Article

Spatial and Temporal Changes in Land Use and Landscape Pattern Evolution in the Economic Belt of the Northern Slope of the Tianshan Mountains in China

1
College of Water and Architectural Engineering, Shihezi University, Shihezi 832000, China
2
Key Laboratory of Cold and Arid Regions Eco-Hydraulic Engineering of Xinjiang Production & Construction Corps, Shihezi 832000, China
*
Authors to whom correspondence should be addressed.
Sustainability 2024, 16(16), 7003; https://doi.org/10.3390/su16167003
Submission received: 5 March 2024 / Revised: 9 August 2024 / Accepted: 13 August 2024 / Published: 15 August 2024

Abstract

:
The economic belt on the north slope of the Tianshan Mountains is a highly productive area in Xinjiang, but with the rapid development of the economy and industry and the acceleration of urbanization in recent years, the fragile ecological environment in the region has further deteriorated. Exploring shifts in land utilization across different eras and regions, along with the transformation of terrain configurations, provides key perspectives that can propel sustainable societal and environmental growth within this particular area. The research analyzed four periods (1990, 2000, 2010, 2020) of remote sensing image data combined with field monitoring data using methods such as land use variability, landscape pattern index, and grey relational model. Focusing on investigating the dynamics of the ecological environment in high-intensity human activity areas, examining alterations in land use patterns over time and space, transitions in land use types, and trends in landscape pattern indices. (1) The dominant land environments situated in the economic zone adjacent to the northern base of the Tianshan mountain range encompass extensive expanses of grassy plains and unexploited landscapes, making up 45% and 38% of the area, correspondingly. The single dynamic change degree of construction land was the largest due to the implementation of long-term land development and urbanization policies. Land use transfer change mainly occurred among cultivated land, grassland, forestland, and unused land. With strong human activities, the construction land area has expanded by 145.16% (2089.7 km2), and this number is still increasing. (2) The spatial landscape structure on the north slope of Tianshan Mountain is becoming more complicated and diversified; the cities with the highest degree of fragmentation were concentrated in the middle and western sections. Grassland is the most dominant patch type in the landscape. The shape of patches tends to be irregular and complex in general, and the fragmentation degree and dispersion degree of landscape patches are enhanced as the proportion of different landscape types increases. (3) Grey correlation analysis indicates that grasslands, cultivated land, and unused land are key elements in the landscape pattern changes on the northern slope of the Tianshan Mountains. Central urban agglomeration is an area with strong landscape pattern changes, and ecological protection should be emphasized while promoting economic development.

1. Introduction

Land resources are the material basis for human survival and an important carrier for human survival and production [1]. Land use is closely related to landscape pattern change [2], the ecological environment [3], biodiversity [4], population growth [5], and the urban heat island effect [6]. Exploring the dynamic shifts in land utilization over time and space, as well as the development of landscape structures, plays a crucial role in promoting the sustainable development of both societal prosperity and environmental harmony.
Numerous studies have been conducted on the spatial and temporal dynamics of land utilization, which have been extensively explored by domestic and foreign scholars from different angles and using a variety of spatiotemporal scales and methods. Dong Meina et al. [7] conducted research on how changes in land use affect the value and vulnerability of ecosystem services. They carried out an assessment of the economic worth of ecosystem services provided by each unit of land in China’s terrestrial environment and compared it with the Costanza ecosystem service value formula. Kuang Wenhui et al. [8] integrated big data cloud computing and expert knowledge-assisted human–computer interactive interpretation methods. This allowed them to produce detailed geographical data on shifts in land use patterns and current land utilization in China and to successfully craft a comprehensive digital repository detailing the evolving landscape at a high resolution of 30 m across the country. Chen Hongji et al. [9] employed a transfer matrix and dynamic orientation model to examine the dynamic developmental features of the scale, composition, and layout of the “trio of growth zones” and created a land spatial pattern based on the FLUS model to simulate the three scenarios of natural development, cultivated land protection, and ecological protection. Chen X et al. [10] suggested a novel approach at the village level to assess how effectively the distribution of various land resources can enhance the overall land utilization efficiency within each village. Sun Q et al. [11] used LandsatTM/OLI data to examine the fluctuations in both time and space of pertinent land utilization and quantitatively evaluated the changes in ecological security. Taking a typical land use database as an example, Liu, Y.L. et al. [12] studied the impact of scale and the land use model on the comprehensive index of the land use database and estimated the threshold of these indexes.
In addition to research on land use, research on landscape patterns is also a hot topic. Jia et al. [13] studied the evolution of landscape patterns and analyzed their main driving forces. Based on the interpretation of remote sensing data, they calculated and analyzed the change in the landscape pattern index, landscape type shift, and centroid shift at the type and landscape levels and discussed the main driving forces behind landscape pattern evolution. Ou Guanglong et al. [14] drew a landscape map of the study area and calculated the landscape index of the study area and individual plots before and after the construction of a hydropower station through software. They also examined the alterations in the spatial arrangement of the research region and analyzed the changing characteristics of the landscape pattern from the dam site to the end of the reservoir before and after the formation of the reservoir area by combining cluster analysis results. Li Chong et al. [15] explored the spatial and temporal distribution as well as the evolving features of land use conversion and landscape layout in the research region through a detailed examination of alterations in land use and the development of landscape patterns. The SWAT hydrological model was utilized to replicate the fluctuation and evolution of water preservation within the research region throughout this timeframe, and the effect of landscape pattern change on water conservation was analyzed using partial correlation analysis. Yohannes H et al. [16] conducted a thorough analysis to measure the variations in water yield and sediment transport over time and space. They utilized historical data, made predictions on land use and cover changes, and employed a holistic evaluation model to assess ecosystem services and potential trade-offs. Li Y et al. [17] conducted an initial assessment by utilizing a combination of five machine-learning techniques along with features from sentinel-2a data for identification and extraction purposes. They then selected the XGBoost algorithm with the highest accuracy for information recognition and extraction and examined the shifting trajectory by integrating landscape pattern metrics, dynamic behavioral framework, and statistical analysis. Xu L et al. [18] calculated the response index by comparing the dynamic characteristics and morphological spatial pattern analysis of landscape pattern indicators inside and outside scenic spots.
Similarly, a great deal of research on land use and landscape patterns has been carried out in Xinjiang. Li Xinqi et al. [19] applied RS and GIS technology to analyze LandsatTM satellite images of the economic belt located on the northern flank of the Tianshan mountain range. They investigated the status quo of land use in the economic belt and the characteristics of land use dynamic change and discussed the driving factors of land use change. Mansur Shabiti et al. [20] analyzed the quantity, type, and change of land use within the commercial zone located along the northern side of the Tianshan mountain range based on the GIS platform and land use information obtained from the statistical data of counties and cities in Xinjiang and LandsatTM image interpretation. Based on land use data, Wu Jianzhai et al. [21] conducted a thorough examination of the shifts in land utilization and the economic worth of ecosystem services, highlighting the unique geographical variations within the mountain, oasis, and desert zones situated on the north face of the Tianshan mountain range.
Zhang, RY et al. [22] used the methods of land use transfer matrix and landscape pattern analysis to quantitatively describe the spatial-temporal evolution pattern of land use in the Huaihe River ecological economic zone. Combining remote sensing images and the Google Earth Engine (GEE) platform, Zhang, LJ et al. [23] used the transfer matrix and landscape pattern index methods to analyze the spatial-temporal evolution trends of land use and landscape patterns in 13 typical open-pit coal mines in Inner Mongolia from 2001 to 2020. Despite the continuous development of research methods in these papers, there are few studies on the spatio-temporal integration of regional land use and landscape patterns. In addition, the north slope of Tianshan Mountain is an important natural barrier in the arid area of Northwest China, and its land use change and landscape pattern evolution play an important role in soil and water conservation, water resource utilization, and local ecological balance. However, in recent years, the rapid economic and industrial development of city clusters and the accelerated urbanization process have further deteriorated the already fragile ecological environment, seriously hindering the sustainable development of the Belt and Road Initiative. Therefore, it is of great significance to study the temporal and spatial changes in land use and the evolution of landscape patterns in the economic belt on the north slope of the Tianshan Mountains to grasp the ecological environment of the typical arid zone economic belt, propose corresponding prevention and control measures, optimize the allocation of land resources, and adjust the industrial structure. Therefore, this article selected land use remote sensing data from economically developed areas on the northern slope of the Tianshan Mountains in China in 1990, 2000, 2010, and 2020. Based on remote sensing and geographic information system technology, combined with grey relational analysis model, this paper analyzes the characteristics of land use area change, land use type conversion, and landscape pattern evolution from the perspective of urbanization development process of urban agglomerations, explores their spatiotemporal distribution patterns and influencing factors, and proposes strategies for the coordinated and sustainable development of “society economy ecology” in the future of the region. The research results have important theoretical significance for enhancing the ecological security of land use in the North slope of the Tianshan Mountains, realizing high-quality development of ecological economy and regional sustainable development, etc., and providing data support for high-quality, sustainable development of the arid region urban agglomeration represented by the North Slope of Tianshan Mountains Economic Belt, optimizing the local industrial layout, and guaranteeing the quality of ecological environment. It also provides a scientific basis for the future development of arid areas and the protection of land resources.

2. Materials and Methods

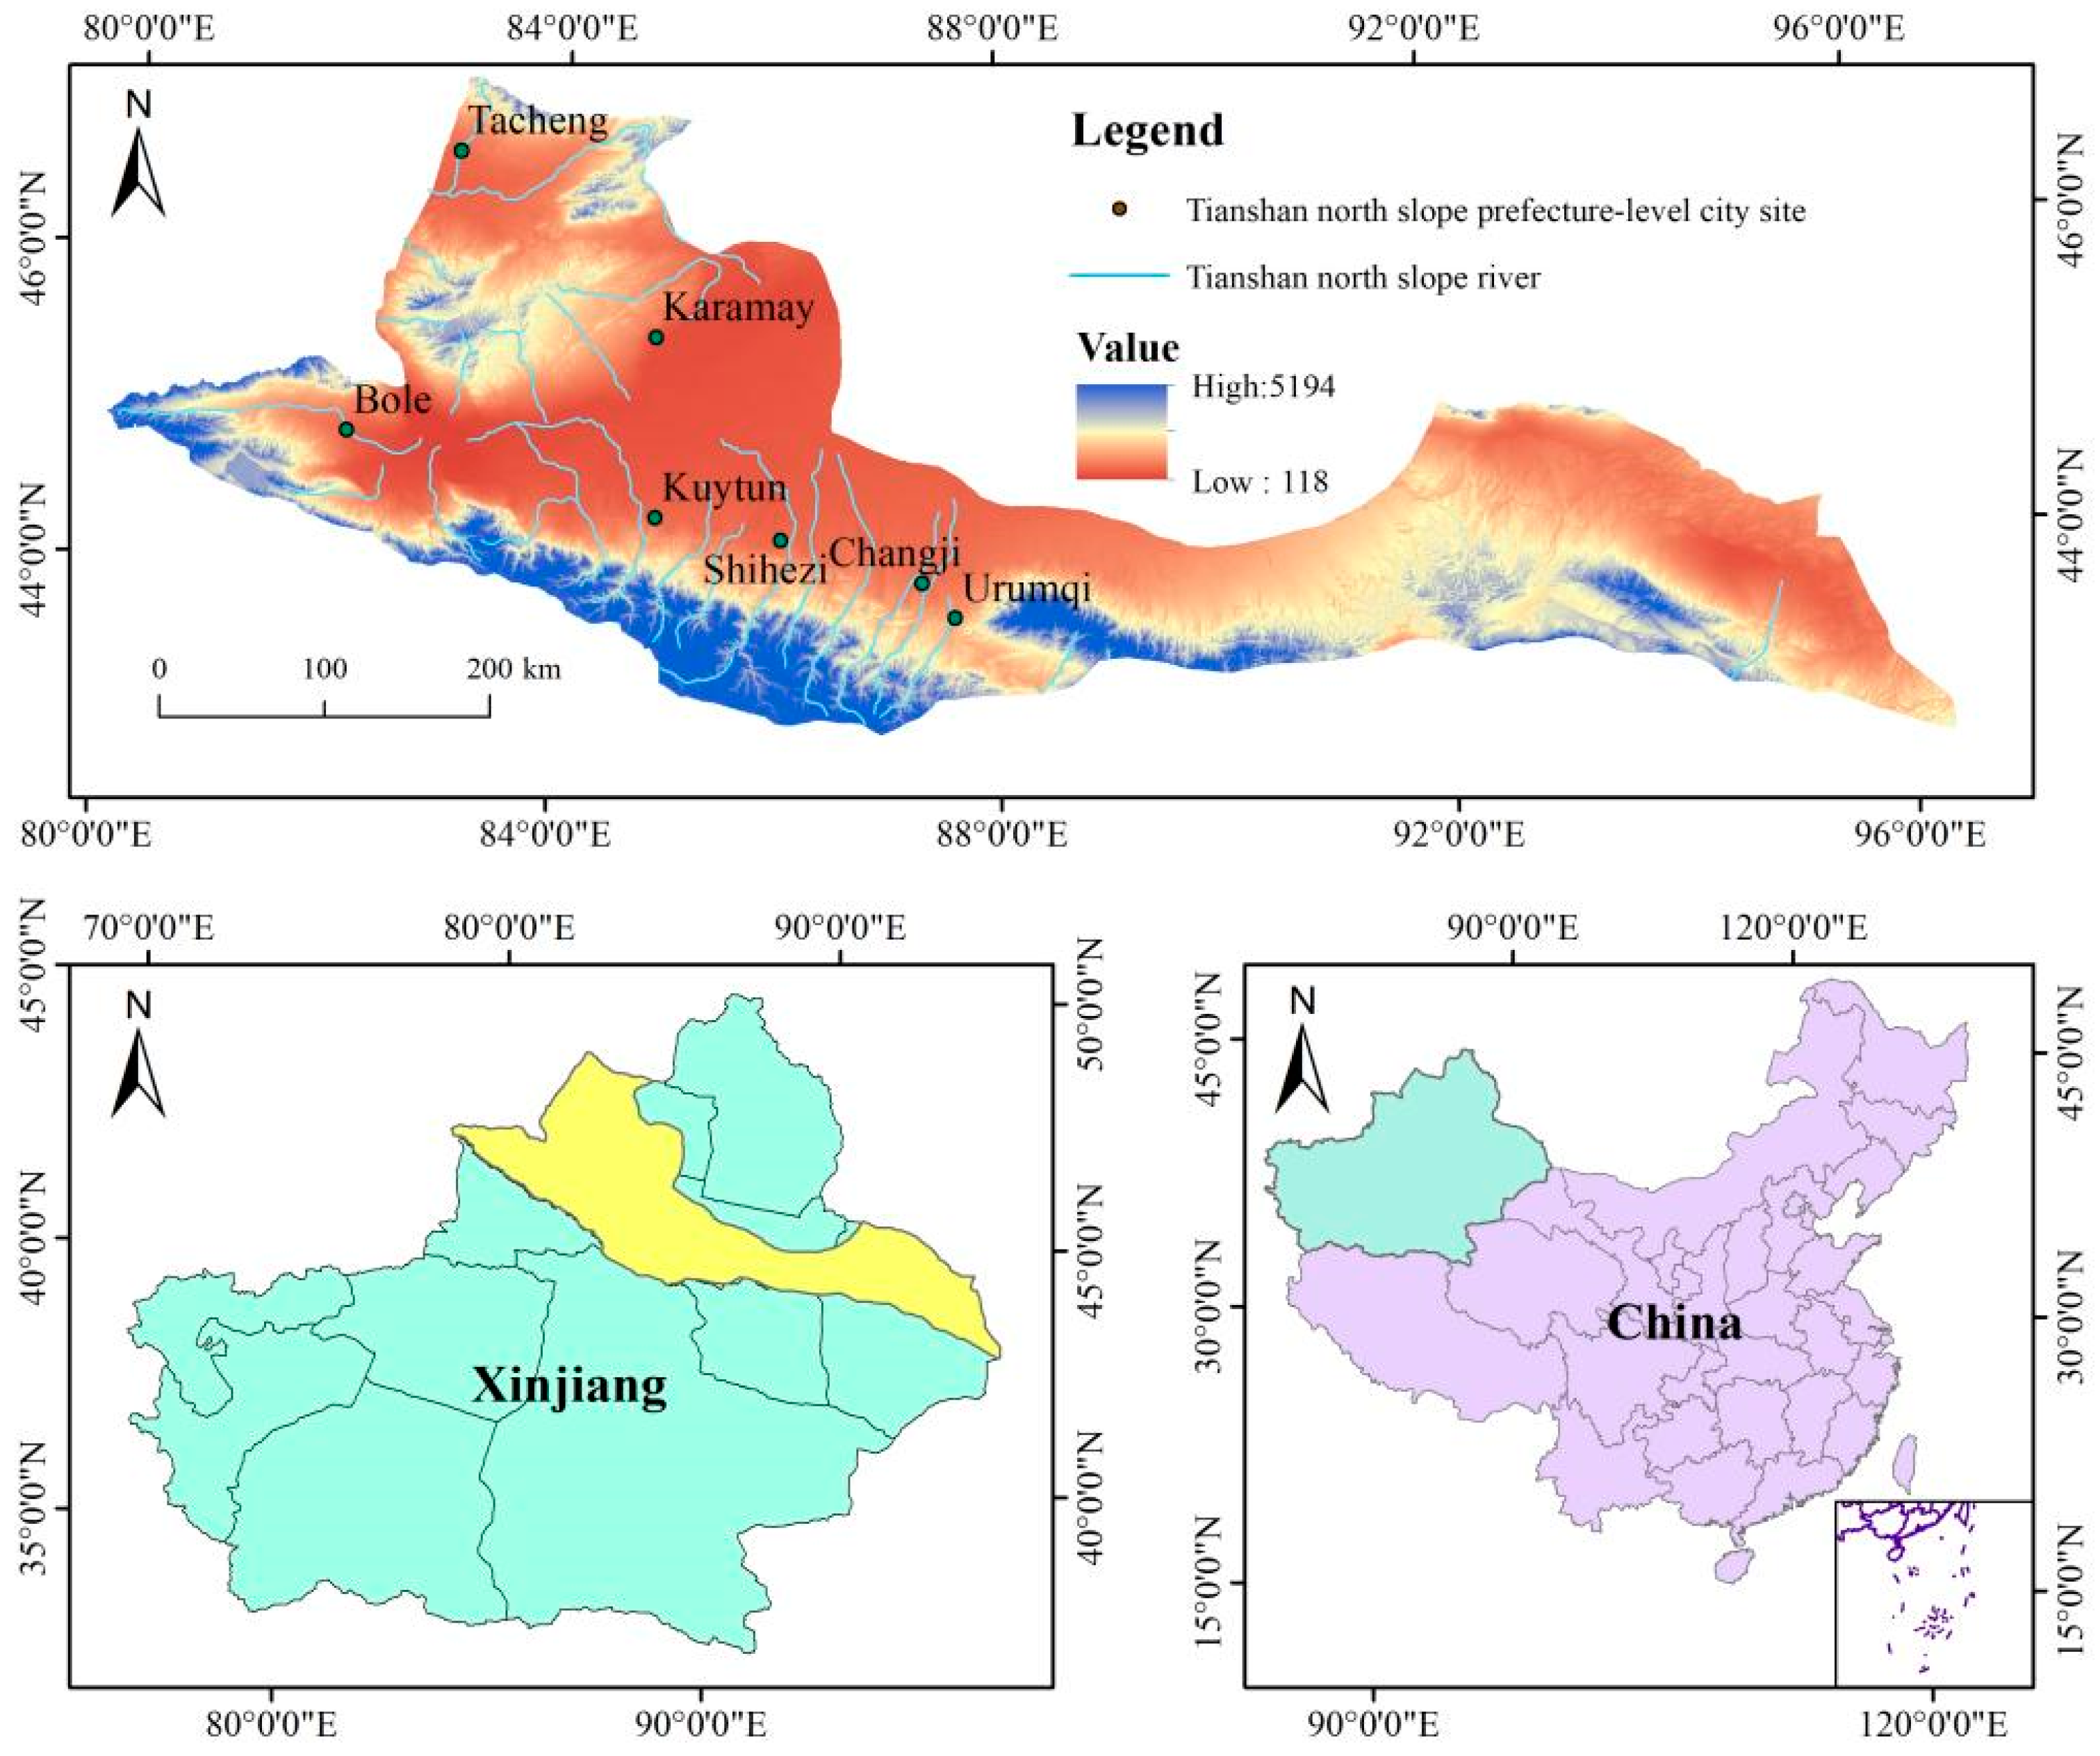
2.1. Area of Research Focus

The economic belt of the northern slope of the Tianshan Mountains lies deep within the heart of the Eurasian continent, on the southern edge of the Junggar Basin, within the Xinjiang Uygur Autonomous Region. It is located at 84°33′–90°32′ east longitude and 42°78′–45°59′ north latitude and is connected to the Gurban Tungut Desert to the north and bordered by the grand Tianshan Mountains to the south. It has exceptional natural wealth and advantageous geographic circumstances. It is a key area of China’s Western development and the bridgehead of the Belt and Road Initiative. The typical yearly temperature hovers around 7.5 degrees Celsius, while the annual rainfall measures approximately 185.34 mm, establishing its classification as a mountain–oasis–desert region. The thaw of alpine ice and snow supplies the necessary water resources for local growth, with grassland dominating as the primary form of vegetation coverage. This region is the most densely populated urban area in Xinjiang, including more than 10 key cities such as Urumqi, Changji, Kuitun, and Shihezi, with an urbanization level of 86.98% (Figure 1).

2.2. Data Sources

Basic data are used in this paper, including land use data, population data, and socio-economic data. Visual information captured on the northern face of the Tianshan Mountains in the years 1990, 2000, 2010, and 2020 was selected for processing and research. The software utilized for extracting the land use data from the four time periods was ArcGIS version 10.7. According to the research content, the land use in the study area was mainly divided into six land types: construction land, water, farmland, forestland, grassland, and unused land. Data on land utilization were obtained from the Resource and Environment Science and Data Center, Chinese Academy of Sciences (https://www.resdc.cn/, accessed on 21 March 2023), with at least 94.3% accuracy. Altitude information was sourced from the Geospatial Data Cloud (http://www.gscloud.cn/search, accessed on 12 December 2022). The map of China and Xinjiang administrative regions was obtained from the National Earth System Science Data Center (http://www.geodata.cn/, accessed on 12 December 2022). Other data were from the Xinjiang Grain Yearbook. The maximum likelihood method was used for supervised classification, the ENVI 5.3 software was used in combination with field investigation, and data were obtained through human–computer interactive visual interpretation. The data accuracy was 30 m × 30 m, and the Kappa coefficient of data interpretation in all four phases was greater than 80%, which met the application requirements.

2.3. Research Methods

2.3.1. Flexible Approach to Land Utilization

The ever-changing nature of individual land utilization mirrors the varying pace and scale of transformation across diverse land use categories within a specific timeframe and plays an important role in comparing regional differences of land use change and predicting future land use trends [24]. The calculation formula is as follows:
K = ( U b U a ) U a × 1 T × 100 %
where K represents the ever-evolving disposition of a specific type of land utilization over the course of the investigation; Ua and Ub represent the surface area dedicated to a specific land use category at the commencement and conclusion of the observation period; and T represents the duration of the research period. If T is designated as one year, K signifies the yearly fluctuation rate of a specific land use category within the research area.

2.3.2. Land Use Transfer Matrix

The matrix for land use transfer provides a precise depiction of the extent to which various land use categories have undergone transformation throughout the duration of the research, which is conducive to the quantitative analysis of the structural characteristics of different types and the direction and amount of mutual transfer [25]. The matrix can be mathematically represented as depicted below.
S ij = S 11 S 12 S 1 n S 21 S 22 S 2 n S n 1 S n 2 S n n
where S represents the area; n represents the number of land use types in question; i denotes the land utilization category pre-transfer; on the other hand, j signifies the land application category post-transfer; and Sij denotes the land area allocated to land category i pre-transfer transitioning to land category j post-transfer.

2.3.3. Landscape Pattern Index

The landscape pattern index is a quantitative index that comprehensively reflects landscape pattern information, establishes the relationship between pattern and process, and analyzes the development and change of landscape elements and regional ecological resources. Prior research has demonstrated that various types of landscapes are crucial for preserving the authenticity of natural habitats, safeguarding the vitality of natural resources, shaping the structure and operation of ecosystems, and facilitating the progression of ecosystems over time [26]. Currently, no single research approach or individual measure can fully and impartially capture the intricate nature of evolving landscape patterns, with frequent interconnections observed among various landscape metrics [27]. Therefore, class metrics selected in this study included Total Area (CA), Number of Patches (NP), Largest Patch Index (LPI), Aggregation Index (AI), and landscape metrics, including Landscape Shape Index (LSI), Aggregation Index (AI), Contagion (CONTAG), Landscape Division Index (DIVISION), Shannon’s Diversity Index (SHDI), and Shannon’s Evenness Index (SHEI), were analyzed using Fragstats 4.2 software. The specific calculation formula is as follows:
(1)
Class metrics
① Number of Patches (NP)
N P = N i
where Ni represents the number of patches of the category i landscape type.
② Total Area (CA)
C A = j = 1 n a i j
where aij represents the area of the jth patch of the class i landscape type.
③ Largest Patch Index (LPI)
L P I = max S N i S N i
where S(Ni) represents the area of the i landscape.
(2)
Landscape metrics
① Aggregation Index (AI)
A I = 100 i = 1 m g i i max g i i p i
where gii represents the number of similar adjacent patches of the corresponding landscape type, and Pi is the percentage of the area occupied by type i plaques.
② Contagion (CONTAG)
C O N T A G = 100 + 50 i = 1 m k = 1 m p i g i k k = 1 m g i k × I n p i g i k k = 1 m g i k I n m
where Pi is the percentage of the area occupied by type i plaques; gik is the number of plaques of type i adjacent to type k; and m is the total number of plaque types.
③ Landscape Shape Index (LSI)
L S I = 0.25 E A
where E is the boundary length of a certain type of landscape patch, and A is the total area of the landscape.
④ Shannon’s Diversity Index (SHDI)
S H D I = i = 1 m P i × I n P i
where Pi is the percentage of the area occupied by type i plaques.
⑤ Shannon’s Evenness Index (SHEI)
S H E I = i = 1 m P i × I n P i I n m
where Pi is the percentage of the area occupied by type i plaques, and m is the total number of plaque types.
⑥ Landscape Division Index (DIVISION)
D I V I S I O N = 1 i = 1 m j = 1 n a i j A 2
where aij represents the area of the jth patch of the type i landscape type, and A is the total area of the landscape.

2.3.4. Grey Correlation Model

Grey correlation analysis is based on grey correlation degree, which analyzes the degree of correlation between various factors in the system by comparing the similarity between the geometric relationship of data series and the geometric shape of curves. Its steps are as follows:
① Determine the characteristic series and the derivation series.
The comparison sequence is
X 1 X 2 X n = X 1 1 X 2 1 X n 1 X 1 2 X 2 2 X n 2   X 1 m X 2 m X n m
Parent sequence is
X 0 = x 0 1 , x 0 2 , , x 0 m T
where n is the number of system characteristic behavior sequences, and m is the number of indicators;
② Dimensionalize the indicator data.
③ Calculate the correlation coefficient.
γ x 0 k , x i k = Δ min + ρ Δ max Δ i k + ρ Δ max
where ρ is the resolution coefficient, ρ ∈ [0, 1];
④ Calculate the correlation degree.
r 0 i = 1 m k = 1 m γ x 0 k , x i k
where t = 1, 2, 3, ⋯, m. r0i represents the grey correlation of xi(k) for x0(k).

3. Results

3.1. Analysis of Land Use Change

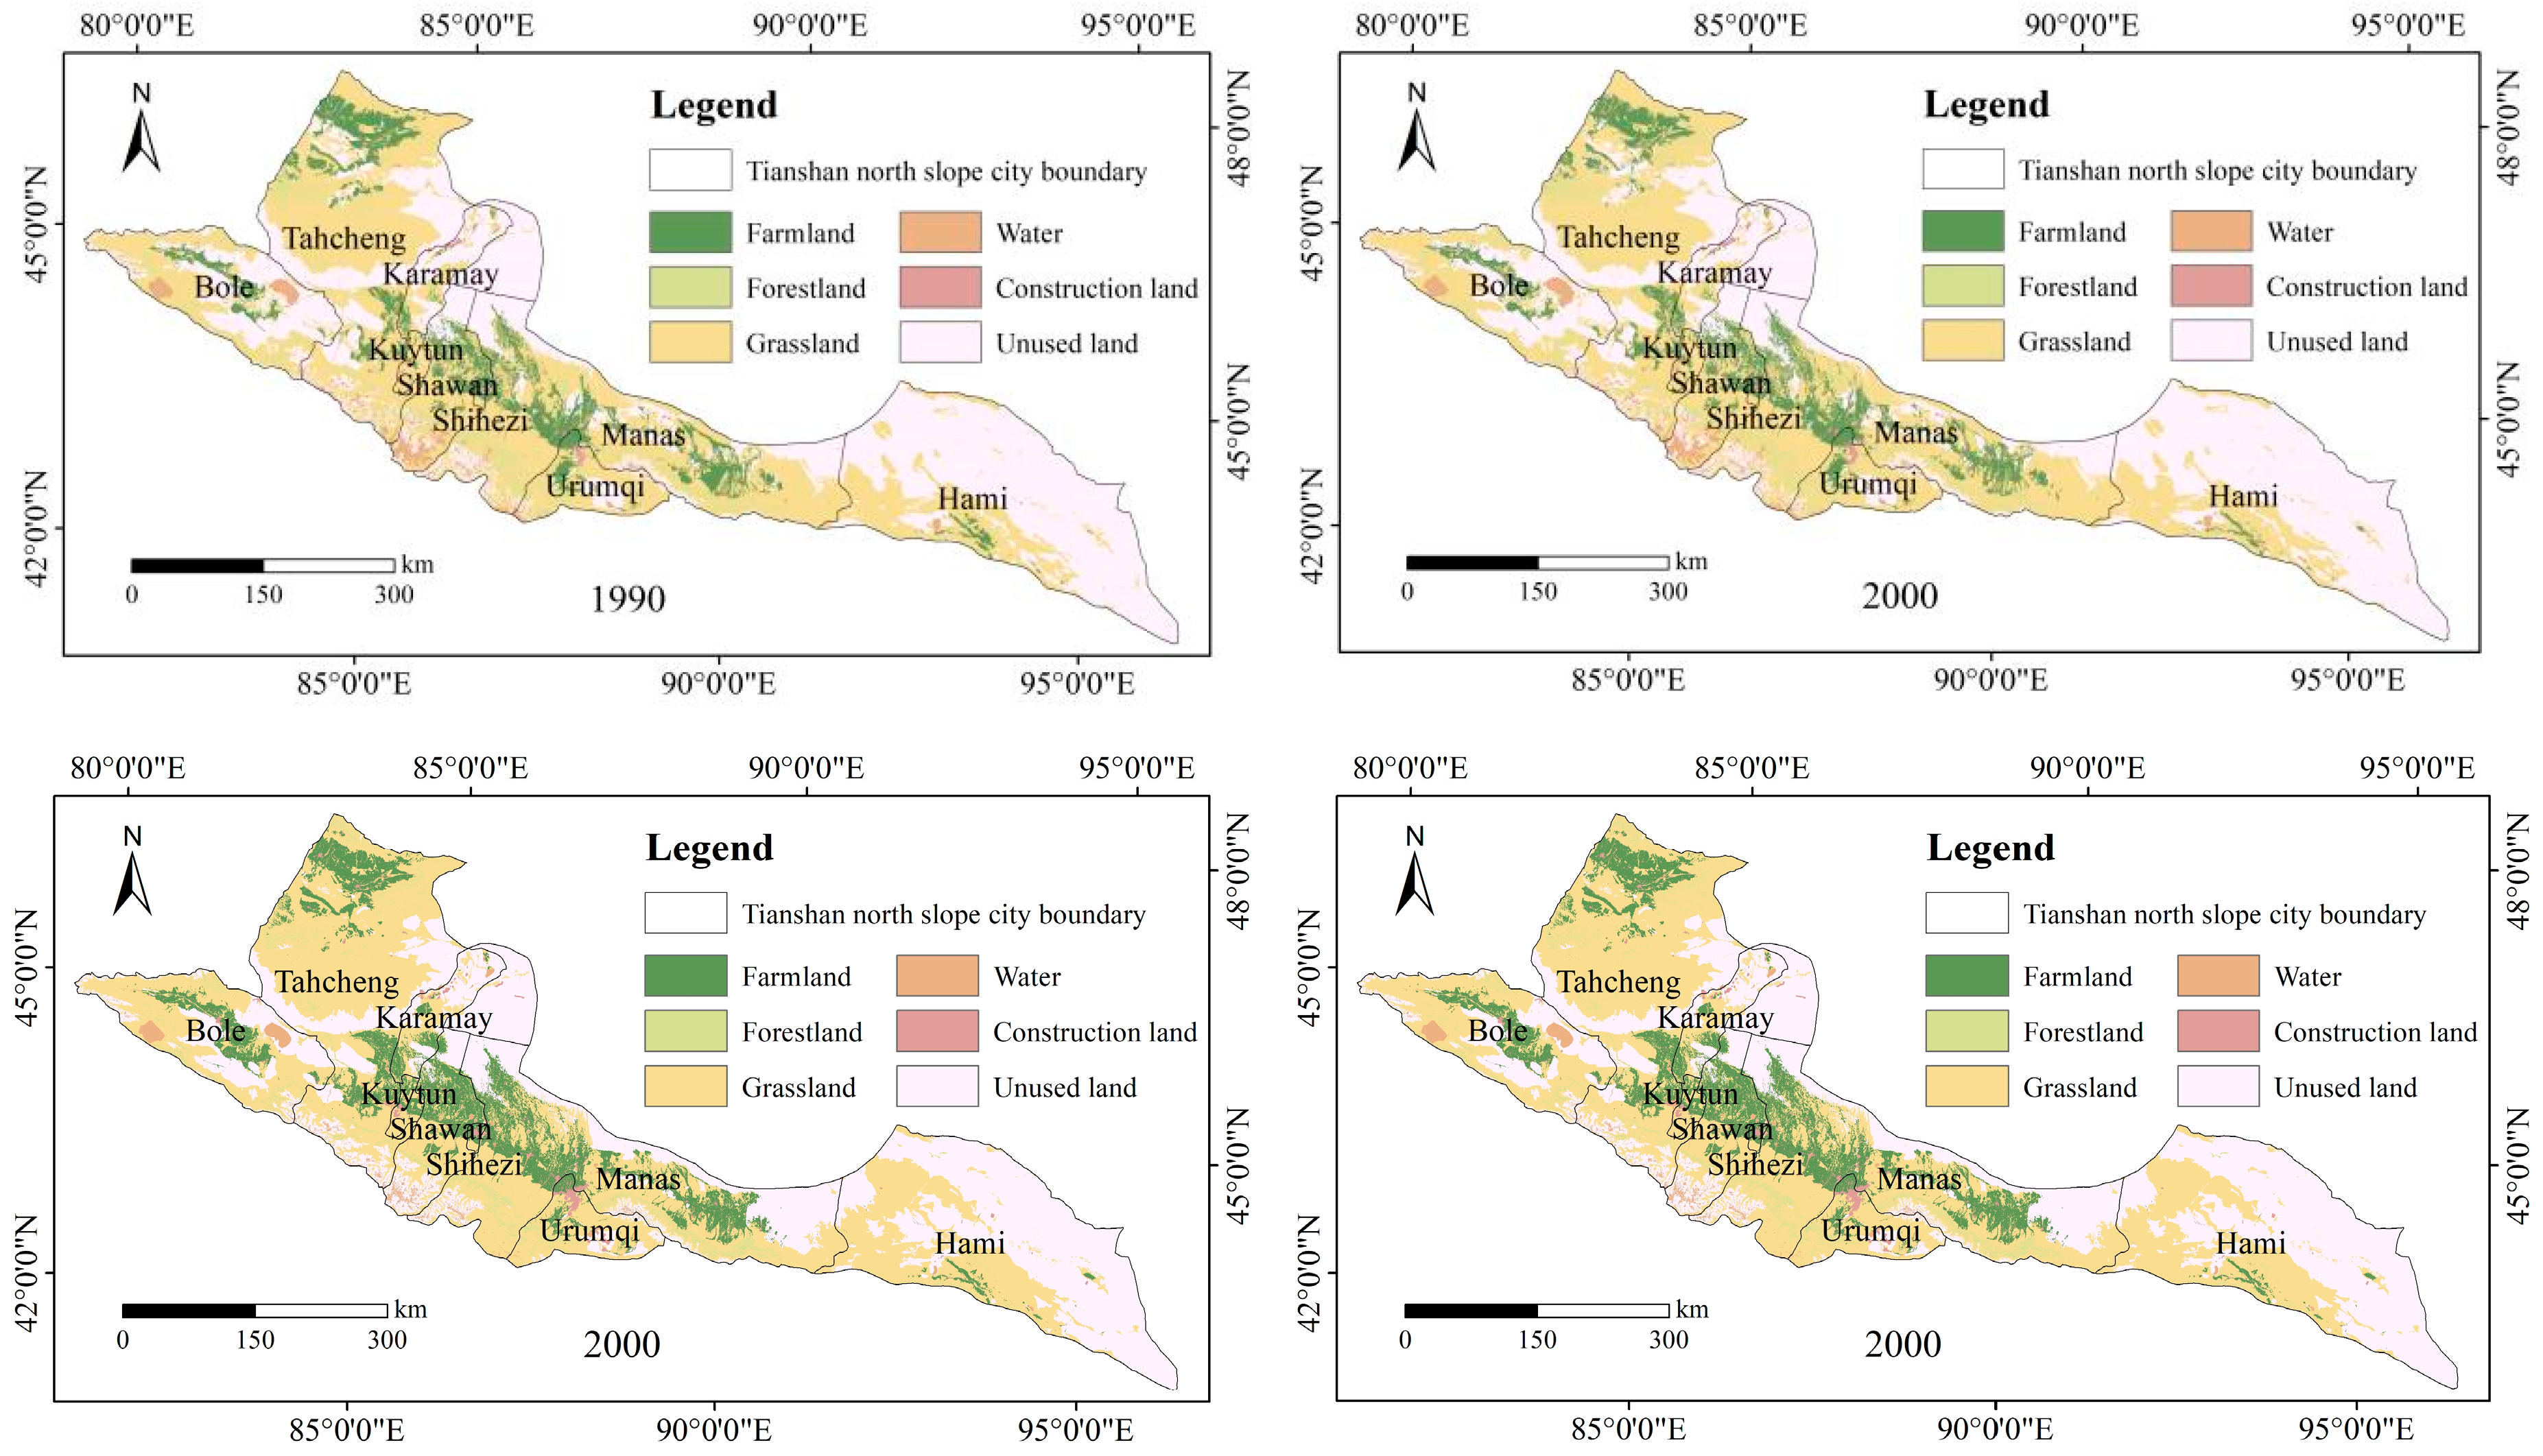
3.1.1. Spatiotemporal Changes in Land Use Type

Data concerning land usage during 1990, 2000, 2010, and 2020 were gathered through the examination of images obtained via advanced remote sensing techniques, as depicted in Figure 2. The alteration of land utilization patterns on the northern slope of the Tianshan Mountains during the period from 1990 to 2020 is depicted in Table 1 The analysis shows the following:
(1) In 1990, the total area of farmland spanned 210.41.4 square kilometers, constituting approximately 9.32% of the overall landmass; in 2000, the farmland area was 20,997.9 km2, accounting for 9.30% of the total area; therefore, from 1990 to 2000, the farmland area decreased by 0.2%, accounting for 43.5 km2. In 2010, the total expanse of farmland encompassed a grand 28,535.5 square kilometers, representing a notable 12.64% of the overall territorial expanse; thus, from 2000 to 2010, the farmland area increased by 35.9%, which represents an increase of 7537.6 km2. In 2020, the farmland area was 30182.7 km2, accounting for 13.36% of the entire expanse; therefore, between 2010 and 2020, there was a 5.77% expansion in the expanse of farmland, equating to a growth of 1647.2 square kilometers. Taken together, from 1990 to 2020, the farmland area increased by 43.44%, and the increased area was 9141.3 km2. The farmland area first decreased and then increased, but showed an overall growth trend.
(2) In 1990, the expanse of woodland territory spanned 8047.7 km2, representing 3.56% of the overall land area. Fast forward to 2000, the woodland territory expanded to cover 8501.0 km2, constituting 3.76% of the total area. This marked a 5.63% growth in woodland territory from 1990 to 2000, encompassing an additional 453.3 km2. However, by 2010, the woodland territory had diminished to 4782.5 km2, making up merely 2.12% of the total area. From 2000 to 2010, the area of forestland decreased by 43.74%, that is, by 3718.5 km2. In 2020, the area of forestland was 4548.7 km2, accounting for 2.01% of the whole expanse. Therefore, between 2010 and 2020, there was a decrease of 4.89% in the expanse of forested land, which equates to 233.8 km2. This means that, between 1990 and 2020, there was a significant 43.48% decline in the expanse of forested territory, and the region saw a reduction of 3499 km2 in size. The area of forestland first increased and then decreased, but the overall trend was decreasing.
(3) In 1990, the expanse of grassland covered a vast 97,580.4 km2, representing a substantial 43.20% portion of the overall land area; in 2000, the grassland area was 96,518.5 km2, accounting for 42.73% of the total area; therefore, from 1990 to 2000, the grassland area decreased by 1.09%, accounting for 1061.9 km2. In 2010, the expanse of grassland encompassed a vast 103633.2 km2, constituting a substantial 45.89% of the overall land mass. Thus, from 2000 to 2010, the grassland area increased by 7.37%, which represents an increase of 7114.7 km2. In 2020, the vast expanse of grassland stretched across 104814.1 km2, making up a substantial 46.40% of the entire landmass. Therefore, from 2010 to 2020, the grassland area increased by 1.14%, that is, by 1180.9 km2. Taken together, from 1990 to 2020, the grassland area increased by 7.41%, which equates to 7233.7 km2. Grassland is the largest land type, and the overall trend keeps growing.
(4) In 1990, the water surface covered a grand total of 5313.0 km2, making up a mere 2.35% of the overall expanse; in 2000, the water area was 5813.9 km2, constituting a mere 2.57% of the overall landmass; therefore, from 1990 to 2000, the water area increased by 9.43%, accounting for 500.9 km2. In 2010, the water surface encompassed 3276.4 square kilometers, representing a mere 1.45% of the overall land expanse. Thus, from 2000 to 2010, the water area decreased by 43.65%, which equates to 2537.5 km2. In 2020, the water area covered an expanse of 3453.8 km2, representing a mere 1.53% of the overall landmass. Therefore, from 2010 to 2020, the water area increased by 5.41%, which represents an increase of 177.4 km2. Overall, from 1990 to 2020, the water area decreased by 34.99%, that is, by 1859.2 km2. The water area first decreased and then increased, but the increase was not obvious, and the water resources are gradually decreasing.
(5) In 1990, the expanse of land designated for construction measured 1439.6 km2, representing a mere 0.64% of the overall territory. Fast forward to 2000, the construction land area expanded to 1791.0 km2, making up 0.79% of the total area. This marked a 24.41% increase in construction land area, equating to 351.4 km2. By 2010, the construction land area had further ballooned to 2575.6 km2, accounting for 1.14% of the total territory. The subsequent decade, from 2000 to 2010, witnessed a staggering 43.81% growth in construction land area, translating to an increase of 784.6 km2. In 2020, the construction land area reached 3529.3 km2, encompassing 1.56% of the entire expanse. The growth from 2010 to 2020 equates to 37.03%, adding 953.7 km2 to the construction land area. Overall, from 1990 to 2020, there was a remarkable 145.16% expansion in construction land area, with a total increase of 2089.7 km2. The trend of expanding construction land area shows no signs of abating.
(6) In 1990, the unused land area comprised 92441.0 km2, making up 40.93% of the overall territory. Fast forward to 2000, the unused land area stood at 92240.8 km2, representing 40.84% of the total expanse, with minimal fluctuations compared to the previous decade. By 2010, the unused land area had decreased to 83040.4 km2, constituting 36.77% of the entire region. Between 2000 and 2010, the unused land area experienced a reduction of 9.97%, equivalent to a loss of 9200.4 square kilometers. In 2020, the unused land area was 79,387.3 km2, accounting for 35.14% of the entire expanse. During the decade from 2010 to 2020, the unused land area was reduced by 4.4%; that is, it was reduced by 3653.1 km2. Overall, from 1990 to 2020, the unused land area was reduced by 14.12%, which equates to 13,053.6 km2. The unused land area continues to decrease.
(7) On the whole, all land use types were ranked from largest to smallest in terms of area: grassland > unused land > farmland > forestland > water > construction land; it is evident that grassland was the most important land use type.

3.1.2. Fluctuating Alterations in the Types of Land Utilization

The fluctuating perspective of individual land utilization mirrors the varying pace of transformation for each category of land use. Based on the classified data of land use on the northern slope of the Tianshan Mountains, the dynamic attitude of single land use in three periods from 1990 to 2000, 2000 to 2010, and 2010 to 2020 was calculated (Table 2). In general, the dynamic attitude of construction land was always at the highest level; the three phases were 2.44%, 4.38%, and 3.70%, respectively, showing a trend of expansion year by year, and the growth rate was the fastest from 2000 to 2010. The dynamic attitude of forestland in the three periods was 0.56%, −4.37%, and −0.53%, respectively, and showed a negative trend after 2000, with an overall trend of “increase–decrease”. The dynamic attitude of farmland in the three periods was −0.02%, 3.59%, and 0.58%, respectively, indicating that farmland had a trend of “decreasing and increasing”, and the change amplitude was the largest from 2000 to 2010. The dynamic attitude of grassland in the three periods was −1.09%, 0.74%, and 0.11%, respectively, and became positive after 2000, showing a trend of “decreasing and increasing”. The single land use dynamic attitude of water was 0.94%, −4.37%, and 0.54%, respectively, indicating that the water area showed a fluctuation trend of “increase–decrease–increase”. The unused land was negative in the study period, indicating that the unused land area was continuously decreasing, and the dynamic attitude was −0.02%, −1.00%, and −0.44%, respectively.

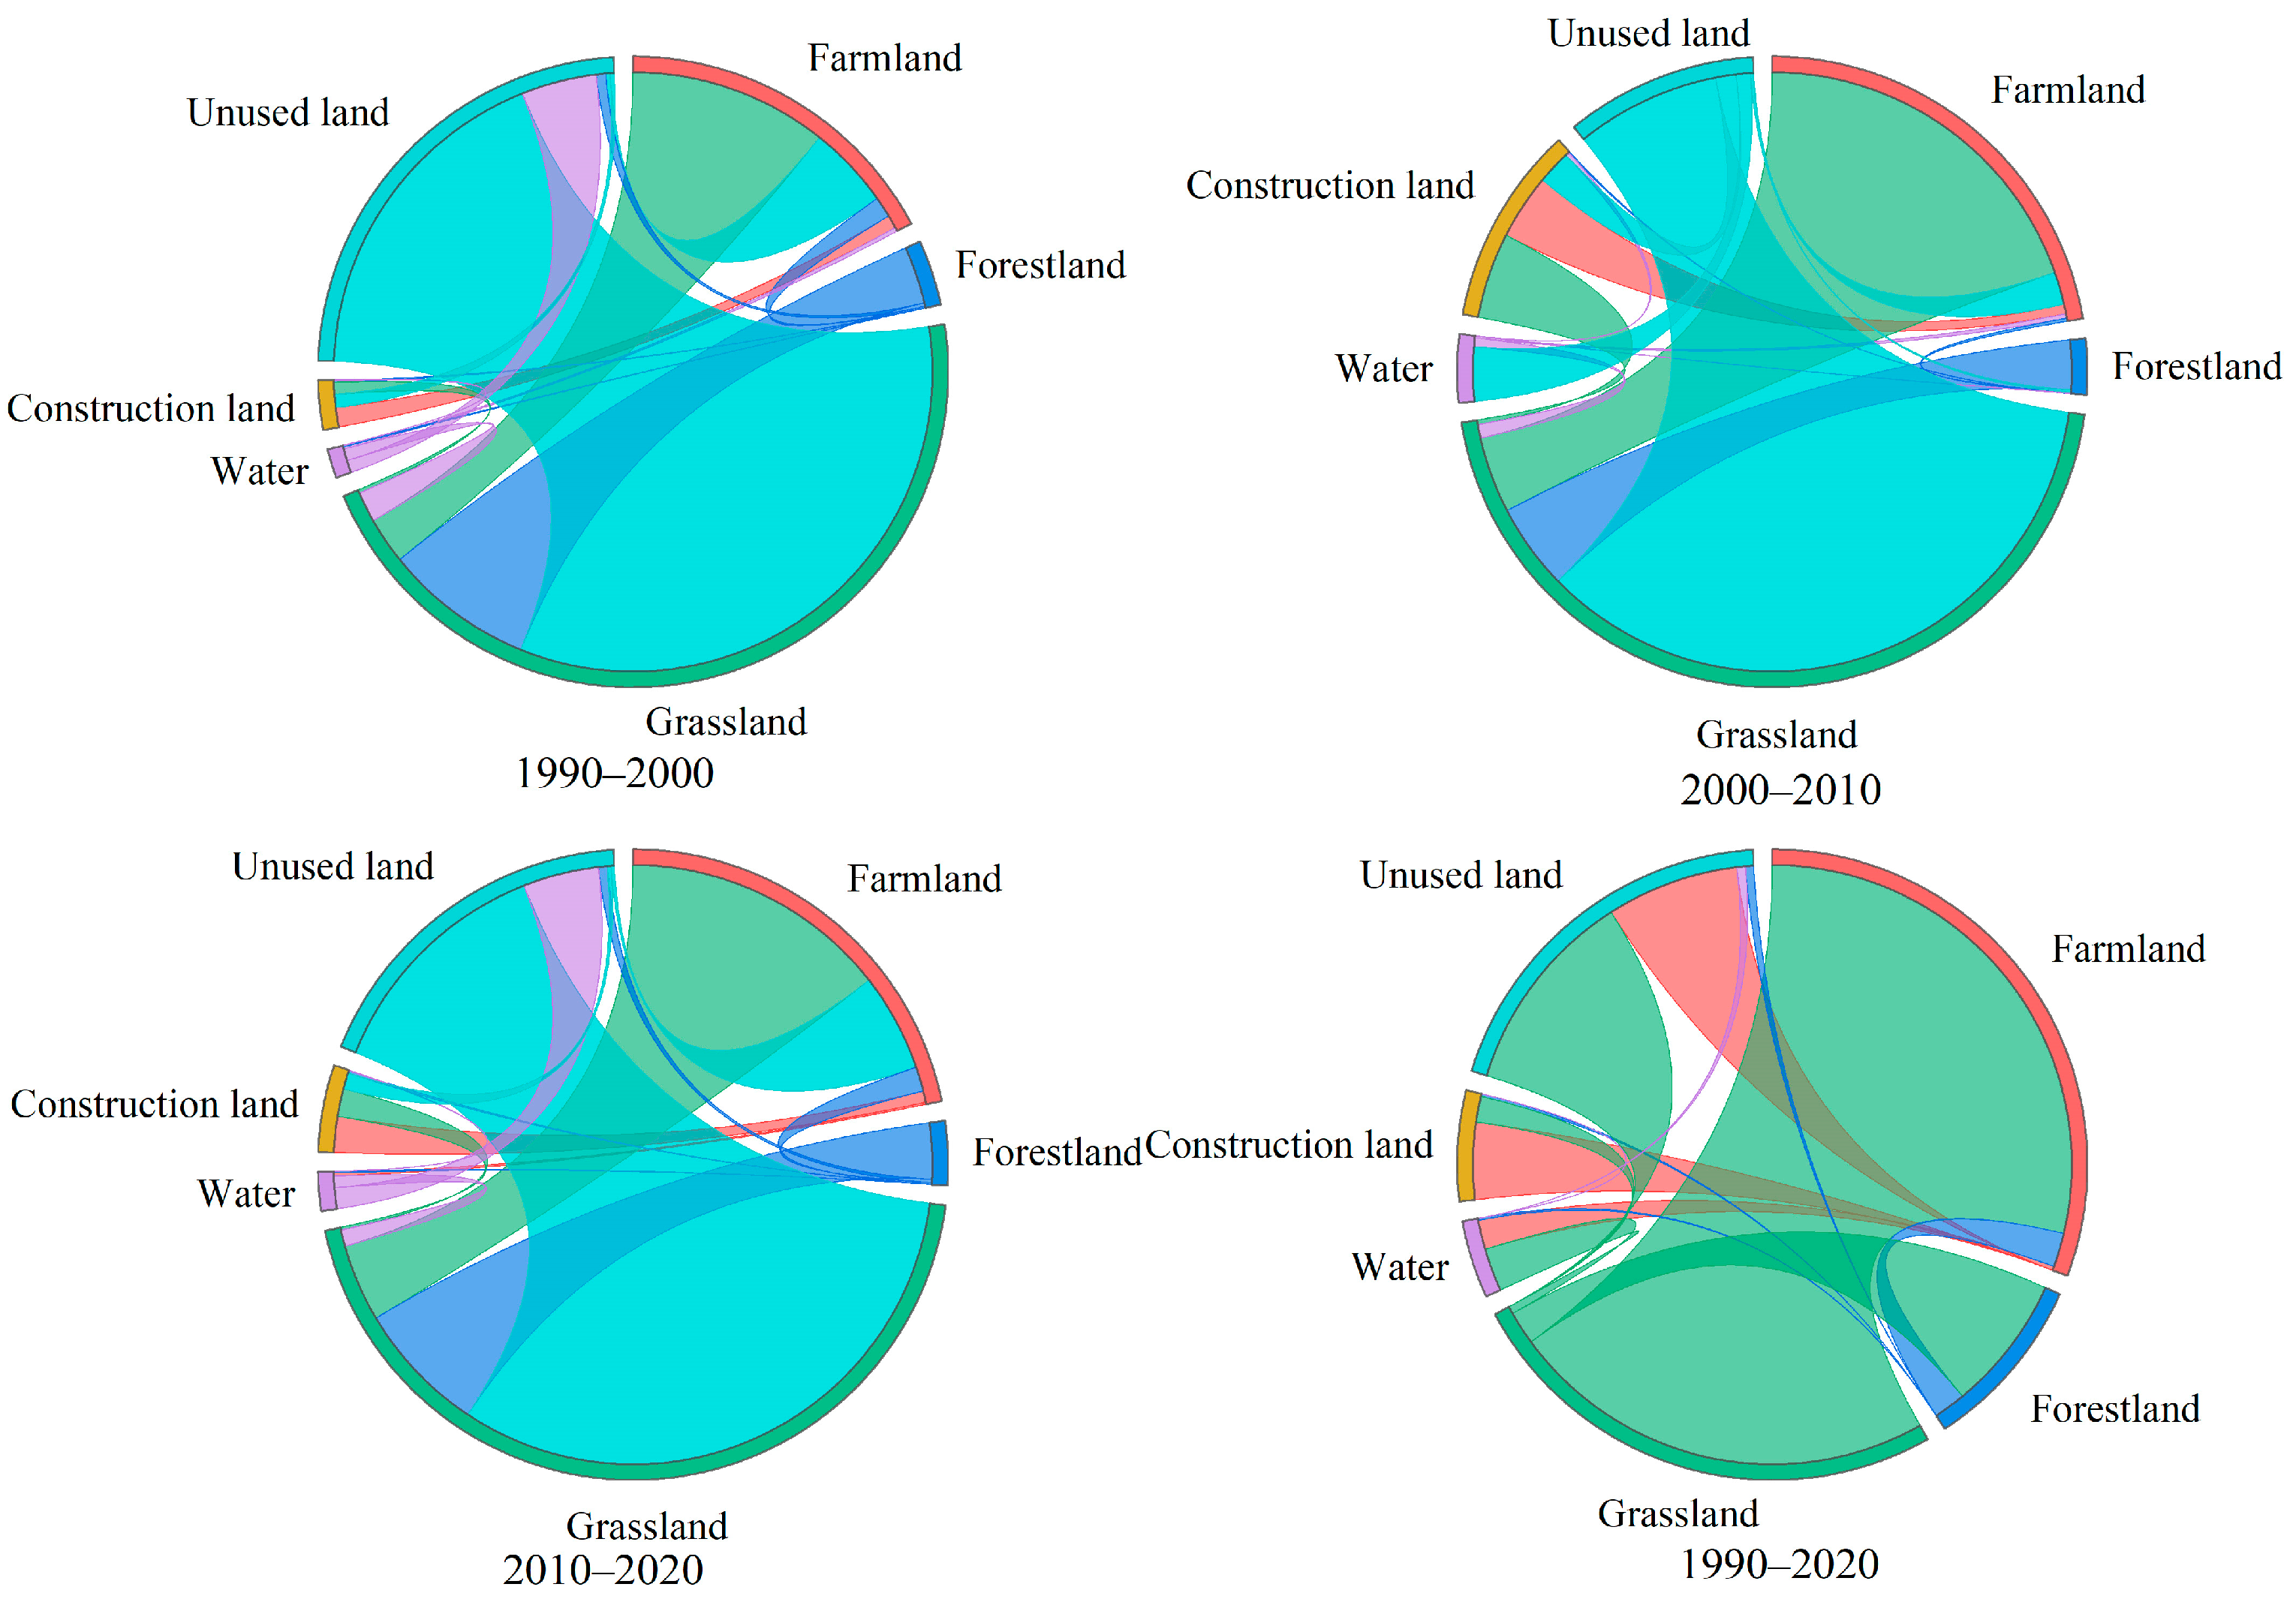
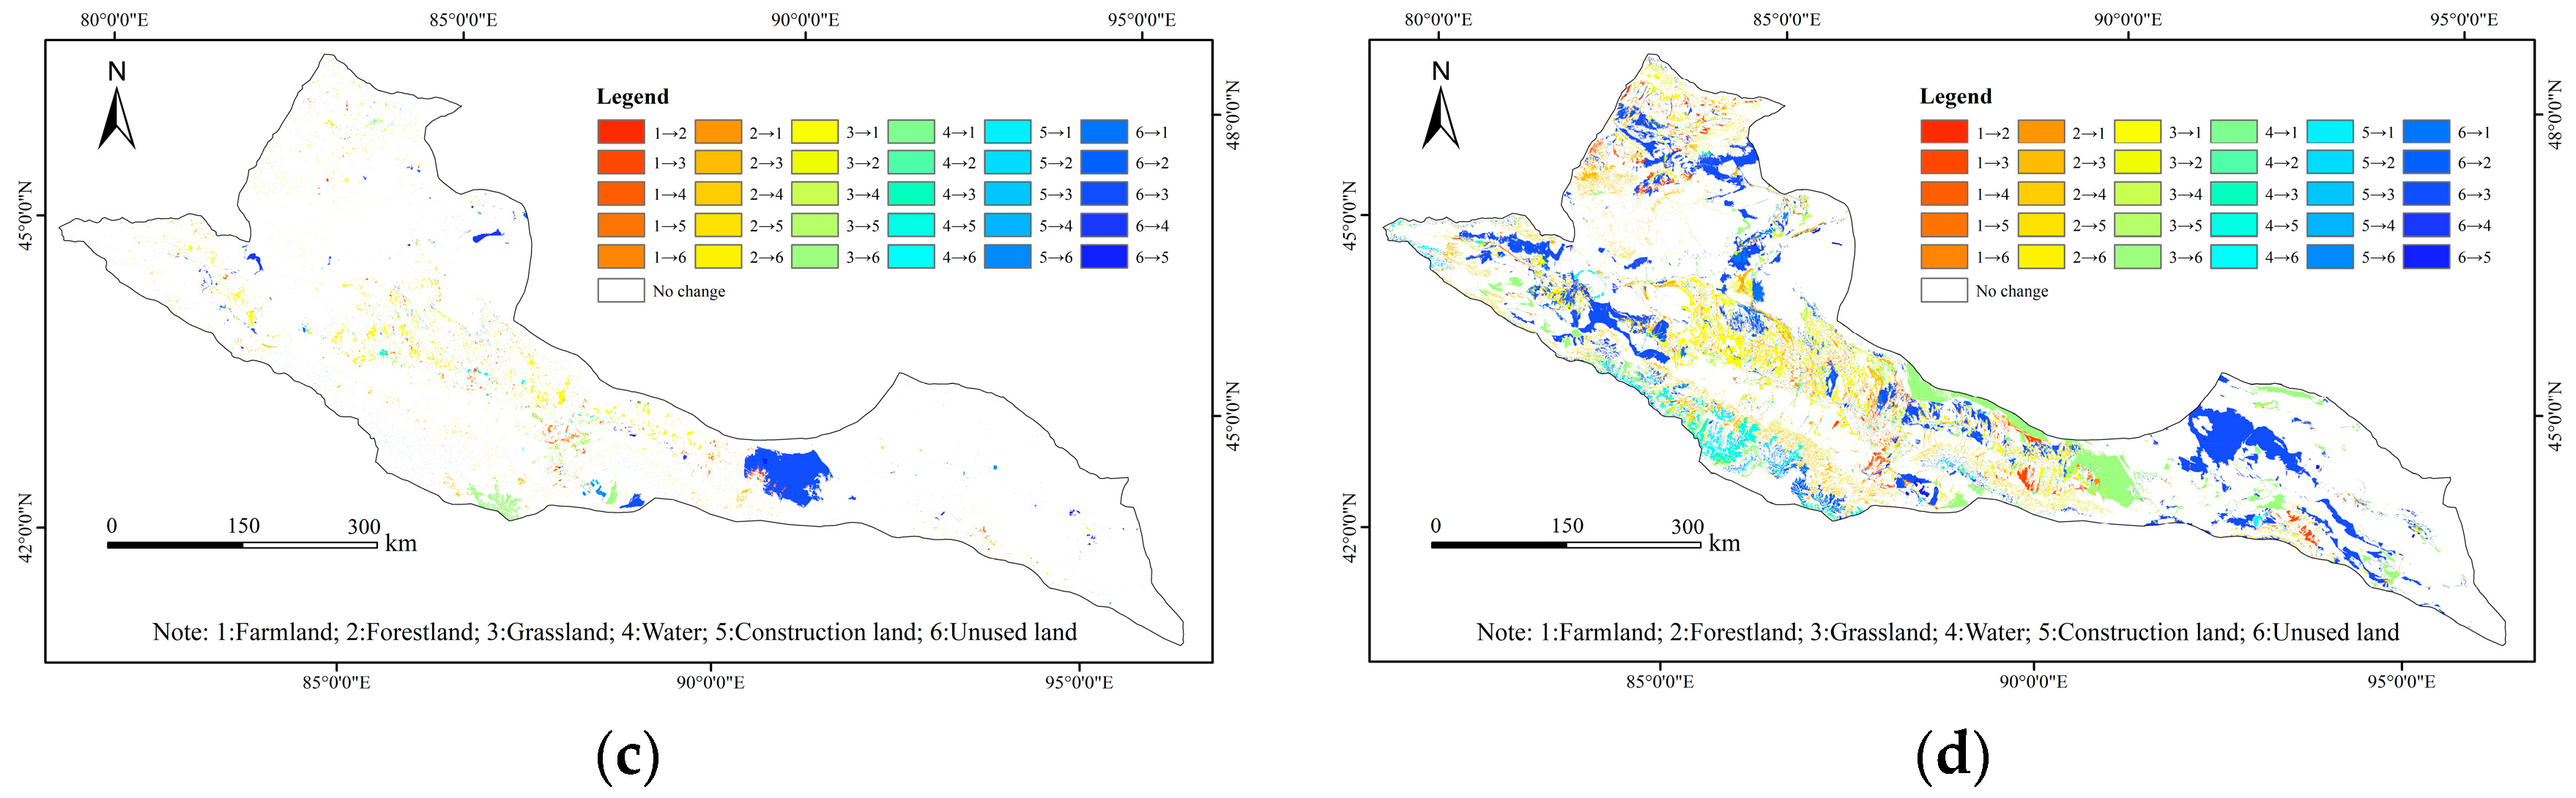
3.2. The Mutual Transformation Process between Land Use Types

The matrix for transferring land use provides a detailed portrayal of the structural attributes and the trajectory of changes in land use types within the research area. Figure 3 shows the transformation matrix depicting the evolution of diverse land utilization categories spanning the periods 1990–2000, 2000–2010, and 2010–2020. The analysis results are as follows:
(1) Between 1990 and 2000, there was a noticeable decline in the expanse of farmland and grassland, while the size of construction land, water bodies, and unused land saw a rise. This period witnessed a significant transformation of farmland into grassland, accounting for a total of 2030.2 km2. Forestland was mainly converted into farmland, representing an area of 160.2 km2. Grassland was mainly transformed into farmland, accounting for 2517.0 km2, except in cases where the majority of the land was converted into grassland, representing an area of 1137.3 km2. Out of these land use types, it is noteworthy that grassland experienced the most significant alteration in terms of land use, whereas the transformation of water and construction land areas was relatively minimal, as illustrated in Figure 4.
(2) Between 2000 and 2010, there was a noticeable rise in the expanse of farmland, grassland, and urban development zones, while forested areas, water bodies, and wastelands experienced a decline. The conversion of farmland into grassland dominated the landscape alterations, encompassing approximately 1431.1 km2. Forestland was mainly converted to grassland, representing an area of 4624.2 km2. Grassland was mainly transformed into unused land, which accounted for 10,493.2 km2. Unused land was mainly converted into grassland, representing an area of 19,120.9 km2. Out of all categories, it was grassland that experienced the most significant transformation in land utilization trends, with negligible modifications detected in the regions demarcated for water and infrastructure development, as exemplified in Figure 4.
(3) Between 2010 and 2020, there was a notable expansion in the territory of farmland, grassland, water bodies, and urban development zones. Conversely, forested areas and barren lands experienced a decline in size. A significant portion of farmland was converted into grassland, amounting to a substantial area of 470.5 km2. Forestland was predominantly transformed into meadows, covering an expanse of 531.1 km2. Meadows was primarily repurposed for agricultural use, spanning 2246.9 square kilometers. Unused land was mainly transformed into grassland, representing an area of 4072.2 km2. Out of all the various types of land, grassland experienced the most significant shift in terms of changes in land area, as depicted in Figure 4, while water and construction land saw minimal modifications.
(4) Between 1990 and 2020, there was a noticeable expansion in farmland, grassland, and urban development zones. Conversely, forested areas, water bodies, and unused terrains experienced a reduction during this period. Notably, a significant portion of farmland underwent a transition into grassland, with a total coverage of 2497.2 km2. Forestland was mainly converted into grassland, covering 4283.6 km2. Grassland was mainly transformed into farmland and unused land, accounting for 8665.4 km2 and 7772.2 km2, respectively. Unused land was mainly transformed into grassland, representing an area of 19,341.7 km2. Grassland experienced the most significant transformation in land use compared to other types of land, whereas the extent of land converted for water and construction purposes was relatively limited, as depicted in Figure 4.

3.3. Landscape Pattern Evolution Analysis

Land use change is the main factor leading to landscape pattern change, which can be characterized and explained using terrain layout indicators. The study area stands to benefit from a thorough examination of landscape pattern transformation through quantitative analysis, which can offer valuable insights for refining land use structure and strategically managing land resource distribution.

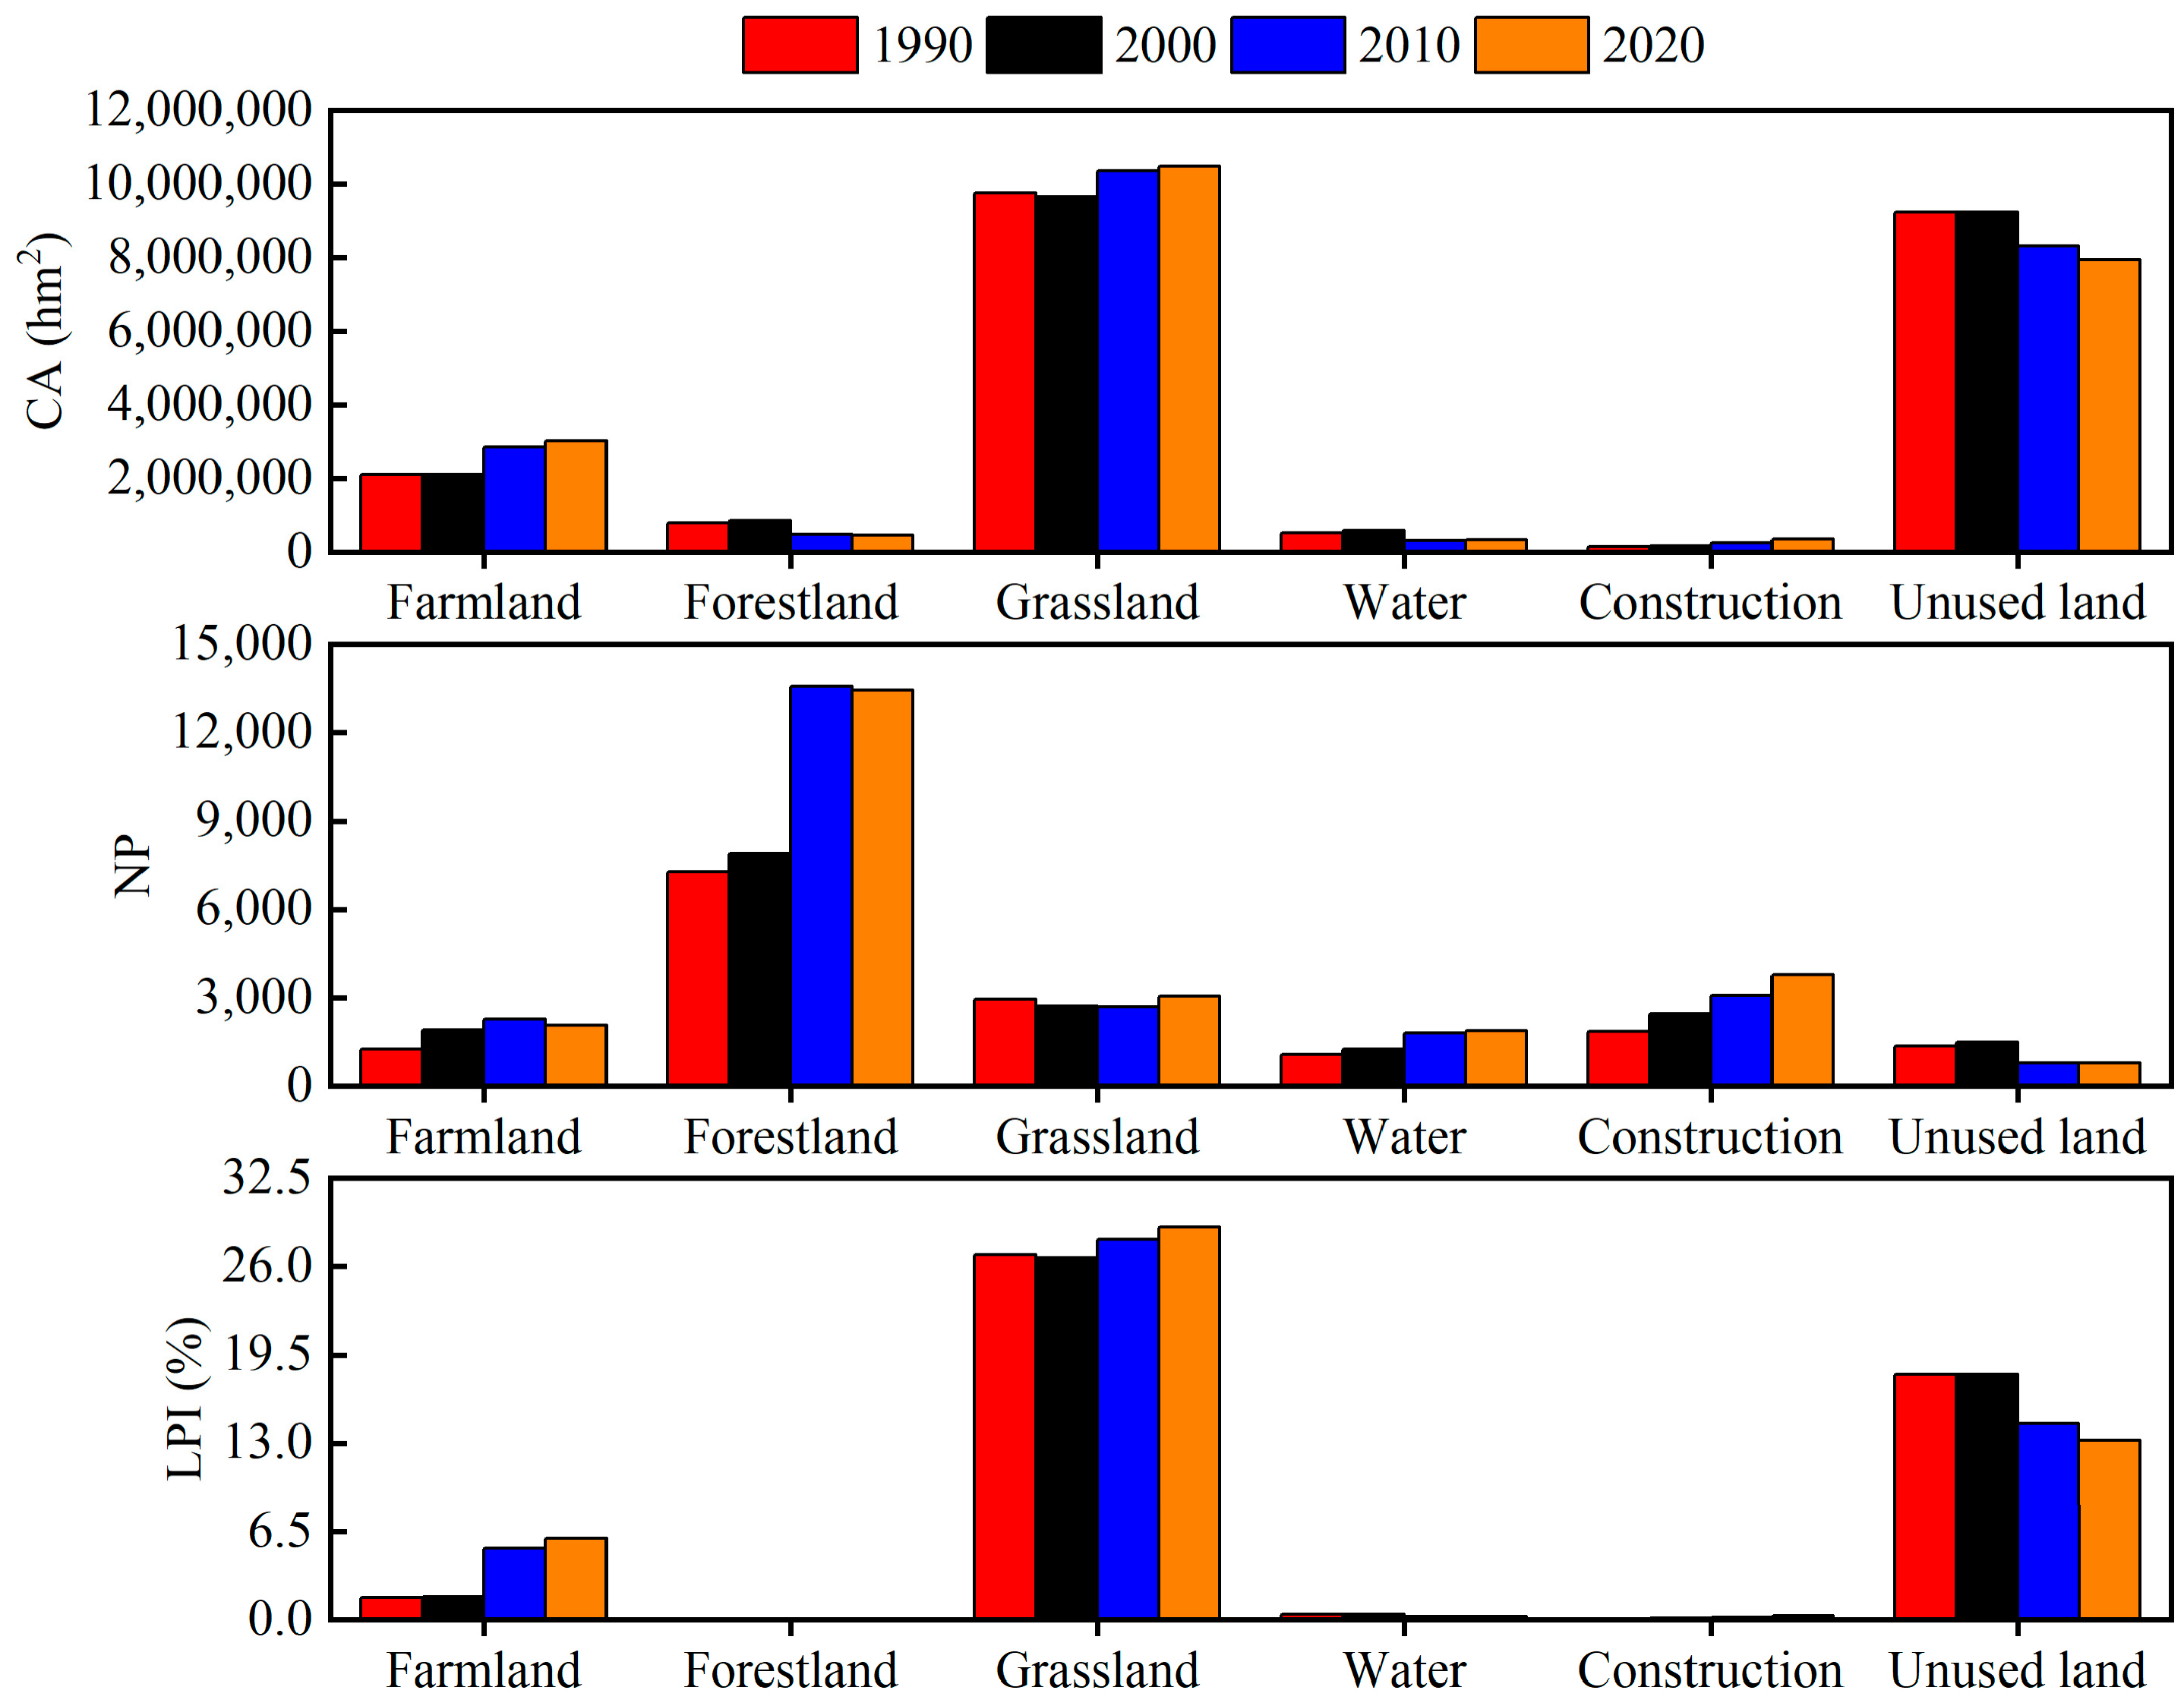
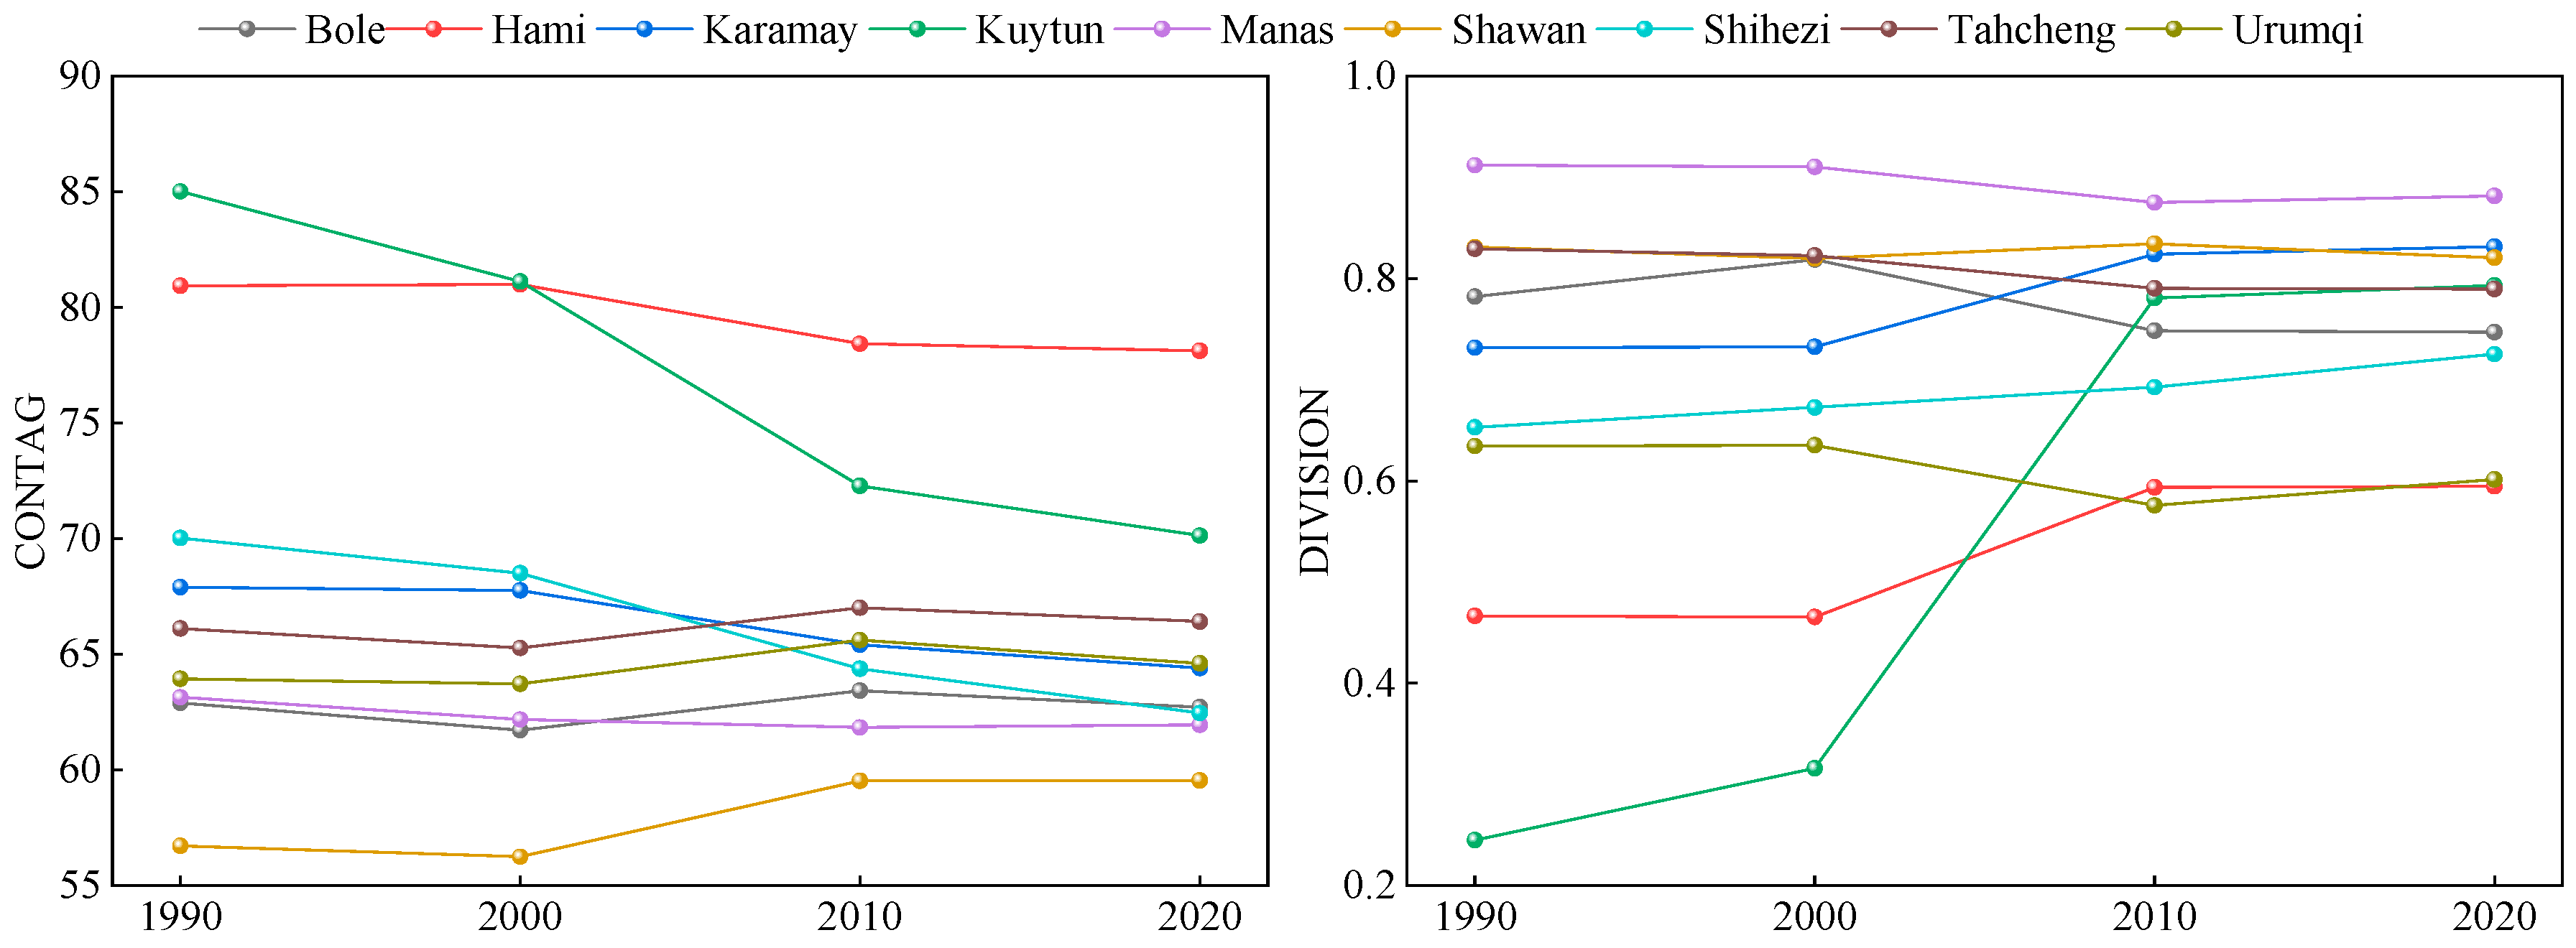
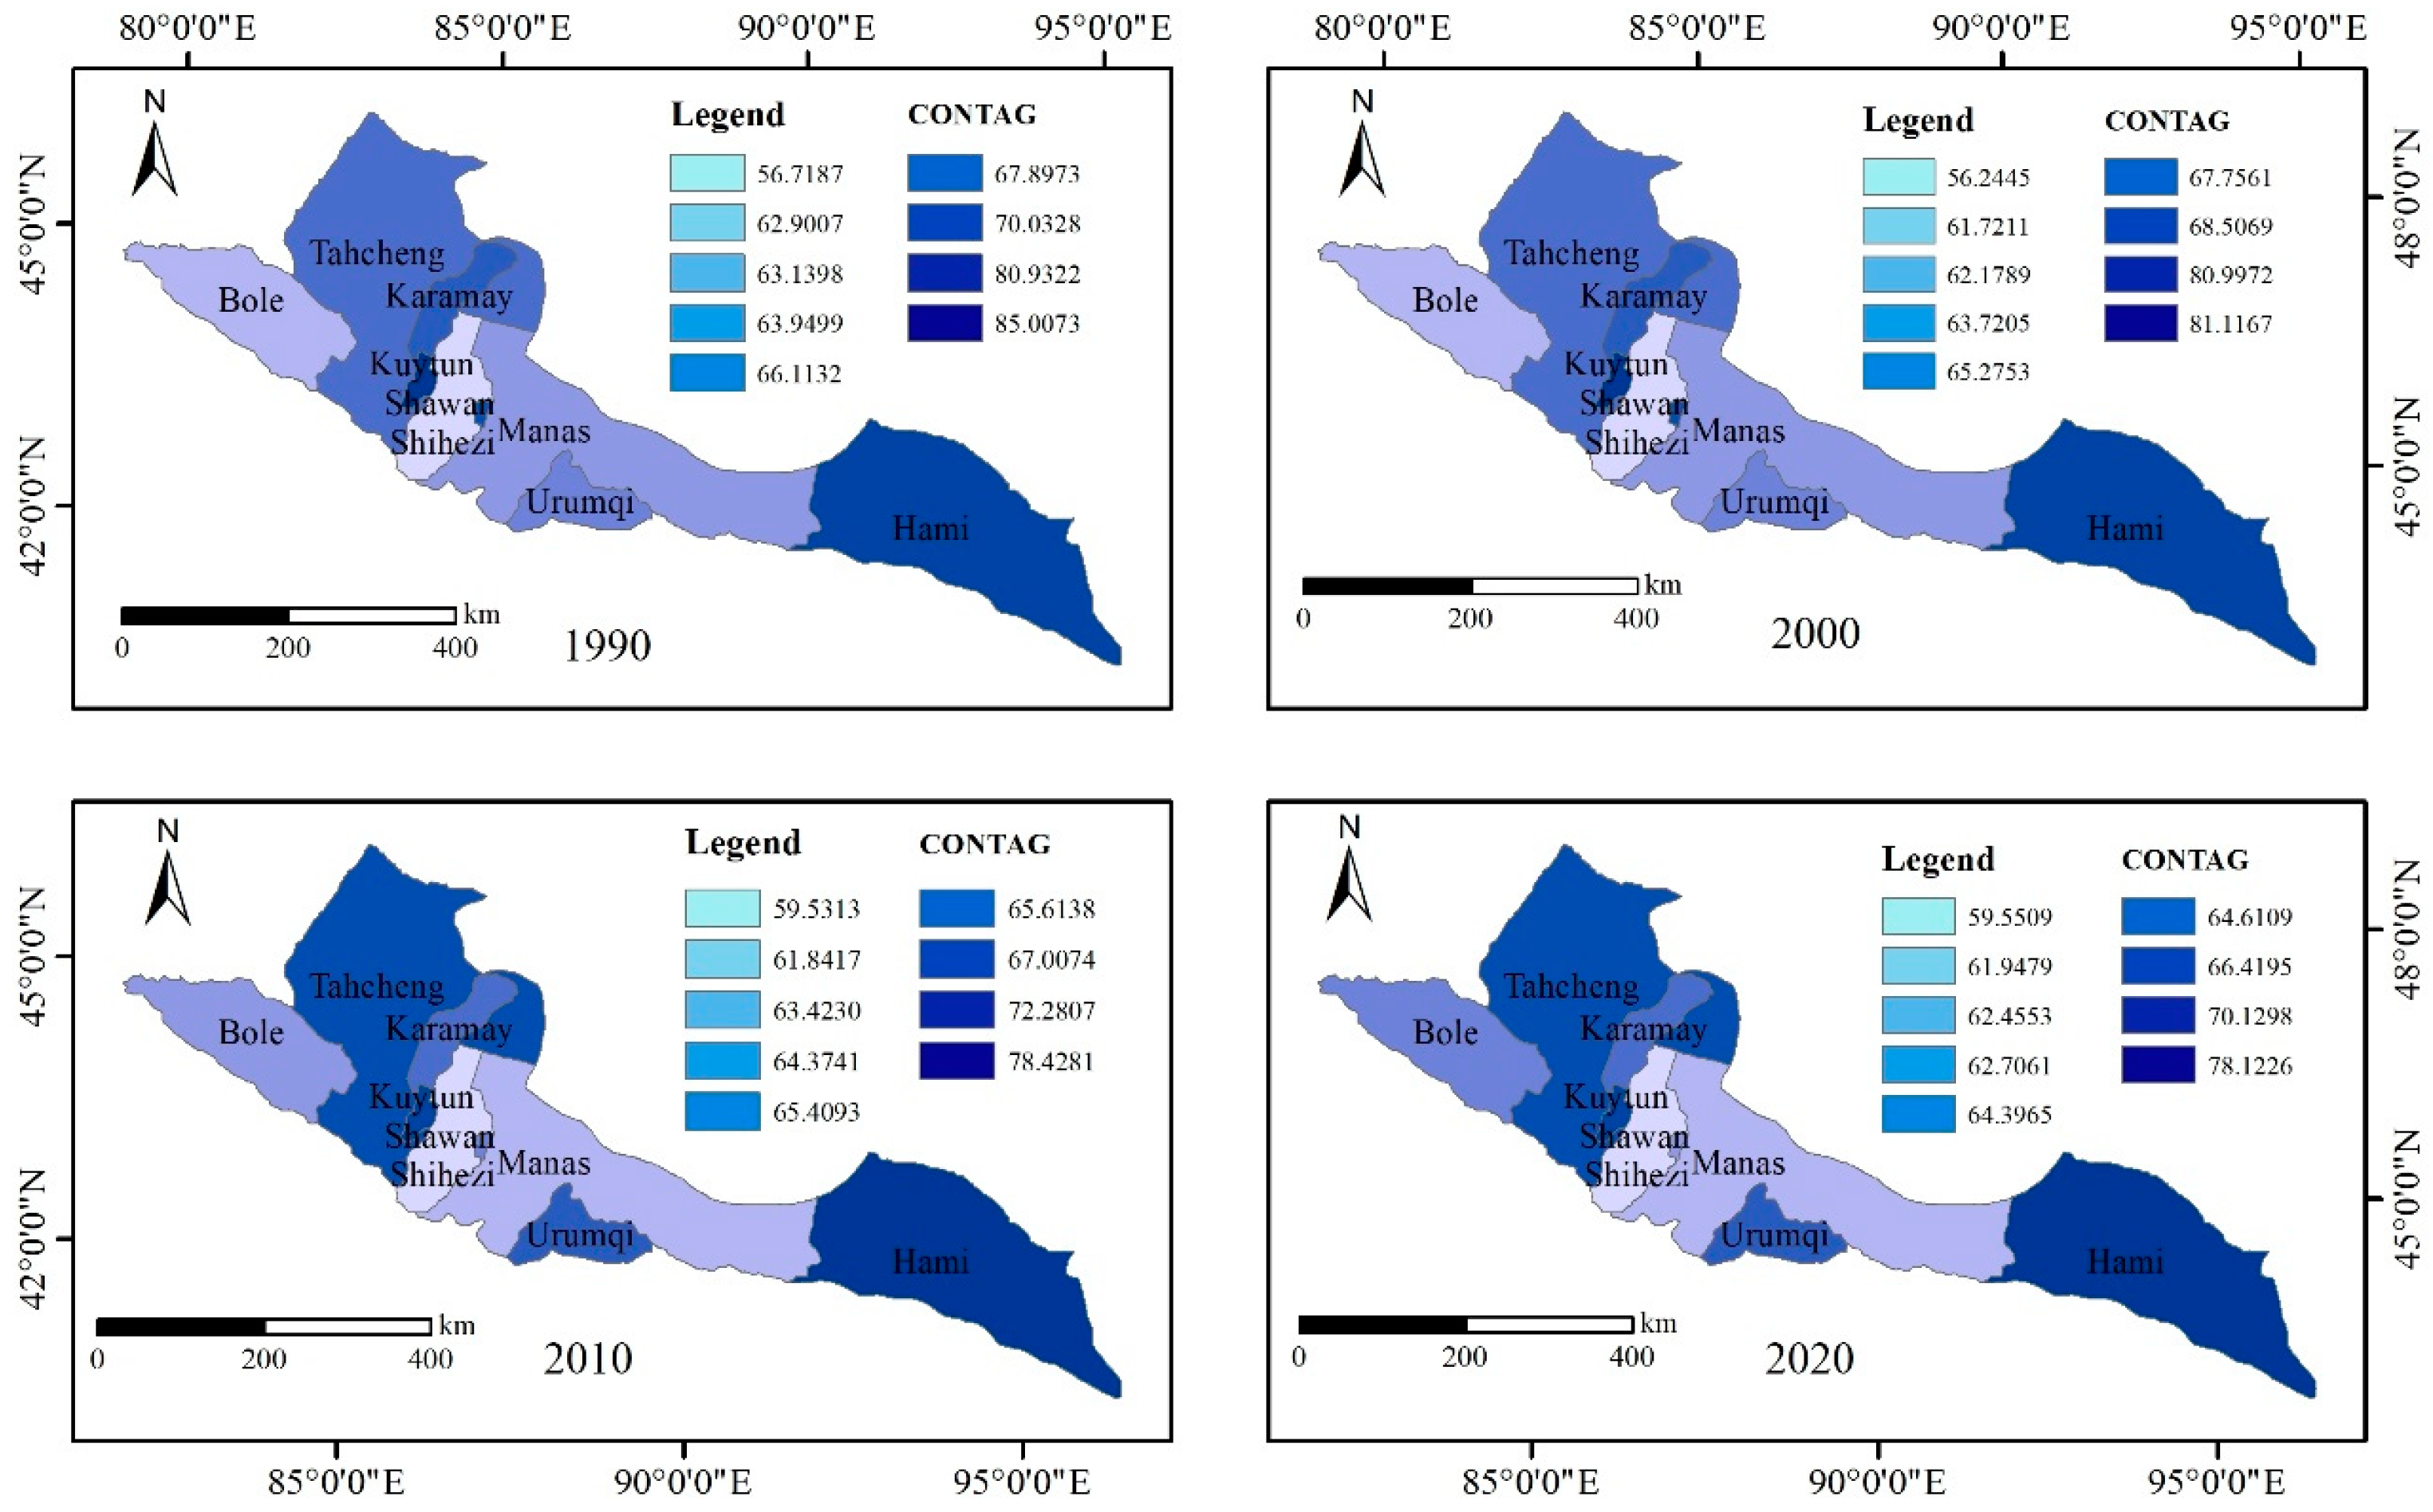
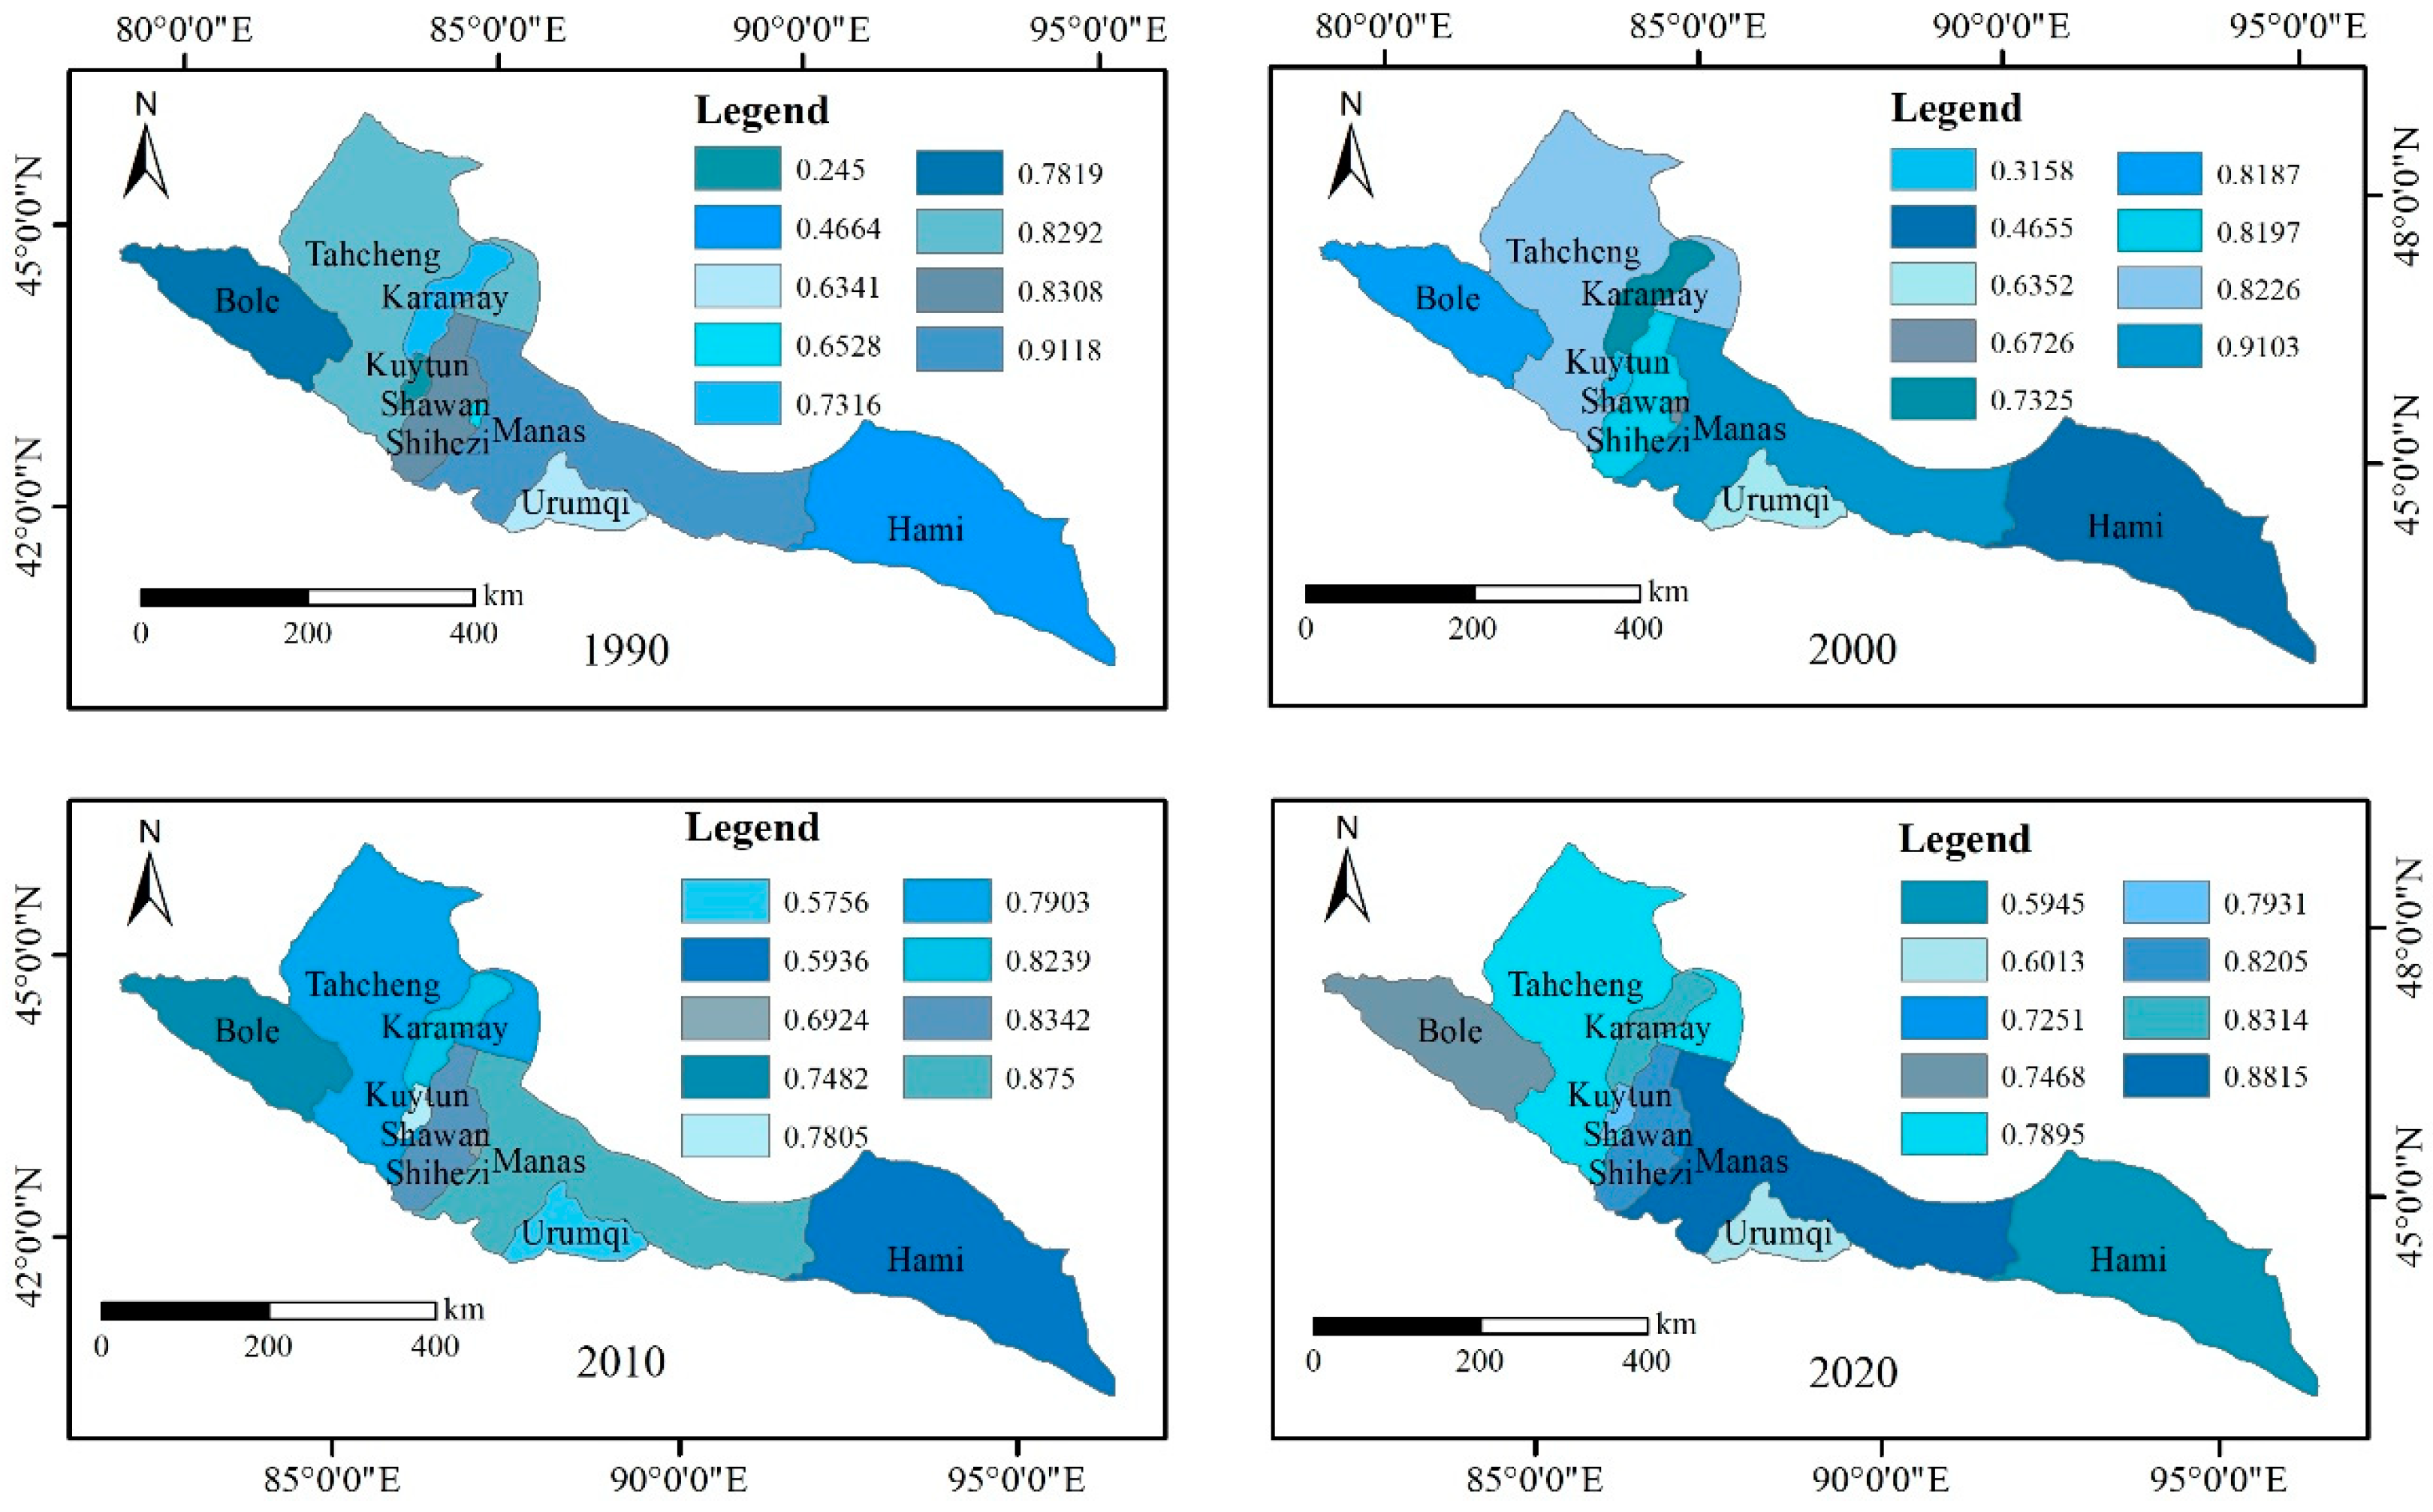
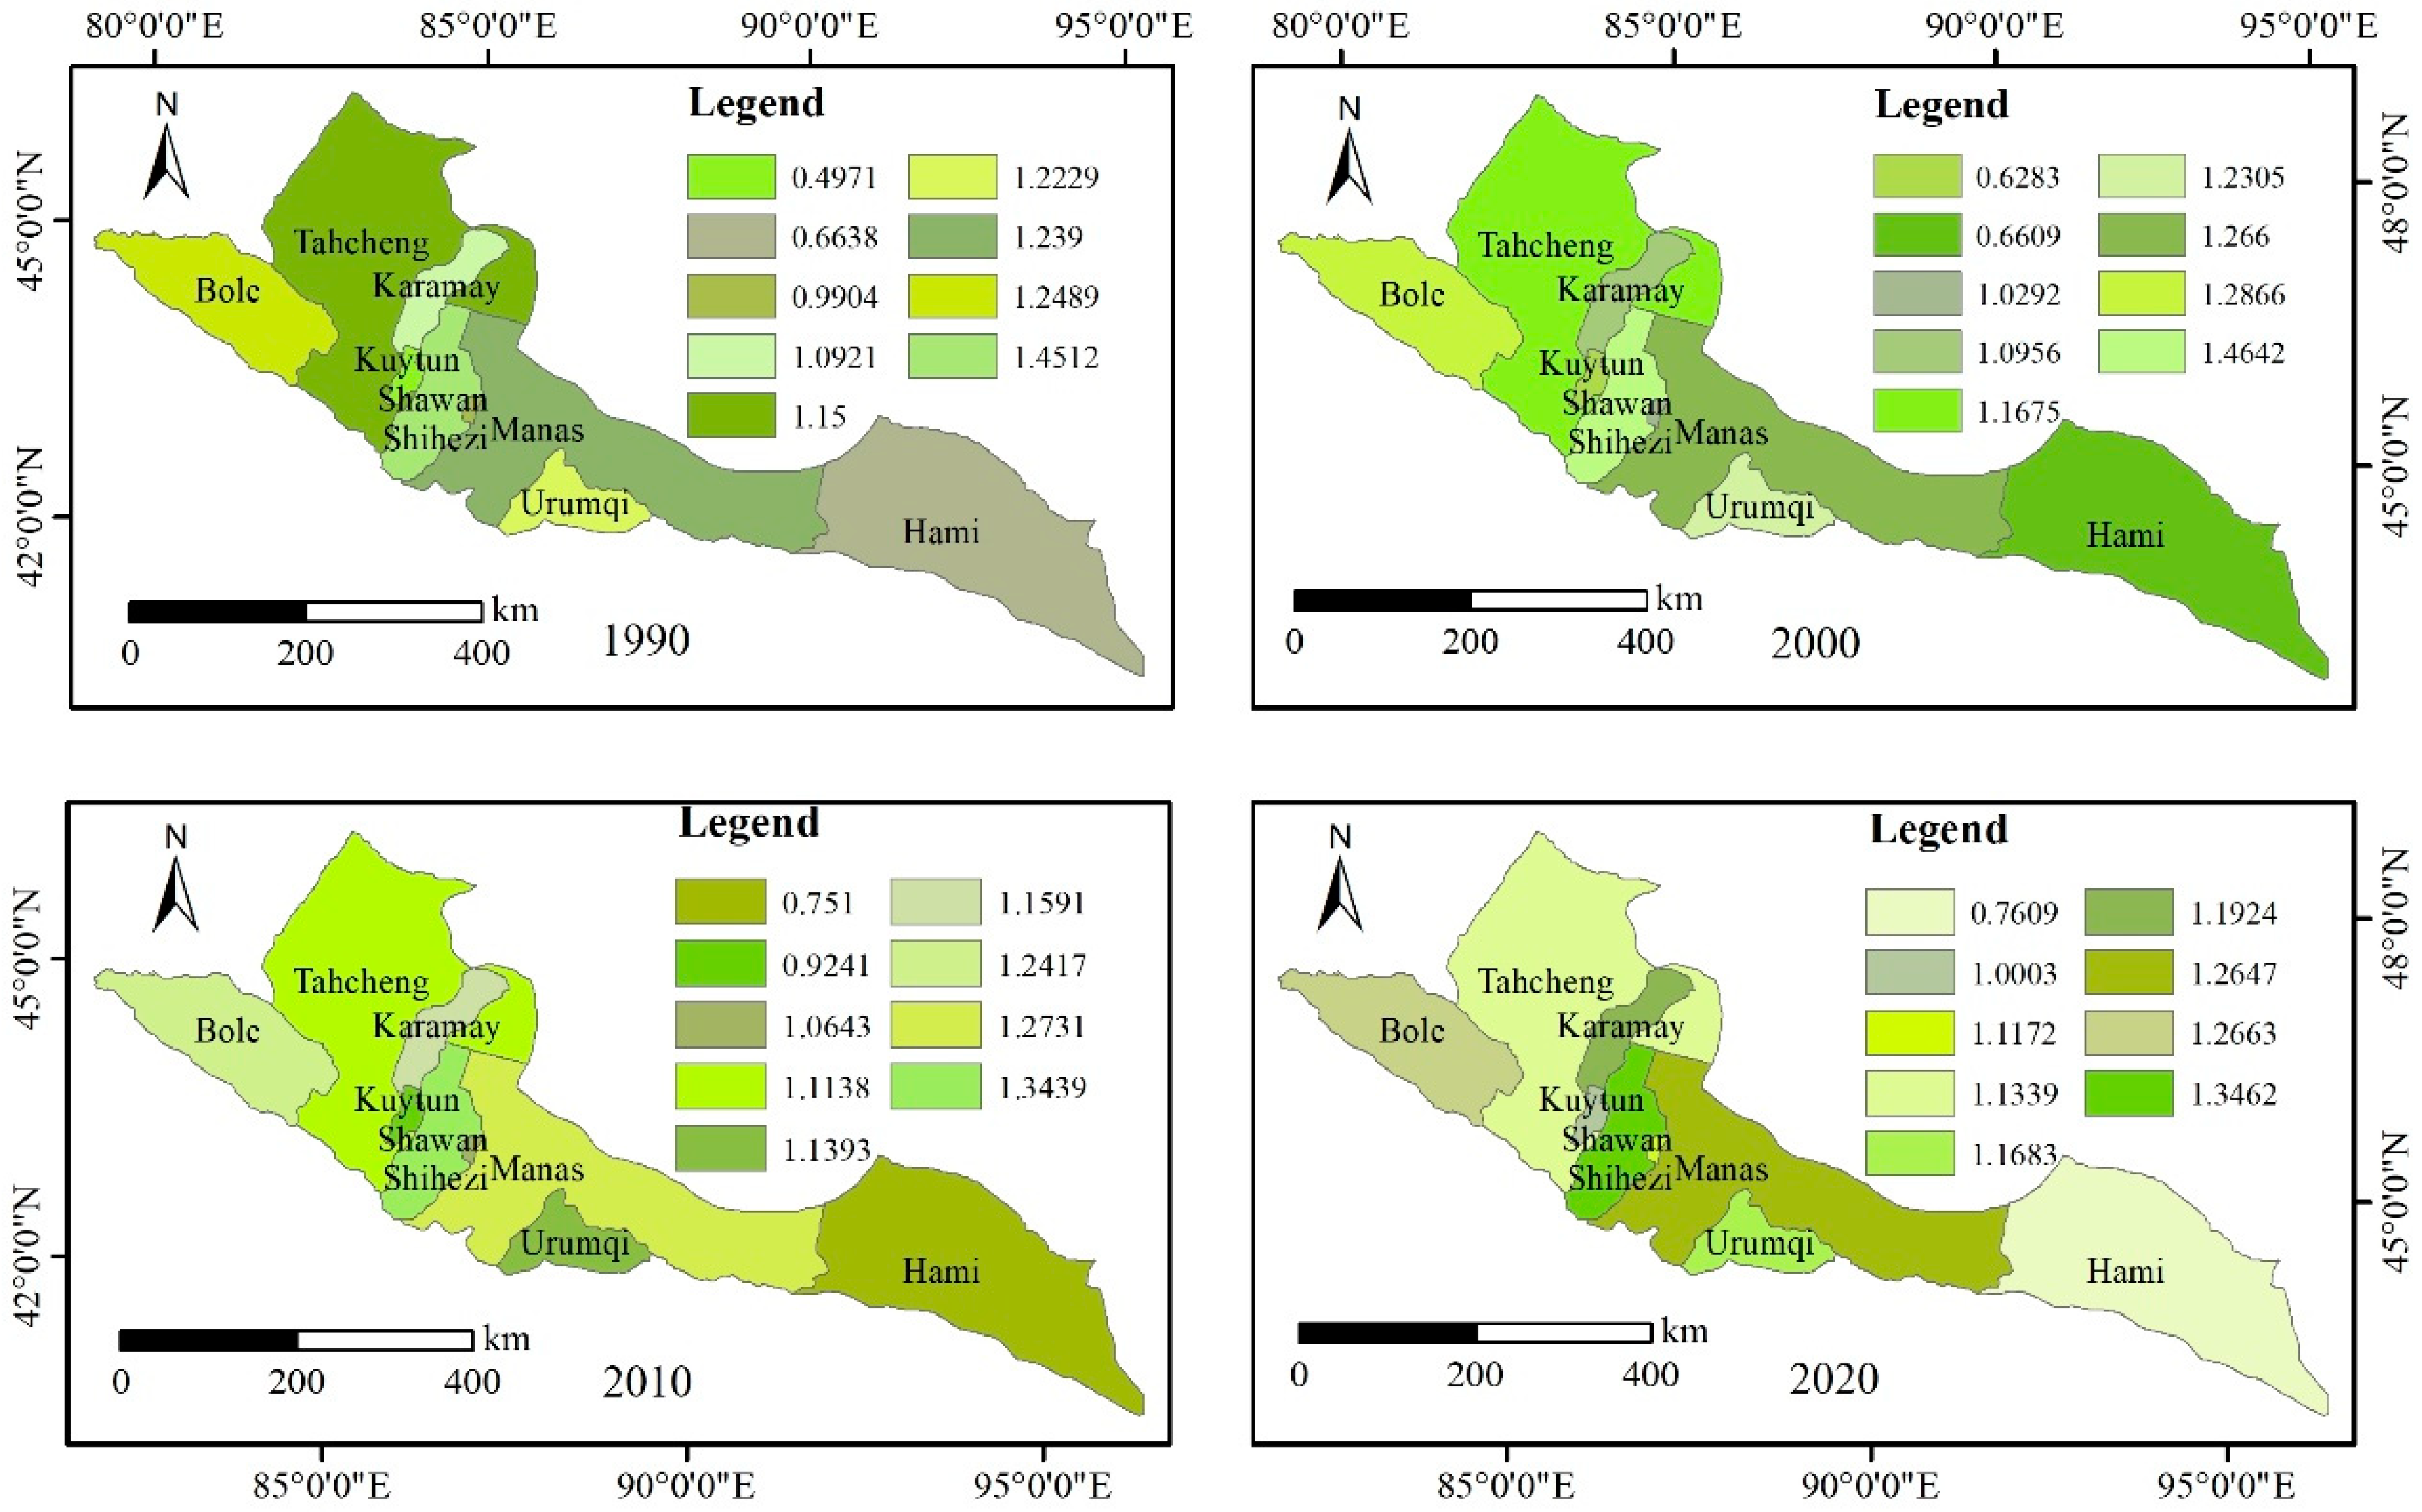
3.3.1. Altering the Attributes of the Landscape Structure on a Categorical Level

Between 1990 and 2020, the changes to the scenery arrangement north of the Tianshan Mountains can be broken down into distinct categories, revealing a unique progression (Figure 5):
(1) Total Area (CA) represents the overall expanse of a specific category of land patch, among which the grassland area changed from 9758269.5 hm2 in 1990 to 10482642.0 hm2 in 2020, indicating that grassland is the largest landscape area.
(2) The value of the Number of Patches (NP) reflects the spatial pattern of the landscape and is often used to describe the heterogeneity of the entire landscape. Generally, the larger the NP value, the higher the fragmentation degree. The NP values increased significantly in all unused areas, indicating that the patch size became smaller and the degree of fragmentation was large.
(3) The Largest Patch Index (LPI) was employed to identify the prevailing patch types across the terrain. The LPI values of farmland and grassland steadily increased from 1.64% and 26.85% in 1990 to 6.00% and 28.91% in 2020, indicating that farmland and grassland were the dominant patch types in the landscape. Grassland is the most dominant patch type in the landscape.

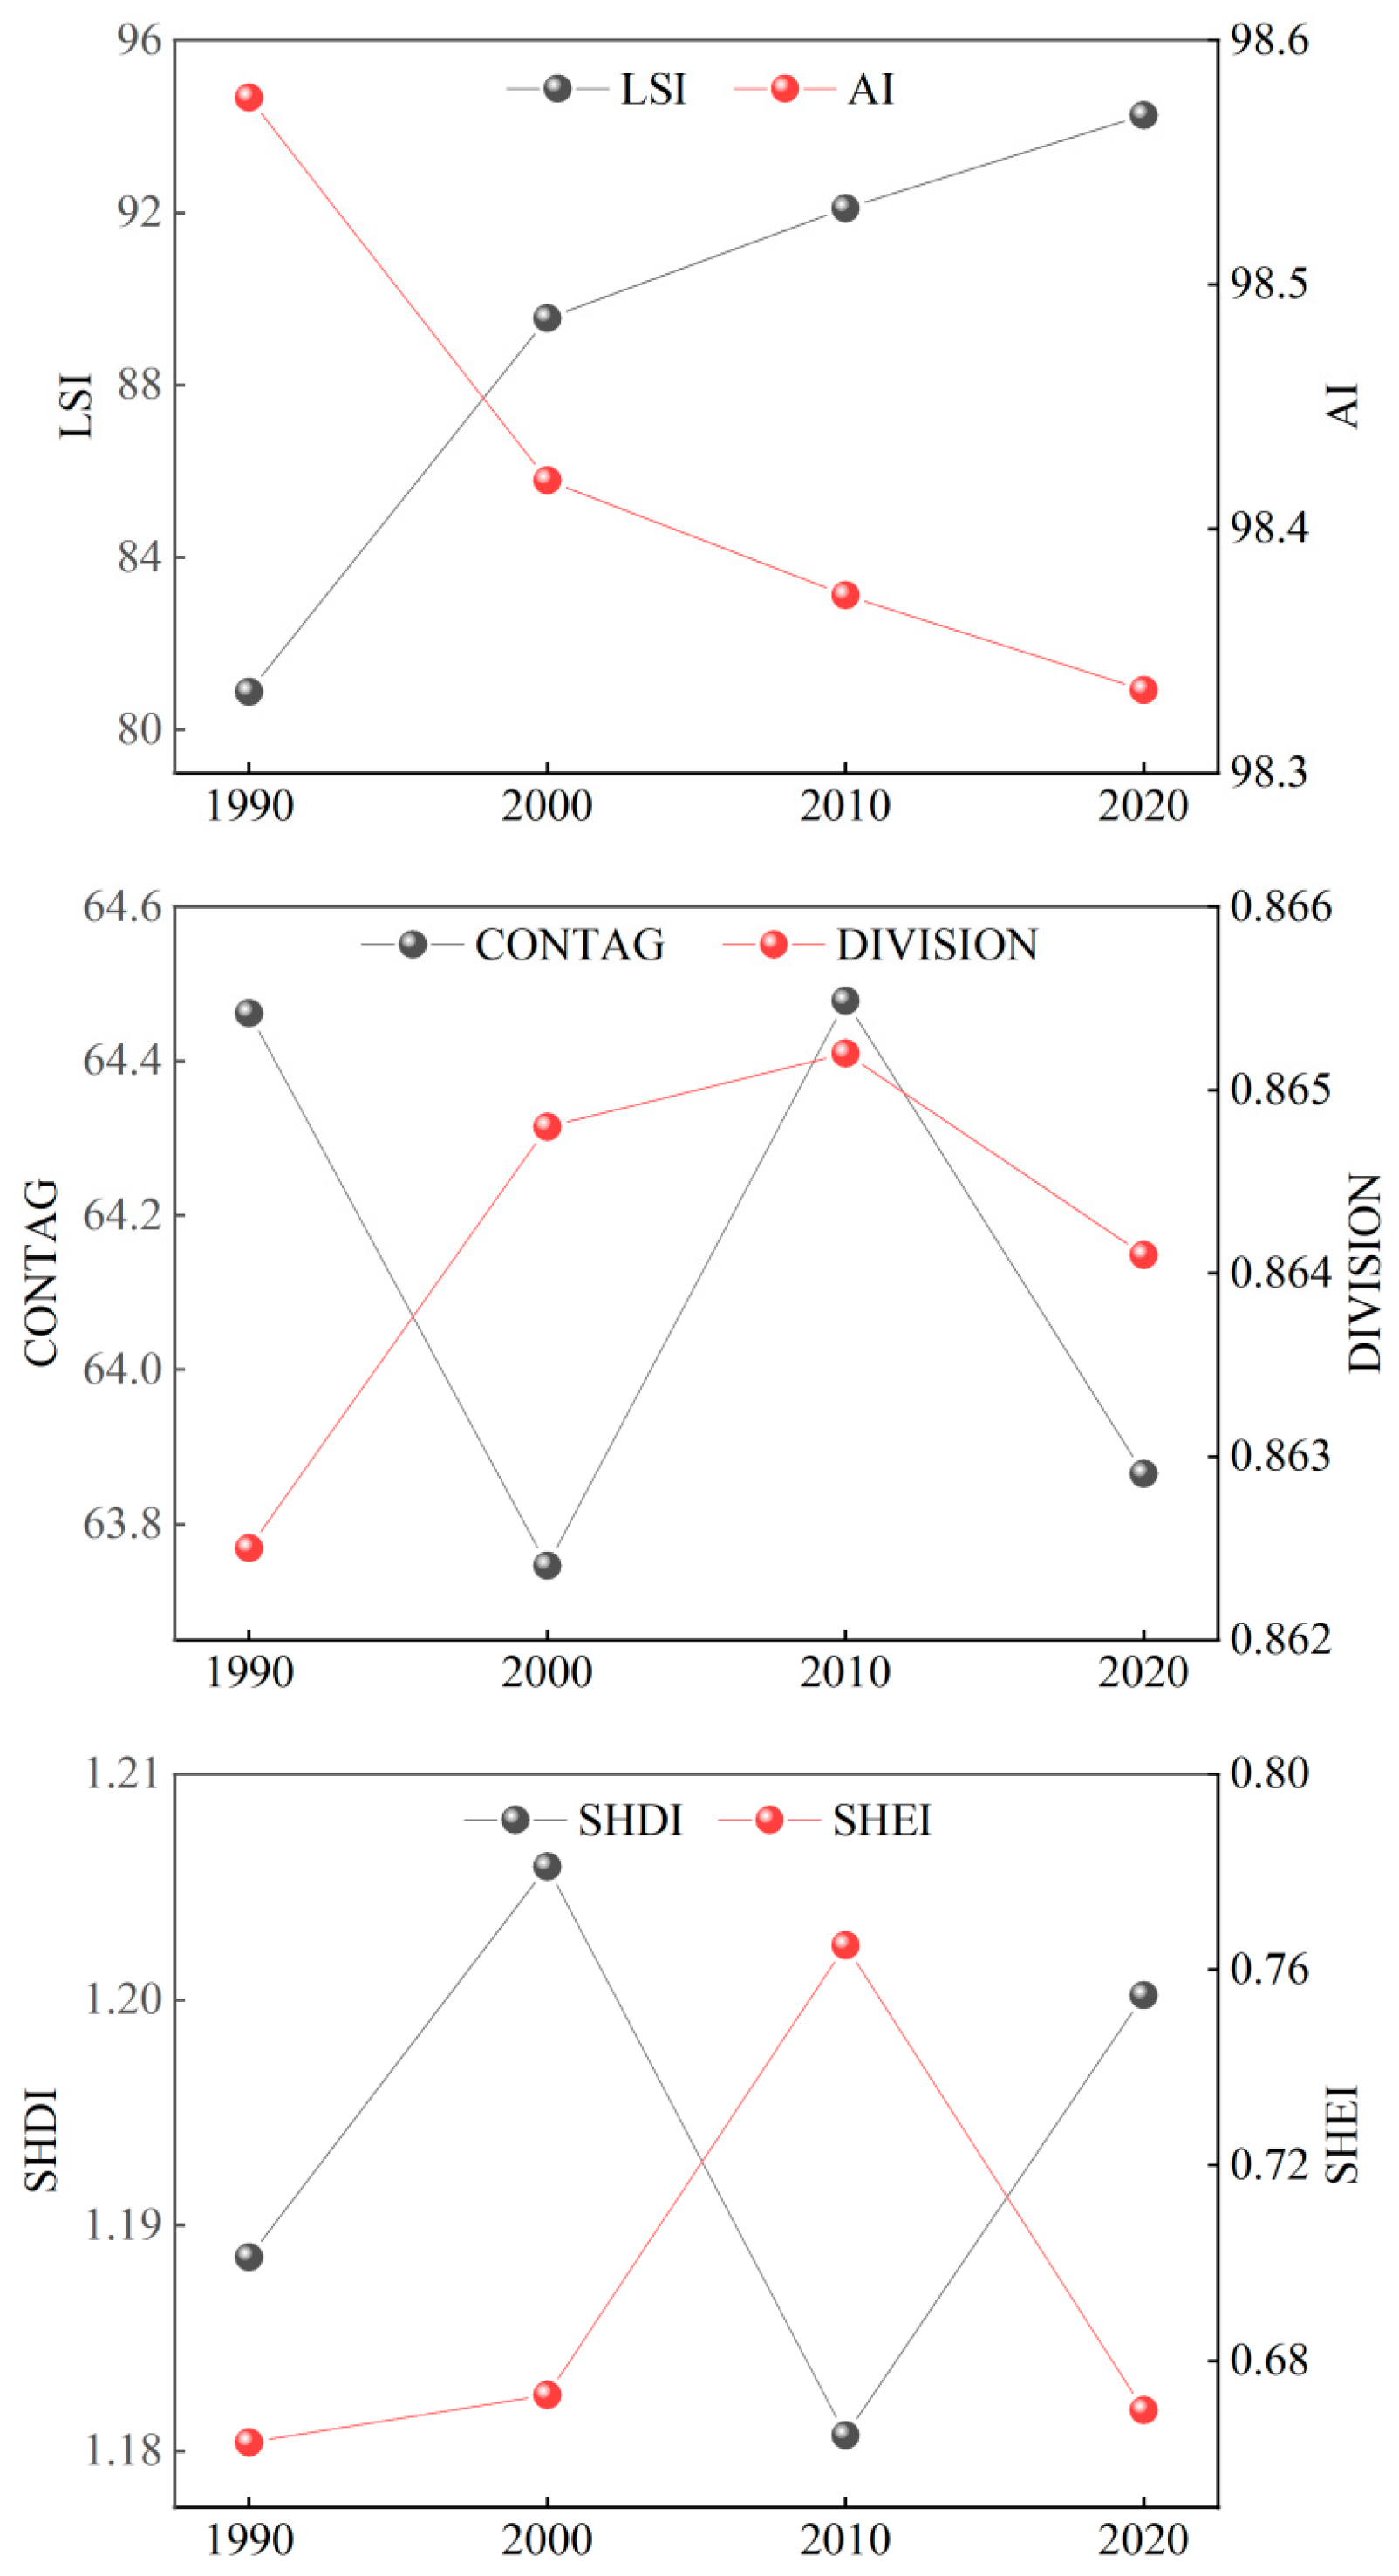
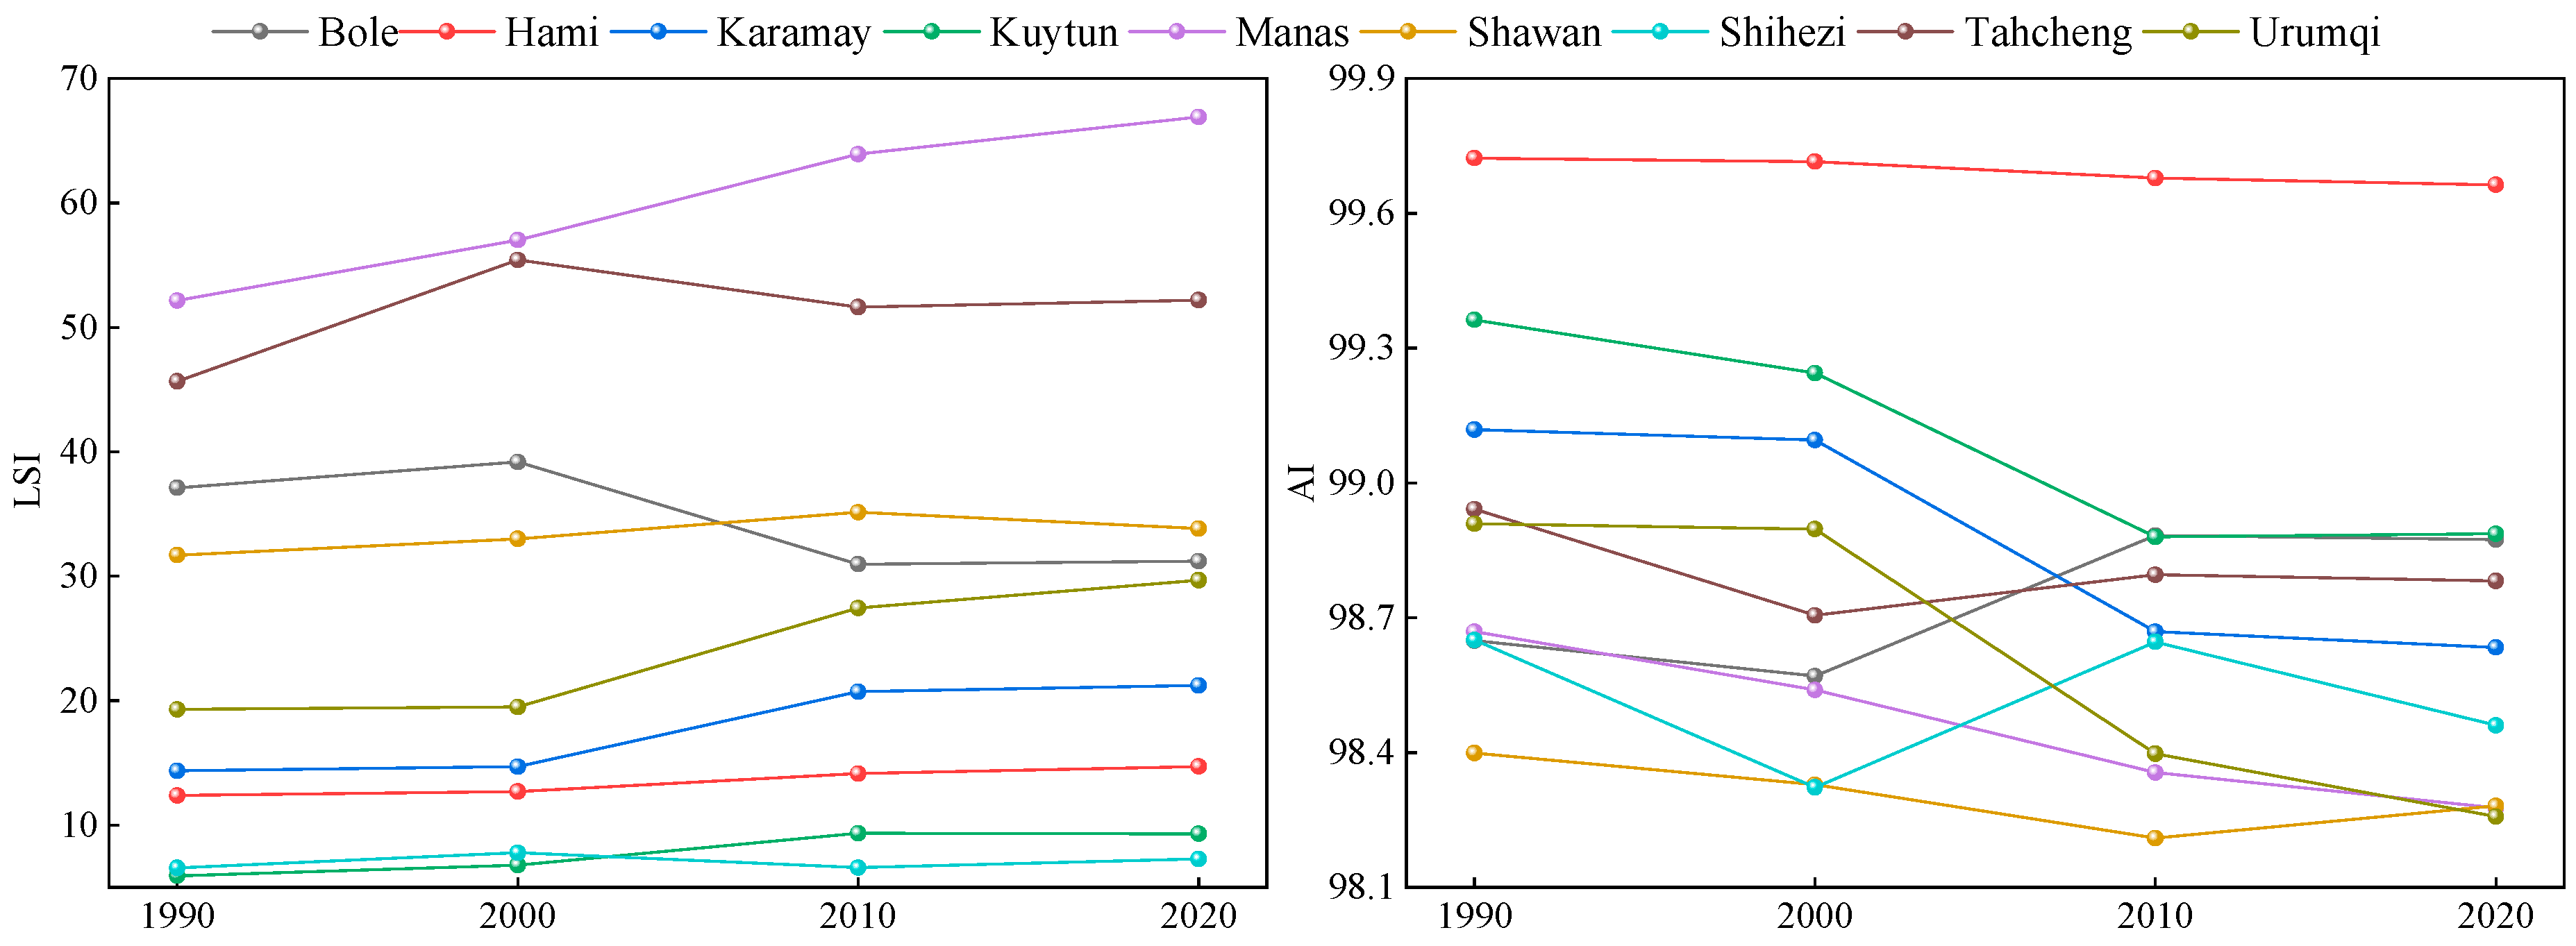
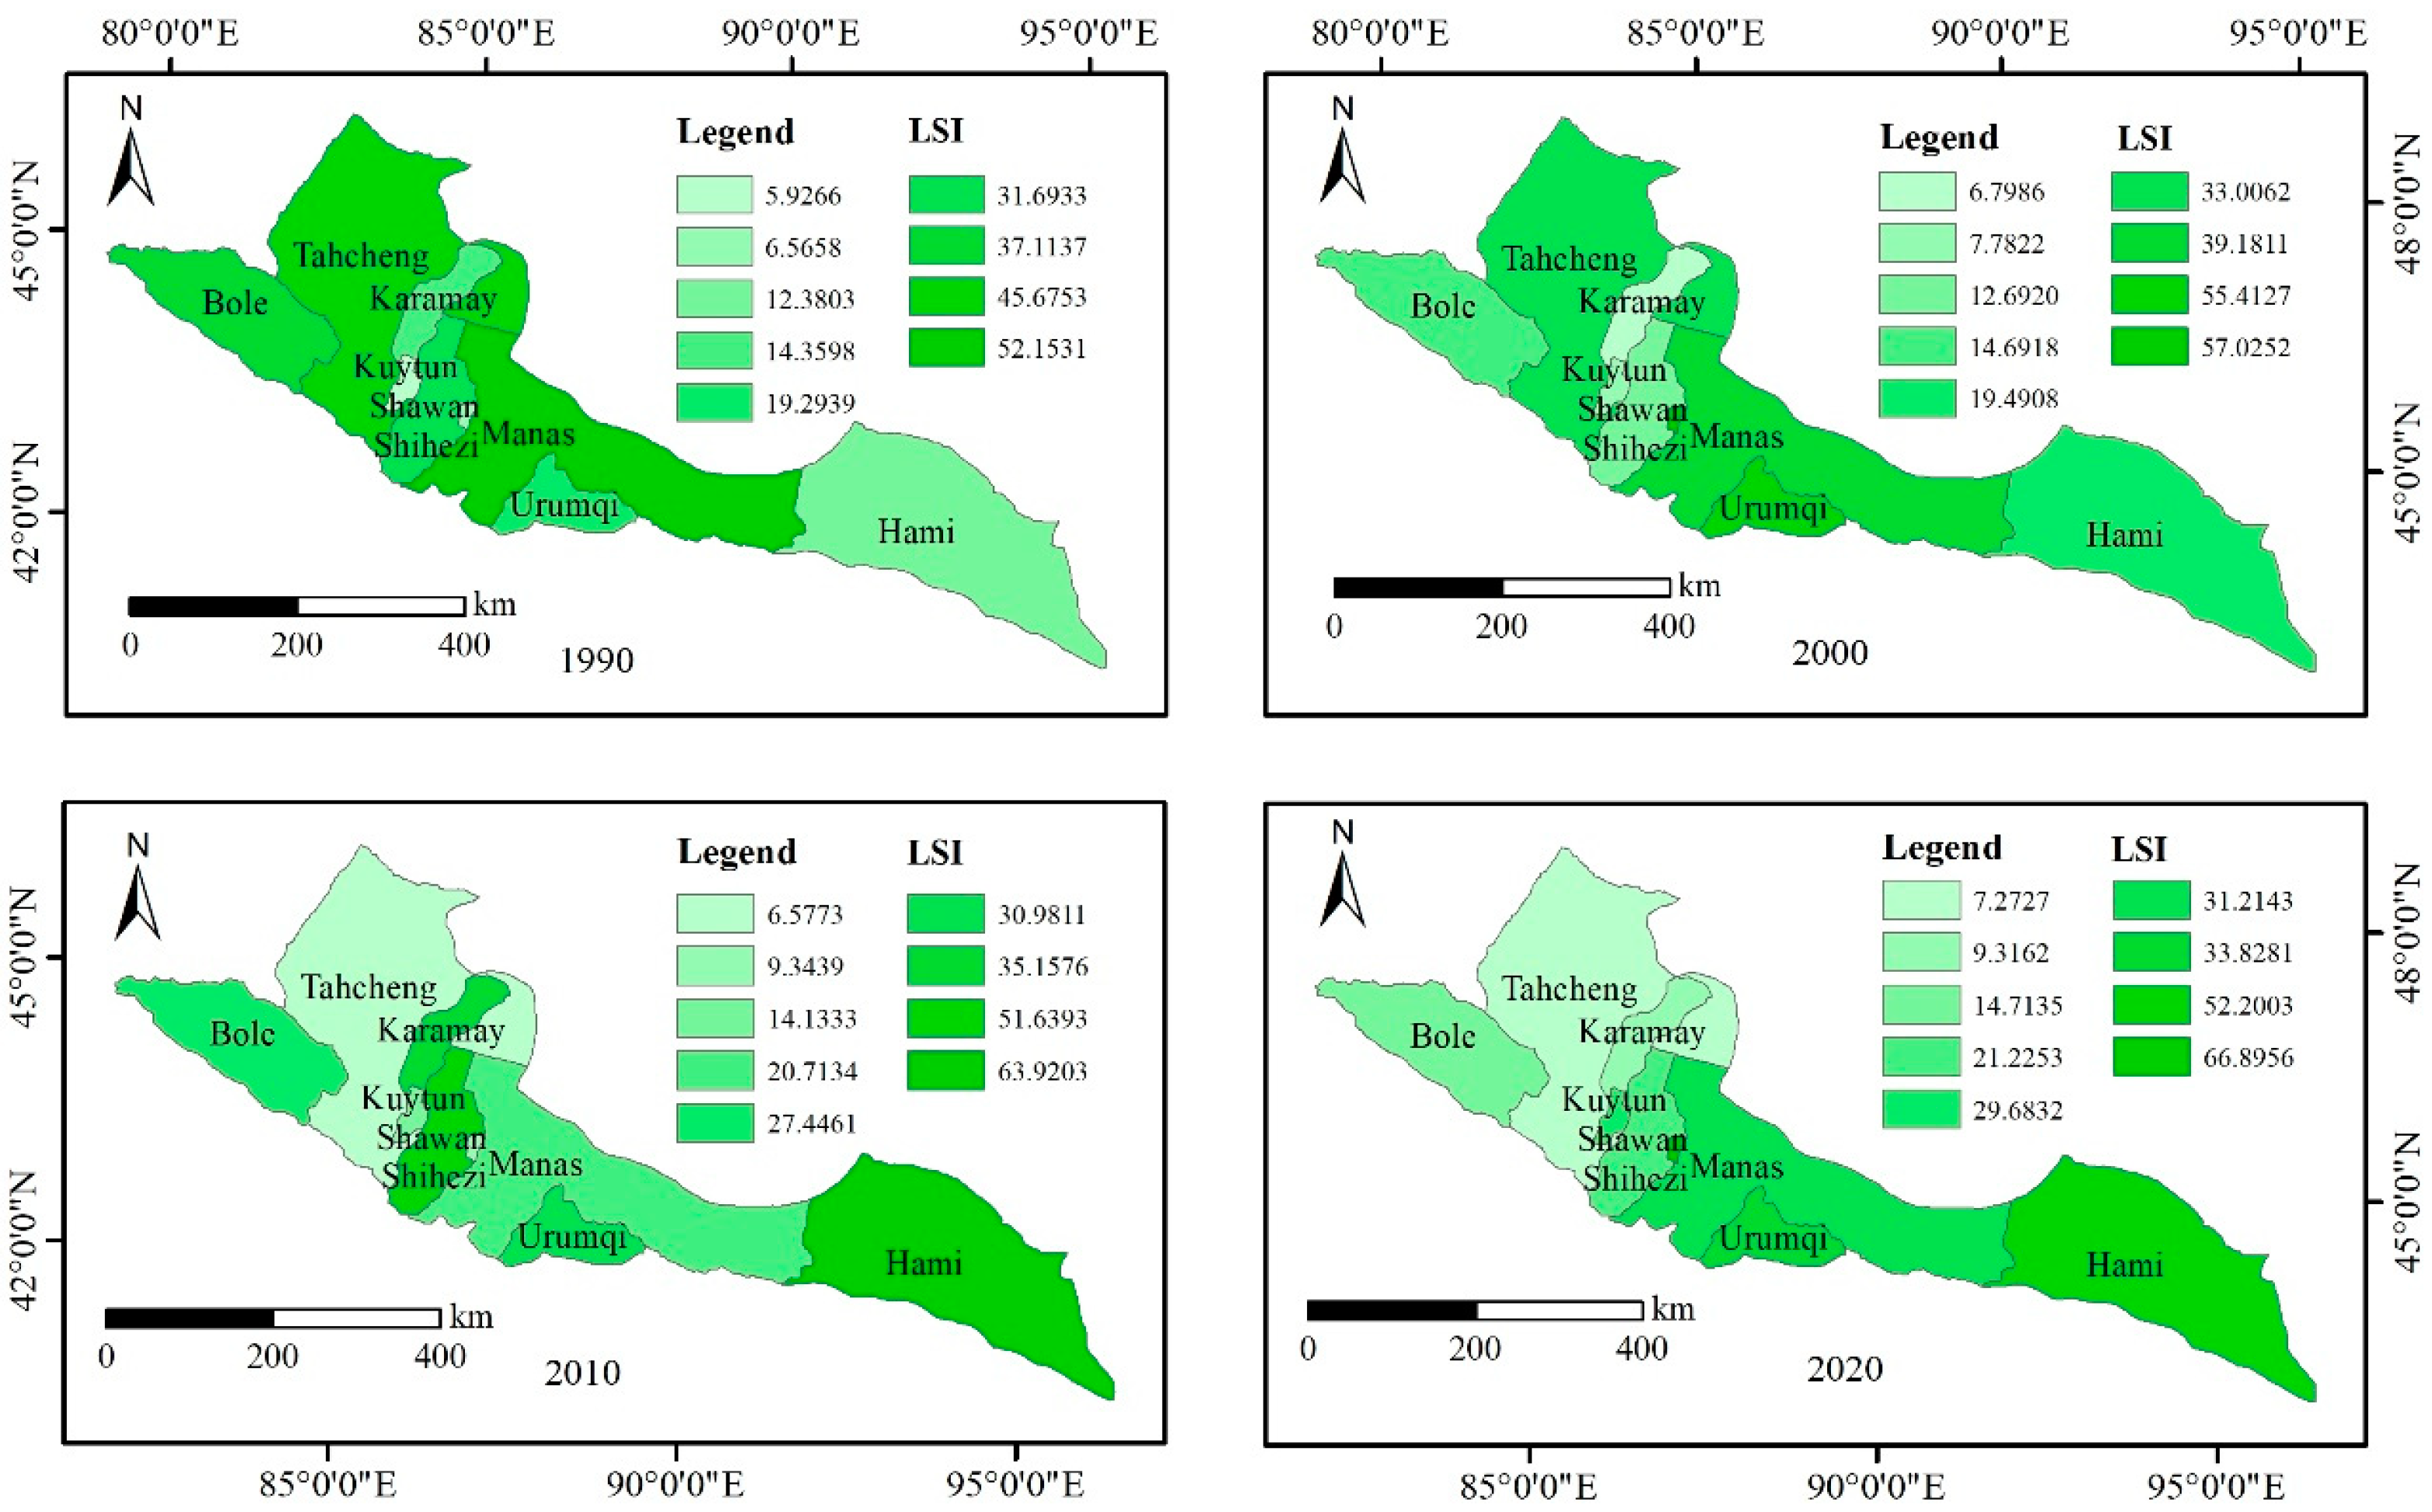
3.3.2. Modifying the Features of the Landscape Pattern on a Broader Scale

Here is an examination of the changes in the terrain layout on the northern slope of the Tianshan Mountains from 1990 to 2020, analyzed through the lens of landscape dynamics:
(1)The value of the Landscape Shape Index (LSI) increased from 80.8803 in 1990 to 94.2634 in 2020. This index is closely related to the intensity of human disturbance, indicating that the patch shape and landscape structure located on the northern side of the Tianshan mountain range tend to be complicated (Figure 6). The landscape shape index showed an increasing trend year by year, mainly in Manas County, Urumqi City, and Karamay City, indicating that the middle part of the north slope of Tianshan Mountain was greatly affected by human disturbance, and the landscape structure complexity was the most significant (Figure 7 and Figure 8).
(2) The Aggregation Index (AI) investigated the interconnectivity between patches of each landscape type, with a lower value indicating a more fragmented landscape. The AI value continued to decrease from 98.5765 in 1990 to 98.3339 in 2020, indicating that the landscape located on the northern slope of the Tianshan mountain range is becoming more and more discrete (Figure 6). The concentration index showed an upward trend mainly in Tacheng, Bole, and Shihezi., whereas the remaining cities witnessed a decline in their trends, indicating that other urban landscapes except these three cities were increasingly dispersed (Figure 7). In terms of the Aggregation Index, Hami City stands tall on the eastern edge of the northern slope of the Tianshan Mountains, proudly claiming the highest spot in the region, followed by cities in the western section of the northern slope of the Tianshan Mountains, while the middle section of the northern slope of the Tianshan Mountains is the lowest (Figure 9).
(3) The Contagion index (CONTAG) serves as a measure of the clustering intensity or expansion trajectory of various patch categories within the terrain. In essence, a heightened dissemination figure suggests effective interconnection among specific dominant patch types in the terrain. Conversely, it points towards a landscape characterized by intricate patterns comprising diverse elements, thereby indicating a notable level of fragmentation within the terrain. The CONTAG metric showed a consistent decline from 64.4622 in 1990 to 63.8652 in 2020, suggesting that the northern incline of the Tianshan Mountains boasts a rich array of diverse elements, the dominant species do not have good connectivity, and the degree of fragmentation is high (Figure 6). Among them, the Contagion index of Bole, Shawan, Tacheng, and Urumqi increased year by year; it shows that the areas with good connectivity of dominant patches are mainly concentrated in Boler, Shawan, Tacheng and Urumqi, while the fragmentation degree of other cities is getting higher and higher (Figure 10). Spatially, the Contagion index of the eastern and western sections of the northern side of the Tianshan mountain range is higher, while that of the middle section is lower, indicating that the middle section is greatly affected by human activities and has a higher degree of fragmentation (Figure 11).
(4) The Landscape Division Index (DIVISION) indicates the level of isolation between patches within the landscape. A higher value suggests a higher degree of patch fragmentation and a more intricate landscape structure. Although the DIVISION value first increased and then decreased, the overall DIVISION value increased from 0.8625 in 1990 to 0.8641 in 2020, so the landscape patch composition located on the northern face of the towering Tianshan mountain range became increasingly fragmented and complex (Figure 6). Among them, the Landscape Division Index of Kuitun City and Hami City significantly increased, and the patch composition became more and more complex, while the change in other cities was not obvious (Figure 10). Spatially, the cities with the highest degree of fragmentation are mainly concentrated in Kuitun and Hami (Figure 12).
(5) Shannon’s Diversity Index (SHDI) can reflect landscape heterogeneity. The richer the land use is, the higher the degree of fragmentation, the greater the uncertainty information content, and the higher the calculated SHDI value. SHDI tended to increase, from 1.1886 in 1990 to 1.2002 in 2020, indicating that patch types located on the northern slope of the Tianshan mountain range were constantly increasing, types were constantly enriched, urban landscape fragmentation was constantly strengthened, landscape type dominance was declining, and the prevailing landscape structure characterized by a limited number of dominant patches was slowly undergoing transformation. The SHDI values of Shawan, Bole, Tacheng, and Urumqi all increased to varying degrees, except for a slight decrease. The urban areas with the largest degree of spatial disintegration and diverse patch types are mainly concentrated in Shawan, Bole, Tacheng, and Urumqi (Figure 13 and Figure 14).
(6) When the value of Shannon’s Evenness Index (SHEI) is smaller, the dominance degree is generally higher, which indicates that the terrain is primarily characterized by a single or a small number of prevailing block varieties. When SHEI reaches the value of 1, the dominance level is minimal, suggesting a lack of prominent block types in the scenery, with all block types evenly scattered throughout the environment. Although the SHEI value first increased and then decreased, its value changed from 0.6633 in 1990 to 0.6699 in 2020, tending more and more toward 1, which indicates that the dominance degree of the northern slope of the Tianshan Mountains is declining. The SHEI value of most cities increased, except for Shawan County, where it had a more obvious decline, suggesting that only Shawan County’s dominance is increasing (Figure 13). Geographically speaking, Shannon’s Evenness Index reached its peak on the eastern side of the northern slope of the Tianshan Mountains, gradually decreasing towards the central and western regions. This trend suggests a notable absence of dominance in the eastern part of the northern slope of the Tianshan Mountains (Figure 15).

3.4. Correlation Analysis of Land Use Change and Landscape Pattern

SPSS 26 software was used to analyze the grey correlation degree between 6 land use types and 9 landscape pattern indices (Figure 16). The three land use types with the highest correlation degree with CA were grassland (0.95) > unused land (0.93) > cultivated land (0.82). The three land use types with the highest correlation degree with NP were cultivated land (0.83) > construction land (0.71) > grassland (0.70). The three land use types with the highest correlation degree with LPI were grassland (0.97) > unused land (0.91) > cultivated land (0.83). The three land use types with the highest correlation with LSI were grassland (0.90) > cultivated land (0.83) > unused land (0.82). The three land use types with the highest degree of correlation with AI were grassland (0.95) > unused land (0.93) > cultivated land (0.82). The three land use types with the highest correlation degree with CONTAG were grassland (0.96) > unused land (0.93) > cultivated land (0.82). The three land use types with the highest correlation degree with DIVISION were grassland (0.96) > unused land (0.93) > cultivated land (0.83). The three land use types with the highest correlation with SHDI were grassland (0.95) > unused land (0.92) > cultivated land (0.82). The three land use types with the highest correlation degree with SHEI were grassland (0.94) > unused land (0.88) > cultivated land (0.85).
The analysis of the correlation between land use type change and landscape pattern evolution can provide scientific basis for the sustainable and healthy development of ecological landscape in the north slope of Tianshan Mountains. In summary, there is a close relationship between grassland, cultivated land, and unused land on the north slope of Tianshan Mountain and landscape patterns, which play an important role in the change of regional landscape patterns. The regulation of land use and landscape pattern on the north slope of Tianshan Mountain should mainly focus on grassland, cultivated land, and unused land, and take grassland and cultivated land protection as the focus, vigorously develop unused land, reduce the fragmentation of landscape pattern, and promote the sustainable and healthy development of the regional ecological economy.

4. Discussion

4.1. Research Consistency Analysis and Future Research Direction

Many scholars have analyzed and studied the driving forces behind land use change [28], the changes in ecological environment quality [29], and the changes in ecological service value [30]. Other scholars have studied land use and erosion risk mapping [31], mountain–oasis–desert ecosystems [32], and ecological responses [33]. However, there is little research on land use and landscape patterns from the perspective of temporal and spatial distribution. In this study, land utilization statistics extracted from the years 1990, 2000, 2010, and 2020 were specifically chosen to scrutinize the alterations in spatial-temporal land usage and the index of landscape patterns within the designated research zone by using the matrix of land use transfer and indices of landscape patterns. The research results were essentially in line with the conclusions of Liu Yaru et al. [34] and Nijati Imir et al. [35]. If image data with a higher resolution and a long time series can be obtained for analysis, the research results in this paper may be more systematic and targeted. Land use landscape pattern change is a long-term and dynamic process. To what extent do natural elements like temperature, precipitation, flora, human interventions, and policy decisions influence alterations in the landscape patterns on the northern slope of the Tianshan Mountains? A multi-scenario optimization of land use on the northern slope of the Tianshan Mountains and the simulation and prediction of its type evolution will be the direction of further exploration and research in the future [36]. It is worth noting that there are currently some issues with regional urban agglomerations. The development of urban clusters in the central and western regions is relatively concentrated, and the ecological environment is severely damaged. It is necessary to coordinate economic development and ecological environment protection simultaneously, adjust fragmented development to intensive development, and strengthen cooperation between regional governments. In addition, from the perspective of population development, the number of unemployed people in urban agglomerations is increasing year by year, and the problem of uneven allocation of high-quality population resources is becoming increasingly serious. Moreover, the pressure on resources and the environment is increasing year by year, and the prospects for sustainable development of urban agglomerations are not optimistic.

4.2. Influence of Driving Factors on Land Use Pattern on the North Slope of Tianshan Mountains

The changes in land use and landscape patterns in the economic belt on the north slope of Tianshan Mountain are affected by population, economy, climate, policy, and other factors. Among the population elements, the increase in population will directly lead to the expansion of living areas, which will promote the change of land use [37]. The population of the north slope of Tianshan Mountain was 3.455 million in 1990, and the total population increased to 8.666 million in 2020. Meanwhile, construction land and cultivated land increased by 2089.7 km2 and 9141.3 km2 from 1990 to 2020. With the growth of population, the scale of urban and rural areas needs to expand, and the area of cultivated land needs to expand, which will lead to the transformation of other land use types to construction land and cultivated land, resulting in the change of land use mode. Among the economic factors, the total grain output and agricultural output value have a great influence on the change in cultivated land. The state has stopped agricultural tax and expanded agricultural subsidies, which has reduced the economic burden of farmers and increased the motivation of farmers to cultivate land, thus affecting the transformation of land use types [38]. In terms of climate factors, average annual precipitation and average annual temperature are the main factors of water body area change [39], and with the development of population and agriculture, urban water consumption and agricultural water consumption continue to increase, so the water body area decreased by 1859.2 km2 from 1990 to 2020, showing a trend of continuous reduction. In addition, the area of grassland increased by 7233.7 km2 from 1990 to 2020, and grassland is the largest land type, and the overall trend keeps growing. In order to respond to the “One Belt and One Road” policy and promote the comprehensive and sustainable development of economic ecology, the research area vigorously develops desert improvement and urban greening and builds an oasis economic belt on the north slope of Tianshan Mountain. The pattern of grassland land use has increased [40]. The Tianshan North Slope Economic Zone has seized the opportunities brought by the Western Development, actively promoted a comprehensive, multi-level, and wide-ranging pattern of opening up to the outside world, broken down regional divisions and administrative boundaries, vigorously promoted economic integration within the region, and made breakthroughs in economic cooperation with coastal cities in multiple fields and levels. The scale of foreign trade, economic and technological exchanges, and cooperation continues to expand. The international trade center with Urumqi as the center has initially taken shape. Progress has been made in the construction of the Sino-Kazakhstan Khorgos International Border Cooperation Center, Alashankou and Khorgos Port, further opening up markets in Central Asia, West Asia, Russia, Eastern Europe, etc., and forming a multi-level opening platform to the west, including Yanbian open counties and cities, ports, various development zones, etc. In the future, the construction of the Tianshan North Slope Economic Zone will place greater emphasis on the development model of urban-rural coordination and a good ecological environment.

5. Conclusions

(1) The land use type of the north slope of Tianshan Mountain was mainly grassland, followed by unused land, but the unused land showed a decreasing trend. Both the cultivated land area and the water area showed a trend of decreasing first and then increasing. On the other hand, the forest area increased first and then decreased. The proportion of construction land is the smallest, and the area continues to increase. The single dynamic change degree of construction land is the largest, and the change of construction land is the fastest in the past 30 years, and it is still increasing. From 1990 to 2000, the conversion between cultivated land and grassland was mainly two-way. From 2000 to 2010, the conversion of grassland to unused land will be dominated, and from 2010 to 2020, the conversion of cropland to grassland to unused land will be dominated. From 1990 to 2020, the total area of cropland, grassland, woodland, and unused land has changed. Among them, the change of grassland area is the largest, followed by unused land, and the conversion area of water and construction land is small. The impact of the urbanization process mainly lies in the reduction of fluctuations in grassland and unused land, as well as the non-linear increase of water and construction land. While promoting economic development, it also causes a certain degree of environmental damage.
(2) From the type level index, the NP values of the remaining areas, except the unused areas, increased significantly, indicating that the patch size gradually decreased and the degree of fragmentation was greater. The LPI values of cultivated land and grassland increased steadily, indicating that cultivated land and grassland were the dominant patch types in the landscape, and grassland was the dominant landscape matrix type on the north slope of the Tianshan Mountains. From the perspective of landscape grade index, the increase of LSI value indicates that the landscape structure on the north slope of Tianshan Mountain is complex. The fragmentation of landscape pattern is most obvious in Kuitun, Karamay and other central and western cities. The AI value continues to decrease, indicating that the landscape on the north slope of Tianshan Mountain is becoming more and more discrete. The CONTAG value showed a decreasing trend from 1990 to 2020, indicating that the fragmentation degree of the north slope of the Tianshan Mountains was higher. The region value increases in general, and the landscape patch composition on the north slope of Tianshan Mountain is increasingly fragmented and complicated. SHDI showed an increasing trend, indicating that the dominance of landscape types was declining, and the overall landscape pattern dominated by one or a few dominant patches was gradually changing. Although the SHEI value first increases and then decreases, it is more and more inclined to 1, indicating that The trend of a single city dominating the development of the central urban agglomeration indicates that the urbanization process is increasingly moving towards regional cooperation and mutual assistance in terms of policies.
(3) The relationship between land use type change and landscape pattern change on the north slope of the Tianshan Mountains was analyzed by using a grey relational degree model. It was found that grassland, cultivated land and unused land had significant effects on landscape pattern change. The effects of economy, population, ecology, and policy on land use and landscape pattern change are discussed. The trend of land use and landscape pattern changes is highly correlated with factors such as regional population, economy, policies, and environment. Strong human activities are the main factor causing these changes. The slowdown in economic growth caused by environmental degradation is mainly due to the increase in agricultural land, which sacrifices the environment. The development of the secondary and tertiary industries is greatly affected by agriculture, and economic growth in the future depends on a decrease in agricultural investment and an increase in industrial investment.

Author Contributions

Conceptualization, X.L. and G.Y.; data curation, D.Q. and X.L.; formal analysis, D.Q. and X.L.; funding acquisition, X.H.; investigation, X.L.; methodology, D.Q.; project administration, X.H.; resources, X.H., X.L. and G.Y.; software, D.Q. and Y.Y.; validation, D.Q.; writing—original draft, D.Q.; writing—review and editing, X.L., G.Y., C.W., P.L., B.L. and P.G. All authors have read and agreed to the published version of the manuscript.

Funding

The study received financial support from the XPCC Science and Technology Talent Project (approval number: 2024DB049), the Shihezi University innovative cultivation project (approval number: CXPY202322), the XPCC Science and Technology Research Program Project (Approval No.: 2023AB059), Xinjiang Third Comprehensive Scientific Expedition Project (Approval No.: 2021xjkk0804), the XPCC Science and Technology Plan Project (Approval No.: 2022BC001).

Data Availability Statement

The information provided in this research can be accessed by contacting the author who is responsible for this study.

Conflicts of Interest

The authors declare no conflicts of interest.

References

  1. Yang, L.; Zhang, J.; Gong, E.; Liu, M.; Ren, J.; Wang, Y. Analysis of spatio-temporal land-use patterns and the driving forces in Xi’an City using GEE and multi-source data. Trans. Chin. Soc. Agric. Eng. 2022, 38, 279–288. [Google Scholar]
  2. Liu, X.Z.; Li, X.S.; Jiang, D.M. Landscape pattern identification and ecological risk assessment using land-use change in the Yellow River Basin. Trans. Chin. Soc. Agric. Eng. 2021, 37, 265–274. [Google Scholar]
  3. Yueriguli, K.; Yang, S.; Zibibula, S. Impact of land use change on ecosystem service value in Ebinur Lake Basin, Xinjiang. Trans. Chin. Soc. Agric. Eng. 2019, 35, 260–269. [Google Scholar]
  4. Le, C.; Wei, W. Spatiotemporal Changes in Land Use and Habitat Quality in A Typical Dryland Watershed of Northwest China. Ecol. Environ. Sci. 2022, 31, 1909–1918. [Google Scholar]
  5. Guo, Z.; Chen, F.; Liu, X.; Dai, Z. A method to improve the spatial accuracy of population grided data based on land use. Bull. Surv. Mapp. 2021, 12, 66–70. [Google Scholar]
  6. Shen, Z.; Zeng, J. Analysis of spatiotemporal patterns and evolution of regional thermal islands in Fujian Delta urban agglomeration during decade of 1996–2017. J. Saf. Environ. 2020, 20, 1567–1578. [Google Scholar]
  7. Dong, M.; Yang, L.; Su, l.; Chang, L.; Gao, D.; Zhou, J. On the value of ecosystem service and sensitivity based on the land-use pattern change in Daqing. J. Saf. Environ. 2014, 14, 330–333. [Google Scholar]
  8. Kuang, W.; Zhang, S.; Du, G.; Yan, C.; Wu, S.; Li, R.; Lu, D.; Pan, T.; Ning, J.; Guo, C.; et al. Remotely sensed mapping and analysis of spatio-temporal patterns of land use change across China in 2015–2020. Acta Geogr. Sin. 2022, 77, 1056–1071. [Google Scholar]
  9. Chen, H.; Yang, Q.; Peng, L.; Su, K.; Zhang, H.; Liu, X. Spatiotemporal evolution characteristics and scenario simulation of production-living-ecological space at county level in Three Gorges reservoir areas. Trans. Chin. Soc. Agric. Eng. 2022, 38, 285–294. [Google Scholar]
  10. Chen, X.; Zhan, Q.; Fan, Y. Classification and Evaluation Methods for Optimization of Land Use Efficiency at Village Level. Land 2023, 12, 710. [Google Scholar] [CrossRef]
  11. Sun, Q.; Sun, J.; Baidurela, A.; Li, L.; Hu, X.Y.; Song, T.W. Ecological landscape pattern changes and security from 1990 to 2021 in Ebinur Lake Wetland Reserve, China. Ecol. Indic. 2022, 145, 109648. [Google Scholar] [CrossRef]
  12. Liu, Y.L.; Jiao, L.M.; Liu, Y.F. Analyzing the effects of scale and land use pattern metrics on land use database generalization indices. Int. J. Appl. Earth Obs. Geoinf. 2011, 13, 346–356. [Google Scholar] [CrossRef]
  13. Jia, J.; Bai, J.; Deng, W. On the landscape pattern evolution and its motivating factors in Kangding City in the past two decades. J. Saf. Environ. 2017, 17, 1571–1577. [Google Scholar]
  14. Ou, G.; Peng, M.; Wang, C.; Duan, H.; Li, X. Landscape pattern impacts of the Ludila hydropower station construction in the middle reach of Jinsha River. J. Saf. Environ. 2011, 11, 153–157. [Google Scholar]
  15. Li, C.; Zhang, X.; Wu, Y.; Hao, F.; Yin, G. Change of landscape pattern and its impact on water conservation in Beijing-Tianjin-Hebei ecological barrier region. China Environ. Sci. 2019, 39, 2588–2595. [Google Scholar]
  16. Yohannes, H.; Soromessa, T.; Argaw, M.; Dewan, A. Impact of landscape pattern changes on hydrological ecosystem services in the Beressa watershed of the Blue Nile Basin in Ethiopia. Sci. Total Environ. 2021, 793, 148559. [Google Scholar] [CrossRef] [PubMed]
  17. Li, Y.; Wen, H.; Wang, F.X. Analysis of the Evolution of Mangrove Landscape Patterns and Their Drivers in Hainan Island from 2000 to 2020. Sustainability 2023, 15, 759. [Google Scholar] [CrossRef]
  18. Xu, L.L.; Yu, H.; Zhong, L.S. Evolution of the landscape pattern in the Xin’an River Basin and its response to tourism activities. Sci. Total Environ. 2023, 880, 163472. [Google Scholar] [CrossRef] [PubMed]
  19. Li, X. Recently Spatial-Temporal Landuse Changes in Northern Slope Economic Zone of Tianshan Mountains. J. Arid Land Resour. Environ. 2004, 02, 115–119. [Google Scholar]
  20. Shabiti, M.; Yusufu, D. Analysis on the Characteristics of Landuse Space-Time Change in the Econom ic Belt on the Northem Slope of Tianshan Mountain Xinjiang China. Areal Res. Dev. 2008, 27, 103–108. [Google Scholar]
  21. Wu, J.; Li, B.; Chong, J.; Zhang, X.; Xia, Y. Change of Land Use and Ecosystem Services Value in Different Landscape Belts in the Northern Slope of Tianshan Mountains. Resour. Sci. 2008, 5, 621–627. [Google Scholar]
  22. Zhang, R.; Li, S.; Wei, B.; Zhou, X. Characterizing production–living–ecological space evolution and its driving factors: A case study of the chaohu lake basin in China from 2000 to 2020. ISPRS Int. J. Geo-Inf. 2022, 11, 447. [Google Scholar] [CrossRef]
  23. Zhang, L.; Zhai, Z.; Zhou, Y.; Liu, S.; Wang, L. The Landscape Pattern Evolution of Typical Open-Pit Coal Mines Based on Land Use in Inner Mongolia of China during 20 Years. Sustainability 2022, 14, 9590. [Google Scholar] [CrossRef]
  24. Tong, X.R.; Yang, Q.Y.; Bi, G.H. Spatio-temporal Characteristics of Land Use Changes in Chongqing during 2000–2015. Resour. Environ. Yangtze Basin 2018, 27, 2481–2495. [Google Scholar]
  25. Yan, Z.; Wang, Y.; Li, R.; Zhang, S.; Li, W.; Zhang, Y. Spatiotemporal and evolutional characteristics and driving forces of land use/land cover in Xilingol Steppe during 2000–2020. Trans. Chin. Soc. Agric. Eng. 2022, 38, 275–284. [Google Scholar]
  26. Wang, L.; Zhang, Z.; Li, G.; Ma, F.; Chen, L. Landscape pattern change in Beijing fringe area and its impact on the ecosystem services:a case study in Niulanshan-Mapo town. Acta Ecol. Sin. 2018, 38, 750–759. (In Chinese) [Google Scholar]
  27. Su, K.; Wang, Y.; Sun, X.; Yue, D. Landscape Pattern Change and Prediction of Northeast Forest Belt Based on GIS and RS. Trans. Agric. Mach. 2019, 50, 195–204. [Google Scholar]
  28. Xu, X.; Du, Z.; Zhang, H.; Feng, L.; Shen, X. Quantitative analysis on driving forces of land use/cover change in north Shanxi province during 1986~2010. China Environ. Sci. 2016, 36, 2154–2161. [Google Scholar]
  29. Zhang, X.; Zhou, J.; Li, M. Analysis on spatial and temporal changes of regional habitat quality based on the spatial pattern reconstruction of land use. Acta Geogr. Sin. 2020, 75, 160–178. [Google Scholar]
  30. Lou, P.Q.; Fu, B.L.; Lin, X.C.; Bi, L.; Ma, R.X.; Tang, T.Y. Influence of Land Use Change on Ecosystem Service Value Based on GEE in the Beijing-Tianjin-Hebei Region from 1998 to 2018. Environ. Sci. 2019, 40, 5473–5483. [Google Scholar]
  31. Niu, H.B.; Wang, J.M.; Jing, Z.R.; Liu, B. Identification and management of land use conflicts in mining cities: A case study of Shuozhou in China. Resour. Policy 2023, 81, 103301. [Google Scholar] [CrossRef]
  32. Mamat, A.; Wang, J.P.; Ma, Y.X. Impacts of Land-Use Change on Ecosystem Service Value of Mountain-Oasis-Desert Ecosystem: A Case Study of Kaidu-Kongque River Basin, Northwest China. Sustainability 2021, 13, 140. [Google Scholar] [CrossRef]
  33. Zhang, M.; Wang, J.M.; Zhang, Y.; Wang, J. Ecological response of land use change in a large opencast coal mine area of China. Resour. Policy 2023, 82, 103551. [Google Scholar] [CrossRef]
  34. Liu, Y.; Li, L.; Ju, C. Spatio-temporal Evolution of Land Use and Ecological Service Value in Urban Agglomeration on Northern Slope of Tianshan Mountains. Bull. Soil Water Conserv. 2020, 40, 312–320. [Google Scholar]
  35. Nijat, E.; Mansur, S.; Yusup, M.; Malika, A. Temporal and spatial variation of LUCC in Jinghe oasis on the northern slope of Tianshan Mountains. J. China Agric. Univ. 2019, 24, 158–169. [Google Scholar]
  36. Chen, N.; Xin, C.L.; Tang, D.B.; Zhang, L.; Xin, S.J. Multi-scenario Land Use Optimization and Carbon Storage Assessment in Northwest China. Environ. Sci. 2023, 44, 4655–4665. [Google Scholar]
  37. Qiao, X.; Liu, H.; Liu, Y.; Gong, P.; Li, P.; Li, L. Analysis of spatial and temporal evolution and drivers of cropland in the economic zone of the northern slope of Tianshan mountain. Environ. Res. Commun. 2023, 5, 105010. [Google Scholar] [CrossRef]
  38. Pan, T.; Zhang, C.; Kuang, W.; Luo, G.; Du, G.; DeMaeyer, P.; Yin, Z. A large-scale shift of cropland structure profoundly affects grain production in the cold region of China. J. Clean. Prod. 2021, 307, 127300. [Google Scholar] [CrossRef]
  39. Sun, Y.; Liu, B.; Yang, G.; Du, Y.; Huang, H.; Wang, T.; Wang, J. Analysis of Spatiotemporal Evolution Patterns and Driving Forces of Reservoirs on the Northern Slope of the Tianshan Mountains in Xinjiang. Sustainability 2023, 15, 8824. [Google Scholar] [CrossRef]
  40. Reheman, R.; Kasim, A.; Ablat, H.; Duolat, X.; Xu, J.H. Research on the temporal and spatial evolution of habitat quality in urban agglomeration on the northern slope of Tianshan Mountains based on InVEST model. J. Ecol. Rural. Environ. 2022, 38, 1112–1121. [Google Scholar]
Figure 1. Geographical location of Tianshan Mountain northern slope economic belt. Note: The high and low values in the map represent the highest and lowest values of the elevation. In the map, purple represents China, green represents Xinjiang, and yellow represents the north slope of the Tianshan Mountains.
Sustainability 16 07003 g001
Figure 2. Land use trends along the northern slope of the Tianshan mountain range from 1990 to 2020.
Sustainability 16 07003 g002
Figure 3. Tianshan Mountain’s northern slope land conversion transfer matrix.
Sustainability 16 07003 g003
Figure 4. Transformation of land utilization categories and change map of the northern slope of the Tianshan Mountains from 1990 to 2020. Note: (a) represents the land use type transfer from 1990 to 2000, (b) represents the land use type transfer from 2000 to 2010, (c) represents the land use type transfer from 2010 to 2020, and (d) represents the transformation of land utilization categories from 1990 to 2020.
Sustainability 16 07003 g004aSustainability 16 07003 g004b
Figure 5. Time variation characteristics of the CA, NP, and LPI of land use types located on the northern incline of the Tianshan mountain range.
Sustainability 16 07003 g005
Figure 6. Transformation of terrain characteristics on the northern incline of the Tianshan Mountains between 1990 and 2020.
Sustainability 16 07003 g006
Figure 7. Temporal changes in LSI and AI values of major urban centers situated on the northern incline of the Tianshan Mountains between 1990 and 2020.
Sustainability 16 07003 g007
Figure 8. Transformation of the Landscape Shape Index (LSI) in key urban centers on the northern side of the Tianshan Mountains between 1990 and 2020.
Sustainability 16 07003 g008
Figure 9. Evolution of the Aggregation Index (AI) in the major urban centers along the northern foothills of the Tianshan Mountains between 1990 and 2020.
Sustainability 16 07003 g009
Figure 10. Transformation of CONTAG and DIVISION in significant urban zones and industries located along the northern incline of the Tianshan mountain range from 1990 to 2020.
Sustainability 16 07003 g010
Figure 11. Transformation of CONTAG in key urban centers on the northern foothills of the Tianshan Mountains between 1990 and 2020.
Sustainability 16 07003 g011
Figure 12. Transformation of DIVISION in key urban centers on the northern foothills of the Tianshan Mountains between 1990 and 2020.
Sustainability 16 07003 g012
Figure 13. Evolution of the Spatial Heterogeneity Diversity Index (SHDI) and Spatial Heterogeneity Equity Index (SHEI) in prominent urban centers situated along the northern foothills of the Tianshan mountain range from 1990 to 2020.
Sustainability 16 07003 g013
Figure 14. Transformation in SHDI across key urban areas located on the northern side of the Tianshan Mountains during the period from 1990 to 2020.
Sustainability 16 07003 g014
Figure 15. Transformation in the spatial distribution of SHEI across key urban centers situated along the northern flank of the Tianshan Mountains spanning the period from 1990 to 2020.
Sustainability 16 07003 g015
Figure 16. Heat map of correlation between land use type and landscape pattern.
Sustainability 16 07003 g016
Table 1. Land use changed on the northern slope of the Tianshan Mountains from 1990 to 2020.
YearChangeFarmlandForestlandGrasslandWaterConstruction LandUnused Land
1990Area/km221,041.48047.797,580.45313.01439.692,441.0
Ratio/%9.323.5643.202.350.6440.93
2000Area/km220,997.98501.096,518.55813.91791.092,240.8
Ratio/%9.303.7642.732.570.7940.84
2010Area/km228,535.54782.510,3633.23276.42575.683,040.4
Ratio/%12.642.1245.891.451.1436.77
2020Area/km230,182.74548.710,4814.13453.83529.379,387.3
Ratio/%13.362.0146.401.531.5635.14
Table 2. The degree of dynamic change in each land use type varied individually from 1990 to 2020.
YearChangeFarm
Land
Forest
Land
GrasslandWaterConstruction LandUnused Land
1990–2000Variation/km2−43.50453.25−1061.86500.93351.43−200.26
Single dynamic attitude/%−0.020.56−1.090.942.44−0.02
2000–2010Variation/km27537.60−3718.507114.62−2542.47784.61−9200.32
Single dynamic attitude/%3.59−4.370.74−4.374.38−1.00
2010–2020Variation/km21647.27−253.761180.95177.40953.70−3653.13
Single dynamic attitude/%0.58−0.530.110.543.70−0.44
Disclaimer/Publisher’s Note: The statements, opinions and data contained in all publications are solely those of the individual author(s) and contributor(s) and not of MDPI and/or the editor(s). MDPI and/or the editor(s) disclaim responsibility for any injury to people or property resulting from any ideas, methods, instructions or products referred to in the content.

