Article

Traffic Safety Evaluation of Downstream Intersections on Urban Expressways Based on Analytical Hierarchy Process–Matter-Element Method

School of Transportation Science and Engineering, Jilin Jianzhu University, Changchun 130118, China
*
Author to whom correspondence should be addressed.
Sustainability 2024, 16(16), 6887; https://doi.org/10.3390/su16166887
Submission received: 7 July 2024 / Revised: 6 August 2024 / Accepted: 9 August 2024 / Published: 10 August 2024

Abstract

:
This study aimed to explore the traffic safety evaluation model for downstream intersections of urban expressway exits and make up for the shortcomings in safety research on downstream intersections of urban expressway exits. We constructed a comprehensive traffic safety evaluation index system, established a traffic safety evaluation model, and divided precise safety evaluation levels using the AHP–Matter-Element analysis method, establishing a traffic safety evaluation index system consisting of eleven indicators. The effectiveness of this method was validated through an assessment of traffic safety at the intersection of Dongsheng Street and Free Road in Changchun City. A theoretical basis for improving traffic safety at downstream intersections of urban expressways and a reference for subsequent related research were provided.

1. Introduction

As the mileage of urban expressways continues to increase and traffic volumes grow, the traffic flow from urban expressway exits significantly impacts the safety of downstream intersections. This situation often leads to numerous safety hazards during the integration process with the main roads, increasing pressure on downstream intersections and resulting in frequent traffic accidents. Strengthening traffic safety management at intersections downstream from urban expressway exits and improving their safety standards are crucial to reducing traffic accidents, ensuring the safety of people’s lives and property, and promoting safe travel.
The AHP–Matter-Element method and AHP-DEMATEL are distinct despite using the Analytic Hierarchy Process (AHP). The AHP–Matter-Element method integrates AHP with Matter-Element analysis, addressing uncertainties and multi-dimensional attributes. In contrast, AHP-DEMATEL combines AHP with the DEMATEL technique to explore interdependencies among factors. Considering the uncertainty and diversity of the indicators, the AHP–Matter-Element method is more suitable for this paper. Stefan Bilasco and Titus-Cristian Man proposed that the AHP framework can be applied to analyze the impact across five key dimensions: accident severity, occurrence mode, prevailing weather conditions, traffic restrictions, and road markings. This multi-level AHP analysis not only identifies high-risk hotspots but also confirms the effectiveness of the proposed spatial model [1]. Priyank Trivedi et al. used AHP to integrate 40 expert inputs to determine criterion weights [2]. Li Qingfu et al. proposed utilizing a cloud model to enhance the Analytic Hierarchy Process (AHP) risk assessment method, citing the unique characteristics of expert judgment language and the inherent ambiguity and randomness among various factors [3]. Hao Sheng et al. used the Analytic Hierarchy Process (AHP) to establish the index hierarchy structure of the evaluation system, and the weight of each index was determined by combining it with the expert consultation method [4]. Han Shixing et al. used the AHP–matter-element analysis method, and the service quality of college express collection points was evaluated, demonstrating its feasibility in this regard [5]. Deng et al. selected 35 indicators with a range of values for an urban water security evaluation index system and validated it. They validated it using a physical element model with Chongqing as an example [6]. Jiajun Chen et al. determined the objective weights of evaluation indexes and established an improved Matter-Element extension model [7]. Traffic microsimulation software such as VISSIM6.0 and the Surrogate Safety Assessment Model (SSAM) are commonly utilized in traffic conflict analysis [8,9,10]. Ghassan Suleiman et al. applied VISSIM to extract traffic operation parameters for their analysis [11]. M. del Valle et al. employed SSAM for automatic conflict counting, categorizing conflicts by collision angles (crossing, rear-end), lane changes, and time-to-collision (TTC) severity levels [12]. Hussein Mahdi Abed et al. evaluated safety at signalized intersections in urban areas of Hilla City using a combination of VISSIM and SSAM [13]. Q Liang et al. adjusted 31 driving behavior parameters, generated various vehicle trajectory files, and utilized SSAM to assess conflict scenarios [14]. A total of eleven evaluation criteria were selected for selecting evaluation indicators. Deng Mingjun et al. examined queue lengths towards a ramp and other directions. They utilized the particle swarm optimization algorithm to solve their model, applied it in a real-world scenario, and validated it using MATLAB2022 and VISSIM6.0 simulation platforms [15]. Ling Lu et al. identified that the length, width, and turning radius of RTLs, along with the installation of traffic roundabouts, exhibit more significant spatiotemporal heterogeneity compared to other factors in crash frequency modeling. Moreover, they found that RTL’s geometric factors’ spatial and temporal effects vary significantly [16]. By analyzing the extended characteristics of left-turning non-motorized vehicles at intersections, relationships between various influencing factors and the extent of expansion were obtained [17]. Yao Qi Yan et al. suggested that non-motorized vehicles can safely make left turns at intersections when the number of cars and their maximum extended width are within specified limits. Exceeding these limits significantly increases the risk of traffic conflicts [18]. The length of the merge section determines the number of permissible vehicles, making it a crucial safety consideration at intersections with heavy traffic volumes [19]. Guo Hongyu et al. proposed that lane changes are complex driving behaviors and frequently involve safety-critical situations [20]. The traffic volume at intersections directly affects the number of traffic conflicts at the entire intersection, making it an essential indicator of intersection safety [21]. Pedestrians affect intersection efficiency. Fornalchyk Yevhen et al. suggested that the pedestrian waiting time to cross the road fluctuates with traffic flow [22]. Rahmani Omid et al. suggested that simulation results indicated varying delay parameters influenced by the number of right-turn lanes and traffic volumes. Moreover, intersections featuring single and dual left-turn lanes showed significant differences in delay parameters, with simulation results estimating 77.4% and HCM estimating 59.7% [23]. Wang, Fu et al. calculated the minimum distance value for the connection section and obtained the recommended value based on the analysis of traffic flow characteristics [24].
This study builds on the latest traffic safety analysis and clustering algorithm research. Recently, K-means and hierarchical clustering methods have advanced significantly and have been widely used in data analysis. New algorithms, such as density-based and deep learning-enhanced clustering, have improved the handling of large, complex datasets. Recent traffic safety research has also introduced new evaluation metrics and data processing techniques, which support this study [24,25,26,27,28,29]. Zhao Yi et al. chose time to collision (TTC) and extended time to collision (ETTC) as metrics for evaluating traffic risk. They developed an approach to classify instantaneous traffic risk levels by combining Pareto’s law with the K-means clustering algorithm [30]. Chen Shuyi et al. used the K-means clustering algorithm to classify types of driving risk behaviors [31]. Feng Tianjun et al. used principal component analysis and the K-means clustering method; we obtained differences in driving styles and vehicle parameters (speed, acceleration, deceleration, etc.) [32]. Ran Xingcheng et al. reviewed hierarchical clustering methods, focusing on recent advancements. They addressed critical issues in divisive and agglomerative clustering, evaluated various similarity measures, and highlighted the strengths and weaknesses of different hierarchical clustering methods. The article also discussed practical applications and recent studies integrating deep learning with hierarchical clustering to enhance effectiveness [33]. Zheng, Yi et al. proposed an adaptive person re-identification (ReID) method that enhances pseudo-label accuracy through hierarchical clustering dynamics [34]. Briggs, Christopher et al. modified federated learning (FL) by adding a hierarchical clustering step (FL+HC), grouping clients based on the similarity of their local updates to the global model. This approach allows for independent and parallel training on specialized models [35].
The article applies the Analytic Hierarchy Process (AHP) from systems engineering and integrates with Meta-Analysis Theory to establish a multi-level, multi-index safety evaluation indicator system. It analyzes practical intersection factors that influence traffic safety at downstream intersections of urban expressway exits, providing an effective strategy to assess the safety level of these intersections more accurately and reasonably.

2. Determining Factor Weights Using the AHP

2.1. Analyzing Weight Determination Theory

First, we compare the relative importance of the second-level factors under the constraints of the first-level factors and construct a comparison matrix. The first level is the criterion layer (element C), and the second level consists of elements x 1 , x 2 , …, x n representing their importance to C. If the importance of the second-level elements can be quantitatively determined, their weights are directly established. If the importance is only qualitatively assessed, their weights are determined through pairwise comparisons using Satty’s 1–9 scale, as shown in Table 1.
To objectively reflect the relative importance of each evaluation factor, the consistency index (CI) formula, CI = ( λ m a x − n)/(n − 1), can be used to evaluate whether the matrix has consistency. λ m a x is the maximum eigenvalue of matrix A, and N is the dimension of the matrix. Then, the Consistency Ratio (CR) can be calculated using the formula CR = CI/RI.
RI is a Random Index that depends only on the order n of the matrix, and its value can be obtained from a lookup table.
When C < 0.1, the consistency of the matrix is considered acceptable; when CR ≥ 0.1, the judgment matrix needs appropriate adjustment.
The relationship between matrix order and RI, as shown in Table 2.
Once the inconsistency of matrix A reaches an acceptable level, you can compute its eigenvector corresponding to the maximum eigenvalue. Normalizing this eigenvector yields the weight vector, which indicates the proportion of each element within the whole. By comparing the weight vector components, you can rank the elements according to their importance, identifying those that have the greatest impact on the criteria layer.
This method constructs a comparison matrix between the criteria layer and the alternative layer. Subsequently, the final weight vector is computed.

2.2. Filter Weights

Assuming m experts evaluating n criteria, we obtain an m*n weight matrix:
W = W 11 W 12 W 1 n W 21 W 22 W 2 n W m 1 W m 2 W m n
W i j denotes the i-th expert assigning the weight value to the j-th evaluation criterion.
By calculating the similarity coefficients between the various weights, the consistency of the experts’ weight assignments to the evaluation criteria is evaluated, and these similarity coefficients form a similarity coefficient matrix. The similarity coefficient is R i j and the similarity matrix is R.
R i j = 1 1 n k = 1 n W i k W j k 2
R = ( R i j ) m m = R 11 R 12 R 1 m R 21 R 22 R 2 m R m 1 R m 2 R m m
R i j is the similarity of the weight assignments to evaluation criteria between the i-th and j-th experts and is directly proportional to the value of R i j , indicating their degree of similarity. n is the number of evaluation metrics, and M is all experts’ opinions on assigning weights to indicators.
Principles from cluster analysis are used to eliminate indicators with significant divergence in weight, thereby enhancing the accuracy of Equations (4) and (5).
P i = j = 1 m R i j
R o j = M o j , C n , V o j n = M o j C 1 V o j 1 0 C 2 V o j 2 0 C n V o j n = M o j C 1 a o j 1 , b o j 1 0 C 2 a o j 2 , b o j 2 0 C n a o j n , b o j n
P i represents the sum of each row in the similarity matrix, indicating the deviation level of the i-th expert’s weight assessment of evaluation criteria. A larger P i signifies a smaller deviation between the i-th expert’s assessment and the overall expert assessment results. P denotes the column vector composed of P i values. M o j is an entity with the j-th evaluation level. In intersection traffic safety evaluation, j = 1, 2, 3, 4, 5 represent safe, relatively safe, average, relatively dangerous, and dangerous, respectively. C 1 , C 2 , …, C n are the characteristics of the j-th evaluation level. V o j n is the range of values a o j n , b o j n corresponding to the characteristics C n of different evaluation levels j, denoted as M o j , concerning their values.

3. The Construction of a Meta-Evaluation Model

3.1. Establishing an Evaluation Indicator System

The traffic safety evaluation indicator system at downstream intersections of urban expressway exits consists of three interconnected subsystems: the urban expressway exit factors, the connecting section factors, and the intersection factors. The selection of evaluation indicators is crucial for establishing a comprehensive evaluation system, requiring a scientific and rational analysis of numerous factors affecting the safety of downstream intersections of urban expressway exits. The chosen evaluation indicators should be representative and applicable, in a moderate quantity, and cover various aspects as comprehensively as possible to ensure effective measurement of corresponding features. The intersection traffic safety evaluation indicator system established in this paper is shown in Table 3.

3.2. Determine the Elements to Be Evaluated

The fundamental elements of a physical entity include the aspects of “entity, characteristics, and quantities.” Describing these three elements as an ordered triplet determines the entity to be evaluated as R = (M, C, V). R can be represented as an n-dimensional entity when an entity contains multiple characteristics.
R = M , C n , V n = M C 1 V 1 0 C 2 V 2 0 C n V n
M is the traffic safety rating of downstream intersections at urban expressway exits. C 1 , C 2 , …, C n are the factors affecting the traffic safety of downstream intersections at urban expressway exits, including the characteristics of the facilities, dynamic conditions of the connecting sections, and variables of the intersections. V 1 , V 2 , …, V n and C 1 , C 2 , …, C n are translations of different quantified values corresponding to indicator factors.

3.3. Classical Domain-Element Matrix and Sector Domain-Element Matrix

Classical Domain-Element Matrix.
R o j = M o j , C n , V o j n = M o j C 1 V o j 1 0 C 2 V o j 2 0 C n V o j n = M o j C 1 a o j 1 , b o j 1 0 C 2 a o j 2 , b o j 2 0 C n a o j n , b o j n
The nodal element matrix is as follows:
R p = M p , C n , V p n = M p C 1 V p 1 0 C 2 V p 2 0 C n V p n = M p C 1 a p 1 , b p 1 0 C 2 a p 2 , b p 2 0 C n a p n , b p n
M p is an aggregate of entities with different safety levels. C 1 , C 2 , …, C n are different characteristics of M p . Specify the range of all possible values for C n as V p n , where a p n denotes the minimum value and b p n denotes the maximum value, represented as a p n = min( a o j n , b p n ) and b p n = max( b o j n ). V p n encompasses the range of values for C n across all levels.

3.4. Correlation Function and Membership Degree

The associated function K(v) represents the degree of membership of the evaluation unit in meeting a certain specific standard range. It is a mathematical expression.
K ( v ) = ρ V , V o j i V o j v V o j ρ V , V o j i ρ V , V p ρ V , V o j i v V o j
K(v) is the associated function. ρ V , V o j i is the distance between the measured value V and the interval V o j i = a o j n , b o j n . ρ V , V p is the distance between the measured value V and the interval V p = a p i , b p i in formula (9).
ρ V , V o j i = V a o j i , + b o j i 2 ( b o j i a o j i ) / 2 ρ V , V p = V a p i , + b p i 2 ( b p i a p i ) / 2 V o j = b o j i a o j i
The final determination of the comprehensive correlation of the target element uses various levels of evaluation L j ( M 1 ).
L j ( M 1 ) = j = 1 n K j ( V i )
K j ( V i ) is the correlation of the i-th indicator with the j-th level.
Introducing the Analytic Hierarchy Process (AHP) on top of the physical element model to obtain weight coefficients results in the comprehensive correlation under AHP-physical element analysis L j (M).
L j M = j = 1 n K j ( V i ) W ( i )
W ( i ) is the weight coefficient of factors influencing intersection traffic safety. K j ( V i ) is the degree of correlation of the i-th indicator concerning the j-th level. K j ( V i ) is the correlation of the i-th indicator with the j-th level.
K(v) reflects the degree to which something conforms to the standard grade. A more considerable value indicates a higher degree of conformity. If 0 ≤ L j (M) ≤ 1, according to the maximum membership principle, the safety grade with the maximum comprehensive relevance max L j (M) is selected as the evaluation result. If 1 < L j (M) or L j (M) < 0, it means that the safety grade of the thing is outside the defined range.

4. Traffic Safety Evaluation at Downstream Intersections of Urban Expressway Exits

4.1. Determining Indicator Weights

According to the principles of the Analytic Hierarchy Process (AHP), factors affecting the safety of downstream intersections of urban expressway exits are categorized into primary factors: urban expressway exit factors, connecting segment factors, and intersection factors denoted as V = V 1 , V 2 , V 3 , V 1 , V 2 , V 3 serve as secondary indicators. V i = V 1 , V 2 , V 11 represents all tertiary indicators. Experts from the transportation sector, university professors, professional drivers, and users of downstream intersections of urban expressway exits are invited to assess the impact indicators of intersection safety using a 1–9 scale. To ensure the reliability and validity of the data, the following steps have been implemented: First, cross-validation is used to assess model stability and generalizability. The data are randomly divided into k subsets (e.g., k = 10). For each round, k-1 subsets are used for training, and the remaining subset is used for validation. This procedure is repeated k times so that each subgroup is validated once. The results are then averaged to evaluate model performance. Second, feedback from real-world applications is gathered to refine and optimize the model, ensuring its effectiveness across different scenarios. Finally, historical data are compared with current data to verify consistency and continuity. Diverse data sources are used to prevent biases from a single data source. Integrating multiple data sources enhances the stability and reliability of the model outcomes. The weights of each indicator are calculated, and indicators with significantly deviant weights are excluded, resulting in the final evaluation indicator system weights, as shown in Table 4 and Table 5.

4.2. Element Analysis

Based on collected data, information, relevant studies, and expert opinions, combined with field inspections, the indicators are evaluated according to their safety levels in real-world conditions. Quantitative analysis of evaluation indicators such as freeway exit traffic volume V 1 , connector section right-turn ratio V 4 , connector section left-turn ratio V 7 , intersection motorized traffic volume V 10 , and pedestrian crossing traffic volume at intersections V 11 is conducted using VISSIM simulation and SSAM conflict analysis. A series of indicators, including actual survey data and vehicle composition, are obtained through video recording for VISSIM simulation, followed by SSAM conflict analysis using the output trajectory file try. The changes in traffic conflicts with freeway exit traffic volume, connector section right-turn ratio, connector section left-turn ratio, intersection motorized traffic volume, and pedestrian crossing traffic volume are then analyzed using SPSS26.0 software, as shown in Figure 1.
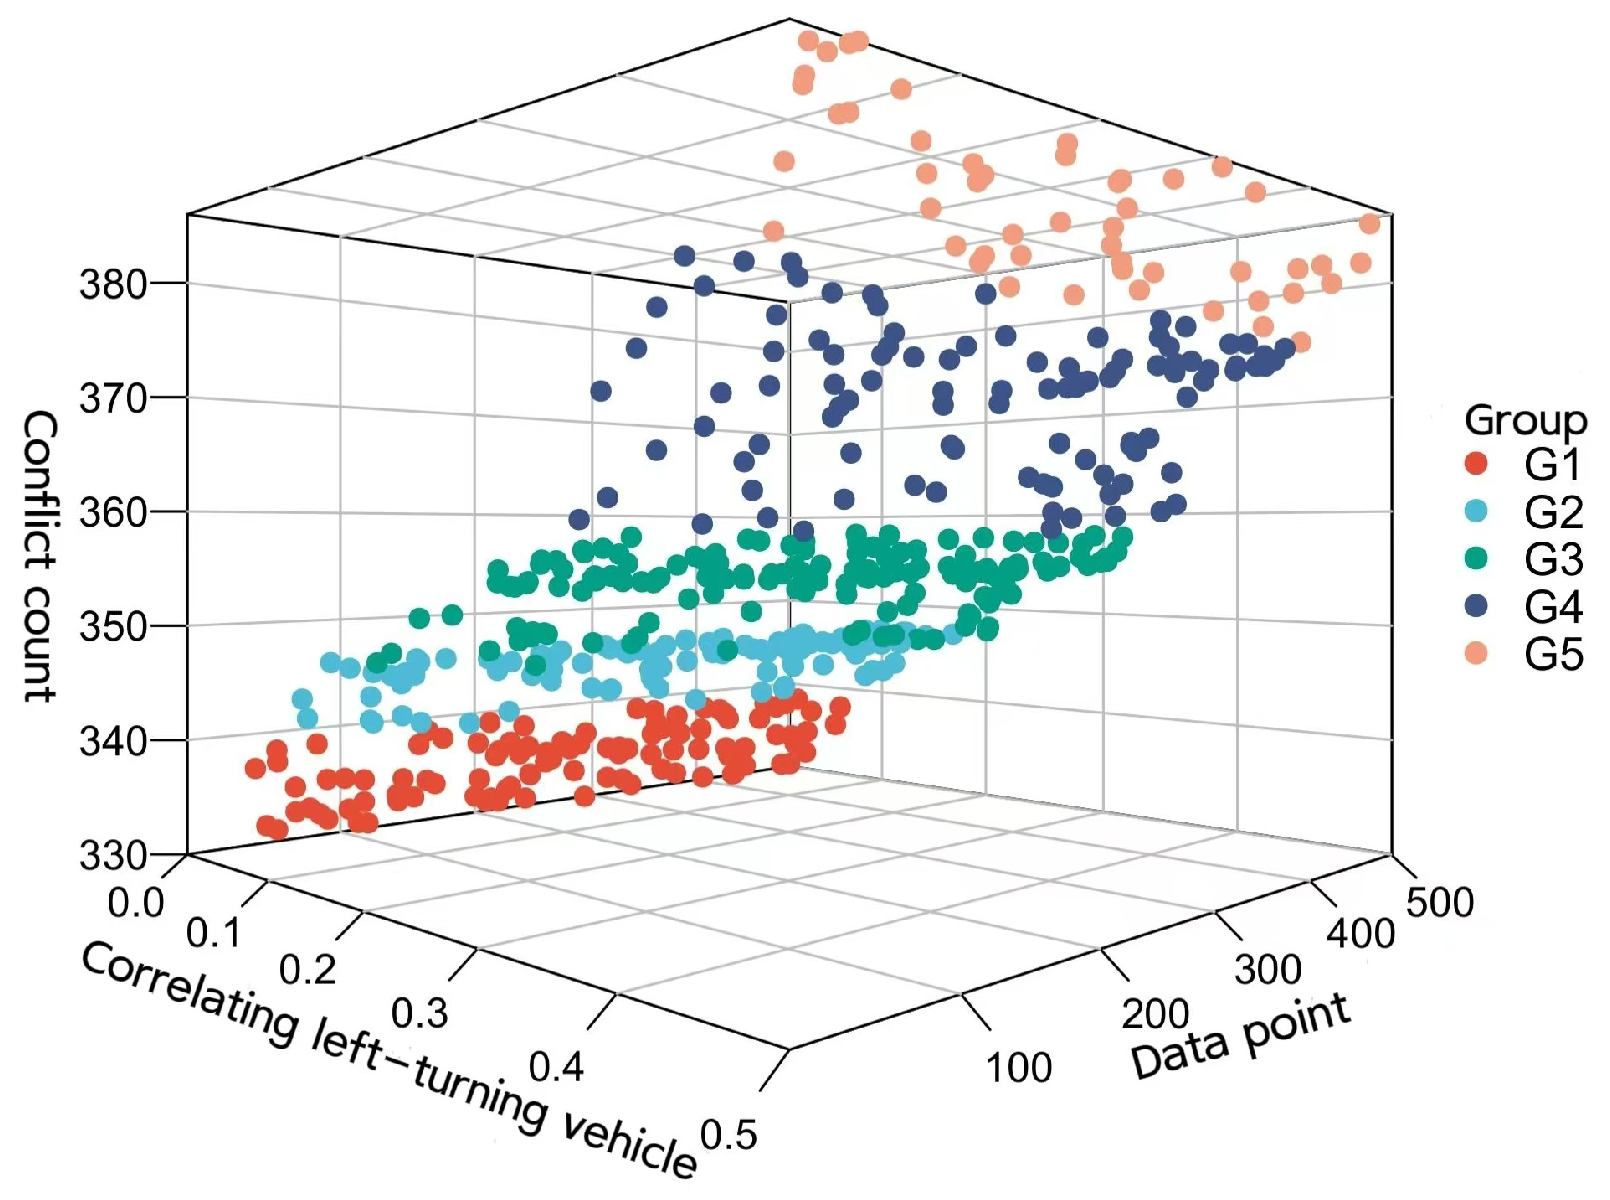
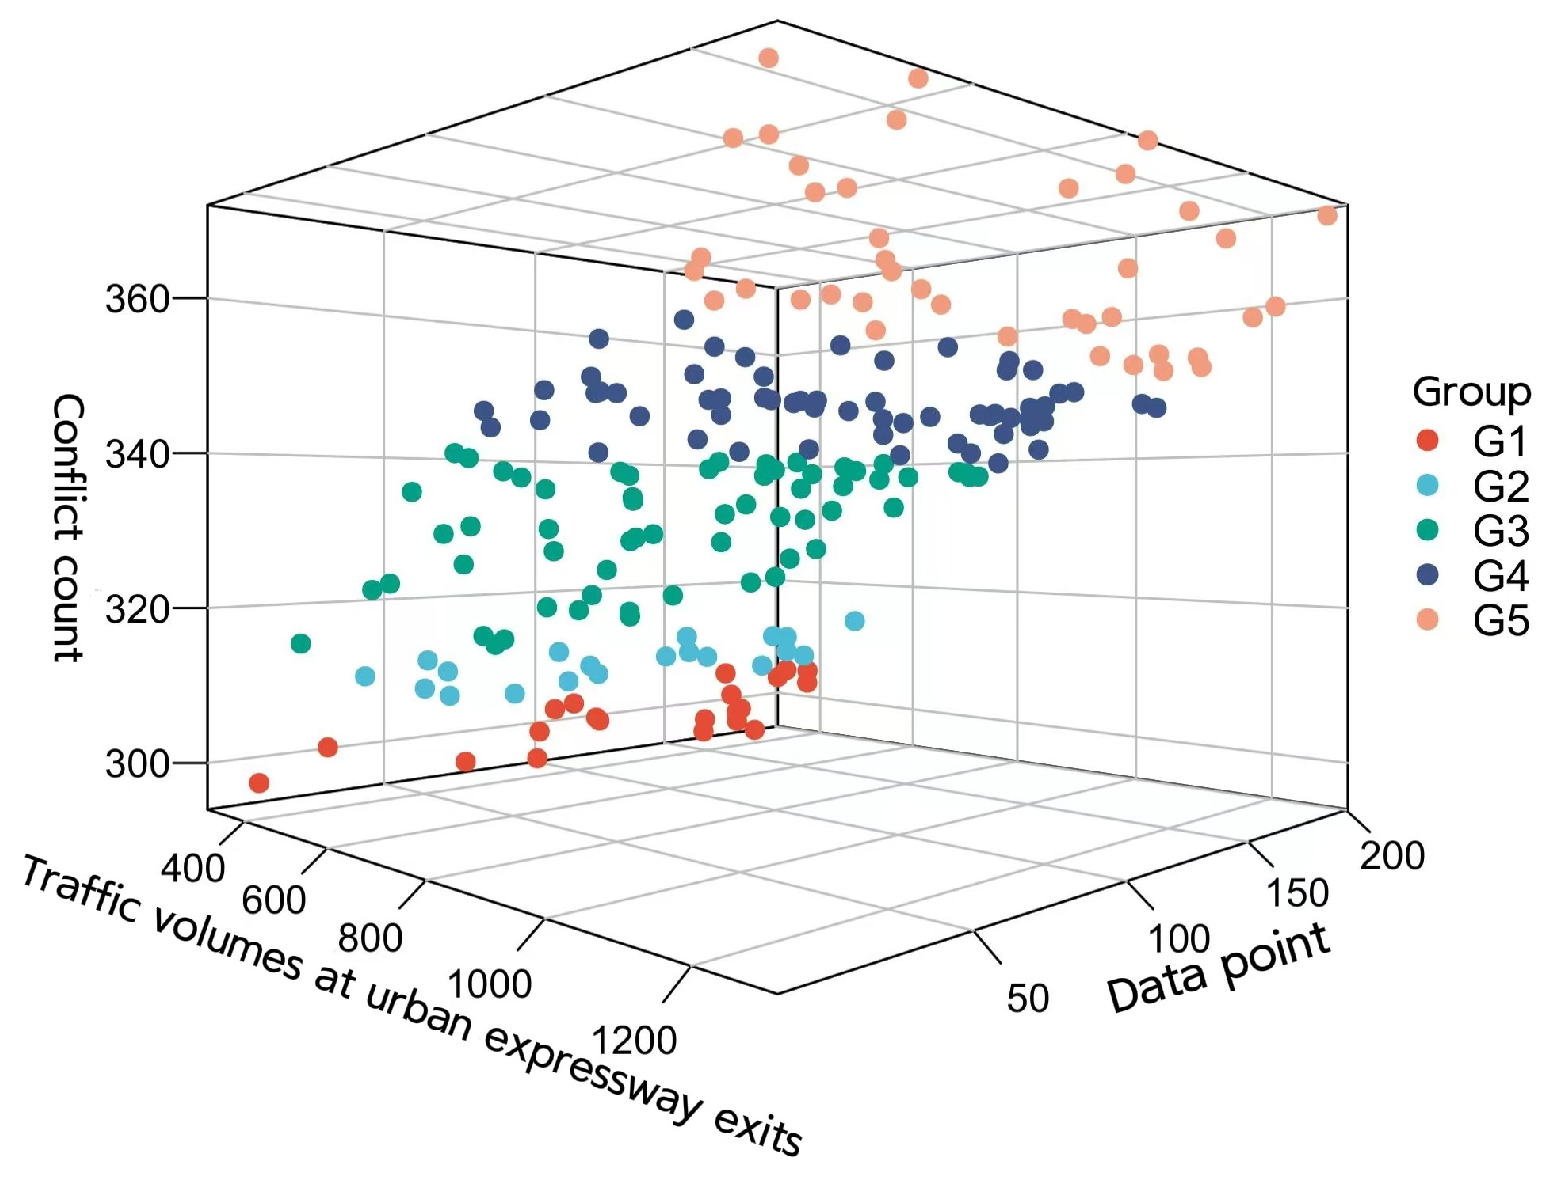
Considering the characteristics of the data in this study, we have chosen to combine hierarchical clustering and K-means clustering methods to improve the effectiveness of the clustering analysis. Safety levels of V 1 , V 4 , V 7 , V 10 , V 11 are classified using the hierarchical clustering method and the K-means clustering analysis method to obtain cluster centers and combine evaluation metrics with a diagram depicting the relationship with traffic conflict counts. The clustering results are shown in Figure 2, Figure 3, Figure 4, Figure 5 and Figure 6.
The qualitative analysis of non-quantifiable indicators such as the number of lanes at freeway exit ramps V 2 , the number of lanes in the merging section V 5 , the maximum number of lane changes V 6 , the number of exit lanes at downstream intersections V 8 , and the number of entry lanes at intersections V 9 is based on the safety levels in actual road conditions. Using a ten-point scale, these evaluation criteria are quantified through expert surveys to obtain their respective quantified values.
The indicator V 3 , which pertains to the length of the merging section between freeway exits and downstream intersections, is categorized into safety levels based on reasonable distances between urban freeway exit ramps and downstream intersections.

4.3. Safety Level Classification

After analysis, the downstream intersections of urban expressways are classified into five safety levels, dangerous, relatively dangerous, normal, relatively safe, and safe, based on various evaluation indicators V i , section domain V p , and classical domain V o j i , as shown in Table 6.

4.4. Intersection Traffic Safety Evaluation

This article selects the intersection of Dongsheng Street and Free Avenue in Changchun City as an example of an urban expressway exit downstream intersection for verification and analysis. Data collection occurred during three periods (9 October 2023 to 11 October 2023): weekday mornings from 7:00 a.m. to 8:00 a.m., noon from 12:00 p.m. to 1:00 p.m., and evenings from 5:00 p.m. to 6:00 p.m. The analysis utilizes the average values derived from data collected over these three periods. Quantitative data from video recording and field surveys were obtained, including measurable indicators such as urban expressway exit traffic volume V 1 , connecting segment length V 3 , proportion of right-turning vehicles in the connecting segment V 4 , proportion of left-turning vehicles in the connecting segment V 7 , non-vehicle traffic volume at the intersection V 10 , and pedestrian crossing traffic volume V 11 . Non-quantifiable indicators include number of lanes in the urban expressway exit ramp V 2 , number of lanes in the connecting segment V 5 , maximum number of lane changes V 6 , number of exit lanes at the intersection V 8 , and number of entry lanes at the intersection V 9 . These were quantified using a ten-point scale, and values were obtained through expert surveys. The quantitative values V i , sector V p , and classic domain V o j i of each evaluation indicator are shown in Table 7.
According to Formulas (9) and (10), the comprehensive correlation is calculated, and the results are shown in Table 8.
According to the principle of maximum membership degree, that is, selecting the evaluation factor corresponding to the highest evaluation result, the safety level of the intersection of Free Road and Dongsheng Street in Changchun City is assessed as relatively dangerous, based on MAX L j (M) = 0.1477. This assessment aligns with actual statistical data and objective facts.

5. Discussion and Conclusions

This study proposes a safety evaluation index system for downstream intersections of urban expressway exits and establishes a safety evaluation model using the AHP–Matter-Element method. The Dongsheng Street and Free Avenue intersection in Changchun City was selected for case validation and analysis, and additional tests were conducted in various contexts, covering different geographic locations, traffic conditions, and periods to ensure the model’s applicability in diverse environments. The results demonstrate that the model can accurately identify and classify traffic conflicts in the tested datasets, providing valuable insights for traffic management. The main conclusions are as follows:
The study demonstrates that the AHP–Matter-Element model is suitable for evaluating the safety of downstream intersections of urban expressway exits, showing its rationality and accuracy. The model categorizes safety into five levels, providing a precise theoretical foundation for future research.
Further analysis reveals that the traffic volume at urban expressway exits, the number of lanes in the connecting segments, the maximum number of lane changes, and the non-motorized traffic volume at intersections occupy significant proportions in the evaluation index system. These aspects should be prioritized when optimizing traffic safety at downstream intersections of urban expressway exits.
The AHP–Matter-Element method addresses issues related to fuzzy and hard-to-quantify evaluation criteria. The safety evaluation levels obtained through empirical analysis align with actual conditions, but the accuracy and completeness of survey data influence the precision of the evaluations. Additionally, due to the constraints of conditions and evaluation indicators, the system may not fully reflect all safety-influencing factors at downstream intersections of urban expressway exits, indicating the need for further in-depth research.
Furthermore, the findings of this study support the integration of safety and sustainability objectives in urban expressway planning and management. By considering both safety and sustainability, urban planners can develop more comprehensive and practical strategies that ensure the long-term well-being of urban populations.
While the results of this study indicate the effectiveness of the evaluation method, the qualitative nature of the results may limit their application in practical decision-making. To address this issue, we suggest further in-depth analysis in future research, including the following:
  • Broader Data Collection: Gathering more extensive field data and real-time traffic data to enhance the quantitative characteristics of the study results.
  • Quantitative Method Validation: Integrating other quantitative analysis methods (e.g., traffic simulation and conflict analysis) to validate the evaluation results and improve their reliability.
  • Field Verification and Improvement: Verifying the effectiveness of the evaluation model in real-world scenarios, incorporating practical experience and common sense to ensure the feasibility and effectiveness of the evaluation results.
Through these improvements, we hope to enhance the applicability of the proposed method in practical traffic safety assessments and provide more comprehensive and accurate theoretical support for related research.

Author Contributions

Conceptualization, funding acquisition, T.F. and C.H.; software, Y.L.; data curation, Y.L.; writing—original draft preparation, Y.L., T.F. and C.C.; investigation, Y.L.; writing—review and editing, Y.L., T.F. and K.L. All authors have read and agreed to the published version of the manuscript.

Funding

This research was supported by the Jilin province Science and Technology Research Planning Project (20220402030 GH).

Institutional Review Board Statement

Not applicable.

Informed Consent Statement

Not applicable.

Data Availability Statement

Data are available from the corresponding author upon request.

Conflicts of Interest

The authors declare no conflicts of interest.

References

  1. Bilașco, Ș.; Man, T.C. GIS-Based Spatial Analysis Model for Assessing Impact and Cumulative Risk in Road Traffic Accidents via Analytic Hierarchy Process (AHP)—Case Study: Romania. Appl. Sci. 2024, 14, 2643. [Google Scholar] [CrossRef]
  2. Trivedi, P.; Shah, J.; Moslem, S.; Pilla, F. An application of the hybrid AHP-PROMETHEE approach to evaluate the severity of the factors influencing road accidents. Heliyon 2023, 9, e21187. [Google Scholar] [CrossRef] [PubMed]
  3. Li, Q.; Wang, Z.; Lu, L.; Ma, Q. Construction risk evaluation of poor geological channels based on cloud model-improved AHP–matter–element theory. Sustainability 2021, 13, 9632. [Google Scholar] [CrossRef]
  4. Hao, S.; Qiao, Z.; Zhao, L.; He, X. AHP Matter Element Model for Expressway Service Quality Evaluation. In 2021 International Conference on Big Data Analytics for Cyber-Physical System in Smart City: Volume 2; Springer: Singapore, 2022. [Google Scholar]
  5. Han, S.; Liang, S.; Liu, C.; Hong, B.; Han, S. Research on service quality evaluation of college express collection point based on AHP matter element analysis. Manuf. Serv. Oper. Manag. 2023, 4, 15–21. [Google Scholar]
  6. Deng, H.; Yang, J.; Wang, P. Study on coupling coordination relationship between urban development intensity and water environment carrying capacity of Chengdu–Chongqing Economic Circle. Sustainability 2023, 15, 7111. [Google Scholar] [CrossRef]
  7. Chen, J.; Hu, B.; Shi, D.; Min, Z. Testability evaluation of radar equipment with improved matter-element extension method. J. Phys. Conf. Ser. 2024, 2724, 012049. [Google Scholar] [CrossRef]
  8. Chen, P.; Ni, H.; Wang, L.; Yu, G.; Sun, J. Safety performance evaluation of freeway merging areas under autonomous vehicles environment using a co-simulation platform. Accid. Anal. Prev. 2024, 199, 107530. [Google Scholar] [CrossRef] [PubMed]
  9. Sekar, N.K.; Malaghan, V.; Pawar, D.S. Micro-simulation insights into the safety and operational benefits of autonomous vehicles. J. Intell. Connect. Veh. 2023, 6, 202–210. [Google Scholar] [CrossRef]
  10. Coropulis, S.; Berloco, N.; Gentile, R.; Intini, P.; Ranieri, V. The use of microscopic simulators for safety assessment in automated and partially automated scenarios: A comparison. Transp. Res. Procedia 2023, 69, 313–320. [Google Scholar] [CrossRef]
  11. Suleiman, G.; Younes, M.K.; Ergun, M.; Abushammala, M.F.; Aljaradin, M. Highlighting Traffic Accidents on Roundabouts Using MRSS-AHP Expert System. Civ. Eng. J. 2024, 10, 1210–1220. [Google Scholar] [CrossRef]
  12. Del Valle, M.; La Rosa, X.; Silvera, M.; Campos, F.; Palacios-Alonso, D. Vehicular Conflict Assessment on a Road with Lane Reduction Using the SSAM Methodology. In Proceedings of the 21st LACCEI International Multi-Conference for Engineering, Education and Technology (LACCEI 2023), Buenos Aires, Argentina, 17–21 July 2023. [Google Scholar]
  13. Abed, H.M.; Ewadh, H.A. Coupling Visual Simulation Model (VISSIM) with Surrogate Safety Assessment Model (SSAM) to Evaluate Safety at Signalized Intersections. J. Phys. Conf. Ser. 2021, 1973, 012234. [Google Scholar] [CrossRef]
  14. Liang, Q.Y.; Wan, Q.; Bai, L.; Yu, H.; Lv, L.X.; Li, D.P. Sensitivity of Simulated Conflicts to VISSIM Driver Behavior Parameter Modification. In Green, Smart and Connected Transportation Systems: Proceedings of the 9th International Conference on Green Intelligent Transportation Systems and Safety; Springer: Singapore, 2020. [Google Scholar]
  15. Deng, M.; Chen, F.; Gong, Y.; Li, X.; Li, S. Optimization of Signal Timing for Urban Expressway Exit Ramp Connecting Intersection. Sensors 2023, 23, 6884. [Google Scholar] [CrossRef] [PubMed]
  16. Ling, L.; Zhang, W.; Bao, J.; Ukkusuri, S.V. Influencing factors for right turn lane crash frequency based on geographically and temporally weighted regression models. J. Saf. Res. 2023, 86, 191–208. [Google Scholar] [CrossRef] [PubMed]
  17. Feng, T.; Liu, J.; Liang, C.; Tian, X.; Chen, C.; Liu, K. Analysis of left-turn behaviors of non-motorized vehicles and vehicle-bicycle conflicts. PLoS ONE 2023, 18, e0291504. [Google Scholar] [CrossRef] [PubMed]
  18. Yao, Q.; Li, K.; Wu, M.; Yang, W.; Hong, B. A Study of Safe Left-Turn Intersection Conditions for Non-Motorized Vehicles in Lhasa Based on Expansion Widths. Front. Traffic Transp. Eng. 2024, 4, 18–25. [Google Scholar]
  19. Guzmán-Ortega, A.; Rodriguez-Gomez, V.; Snyder, G.F.; Chamberlain, K.; Hernquist, L. Morphological signatures of mergers in the TNG50 simulation and the Kilo-Degree Survey: The merger fraction from dwarfs to Milky Way-like galaxies. Mon. Not. R. Astron. Soc. 2022, 519, 4920–4937. [Google Scholar] [CrossRef]
  20. Guo, H.; Xie, K.; Keyvan-Ekbatani, M. Modeling driver’s evasive behavior during safety–critical lane changes: Two-dimensional time-to-collision and deep reinforcement learning. Accid. Anal. Prev. 2023, 186, 107063. [Google Scholar] [CrossRef] [PubMed]
  21. Fu, T.; Yu, Q.; Lao, H.; Liu, P.; Wan, S. Traffic Safety Oriented Multi-Intersection Flow Prediction Based on Transformer and CNN. Secur. Commun. Netw. 2023, 2023, 1363639. [Google Scholar] [CrossRef]
  22. Fornalchyk, Y.; Koda, E.; Kernytskyy, I.; Hrytsun, O.; Royko, Y.; Bura, R.; Osiński, P.; Barabash, R.; Humenuyk, R.; Polyansky, P. The impact of vehicle traffic volume on pedestrian behavior at unsignalized crosswalks. Roads Bridges-Drog. I Mosty 2023, 22, 201–219. [Google Scholar] [CrossRef]
  23. Rahmani, O.; Nasiri, A.S.A.; Aghayan, I. The Effect of the Number of Right-Turn and Left-Turn Lanes on the Performance of Undersaturated Signalized Intersections. J. Adv. Transp. 2023, 2023, 8764498. [Google Scholar] [CrossRef]
  24. Wang, F.; Gu, D.; Chen, A. Analysis of traffic operation characteristics and calculation model of the length of the connecting section between ramp and intersection. Sustainability 2022, 14, 629. [Google Scholar] [CrossRef]
  25. Arkes, J. Regression Analysis: A Practical Introduction; Routledge: London, UK, 2023. [Google Scholar]
  26. Levine, H.; Jørgensen, N.; Martino-Andrade, A.; Mendiola, J.; Weksler-Derri, D.; Jolles, M.; Pinotti, R.; Swan, S.H. Temporal trends in sperm count: A systematic review and meta-regression analysis of samples collected globally in the 20th and 21st centuries. Hum. Reprod. Updat. 2022, 29, 157–176. [Google Scholar] [CrossRef] [PubMed]
  27. Iatan, I.; Guan, M.; Humphries, K.H.; Yeoh, E.; Mancini, G.J. Atherosclerotic coronary plaque regression and risk of adverse cardiovascular events: A systematic review and updated meta-regression analysis. JAMA Cardiol. 2023, 8, 937–945. [Google Scholar] [CrossRef] [PubMed]
  28. Ikotun, A.M.; Ezugwu, A.E.; Abualigah, L.; Abuhaija, B.; Heming, J. K-means clustering algorithms: A comprehensive review, variants analysis, and advances in the era of big data. Inf. Sci. 2023, 622, 178–210. [Google Scholar] [CrossRef]
  29. Liu, H.; Chen, J.; Dy, J.; Fu, Y. Transforming complex problems into K-means solutions. IEEE Trans. Pattern Anal. Mach. Intell. 2023, 45, 9149–9168. [Google Scholar] [CrossRef]
  30. Zhao, Y.; Zhou, J.; Zhao, C.; Li, M. Traffic risk assessment of lane-changing process in urban inter-tunnel weaving segment. Transp. Res. Rec. J. Transp. Res. Board 2023, 2677, 95–106. [Google Scholar] [CrossRef]
  31. Chen, S.; Cheng, K.; Yang, J.; Zang, X.; Luo, Q.; Li, J. Driving behavior risk measurement and cluster analysis driven by vehicle trajectory data. Appl. Sci. 2023, 13, 5675. [Google Scholar] [CrossRef]
  32. Feng, T.; Liu, K.; Liang, C. An improved cellular automata traffic flow model considering driving styles. Sustainability 2023, 15, 952. [Google Scholar] [CrossRef]
  33. Ran, X.; Xi, Y.; Lu, Y.; Wang, X.; Lu, Z. Comprehensive survey on hierarchical clustering algorithms and the recent developments. Artif. Intell. Rev. 2022, 56, 8219–8264. [Google Scholar] [CrossRef]
  34. Zheng, Y.; Tang, S.; Teng, G.; Ge, Y.; Liu, K.; Qin, J.; Qi, D.; Chen, D. Online pseudo label generation by hierarchical cluster dynamics for adaptive person re-identification. In Proceedings of the IEEE/CVF International Conference on Computer Vision, Montreal, BC, Canada, 11–17 October 2021. [Google Scholar]
  35. Briggs, C.; Fan, Z.; Andras, P. Federated learning with hierarchical clustering of local updates to improve training on non-IID data. In Proceedings of the 2020 international joint conference on neural networks (IJCNN), Glasgow, UK, 19–24 July 2020. [Google Scholar]
Figure 1. The relationship between evaluation metrics and traffic conflict count contribution. (Figure (a) is the relationship between urban expressway exits traffic volums and traffic conflict count. Figure (b) is the relationship between right-turn vehicle and traffic conflict count. Figure (c) is the relationship between left-turn vehicle and traffic conflict count. Figure (d) is the relationship between intersections traffic volums and traffic conflict count. Figure (e) is the relationship between Pedestrian crossing traffic volume and traffic conflict count).
Sustainability 16 06887 g001
Figure 2. Clustering method of traffic conflict occurrences and traffic volumes at urban expressway exits.
Sustainability 16 06887 g002
Figure 3. Clustering method correlating right-turning vehicle proportions and traffic conflict counts.
Sustainability 16 06887 g003
Figure 4. Clustering method of correlating left-turning vehicle proportions and traffic conflict counts.
Sustainability 16 06887 g004
Figure 5. Clustering method of traffic volume at intersections and traffic conflict counts.
Sustainability 16 06887 g005
Figure 6. Clustering method of pedestrian crossing traffic volume and traffic conflict counts.
Sustainability 16 06887 g006
Table 1. Significance of scale.
ScaleMeaning
1Two factors have similar importance compared to each other
3Compared to two factors, the former is slightly more important than the latter
5Compared to the other two factors, the former is slightly more important than the latter
7Compared to two factors, the former is more important than the latter
9Compared to the latter, the former is far more important
2, 4, 6, 8The intermediate value of the above adjacent judgments
ReciprocalIf the importance ratio of factor i to factor j is a i j , then the importance ratio of factor j to factor i is its reciprocal 1/ a i j
Table 2. Relationship between matrix order and RI.
Matrix Order123456789
RI000.520.891.121.261.361.411.46
(Source: own compilation based on [1]).
Table 3. Intersection traffic safety evaluation index system.
Freeway Exit FactorsUrban Expressway Exit Traffic Volume, Number of Lanes on Urban Expressway Exit Ramp
Connecting segment factorsProportion of right-turn vehicles on the connecting segment, length of the connecting segment between urban expressway exit and downstream intersection, number of lanes on the connecting segment, maximum number of lane changes, proportion of left-turn vehicles on the connecting segment
Downstream intersection factorsNumber of entry lanes at the intersection, number of exit lanes at the intersection, non-motorized traffic volume at the intersection, pedestrian crossing traffic volume
Table 4. Calculation results of weights for primary indicators in intersection safety evaluation.
Primary IndicatorsWeight
Urban expressway exit factors0.2
Linking segment factors0.5
Intersection factors0.3
Table 5. The calculation results of the weights for the second-level indicators in intersection safety assessment.
Secondary IndicatorsWeightOverall Weight
Urban expressway exit traffic volume V 1 0.650.13
Number of lanes on urban expressway exit ramp V 2 0.150.03
Length of the connecting segment between urban expressway exit and downstream intersection V 3 0.160.08
Number of lanes on the connecting segment V 4 0.080.04
Number of lanes on the connecting segment V 5 0.420.21
Maximum number of lane changes V 6 0.220.11
The proportion of left-turn vehicles on the connecting segment V 7 0.140.07
Number of entry lanes at the intersection V 8 0.230.07
Number of exit lanes at the intersection V 9 0.270.08
Non-motorized traffic volume at the intersection V 10 0.470.14
Pedestrian crossing traffic volume V 11 0.130.04
Table 6. Quantified values range of traffic safety evaluation indicators for downstream intersections of urban expressway exits.
IndexSector V p Classic Domain V o j i
DangerLess DangerCommonlyLess SecureSecure
V 1 (pcu/h) ( 0 , 1400 ] ( 1100 , 1400 ] ( 800 , 1100 ] ( 500 , 800 ] ( 400 , 500 ] ( 0 , 400 ]
V 2 ( 0 , 10 ] ( 0 , 2 ] ( 2 , 4 ] ( 4 , 6 ] ( 6 , 8 ] ( 8 , 10 ]
V 3 (m) ( 0 , 280 ] ( 0 , 56 ] ( 56 , 112 ] ( 112 , 168 ] ( 168 , 224 ] ( 224 , 280 ]
V 4 ( 0 , 0.6 ] ( 0.45 , 0.6 ] ( 0.35 , 0.45 ] ( 0.2 , 0.35 ] ( 0.1 , 0.2 ] ( 0 , 0.1 ]
V 5 ( 0 , 10 ] ( 0 , 2 ] ( 2 , 4 ] ( 4 , 6 ] ( 6 , 8 ] ( 8 , 10 ]
V 6 ( 0 , 10 ] ( 0 , 2 ] ( 2 , 4 ] ( 4 , 6 ] ( 6 , 8 ] ( 8 , 10 ]
V 7 ( 0 , 0.6 ] ( 0.45 , 0.6 ] ( 0.35 , 0.45 ] ( 0.25 , 0.35 ] ( 0.15 , 0.25 ] ( 0 , 0.15 ]
V 8 ( 0 , 10 ] ( 0 , 2 ] ( 2 , 4 ] ( 4 , 6 ] ( 6 , 8 ] ( 8 , 10 ]
V 9 ( 0 , 10 ] ( 0 , 2 ] ( 2 , 4 ] ( 4 , 6 ] ( 6 , 8 ] ( 8 , 10 ]
V 10 (pcu/h) ( 0 , 11,000 ] ( 9000 , 11,000 ] ( 7000 , 9000 ] ( 5000 , 7000 ] ( 3000 , 5000 ] ( 0 , 3000 ]
V 11 (pcu/h) ( 0 , 3000 ] ( 2400 , 3000 ] ( 1800 , 2400 ] ( 1200 , 1800 ] ( 600 , 1200 ] ( 0 , 600 ]
Table 7. Quantified values of traffic safety evaluation indicators for downstream intersections of urban expressway exits.
IndexMeasurement VSector V p Classic Domain V o j i
DangerLess DangerCommonlyLess SecureSecure
V 1 (pcu/h)1052 ( 0 , 1400 ] ( 1100 , 1400 ] ( 800 , 1100 ] ( 500 , 800 ] ( 400 , 500 ] ( 0 , 400 ]
V 2 9 ( 0 , 10 ] ( 0 , 2 ] ( 2 , 4 ] ( 4 , 6 ] ( 6 , 8 ] ( 8 , 10 ]
V 3 (m)140 ( 0 , 280 ] ( 0 , 56 ] ( 56 , 112 ] ( 112 , 168 ] ( 168 , 224 ] ( 224 , 280 ]
V 4 0.2 ( 0 , 0.6 ] ( 0.45 , 0.6 ] ( 0.35 , 0.45 ] ( 0.2 , 0.35 ] ( 0.1 , 0.2 ] ( 0 , 0.1 ]
V 5 9 ( 0 , 10 ] ( 0 , 2 ] ( 2 , 4 ] ( 4 , 6 ] ( 6 , 8 ] ( 8 , 10 ]
V 6 7 ( 0 , 10 ] ( 0 , 2 ] ( 2 , 4 ] ( 4 , 6 ] ( 6 , 8 ] ( 8 , 10 ]
V 7 0.3 ( 0 , 0.6 ] ( 0.45 , 0.6 ] ( 0.35 , 0.45 ] ( 0.25 , 0.35 ] ( 0.15 , 0.25 ] ( 0 , 0.15 ]
V 8 9 ( 0 , 10 ] ( 0 , 2 ] ( 2 , 4 ] ( 4 , 6 ] ( 6 , 8 ] ( 8 , 10 ]
V 9 9 ( 0 , 10 ] ( 0 , 2 ] ( 2 , 4 ] ( 4 , 6 ] ( 6 , 8 ] ( 8 , 10 ]
V 10 (pcu/h)7588 ( 0 , 11,000 ] ( 9000 , 11,000 ] ( 7000 , 9000 ] ( 5000 , 7000 ] ( 3000 , 5000 ] ( 0 , 3000 ]
V 11 (pcu/h)1692 ( 0 , 3000 ] ( 2400 , 3000 ] ( 1800 , 2400 ] ( 1200 , 1800 ] ( 600 , 1200 ] ( 0 , 600 ]
Table 8. Intersection safety evaluation correlation calculation results.
IndexClassic Domain V o j i
DangerLess DangerCommonlyLess SecureSecure
V 1 (pcu/h)−0.01580.1508−0.0546−0.0797−0.0848
V 2 −0.0263−0.0250−0.0225−0.01500.0150
V 3 (m)−0.0300−0.01330.0200−0.01330.2000
V 4 −0.0222−0.01710.00000.0800−0.0133
V 5 −0.1838−0.1750−0.1575−0.10500.1050
V 6 −0.02750.0550−0.0275−0.1650−0.0688
V 7 −0.0233−0.01000.2100−0.0100−0.0233
V 8 −0.0613−0.0583−0.0525−0.03500.0350
V 9 −0.0700−0.0667−0.0600−0.04000.0400
V 10 (pcu/h)−0.02040.3377−0.0274−0.0650−0.0786
V 11 (pcu/h)−0.0140−0.00310.0306−0.0109−0.0182
Comprehensive correlation degree−0.02980.1477−0.0240−0.0907−0.1030
Disclaimer/Publisher’s Note: The statements, opinions and data contained in all publications are solely those of the individual author(s) and contributor(s) and not of MDPI and/or the editor(s). MDPI and/or the editor(s) disclaim responsibility for any injury to people or property resulting from any ideas, methods, instructions or products referred to in the content.