

A Novel Accident Duration Prediction Method Based on a Conditional Table Generative Adversarial Network and Transformer


Abstract
1. Introduction
2. Related Work
3. Methodology
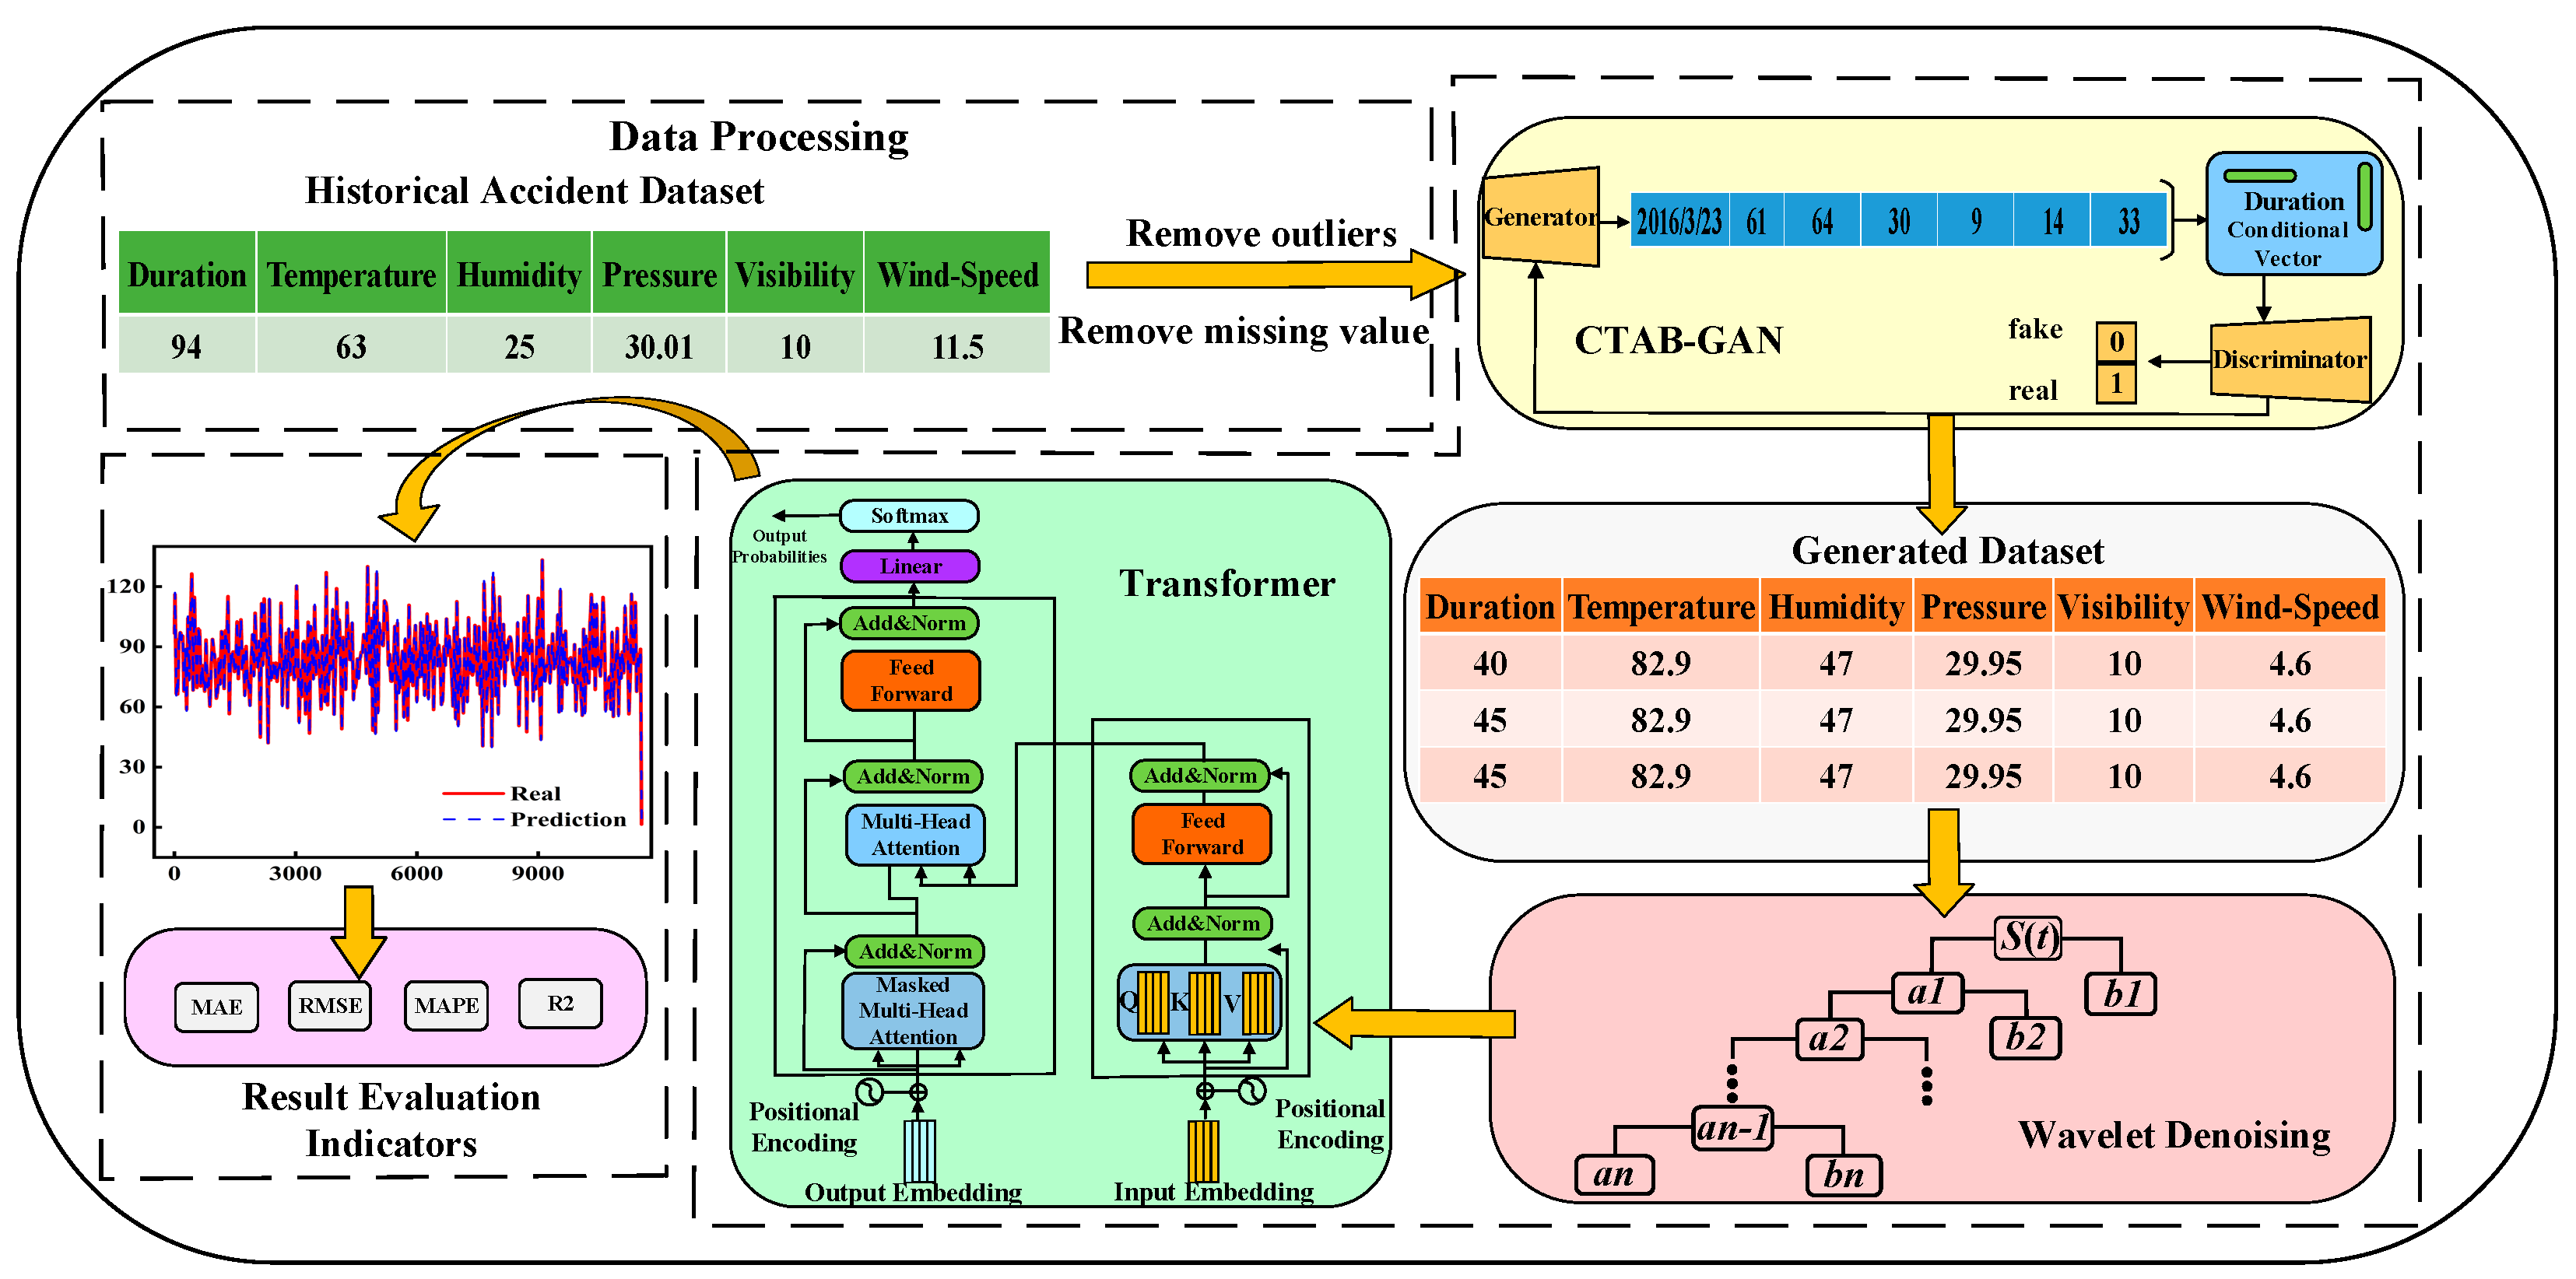
3.1. The Framework
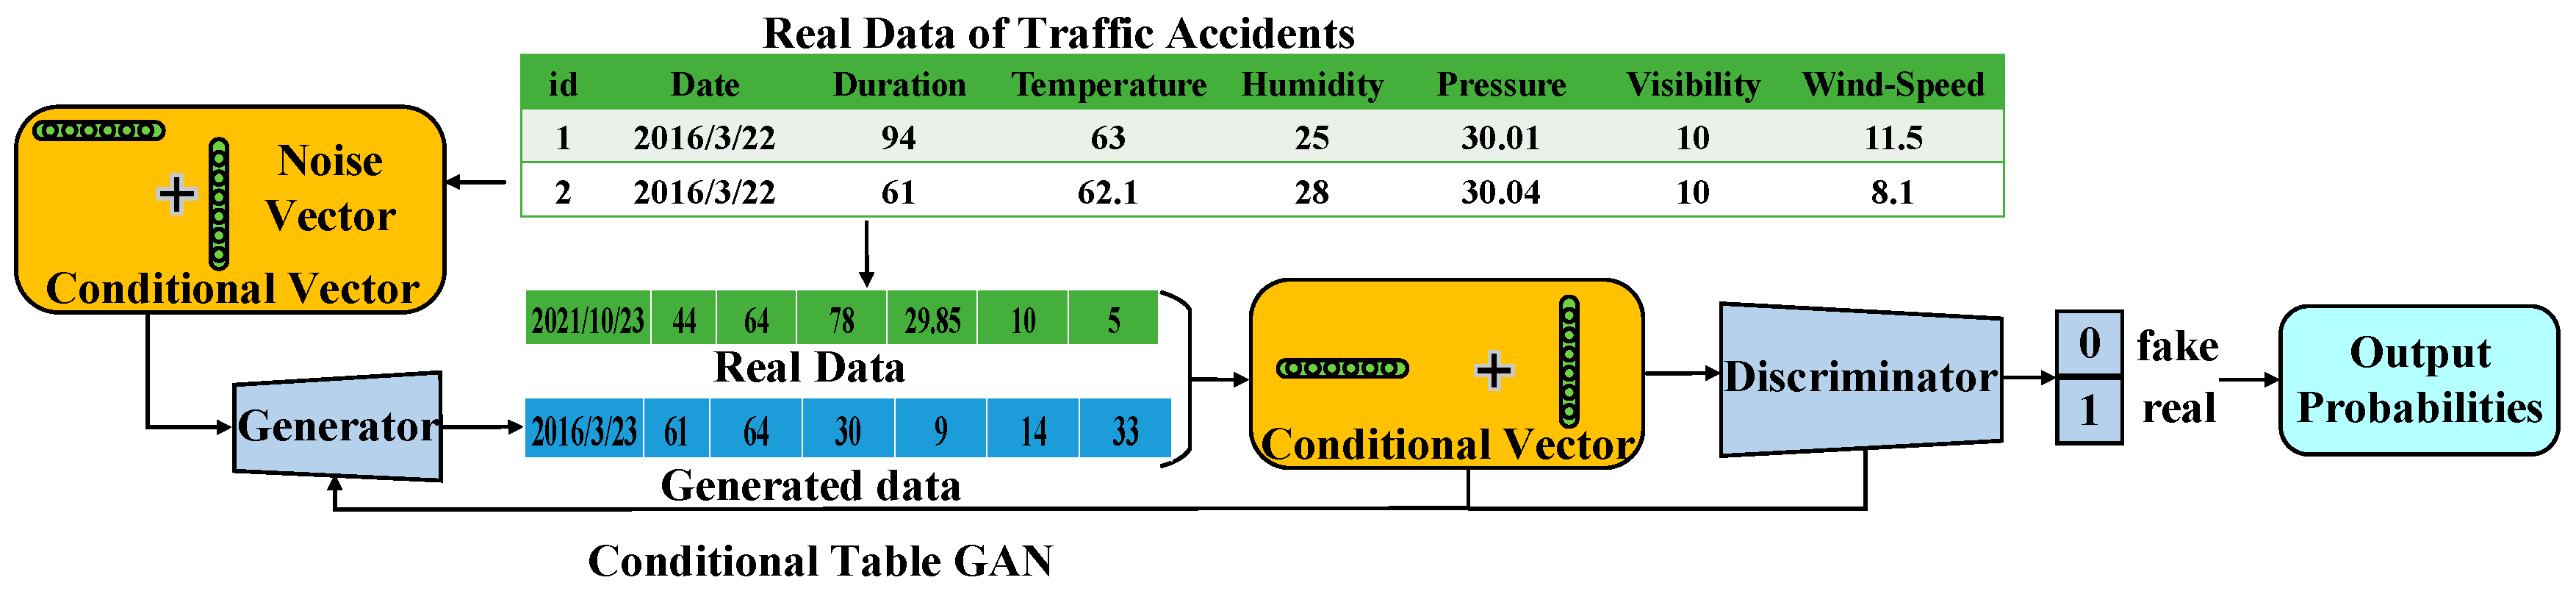
3.2. Conditional Table Generative Adversarial Network (CTGAN)
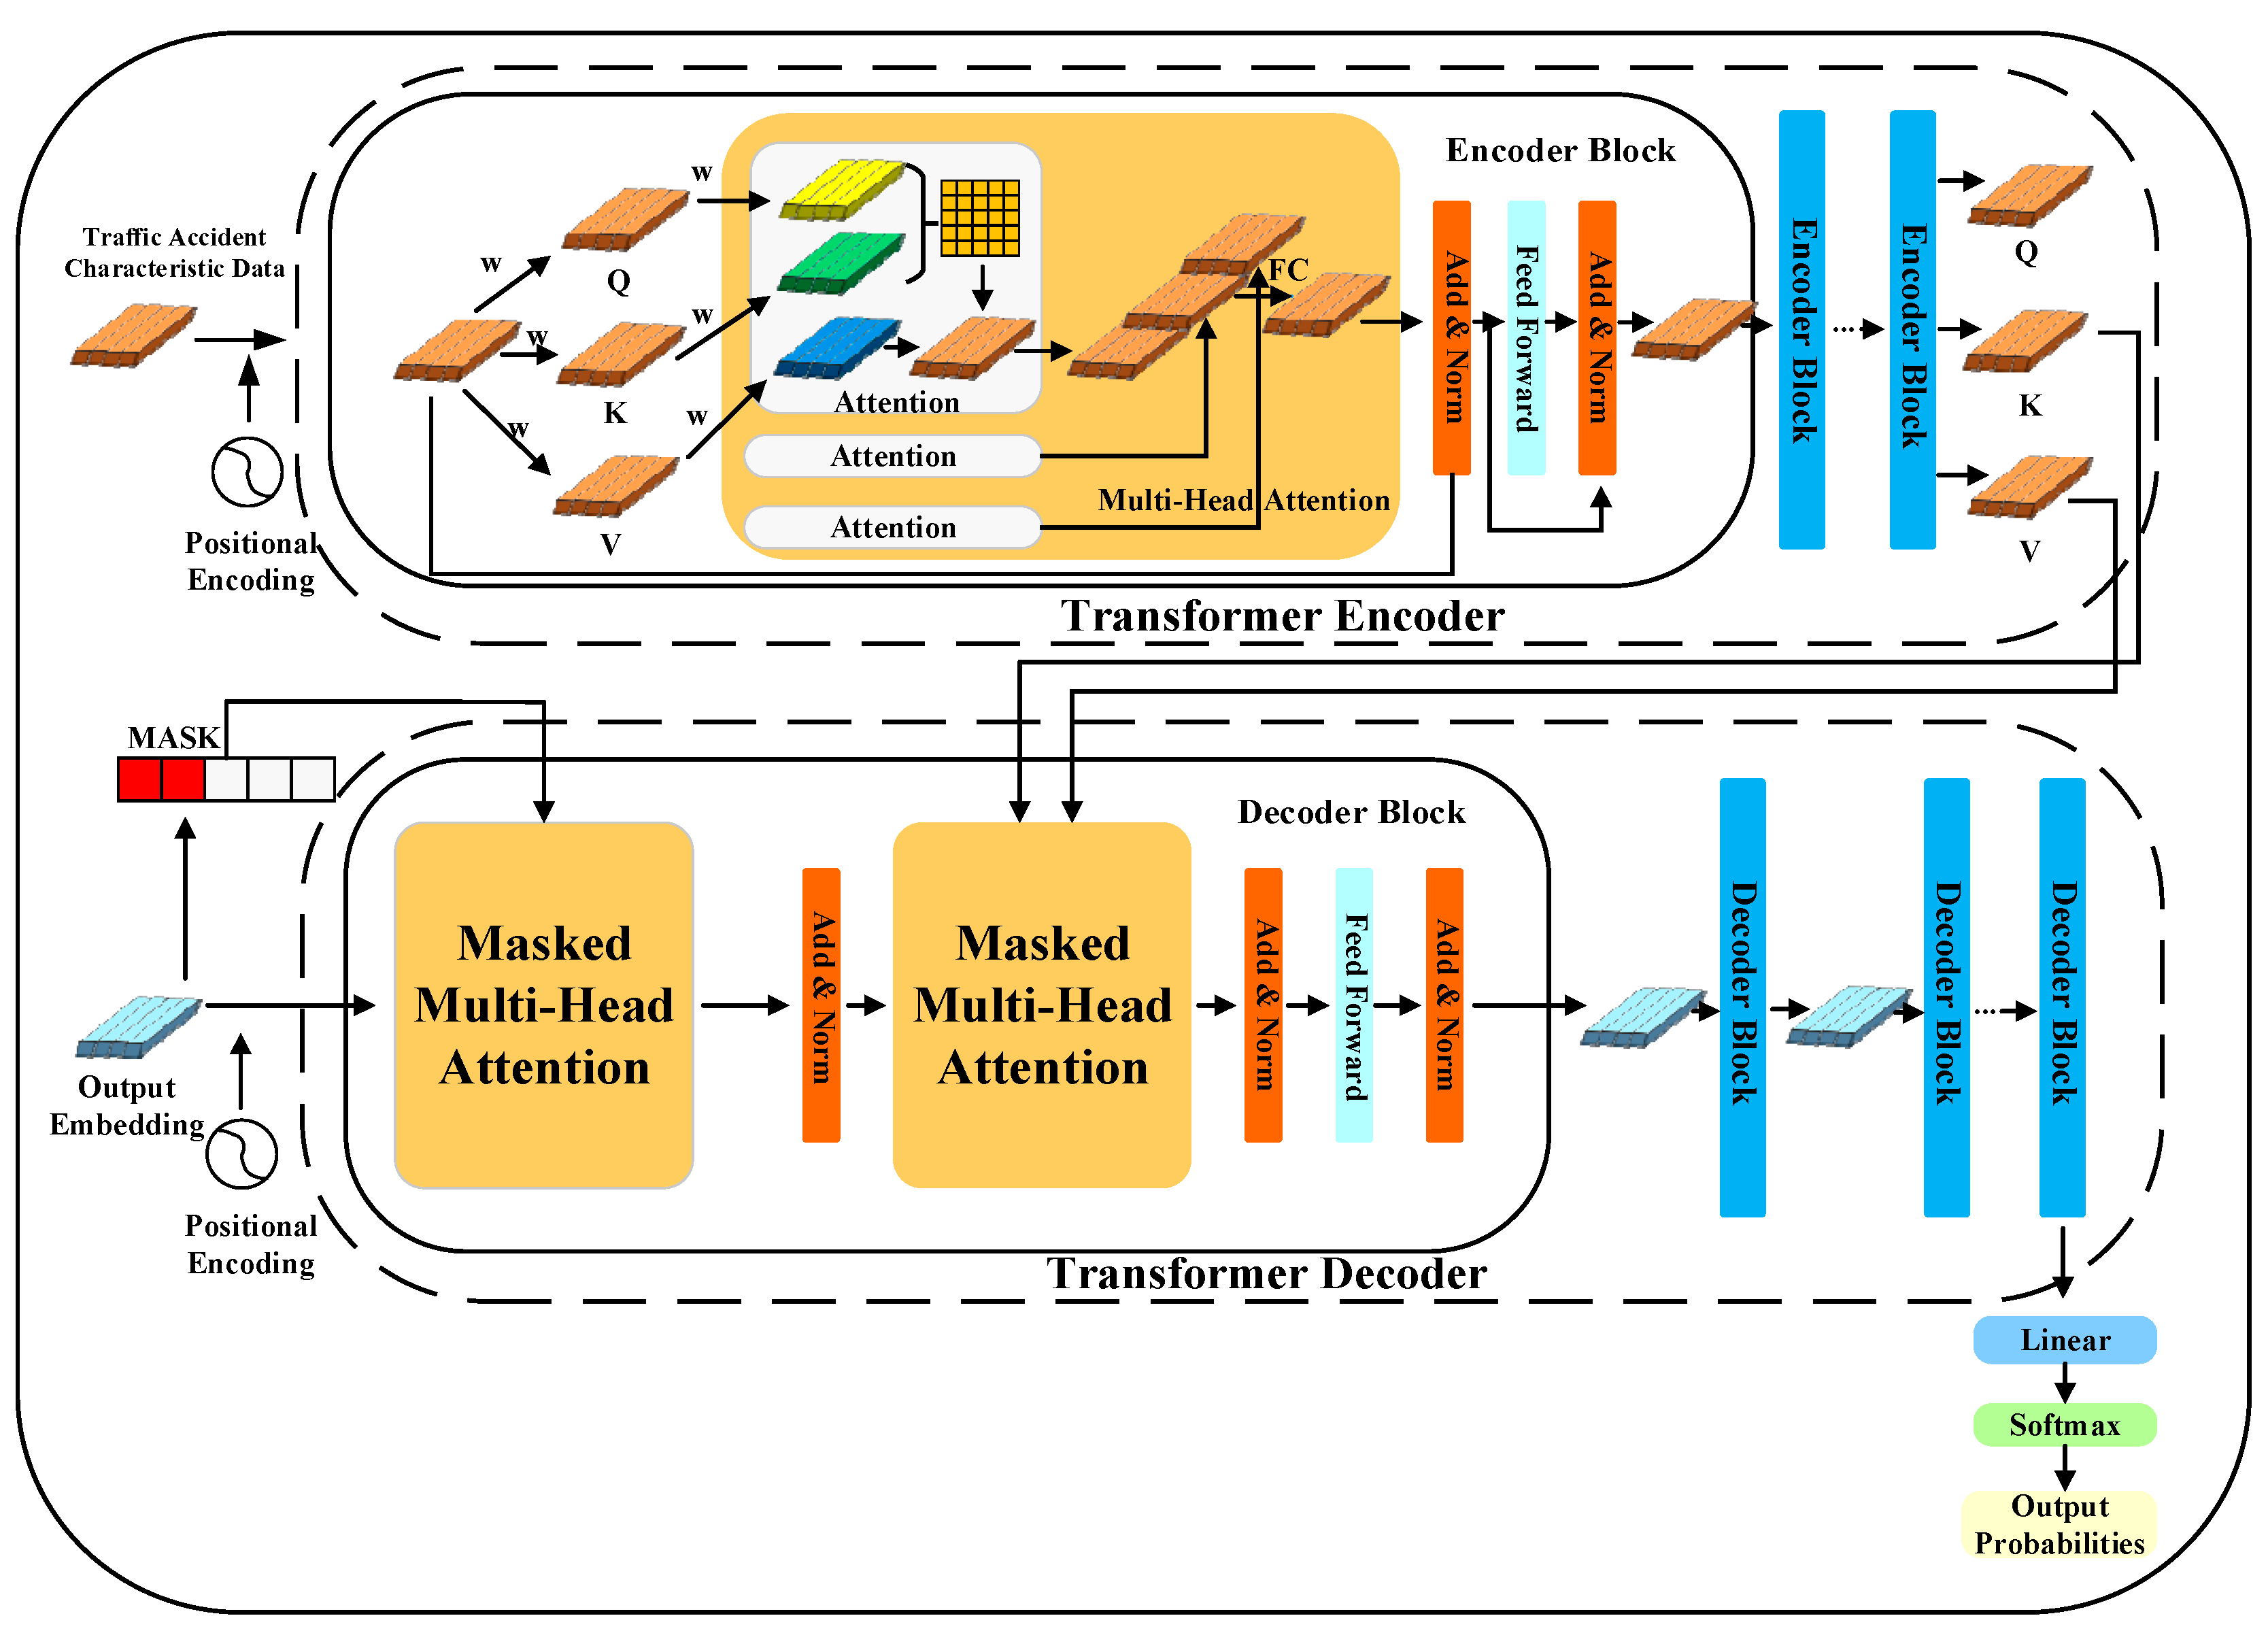
3.3. Transformer Model
3.4. Evaluation Indicators
4. Case Studies
4.1. Data Description
4.2. Data Selection and Processing
4.3. Experiments Process
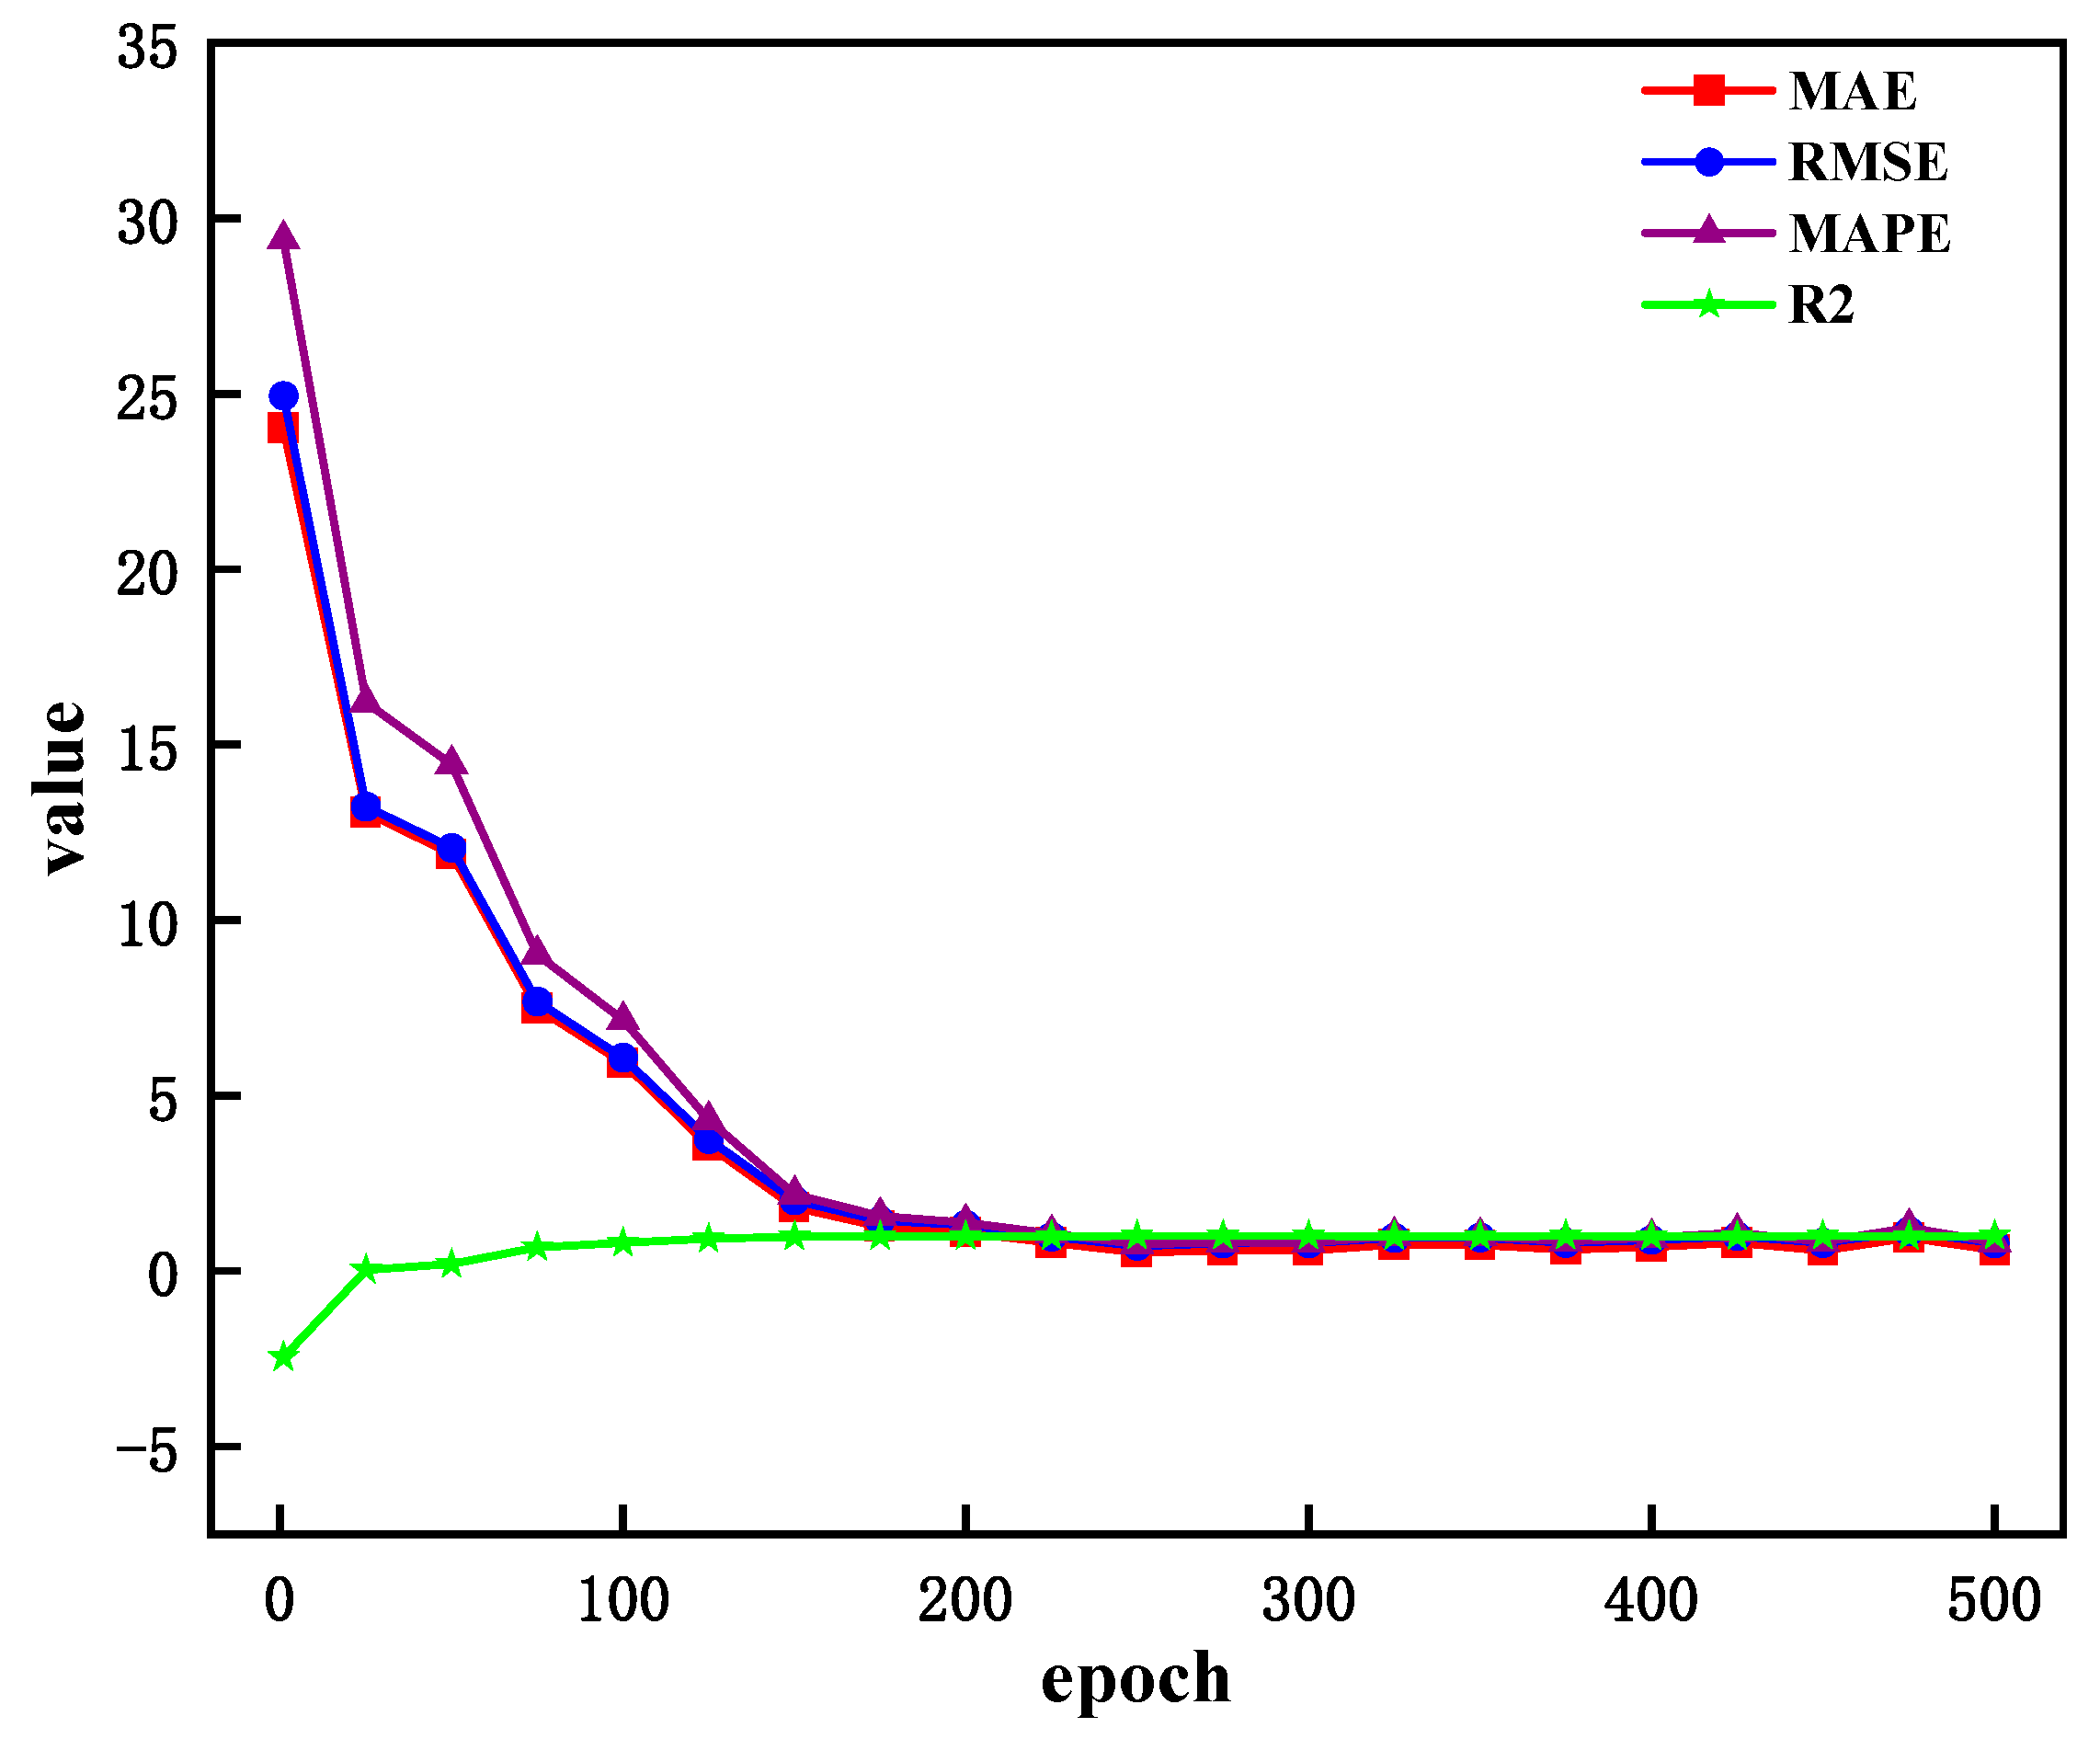
4.3.1. Experiment and Analysis
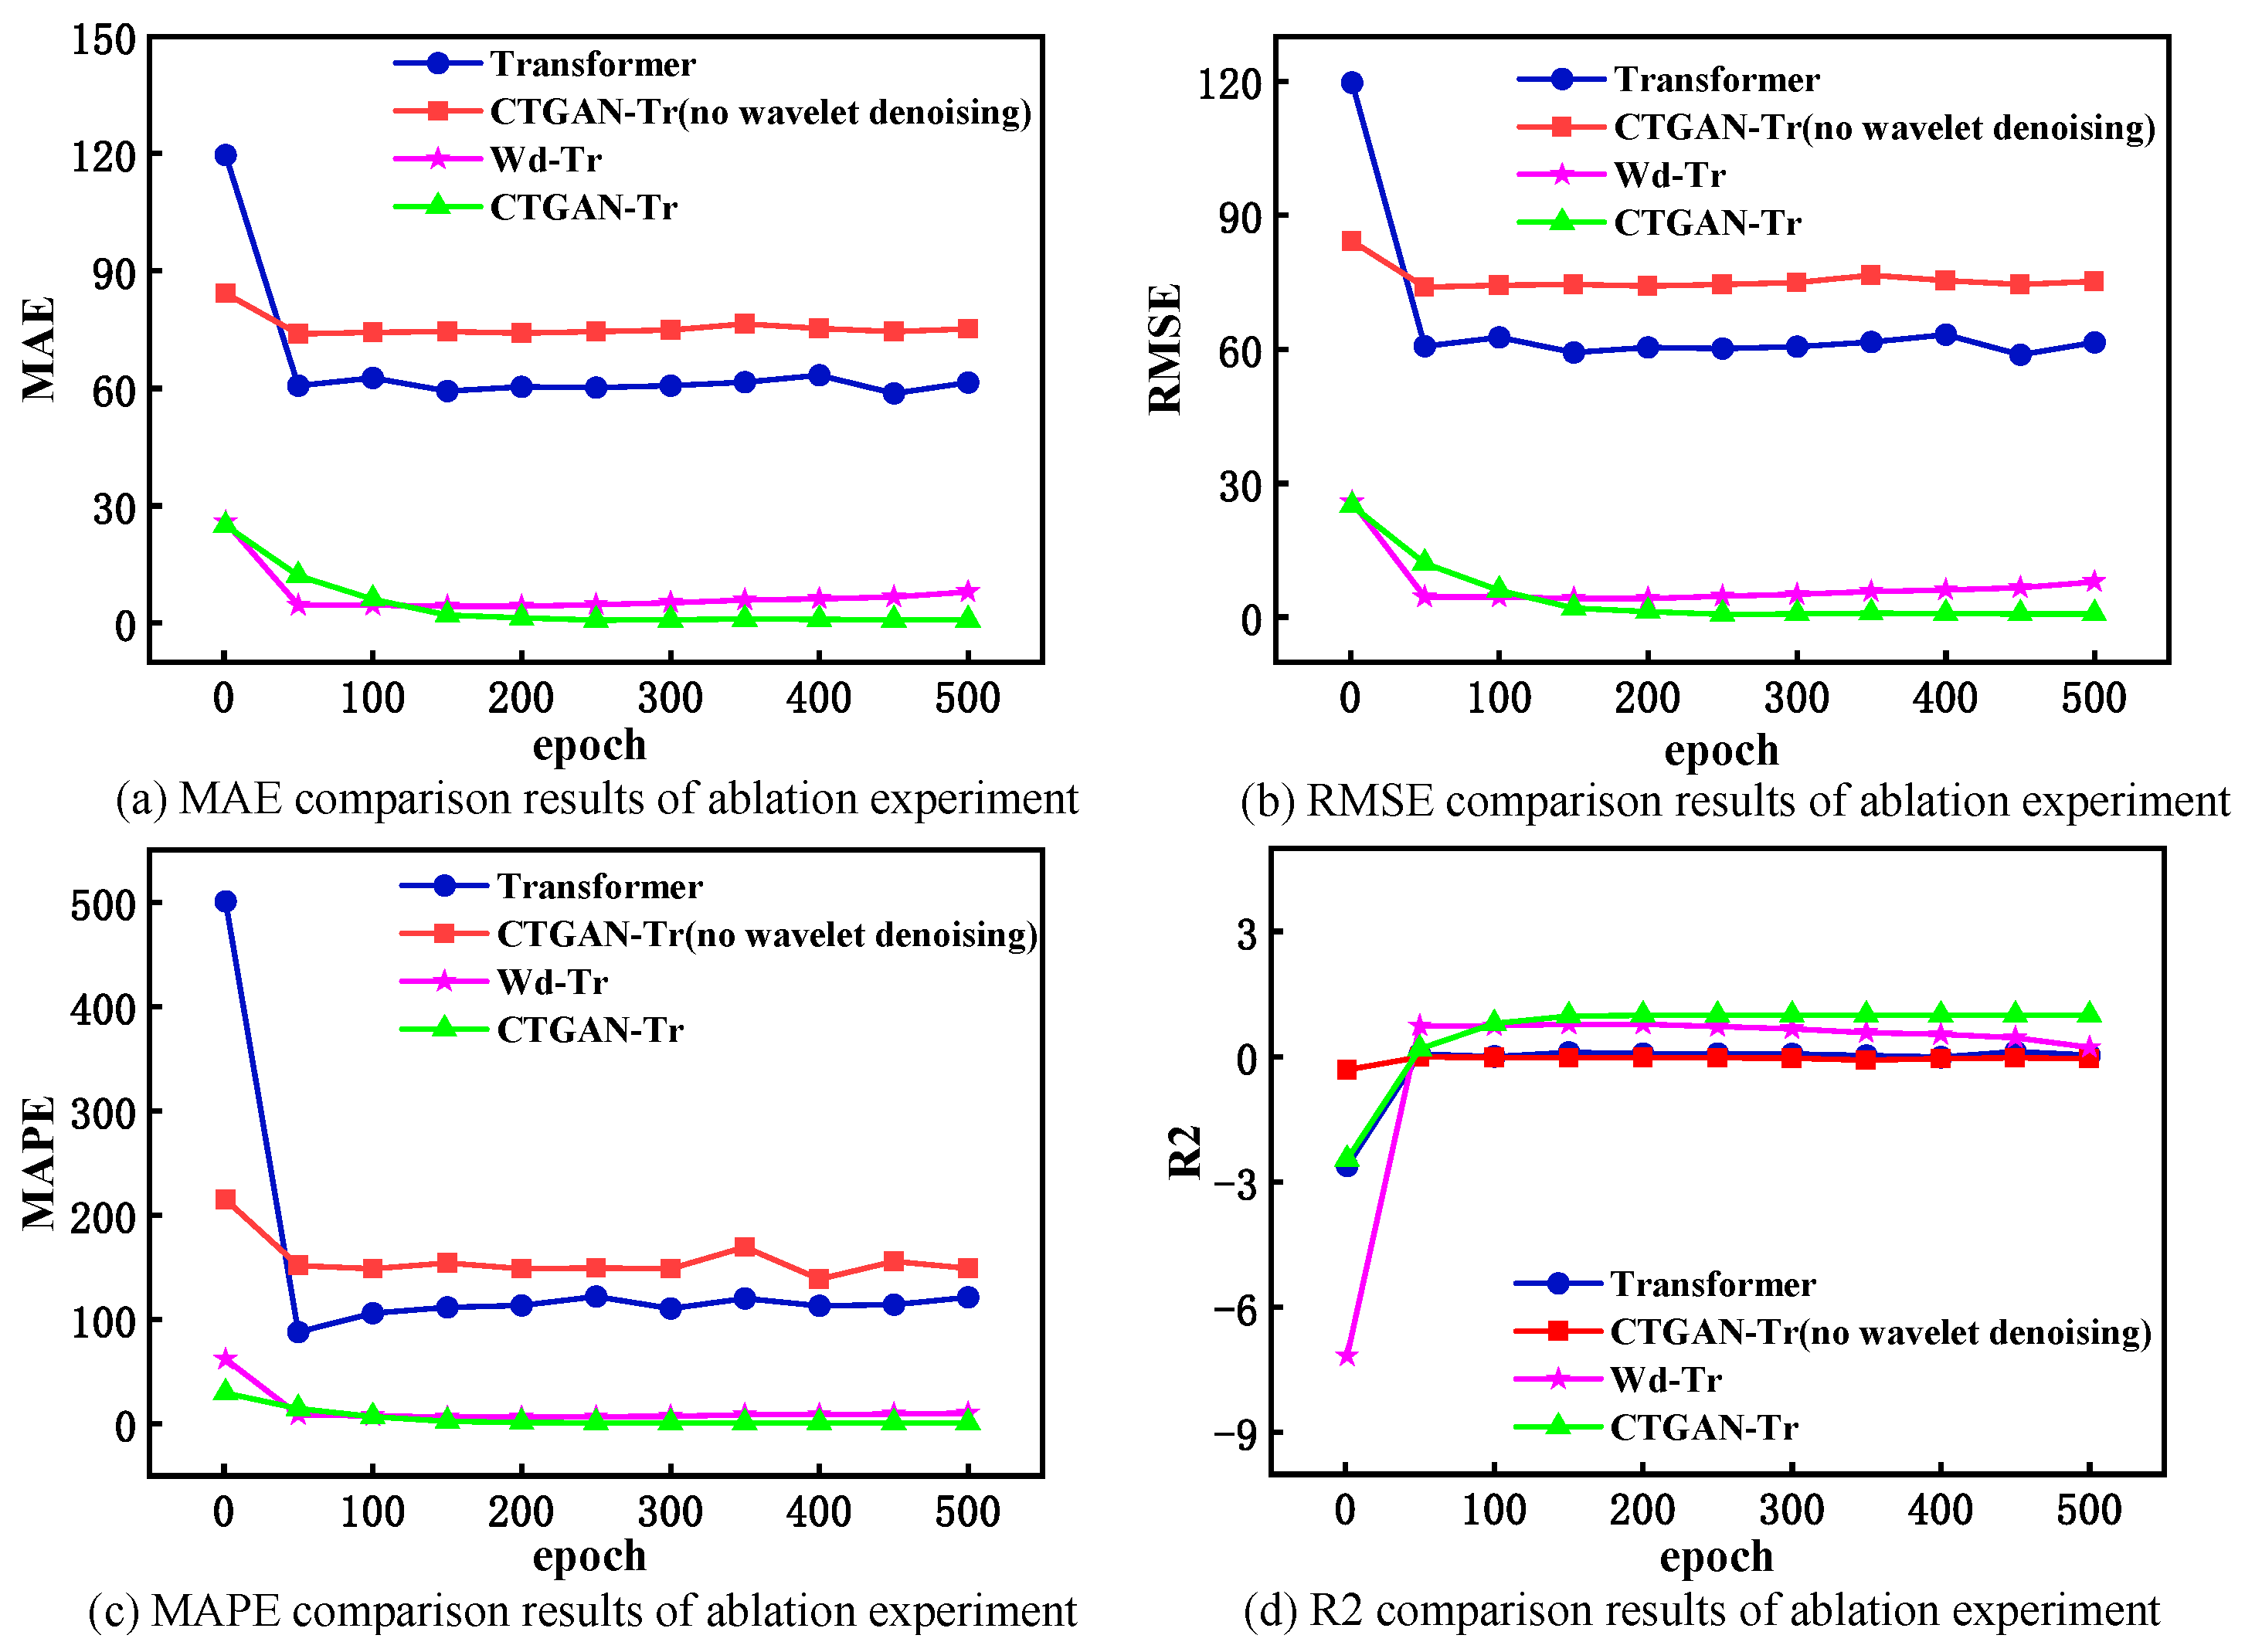
4.3.2. Ablation Experiment
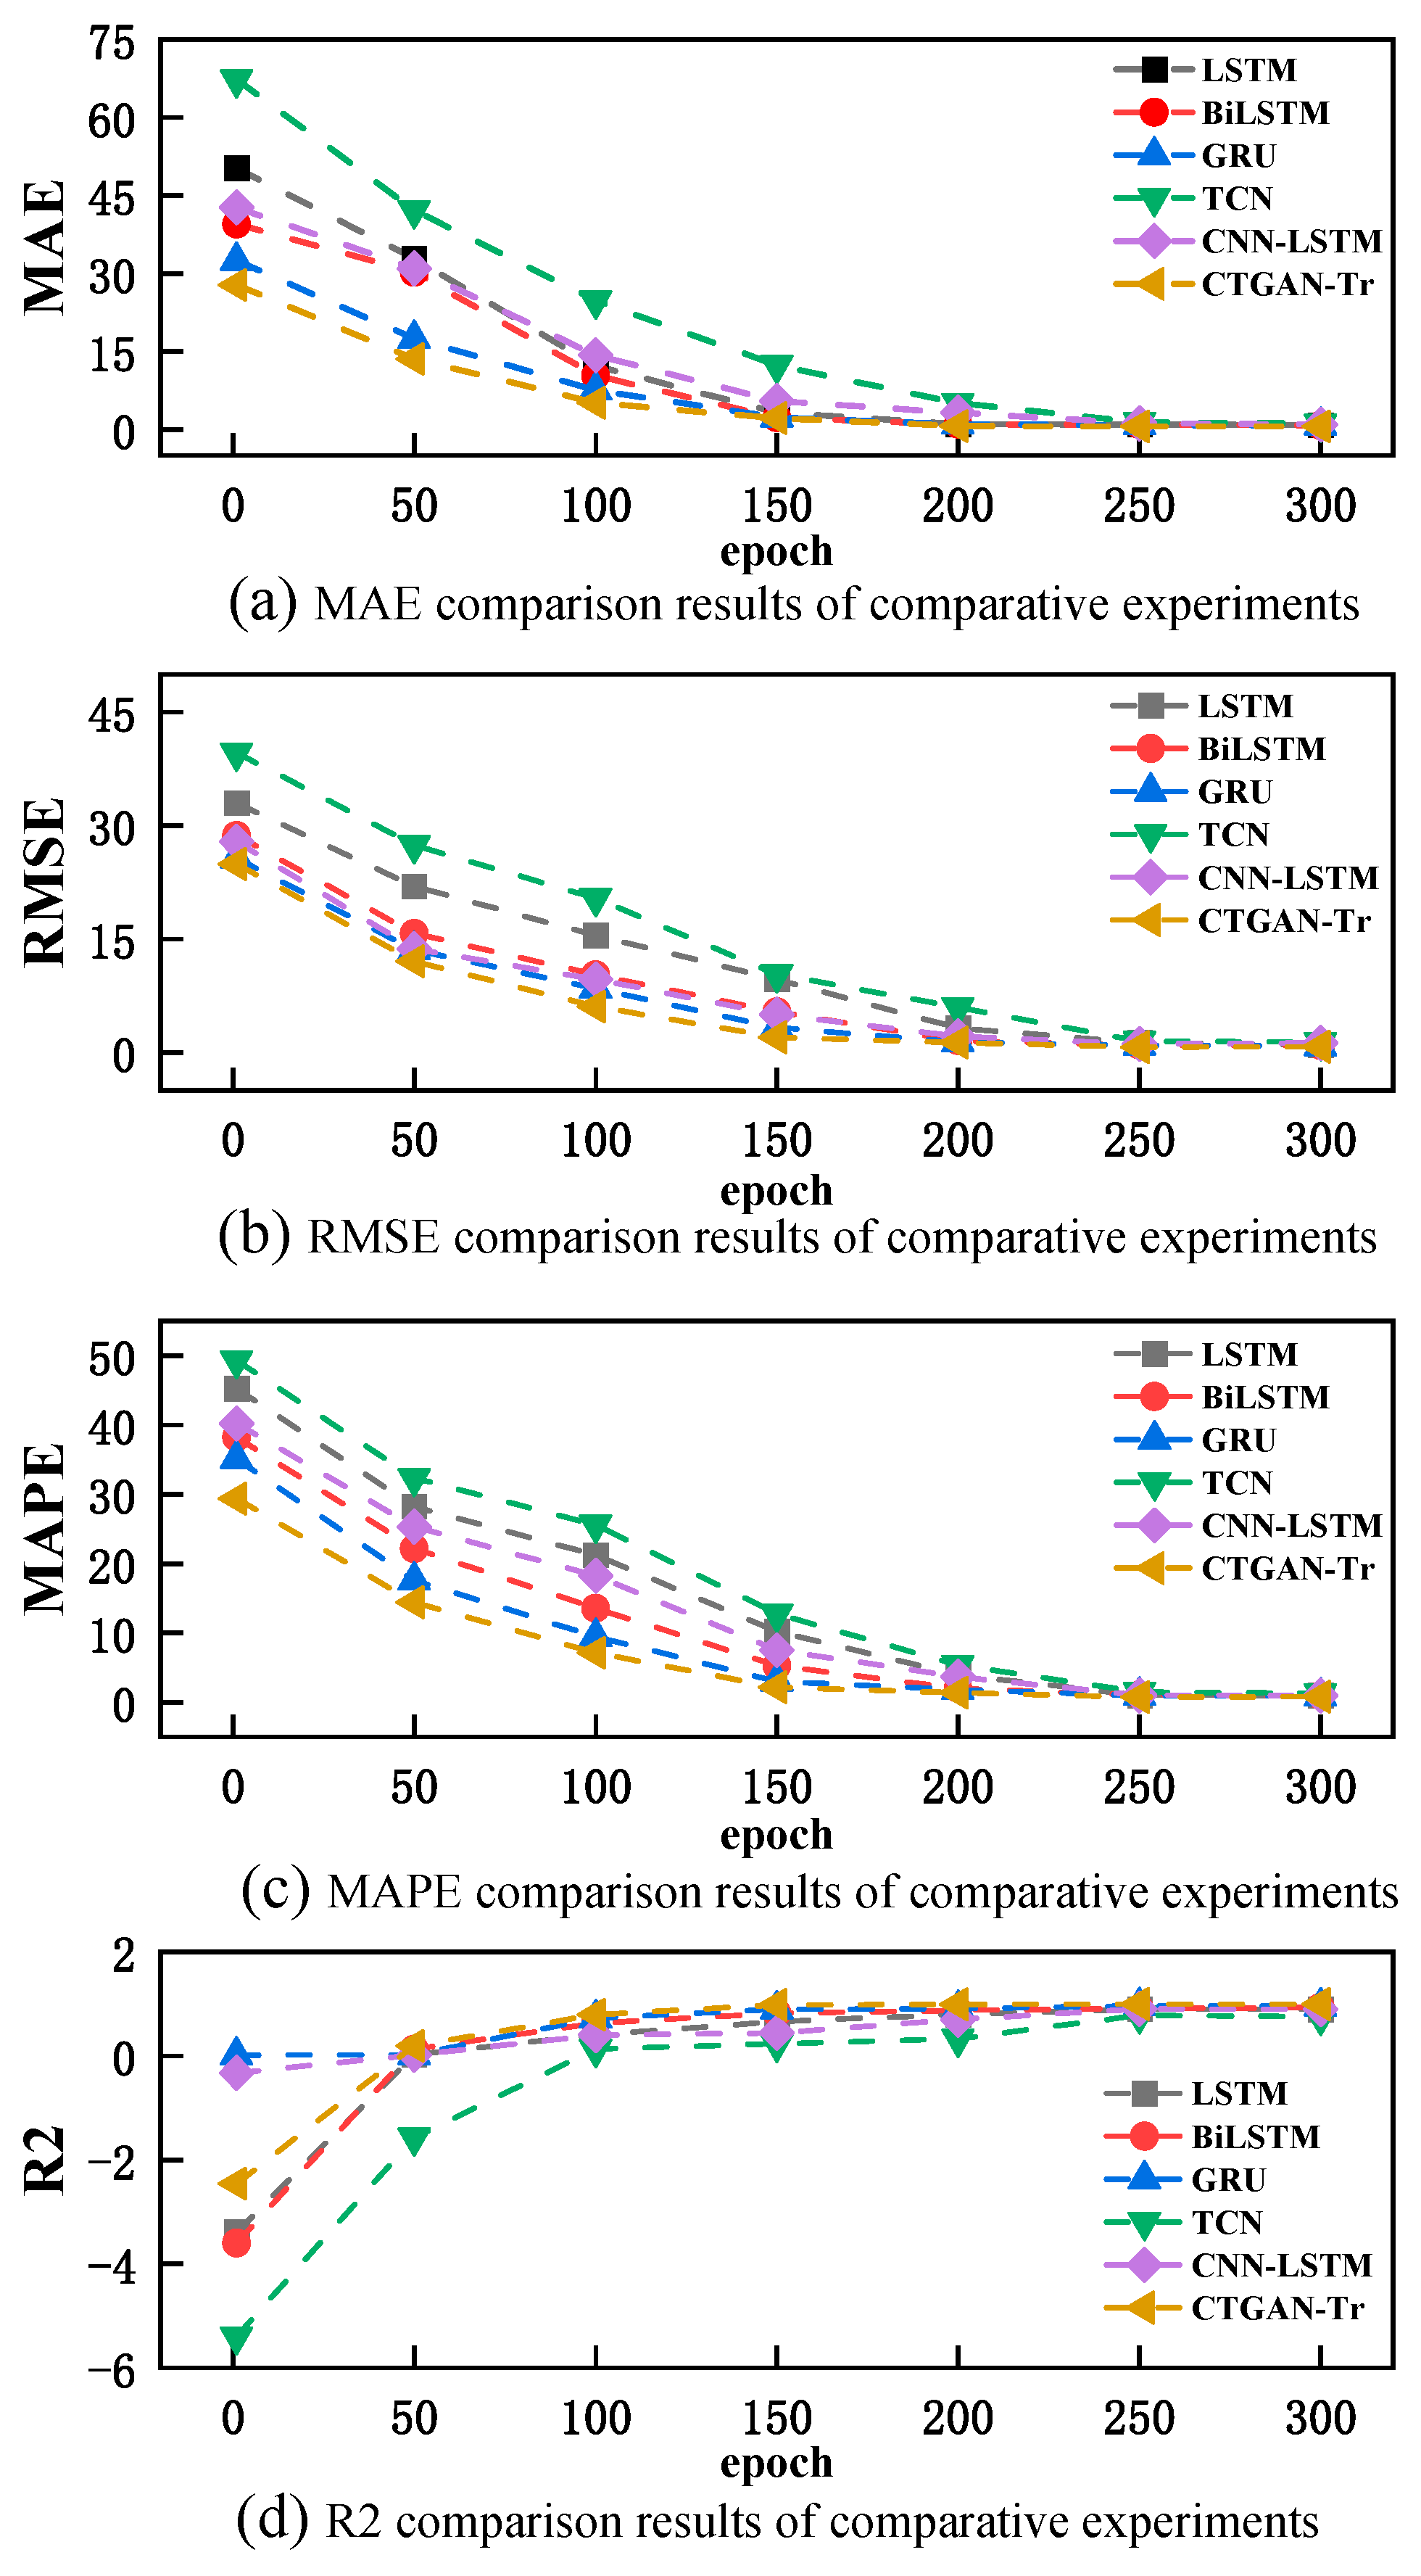
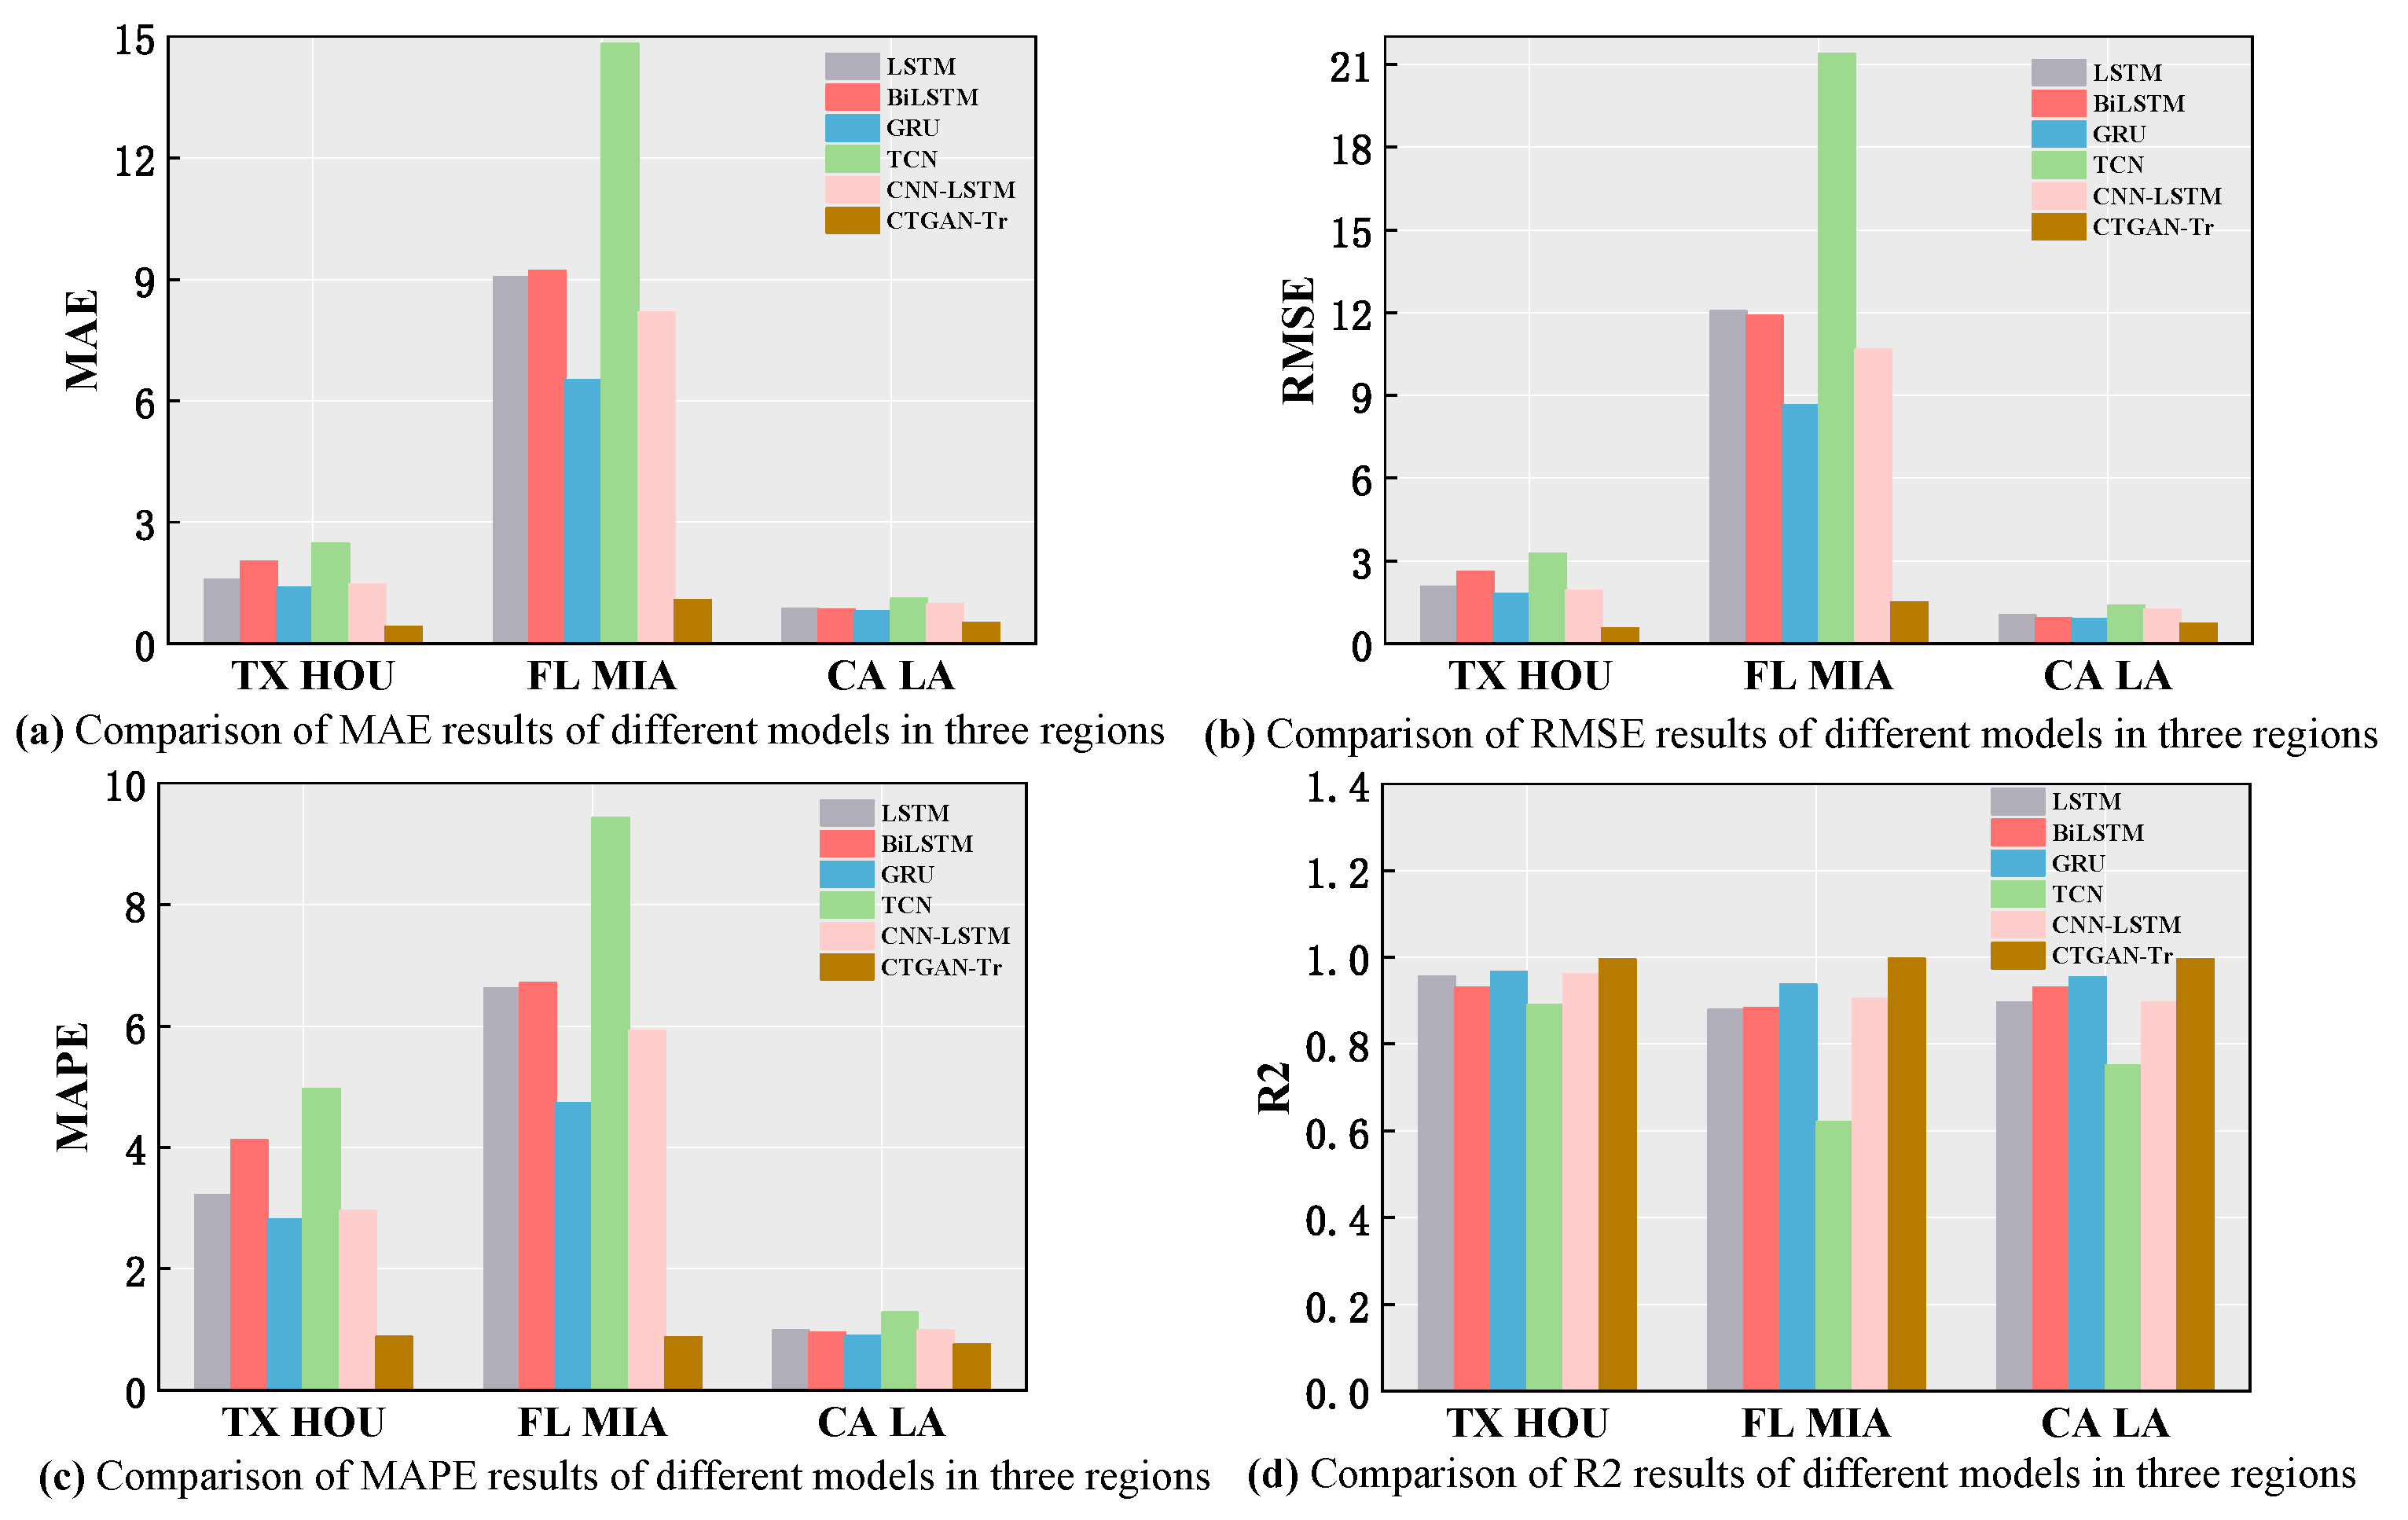
4.3.3. Comparative Experiment
5. Conclusions
Author Contributions
Funding
Institutional Review Board Statement
Informed Consent Statement
Data Availability Statement
Conflicts of Interest
References
- Li, R.; Pereira, F.C.; Ben-Akiva, M.E. Overview of traffic incident duration analysis and prediction. Eur. Transp. Res. Rev. 2018, 10, 22. [Google Scholar] [CrossRef]
- Lin, Y.; Li, R. Real-time traffic accidents post-impact prediction: Based on crowdsourcing data. Accid. Anal. Prev. 2020, 145, 105696. [Google Scholar] [CrossRef]
- Saracoglu, A.; Ozen, H. Estimation of traffic incident duration: A comparative study of decision tree models. Arab. J. Sci. Eng. 2020, 45, 8099–8110. [Google Scholar] [CrossRef]
- Zhang, Z.; Liu, J.; Li, X.; Khattak, A.J. Do larger sample sizes increase the reliability of traffic incident duration models? A case study of east Tennessee incidents. Transp. Res. Rec. 2021, 2675, 265–280. [Google Scholar] [CrossRef]
- Wang, Y.; Zhai, H.; Cao, X.; Geng, X. Cause Analysis and Accident Classification of Road Traffic Accidents Based on Complex Networks. Appl. Sci. 2023, 13, 12963. [Google Scholar] [CrossRef]
- Zhu, W.; Wu, J.; Fu, T.; Wang, J.; Zhang, J.; Shangguan, Q. Dynamic prediction of traffic incident duration on urban expressways: A deep learning approach based on LSTM and MLP. J. Intell. Connect. Veh. 2021, 4, 80–91. [Google Scholar] [CrossRef]
- Oralhan, B.; Göktolga, Z.G. Determination of the risk factors that influence occurrence time of traffic accidents with survival analysis. Iran. J. Public Health 2018, 47, 1181. [Google Scholar]
- Wali, B.; Khattak, A.J.; Liu, J. Heterogeneity assessment in incident duration modelling: Implications for development of practical strategies for small & large scale incidents. J. Intell. Transp. Syst. 2022, 26, 586–601. [Google Scholar]
- Zeng, Q.; Wang, F.; Chen, T.; Sze, N.N. Incorporating real-time weather conditions into analyzing clearance time of freeway accidents: A grouped random parameters hazard-based duration model with time-varying covariates. Anal. Methods Accid. Res. 2023, 38, 100267. [Google Scholar] [CrossRef]
- Islam, N.; Adanu, E.K.; Hainen, A.M.; Burdette, S.; Smith, R.; Jones, S. A comparative analysis of freeway crash incident clearance time using random parameter and latent class hazard-based duration model. Accid. Anal. Prev. 2021, 160, 106303. [Google Scholar] [CrossRef]
- Suzuki, T.; Kataoka, H.; Aoki, Y.; Satoh, Y. Anticipating traffic accidents with adaptive loss and large-scale incident db. In Proceedings of the IEEE Conference on Computer Vision and Pattern Recognition, Salt Lake City, UT, USA, 18–23 June 2018; pp. 3521–3529. [Google Scholar]
- Li, X.; Liu, J.; Khattak, A.; Nambisan, S. Sequential prediction for large-scale traffic incident duration: Application and comparison of survival models. Transp. Res. Rec. 2020, 2674, 79–93. [Google Scholar] [CrossRef]
- Tirtha, S.D.; Yasmin, S.; Eluru, N. Modeling of incident type and incident duration using data from multiple years. Anal. Methods Accid. Res. 2020, 28, 100132. [Google Scholar] [CrossRef]
- Jiaona CH, E.N.; Yinli JI, N.; Weijun TA, O.; Daofeng, L.I. Research on mediating effect of express way accident duration based on text information. China Saf. Sci. J. 2023, 33, 155. [Google Scholar]
- Grigorev, A.; Mihaita, A.S.; Lee, S.; Chen, F. Incident duration prediction using a bi-level machine learning framework with outlier removal and intra–extra joint optimisation. Transp. Res. Part C Emerg. Technol. 2022, 141, 103721. [Google Scholar] [CrossRef]
- Hamad, K.; Al-Ruzouq, R.; Zeiada, W.; Abu Dabous, S.; Khalil, M.A. Predicting incident duration using random forests. Transp. A: Transp. Sci. 2020, 16, 1269–1293. [Google Scholar] [CrossRef]
- Chen, J.; Tao, W. Traffic accident duration prediction using text mining and ensemble learning on expressways. Sci. Rep. 2022, 12, 21478. [Google Scholar] [CrossRef] [PubMed]
- Chen, J.; Tao, W.; Jing, Z.; Wang, P.; Jin, Y. Traffic accident duration prediction using multi-mode data and ensemble deep learning. Heliyon 2024, 10, e25957. [Google Scholar] [CrossRef]
- Can, V.X.; Rui-Fang, M.; Van Hung, T.; Thuat, V.T. An analysis of urban traffic incident under mixed traffic conditions based on SUMO: A case study of Hanoi. Int. J. Adv. Res. Eng. Technol. 2020, 11, 573–581. [Google Scholar]
- Tang, J.; Zheng, L.; Han, C.; Yin, W.; Zhang, Y.; Zou, Y.; Huang, H. Statistical and machine-learning methods for clearance time prediction of road incidents: A methodology review. Anal. Methods Accid. Res. 2020, 27, 100123. [Google Scholar] [CrossRef]
- Ji, K.; Li, Z.; Chen, J.; Liu, K.L.; Wang, G.Y. Freeway accident duration prediction based on social network information. Neural Netw. World 2022, 32, 93. [Google Scholar] [CrossRef]
- Hamad, K.; Obaid, L.; Nassif, A.B.; Abu Dabous, S.; Al-Ruzouq, R.; Zeiada, W. Comprehensive evaluation of multiple machine learning classifiers for predicting freeway incident duration. Innov. Infrastruct. Solut. 2023, 8, 177. [Google Scholar] [CrossRef]
- Shan, L.; Yang, Z.; Zhang, H.; Shi, R.; Kuang, L. Predicting duration of traffic accidents based on ensemble learning. In Collaborative Computing: Networking, Applications and Worksharing, Proceedings of the 14th EAI International Conference, CollaborateCom 2018, Shanghai, China, 1–3 December 2018; Proceedings 14; Springer International Publishing: Cham, Switzerland, 2019; pp. 252–266. [Google Scholar]
- Kalair, K.; Connaughton, C. Dynamic and interpretable hazard-based models of traffic incident durations. Front. Future Transp. 2021, 2, 669015. [Google Scholar] [CrossRef]
- Shang, Q.; Xie, T.; Yu, Y. Prediction of duration of traffic incidents by hybrid deep learning based on multi-source incomplete data. Int. J. Environ. Res. Public Health 2022, 19, 10903. [Google Scholar] [CrossRef]
- De Souza, V.N.; de Oliveira Neto, F.M. Modelling traffic accident duration on urban roads with high traffic variability using survival models: A case study on Fortaleza arterial roads. TRANSPORTES 2023, 31, e2837. [Google Scholar] [CrossRef]
- Sun, C.; Hao, J.; Pei, X.; Zhang, Z.; Zhang, Y. A data-driven approach for duration evaluation of accident impacts on urban intersection traffic flow. In Proceedings of the 2016 IEEE 19th International Conference on Intelligent Transportation Systems (ITSC), Rio de Janeiro, Brazil, 1–4 November 2016; IEEE: Toulouse, France; pp. 1354–1359. [Google Scholar]
- Yun, G.R.; Bae, S.H. Analysis of incident impact factors and development of SMOGN-DNN model for prediction of incident clearance time. J. Korea Inst. Intell. Transp. Syst. 2021, 20, 46–56. [Google Scholar] [CrossRef]
- Zhao, W.; Ye, Y.; Ding, J.; Wang, T.; Wei, T.; Chen, M. Ipdalight: Intensity-and phase duration-aware traffic signal control based on reinforcement learning. J. Syst. Archit. 2022, 123, 102374. [Google Scholar] [CrossRef]
- He, Y.; Zhang, S.; Zhong, P.; Li, Z. Prediction of traffic accident duration based on N-BEATS. In Proceedings of the Second International Conference on Algorithms, Microchips, and Network Applications (AMNA 2023), Zhengzhou, China, 15 January 2023; SPIE: New York, NY, USA; Volume 12635, pp. 128–132. [Google Scholar]
- Zhao, Y.; Deng, W. Prediction in traffic accident duration based on heterogeneous ensemble learning. Appl. Artif. Intell. 2022, 36, 2018643. [Google Scholar] [CrossRef]
- Ghosh, B.; Dauwels, J. Comparison of different Bayesian methods for estimating error bars with incident duration prediction. J. Intell. Transp. Syst. 2022, 26, 420–431. [Google Scholar] [CrossRef]
- Lyu, D.; Lin, Y. Impact Estimation of Traffic Accident Duration Based on Survival Analysis by Using Field Urban Traffic Condition. In Proceedings of the International Conference on Green Building, Civil Engineering and Smart City, Guilin, China, 8–10 April 2022; Springer Nature: Singapore, 2022; pp. 1247–1254. [Google Scholar]
- Srivastava, M.; Anderson, C.L.; Freed, J.H. A new wavelet denoising method for selecting decomposition levels and noise thresholds. IEEE Access 2016, 4, 3862–3877. [Google Scholar] [CrossRef]
- Hojati, A.T.; Ferreira, L.; Washington, S.; Charles, P. Hazard based models for freeway traffic incident duration. Accid. Anal. Prev. 2013, 52, 171–181. [Google Scholar] [CrossRef]
- Li, R.; Pereira, F.C.; Ben-Akiva, M.E. Competing risk mixture model and text analysis for sequential incident duration prediction. Transp. Res. Part C Emerg. Technol. 2015, 54, 74–85. [Google Scholar] [CrossRef]
- Ma, X.; Ding, C.; Luan, S.; Wang, Y.; Wang, Y. Prioritizing influential factors for freeway incident clearance time prediction using the gradient boosting decision trees method. IEEE Trans. Intell. Transp. Syst. 2017, 18, 2303–2310. [Google Scholar] [CrossRef]
- Yu, B.; Wangy, Y.T.; Yaoz, J.B.; Wang, J.Y. A Comparison of the Performance of ANN and SVM for the Prediction of Traffic Accident Duration. Neural Netw. World 2016, 26, 271–287. [Google Scholar] [CrossRef]
- Rashid, L.; Rubab, S.; Alhaisoni, M.; Alqahtani, A.; Alsubai, S.; Binbusayyis, A.; Bukhari SA, C. Analysis of dimensionality reduction techniques on Internet of Things data using machine learning. Sustain. Energy Technol. Assess. 2022, 52, 102304. [Google Scholar] [CrossRef]
- Smith, K.; Smith, B.L. Forecasting the Clearance Time of Freeway Accidents; Center for Transportation Studies, University of Virginia: Charlottesville, VA, USA, 2002. [Google Scholar]
- Kim, W.; Chang, G.L. Development of a hybrid prediction model for freeway incident duration: A case study in Maryland. Int. J. Intell. Transp. Syst. Res. 2012, 10, 22–33. [Google Scholar] [CrossRef]
- Thapa, D.; Mishra, S.; Velaga, N.R.; Patil, G.R. Advancing proactive crash prediction: A discretized duration approach for predicting crashes and severity. Accid. Anal. Prev. 2024, 195, 107407. [Google Scholar] [CrossRef] [PubMed]
- Kuang, L.; Yan, H.; Zhu, Y.; Tu, S.; Fan, X. Predicting duration of traffic accidents based on cost-sensitive Bayesian network and weighted K-nearest neighbor. J. Intell. Transp. Syst. 2019, 23, 161–174. [Google Scholar] [CrossRef]
- Lin, L.; Wang, Q.; Sadek, A.W. A combined M5P tree and hazard-based duration model for predicting urban freeway traffic accident durations. Accid. Anal. Prev. 2016, 91, 114–126. [Google Scholar] [CrossRef] [PubMed]
- Ieracitano, C.; Mammone, N.; Paviglianiti, A.; Morabito, F.C. A conditional generative adversarial network and transfer learning-oriented anomaly classification system for electrospun nanofibers. Int. J. Neural Syst. 2022, 32, 2250054. [Google Scholar] [CrossRef]
- Shim, S. Self-training approach for crack detection using synthesized crack images based on conditional generative adversarial network. Comput.-Aided Civ. Infrastruct. Eng. 2024, 39, 1019–1041. [Google Scholar] [CrossRef]

| Id | Influence Factor | Variable Composition and Description |
|---|---|---|
| 1 | Date | Shows the time of the accident in a local time zone |
| 2 | Duration | The period between the start and end of the accident |
| 3 | Temperature | Shows the temperature (in centigrade) |
| 4 | Humidity | Shows the humidity (in percentage) |
| 5 | Pressure | Shows the air pressure (in inches) |
| 6 | Visibility | Shows visibility (in miles) |
| 7 | Wind Speed | Shows wind speed (in miles per hour) |
| Epoch | MAE | RMSE | MAPE | |
|---|---|---|---|---|
| 50 | 13.5818 | 13.7731 | 16.5454 | −0.0551 |
| 100 | 5.9265 | 6.0748 | 7.1436 | 0.7947 |
| 150 | 1.8037 | 2.0119 | 2.1756 | 0.9575 |
| 200 | 1.1028 | 1.3195 | 1.3731 | 0.9703 |
| 250 | 0.5331 | 0.7195 | 0.7560 | 0.9771 |
| 300 | 0.5591 | 0.7583 | 0.7930 | 0.9768 |
| 350 | 0.7342 | 0.9490 | 0.9923 | 0.9750 |
| 400 | 0.6888 | 0.8797 | 0.9393 | 0.9757 |
| 450 | 0.5828 | 0.7970 | 0.8281 | 0.9765 |
| 500 | 0.5949 | 0.7871 | 0.8271 | 0.9766 |
| Models | MAE | RMSE | MAPE | |
|---|---|---|---|---|
| Transformer | 43.5475 | 60.1998 | 122.1850 | 0.0831 |
| CTGAN-Tr (no wavelet denoising) | 58.7680 | 74.4591 | 149.3692 | −0.0254 |
| Wd-Tr | 2.8539 | 4.7211 | 6.7089 | 0.7267 |
| CTGAN-Tr | 0.5331 | 0.7195 | 0.7560 | 0.9771 |
| Models | MAE | RMSE | MAPE | |
|---|---|---|---|---|
| LSTM | 0.9736 | 1.2845 | 1.0237 | 0.8994 |
| BiLSTM | 0.9213 | 0.9867 | 1.0589 | 0.9113 |
| GRU | 0.8456 | 0.9651 | 0.9931 | 0.9651 |
| TCN | 1.4329 | 1.5237 | 1.5026 | 0.7802 |
| CNN-LSTM | 1.2136 | 1.1597 | 1.0264 | 0.9036 |
| CTGAN-Tr | 0.5331 | 0.7195 | 0.7560 | 0.9771 |
| Dataset | Models | MAE | RMSE | MAPE | |
|---|---|---|---|---|---|
| TX HOU | LSTM | 1.5878 | 2.0670 | 3.2195 | 0.9568 |
| BiLSTM | 2.0416 | 2.6128 | 4.1197 | 0.9310 | |
| GRU | 1.3901 | 1.8111 | 2.8192 | 0.9669 | |
| TCN | 2.4790 | 3.2708 | 4.9699 | 0.8919 | |
| CNN-LSTM | 1.4765 | 1.9156 | 2.9639 | 0.9629 | |
| CTGAN-Tr | 0.4272 | 0.5512 | 0.8860 | 0.9769 | |
| FL MIA | LSTM | 9.0676 | 12.0574 | 6.6264 | 0.8795 |
| BiLSTM | 9.2169 | 11.8946 | 6.7080 | 0.8828 | |
| GRU | 6.5186 | 8.6496 | 4.7375 | 0.9380 | |
| TCN | 14.8210 | 21.3790 | 9.4354 | 0.6213 | |
| CNN-LSTM | 8.1782 | 10.6528 | 5.9221 | 0.9060 | |
| CTGAN-Tr | 1.0848 | 1.5047 | 0.8802 | 0.9774 | |
| CA LA | LSTM | 0.8741 | 1.0349 | 0.9853 | 0.8961 |
| BiLSTM | 0.8431 | 0.9217 | 0.9547 | 0.9312 | |
| GRU | 0.8047 | 0.8876 | 0.9023 | 0.9553 | |
| TCN | 1.1239 | 1.3974 | 1.2853 | 0.7521 | |
| CNN-LSTM | 0.9873 | 1.2674 | 0.9878 | 0.8967 | |
| CTGAN-Tr | 0.5331 | 0.7195 | 0.7560 | 0.9771 |
Disclaimer/Publisher’s Note: The statements, opinions and data contained in all publications are solely those of the individual author(s) and contributor(s) and not of MDPI and/or the editor(s). MDPI and/or the editor(s) disclaim responsibility for any injury to people or property resulting from any ideas, methods, instructions or products referred to in the content. |
© 2024 by the authors. Licensee MDPI, Basel, Switzerland. This article is an open access article distributed under the terms and conditions of the Creative Commons Attribution (CC BY) license (https://creativecommons.org/licenses/by/4.0/).
Share and Cite
Wang, Y.; Zhai, H.; Cao, X.; Geng, X. A Novel Accident Duration Prediction Method Based on a Conditional Table Generative Adversarial Network and Transformer. Sustainability 2024, 16, 6821. https://doi.org/10.3390/su16166821
Wang Y, Zhai H, Cao X, Geng X. A Novel Accident Duration Prediction Method Based on a Conditional Table Generative Adversarial Network and Transformer. Sustainability. 2024; 16(16):6821. https://doi.org/10.3390/su16166821
Chicago/Turabian StyleWang, Yongdong, Haonan Zhai, Xianghong Cao, and Xin Geng. 2024. "A Novel Accident Duration Prediction Method Based on a Conditional Table Generative Adversarial Network and Transformer" Sustainability 16, no. 16: 6821. https://doi.org/10.3390/su16166821
APA StyleWang, Y., Zhai, H., Cao, X., & Geng, X. (2024). A Novel Accident Duration Prediction Method Based on a Conditional Table Generative Adversarial Network and Transformer. Sustainability, 16(16), 6821. https://doi.org/10.3390/su16166821