Article

Spatiotemporal Distribution and Regional Imbalance of China’s Digital Economy

1
Chinese Academy of Environmental Planning (CAEP), Beijing 100041, China
2
Chinese Research Academy of Environmental Sciences, Beijing 100012, China
*
Authors to whom correspondence should be addressed.
These authors contributed equally to this work.
Sustainability 2024, 16(16), 6738; https://doi.org/10.3390/su16166738
Submission received: 10 July 2024 / Revised: 4 August 2024 / Accepted: 5 August 2024 / Published: 6 August 2024

Abstract

:
The digital economy is an important driving force for promoting national economic growth and achieving high-quality economic transformation, and is a key force in achieving the sustainable development goals (SDGs). This paper measures the digital economy development level of 30 provinces in China from 2013 to 2021 utilizing the entropy of weighting approach, and in order to further reveal its intrinsic laws and differences, it uses three-dimensional kernel density analysis, the Dagum Gini coefficient, spatial autocorrelation analysis, and cold hot spot analysis to explore the spatial and temporal evolution characteristics of the digital economy and its regional imbalance. The empirical results show that ① China’s digital economy has been steadily increasing, spatially showing the characteristics of gradual decrease from east to west and from coast to inland, with obvious spatial agglomeration characteristics and an increasing trend. ② There are obvious regional imbalances in the digital economy, with the southeast coastal region leading significantly. ③ The overall regional differences are large but reduced, mainly from intra-regional differences, the and inter-regional contribution is low. The research in this paper provides data support for revealing the spatial and temporal evolution characteristics of digital economic development and provides new path support for the balanced development of China’s regional digital economy.

1. Introduction

In the face of the global economic landscape, China encounters a critical need to bolster its economic growth drivers to sustain high-quality development [1]. The digital economy (DE), recognized as a progressive economic paradigm, emerges as a pivotal opportunity for revitalizing China’s economic landscape through its inherent efficiency, ease, and innovative capabilities [2]. Accelerated advancements in information technology have positioned the digital economy as a crucial catalyst in fostering economic expansion, demonstrating substantial potential in enhancing resource distribution, boosting production efficiency, and propelling innovation-driven growth [3,4]. The concept of the “digital economy” was first introduced in the Chinese government’s work report in 2017, marking a sustained interest in this arena. Subsequently, the 19th National Congress of the Communist Party of China outlined the strategic ambition to establish a “digital China”, underlining the digital economy’s crucial role in the nation’s developmental strategy [5]. This was further elevated by the discourse at the 20th National Congress, which set higher benchmarks for the digital economy’s development and the fusion of digital and traditional industries, underscoring the strategic imperative and its central role in economic transformation and upgrading. With the commencement of the “14th Five-Year Plan”, digital development has been identified as a strategic priority, with “digital China” construction earmarked as a principal endeavor. By 2024, the National Development and Reform Commission alongside the National Data Administration released the “Digital Economy for the Well-being of the People” report and initiated the “Implementation Plan for Promoting Digital Economy for Common Prosperity”. This plan articulates the resolution of development disparities through digital solutions, aiming to foster social equity and widespread prosperity via the digital economy’s evolution. The unveiling of this strategy not only broadens the vistas for digital economy research and application but also accentuates its pivotal role in advancing society’s comprehensive development [6].
Currently, China’s digital economy is advancing rapidly. According to the 2023 White Paper on China’s Digital Economy, the sector’s size surged from CNY 27.2 trillion in 2017 to CNY 50.2 trillion in 2022, marking an 84.6% increase. Concurrently, its GDP share rose from 14.2% in 2005 to 41.5% in 2022. This indicates that for 11 consecutive years, the digital economy’s growth rate has outpaced that of the GDP, establishing it as a crucial driver of economic expansion [7]. Nonetheless, China faces significant regional disparities in development. Variations in geographical location, resource allocation, and policy impact have led to pronounced economic differences among the Eastern, Central, Western, and Northeastern regions. Although the overall trajectory of the digital economy is positive, a “digital divide” persists, with stark contrasts in digital economic development across regions [5]. Investigating the spatiotemporal dynamics of digital economic levels and regional imbalances is vital for enhancing the digital economy’s development and fostering equitable regional growth in China. What are the characteristics of the temporal and spatial evolution of China’s digital economy? How do the digital economies of China’s four major regions—East, Central, West, and Northeast—differ specifically? Additionally, what spatial correlations are evident in the development levels of the digital economy across China’s 30 provinces?
To answer the above questions, the research structure of this paper is as follows: Section 1 of the article outlines the research context and presents the questions this study aims to address. Section 2 reviews the related literature and summarizes the literature gaps. Section 3 presents the methodology and necessary data. Section 4 presents a visualization analysis of the spatial and temporal features. Section 5 synthesizes the research findings and offers specific recommendations. Section 6 summarizes the limitations of the article and future research directions.

2. Review of the Literature

The digital economy is a key component of the innovation-driven development strategy and contributes significantly to the superior development of the local economy [8]. In the context of sustainable development, countries around the world have placed greater emphasis on green innovation in their environmental policies, and the digital economy may play an important role in promoting green innovation [9]. A large number of studies have shown that the digital economy has played a huge role in promoting China’s high-quality economic growth, improving urban innovation capabilities, reforming traditional industries, and sustainable development [9]. Contemporary scholarly endeavors primarily dissect the digital economy by elucidating its definition, constructing and calibrating metrics for its assessment, mapping its geographic spread, and evaluating its economic repercussions. Internationally, the concept of the digital economy lacks a standardized definition. In 1994, the American scholar Tapscott initially introduced the term “digital economy”, defining it as “activities that integrate information and business endeavors digitally, utilizing the Internet as a commerce platform” [10]. According to the Group of Twenty (G20), the digital economy is delineated as “an array of economic activities that center around digital knowledge and information as pivotal production elements, leveraging modern informational networks as a crucial platform and enhancing efficiency and economic structure through the adept application of information and communication technologies (ICT)” [11]. The China Academy of Information and Communications Technology (CICT) perceives the digital economy as an innovative economic framework predicated on digital knowledge and information, with digital technology innovation at its core and modern informational networks as the primary platform. It promotes the enhancement of traditional industries’ digitalization and intelligence by deeply fusing digital technology with the real economy, thereby expediting the transformation of economic development methodologies. Despite varying perspectives from different scholars and research entities, it is widely recognized that the digital economy is founded on information technology, with data resources as the central element [12]. Zhao et al. constructed digital economy indicators from the perspectives of supply and demand [7]. It principally aims to augment economic efficiency by digitalizing industries, industrializing digital technology, and amalgamating them with the real economy [13]. In terms of building a digital economy evaluation system and measuring it, many scholars have made representative contributions [14,15,16,17]. The process of informatization, Internet development, advancements in digital transactions, digital economic carriers, industrial digitization, digital technology industrialization, digital industry scale, digital industry integration, and input–output are just a few of the perspectives from which these researchers have built an evaluation index system. To evaluate it, they used subjective weighting methods such as AHP, and objective weighting methods such as principal component analysis, and the entropy weight method [18,19].
The environmental impact of the digital economy has increasingly become a focal point for discussion. Zhao et al. (2024) demonstrated that the digital economy can effectively address issues related to energy security, inequality, and sustainability [20]. Information and communication technology, a crucial component of the digital economy, facilitates enhancements in energy infrastructure and fosters the adoption of renewable energy technologies, thereby enhancing environmental quality [21,22]. Furthermore, the digital economy substantially refines the consumption patterns of renewable energy [23]. Research by Sun et al. (2024) indicates that the synergy between the digital economy and the real economy significantly boosts green innovation [24]. The digital economy not only catalyzes the green transformation of industries but also maintains the momentum of these changes [25]. Wang et al. (2024) explored the relationship between the digital economy and CO2 emissions, discovering an inverted U-shaped correlation [26]. Additionally, Xie et al. found that the digital economy mitigates CO2 emissions in local and adjacent regions by correcting structural imbalances [20].
Numerous studies have confirmed that the digital economy significantly contributes to energy conservation, the reduction of carbon dioxide emissions, and the achievement of sustainable development goals. Consequently, conducting in-depth research into the spatiotemporal evolution of China’s digital economy is crucial for advancing green, low-carbon, and balanced development. Research into the spatiotemporal evolution of the digital economy varies widely based on the scope of investigation, particularly in terms of data selection and regional categorization. Scholars have employed analyses at both the city and provincial levels [27], exploring digital economy variations across China’s three major regions—East, Central, and West—as well as within eight comprehensive economic zones, the Yellow River Basin, the Yangtze River Economic Belt, the Beijing-Tianjin-Hebei area, and other significant urban clusters nationwide [28,29,30,31]. Predominant methodologies in these studies include the use of the Theil index, the Moran index, kernel density estimation, the Dagum Gini coefficient, the center of gravity standard deviation ellipse, Markov chains, and hot spot analysis [32,33,34].
Despite numerous in-depth studies on the digital economy both domestically and internationally, significant shortcomings remain. Firstly, the evaluation of the digital economy’s development level is frequently impeded by the absence of a unified set of indicators. Establishing a comprehensive indicator system is thus essential for accurately assessing the digital economy’s progress. Secondly, the choice of measurement methods for these indicators, particularly the divergence between subjective and objective weightings, results in inconsistent index results. Lastly, many studies focus solely on temporal progress, spatial distribution, and regional disparities, neglecting an integrated analysis of global spatial correlations and local spatial agglomeration characteristics. This oversight leads to an incomplete portrayal of the digital economy’s spatiotemporal dynamics.
This paper’s marginal contributions are manifest in several key areas: Firstly, it seeks to establish a more comprehensive evaluation system for assessing the digital economy’s development level. While existing research primarily focuses on digital industrialization and industrial digitalization, this study recognizes the critical role of technological innovation. It therefore extends the existing framework by incorporating indicators of the digital innovation environment, alongside digital infrastructure, digital industrialization, and industrial digitalization. This approach aims to provide a more holistic view of the digital economy’s development status. Secondly, in terms of constructing the indicator system, traditional subjective weighting methods often introduce considerable uncertainty. To address this, the paper employs an objective entropy weight method for constructing the digital economy index, thereby enhancing the evaluation’s objectivity and precision. Lastly, the paper conducts an in-depth analysis of the dynamic changes in the digital economy’s development across China’s four major regions. This analysis utilizes kernel density estimation, the Dugam Gini coefficient, spatial correlation analysis, and the local G index, and it covers three dimensions: spatiotemporal evolution, regional differences and their decomposition, and both global and local spatial correlations.

3. Research Methods, Index System and Data Sources

3.1. Research Methods

3.1.1. Entropy Weight Method

This study determines the weights of each indicator of the digital economy development level of 30 provinces (autonomous regions and municipalities) in China using the objective weighting technique—the entropy weighting method. Subjective weighting methods, such as the Analytic Hierarchy Process (AHP), inherently contain elements of subjectivity in weight determination, potentially compromising the objectivity of the comprehensive evaluation index. Quantitative weighting methods, including principal component analysis and the entropy weight method, are also utilized. Notably, principal component analysis can introduce errors in post-dimensionality reduction and is highly sensitive to outliers or extreme values. Consequently, after careful consideration, we have opted for the entropy weight method to determine the DE value, which effectively balances the conflict and independence of indicators to ensure a more rational weighting.
The entropy weight method is based on the size of the information provided by the observations of the indicators to determine the weight of the indicators; the greater the degree of data discretization, the greater the amount of information; the entropy value is also smaller, it should be given a greater weight; the smaller the degree of data discretization, the smaller the amount of information; the entropy value is also larger, it should be given a smaller weight. The specific steps are as follows:
(1)
Standardization of data
It is required to first normalize the data of the indicators due to variations in the data outline of the indicators. All of the indicators in the indicator system built in this research are positive. The standardization processing approach for the positive indications is:
Z i j t = X i j t M i n ( X i j t ) M a x ( X i j t ) M i n ( X i j t ) , i = 1 , , m , j = 1 , , n , t = 1 , , T
Assume that the research object involves m provinces, the indicator system contains n indicators, and the time span is T, and X i j t is the original value of the j indicator of province i in period T. Z i j t is the index value of the j indicator of province i after standardized processing in period T, M i n ( X i j t ) is the minimum value of the original value of the j indicator of each province in period T, and M a x ( X i j t ) is the maximum value of the original value of the j indicator of each province in period T.
(2)
Determine the indicators’ weights
Determine the standardized weight P i j t of province j index:
P i j t = Z i j t i = 1 n Z i j t , i = 1 , , m , j = 1 , , n , t = 1 , , T
Determine the entropy of information E j of index j :
E j = 1 ln n i = 1 m t = 1 T P ijt ln P i j t , j = 1 , , n , t = 1 , , T
Determine the information utility value D j of index j :
D j = 1 E j , j = 1 , , n
Determine the weight W j of each indicator:
W j = D j j = 1 n D j , j = 1 , , n
(3)
Determine each sample’s overall score. The comprehensive score is computed using the following formula:
D E = i = 1 m W j × Z i j t , i = 1 , , m , j = 1 , , n , t = 1 , , T

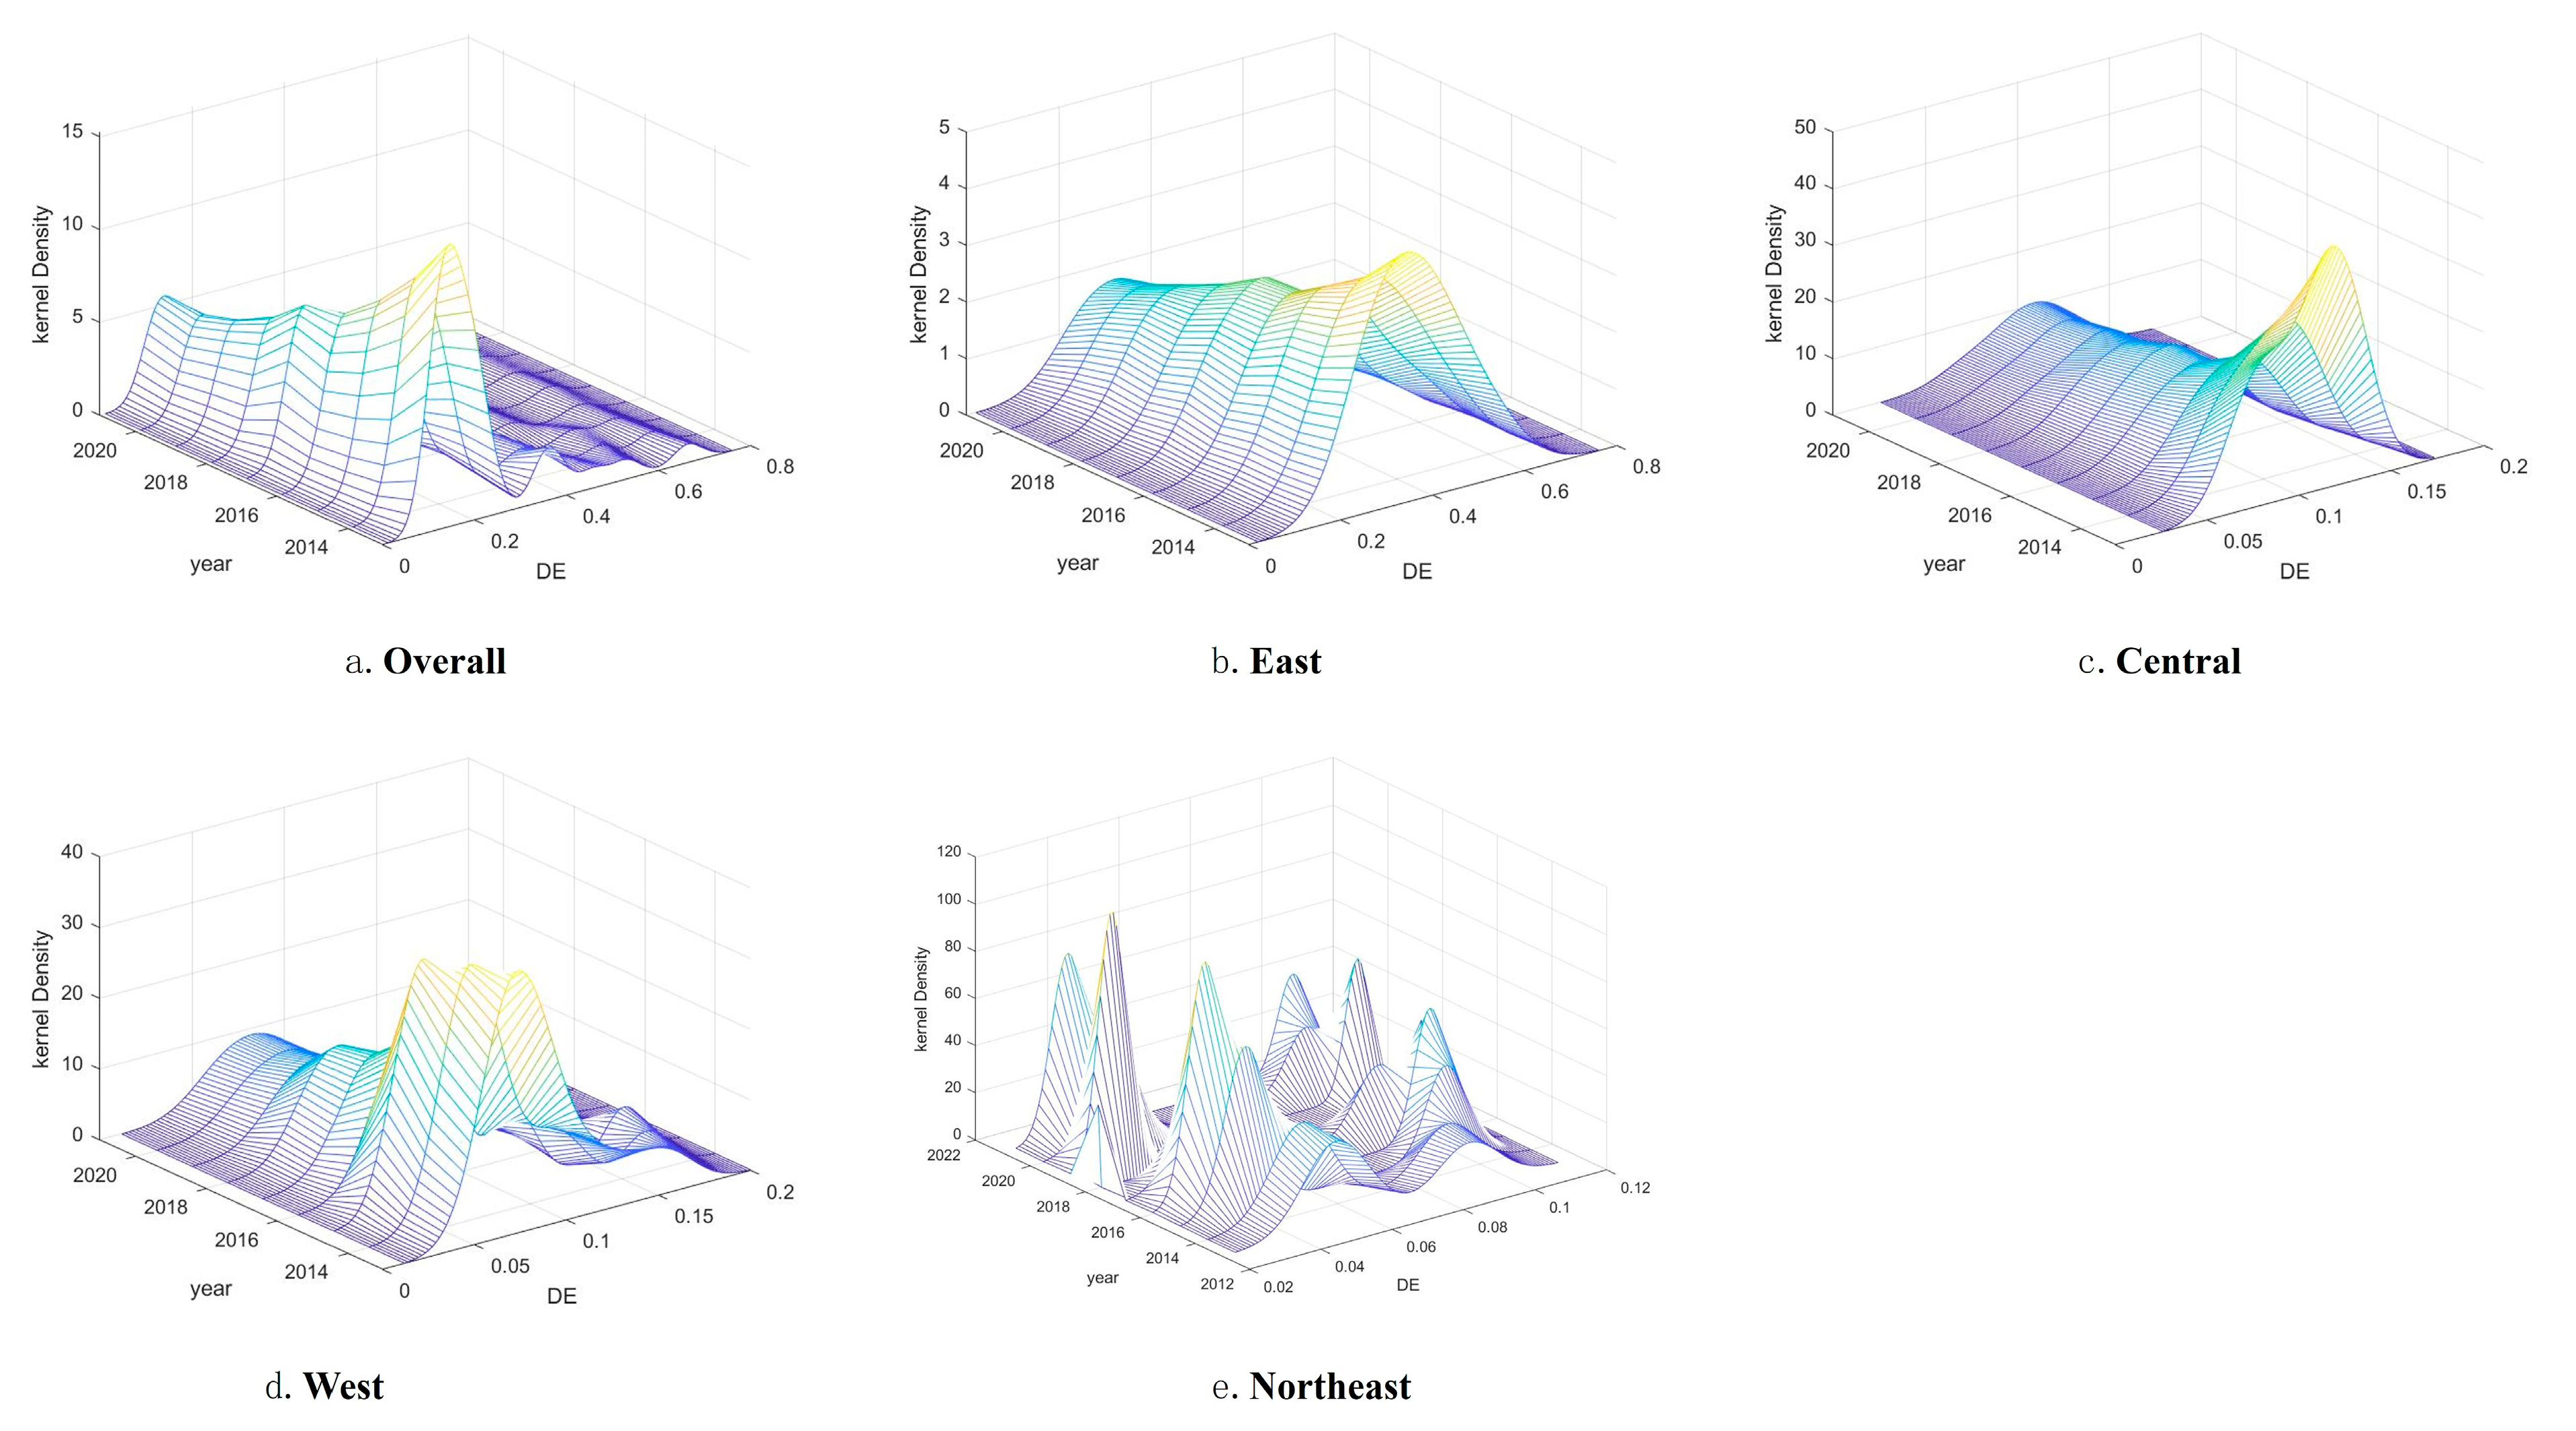
3.1.2. Three-Dimensional Kernel Density Estimation

Kernel density estimation (KDE) is a non-parametric approach that employs a Gaussian kernel function to estimate the probability density from sample data [14]. This method integrates each data point with a specified bandwidth into the kernel function, leading to the formation of a continuous estimation curve through superposition [35]. Owing to its minimal dependency on underlying models and superior statistical characteristics, KDE is extensively utilized in the analysis of non-uniform spatial distributions. In this article, a three-dimensional kernel density graph is used to illustrate the distribution, location, and extent of digital economic development over time. Assume f ( u , v ) is the joint kernel density estimation function of the two-dimensional random variable ( u , v ) , and the calculation formula is:
f u , v = 1 n h u h v i = 1 n K u u u i h u K v v v i h v ,   i = 1,2 , , n
Among them, n is the number of observations, h u and h v are the bandwidths of variables u and v, respectively. K u · and K v · are kernel functions, and for each data point, u i and v i   weights are assigned to the points in the surrounding area.

3.1.3. Dagum Gini Coefficient and Decomposition

This paper uses the Gini coefficient and its decomposition method proposed by Dagum (1998) to study the regional differences in the level of digital economic development in China’s four major economic regions of East, Central, West, and Northeast and their sources of differences [36]. This method fully evaluates the distribution of sub-samples, effectively solves the problem of cross-overlapping between sample data and the source of regional differences, and overcomes the limitations of the traditional Gini coefficient and the Theil index [37]. The overall Gini coefficient calculation formula is as follows:
G = j = 1 k h = 1 k i = 1 n j r = 1 n h y j i y h r / 2 n 2 y ¯
Among them, k represents the number of four major regions, j and h represent a single region, i , and r represent the provinces within the corresponding j h region. n j n h respectively represents the number of provinces within the j h region, y j i y h r represents the level of digital economic development of each province within the j h region, and y ¯ j represents the average level of digital economic development within the region. G represents the total Gini coefficient, which can be decomposed into the contribution of inter-group differences ( G n b ) , intra-group differences G w , and the contribution of hyper-variable density differences G t , and satisfies G = G w + G n b + G t . The specific decomposition formula is as follows:
G w = j = 1 k G j j P j S j
G j j = 1 2 y ¯ i = 1 c j r = 1 c j y j i y j r / c j 2
G n b = j = 1 k h = 1 j 1 G j h P j S h + P h S j D j h
G t = j = 1 k h = 1 j 1 G j h P j S h + P h S j 1 D j h
G t = i = 1 c j r = 1 c h y j i y j r / c j c h y ¯ j + y ¯ h
Among them, P j = n j / n represents the ratio of the number of provinces in region j to the total number of provinces, s j = n j y ¯ / n y ¯ j = 1,2 , , k ; D j h represents the relative impact of the level of digital economic development between regions j and h ; d j h represents the difference in digital economic development levels between regions, which can be interpreted as the mathematical expectation of all sample values satisfying the condition y j i y h r > 0 ;   P j h represents the hyper-variance step, representing the mathematical expectation of all sample values satisfying the condition y j i y h r < 0 in region h ; F i F h is the cumulative density distribution function of region j h . The specific calculation formula is as follows:
D j h = d j h P j h d j h + P j h
d j h = 0 d F j y 0 y y x d F h ( x )
P i j = o d F h y 0 y y x d F j ( x )

3.1.4. Spatial Autocorrelation

Global Spatial Autocorrelation (Global Moran’s I) determines whether there is spatial agglomeration by evaluating the distribution relationship and correlation degree of the research elements in space. Spatial autocorrelation measures the degree of clustering of patterns by calculating the similarity between different spatial locations. If the similarity between different locations is high, it indicates that the spatial pattern shows a clustered trend; if the similarity is low, it indicates that the spatial pattern shows a discrete or random trend. The global spatial autocorrelation formula is as follows [38]:
I = n i = 1 n j = 1 n W i j ( x i x ¯ ) ( x j x ¯ ) ( i = 1 n j = 1 n W i j ) i = 1 n ( x i x ¯ ) 2
The global autocorrelation index cannot analyze local spatial laws and spatial differences, so the local spatial autocorrelation index (Local Indicators of Spatial Association, LISA) is needed to examine local areas. The local spatial autocorrelation index can be classified according to the degree of spatial agglomeration in different regions, so as to better describe the distribution law of the research elements in space. The local spatial autocorrelation formula is as follows:
I i = n ( x i x ¯ ) i j n W i j ( x i x ¯ ) i = 1 n ( x i x ¯ ) 2
Among them, n is the total number of samples for spatial analysis, which in this paper refers to the total number of provincial and equivalent regional divisions; x i and x j are the values of attribute x on elements i and j ; x i and x j are the digital economic development levels of provinces i and j, respectively; W i j is the spatial weight between i and j . x ¯ is the average digital economic development level of the province, and i = 1 n x i x ¯ 2 is the variance of the digital economic development level of the province. I is the global Moran’s index, which indicates the global spatial correlation of the provincial digital economic development level, and its value range is [−1,1]. I i is the local Moran’s index, which reflects the correlation of the digital economic development levels between adjacent provinces [15].

3.1.5. Local G Index

The local G index is an indicator used to study spatial statistical data, also known as hot and cold spot analysis. It can be used to measure the degree of aggregation around a certain point in space, that is, whether there is a significant difference in a certain area compared with its surrounding areas. This is known as the phenomenon of spatial agglomeration or dispersion. The Getis-Ord G i statistic has a different focus from the Moran’s I. The Getis-Ord G i statistic has the advantage of distinguishing high-value and low-value clusters, and is particularly sensitive to high-value ones [39]. By calculating the Getis-Ord G i index and Z value, the dependence of variables on space is quantified [40]. If the Z value is greater than 0, it indicates that there is positive spatial autocorrelation in the region, that is, there is a tendency of spatial agglomeration; if the Z value is less than 0, it indicates that there is negative spatial autocorrelation in the region, that is, there is a tendency of spatial dispersion; if the value of Z is close to 0, it indicates that there is a random spatial distribution in the area.
The calculation formula of the local G index is as follows [41]:
G i * = i = 1 k j = 1 k W i j X i X j i = 1 k j = 1 k X i X j
z G i * = G i * E ( G i * ) V a r ( G i * )
Among them, K represents the total number of regions; W i j represents the spatial weight matrix; X i and X j represent the attribute values of regions i and j , respectively; E G i * represents the expected value of G i * ; V a r G i * represents the variance coefficient of G i * . Regions with large z G i * values are hot spots; regions with small Z G i * values are cold spots.

3.2. Variable Selection and Data Sources

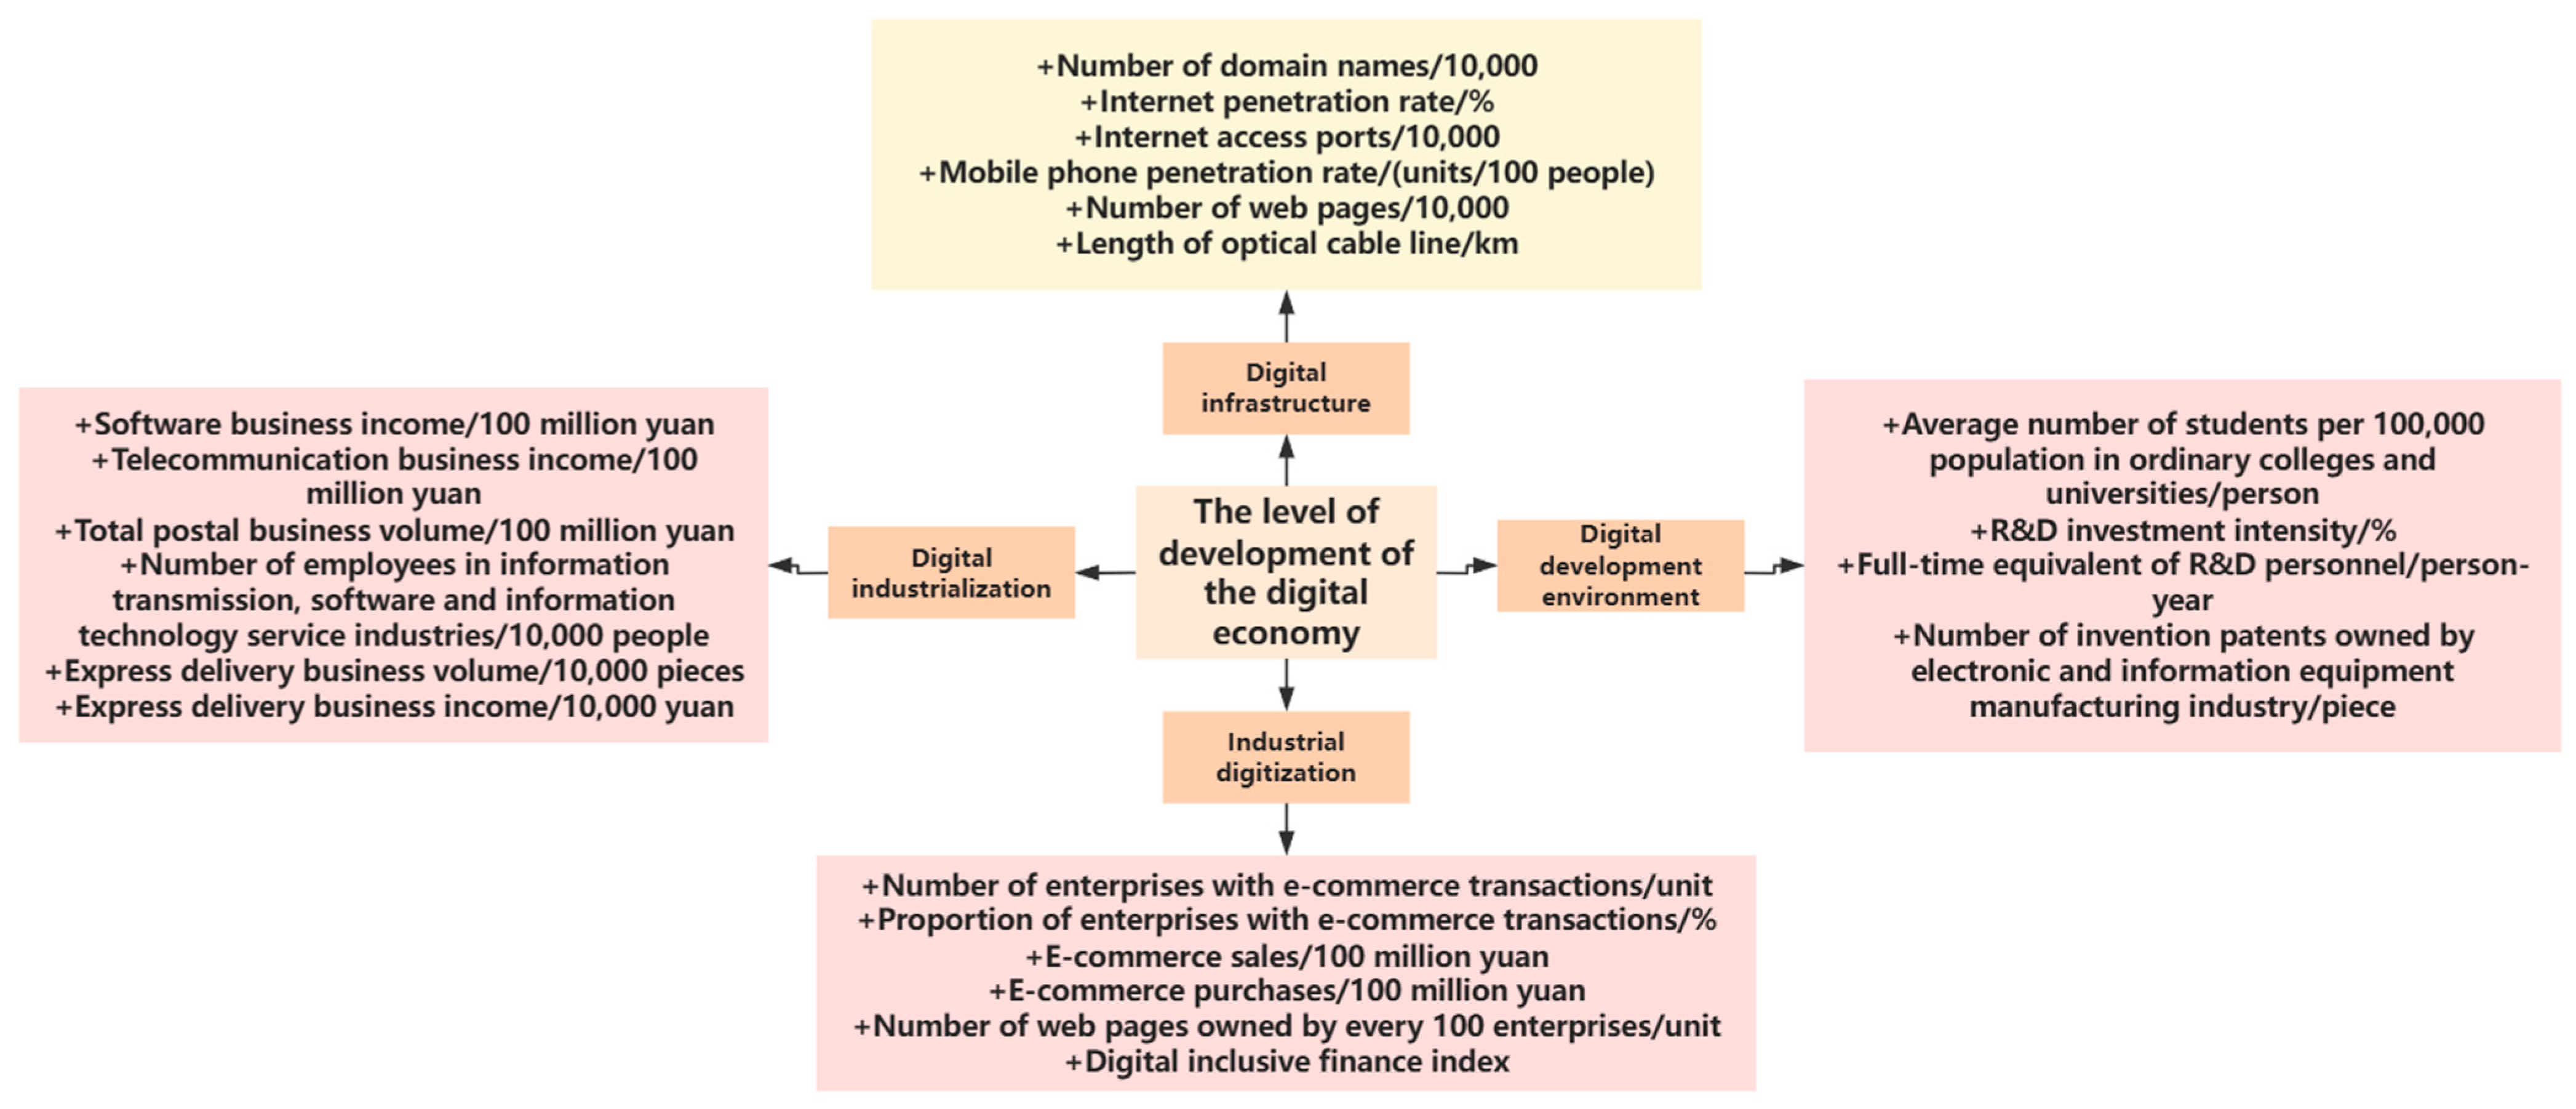
3.2.1. Indicator System Construction

Currently, the definition of the DE remains fluid, with various scholarly approaches to evaluating its developmental level. The existing literature [42] and the G20’s “Digital Economy Development and Cooperation Initiative” outline that the DE is structured around three principal components: digital technology, data resources, and digital infrastructure, all crucial for its growth. The China Academy of Information and Communications Technology introduces two fundamental concepts: digital industrialization, forming the base layer of the DE, and industrial digitalization, which enhances the efficiency of traditional sectors.
This research incorporates multiple facets of digital economic growth, including infrastructure build-out, industry development, sector integration, and innovation climates. The study develops an evaluation framework for the DE’s development level from four perspectives: digital infrastructure, digital industrialization, industrial digitalization, and digital innovation. It establishes a comprehensive system with 22 sub-indicators detailed in Figure 1. Utilizing the entropy weight method, these sub-indicators are normalized and weighted objectively, forming a province-specific index for digital economic development, designated as the digi index.

3.2.2. Data Sources

Given the practicality of the study and data accessibility, this research utilizes panel data from 30 Chinese provinces spanning from 2013 to 2021 to gauge the development level of the DE and examine its spatiotemporal patterns and regional disparities. This analysis also investigates the impact of technological innovation on the DE’s growth. The data are mainly sourced from the China Electronic Information Industry Statistical Yearbook, the China Regional Economic Statistical Yearbook, and the China High-Tech Statistical Yearbook. Due to serious data omissions, the Tibet region was not included in the analysis. In order to provide comprehensive coverage, the missing data in the dataset were processed using interpolation methods. The analysis results of the digital economy development levels are shown in Table 1.

4. Characteristics of the Spatiotemporal Evolution of the DE

4.1. Time Series Evolution Characteristics

In accordance with the official guidelines on national administrative divisions, China’s 30 provinces are organized into four principal regions: East, Central, West, and Northeast. Figure 2 illustrates the mean development level of the DE across these regions. Generally, the progression of the DE in various mainland Chinese provinces has maintained a consistent rise, although there was a noticeable dip from 2020 to 2021. The onset of the COVID-19 pandemic in 2019 profoundly influenced China’s economy. While the surge in remote work and e-commerce accelerated the expansion of the digital economy, the widespread halt in industrial production and commercial activities delivered considerable economic repercussions. Viewed from a regional angle, the disparity in development levels across different areas remains marked:
The proportion of the DE in the eastern region has shown steady growth, from about 0.05 in 2013 to nearly 0.30 in 2021. This shows that the DE in the eastern region is developing much faster than other regions, mainly due to its advanced infrastructure, strong innovation atmosphere, and strong policy support.
Although the growth rate in the Central and Western regions is slower, they also show a continued upward trend. The Central region increased from about 0.05% to about 0.15, and the Western region increased from nearly 0.05 to about 0.10. Although the growth of these two regions is not as good as that of the East, in recent years, through the country’s “Western Development” and other policies, infrastructure construction has been gradually strengthened and the growth of the DE has been promoted.
The Northeast region has the slowest growth, increasing slightly from 0.05 in 2013 to about 0.07 in 2021. The transformation of the economic structure in the Northeast is relatively slow and has been greatly affected by the decline of traditional industries, which has inhibited the rapid development of the DE to a certain extent.
In order to further understand the overall trend of digital economic development in different regions and at different times in China, 2013, 2015, 2017, 2019 and 2021 were selected as observation points, and a three-dimensional distribution map of Gaussian kernel density was constructed using Matlab R2024a software. The distribution position and shape were used to characterize the spatiotemporal evolution characteristics of China’s provincial digital economic development level, as shown in Figure 3. In Figure 3a, from the position point of view, the curve is a single-peak bell-shaped distribution and is relatively steep, with a peak at a low level, indicating that the number of provinces with high development levels is relatively small, but their development level is far higher than other provinces. From the shape point of view, the overall peak width is large and the right side tail is serious, indicating that there are large differences in the level of digital economic development, some provinces are far higher than other provinces, and the polarization phenomenon is becoming increasingly serious. In Figure 3b, from the position point of view, the curve also presents a single-peak bell-shaped distribution feature, but compared with (a), the peak width is larger, and the right side of the curve covers a smaller area, indicating that the proportion of high-level provinces (regions, cities) in the Eastern region is small, and the polarization phenomenon is not obvious, but from the perspective of shape, only the peak value showed a fluctuating downward trend during the investigation period, and the other changes in the curve did not differ much, which shows that the development of the DE in the Eastern region is relatively stable, and the situation of the widening internal development gap year by year has not changed. In Figure 3c, from the perspective of position, the single peak shifts to the right and the peak value decreases, indicating that the proportion of provinces with low DE levels is decreasing, and the Central region as a whole shows a positive growth trend. In terms of form, the peak width of the curve decreases over time, and there is no obvious right tail feature, indicating that there is no obvious polarization phenomenon in the region, and the difference in the level of digital economic development is decreasing. In Figure 3d, from the perspective of position, the curve also shows a single peak right shift feature, but from the perspective of form, the peak value decreases and there is a serious right tail phenomenon, indicating that the level of DE in the Western region has increased, but there is a significant polarization phenomenon. In Figure 3e, from the perspective of position, the curve shows a double peak feature, and the peak value fluctuates irregularly, the peak span gradually widens, the development is unstable, and it becomes frequent, showing a multipolarization trend, and the gap within the region is increasing. The right tail is serious in terms of morphology, indicating that there are provinces in the Northeast region with a high level of digital economic development and obvious polarization.

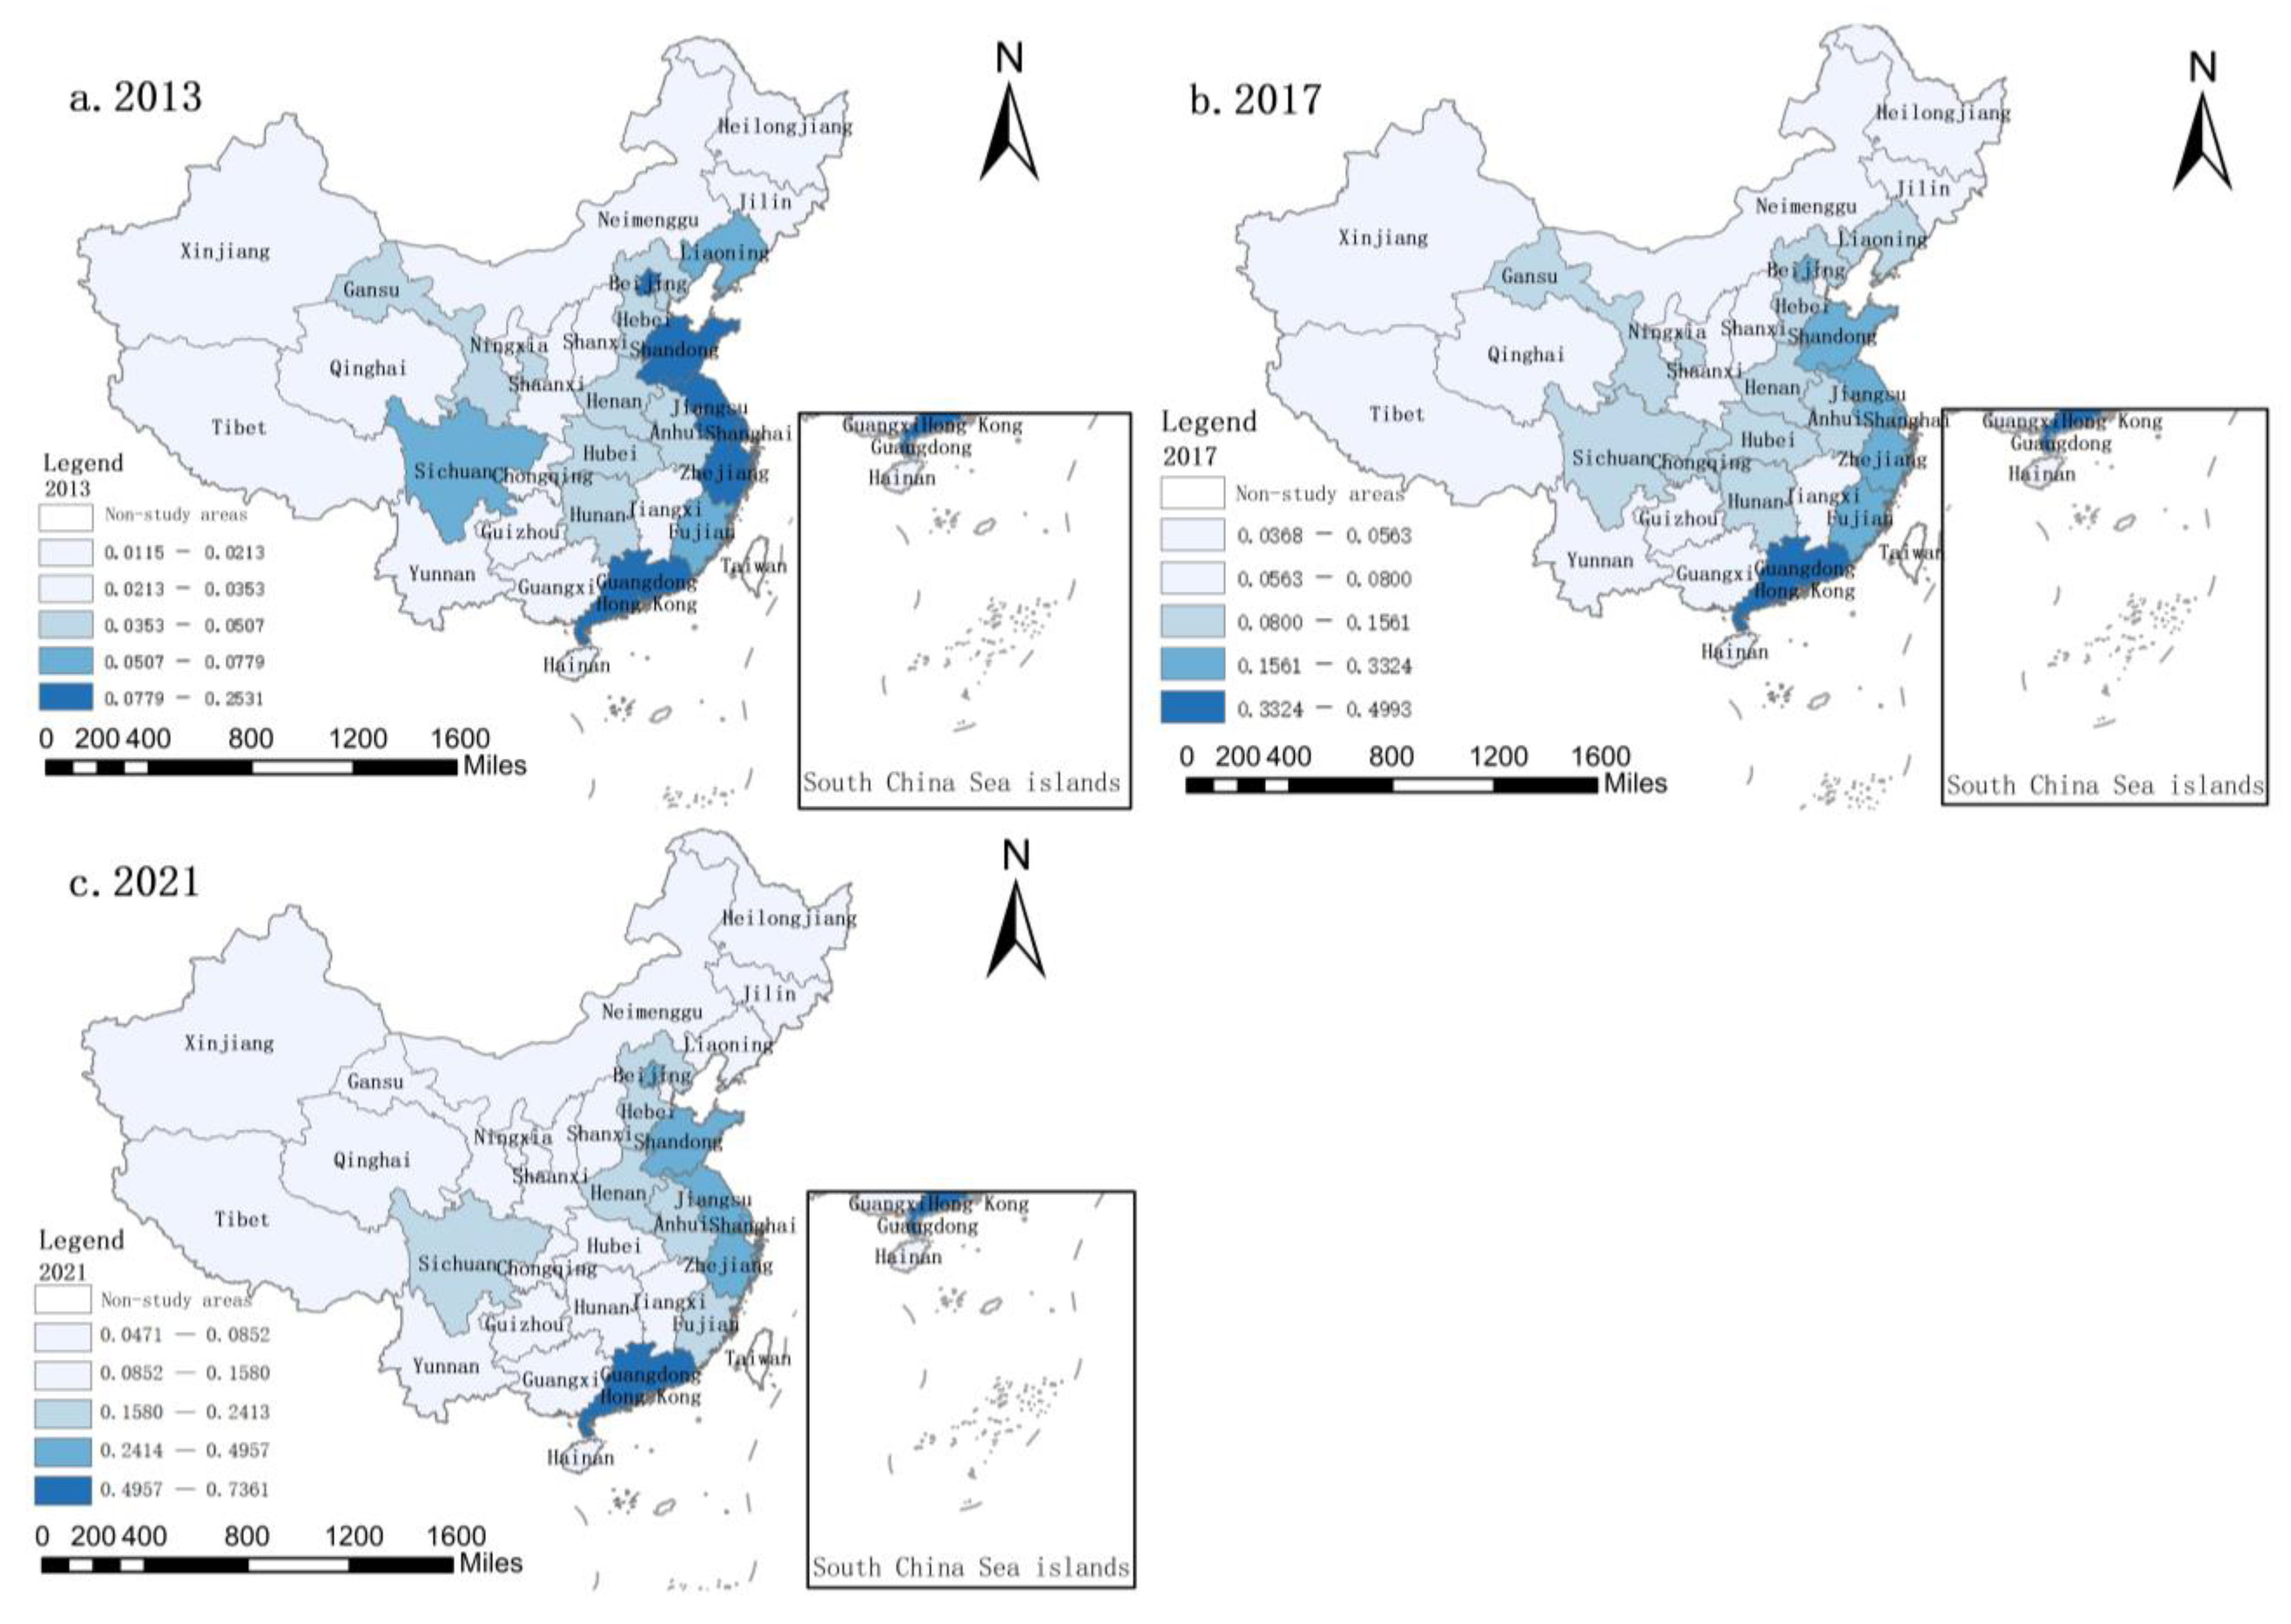
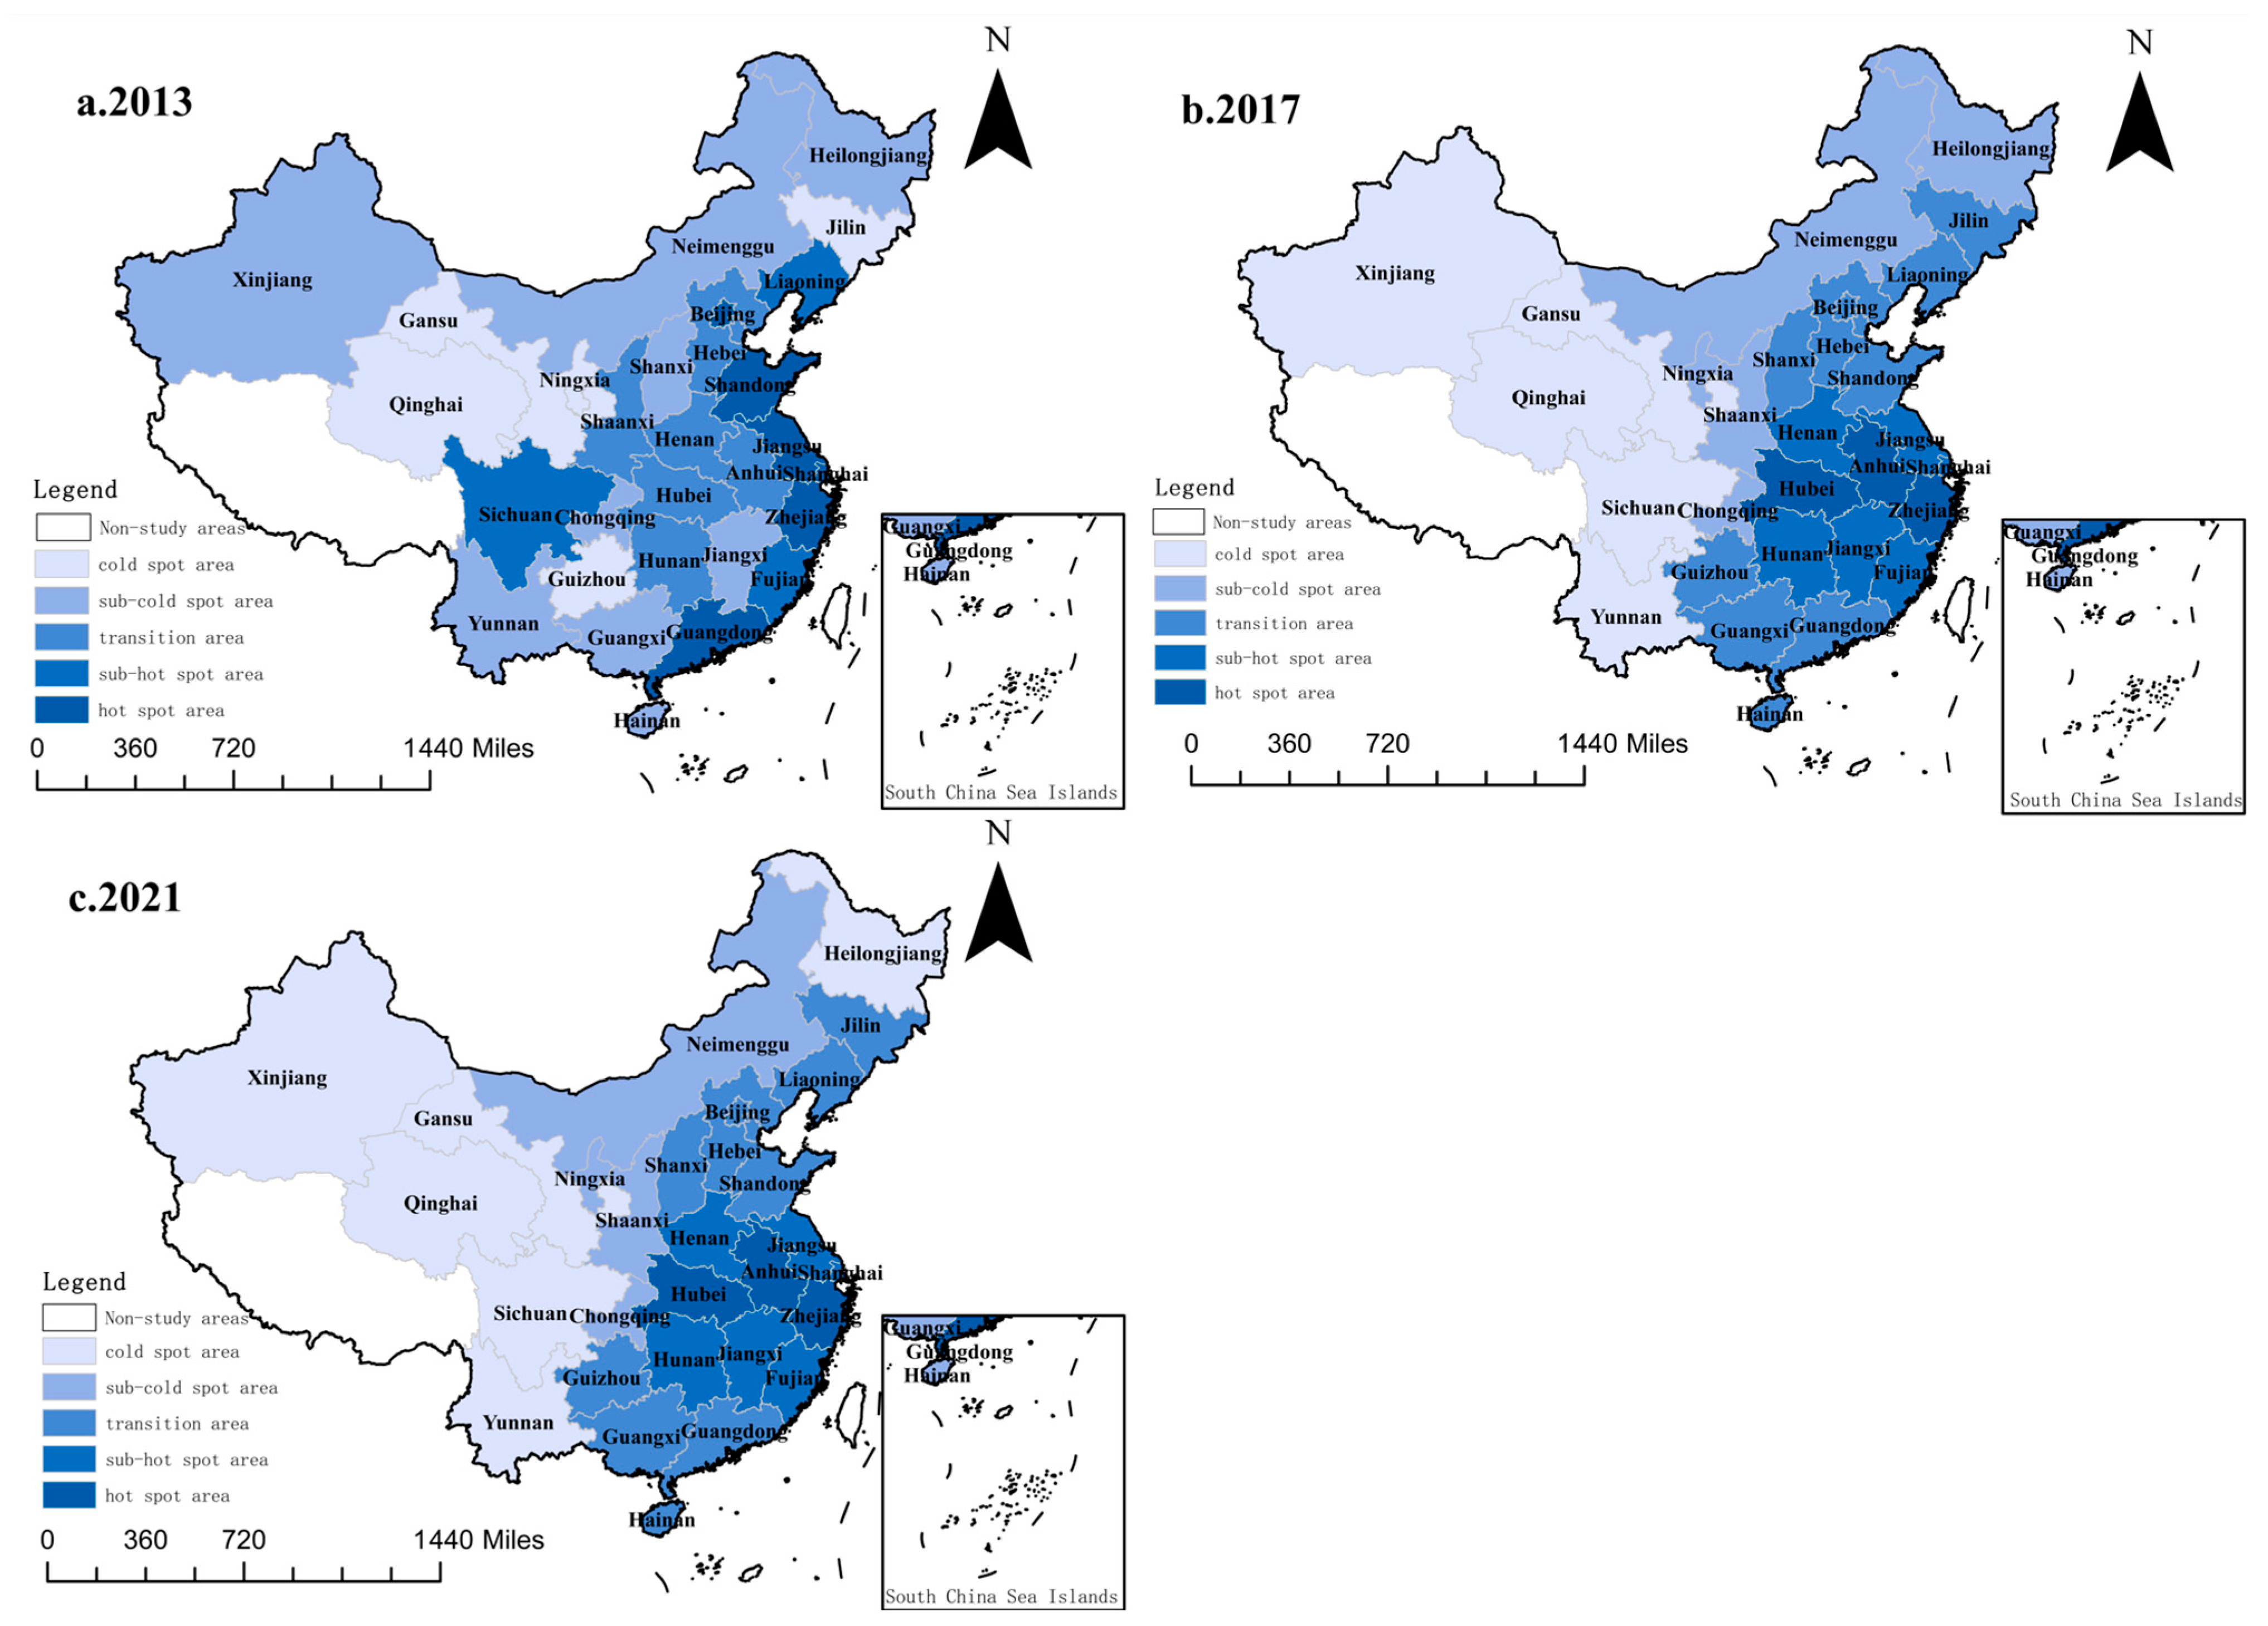
4.2. Spatial Evolution Characteristics

4.2.1. Overall Evolutionary Characteristics

To visually represent the spatial evolution of China’s DE, this study selects three pivotal years: 2013, 2017, and 2021. The development levels are categorized using the natural breakpoint method in ArcGIS 10.8, as depicted in Figure 4.
Predominantly, advanced digital economic development clusters in the southeastern coastal regions of China, progressively spreading inland. This expansion illustrates a diminishing gradient from east to west, with a development pattern increasingly centered around East and South China. Conversely, the DE in the Western and Northeastern regions remains less developed, highlighting stark regional disparities within the country.
Chronologically, in 2013, the digital economic development across provinces was generally modest, with higher development concentrations in southeastern coastal provinces such as Shandong, Jiangsu, Shanghai, Zhejiang, and Guangdong. By 2017, there was a noticeable enhancement in the overall digital economic stature, with the southeastern coast maintaining a developmental lead. The Central and Southwestern regions also exhibited improvements, beginning to reflect a development trajectory that moves from the coast towards the interior. By 2021, while the eastern coastal area continued to dominate the digital economic landscape, there was a significant leap in the development levels of the Central regions, underscoring substantial growth potential.

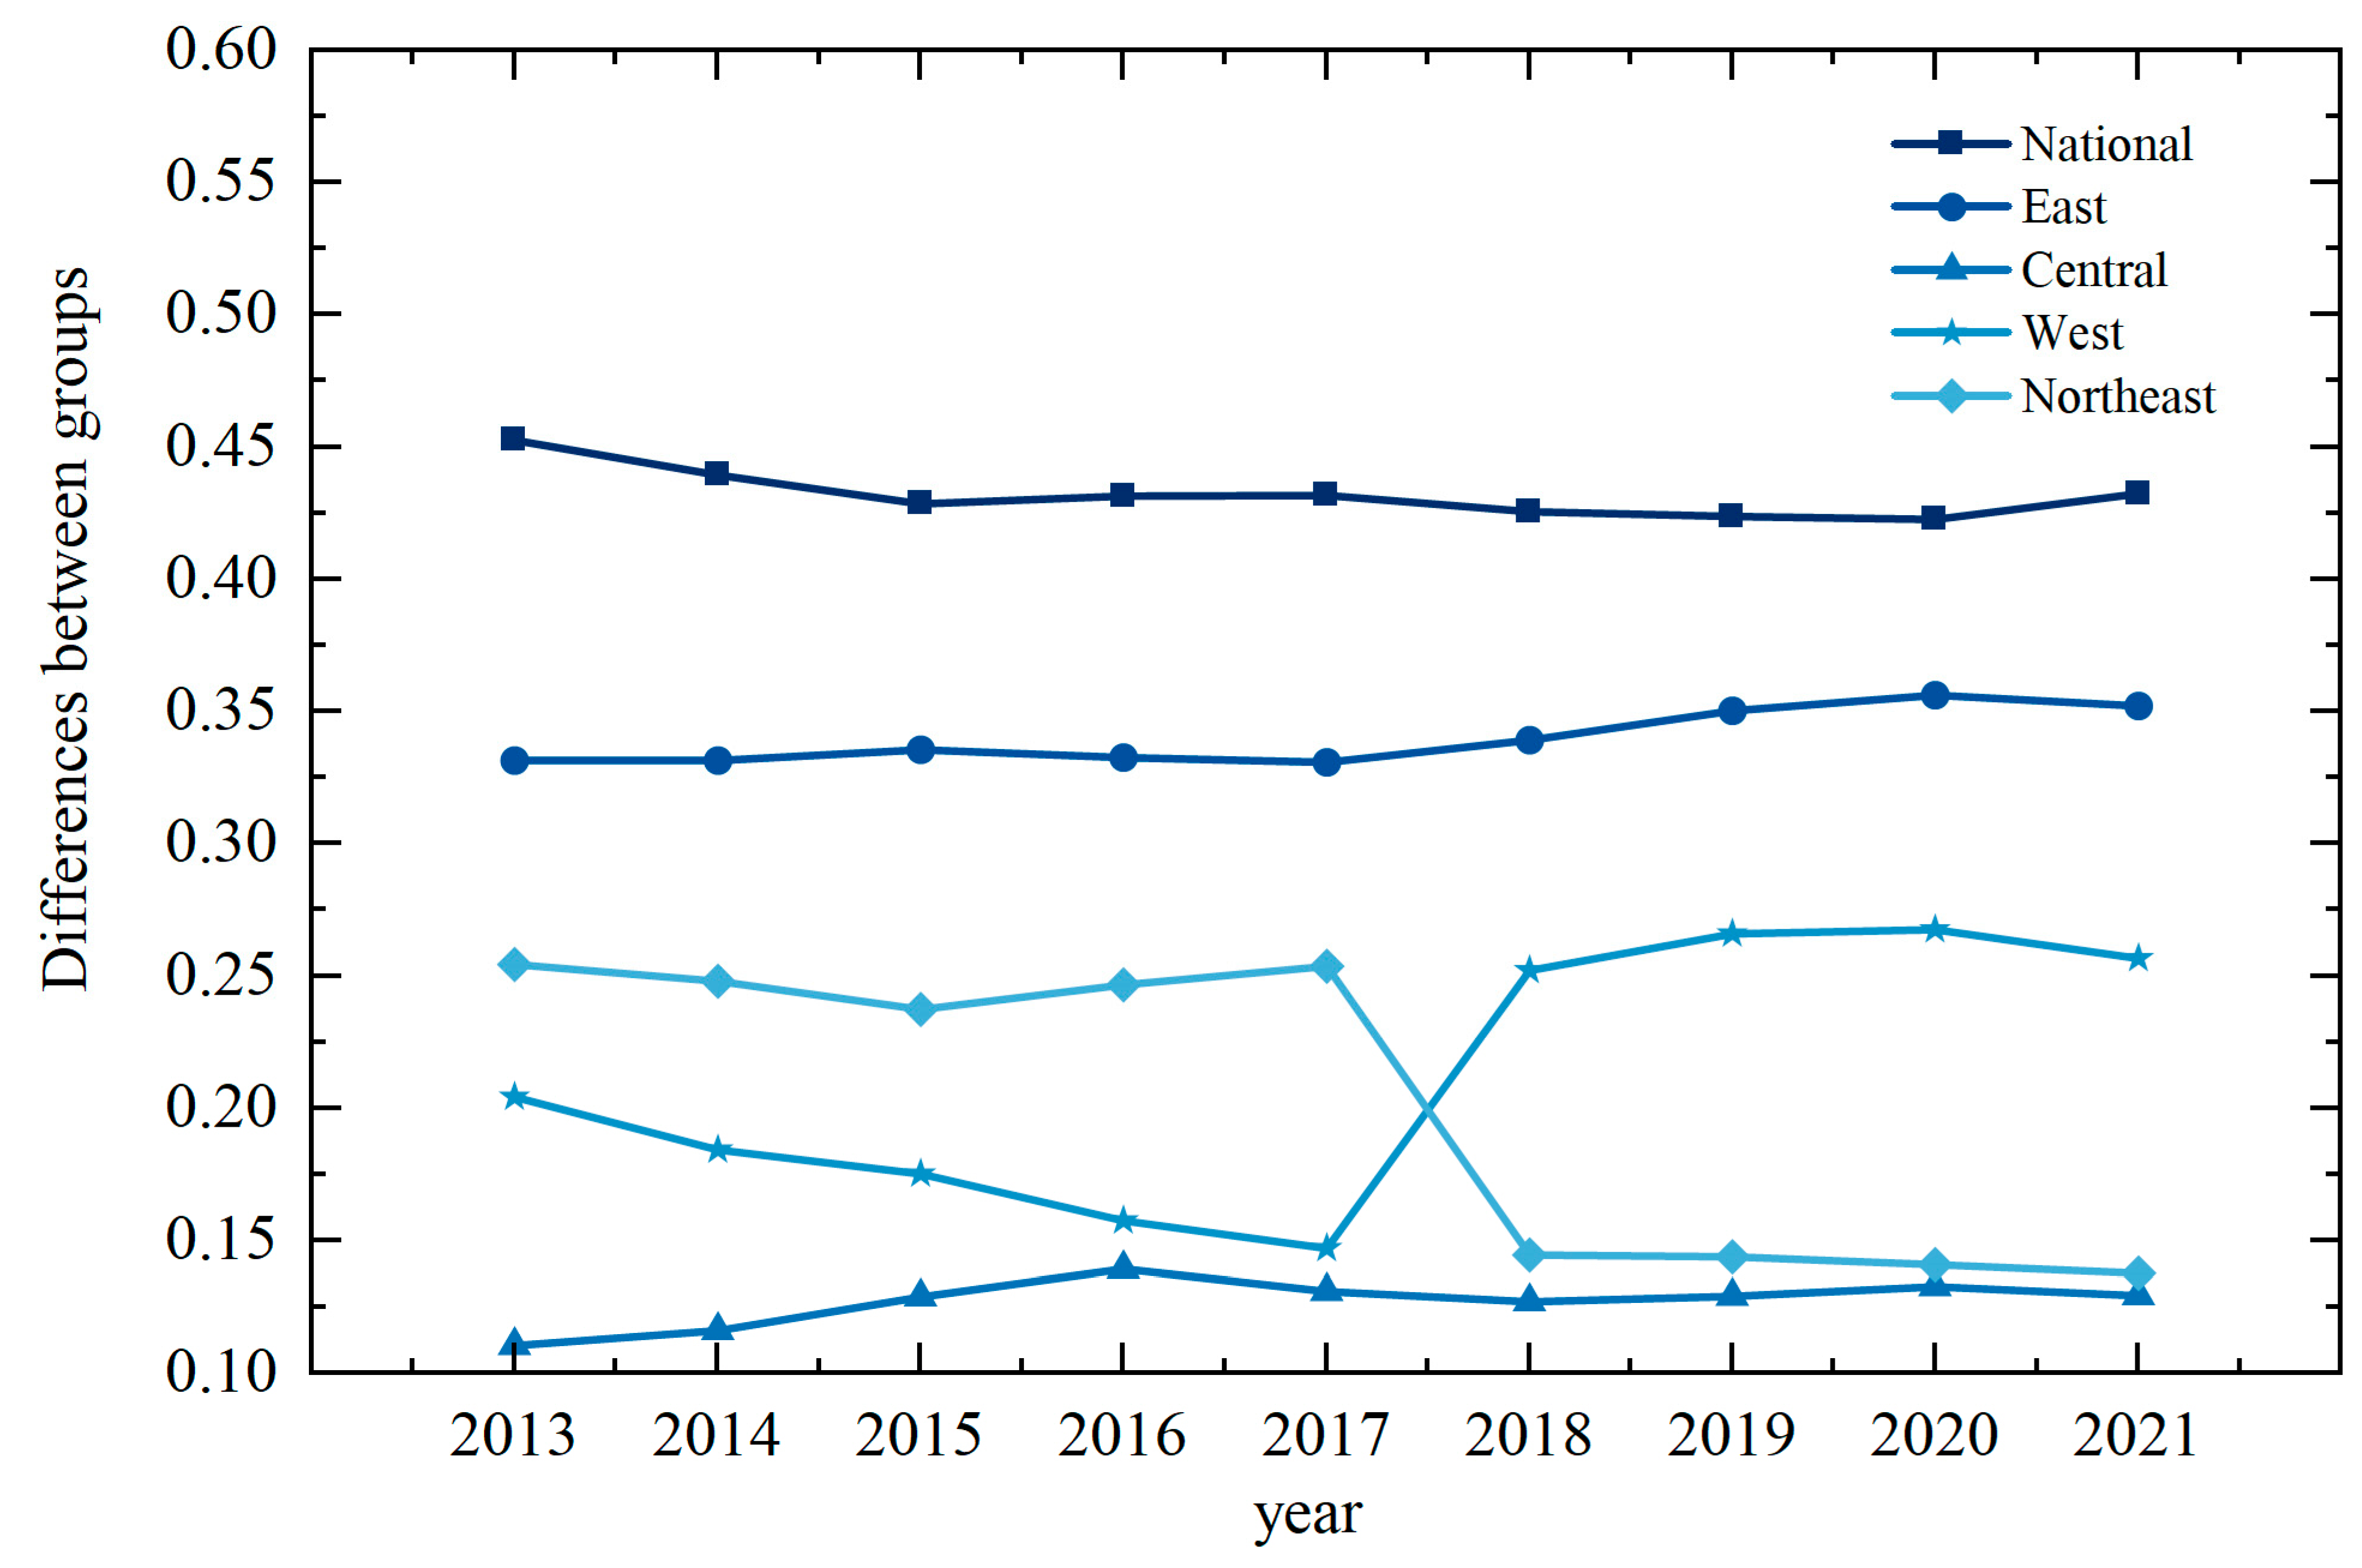
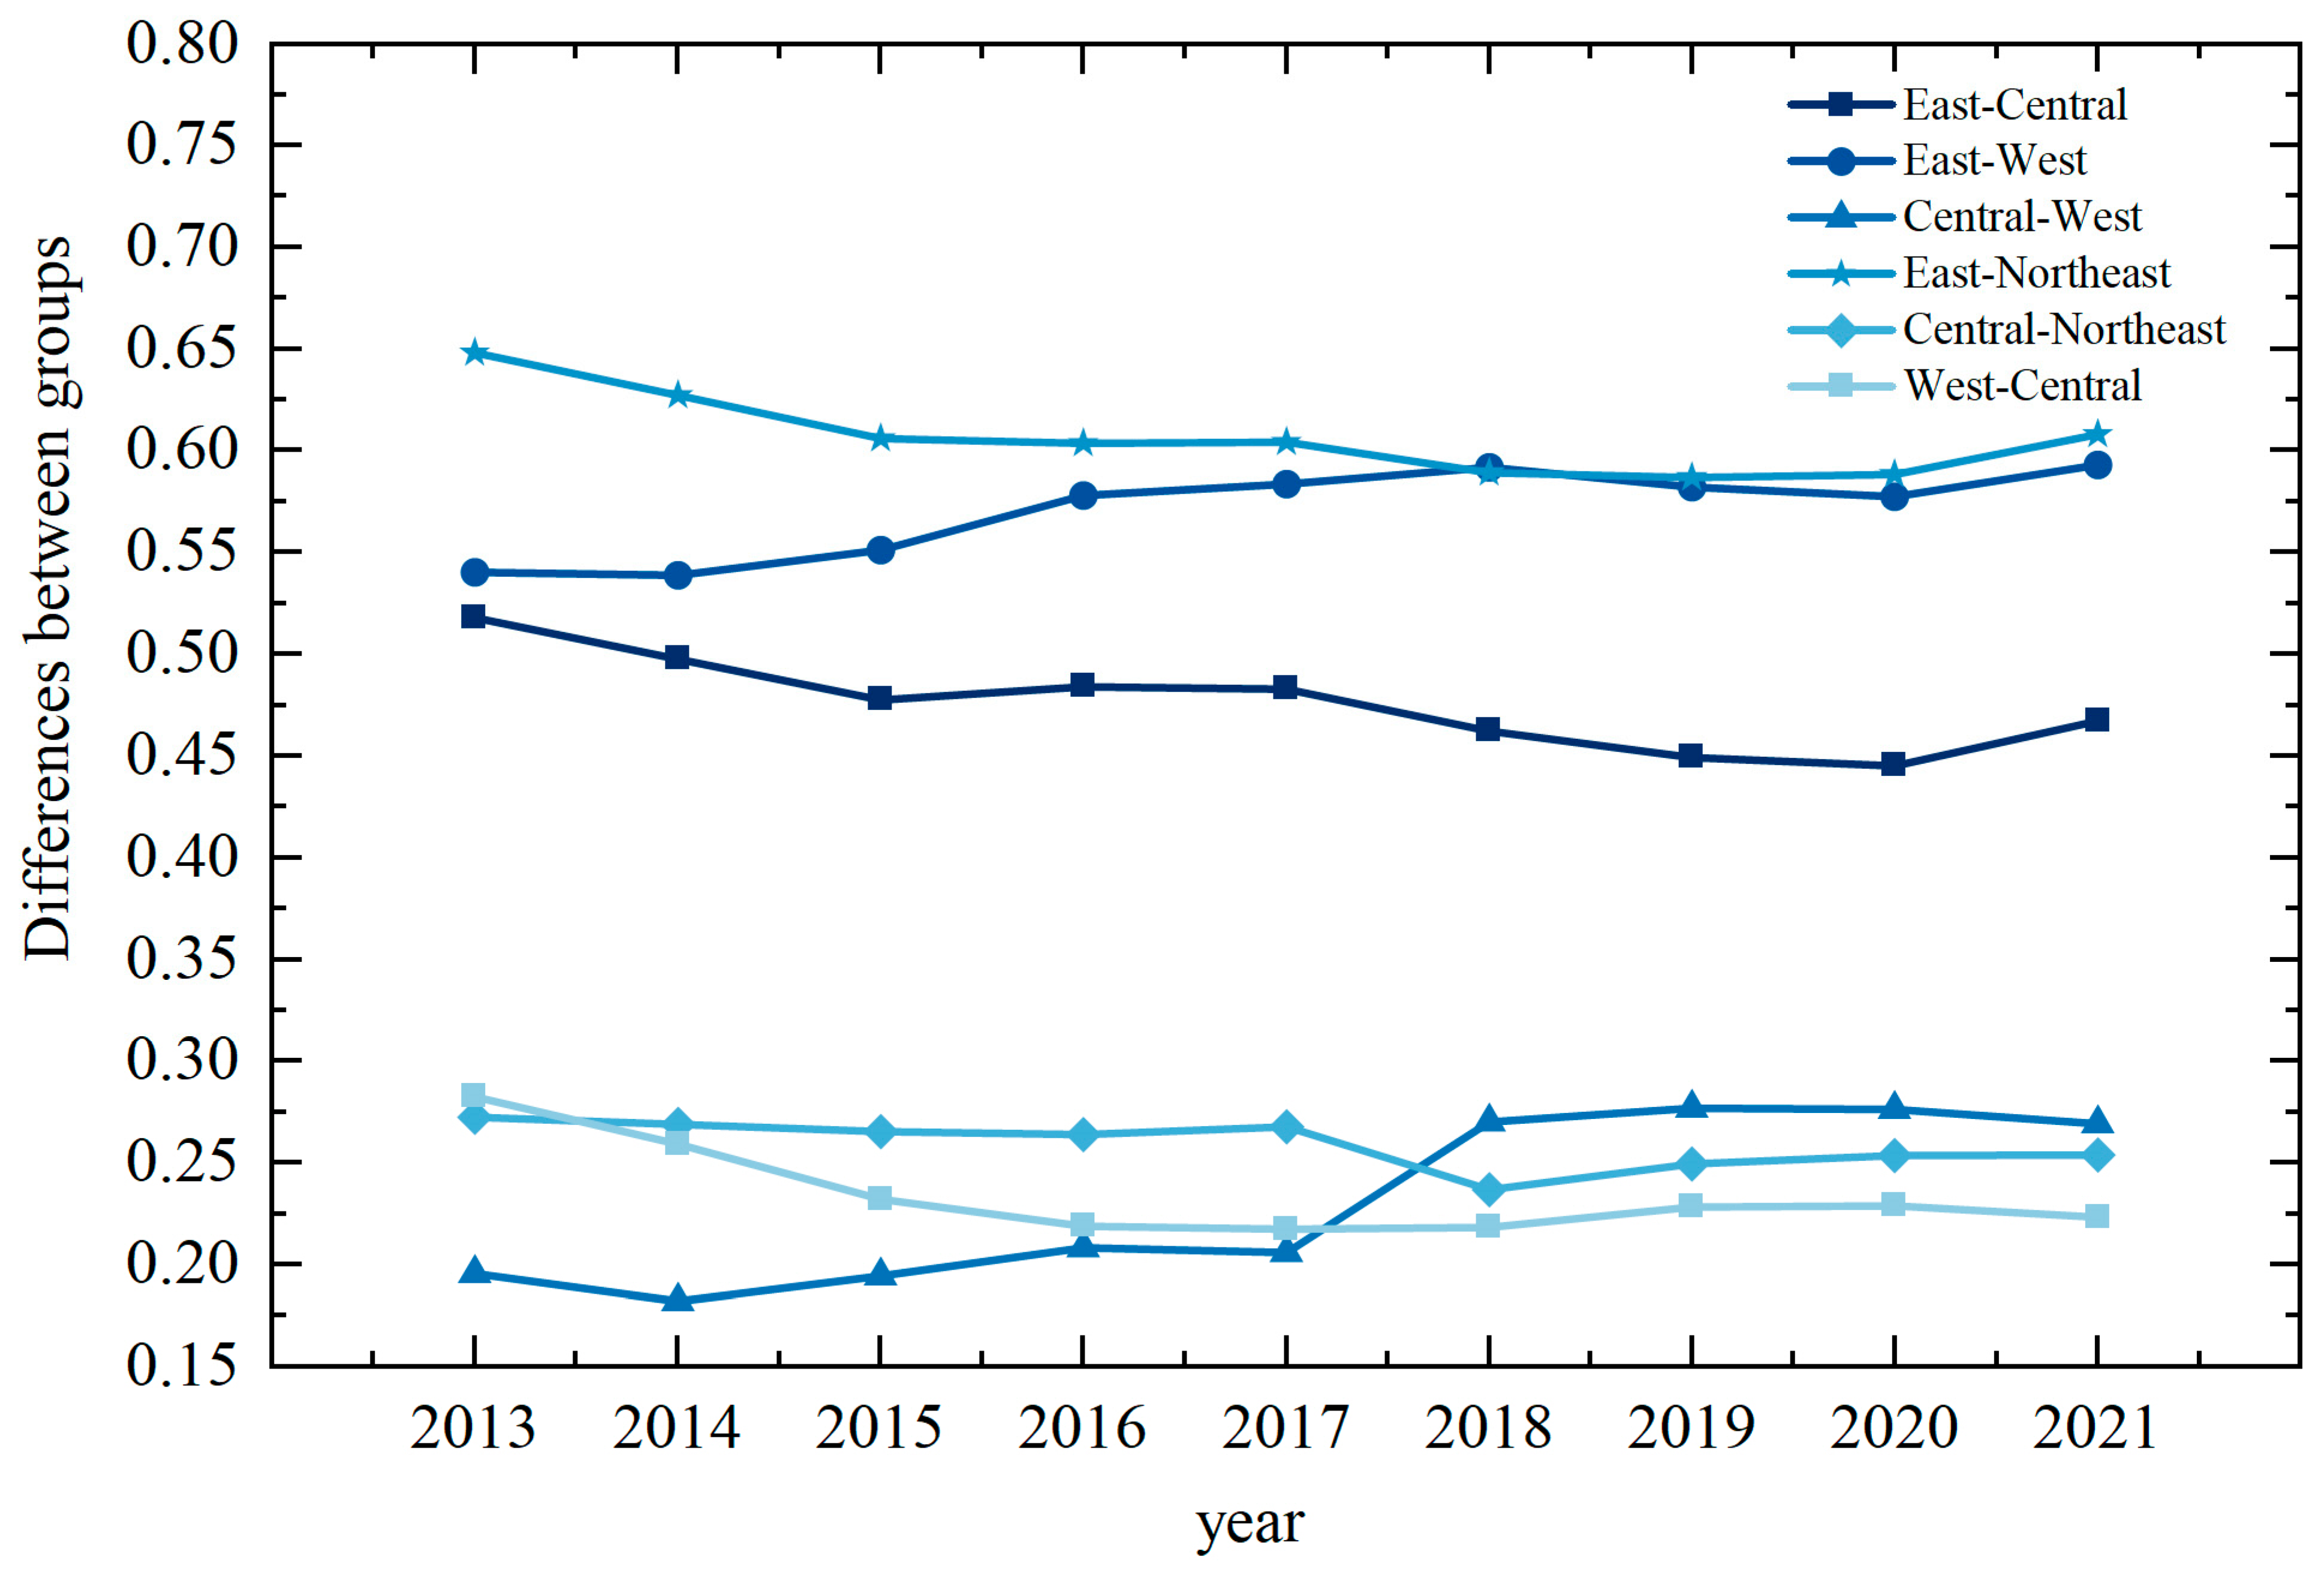
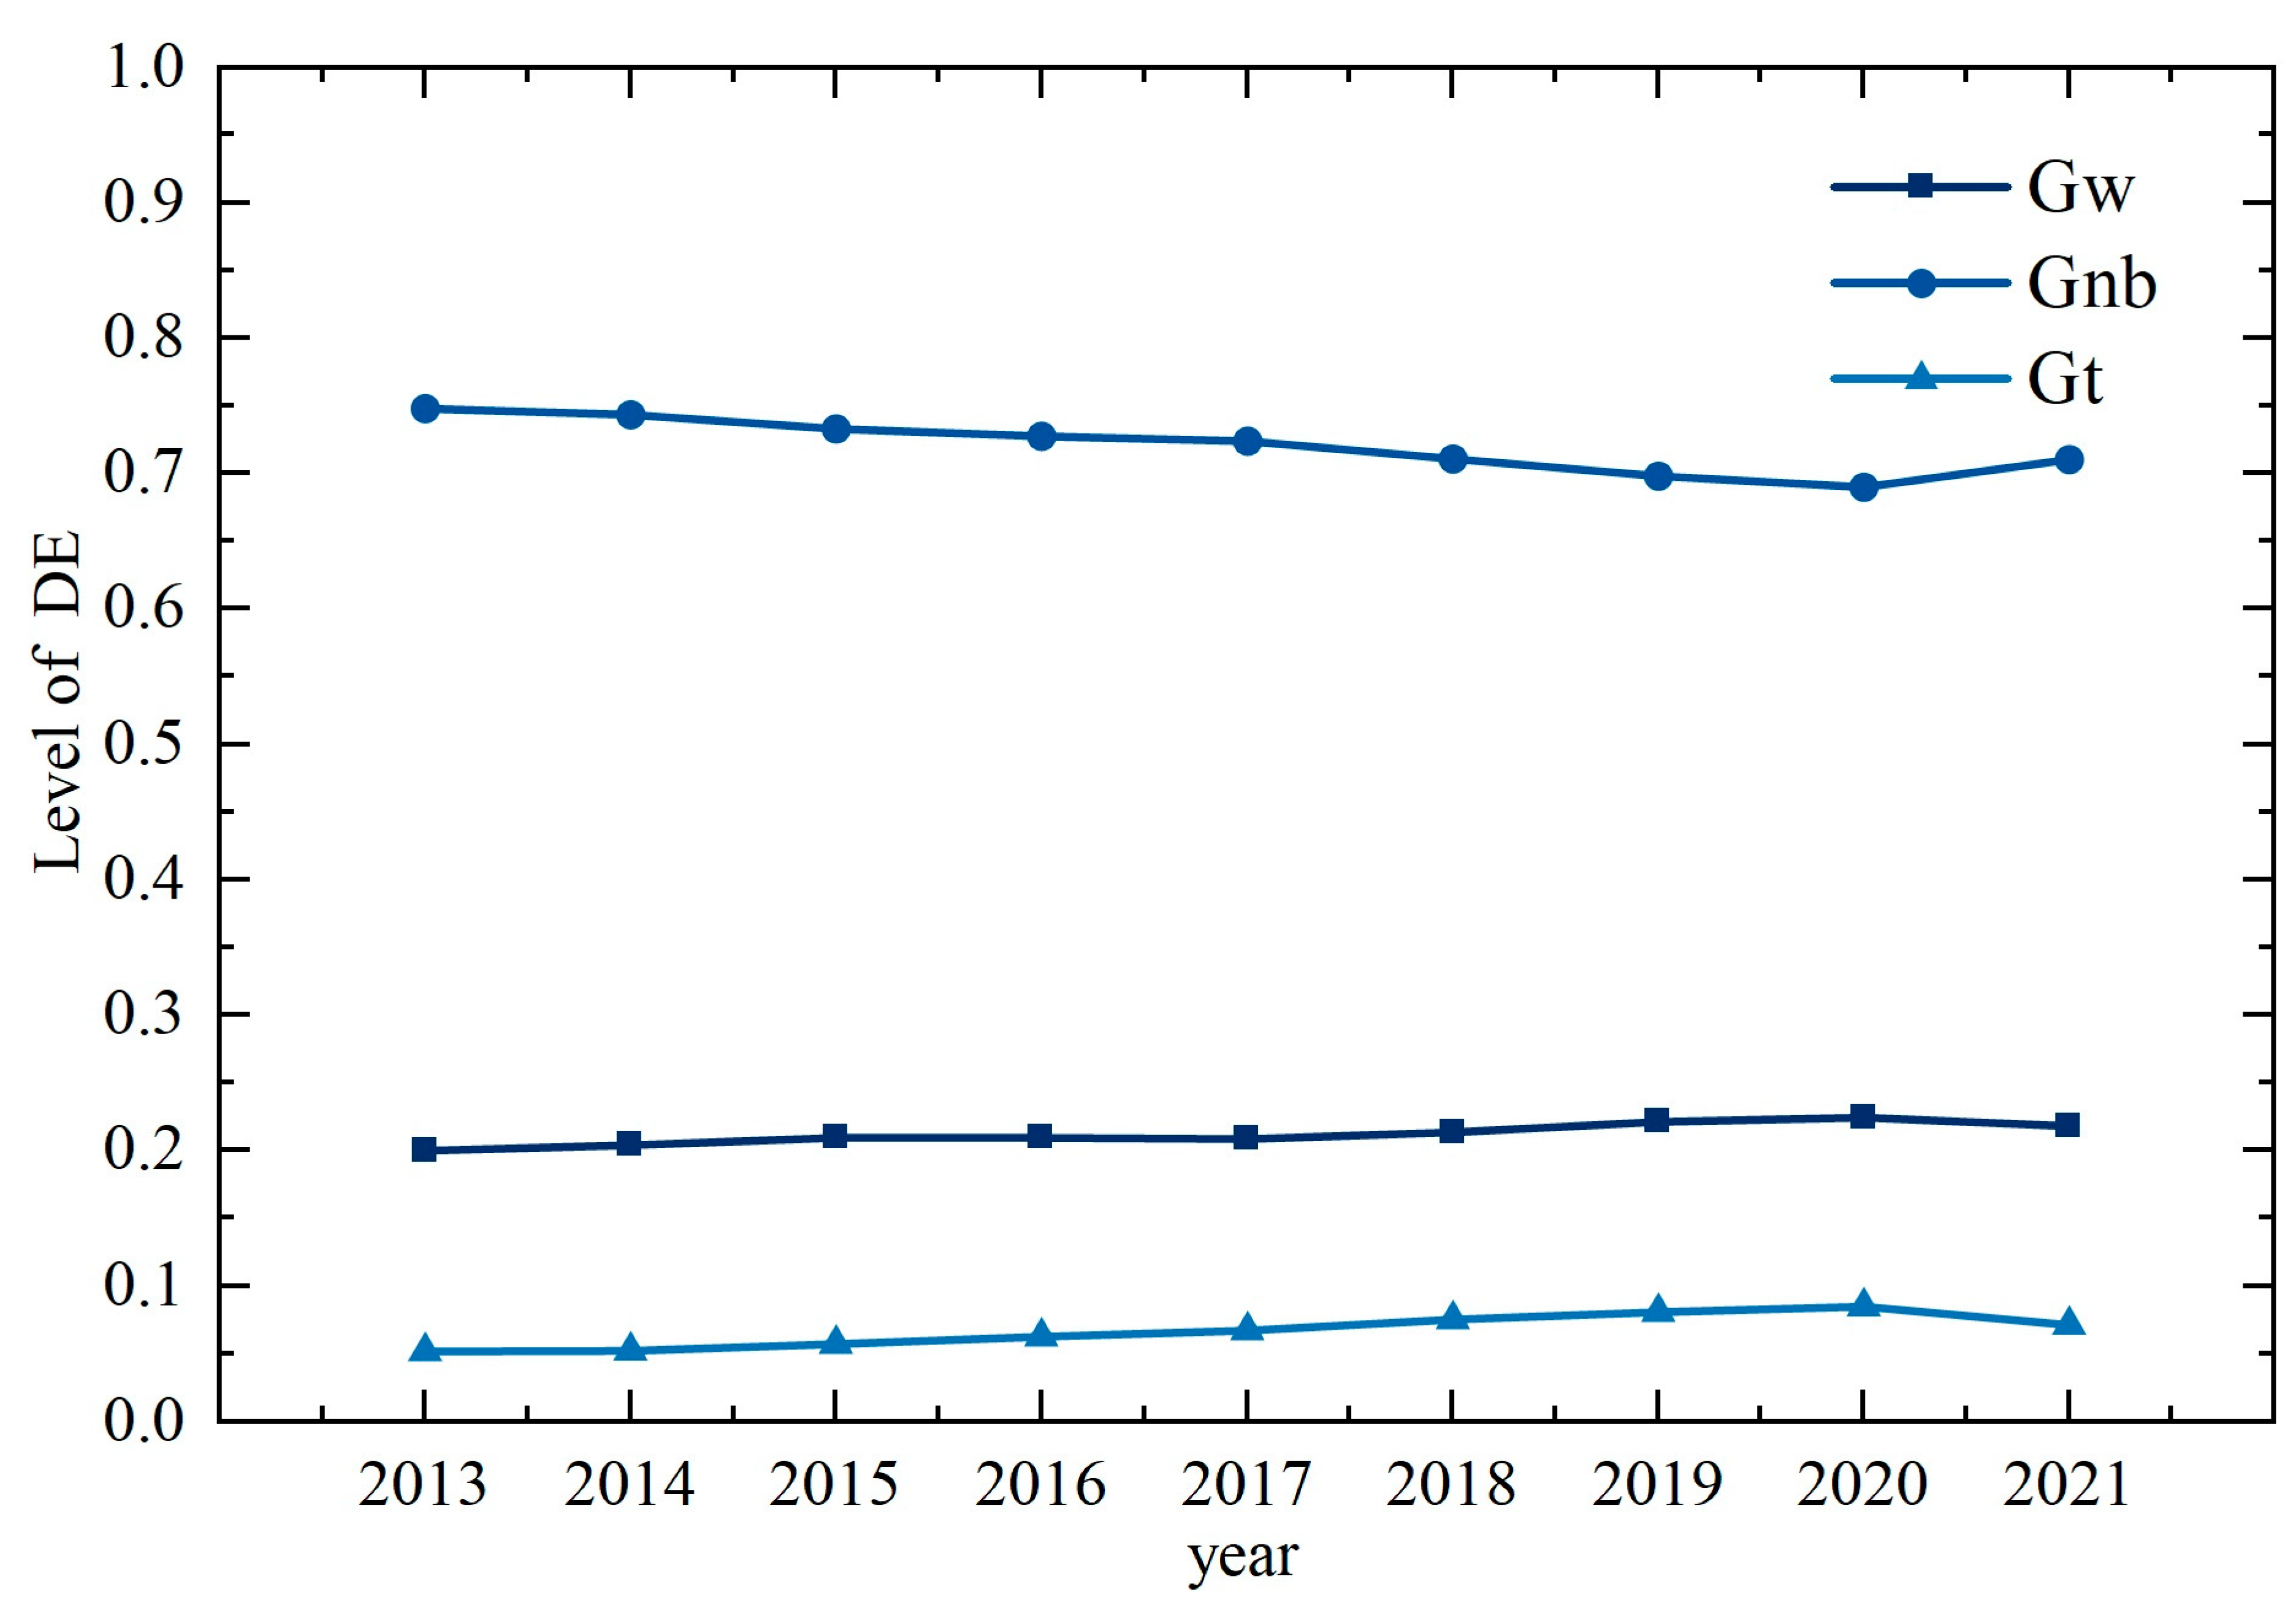
4.2.2. Regional Differences

Based on the analysis of the spatiotemporal characteristics of China’s DE development, this paper utilizes the Dagum Gini coefficient and its decomposition method to examine regional disparities and their sources across China and its four major regions. The findings are detailed in Table 2. Figure 5 shows the trends in disparities within China and its regions from 2013 to 2021. During this period, the overall Gini coefficient exhibited a fluctuating downward trend, decreasing from 0.453 in 2013 to 0.432 in 2021, a reduction of 4.9%. This indicates that while disparities in DE development levels between regions persist, the degree of imbalance has lessened.
In terms of regional disparities, the Eastern region exhibits the largest disparities, the Central region the smallest, with the West and Northeast falling in between, showing a fluctuating upward “M”-shaped trend in the east. The Central region remained relatively stable from 2013 to 2017, but experienced a significant drop from 2017 to 2018, followed by a slow decline at a low level, which is closely linked to the central government’s new round of strategies for revitalizing the northeast, such as the “Northeast Revitalization Technology Leadership Action Plan (2016–2020)” issued by the National Development and Reform Commission in 2016, advocating innovation-driven revitalization. The Western region saw a low level of disparity from 2013 to 2017, then jumped to 0.252 and stabilized at a higher level. The Central region showed an “up-down-up-down” M-shaped trend, with an early increase of 25.23%, indicating an expansion of internal regional disparities.
The differences between the East and Northeast, East and West, and East and Central regions are substantially larger than the differences between the Central and Northeast, West and Northeast, and Central and West regions, according to Figure 6, which shows the inter-regional disparities. While the differences between the East and West and the Central and West regions exhibited a changing increasing trend during the survey period, the disparities between the East and Northeast, East and West, Central and Northeast, and West and Northeast regions all showed a fluctuating decreasing trend.
As for the causes and contributions to disparities, Figure 7 illustrates that, generally and during particular times, regional differences have been the main cause, accounting for an average contribution rate of 72.09% that has been steadily declining by 5.01%. The next highest contribution rate is from intra-regional disparities, which have an average of 21.22%; the lowest is from super-density disparities, which have an average of only 6.69%. Both types of disparities exhibit a slowly increasing trend, rising by 9.05% and 4.00%, respectively.

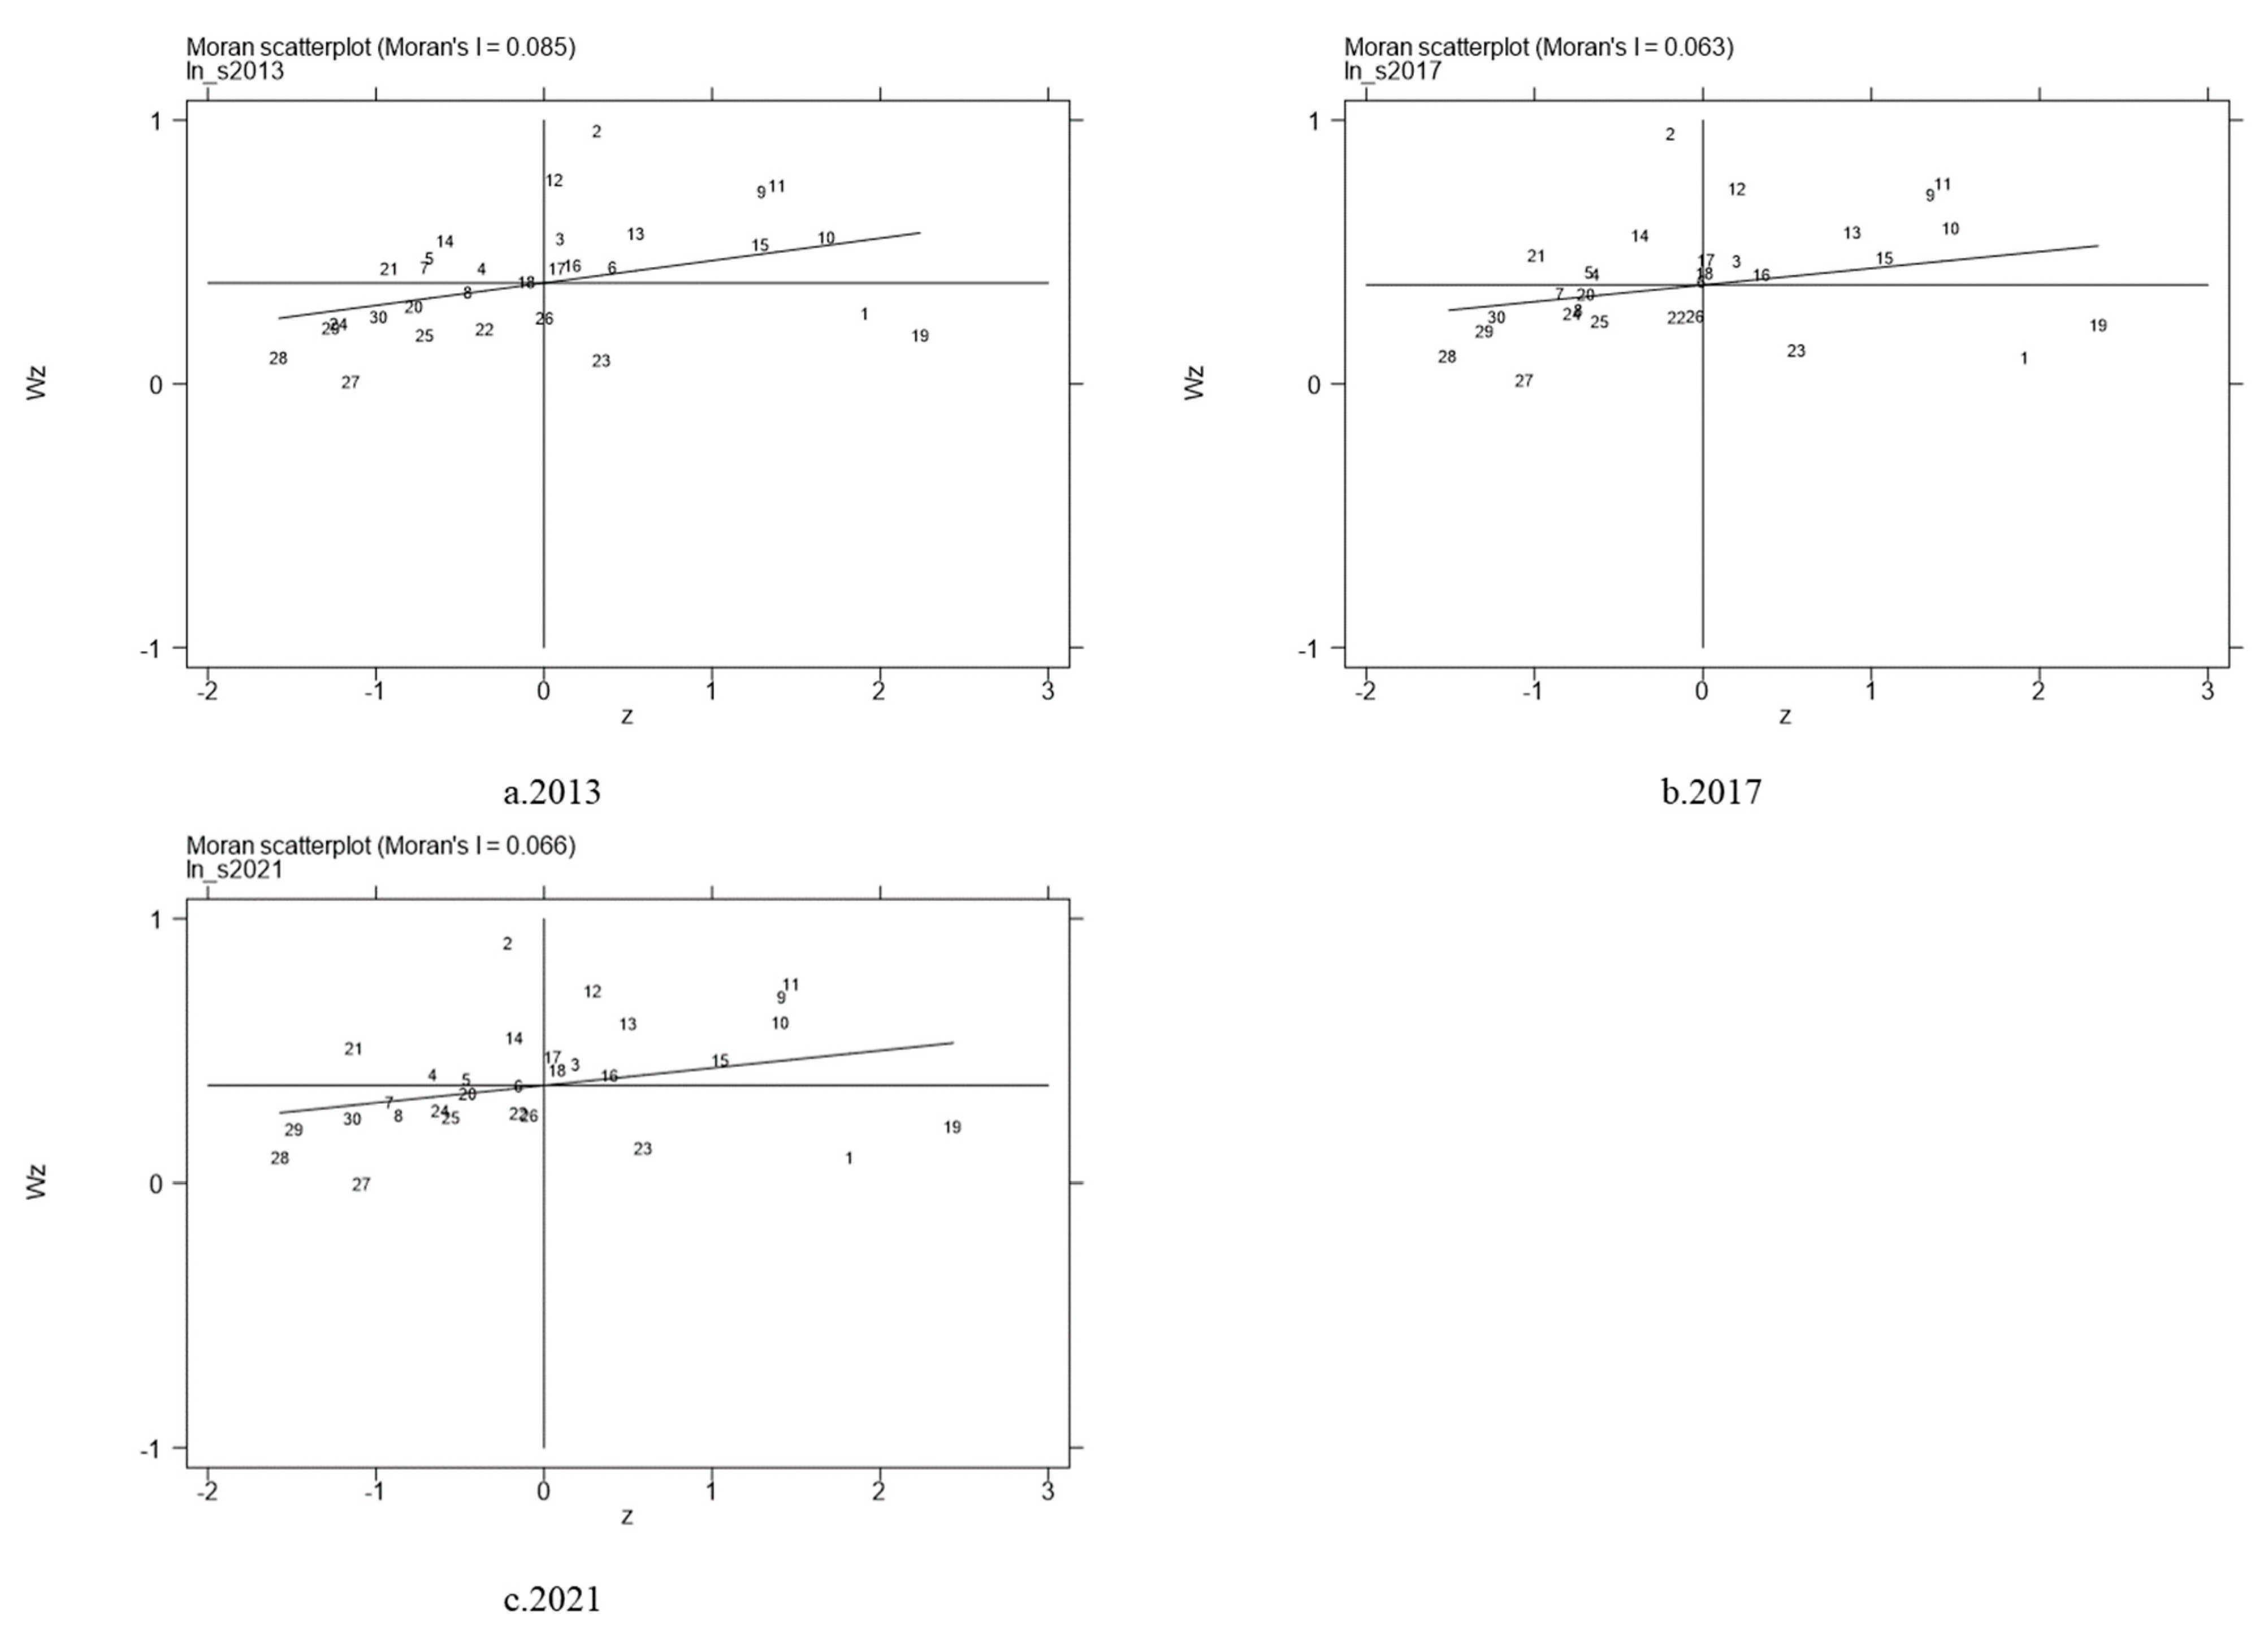
4.2.3. Spatial Correlation

To delve deeper into the clustering characteristics and evolution trends in the spatial development of China’s DE, this study computes the global Moran index for the years from 2013 to 2021 and illustrates these relationships using Moran scatter plots for the years of 2013, 2017, and 2021.
Data presented in Table 3 indicate that the global Moran index for China’s DE development level fluctuated between 0.250 and 0.301 throughout the observation period, consistently exhibiting a positive spatial correlation at the 5% significance level. This correlation suggests that provinces with advanced digital economies tend to be geographically proximate to similarly advanced regions, while areas with lower development levels also tend to cluster together. Trend analysis over the period indicates a gradual decline in the overall Moran Index, signifying a narrowing spatial disparity in the development of China’s DE.
Figure 8 displays the Local Moran’s scatterplots for the years of 2013, 2017, and 2021, highlighting the spatial agglomeration patterns of DE development in China. The scatterplots’ horizontal axis represents the standardized DE development level, while the vertical axis indicates the spatial lag of this level, with the center line representing their average. The diagram is divided into four quadrants: H-H, L-H, L-L, and H-L agglomerations, indicating spatial positive and negative correlations, respectively. H-H and L-L agglomerations illustrate the interaction and coordinated development between regions with high and low levels of DE development, respectively. In contrast, L-H and H-L agglomerations show the clustering of regions with differing DE levels.
In the figure, numbers 1 to 30 denote China’s 30 provinces. According to observations from 2013, 2017, and 2021, regions like Hebei, Shanghai, Jiangsu, Zhejiang, Anhui, Fujian, Shandong, Henan, and Hubei in the eastern and central parts mainly exhibit H-H agglomeration. In contrast, regions such as Guangxi, Chongqing, Guizhou, Yunnan, Shanxi, Gansu, Ningxia, Xinjiang, Jilin, and Heilongjiang in the western and northeastern areas mostly fall into the L-L agglomeration category. These areas, due to relatively underdeveloped economic levels and infrastructure, have lower levels of DE development. H-L agglomeration is sporadically distributed in areas like Shanxi, Inner Mongolia, Jiangxi, and Hainan, whereas Beijing, Shanghai, and Sichuan constitute the L-H agglomeration areas. Throughout the observation period, the local spatial agglomeration patterns of China’s DE development remained relatively unchanged, with stable spatial relationships and only a few provinces experiencing abrupt changes.
To further analyze the hot and cold distribution pattern of China’s provincial DE development levels, this paper uses ArcGIS 10.8 to draw the Ord Getis index distribution map of China’s DE development level in 2013, 2017 and 2021 (see Figure 9).
The Central and Eastern regions of China predominantly feature the hot and sub-hot zones of DE development, whereas the Western and Northeastern regions primarily encompass the cold and sub-cold zones. This distribution underscores the regional disparities and imbalances in China’s DE advancement. Specifically, the Southeastern coastal area has become the main hot spot for the development of the DE with its unique geographical location, advanced economic foundation, and active innovation environment. It not only gathers a large number of high-tech enterprises and innovation resources, but also forms a complete industrial chain and ecosystem, which provides strong support for the vigorous development of the DE. In contrast, the Southwest region presents the characteristics of a sub-cold spot. Although the region also has a certain foundation and potential for the development of the DE, its development level is relatively lagging due to factors such as geographical location, economic foundation and innovation resources. However, with the country’s continued investment and policy support in the Western region, the development of the DE in the Southwest region is expected to usher in new breakthroughs.
The Northwest region has become the main cold spot for China’s DE development. Due to its remote geographical location, weak economic foundation, and lack of innovation resources, the development of the DE in this region is relatively lagging. But this also means that the Northwest region has huge potential and space for the development of the DE. As long as more investment and support are given, it is possible to achieve leapfrog development.
From the perspective of time evolution, the hot spots are gradually extending from the southeast coast to the inland areas. Some areas that originally belonged to the sub-hot spots and transition areas are gradually turning into hot spots under the joint promotion of policies and markets. This shows that the hot spots for the development of China’s DE are steadily improving and showing a trend of spreading to inland areas. At the same time, the transition area and the sub-cold spot area have also expanded in a small range. This is mainly because some regions still face many challenges and difficulties in the development of the DE, such as a weak infrastructure, a lack of talent, and insufficient innovation capabilities. However, with the country’s attention and investment in the development of the DE, these regions are also expected to gradually achieve transformation and upgrading and get rid of the label of cold spots. The hot spots for the development of China’s DE are steadily improving, and the sub-cold spots are also showing a good trend of improvement. But at the same time, we must also see that there are still obvious regional differences and imbalances in the development of the DE, and we need to further strengthen policy guidance and market regulation to promote coordinated development among regions. Based on the approval number, GS (2019) No. 822, the base map is not modified.

5. Research Conclusions and Policy Recommendations

5.1. Main Conclusion

This investigation employs the panel data entropy weighting method to quantify the development level of the DE across China’s 30 provinces from 2013 to 2021, analyzing its spatiotemporal dynamics through methods such as kernel density analysis, the Dagum Gini coefficient, and spatial correlation analysis. The study also utilizes fixed effects and threshold effect models to examine the influence of technological innovation on the growth of China’s DE. Key findings are summarized as follows:
Firstly, a temporal analysis reveals a consistent increase in the overall development level of China’s DE, with a gradient that descends from east to west. The Eastern provinces lead in development, followed by Central regions, while the Western and Northeastern provinces remain less developed.
Secondly, spatially, the development level diminishes from the southeastern coastal areas towards the interior, largely reflecting the economic infrastructure in each area. The southeastern coasts, benefiting from geographical advantages, have evolved into hubs of digital economic growth, showing strong positive spatial correlations. Most Eastern and Central provinces display a “high–high” clustering pattern, whereas western and northeastern regions typically manifest a “low–low” clustering.
Lastly, despite clear regional imbalances in the development of China’s DE, these disparities are diminishing. Differences within regions primarily contribute to the overall disparities. The Eastern regions, although technologically advanced, exhibit notable internal differences. Conversely, the Central regions present the least disparities. The trajectory of inter-regional disparities is on a decline. Addressing both inter-regional and intra-regional disparities, especially reversing the trend of increasing inter-regional differences, is crucial for fostering the balanced regional development of the DE.

5.2. Policy Suggestion

Based on the findings, we propose several strategies to enhance the development of China’s DE and ensure its regional coordination:
Enhance Digital Brand Construction in Central and Western Regions: ** Given the observed east-to-west decline in digital brand development, it is crucial to bolster digital brand-building in China’s Central and Western regions. Initially, the government should implement policies like fiscal incentives and tax breaks to motivate enterprises in these regions towards digital transformation. Furthermore, encouraging Eastern digital brand enterprises to expand operations or collaborate on projects in Central and Western regions can stimulate local brand development. Additionally, leveraging unique local resources and industries to cultivate distinctive digital brands and improve brand recognition and impact is essential. Strengthening digital infrastructure, such as network connectivity and data transmission capabilities, will provide a robust foundation for digital brand development in these regions.
Utilize Geographic Benefits of Southeast Coastal Areas for Brand Innovation: ** The southeastern coastal areas, being at the forefront of China’s digital brand development, should maximize their geographical benefits. This includes enhancing connections with international markets, adopting advanced digital technologies, and incorporating global brand management practices. Establishing digital brand industrial parks to attract companies and create an industry clustering effect can further this goal. Additionally, hosting forums, exhibitions, and other industry events can foster industry exchanges and international brand development. Prioritizing digital brand talent cultivation through comprehensive training programs will support local brand innovation and growth.
Optimize DE Policy Framework to Minimize Regional Disparities: ** To address regional imbalances in the DE, the government needs to tailor regional DE policies more precisely. Establishing special funds to support digital brand development in less digitally advanced areas can boost their market competitiveness. Moreover, setting up a robust regulatory framework for the DE is essential to prevent unfair competition and safeguard market integrity. Promoting inter-regional cooperation and technology transfer can facilitate resource sharing and synergistic advantages.
By implementing these measures—focusing on digital brand enhancement in Central and Western regions, leveraging the geographic strengths of the southeastern coast, and refining the DE’s policy environment—China can foster a more balanced development across its digital brands and augment the overall competitiveness of its DE.

6. Research Limitations and Future Research

Despite diligent efforts to delineate the spatiotemporal and regional disparities in the development of China’s digital economy, this study faces several limitations that necessitate deeper future investigations. Firstly, the sample data, encompassing 30 Chinese provinces from 2013 to 2021, does not extend to all regions and is somewhat outdated. The difficulty in accessing data from Tibet, coupled with a broad evaluation index system, results in missing data for recent years. Secondly, the classification of China’s provinces into four major regions—East, Central, West, and Northeast—proves to be too coarse given the vastness of the country’s territory. Future studies might benefit from adopting more nuanced regional divisions, such as the eight comprehensive economic zones or specific economic circles like the Yangtze River Delta, the Pearl River Delta, Chengdu–Chongqing, and Beijing–Tianjin–Hebei, which could yield more precise insights into regional variances.

Author Contributions

R.F.: Conceptualization, methodology, software, visualization, data processing, and writing—original draft. C.N.: Data collection and investigation, software, methodology, and writing—review and editing. Y.Z.: Data processing, visualization, and writing—review and editing. C.H. and C.P.: Supervision, review and editing, and project administration. All authors have read and agreed to the published version of the manuscript.

Funding

This work was supported by the major program of the National Social Science Foundation of China “Research on Accelerating the Modernization of Ecological Environmental Governance System and Governance Capacity” (Grant No. 20&ZD092).

Institutional Review Board Statement

Not applicable.

Informed Consent Statement

Not applicable.

Data Availability Statement

The original contributions presented in the study are included in the article, further inquiries can be directed to the corresponding authors.

Conflicts of Interest

The authors declare that they have no known competing financial interest or personal relationships that could have appeared to influence the work reported in this paper.

References

  1. Ma, X.; Feng, X.; Fu, D.; Tong, J.; Ji, M. How Does the Digital Economy Impact Sustainable Development?—An Empirical Study from China. J. Clean. Prod. 2024, 434, 140079. [Google Scholar] [CrossRef]
  2. Pan, W.; Xie, T.; Wang, Z.; Ma, L. Digital Economy: An Innovation Driver for Total Factor Productivity. J. Bus. Res. 2022, 139, 303–311. [Google Scholar] [CrossRef]
  3. Song, M.; Zheng, C.; Wang, J. The Role of Digital Economy in China’s Sustainable Development in a Post-Pandemic Environment. J. Enterp. Inf. Manag. 2021, 35, 58–77. [Google Scholar] [CrossRef]
  4. Zhang, H.; Dong, S. Digital Transformation and Firms’ Total Factor Productivity: The Role of Internal Control Quality. Financ. Res. Lett. 2023, 57, 104231. [Google Scholar] [CrossRef]
  5. Zhang, C.; Liu, B.; Yang, Y. Digital Economy and Urban Innovation Level: A Quasi-Natural Experiment from the Strategy of “Digital China”. Humanit. Soc. Sci. Commun. 2024, 11, 574. [Google Scholar] [CrossRef]
  6. Liu, J.; Yang, Y.; Zhang, S. Research on the Measurement and Driving Factors of China’s Digital Economy. Shanghai J. Econ. 2020, 6, 81–96. [Google Scholar]
  7. Zhao, C.; Dong, K.; Liu, Z.; Ma, X. Is Digital Economy an Answer to Energy Trilemma Eradication? The Case of China. J. Environ. Manag. 2024, 349, 119369. [Google Scholar] [CrossRef]
  8. Cai, H.; Wang, Z.; Ji, Y.; Xu, L. Digitalization and Innovation: How Does the Digital Economy Drive Technology Transfer in China? Econ. Model. 2024, 136, 106758. [Google Scholar] [CrossRef]
  9. Luo, S.; Yimamu, N.; Li, Y.; Wu, H.; Irfan, M.; Hao, Y. Digitalization and Sustainable Development: How Could Digital Economy Development Improve Green Innovation in China? Bus. Strategy Environ. 2023, 32, 1847–1871. [Google Scholar] [CrossRef]
  10. Bowman, J.P. The Digital Economy: Promise and Peril in the Age of Networked Intelligence; Academy of Management: Valhalla, NY, USA, 1996. [Google Scholar]
  11. Central Cyberspace Affairs Commission of the CPC Central Committee. (n.d.). G20 Digital Economy Development and Cooperation Initiative. Available online: https://www.cac.gov.cn/2016-09/29/c_1119648520.htm (accessed on 4 July 2024).
  12. Li, K.; Kim, D.J.; Lang, K.R.; Kauffman, R.J.; Naldi, M. How Should We Understand the Digital Economy in Asia? Critical Assessment and Research Agenda. Electron. Commer. Res. Appl. 2020, 44, 101004. [Google Scholar] [CrossRef]
  13. Zhang, W.; Zhao, S.; Wan, X.; Yao, Y. Study on the Effect of Digital Economy on High-Quality Economic Development in China. PLoS ONE 2021, 16, e0257365. [Google Scholar] [CrossRef] [PubMed]
  14. Liu, C.; Jiang, Y.; Zhang, Q.; Zhu, X. Research on the Statistical Measure and Spatiotemporal Trend of the Development Level of Digital Economy. J. Ind. Technol. Econ. 2022, 41, 129–136. [Google Scholar]
  15. Liu, L.; Zhang, Y.; Gong, X.; Li, M.; Li, X.; Ren, D.; Jiang, P. Impact of Digital Economy Development on Carbon Emission Efficiency: A Spatial Econometric Analysis Based on Chinese Provinces and Cities. Int. J. Environ. Res. Public Health 2022, 19, 14838. [Google Scholar] [CrossRef]
  16. Tao, Z.; Zhang, Z.; Shangkun, L. Digital Economy, Entrepreneurship, and High-Quality Economic Development: Empirical Evidence from Urban China. Front. Econ. China 2022, 17, 393. [Google Scholar]
  17. Wang, J.; Zhu, J.; Luo, X. Research on the Measurement of China’s Digital Economy Development and the Characteristics. J. Quant. Tech. Econ. 2021, 38, 26–42. [Google Scholar]
  18. Yu, S.; Fan, X.; Jiang, H. Research on the Impact of Digital Economy Development on Carbon Productivity Improvement. J. Stat. Inf. 2022, 37, 26–35. [Google Scholar]
  19. He, W.; Wen, J.; Zhang, M. Research on the Impact of Digital Economy Development on China’s Green Ecological Efficiency: Based on Two-Way Fixed Effects Model. Econ. Probl. 2022, 1, 1–8. [Google Scholar]
  20. Xie, B.; Liu, R.; Dwivedi, R. Digital Economy, Structural Deviation, and Regional Carbon Emissions. J. Clean. Prod. 2024, 434, 139890. [Google Scholar] [CrossRef]
  21. Dogan, A.; Pata, U.K. The Role of ICT, R&D Spending and Renewable Energy Consumption on Environmental Quality: Testing the LCC Hypothesis for G7 Countries. J. Clean. Prod. 2022, 380, 135038. [Google Scholar] [CrossRef]
  22. Shahzad, U.; Ferraz, D.; Nguyen, H.-H.; Cui, L. Investigating the Spill Overs and Connectedness between Financial Globalization, High-Tech Industries and Environmental Footprints: Fresh Evidence in Context of China. Technol. Forecast. Soc. Chang. 2022, 174, 121205. [Google Scholar] [CrossRef]
  23. Shahbaz, M.; Wang, J.; Dong, K.; Zhao, J. The Impact of Digital Economy on Energy Transition across the Globe: The Mediating Role of Government Governance. Renew. Sustain. Energy Rev. 2022, 166, 112620. [Google Scholar] [CrossRef]
  24. Sun, G.; Fang, J.; Li, J.; Wang, X. Research on the Impact of the Integration of Digital Economy and Real Economy on Enterprise Green Innovation. Technol. Forecast. Soc. Chang. 2024, 200, 123097. [Google Scholar] [CrossRef]
  25. Yang, X.; Xu, Y.; Razzaq, A.; Wu, D.; Cao, J.; Ran, Q. Roadmap to Achieving Sustainable Development: Does Digital Economy Matter in Industrial Green Transformation? Sustain. Dev. 2024, 32, 2583–2599. [Google Scholar] [CrossRef]
  26. Wang, Q.; Sun, J.; Pata, U.K.; Li, R.; Kartal, M.T. Digital Economy and Carbon Dioxide Emissions: Examining the Role of Threshold Variables. Geosci. Front. 2024, 15, 101644. [Google Scholar] [CrossRef]
  27. Guo, B.; Wang, Y.; Zhang, H.; Liang, C.; Feng, Y.; Hu, F. Impact of the Digital Economy on High-Quality Urban Economic Development: Evidence from Chinese Cities. Econ. Model. 2023, 120, 106194. [Google Scholar] [CrossRef]
  28. Li, L. Evaluation on the Development Level and Analysis on the Coupling Coordination of Digital Economy in the Yellow River Basin. Stat. Decis. 2022, 38, 26–30. [Google Scholar]
  29. Li, Z.; Liu, Y. Research on the Spatial Distribution Pattern and Influencing Factors of Digital Economy Development in China. IEEE Access 2021, 9, 63094–63106. [Google Scholar] [CrossRef]
  30. Luo, K.; Liu, Y.; Chen, P.-F.; Zeng, M. Assessing the Impact of Digital Economy on Green Development Efficiency in the Yangtze River Economic Belt. Energy Econ. 2022, 112, 106127. [Google Scholar] [CrossRef]
  31. Peng, W.; Han, D.; Yin, Y.; Yang, Y.; Shi, X.; Kuang, J. Spatial Evolution and Integrated Development of Digital Economy in Beijing-Tianjin-Hebei Region. Econ. Geogr. 2022, 42, 136–143. [Google Scholar]
  32. Li, Y. Regional Differences and Dynamic Evolution of China’s Digital Economy Output Efficiency. J. Quant. Technol. Econ. 2021, 38, 60–77. [Google Scholar]
  33. Shu, J.; Zhou, J.; Chen, Y.; Liu, C. Spatial Evolution Characteristics of China’s Provincial Digital Economy and Its Urban-Rural Integration Effect. Econ. Geogr. 2022, 42, 104–111. [Google Scholar]
  34. Wong, D.W. Several Fundamentals in Implementing Spatial Statistics in GIS: Using Centrographic Measures as Examples. Geogr. Inf. Sci. 1999, 5, 163–174. [Google Scholar]
  35. Liu, J.; Liu, H. Study on the Spatiotemporal Evolution of Coupled and Coordinated Digital Economic Resilience and Efficiency. Int. Rev. Econ. Financ. 2024, 93, 876–888. [Google Scholar] [CrossRef]
  36. Dagum, C. A New Approach to the Decomposition of the Gini Income Inequality Ratio. In Income Inequality, Poverty, and Economic Welfare; Slottje, D.J., Raj, B., Eds.; Physica-Verlag HD: Heidelberg, Germany, 1998; pp. 47–63. ISBN 978-3-642-51075-5. [Google Scholar]
  37. Huajun, L.; Hao, Z. Empirical Analysis of the Regional Differences of China’s Carbon Dioxide Emissions Intensity. Stat. Res. 2012, 6, 46–50. [Google Scholar]
  38. Tiefelsdorf, M.; Boots, B. A Note on the Extremities of Local Moran’s Iis and Their Impact on Global Moran’s I. Geogr. Anal. 1997, 29, 248–257. [Google Scholar] [CrossRef]
  39. Xie, W.-F.; Li, J.-K.; Peng, K.; Zhang, K.; Ullah, Z. The Application of Local Moran’s I and Getis–Ord Gi* to Identify Spatial Patterns and Critical Source Areas of Agricultural Nonpoint Source Pollution. J. Environ. Eng. 2024, 150, 04024011. [Google Scholar] [CrossRef]
  40. Qianbin, D.; Shuaishuai, H.; Zenglin, H. Spatial Pattern of Economic Carrying Capacity of Cities at Prefecture Level and above in China. Geogr. Res. 2016, 35, 337–352. [Google Scholar]
  41. Hengquan, Z.; Qianwen, G.; Chenjun, Z. Temporal-spatial imbalance of provincial water use efficiency dynamic evolution and drives based on geographic detector. Resour. Ind. 2021, 24, 81. [Google Scholar]
  42. Bukht, R.; Heeks, R. Defining, Conceptualising and Measuring the Digital Economy; Development Informatics working paper; SSRN: Atlanta, GA, USA, 2017. [Google Scholar]
Figure 1. DE development level indicator system.
Sustainability 16 06738 g001
Figure 2. DE development level in 30 provinces in China from 2013 to 2021.
Sustainability 16 06738 g002
Figure 3. Kernel density estimation of DE development levels in China and the four major regions from 2013 to 2021.
Sustainability 16 06738 g003
Figure 4. Spatial distribution characteristics of China’s DE development levels in 2013, 2017, and 2021.
Sustainability 16 06738 g004
Figure 5. Overall and regional differences in the development levels of China’s DE from 2013 to 2021.
Sustainability 16 06738 g005
Figure 6. Regional differences in the development of China’s DE from 2013 to 2021.
Sustainability 16 06738 g006
Figure 7. Sources and contribution rates of regional differences in the development levels of China’s DE from 2013 to 2021.
Sustainability 16 06738 g007
Figure 8. Partial Moran’s scatter plot of China’s DE development levels.
Sustainability 16 06738 g008
Figure 9. Distribution of hot and cold spots in China’s DE development levels in 2013, 2017 and 2021.
Sustainability 16 06738 g009
Table 1. Measurement results.
Province201320142015201620172018201920202021
Anhui0.04050.05600.07680.09220.10910.13940.17280.19490.1777
Beijing0.15990.20660.26220.29740.33080.34520.40570.43840.4941
Fujian0.07610.09090.11900.16190.21820.22620.24490.21620.2129
Gansu0.01670.02510.03630.04140.04910.06130.07190.08170.0732
Guangdong0.25130.29710.36160.43810.49760.61130.75590.83520.7339
Guangxi0.02480.03600.04610.05780.06790.08990.12280.14240.1214
Guizhou0.01990.02840.04140.05460.06310.08240.10610.11850.1137
Hainan0.02580.03750.04910.05240.05720.06140.06970.06960.0747
Hebei0.04900.06090.07440.09350.11850.14130.17160.19460.1669
Henan0.04750.06580.08960.10820.12400.16390.19570.21900.1830
Heilongjiang0.03320.04100.04600.04860.06020.06770.08080.09240.0834
Hubei0.04120.05150.07390.08340.09700.12100.15250.16180.1390
Hunan0.03940.05410.06730.08680.10090.13030.16180.18150.1556
Jilin0.02270.03180.03960.04640.05490.06890.07690.08580.0769
Jiangsu0.15840.18750.22100.24570.28190.33120.39060.42970.3784
Jiangxi0.02480.03410.05270.05780.07800.10020.12800.14490.1290
Liaoning0.06670.07960.09530.09510.10350.12280.14200.15320.1378
Inner Mongolia0.02610.03230.04520.05330.06440.07250.08890.10100.1000
Ningxia0.01800.02590.03270.03720.04120.04750.04900.05230.0516
Qinghai0.01570.02100.03170.03720.03850.04440.04720.05130.0558
Shandong0.13800.14320.15710.19770.23150.28850.30240.33070.3287
Shanxi0.03040.03910.04930.05680.06540.09050.09930.10870.1000
Shaanxi0.03810.05010.06500.07970.09090.11280.14090.15200.1407
Shanghai0.12330.18640.21470.26210.28300.30810.35610.40100.4809
Sichuan0.05870.08100.10420.12560.15350.19020.23870.27100.2382
Tianjin0.04350.05450.07120.07310.07810.08900.10410.11820.1180
Xinjiang0.02620.03300.04270.04390.04890.06610.07560.08680.0787
Yunnan0.02610.03720.05180.05840.06790.08870.11540.13440.1108
Zhejiang0.12760.15640.20900.25330.27880.32740.40180.45700.3962
Chongqing0.03380.04930.06460.08090.09170.11220.13250.14880.1433
Average0.06010.07640.09640.11400.13150.15670.18670.20580.1931
Table 2. Regional differences in the development levels of the DE and contribution rates.
YearsGDifferences between GroupsDifferences within GroupsContribution Rate
East–CentralEast–WestCentral–WestEast–NortheastCentral–NortheastWest–NortheastEastCentralWestNortheastGwGnbGt
20130.4530.5180.5410.1960.6490.2720.2720.3320.1110.2040.25420.00%74.82%5.08%
20140.4390.4980.5390.1820.6280.2690.2590.3310.1160.1840.24820.42%74.38%5.20%
20150.4290.4780.5520.1950.6060.2660.2320.3360.1290.1750.23820.96%73.33%5.70%
20160.4320.4840.5780.2080.6040.2640.2190.3330.1390.1580.24720.94%72.79%6.27%
20170.4320.4830.5840.2060.6050.2680.2180.3310.1310.1470.25420.87%72.43%6.70%
20180.4260.4630.5920.2700.5890.2370.2180.3390.1270.2520.14521.37%71.11%7.52%
20190.4240.4500.5820.2770.5870.2500.2290.3500.1290.2660.14422.12%69.82%8.06%
20200.4230.4450.5780.2770.5890.2640.2290.3560.1330.2680.14122.47%69.04%8.49%
20210.4320.4670.5930.2700.6080.2540.2230.3520.1290.2570.13821.81%71.07%7.11%
Table 3. Global Moran’s I Index of China’s DE Development Levels from 2013 to 2021.
YearMoran’s Izp-Value
20130.284 ***2.5820.005
20140.301 ***2.7280.003
20150.287 ***2.6130.004
20160.279 ***2.5480.005
20170.279 ***2.5480.005
20180.256 ***2.3590.009
20190.250 **2.3220.010
20200.226 **2.1250.017
20210.252 **2.3360.010
Note: *** means p < 0.01, ** means p < 0.05.
Disclaimer/Publisher’s Note: The statements, opinions and data contained in all publications are solely those of the individual author(s) and contributor(s) and not of MDPI and/or the editor(s). MDPI and/or the editor(s) disclaim responsibility for any injury to people or property resulting from any ideas, methods, instructions or products referred to in the content.

