Article

Vegetation Types Can Affect Soil Organic Carbon and δ13C by Influencing Plant Inputs in Topsoil and Microbial Residue Carbon Composition in Subsoil

1
Gansu Key Laboratory for Environmental Pollution Prediction and Control, College of Earth and Environmental Sciences, Lanzhou University, Lanzhou 730030, China
2
Key Laboratory of Strategic Mineral Resources of the Upper Yellow River, Ministry of Natural Resources, Lanzhou 730046, China
*
Author to whom correspondence should be addressed.
Sustainability 2024, 16(11), 4538; https://doi.org/10.3390/su16114538
Submission received: 30 March 2024 / Revised: 20 May 2024 / Accepted: 23 May 2024 / Published: 27 May 2024

Abstract

:
Plantation is an economical and effective method of ecological restoration, which is also a common means to increase soil organic carbon (SOC) content. However, the effects of vegetation types on SOC accumulation and δ13C distribution during ecological restoration are still not clear. Therefore, we evaluated the soils under four types of restoration measures: plantation (PL, dominated by Olea europaeaLeccino’), grasslands [GLs, Setaria viridis], croplands [CLs, Zea mays] and shrublands (SLs, Lycium chinense Mill), after 11-year restoration. SOC and the natural stable carbon isotope abundance in four recovery modes were determined, while amino sugars (ASs) and lignin phenols (LPs) were used as biomarkers to identify microbial- and plant-derived carbon, respectively. The results showed that SOC, AS, and LP decreased with the increasing of soil depth, and SOC and LP showed the same trend in topsoil (0–20 cm). ASs in subsoil (40–50 cm) were significantly higher in GLs than that in CLs and the PL, while fungi residue carbon in GLs was significantly higher in subsoil. The δ13C in topsoil was mainly affected by plant factors, especially by litter. With the increasing soil depth, the effect of plants on δ13C decreased, and the effect of microorganisms increased. Vegetation types could affect SOC and δ13C by influencing plant inputs in topsoil. In the subsoil, differences in microbial compositions under different vegetation types could affect δ13C enrichment. The study revealed the effects of vegetation types on SOC accumulation and δ13C distribution during ecological restoration, emphasized that vegetation types can affect SOC accumulation by influencing the plant input of topsoil and the microbial compositions in subsoil, and provided a reference for the development of management policies in restoration areas.

1. Introduction

Since the global soil organic carbon (SOC) content is much larger than the sum of global vegetation and atmospheric carbon, even small changes in SOC can lead to large changes in atmospheric CO2 concentrations [1]. Plants can absorb and fix atmosphere carbon, and then input it into the soil by means of litter or root secretion [2]. It can also affect the oxygen flux in the soil through the root system, thus affecting the decomposition of organic matter in the soil, and is the pivot connecting the soil and the atmosphere [3]. Differences in vegetation types lead to different plant impacts on SOC [4]. Vegetation can affect the input, composition, and turnover of carbon in topsoil, and influence the physical structure of soil through root systems and secretions, which are affected by vegetation types [5,6]. Different vegetation types have different effects on the amount of input and functional components of carbon in soil. Therefore, vegetation type is one of the most important indicators of changes in SOC content during vegetation restoration.
The ultimate source of SOC is plant input. Some researchers believe that plant-derived organic carbon is a key player in the soil carbon cycle and contributes significantly to the stabilization and formation of SOC pools, because they are chemically recalcitrant and difficult to mineralize and decompose [7]. However, with the growing sophistication of biomarker identification techniques for molecular characterization, researchers have realized that microorganisms mediated SOC conversion and sequestration processes that include long-term SOC accumulation [8,9]. After plant-derived carbon is imported into the soil, microorganisms not only release it to the atmosphere through catabolic processes, but also assimilate it through anabolic processes and ultimately convert it to microbial-derived carbon [10,11]. Compared to plant-derived carbon, microbial-derived carbon is more readily combined with minerals and then is encapsulated in aggregates to remain stable [12]. The relative contribution of two sources to SOC varies with vegetation types, soil properties, and external environment. These internal and external soil characteristics can influence the composition of the microbial community in the soil, and the difference in the ratio of fungi to bacteria can affect the fixation of SOC by microorganisms as well as the amount and quality of microbial residual carbon in the soil [13,14]. The stable isotope natural abundance method is a valuable tool for tracking the transfer of plant inputs to SOC components, because 13C can effectively represent the processes and sources of plant entry into the soil [15].
The fractionation effect suffered by plant inputs of carbon into the soil can be reflected by δ13C [16]. Fresh carbon assimilates can have a significant effect on the δ13C signature of organic carbon, especially in topsoil. Microbial preferences for substances during decomposition affected the vertical distribution of δ13C in soil. Generally, 13C in soils with a higher degree of degradation are enriched [17]. At present, there have been studies on the change in δ13C in the soil during vegetation restoration or vegetation turnover [18,19], but the effects of different types of vegetation restoration on the distribution of δ13C in the soil profile are not yet clear.
The Bailong River basin in the south of the Gansu Province is one of the four major geological disaster-prone areas in China, where ecological protection projects have been carried out for many years in order to improve the ecological environment, which is a typical area of planting restoration [20,21]. Since the ability of ecological restoration effects to improve soil nutrients and soil erodibility is influenced by vegetation type, it is difficult to achieve the best ecological benefits of restoration in some areas. Therefore, after 11 years of restoration in the study area, we used lignin phenols (LP) and amino sugars (AS) to characterize plant- and microbial-derived carbon, respectively. Combined with the natural stable isotope abundance in soil, we evaluated the effects of vegetation types on (1) the distribution of SOC and its sources, (2) the distribution of δ13C along the soil profile, and (3) the influencing factors of SOC sequestration. We hypothesized that SOC behaves consistently with LP in the topsoil and with AS in the subsoil, and δ13C accumulation in the topsoil is mainly influenced by plant factors, and in the subsoil, it is mainly related to microbial residue carbon. The exploration of different vegetation soils in semi-arid mountainous areas is helpful to further understand the influence mechanism of vegetation types on SOC in the process of restoration.

2. Materials and Methods

2.1. Study Area

The study area is located in the Bailong River basin (Miaoping Village, Liangshui Town, Longnan Section, Gansu Province, China, 104°48′ E, 33°26′17″ N, Figure 1a) at the intersection of the Qinghai–Tibet Plateau and the north of the Western Sichuan Plateau, which is an important part of the ecological barrier and the water-source containment area of the upper reaches of the Yangtze River [22]. The percentage of forested land on both sides of the watershed is 43.5%, shrubland and grassland is 33.98%, and farmland is 20.67% [21,23]. The study area is at the intersection of seismic zones, with frequent seismic activity and geological disasters such as shallow landslides. After the Wenchuan earthquake in 2008, soil erosion was severe in the study area, and in order to carry out effective vegetation restoration, the local government chose to cover the study area with soil at a thickness of 1 m [21]. The climate is a northern subtropical semi-arid climate, with an annual precipitation of 700–900 mm, an average annual temperature of 14.5 °C, and yellow-brown soil [21,22].

2.2. Experimental Design

A long-term planting restoration project was started in the study area after the Wenchuan earthquake in 2008 [21]. Four types of restoration measures (Figure 1b–e) were set up, including plantation (PL), natural grasslands (GLs), croplands (CLs), and natural shrublands (SLs). The plantation was weeded every summer by local villagers, and the cropland was sown in the spring, irrigated in the dry season, and harvested in the autumn. The investigation was conducted in the study area in October 2019, at which time the restoration project had been carried out for 11 years. The plot of the PL was 20 × 20 m; the quadrat of SLs was 5 × 5 m; the quadrat of GLs was 1 × 1 m, and the quadrat of CLs was 2 × 2 m in size; there was a distance of at least 5 m among all plots and quadrats. There were six replicates of each vegetation type, totaling 24 sample plots and quadrats. A GPS device was used to record the altitude, latitude, and longitude of each sampling site. Basic sampling information can be found in Table 1. Soil samples were collected at a depth of 50 cm, and one soil sample was collected every 10 cm with a 100 mm × 63 mm ring knife. Soil was collected three times from each layer and mixed well, then capped and sent to the laboratory for analysis. In this study, 0–20 cm was selected as topsoil and 40–50 cm as subsoil. Plant litter was collected from the soil surface at each sample site.

2.3. Physical and Chemical Properties of Soil

Samples were air-dried, and then run through a 2 mm sieve to remove stones and roots. Soil bulk density was measured with a ring knife, soil moisture was measured by drying to constant weight at 105 °C, and soil pH was measured with a pH electrode (soil: water = 1:2.5). As described by Zhao et al. [24], SOC, total nitrogen (TN), and total phosphorus (TP) contents were measured by acidic dichromate heating method, automatic Kay distillation–titration device, and colorimetric method, respectively. Nitrate nitrogen ( NO 3 -N) and ammonium nitrogen ( NH 4 + -N) were measured using an automatic chemical analyzer (SmartChem 200, KPM Analytics, Westborough, MA, USA). Cation exchange capacity (CEC) was assessed via the cobalt hexamine chloride method [25].

2.4. Analysis of Amino Sugars and Lignin Phenols

The determination of ASs followed the classical method of Zhang and Amelung [26]. Briefly, the soil sample was hydrolyzed with 6 M HCL at 105 °C, then inositol was added and evaporated to dryness. The samples were dissolved in distilled water and the pH was adjusted with 1 M KOH. The supernatant evaporated to dryness again after centrifugation. The samples were dissolved with anhydrous ethanol, centrifuged, and blown dry with N2. Samples were dissolved with distilled water and N-methylglucosamine and freeze-dried. After derivatization and blow-drying with N2, the samples were dissolved with ethyl acetate and n-hexane in a 1:1 volume ratio.
LP was determined by alkaline copper oxide hydrolysis [27]. Briefly, CuO, glucose, ammonium iron (II) sulfate hexahydrate [Fe(NH4)2(SO4)2·6H2O], 2 M NaOH solution, and internal standard solution (ethyl vanillin) were added to the samples and hydrolyzed at 170 °C for 2 h. After centrifugation, the pH of the supernatant was adjusted with 6 M HCl. The precipitates were allowed to settle and then the samples were centrifuged again. The supernatants were extracted with ethyl acetate and blown dry with N2. AS and LP samples were determined using Trace 1300 gas chromatography (Thermo Fisher Scientific, Waltham, MA, USA).

2.5. δ13C in Soil

δ13C was determined following the method description by Six et al. [28] using elemental analysis–continuous fluid mass spectrometry (Finnegan MAT253, Thermal Electron Corporation, Waltham, MA, USA). Briefly, 0.5 M HCl was used to remove the carbonate fraction from the milled soil, then distilled water was used to wash the soil samples to neutrality. The samples were placed in tinfoil cups, which were folded and checked for leakage, and waited for the machine. The stable isotope natural abundances are expressed as δ-values relative to international standards. Delta values were calculated according to the following equation:
δ 13 C = R s a m p l e R P D B 1 × 1000
R s a m p l e = 13 C s a m p l e 12 C s a m p l e
Vienna Pee Dee Belemnite (VPDB; Rstandard = 0.0111802) was the standard material for carbon. R describes the ratio of the heavy to light isotope, 13Csample is the sample value determined by isotope ratio mass spectrometer, and 12Csample indicates the total carbon content of the sample.

2.6. Statistical Analysis

Soil amino sugars, namely glucosamine (Gluc), muramic acid (Mura), galactosamine (Gala), and mannosamine (Mann), were quantified. The microbial residue C in soil was calculated according to the following equation:
Fungi   residue   carbon = Gluc   mg · g 1   soil 179.17 2 × Mura   mg · g 1   soil 251.23 × 179.17 × 9
where it was assumed that the ratio of Mura and Gluc in bacterial cells was 1:2 [29], the number 179.17 is the relative molecular mass of Gluc, 251.23 is the relative molecular mass of Mura, 9 is the conversion factor from Gluc to fungal necromass carbon, and 45 is a conversion factor from Mura to bacterial necromass carbon [30].
Mean ± standard error was used to express all the results. Data analysis was performed using SPSS 26.0 (SPSS Inc. Chicago, IL, USA) and R 4.3.3. One-way ANOVA and Duncan’s test (significance was set at p < 0.05) were used for analysis of variance. Partial least squares (PLS) regression analysis was used to evaluate the relative importance of δ13C. The relationships between SOC, ASs and LPs with soil parameters were assessed using Pearson’s correlation.

3. Results

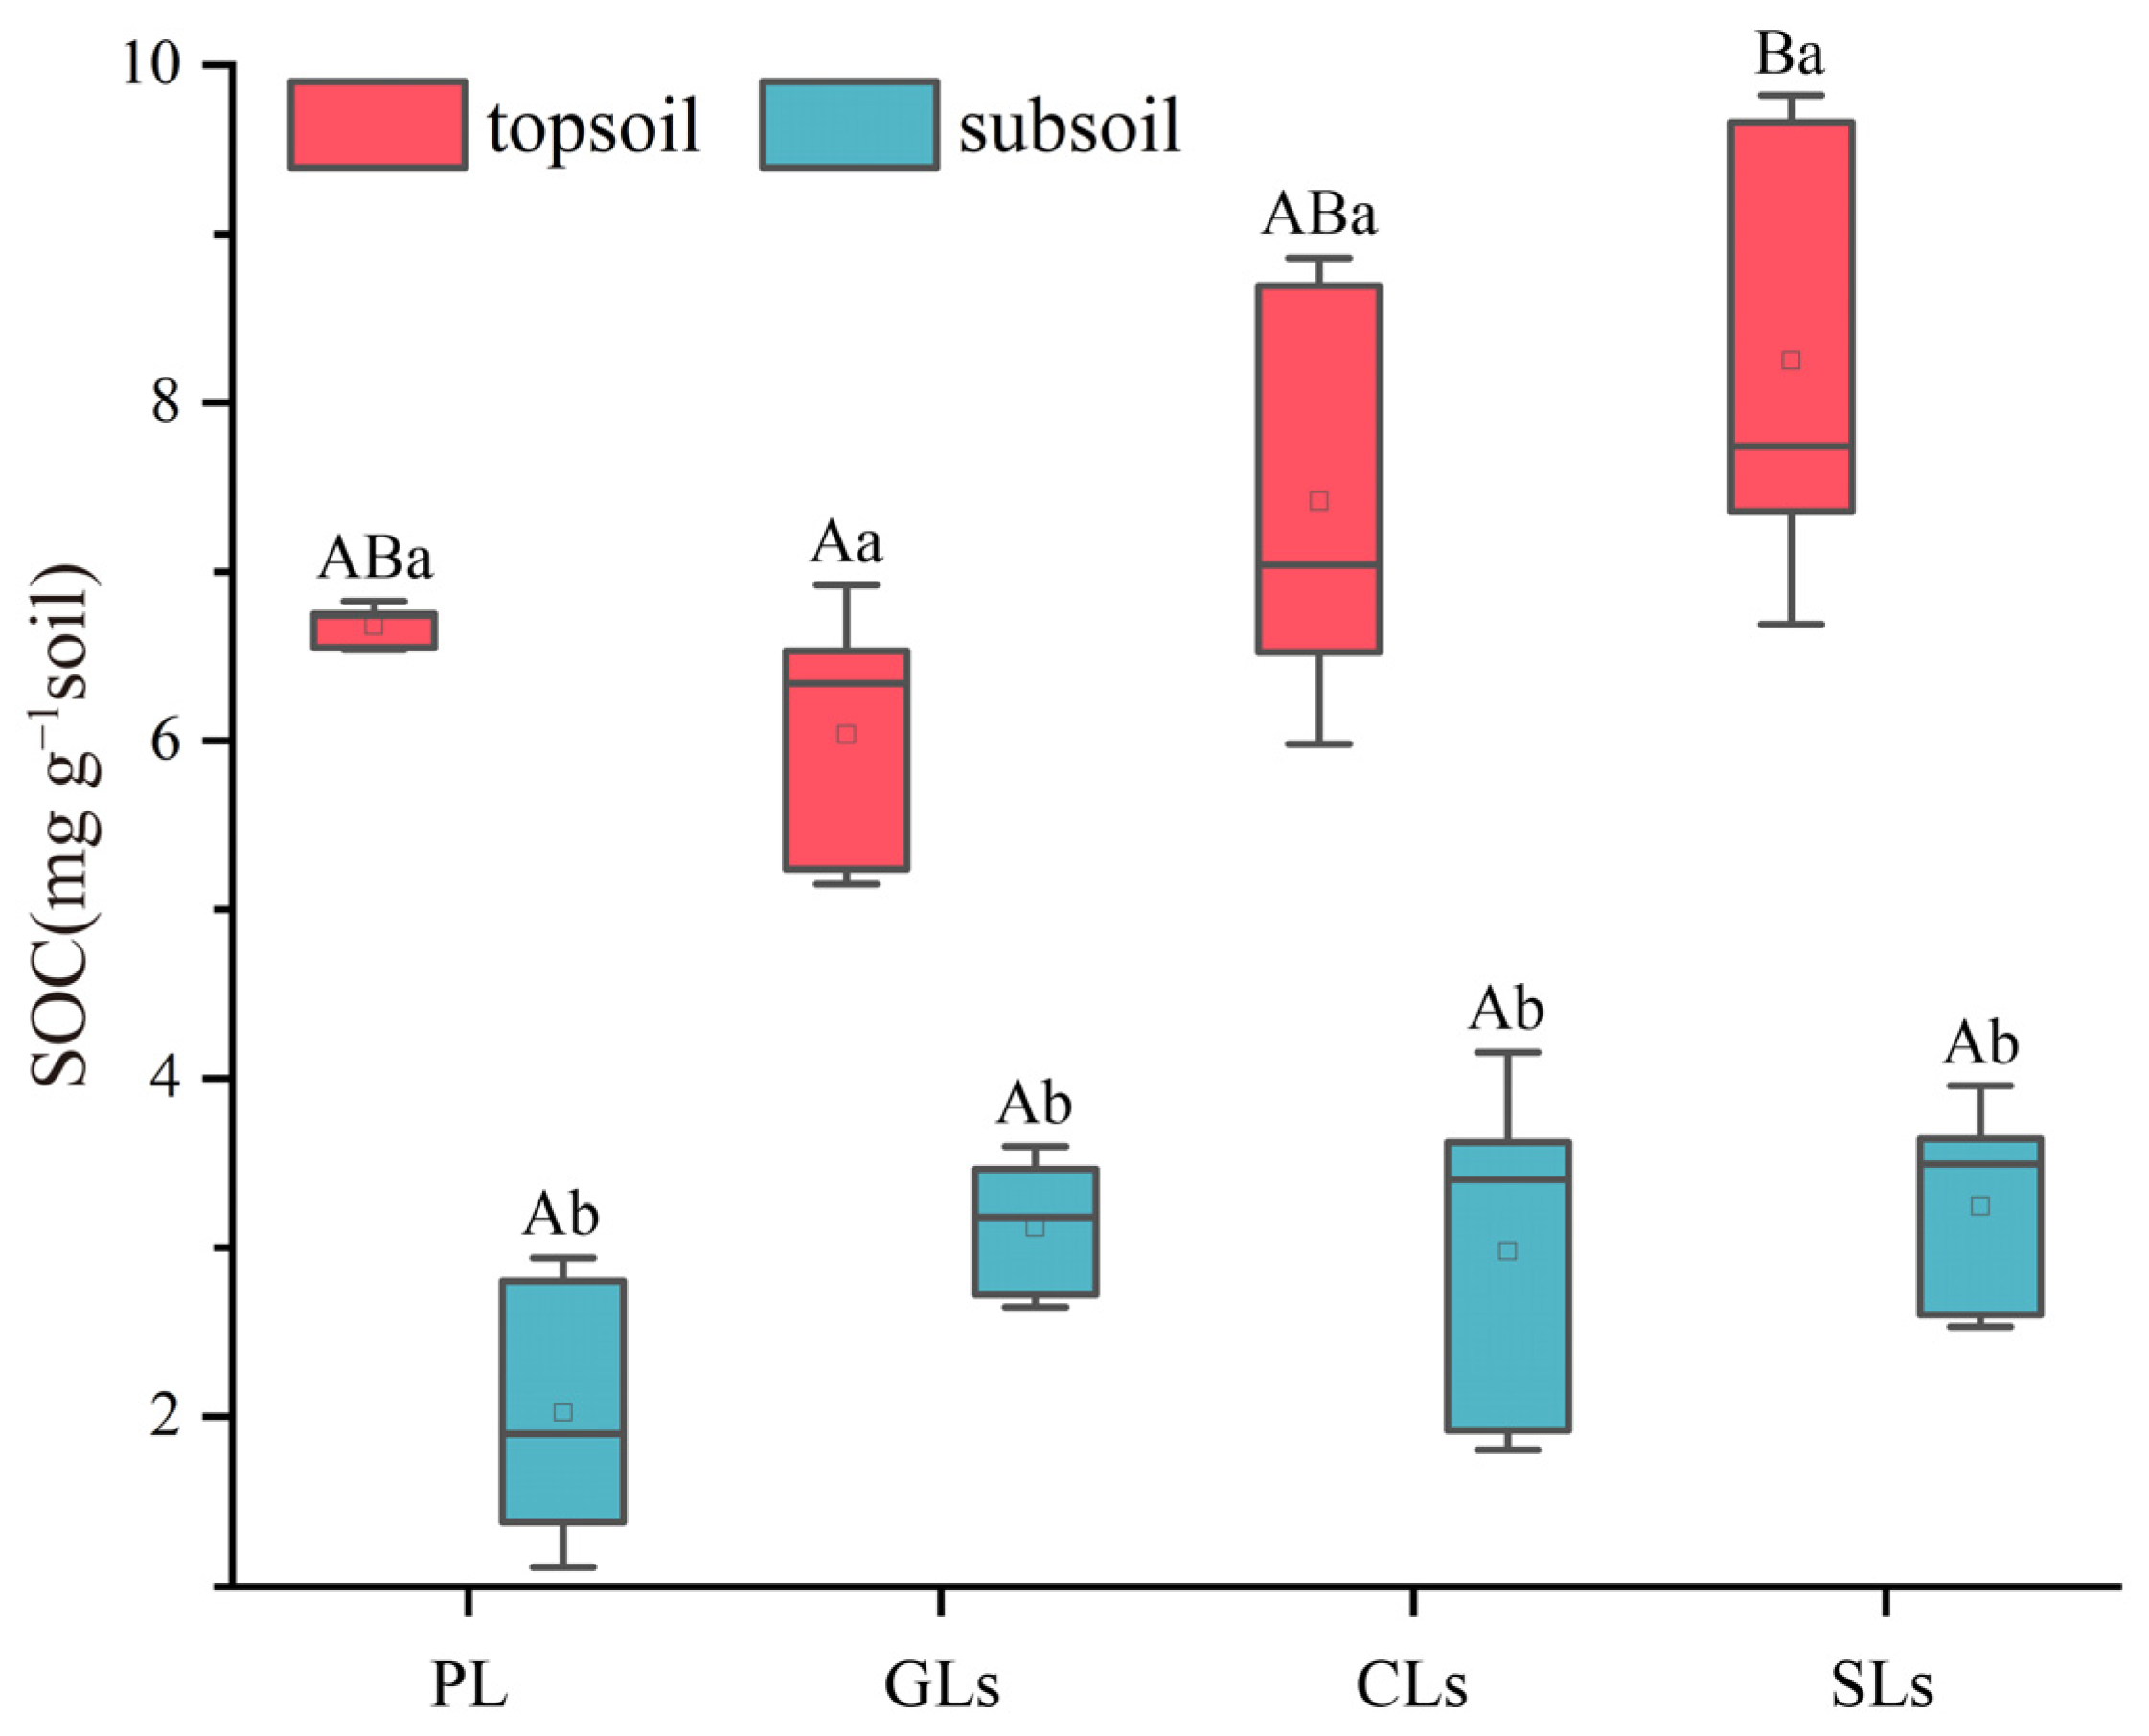
3.1. SOC Distribution Characteristics

The SOC contents of the four vegetation types decreased with increasing soil depth and were significantly different between top and subsoil (p < 0.05, Figure 2). The SOC content in the topsoil showed SLs > CLs > PL > GLs, where SOC content of SLs was significantly higher than that of GLs (p < 0.05). In the subsoil, the SOC content of the subsoil showed no significant difference among vegetation types (p > 0.05).

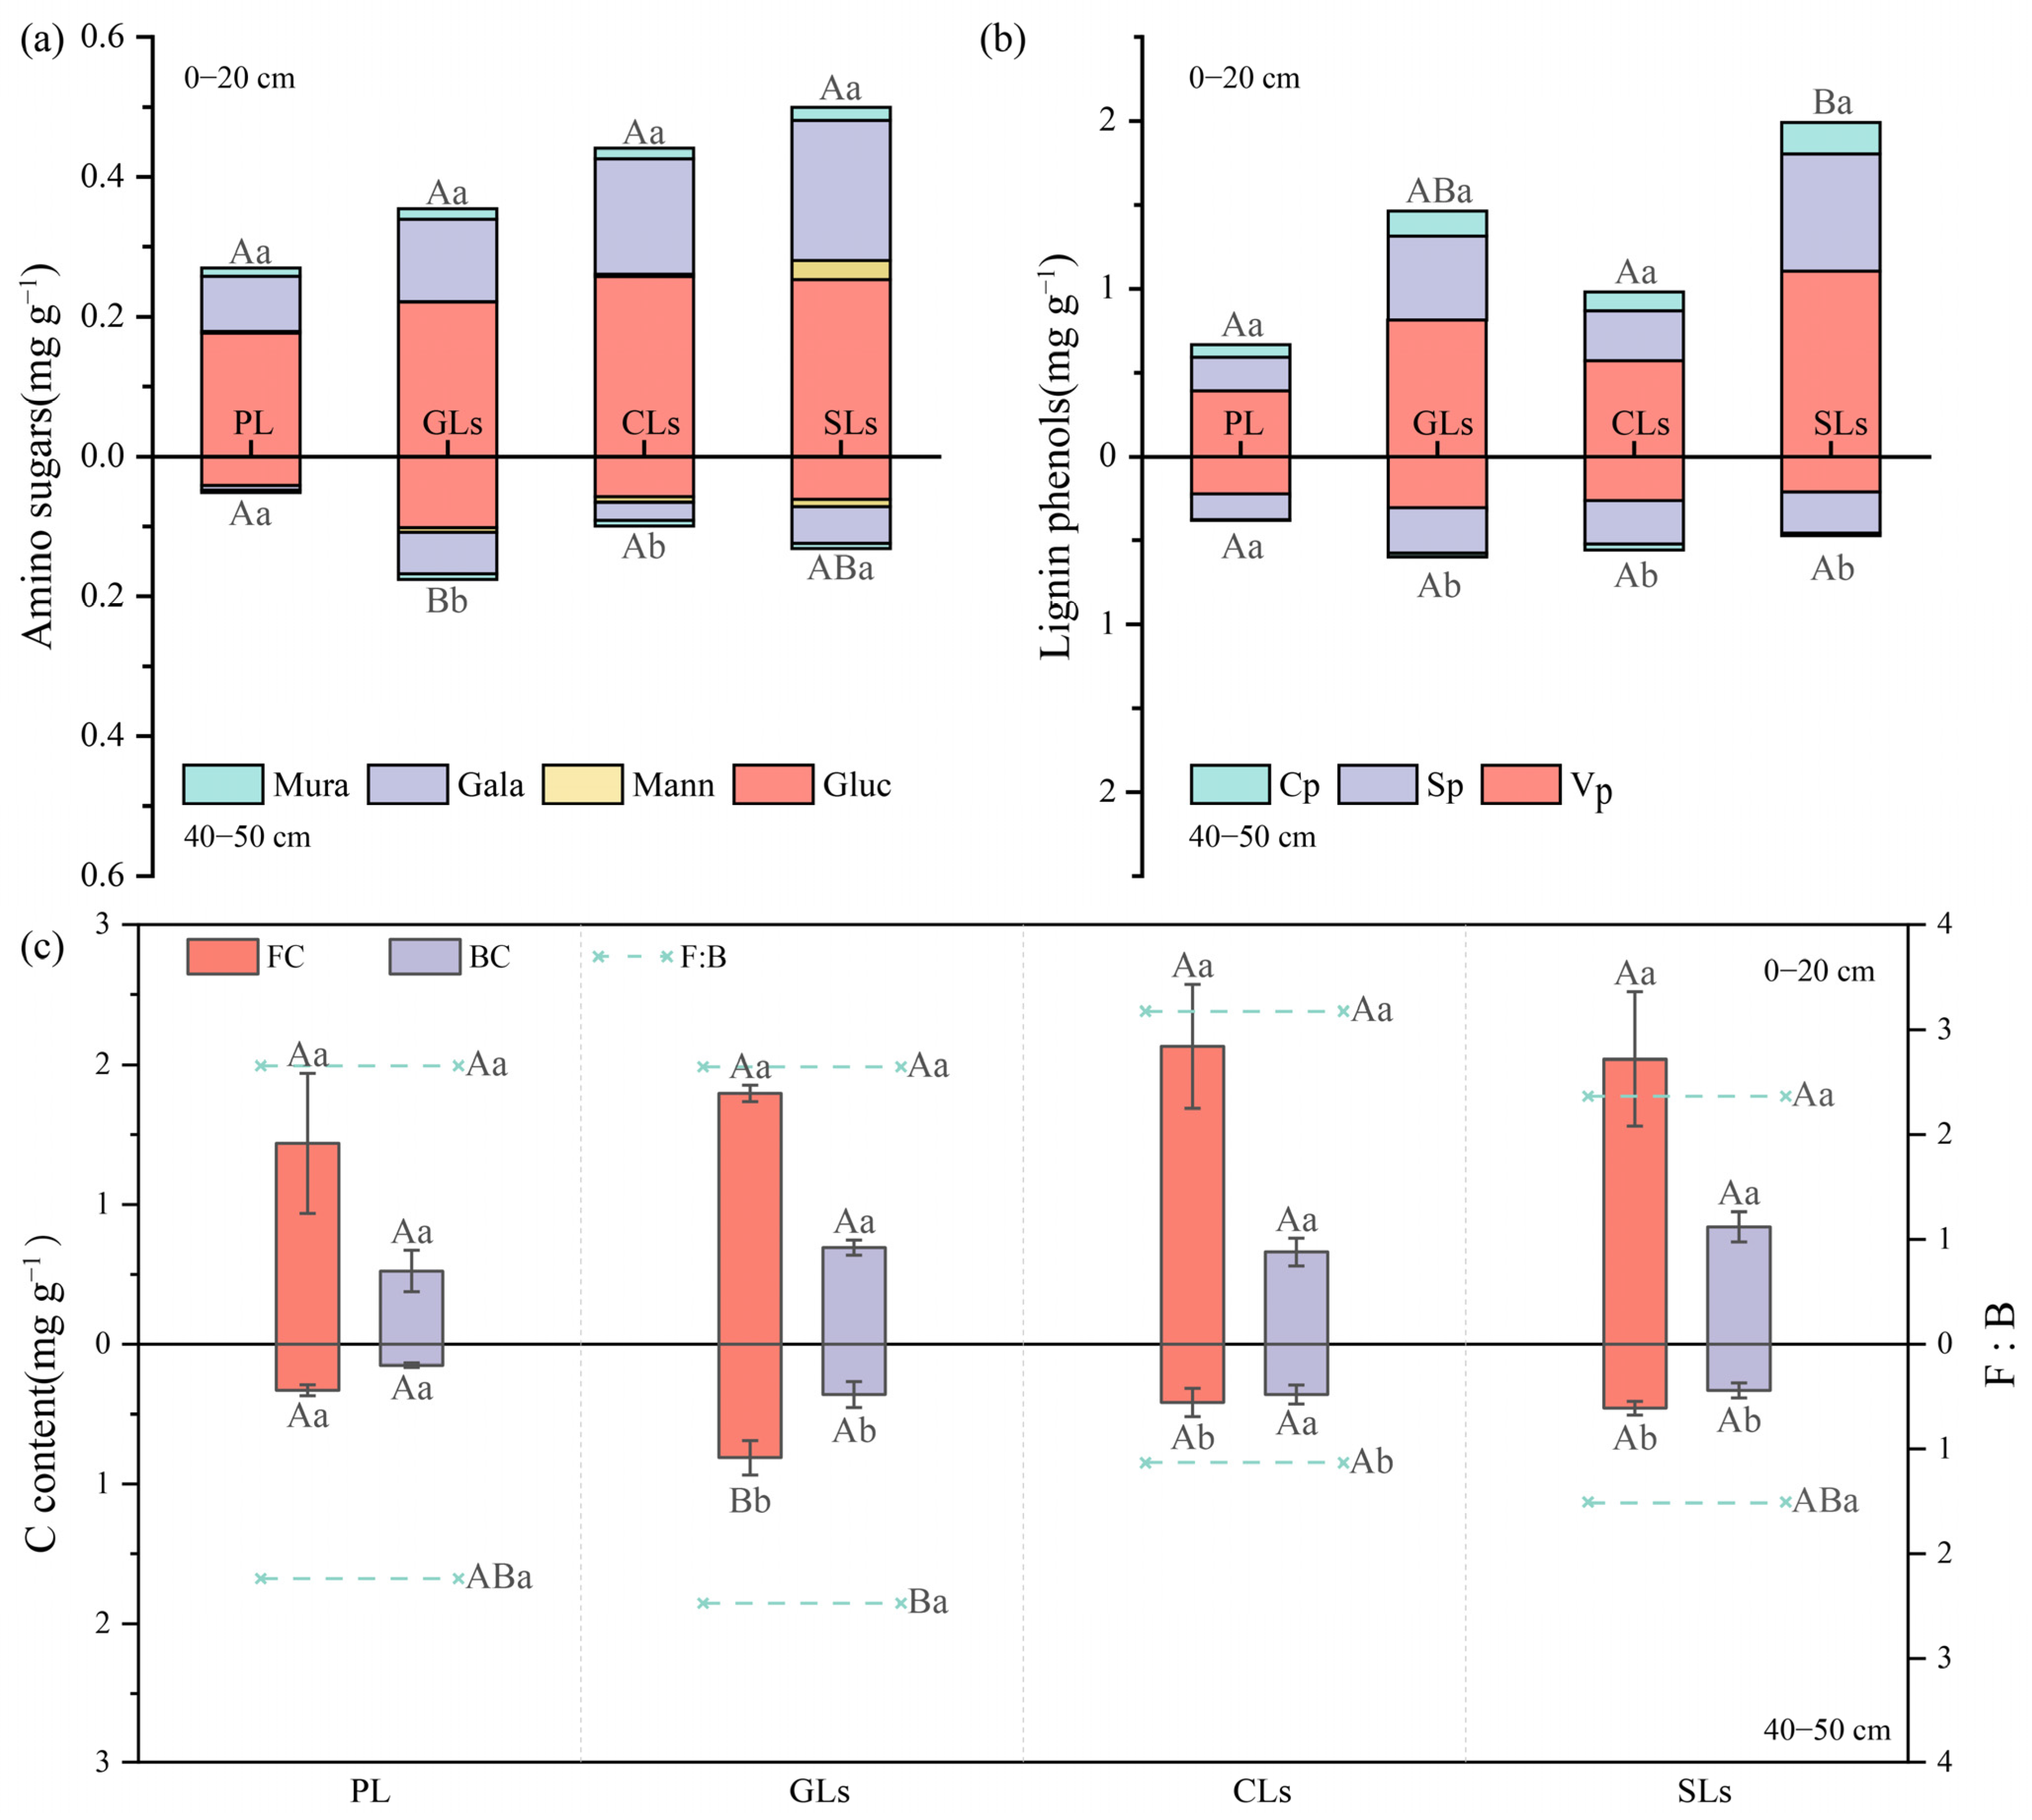
3.2. Amino Sugars, Lignin Phenols and Microbial Residue Carbon

In the topsoil, AS and LP contents decreased with increasing soil depth, consistent with SOC in the soil profile (Figure 2 and Figure 3a,b). The AS content of GLs and CLs was significantly different between the top and subsoil (p < 0.05, Figure 3a), but AS content of PL and SLs did not show significant differences in the soil profile (p > 0.05). In the topsoil, AS content did not differ significantly among vegetation types, but AS in GLs was significantly higher than that in PL and CLs in the subsoil.
The results of LP content showed that LP content decreased significantly with increasing soil depth in vegetation types except PL (p < 0.05, Figure 3b). The LP content in topsoil was significantly higher in SLs than in PL and CLs, but there was no significant difference among the vegetation types in subsoil (p > 0.05).
Significant differences of fungi residue carbon (FC) were shown between top and subsoil in vegetation types except PL, while bacterial residue carbon (BC) was significantly different in GLs and SLs in the soil profile (p < 0.05, Figure 3c). There was no significant difference in BC among vegetation types in either top or subsoil (p > 0.05). No significant differences were shown in FC among vegetation types in topsoil, but FC in GLs was significantly higher than that in the other three vegetation types in the subsoil.
The FC:BC ratio (F:B) in the topsoil was significantly higher than in the subsoil in CL (p < 0.05, Figure 3c). No significant differences were shown between the top and subsoil (p > 0.05) of the other three vegetation types. F:B did not show a significant difference among vegetation types in the topsoil, but in the subsoil, F:B in GLs was significantly higher than in CLs.

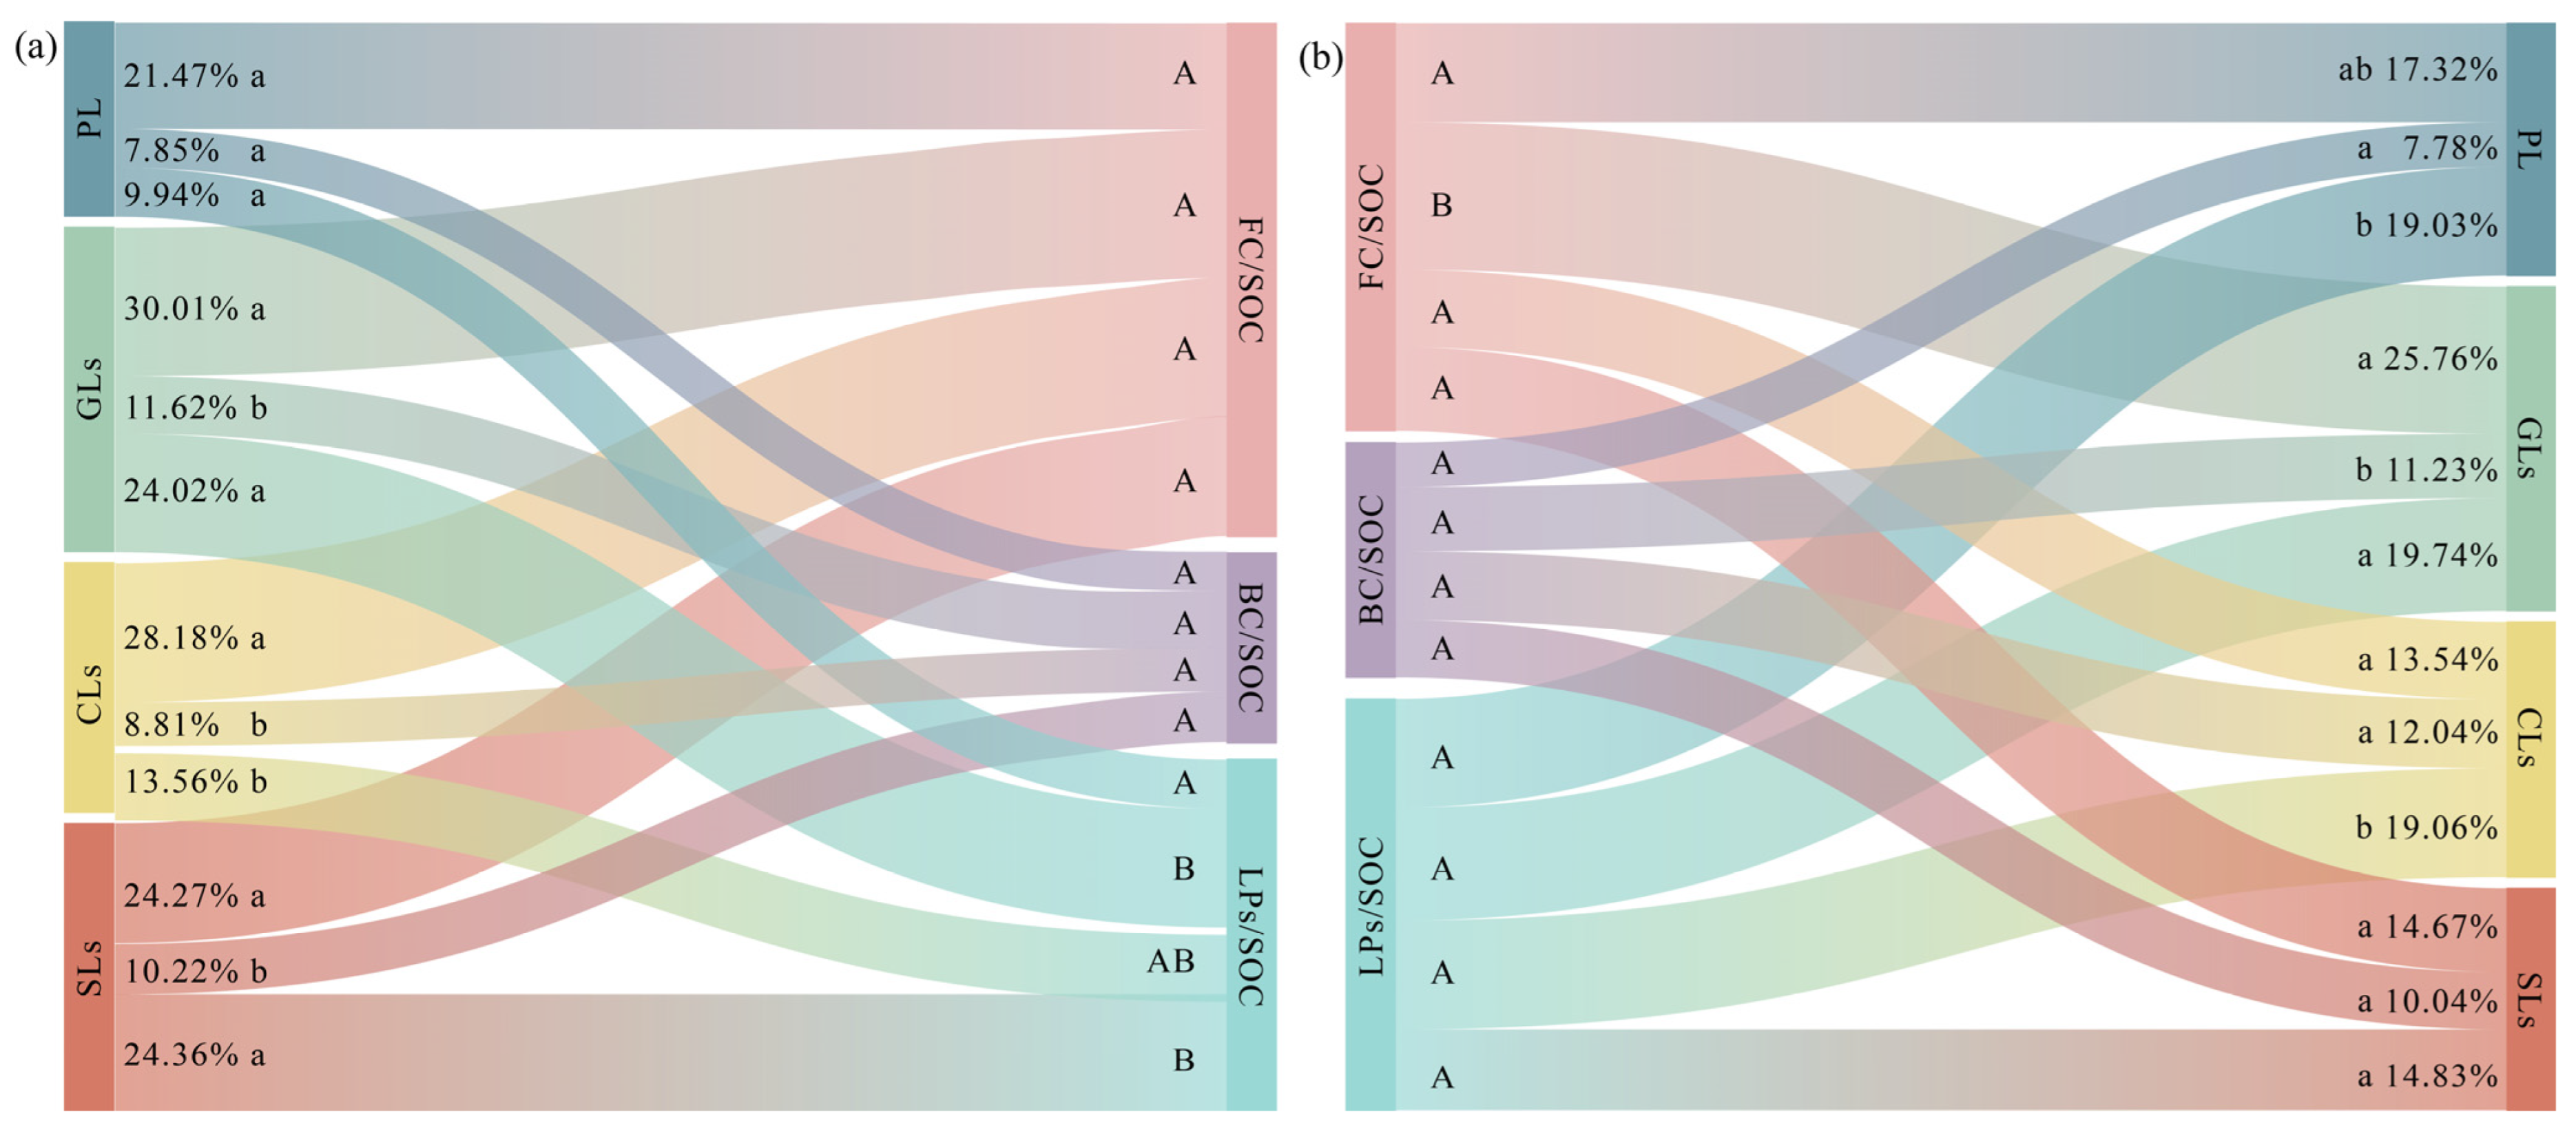
3.3. Contribution of Microbial Residue Carbon and Lignin Phenols to SOC

On the whole, in both top and subsoil, the contribution of LPs to SOC was lower than that of microbial residue carbon, and the contribution of FC was higher than that of BC (Figure 4a,b). In the topsoil, there was no significant difference in the contribution of FC, BC, and LPs to SOC in PL (p > 0.05). FC and LPs contributed significantly more to SOC than BC in GLs and SLs, and the contribution of FC was significantly higher than BC and LPs to SOC in CLs (p < 0.05). The contribution of FC and BC to SOC did not differ significantly among vegetation types, but the contribution of LPs to SOC was significantly higher in GLs and SLs than in PL (Figure 4a).
In the subsoil, the contribution of LPs to SOC was significantly higher than BC in PL (p < 0.05, Figure 4b), and the contribution of FC and LPs to SOC was significantly higher than BC in GLs, whereas the contribution of LPs was significantly higher than FC and BC in CLs, and there was no significant difference in the contribution of FC, BC, and LPs to SOC in SLs (p > 0.05). In the subsoil, the contribution of FC to SOC was significantly higher in GLs than in the other three vegetation types, while the contributions of FC and LPs to SOC did not differ significantly among the vegetation types.

3.4. Distribution and Influencing Factors of δ13C

The δ13C of litter showed GLs > CLs > PL > SLs, while the δ13C of topsoil showed CLs > SLs > GLs > PL, consistent with the performance of subsoil (Figure 5a). The δ13C difference between litter and topsoil (∆13Ct−l) was significantly different among vegetation types (p < 0.05, Figure 5b). The ∆13Ct−l of SLs was significantly higher than of the other three vegetation types (p < 0.05), followed by CLs, in which the ∆13Ct−l was significantly higher than GLs. However, the δ13C difference between topsoil and subsoil (∆13Cs−t) did not differ significantly among vegetation types (p > 0.05).
PLS results showed that the relative importance of plant factors to δ13C in topsoil was higher than that of microbial residue carbon (Figure 6a). The relative importance of δ13C in litter amounted to 49.76%, and the relative importance of cinnamyl phenol (Cp) and vanillyl phenol (Vp) exceeded 10% (16.86% and 10.62%, respectively). The relative importance of BC was higher than that of FC, with 5.04% and 1.80%, respectively. However, in the subsoil, the relative importance of plant factors to δ13C in soil decreased, with only Cp r exceeding 20%, Vp decreasing to 3.40%, and δ13C in litter decreasing to 9.31% (Figure 6b). The relative importance of FC was higher than that of BC (7.05% and 4.26, respectively), with an increase in ASs from 8.67% in the topsoil to 18.40% in the subsoil.

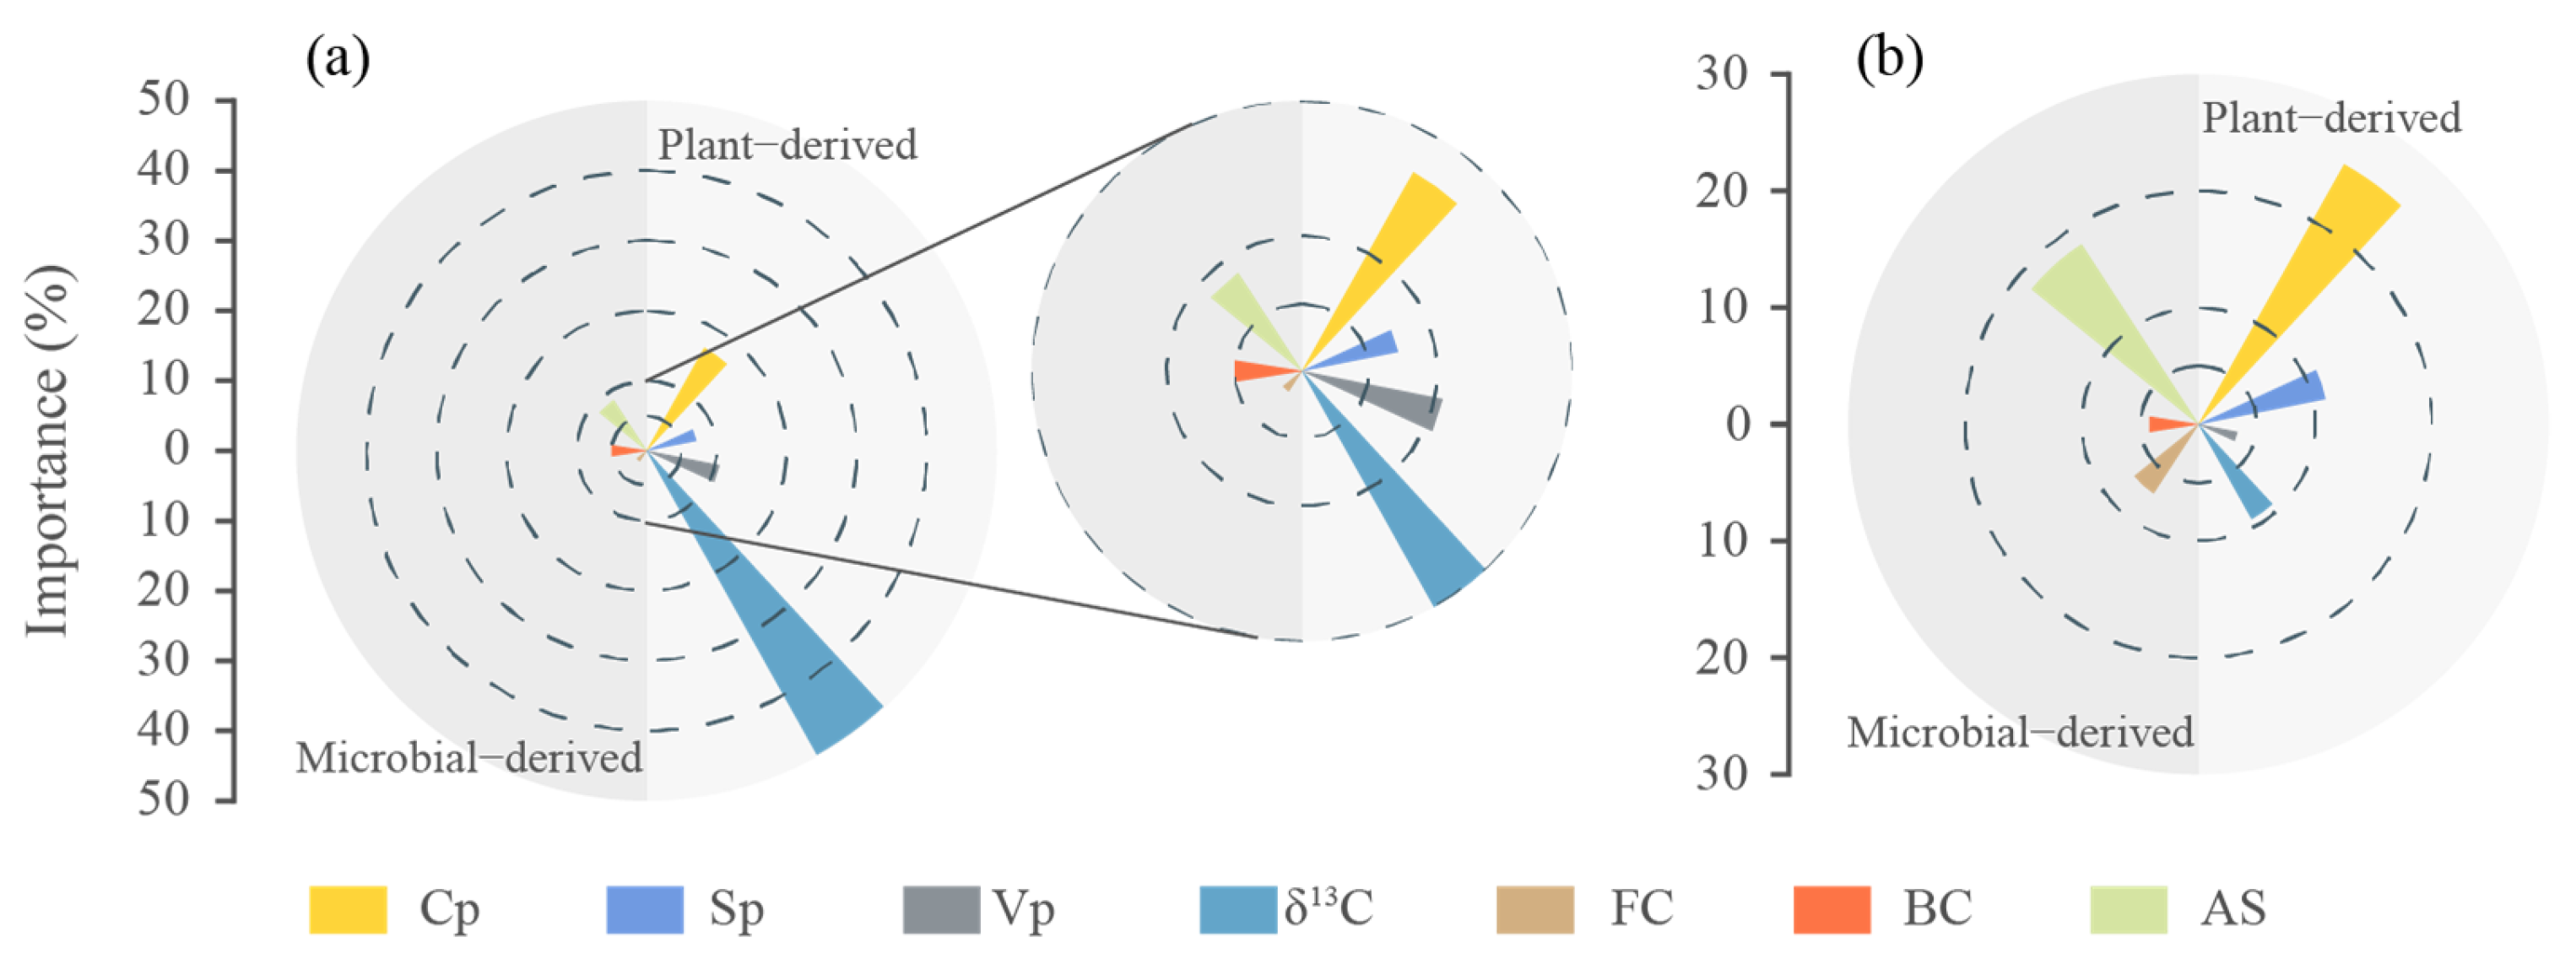
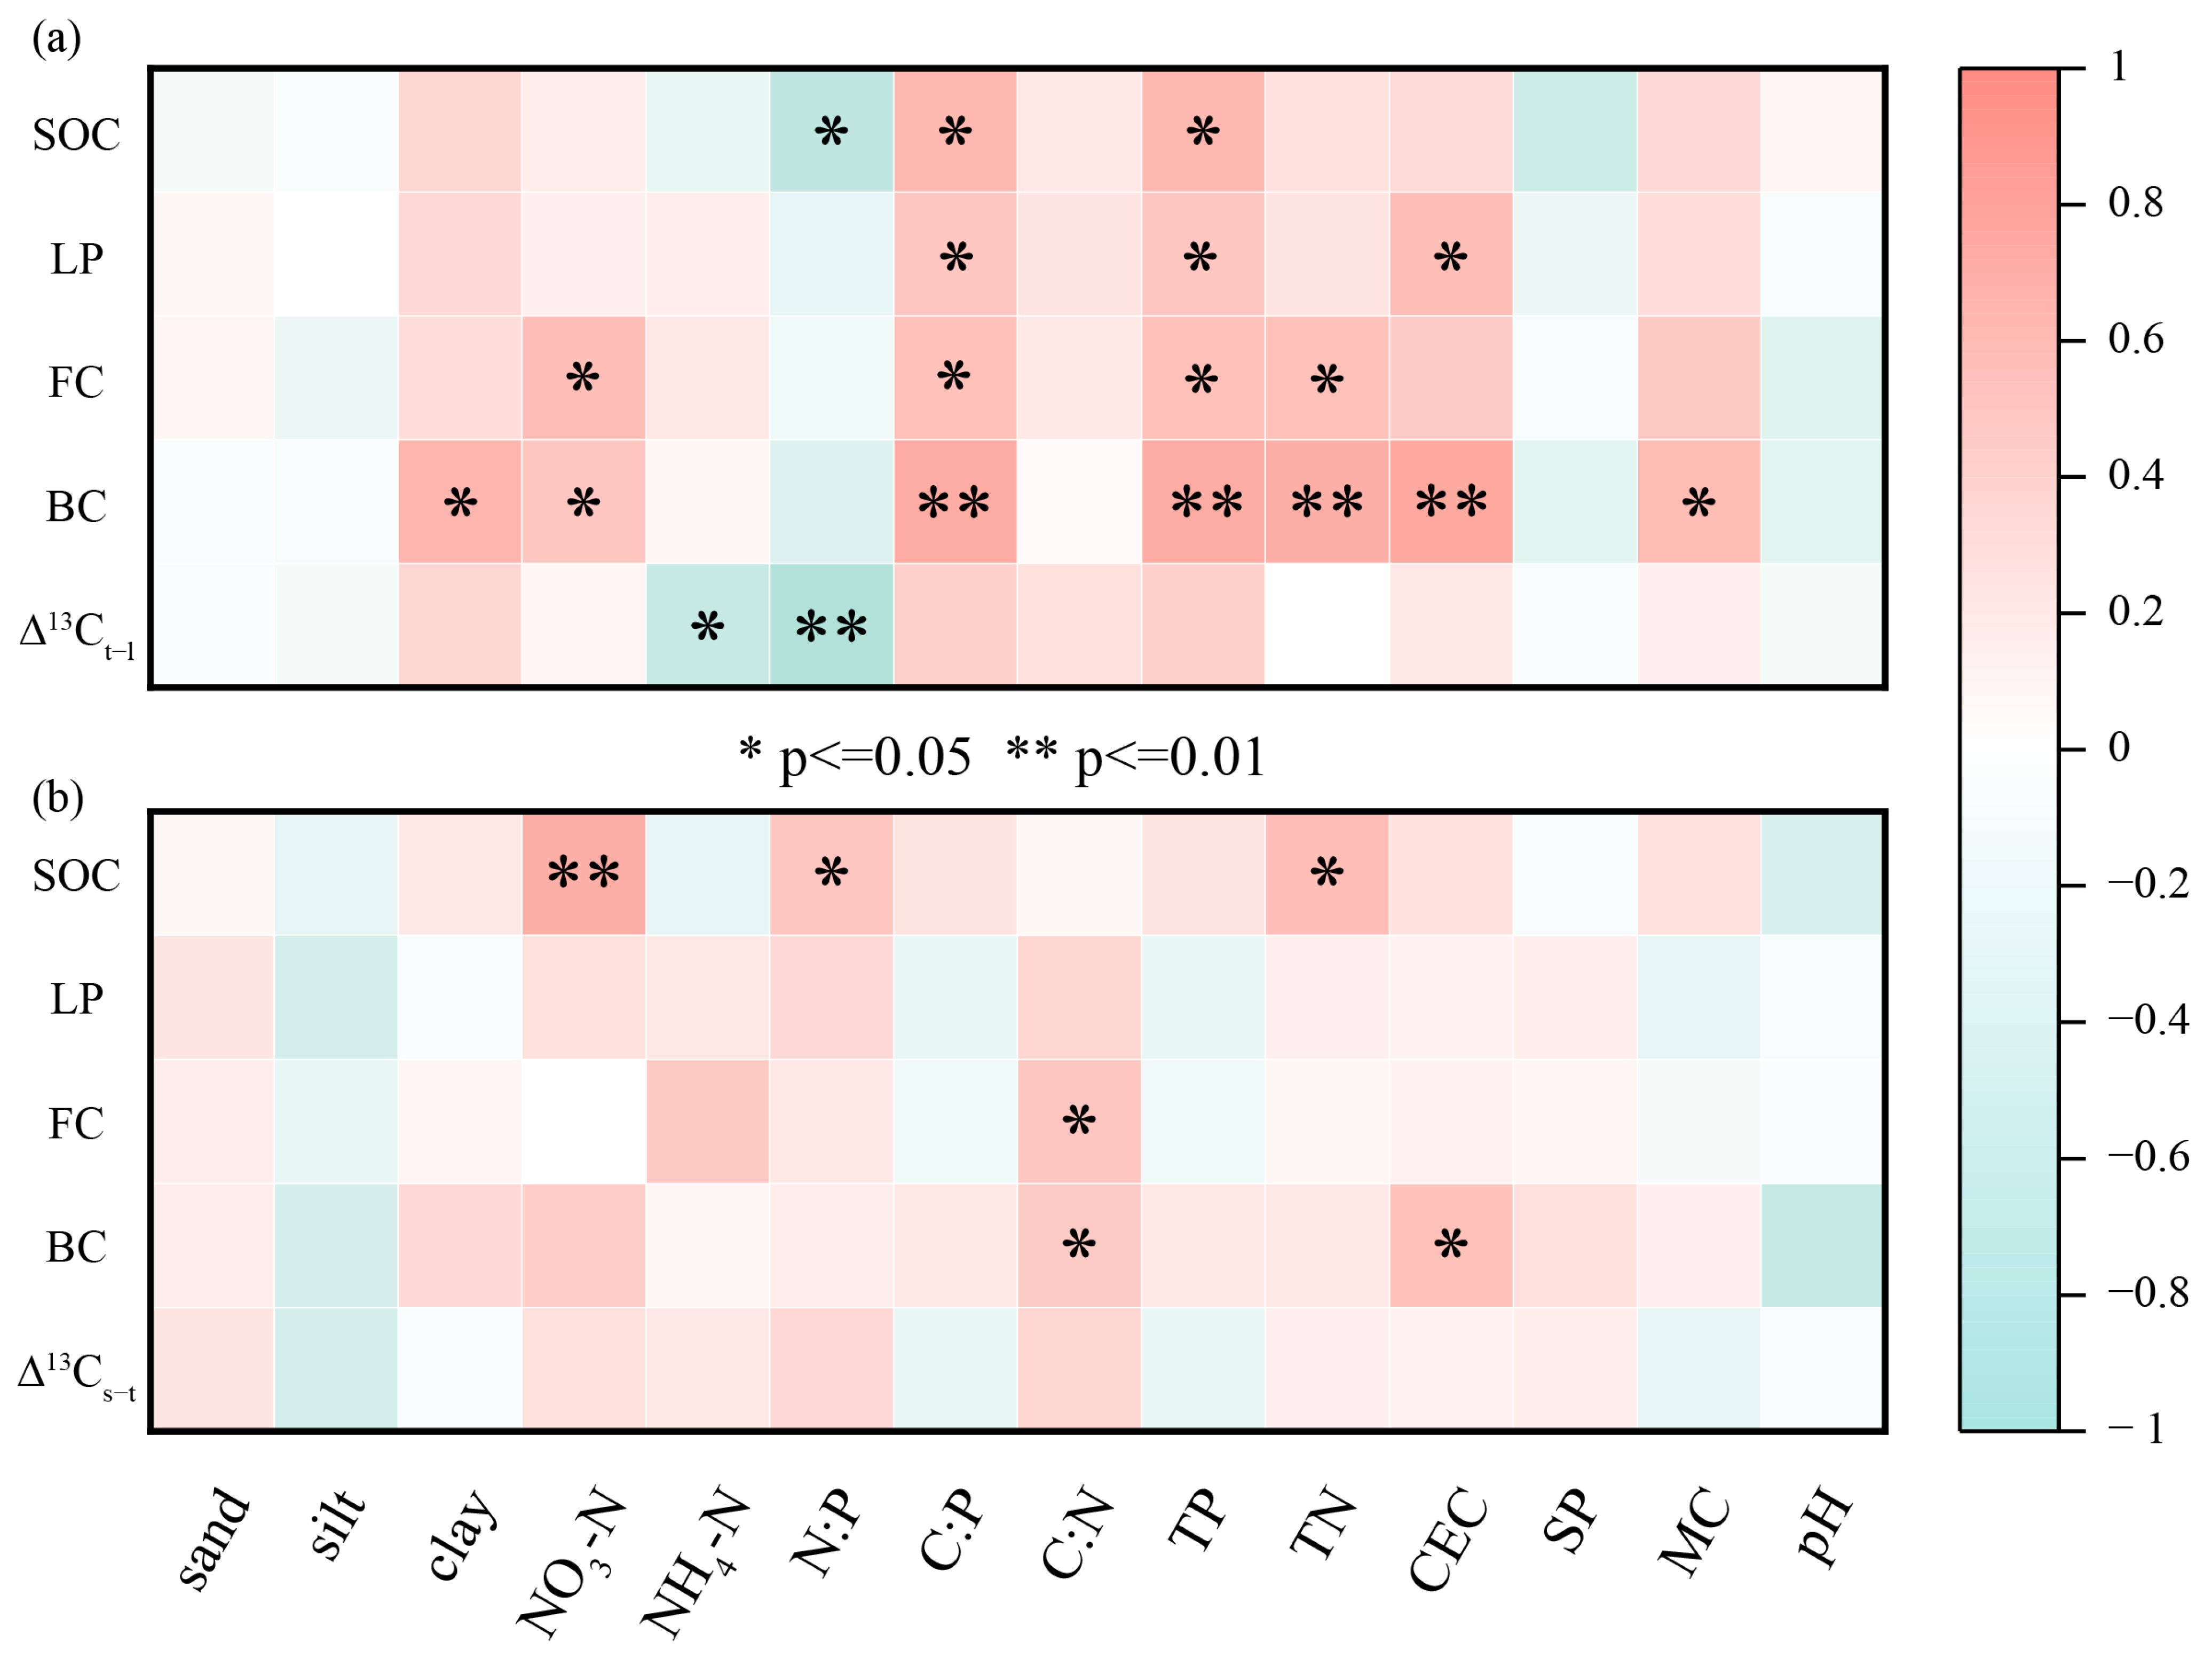
3.5. Influencing Factors of SOC, ∆13C, LPs, and Microbial Residue Carbon

In the topsoil, the ratio of carbon to phosphorus (C:P) and TP were significantly positively correlated with SOC, LPs, FC (p < 0.05), and BC (p < 0.01), while TN and NO 3 -N were significantly positively correlated with FC and BC, and MC was significantly positively correlated with BC (Figure 7a). N:P was significantly negatively correlated with SOC and ∆13Ct−l. In the subsoil, SOC was significantly positively correlated with TN and NO 3 -N, and the ratio of carbon to nitrogen (C:N) was significantly positively correlated with FC and BC. In both topsoil and subsoil, CEC was significantly positively correlated with BC.

4. Discussion

4.1. Distribution of SOC, LPs, and Microbial Residues

In our study, the distribution of SOC, microbial residue carbon, and LPs followed the same trend of decreasing with increasing soil depth (Figure 2 and Figure 3a,b), which was consistent with other studies [31,32]. This is mainly because litter and root secretion inputs are mainly concentrated in the topsoil and gradually decrease with increasing soil depth. At the same time, microorganisms in the topsoil have easier access to carbon sources and nutrients, which makes the microbial biomass in the topsoil more abundant and active than that in the subsoil, so that the AS content in the topsoil is higher than that in the subsoil [33].
SOC in the topsoil showed significant differences among vegetation types (Figure 2), consistent with the trend of LPs, which was the highest in SLs (Figure 3b). However, no significant differences were found in ASs, FC, BC, and F:B (Figure 3a,c). Similarly, in the analysis of contributions to SOC in topsoil, there was no significant difference in the contribution of microbial residue carbon to SOC, but the contribution of LPs to SOC was significantly higher in SLs and GLs (Figure 4a). This may be due to the fact that shrubs are formed during the later stages of grassland development. Typically, a combination of rich grassland and few shrubs appear in the recovery areas after 2–3 years, and shrub communities appear after 10 years [34]. The shrub litter layer is thinner and more perishable, while the shrub soil root system is shallow, abundant, large, and dense [21]. The shrub system is mature, which leads to the accumulation of LPs and SOC in the topsoil. Therefore, the accumulation of SOC in topsoil may depend more on the accumulation of LPs and be influenced by the differences in plant inputs from different vegetation types.
In the subsoil, SOC and LPs were not significantly different among vegetation types (Figure 2 and Figure 3b), but GLs had the significantly highest AS content (Figure 3a), and its FC and F:B were significantly higher than that of the other three vegetation types (Figure 3c). Meanwhile, the contribution of FC to SOC in GLs was significantly higher than that of the other three vegetation types (Figure 4b). This indicated that the abundance of soil fungal communities in the subsoil of different vegetation types was different. Plant inputs can influence the accumulation of microbial residue carbon in the surface layer, but in the subsoil, the influence of plant inputs on microbial residue carbon is weakened [35]. Therefore, the differences in microbial residue carbon among vegetation types in subsoil may be due to differences in the physical and chemical properties of the soil under the influence of different vegetation types, leading to the existence of specific microbial communities and corresponding abundance adapted to each vegetation type [36]. That is, in the subsoil, the influence of plant inputs on SOC is weakened, and vegetation types may influence the nutrient elements of the subsoil and thus the distribution of microbial systems, leading to differences in microbial residue carbon.

4.2. Stable Isotope Patterns

In our study, δ13C increased along litter—topsoil—subsoil, which was consistent with previous studies [37,38]. Soil δ13C values were similar in the four vegetation types, although their litter δ13C differences were large (Figure 5). According to the “carbon mixing” hypothesis, soil δ13C reflects carbon isotope information not only from the soil, but also from vegetative sources [15]. In the topsoil, the relative importance of plant factors to δ13C in topsoil is higher than that of microbial residue carbon (Figure 6a). Whereas the LP content of SLs was significantly higher than that of CLs and PL (Figure 3b), ∆13Ct−l also proved to be significantly higher in SLs than in CLs and PL (Figure 5b). Among these vegetation types, the higher δ13C of litter in GLs may be due to the fact that plant litter of GLs can be partially decomposed at the soil surface to the extent that litter enters the soil in a different initial state [21,39,40]. The above results indicate that δ13C in topsoil is mainly influenced by plant inputs. It has been suggested that fresh carbon assimilates had a significant effect on δ13C in topsoil [16,41,42], which is consistent with our findings.
In the subsoil, it was microbial residue carbon that had high relative importance to δ13Ct−l (Figure 6), consistent with the trend shown for ∆13Ct−l and ASs (Figure 3a and Figure 5b). The higher the ∆13C of SOC, the higher the isotopic fractionation and the higher the soil degradation [43]. Although ∆13Ct−l of different vegetation types did not differ significantly in our study, ∆13Ct−l of GLs was higher than that of CLs and PL, while the AS content of GLs in the subsoil was significantly higher than that of the other three vegetation types. This suggests that the accumulation of microbial residues in subsoil leads to the enrichment of 13C. From an energetic point of view, microbial residues in soil are preferentially utilized by microorganisms [44]. Microorganisms tend to bind existing compounds rather than synthesize new compounds, which can lead to the enrichment of 13C. 13C enrichment often implies the aging of organic matter [45].
Overall, δ13C is more affected by plant factors in the topsoil, whereas the relative importance of microbial residues on δ13C was higher in the subsoil. This may be due to the fact that in the topsoil, although microbial biomass may be higher than in the subsoil due to fresh carbon inputs [33], there are a lot of plant inputs to the topsoil, which lead to the fact that SOC and δ13C may be more affected by plant inputs. However, in the subsoil, microbial biomass and its residues have a greater effect on δ13C. Kohl et al. [38] found that δ13C of microbial biomass increased in relation to soil depth. Fungi have higher δ13C than bacteria, so a decrease in the ratio of fungi to bacteria in the soil may lead to an increase in δ13C in the soil profile. In CLs, the F:B ratio was significantly different between top and subsoils (Figure 3c), which may also explain its lower ∆13Cs−t.

4.3. Environmental Factors That Control SOC Accumulation

In both top and subsoil, SOC, LPs, and microbial residue carbon were mainly controlled by nutrient elements (Figure 7). In topsoil, SOC, LPs, and microbial residues were all affected by C:P, TN, and TP, whereas they were mainly influenced by C:N and TN in the subsoil. If the soil is low in nutrients, plant and microbial growth can be limited [36,46], which may lead to decreased microbial function. In nutrition-limited ecosystems, microorganisms will use more energy for catabolism rather than synthesizing their biomass, which leads to lower microbial synthesis efficiency and affects the efficiency of microbial carbon production, which affects the accumulation of SOC [47,48]. In nitrogen-rich soils, microbial synthesis efficiency is elevated [49,50], which favors the accumulation of microbial residue carbon and SOC. The higher SOC of CLs in topsoil may be due to the addition of fertilizers during crop growth. The addition of nitrogen fertilizer can increase the contribution of microbial residue carbon to SOC [51,52]; therefore, the topsoil of CLs had a higher content of ASs and FC (Figure 3a,c).

5. Conclusions

SOC, LPs, and microbial residues of carbon decreased with soil depth. In the topsoil, the trend of SOC performance was consistent with the trend of LPs, both being highest in SLs. And the relative contribution of plant factors to δ13C was higher, while the relative contribution of microbial residue carbon to δ13C was higher in the subsoil. In both top- and subsoil, the main factor controlling the influence of SOC, LPs, and microbial residues was the nutrient composition of the soil, with more nutrient-rich soils being more favorable for SOC accumulation. We suggest that vegetation types can regulate SOC sequestration mechanisms by influencing plant inputs and soil nutrient elements. Meanwhile, different plant inputs under different vegetation types led to differences in δ13C in the topsoil, while different compositions of the microbial community affected δ13C enrichment in the subsoil. Among the four vegetation types, SLs may be more favorable to SOC accumulation in the topsoil, while GLs may be more favorable to SOC accumulation in the subsoil. This study facilitates an in-depth understanding of the effects of vegetation types on SOC sequestration mechanisms and δ13C enrichment modes and helps to develop more targeted ecological restoration measures for increasing SOC accumulation.

Author Contributions

Y.S. contributed writing—original draft, conceptualization, investigation and formal analysis. X.W. contributed funding acquisition, investigation, and writing—review and editing. Y.Z. contributed investigation, formal analysis, and writing—review and editing. W.D. contributed data curation, formal analysis, and methodology. J.X. and J.W. contributed to the investigation, formal analysis, and data curation. T.D. contributed investigation and formal analysis. All authors have read and agreed to the published version of the manuscript.

Funding

This research was funded by the National Natural Science Foundation of China (NSFC 42271079) and the Key Research and Development Program of Gansu Province (22YF7FA020).

Institutional Review Board Statement

Not applicable.

Informed Consent Statement

Not applicable.

Data Availability Statement

The raw data supporting the conclusions of this article will be made available by the authors on request.

Conflicts of Interest

The authors declare no conflicts of interest.

References

  1. Pries, C.E.H.; Castanha, C.; Porras, R.C.; Torn, M.S. The whole-soil carbon flux in response to warming. Science 2017, 355, 1420–1422. [Google Scholar] [CrossRef] [PubMed]
  2. Wiesmeier, M.; Urbanski, L.; Hobley, E.; Lang, B.; von Luetzow, M.; Marin-Spiotta, E.; van Wesemael, B.; Rabot, E.; Liess, M.; Garcia-Franco, N.; et al. Soil organic carbon storage as a key function of soils—A review of drivers and indicators at various scales. Geoderma 2019, 333, 149–162. [Google Scholar] [CrossRef]
  3. Friggens, N.L.; Hester, A.J.; Mitchell, R.J.; Parker, T.C.; Subke, J.-A.; Wookey, P.A. Tree planting in organic soils does not result in net carbon sequestration on decadal timescales. Glob. Change Biol. 2020, 26, 5178–5188. [Google Scholar] [CrossRef] [PubMed]
  4. Xu, H.; Qu, Q.; Lu, B.; Zhang, Y.; Liu, G.; Xue, S. Variation in soil organic carbon stability and driving factors after vegetation restoration in different vegetation zones on the Loess Plateau, China. Soil Tillage Res. 2020, 204, 104727. [Google Scholar] [CrossRef]
  5. LiuSui, Y.; Zhu, X.; Li, D.; Yan, C.; Sun, T.; Jia, H.; Zhao, X. Soil aggregate and intra-aggregate carbon fractions associated with vegetation succession in an alpine wetland of Northwest China. Catena 2019, 181, 104107. [Google Scholar] [CrossRef]
  6. Bach, E.M.; Williams, R.J.; Hargreaves, S.K.; Yang, F.; Hofmockel, K.S. Greatest soil microbial diversity found in micro-habitats. Soil Biol. Biochem. 2018, 118, 217–226. [Google Scholar] [CrossRef]
  7. Thevenot, M.; Dignac, M.-F.; Rumpel, C. Fate of lignins in soils: A review. Soil Biol. Biochem. 2010, 42, 1200–1211. [Google Scholar] [CrossRef]
  8. Lehmann, J.; Kleber, M. The contentious nature of soil organic matter. Nature 2015, 528, 60–68. [Google Scholar] [CrossRef] [PubMed]
  9. Schmidt, M.W.I.; Torn, M.S.; Abiven, S.; Dittmar, T.; Guggenberger, G.; Janssens, I.A.; Kleber, M.; Koegel-Knabner, I.; Lehmann, J.; Manning, D.A.C.; et al. Persistence of soil organic matter as an ecosystem property. Nature 2011, 478, 49–56. [Google Scholar] [CrossRef] [PubMed]
  10. Liang, C.; Schimel, J.P.; Jastrow, J.D. The importance of anabolism in microbial control over soil carbon storage. Nat. Microbiol. 2017, 2, 17105. [Google Scholar] [CrossRef] [PubMed]
  11. Liang, C.; Balser, T.C. Microbial production of recalcitrant organic matter in global soils: Implications for productivity and climate policy. Nat. Rev. Microbiol. 2011, 9, 75. [Google Scholar] [CrossRef] [PubMed]
  12. Simpson, A.J.; Simpson, M.J.; Smith, E.; Kelleher, B.P. Microbially derived inputs to soil organic matter: Are current estimates too low? Environ. Sci. Technol. 2007, 41, 8070–8076. [Google Scholar] [CrossRef] [PubMed]
  13. Liang, C.; Zhu, X. The soil Microbial Carbon Pump as a new concept for terrestrial carbon sequestration. Sci. China Earth Sci. 2021, 64, 545–558. [Google Scholar] [CrossRef]
  14. Feng, J.; He, K.; Zhang, Q.; Han, M.; Zhu, B. Changes in plant inputs alter soil carbon and microbial communities in forest ecosystems. Glob. Change Biol. 2022, 28, 3426–3440. [Google Scholar] [CrossRef] [PubMed]
  15. Klink, S.; Keller, A.B.; Wild, A.J.; Baumert, V.L.; Gube, M.; Lehndorff, E.; Meyer, N.; Mueller, C.W.; Phillips, R.P.; Pausch, J. Stable isotopes reveal that fungal residues contribute more to mineral-associated organic matter pools than plant residues. Soil Biol. Biochem. 2022, 168, 108634. [Google Scholar] [CrossRef]
  16. Deng, L.; Wang, K.; Tang, Z.; Shangguan, Z. Soil organic carbon dynamics following natural vegetation restoration: Evidence from stable carbon isotopes (delta C-13). Agric. Ecosyst. Environ. 2016, 221, 235–244. [Google Scholar] [CrossRef]
  17. Diochon, A.; Kellman, L. Natural abundance measurements of 13C indicate increased deep soil carbon mineralization after forest disturbance. Geophys. Res. Lett. 2008, 35, 5. [Google Scholar] [CrossRef]
  18. Koesters, R.; Du Preez, C.C.; Amelung, W. Lignin dynamics in secondary pasture soils of the South African Highveld. Geoderma 2018, 319, 113–121. [Google Scholar] [CrossRef]
  19. Ruiz Pessenda, L.C.; Marques Gouveia, S.E.; Ribeiro, A.d.S.; De Oliveira, P.E.; Aravena, R. Late Pleistocene and Holocene vegetation changes in northeastern Brazil determined from carbon isotopes and charcoal records in soils. Palaeogeogr. Palaeoclimatol. Palaeoecol. 2010, 297, 597–608. [Google Scholar] [CrossRef]
  20. Jiang, Z.-Y.; Hu, Z.-M.; Lai, D.Y.F.; Han, D.-R.; Wang, M.; Liu, M.; Zhang, M.; Guo, M.-Y. Light grazing facilitates carbon accumulation in subsoil in Chinese grasslands: A meta-analysis. Glob. Change Biol. 2020, 26, 7186–7197. [Google Scholar] [CrossRef] [PubMed]
  21. Xiao, J.; Zhao, Y.; Wang, X.; Hao, Z.; Wang, K.; Jiang, S.; Liu, H.; Zhou, X. Effects of recovery models on organic carbon pathways: A method using C-13 natural abundance. Agric. Ecosyst. Environ. 2022, 328, 107851. [Google Scholar] [CrossRef]
  22. Li, J.; Wang, X.; Jia, H.; Liu, Y.; Zhao, Y.; Shi, C.; Zhang, F.; Wang, K. Assessing the soil moisture effects of planted vegetation on slope stability in shallow landslide-prone areas. J. Soils Sediments 2021, 21, 2551–2565. [Google Scholar] [CrossRef]
  23. Zhou, Y.; Yue, D.; Guo, J.; Chao, Z.; Meng, X. Assessing the impact of land conversion and management measures on the net primary productivity in the Bailong River Basin, in China. Catena 2021, 207, 105672. [Google Scholar] [CrossRef]
  24. Zhao, Y.F.; Wang, X.; Ou, Y.S.; Jia, H.X.; Li, J.; Shi, C.M.; Liu, Y. Variations in soil δ13C with alpine meadow degradation on the eastern Qinghai-Tibet Plateau. Geoderma 2019, 338, 178–186. [Google Scholar] [CrossRef]
  25. Aran, D.; Maul, A.; Masfaraud, J.-F. A spectrophotometric measurement of soil cation exchange capacity based on cobaltihexamine chloride absorbance. Comptes Rendus Geosci. 2008, 340, 865–871. [Google Scholar] [CrossRef]
  26. Zhang, X.D.; Amelung, W. Gas chromatographic determination of muramic acid, glucosamine, mannosamine, and galactosamine in soils. Soil Biol. Biochem. 1996, 28, 1201–1206. [Google Scholar] [CrossRef]
  27. Hedges, J.I.; Ertel, J.R. Characterization of lignin by gas capillary chromatography of cupric oxide oxidation products. Anal. Chem. 1982, 54, 174–178. [Google Scholar] [CrossRef]
  28. Six, J.; Elliott, E.T.; Paustian, K.; Doran, J.W. Aggregation and soil organic matter accumulation in cultivated and native grassland soils. Soil Sci. Soc. Am. J. 1998, 62, 1367–1377. [Google Scholar] [CrossRef]
  29. Chen, X.B.; Xia, Y.H.; Hu, Y.J.; Gunina, A.; Ge, T.D.; Zhang, Z.H.; Wu, J.S.; Su, Y.R. Effect of nitrogen fertilization on the fate of rice residue-C in paddy soil depending on depth: 13C amino sugar analysis. Biol. Fertil. Soils 2018, 54, 523–531. [Google Scholar] [CrossRef]
  30. Liang, C.; Amelung, W.; Lehmann, J.; Kästner, M. Quantitative assessment of microbial necromass contribution to soil organic matter. Glob. Change Biol. 2019, 25, 3578–3590. [Google Scholar] [CrossRef] [PubMed]
  31. Ma, T.; Dai, G.H.; Zhu, S.S.; Chen, D.M.; Chen, L.T.; Lü, X.T.; Wang, X.B.; Zhu, J.T.; Zhang, Y.J.; Ma, W.H.; et al. Distribution and Preservation of Root- and Shoot-Derived Carbon Components in Soils Across the Chinese-Mongolian Grasslands. J. Geophys. Res.-Biogeosci. 2019, 124, 420–431. [Google Scholar] [CrossRef]
  32. Wang, B.R.; An, S.S.; Liang, C.; Liu, Y.; Kuzyakov, Y. Microbial necromass as the source of soil organic carbon in global ecosystems. Soil Biol. Biochem. 2021, 162, 13. [Google Scholar] [CrossRef]
  33. Pries, C.E.H.; Sulman, B.N.; West, C.; O’Neill, C.; Poppleton, E.; Porras, R.C.; Castanha, C.; Zhu, B.; Wiedemeier, D.B.; Torn, M.S. Root litter decomposition slows with soil depth. Soil Biol. Biochem. 2018, 125, 103–114. [Google Scholar] [CrossRef]
  34. Gu, X.; Fang, X.; Xiang, W.; Zeng, Y.; Zhang, S.; Lie, P.; Peng, C.; Kuzyakov, Y. Vegetation restoration stimulates soil carbon sequestration and stabilization in a subtropical area of southern China. Catena 2019, 181, 104098. [Google Scholar] [CrossRef]
  35. He, M.; Fang, K.; Chen, L.; Feng, X.; Qin, S.; Kou, D.; He, H.; Liang, C.; Yang, Y. Depth-dependent drivers of soil microbial necromass carbon across Tibetan alpine grasslands. Glob. Change Biol. 2021, 28, 936–949. [Google Scholar] [CrossRef] [PubMed]
  36. Delgado-Baquerizo, M.; Maestre, F.T.; Gallardol, A.; Bowker, M.A.; Wallenstein, M.D.; Quero, J.L.; Ochoa, V.; Gozalo, B.; Garcia-Gomez, M.; Soliveres, S.; et al. Decoupling of soil nutrient cycles as a function of aridity in global drylands. Nature 2013, 502, 672–676. [Google Scholar] [CrossRef]
  37. Zhao, Y.; Wang, X.; Li, J.; Xiao, J.; Hao, Z.; Wang, K.; Jiang, S.; Zhou, X.; Liu, H. Variation of δ13C and soil organic carbon under different precipitation gradients in alpine grassland on the Qinghai–Tibetan Plateau. J. Soils Sediments 2022, 22, 2219–2228. [Google Scholar] [CrossRef]
  38. Kohl, L.; Laganière, J.; Edwards, K.A.; Billings, S.A.; Morrill, P.L.; Van Biesen, G.; Ziegler, S.E. Distinct fungal and bacterial δ13C signatures as potential drivers of increasing δ13C of soil organic matter with depth. Biogeochemistry 2015, 124, 13–26. [Google Scholar] [CrossRef]
  39. Castro, J.; Fernandez-Ondono, E.; Rodriguez, C.; Lallena, A.M.; Sierra, M.; Aguilar, J. Effects of different olive-grove management systems on the organic carbon and nitrogen content of the soil in Jaen (Spain). Soil Tillage Res. 2008, 98, 56–67. [Google Scholar] [CrossRef]
  40. Repullo, M.A.; Carbonell, R.; Hidalgo, J.; Rodriguez-Lizana, A.; Ordonez, R. Using olive pruning residues to cover soil and improve fertility. Soil Tillage Res. 2012, 124, 36–46. [Google Scholar] [CrossRef]
  41. Iversen, C.M.; Keller, J.K.; Garten, C.T.; Norby, R.J. Soil carbon and nitrogen cycling and storage throughout the soil profile in a sweetgum plantation after 11 years of CO2-enrichment. Glob. Change Biol. 2012, 18, 1684–1697. [Google Scholar] [CrossRef]
  42. Peri, P.L.; Ladd, B.; Pepper, D.A.; Bonser, S.P.; Laffan, S.W.; Amelung, W. Carbon (delta C-13) and nitrogen (delta N-15) stable isotope composition in plant and soil in Southern Patagonia’s native forests. Glob. Change Biol. 2012, 18, 311–321. [Google Scholar] [CrossRef]
  43. Krüger, N.; Finn, D.R.; Don, A. Soil depth gradients of organic carbon-13—A review on drivers and processes. Plant Soil 2023, 495, 113–136. [Google Scholar] [CrossRef]
  44. Ehleringer, J.R.; Buchmann, N.; Flanagan, L.B. Carbon isotope ratios in belowground carbon cycle processes. Ecol. Appl. 2000, 10, 412–422. [Google Scholar] [CrossRef]
  45. Menichetti, L.; Houot, S.; van Oort, F.; Kätterer, T.; Christensen, B.T.; Chenu, C.; Barré, P.; Vasilyeva, N.A.; Ekblad, A. Increase in soil stable carbon isotope ratio relates to loss of organic carbon: Results from five long-term bare fallow experiments. Oecologia 2015, 177, 811–821. [Google Scholar] [CrossRef] [PubMed]
  46. McHugh, T.A.; Compson, Z.; van Gestel, N.; Hayer, M.; Ballard, L.; Haverty, M.; Hines, J.; Irvine, N.; Krassner, D.; Lyons, T.; et al. Climate controls prokaryotic community composition in desert soils of the southwestern United States. FEMS Microbiol. Ecol. 2017, 93, 13. [Google Scholar] [CrossRef] [PubMed]
  47. Jia, J.; Feng, X.J.; He, J.S.; He, H.B.; Lin, L.; Liu, Z.G. Comparing microbial carbon sequestration and priming in the subsoil versus topsoil of a Qinghai-Tibetan alpine grassland. Soil Biol. Biochem. 2017, 104, 141–151. [Google Scholar] [CrossRef]
  48. Shao, P.S.; Lynch, L.; Xie, H.T.; Bao, X.L.; Liang, C. Tradeoffs among microbial life history strategies influence the fate of microbial residues in subtropical forest soils. Soil Biol. Biochem. 2021, 153, 7. [Google Scholar] [CrossRef]
  49. Ni, X.Y.; Liao, S.; Tan, S.Y.; Wang, D.Y.; Peng, Y.; Yue, K.; Wu, F.Z.; Yang, Y.S. A quantitative assessment of amino sugars in soil profiles. Soil Biol. Biochem. 2020, 143, 10. [Google Scholar] [CrossRef]
  50. Castellano, M.J.; Mueller, K.E.; Olk, D.C.; Sawyer, J.E.; Six, J. Integrating plant litter quality, soil organic matter stabilization, and the carbon saturation concept. Glob. Change Biol. 2015, 21, 3200–3209. [Google Scholar] [CrossRef] [PubMed]
  51. Samson, M.E.; Chantigny, M.H.; Vanasse, A.; Menasseri-Aubry, S.; Royer, I.; Angers, D.A. Management practices differently affect particulate and mineral-associated organic matter and their precursors in arable soils. Soil Biol. Biochem. 2020, 148, 9. [Google Scholar] [CrossRef]
  52. Ding, X.L.; Liang, C.; Zhang, B.; Yuan, Y.R.; Han, X.Z. Higher rates of manure application lead to greater accumulation of both fungal and bacterial residues in macroaggregates of a clay soil. Soil Biol. Biochem. 2015, 84, 137–146. [Google Scholar] [CrossRef]
Figure 1. Schematic diagram of the study area: (a) geographical location of sampling sites, (b) PL: plantation, (c) GLs: grasslands, (d) CLs: croplands, (e) SLs: shrublands.
Sustainability 16 04538 g001
Figure 2. SOC content under different vegetation types. Boxes show the upper and lower quartiles of the data (n = 6). Capital letters indicate differences between vegetation types and lowercase letters indicate differences between different soil layers. Results were obtained by one-way ANOVA, p < 0.05 is significant.
Sustainability 16 04538 g002
Figure 3. Content of (a) amino sugars, (b) lignin phenols, (c) fungi residue carbon (FC), bacterial residue carbon (BC) and the ratio of FC to BC (F:B) under different vegetation types. Capital letters indicate differences between vegetation types and lowercase letters indicate differences between different soil layers. Results were obtained by one-way ANOVA (n = 6), p < 0.05 is significant.
Sustainability 16 04538 g003
Figure 4. The contribution of fungi residue carbon (FC), bacterial residue carbon (BC) and lignin phenols (LPs) to SOC in (a) topsoil and (b) subsoil. The width of the lines indicates the percentages of contribution. Capital letters indicate differences between vegetation types and lowercase letters indicate differences between different soil layers. Results were obtained by one-way ANOVA, p < 0.05 is significant.
Sustainability 16 04538 g004
Figure 5. δ13C (a) values of plant litter, topsoil and subsoil and (b) difference between litter and topsoil (∆13Ct−l), top and subsoil (∆13Cs−t) in PL, GLs, CLs, and SL, error bars showing the standard error of δ13C in soil (n = 6). Capital and lowercase letters indicate differences between vegetation types in topsoil and subsoil, respectively. Results were obtained by one-way ANOVA, p < 0.05 is significant.
Sustainability 16 04538 g005
Figure 6. Relative importance of plant and microbial factors on δ13C in (a) topsoil and (b) subsoil, as analyzed by partial least squares (PLS). Cps: cinnamyl phenols, Sps: syringyl phenols, Vps: vanillyl phenols, FC: fungi residue carbon, BC: bacterial residue carbon, ASs: amino sugars.
Sustainability 16 04538 g006
Figure 7. Factors affecting soil organic carbon (SOC), lignin phenols (LPs), fungi residue carbon (FC), bacterial residue carbon (BC), and δ13C differences (∆δ13C) in (a) top and (b) subsoil. The positive correlation is shown in red, the negative correlation is shown in green, and the correlation intensity is shown in color depth. The stronger the correlation, the darker the color. The asterisk (*) indicates the importance of relevance, while * and ** indicate p < 0.05 and p < 0.01, respectively. NO 3 -N: nitrate nitrogen, NH 4 + -N: ammonium nitrogen, N:P: soil nitrogen–phosphorus ratio, C:P: soil carbon–phosphorus ratio, C:N: soil carbon–nitrogen ratio, TN: total nitrogen, TP: total phosphorus, CEC: cation exchange capacity, SP: soil porosity, MC: soil moisture content.
Sustainability 16 04538 g007
Table 1. Basic characteristics of the study area. PL: plantation, GLs: grasslands; CLs: croplands; SLs: shrublands.
Dominant VegetationLongitudeLatitudeAltitude
PLOlea europaea104°48′09″33°26′15″1149
GLsSetaria viridis104°48′19″33°26′20″1105
CLsZea mays104°48′25″33°26′14″1092
SLsLycium chinense Mill104°48′21″33°26′17″1106
Disclaimer/Publisher’s Note: The statements, opinions and data contained in all publications are solely those of the individual author(s) and contributor(s) and not of MDPI and/or the editor(s). MDPI and/or the editor(s) disclaim responsibility for any injury to people or property resulting from any ideas, methods, instructions or products referred to in the content.

