Article

Study on the Urban Expansion of Typical Tibetan Plateau Valley Cities and Changes in Their Ecological Service Value: A Case Study of Xining, China

1
School of Geography, Qinghai Normal University, Xining 810008, China
2
Academy of Plateau Science and Sustainability, Xining 810008, China
*
Author to whom correspondence should be addressed.
Sustainability 2024, 16(11), 4537; https://doi.org/10.3390/su16114537
Submission received: 9 May 2024 / Revised: 22 May 2024 / Accepted: 24 May 2024 / Published: 27 May 2024

Abstract

:
The accelerated urbanization process drives urban spatial expansion, making it essential to clarify the driving factors of this expansion and the corresponding ecosystem service value (ESV) response for effective regional urban planning. We selected Xining City, a typical plateau valley city with a spatial layout constrained by mountainous and riverine topography, as our study area. We analyzed land changes in Xining City over the past 20 years using the land transfer matrix and the PLUS model, and predicted land use changes under different scenarios for 2030. By combining these analyses with the improved unit area equivalent factor method, we quantitatively assessed the drivers of urban expansion in the main urban area of Xining City from 2000 to 2030 and estimated the ESV. The results showed that: (1) Over the past two decades, Xining City has experienced notable urban expansion, particularly along the Huangshui River, Beichuan River, and Nanchuan River. The urban construction land is mainly converted from cropland and grassland, and the simulation results under different scenarios in the future of 2030 show that the area of cropland and grassland continues to decrease. (2) The spatial expansion of urban areas in Xining City is primarily influenced by topographical factors, with urban transportation planning exerting a secondary influence. Distinct levels of roads exhibit varying degrees of impact on the expansion of constructed areas, with tertiary roads demonstrating the most widespread and substantial influence. Conversely, factors such as population density, GDP, and proximity to government have lesser influence on urban expansion. (3) The ecosystem service value (ESV) of Xining City exhibits a general decline from 2000 to 2030, marked by a significant loss of arable land and grassland and substantial shifts in ESV. Simulated ESV outcomes under diverse scenarios for 2030 consistently underscore that, irrespective of policy orientations, urban expansion and development, despite guarantees for urban, cropland, and ecological preservation, inevitably engender diminishing ecosystem service functionalities.

1. Introduction

With the rapid development of the social economy and the acceleration of urbanization, the spatial expansion of cities has exhibited a trend of gradual acceleration [1]. This trend is particularly notable in Western China, where development has historically been slower. The implementation of national strategies such as “Western Development” and “One Belt, One Road” in recent years has provided cities in western China with unprecedented development opportunities [2]. Urban spatial expansion in these areas is primarily characterized by the increase in urban construction land. As the most significant and visible form of land use and land cover change (LUCC), the expansion of urban construction land greatly impacts the stability and balance of existing systems and leads to numerous environmental issues. Extensive research indicates that the expansion of urban construction land continually transforms ecological land, such as farmland, forests, and grassland, resulting in problems like farmland loss, biodiversity decline, and local and regional climate changes [3], which profoundly alters the city’s landscape pattern [4]. Additionally, urban expansion has driven a substantial influx of rural populations into cities, further accelerating urban sprawl and creating an imbalance between population and available land resources. This imbalance threatens the sustainable development of cities, particularly concerning the economy, population, and ecological environment [5,6]. Furthermore, this phenomenon hinders the achievement of the United Nations Sustainable Development Goal SDG 11.3, “Inclusive and Sustainable Urbanization” [1,7,8].
As China’s urbanization progresses into a stage of comprehensive development, small and medium-sized cities are poised to become the primary drivers of improved urbanization quality and accelerated urbanization. Current research on urban spatial expansion predominantly focuses on well-developed metropolitan areas in the central and eastern regions, such as Shanghai, Beijing, and Guangzhou [9,10], while small and medium-sized cities, with a population of less than 1 million people, especially those in western highland valley regions, receive insufficient attention [11]. Highland valley cities in the western region, constrained by topographical conditions and river distribution, represent typical valley cities with fragile ecological environments. Their urban development is influenced by a complex interplay of social, economic, and natural factors. Current research on urban spatial expansion in the western plateau mainly focuses on land category transfer and expansion trends [12]. The methods used to study the driving factors of urban expansion are relatively traditional, relying on statistical techniques such as correlation analysis, regression analysis, and geographically weighted regression [2,4,11]. These methods are often limited by data types and quantitative relationships, which partially hinder a comprehensive understanding of urban spatial expansion mechanisms. With breakthrough advancements in machine learning technology, the constraints of traditional statistical methods have been swiftly overcome [4]. Consequently, utilizing machine learning methods to analyze construction land expansion and its driving factors offers a robust foundation for exploring the mechanisms of urban spatial expansion. However, current analyses of urban spatial expansion and its driving factors predominantly address the potential mechanisms and processes involved. Ongoing research largely emphasizes changes in ecological patterns, ecological health, and ecological risks [13,14], while there is a relative paucity of focus on ecological service value.
Ecosystem services (ES) are vital products and services derived directly or indirectly from ecosystem structures, processes, and functions [15]. Since Costanza et al. [16] pioneered the evaluation of the environment in terms of methodology, principles, and ecosystem service value (ESV), it has become a prominent research focus in geography. Xie Gao Di et al. [15,17] refined the assessment method for the equivalent factor of value per unit area through literature research, expert knowledge, and remote sensor monitoring, employing geographic information and spatial analysis to conduct a comprehensive and dynamic evaluation of the value of 11 ecological services for 14 ecosystem types in China. This methodology has significantly influenced the direction of ESV assessment. Jiang et al. analyzed the land use changes on the Tibetan Plateau over the past 25 years, discovering that the increase in ESV was primarily due to the expansion of rivers and lakes [18]. Similarly, Liu et al. examined LUCC changes in the Bohai Bay region from 2000 to 2015, revealing substantial regional ESV loss [19]. While extensive research has been conducted on regional land use change and ESV, studies focusing on urban expansion and ecological service value within urban ecosystems are relatively scarce [20]. Accelerated socio-economic development drives urban spatial expansion, fundamentally altering land use patterns and generating significant ecological and environmental impacts. Consequently, it is imperative to quantitatively assess the value of ecosystem services impacted by urban spatial expansion, providing crucial insights for the sustainable development of cities.
As the largest city on the Qinghai-Tibet Plateau, Xining City developed predominantly along the ancient river valley carved by the Yellow River and Huangshui River [21]. This development typifies the majority of urban forms on the plateau, characterized by challenging natural conditions and fragile ecological environments. Over the past 20 years, Xining City has undergone rapid urban expansion, significantly impacting its urban ecosystem. Therefore, this study focuses on Xining City, examining the changes in its urban land use structure over the past 20 years using land use data from 2000, 2010, and 2020, analyzed via a transfer matrix. The study quantitatively evaluates the drivers of urban expansion using the PLUS model and simulates future land use scenarios. Additionally, using the methodology of Xie G. et al. [15], it estimates the ecosystem service values impacted by urban expansion from 2000 to 2030. This research aims to elucidate the driving factors behind urban construction land expansion in plateau valleys and analyze the resulting changes in urban ecosystem service values due to urban expansion. These insights aim to inform the development of Xining City as an international eco-tourism destination, preventing ecological damage from unscientific development practices.

2. Materials and Methods
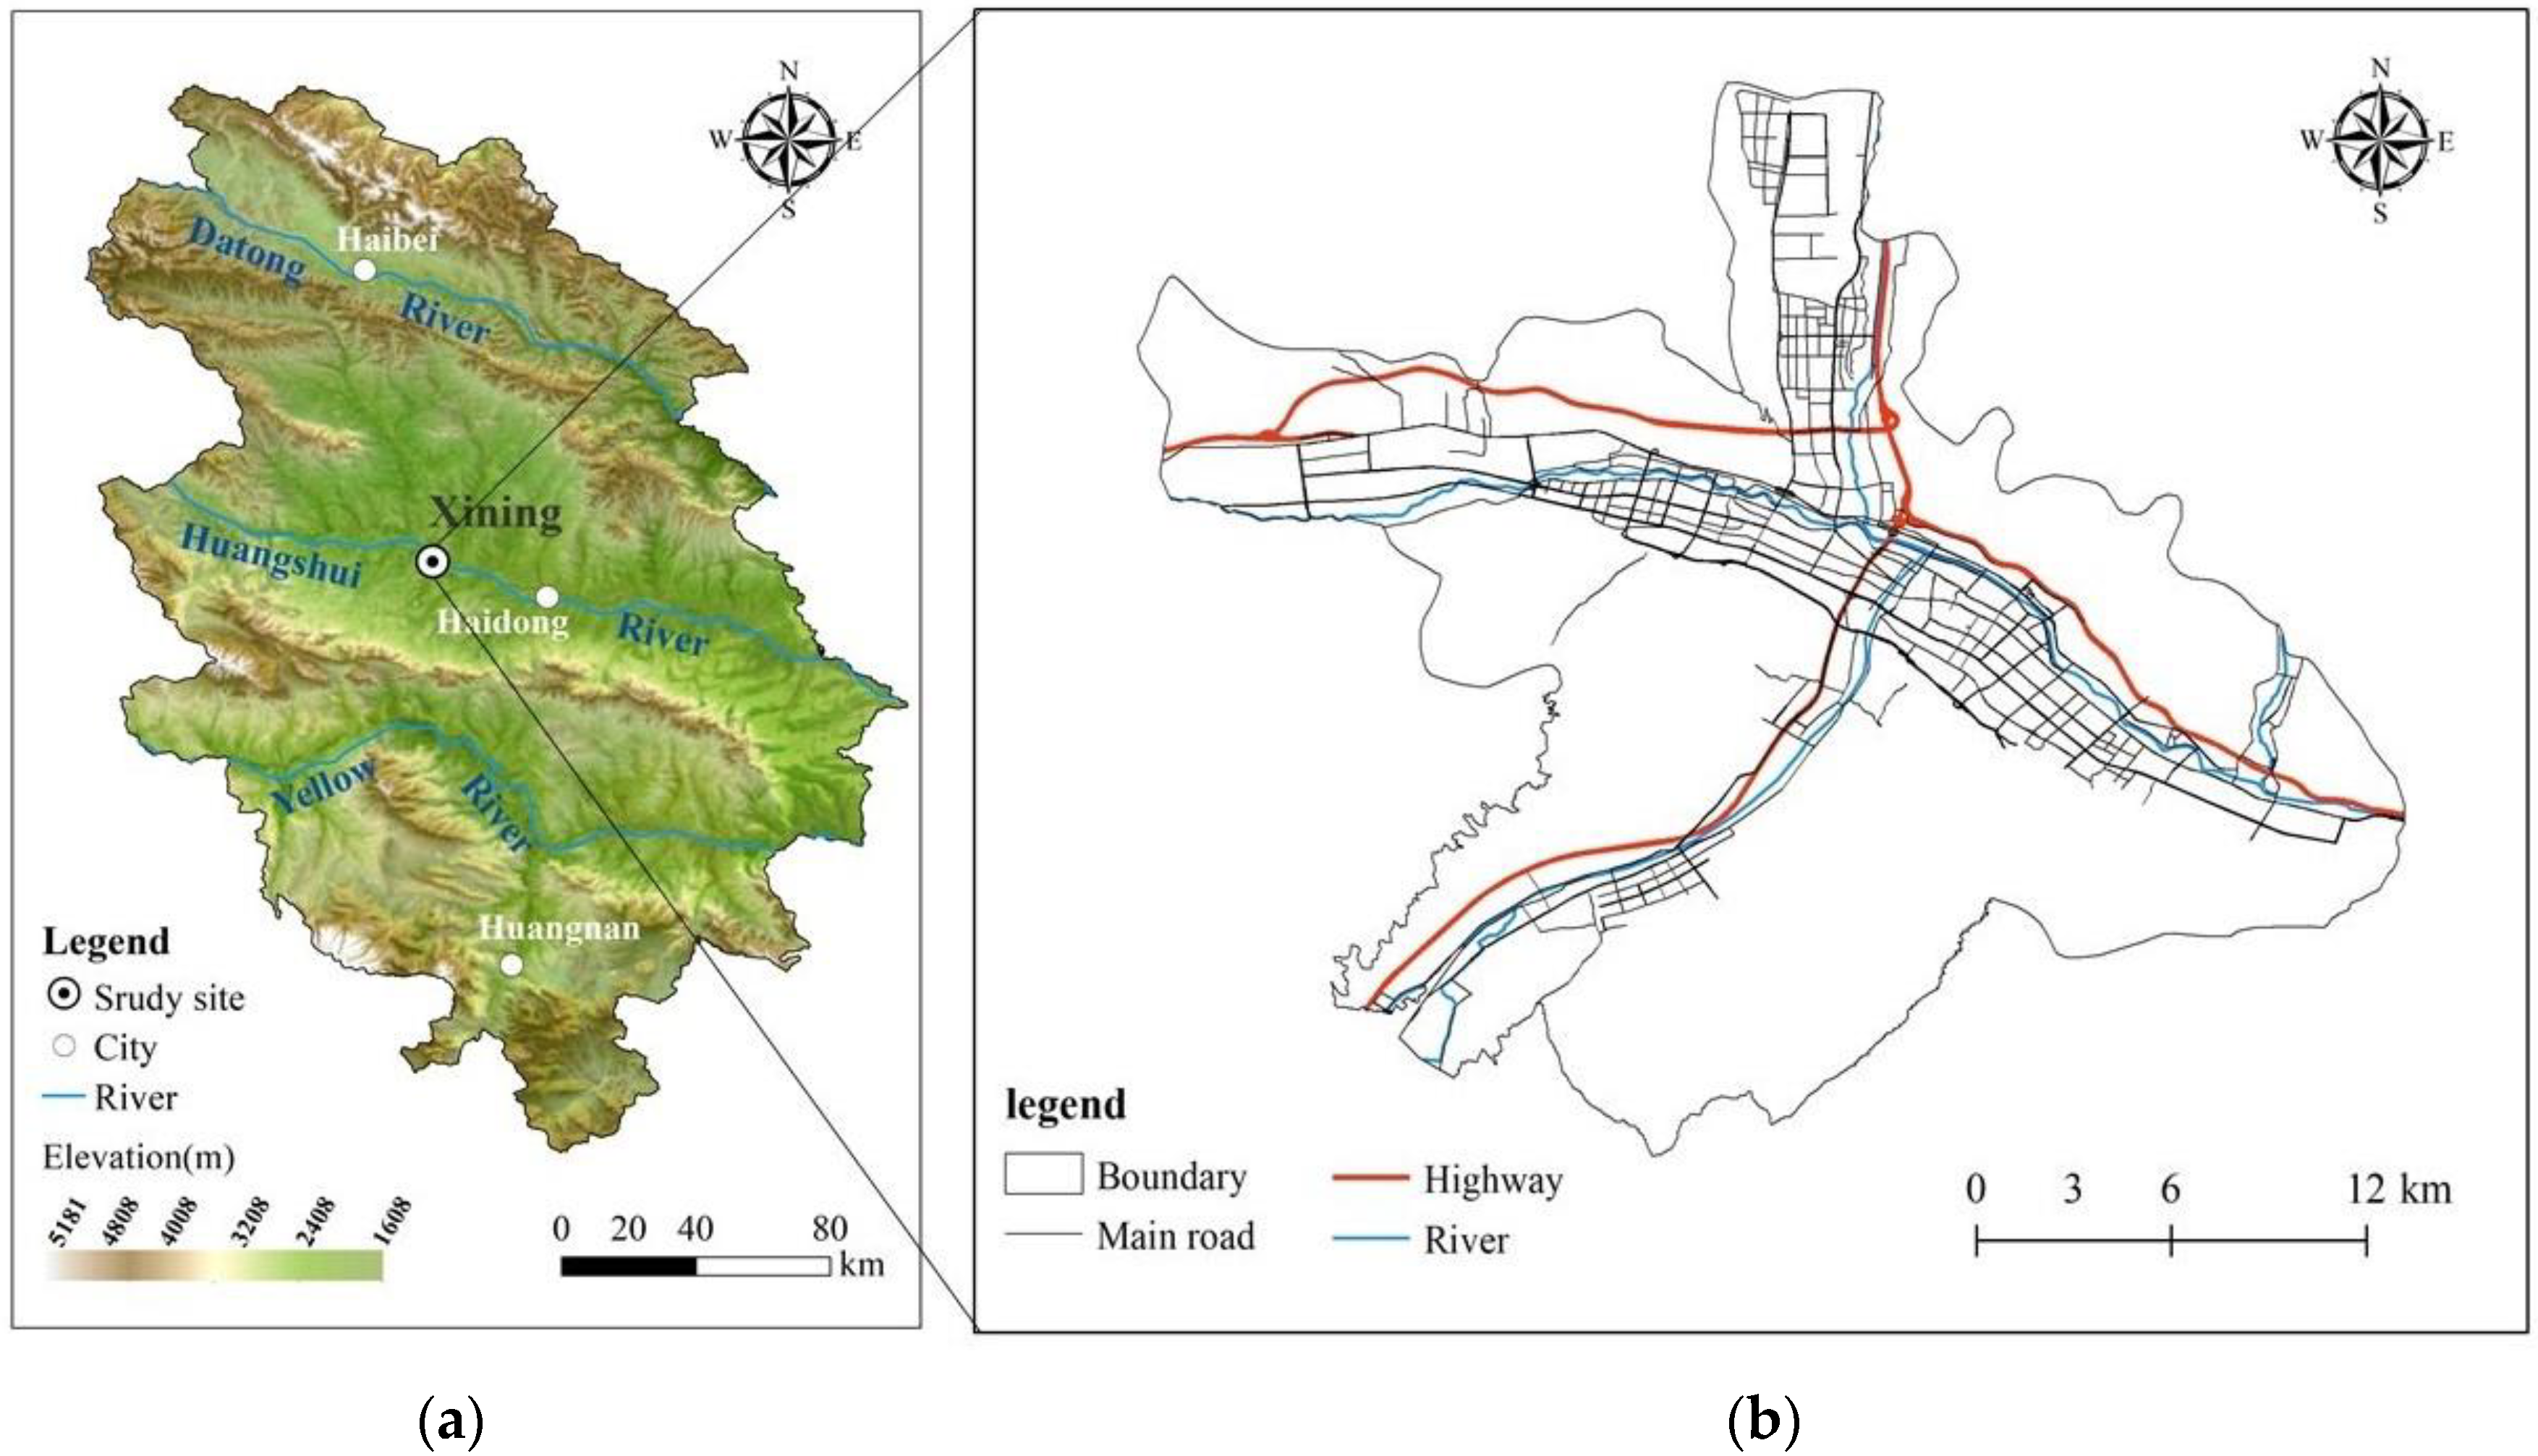
2.1. Study Area

Situated in the eastern reaches of Qinghai Province, 101°33′ E~101°54′ E longitude, 36°28′ N~36°45′ N, Xining City epitomizes the transitional zone between the Loess Plateau and the Tibetan Plateau, representing a quintessential plateau valley city. With its highest point soaring to 2823 m above sea level and the lowest point at 2168 m [22], the city boasts a habitat conducive to human settlement. Its climatic classification aligns with the typical semi-arid conditions of continental plateaus, characterized by prolonged sunshine, intense radiation, protracted cold winters, and mild summers. The average annual precipitation stands at 380 mm, with an average annual temperature spanning 4.91 to 7.1 °C [23]. Governed by the Huangshui River, Nanchuan River, Beichuan River, and other watercourses, the urban layout of Xining City assumes a prototypical cross-shaped river valley configuration, dictating its developmental trajectory along the river’s course, epitomizing a linear urban expansion pattern [12]. From 2000 to 2020, the city’s population burgeoned from 958,900 to 1,559,800 inhabitants, marking a staggering increase of 609,900 individuals, equating to a growth rate of 62.67%. Simultaneously, the city’s Gross Domestic Product (GDP) surged from 10.174 billion in 2000 to 137.298 billion in 2020, reflecting a remarkable growth rate of 1249% [24]. As the largest city on the Tibetan Plateau, Xining serves as the northern gateway to Tibet and is the starting point of the renowned Qinghai-Tibet Railway. Xining City encompasses the districts of Chengxi, Chengbei, Chengdong, Chengzhong, Huangzhong, Datong County, and Huangyuan County. This study focuses on analyzing the urban dynamics within the Chengxi, Chengbei, Chengdong, and Chengzhong districts of Xining City (Figure 1).

2.2. Data Sources and Processes

2.2.1. Data Sources

This study encompasses comprehensive datasets including land use data for Xining City in 2000, 2010, and 2020, point of interest (POI) data for Xining City in 2020, night light data for Xining City in 2020, spatial of Gross Domestic Product(GDP) data for Xining City in 2020, population data for Xining City in 2020, elevation data, slope data, road data for different classifications, river data, and the average grain production data for Xining City in the past 5 years along with the average grain price data for Xining City in 2020. The government POI, road, and river data were subjected to Euclidean distance analysis. Night light data underwent radiometric calibration, while all other data were resampled to a resolution of 100 m × 100 m. The origin and utilization of each dataset are outlined in the table below (Table 1):

2.2.2. Production of GDP

GDP data are referenced from prior studies [29]. Given that the primary industry in the main urban area of Xining City contributes a relatively small percentage, which is considered negligible, this study utilizes nighttime lighting data and Point of Interest (POI) data from the main urban area of Xining City to spatially represent the city’s GDP. Nighttime lighting data is chosen as it can delineate the spatial distribution of human socio-economic activities [30], while POI serves as an influential factor impacting GDP size. Over 25,000 POI points across 12 categories encompassing companies and enterprises, shopping centers, transportation hubs, educational institutions, financial establishments, hotels, tourist attractions, dining venues, essential services, healthcare facilities, and government offices are selected, with any erroneous POIs excluded. Spatial weights for nighttime lighting data and various POIs are determined using the random forest model, and the spatial simulated GDP value is derived based on these weights, as illustrated in the following formula [29]:
Q i = i = 1 n w j p i j ;   G m n = G × F i F i
In the formula, Qi denotes the integrated weight value of each raster; wj represents the weight assigned to each indicator; pij stands for the representative value of the raster ‘i’ for the indicator ‘j’; n denotes the total number of rasters; Gmn represents the cell value of the raster GDP after proxy data dissemination; G signifies the statistical value of Xining City’s GDP; and Fi refers to the integrated weight value of each raster. The outcomes of GDP spatialization are depicted in Figure 2a, while Figure 2b illustrates the distribution of nighttime lighting data and the importance of each POI category.

2.3. Method

2.3.1. PLUS Model

(1) Selection of drive factors
Urban spatial expansion is characterized by changes in urban construction land, influenced by a combination of natural and socio-economic factors. Therefore, drawing from existing research and considering the unique attributes of Xining City’s main urban area [31], this study selects elevation, slope, and proximity to rivers as natural drivers affecting this “plateau valley” city type. Xining City, a typical plateau valley city, is bisected by the Huangshui and Beichuan Rivers and lies between South Mountain, North Mountain, and West Mountain. Urban development is heavily influenced by the topography and rivers [32,33]. The distance from various road levels, population, GDP, and proximity to government units are identified as key socio-economic factors influencing urban expansion. Population and economic growth, as crucial determinants of urban development, inevitably increase the demand for urban facilities, thereby exerting a dual impact on city expansion [34]. Roads, as the arteries of urban development, are essential for urban expansion as they connect various blocks [31]. The government, acting as the policymaker and decision-maker, plays a pivotal role in urban planning and expansion [22]. All factors were sampled at a resolution of 30 m, with data organized into a grid consisting of 1049 rows and 1061 columns, utilizing coordinates standardized under CGCS_2000_3_degree_Gauss_Kruger_zone_34 (Figure 3).
(2) PLUS Model
The Patch-generating Land Use Simulation (PLUS) model, developed by the School of Geography and Information Engineering and the High Performance Spatial Computational Intelligence Laboratory of the National GIS Engineering and Technology Research Center at China University of Geosciences (Wuhan), is a raster-based simulation tool for land use and land cover change (LULCC) at the patch scale. This model is primarily based on cellular automata (CA) principles. The PLUS model encompasses the Land Expansion Analysis Strategy (LEAS) and the CA-based on Multiple Random Seeds (CARS). The LEAS model extracts areas of land use expansion between two time periods, samples from these expanded areas, and employs the random forest algorithm to analyze factors influencing various land use expansions, determining their development probabilities and drivers’ contributions to land use expansion. Conversely, the CARS module enhances traditional CA models by introducing a novel multi-class seed growth mechanism, which better simulates multi-class land use changes at the patch level [31,35,36].
Utilizing the linear CARS module integrated within the PLUS framework, parameters such as development potential, land demand, conversion matrix, patch generation threshold, diffusion coefficient, and neighborhood weights were meticulously calibrated to simulate the land cover dynamics of Xining City’s main urban area for 2020, basing the simulation on the land cover data available for 2010. Validation of the model was conducted against existing 2020 land cover data for Xining City’s main urban area, employing a varied selection of sampling points (5%, 10%, 15%, and 20%) to construct confusion matrices, facilitating parameter fine-tuning for optimal performance. The kappa coefficient derived from the constructed confusion matrices was calculated to be 0.72, with an overall accuracy of 0.81, signifying robust model performance, particularly evident when 10% of the sampling points were employed. This accuracy level renders the model suitable for simulating future land cover scenarios in Xining City’s main urban area. The PLUS model (in Chinese) is accessible for download from https://github.com/HPSCIL/ (accessed on 5 April 2024). Neighborhood weights were computed based on the proportional expansion area of each land cover category relative to the total expansion area observed between 2010 and 2020.
(3) Selection of future simulation scenarios
Given that our research domain encompasses the principal urban expanse of Xining City, our inquiry predominantly focuses on forecasting the land use transformations within Xining City by 2030, influenced by policy directives. These policies notably include rigorous adherence to the national imperatives concerning the “red line of arable land” and the imperative of ensuring food security. Moreover, they are complemented by the extant municipal policy framework of Xining City aimed at positioning itself as a paramount center for international ecotourism. This involves stringent constraints on arable land transfers, augmented transfers of urban wetlands, and the formulation of a land use conversion matrix under three distinct scenarios: Urban Development Scenario, Cropland Protection Scenario, and Ecological Protection Scenario (Table 2) [37]. Additionally, unlike natural ecosystems, urban sprawl is significantly influenced by anthropogenic factors. Consequently, common natural development scenarios were excluded from this study.
The Urban Development Scenario, grounded in the land use transformation trends observed in the study area between 2010 and 2020, embodies a paradigm wherein conversion dynamics among land classes are reasonably delineated without imposition of constraints, and devoid of government or market interventions. Additionally, taking into account the frequency of land class conversions, this scenario entails a 20% elevation in the likelihood of cropland and grassland transitioning into construction land, juxtaposed with a 30% reduction in the probability of construction land transitioning into other land classes, excluding cropland [35].
The Cropland Protection Scenario, acknowledging cultivated land as a pivotal factor influencing food security, incorporates stringent controls in adherence to national policy directives, particularly emphasizing the preservation of the “cultivated land red line” within the Urban Development Scenario framework. Compliant with the “Measures for Implementing the Land Management Law of Qinghai Province,” the existing arable land as of 2020 serves as a pivotal constraint, dictating that the conversion of prime farmland to alternative land use types is strictly regulated, with a primary focus on maintaining the status quo of existing cultivated land. Within this scenario, the likelihood of arable land transitioning into construction land is curtailed by 50%, while the probabilities of conversion into forest land and grassland see a reduction of 20%, and the likelihood of grassland transitioning into arable land is augmented by 20% [38].
The Ecological Protection Scenario underscores Xining City’s historical reliance on the national “Three Norths” protection forest project since the 1990s and its proactive response to the “returning farmland to forests and grasslands” policy, exemplified by the initiation of greening projects for the north and south mountains of Xining, Qinghai. Consequently, within this scenario, there is a relaxation in the scope of farmland conversion. Specifically, the likelihood of arable land transitioning into construction land diminishes by 30%, while the probability of grassland transitioning into construction land decreases by 40%. Conversely, the likelihood of arable land transitioning into forest and grassland is augmented by 20% [38].

2.3.2. Land Use Transfer Matrix

The land use transfer matrix represents an application of the Markov model within land use change analysis. Primarily utilized for the transformation of land use types from i to j during the study period, this method effectively describes the direction and magnitude of land use type shifts. This method, elucidated by prior research [7,10,23], is computed using the following formula:
S i j = S 11 S 1 n S n 1 S n n
In the formula, ‘s’ denotes the land area, ‘n’ represents the number of land use types, ‘i’ signifies type ‘i’ among the initial land use types at the beginning of the study period, and ‘j’ refers to type ‘j’ among the land use types at the end of the study period.

2.3.3. Method for Ecosystem Service Value Based on per Unit Area

The Method for Ecosystem Service Value Based on Per Unit Area, pioneered by Xie Gao Di [15,17], builds upon Costanza’s ecosystem service function classification to devise a quantitative assessment method for ecosystem service value based on expert insights [16]. By refining Costanza’s ecosystem services framework, 17 functional types were reclassified into nine categories, including food production, raw materials production, gas regulation, climate regulation, hydrological regulation, waste treatment, soil conservation, biodiversity maintenance, aesthetic landscape provision, and others. This reclassification involved categories such as disturbance regulation, water regulation, water supply, erosion control and sediment retention, soil formation, nutrient cycling, pollination, biological control, shelter, genetic resources, recreation, and culture. Additionally, leveraging grain yield per unit area of farmland and grain price, the ESV per unit area of farmland was determined, and quantities of other land types relative to farmland were determined via questionnaire methods to ascertain the ecosystem service value of the system. Moreover, a table illustrating the equivalent value of ecological services per unit area of ecosystems in China was established (Table 3).
The ESV equivalent of food production per 1 ha of farmland was standardized to 1, with the ESV of food production per unit area of farmland set at 1/7 of the regional average food market price for that year in the study area [39,40]. To ensure the calculation of ecosystem service value in Xining City aligns with local conditions, modifications were made to the method as follows: (1) Utilizing Xie Gao Di et al.’s biomass factor calculations for farmland across different provinces in China, the biomass factor for farmland in Qinghai Province was determined to be 0.4 [41]. (2) The land use types in Xining City were categorized based on ecosystems mentioned in the table: forest, grassland, cropland, watershed, and construction land were respectively substituted for forest, grassland, cropland, river/lake, and desert ecosystems. However, a standardized research method for calculating the ESV of construction land remains absent, hence it was computed based on unused land in this study. (3) According to the statistical yearbooks of Xining City from 2015 to 2020, the average food production over the past five years was 3543.3 kg/ha, with a food purchase price of 3.29 CNY/kg in 2020 [24,25,26,27,28]. Thus, the ESV of food production per unit area of farmland in Xining City for 2020 was derived as 1665.35 CNY/ha, as calculated by the following formula (Equation (3)). Subsequently, ESV coefficients for different land use types in Xining City were calculated and tabulated (Table 4).
V = 1 7 i = 1 n A i R i P i A t
In the formula, V denotes the value of ecosystem services per unit of standardized factor equivalent in the study area; ‘i’ denotes the main food type; Ai signifies the area planted with food type ‘i’; Ri stands for the average price of food type ‘i’; Pi represents the unit yield of food type ‘i’; and At denotes the total area planted with food.
According to the standard coefficient of ecosystem service equivalent value per unit area in Xining, the formula for calculating ESV is:
E S V = i = 1 n V i A i
In the formula, ESV denotes the total ecosystem services value in the study area; Vi represents the coefficient of land use type ‘i’; Ai signifies the area of land use type ‘i’.

3. Results

3.1. Examination of the Expansion of Urban Built-Up Land and Its Driving Factors in Xining City

3.1.1. Characteristics of Land Use Changes in the Main Urban Area of Xining City

Utilizing the land use transfer matrix method (Equation (2)), we assessed the alterations in land use patterns within Xining City between 2000 and 2020. The results show that there are significant changes in the areas of cropland, grassland, and built-up land, with these changes being more pronounced and noticeable. Regarding outward transfers, predominant shifts in land utilization encompass the conversion of arable land to construction areas, grassland to construction zones, and grassland to arable plots. Notably, outgoing transitions are chiefly characterized by the shift from arable land to grassland, constituting 94.90% of the total transfers. Within this trend, arable land accounts for 6175.42 hectares, comprising 57.32% of the total outgoing area, while grassland amounts to 4048.73 hectares, representing 37.58%. Theoretically, converting arable land and grassland into construction land is bound to impact food security and cause ecological damage in Xining City. However, recent interpretations of Xining City’s arable land protection policies indicate that any expansion of construction land resulting in the conversion of arable land must strictly adhere to the “Qinghai Provincial People’s Government’s Opinions on Strengthening Arable Land Protection and Improving the Balance of Compensation”. Moreover, Xining City’s recent urban green space projects, such as the creation of Beichuan Wetland Park and Huangshui Wetland Park, along with the establishment of the “Northwest China, North China and Northeast China” protection forest, have effectively mitigated the ecological crisis caused by the conversion of grasslands.
Conversely, concerning the direction of transfers in, the focal point revolves around the transition in from arable land to construction areas, accounting for a total transfer ratio of 92.32%. Specifically, arable land conversion covers 1983.32 hectares, constituting 18.41% of the total transfers in, while building land expansion encompasses 7961.92 hectares, representing 73.91% of the transfers in (Table 5).
Based on the land transfer matrix table, it is evident that in 2000, the urban construction land area within the primary urban zone of Xining City spanned 8793.08 hectares. Over the ensuing two decades, by 2020, this urban construction land burgeoned to 16,434.14 hectares, marking a remarkable 86.90% surge over the 20-year period, equating to an average annual expansion of 382 hectares. Notably, the construction land expansion is primarily sourced from grassland and cultivated land, with grassland conversion accounting for 1947.76 hectares, representing 24.46% of the total construction land area, while cultivated land conversion encompasses 5882.84 hectares, constituting 73.89% of the construction land area. The expansion trajectory predominantly aligns along the Huangshui River, Beichuan River, and Nanchuan River, manifesting a cross-shaped expansion pattern oriented “northwest-southeast” and “north-southwest”. The primary areas of expansion are concentrated in the central and western parts of the city, followed by the northern region. The development of the “Chengnan New District” in the southern area and the “Haihu New District” in the western area has altered the regional industrial structure, further stimulating urban space expansion (Figure 4).

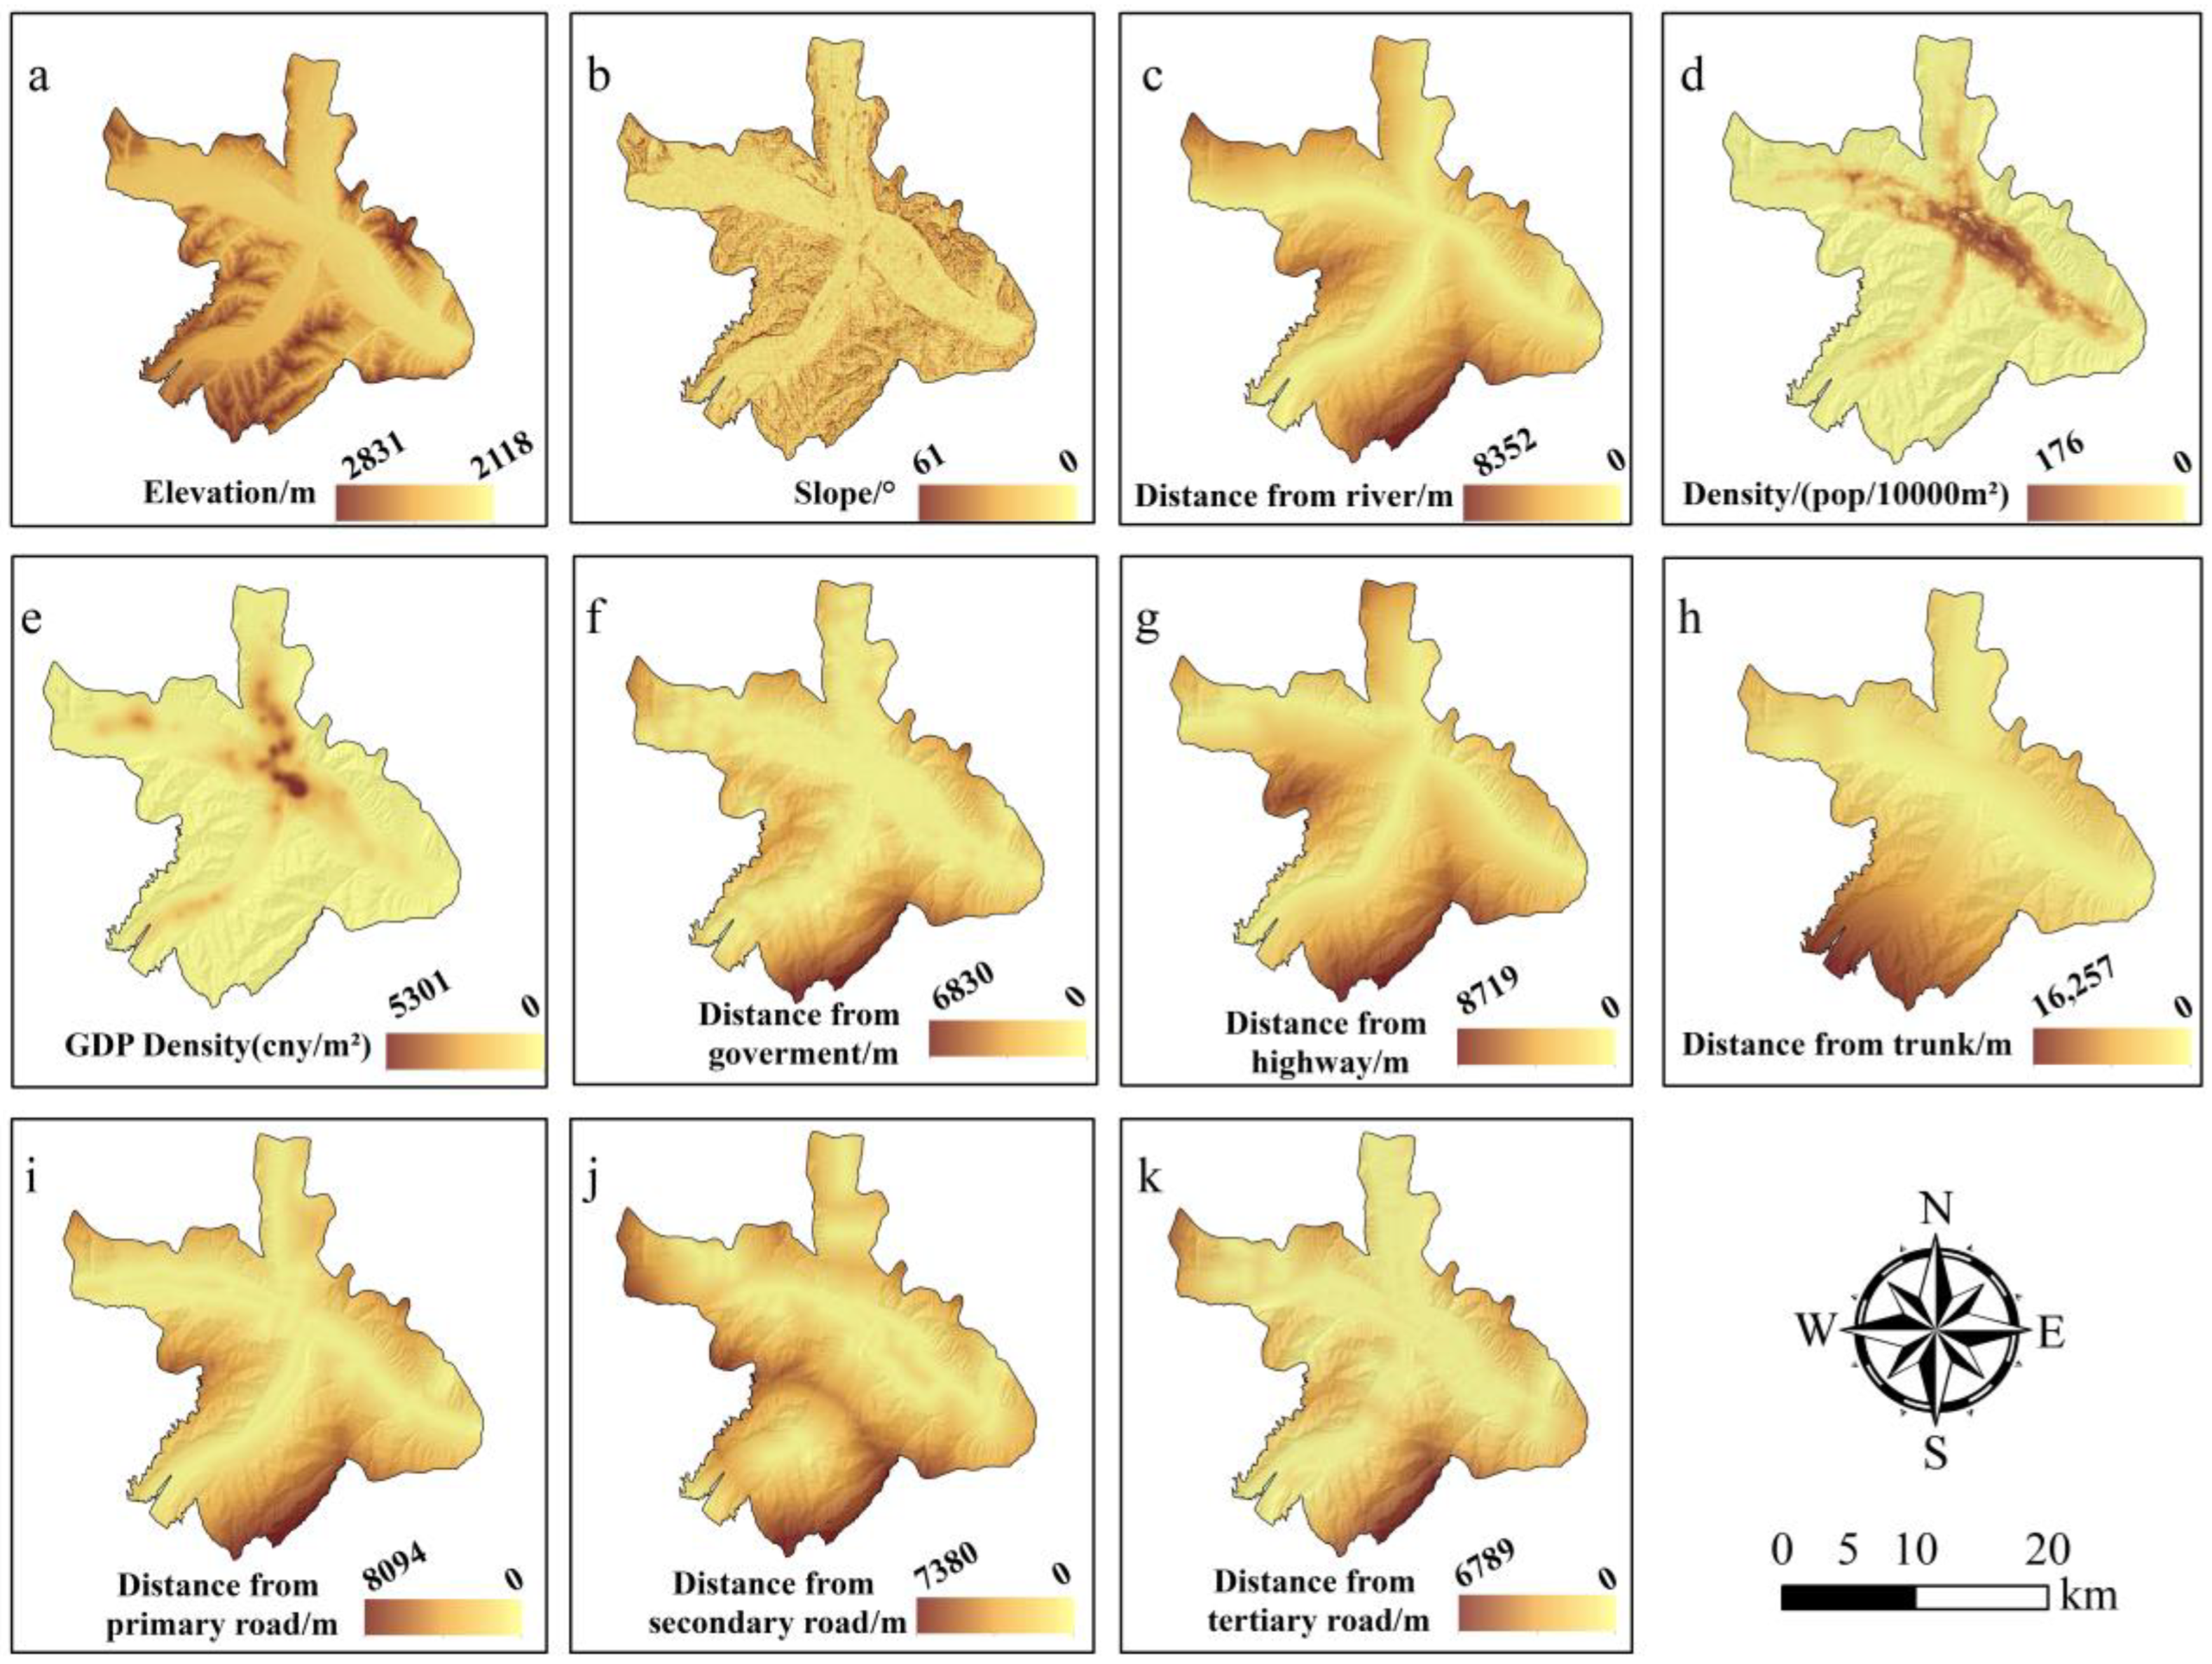
3.1.2. Analysis of the Driving Factors of Built-Up Land Use Change in the Main Urban Area of Xining City

Utilizing the PLUS model, an in-depth analysis of the expansion of construction land in the central urban zone of Xining City was conducted. Factors such as proximity to rivers, primary roads, secondary roads, tertiary roads, main roads, government units, GDP, elevation, slope, and population density were meticulously chosen to scrutinize the drivers shaping urban expansion in Xining City, encapsulating aspects of topography, economy, transportation, population dynamics, and governmental policies. Employing a randomized forest model, the contribution of each influencing factor was elucidated, revealing a comprehensive understanding of their impact (Figure 5).
Initially, as a quintessential plateau valley enclave, the natural geographical elements lay the foundational blueprint for the urban sprawl of Xining City, jointly shaped by factors such as elevation and slope. Notably, elevation exerts a profound influence, with lower elevations and gentle slopes emerging as prime expanses for the burgeoning construction terrain in Xining City, while higher elevations and steeper slopes serve as natural constraints, curtailing the city’s spatial outreach. The strategic positioning of the Huangshui River, Beichuan River, and Nanchuan River within the urban precincts, dating back to historical epochs as cradles of human habitation, has delineated the embryonic contours of Xining City, thereby orchestrating its urban expansion predominantly along the contours of these rivers, manifesting a cross-shaped proliferation. From a quantitative standpoint, the foremost determinant driving urban construction land expansion is the elevation factor, closely trailed by terrain slope, with proximity to river courses emerging as the third pivotal influence. This type of city is prevalent on the plateau, including Lhasa and Linzhi in Xizang, where urban areas are situated along rivers and constrained by mountains. According to Jiang et al. [42], as these cities expand, many river valley cities exhibit distinct slope-climbing characteristics, further indicating that the development of river valley cities is significantly influenced by topography.
Furthermore, in terms of policy dynamics, transportation infrastructure emerges as a pivotal factor constraining urban advancement. Adhering to China’s urban classification criteria, Xining City is slated to attain fourth-tier city status by 2023, where urban mobility will predominantly rely on lower-grade Class III and Class II roads. Serving as the primary vehicular conduits within Xining City, Class III roads outnumber Class II roads and arterial highways, forming dense clusters that profoundly shape urban construction land expansion. Concentrated primarily around residential precincts, burgeoning commercial zones, and industrial enclaves, tertiary roads encircle vital areas such as the burgeoning commercial precinct in the western sector, burgeoning residential and educational zones in the north, and burgeoning industrial hubs in the south. Notably, these tertiary arteries align their trajectory with major thoroughfares like Haihu Avenue, Wusi Avenue, and Tong’an Road, outlining a developmental arc that underscores the strategic significance of tertiary roads in driving urban construction land expansion in Xining City. Hence, within the purview of transportation dynamics’ impact on urban construction land in Xining City, tertiary roads wield paramount influence, trailed by expressways, primary roads, secondary roads, and arterial routes. Liang et al. analyzed the drivers of urban expansion in Wuhan and found that the distribution of tertiary roads is the most important factor influencing its urban expansion [31]. Unlike river valley cities, Wuhan is a typical plain city, where urban expansion is less constrained by topography and other natural elements.
Thirdly, in terms of economic dynamics, the rapid advancement of Xining City can be attributed to the implementation of “Western Development” and “One Belt, One Road” initiatives, alongside the establishment of the “Lanxi City Cluster” development strategy. Over the past two decades, Xining City has witnessed exponential economic growth, soaring from a GDP of 10.174 billion yuan in 2000 to 137.298 billion yuan in 2020, marking an astounding increase of 126.849 billion yuan and a growth rate of 1213.98%. This meteoric economic surge has significantly accelerated urbanization within Xining City. Particularly, the booming real estate sector over the past decade has spurred substantial investments, consequently driving a notable expansion of construction land. As the provincial capital, Xining City exerts a magnetic pull on the populace from surrounding areas, catalyzing the inflow of urbanites, logistical networks, and capital streams from Qinghai Province. The transformation of these urban inflows within Xining City generates positive externalities, fueling urban spatial expansion [22]. Concurrently, this population influx stimulates heightened demand for urban dwellings and associated amenities, further propelling economic development and spatial proliferation within Xining City, underscoring its pronounced agglomeration effect.
Fourthly, demographics play a crucial role in Xining City’s urban expansion. From 2000 to 2020, the urban household population surged from 958,900 to 1,559,800, marking a staggering growth of 600,900 individuals at a rate of 62.67%, surpassing the national average growth rate. As the capital of Qinghai Province, Xining City magnetizes a significant influx of migrants from neighboring regions. Notably, the construction of Chengnan New District has been a significant draw, attracting migrants from areas like Huanghuanzhong District and Huangyuan County. The development of corresponding educational and residential infrastructure in Chengnan New District further propels the expansion of the primary urban area. Moreover, owing to the challenging working environments prevalent in regions like Yushu Prefecture and Golog Prefecture, residents from these areas, commonly referred to as the “state and county” population, seek respite in Xining City. Many of them invest in real estate in Xining City for vacation purposes, fostering additional impetus for the city’s real estate industry. This demographic segment constitutes a substantial portion of the populace, thereby significantly contributing to Xining’s urban development and real estate sector growth.
Population and economy are fundamental elements of livelihood, and these two elements interact and influence each other, driving the expansion of urban space in Xining City. Economic growth fosters the development of industrial structures, leading to the intensive utilization of land in the main urban area and altering its nature. Concurrently, economic growth enhances the city’s attractiveness to the population, resulting in increased road and housing construction to accommodate the burgeoning population [22].
Fifth, regarding policy factors, this paper primarily considers the distance from government units. Policy factors, as a crucial means of government regulation, play a leading role in urban spatial expansion. Government units, as policymakers and key locations for construction expansion, significantly influence the expansion of urban construction land.
Overall, the land use transfer in the main urban area of Xining City is primarily dominated by the conversion of cultivated land and grassland into construction land. The city’s spatial expansion, predominantly along the “northwest-southeast” and “north-southwest” axes, occupies a significant amount of cultivated land and grassland, occurring mainly through infill and edge expansion. Notably, to ensure the red line of arable land and food security, extensive grasslands around Xining City have been reclaimed as arable land. The quantitative analysis of the driving factors indicates that the spatial expansion of Xining City’s main urban area is primarily influenced by the spatial distribution of tertiary roads, followed by topographic slope, and then by population and economic factors.

3.2. Land Use Characteristics of Xining City in 2030 under Different Scenarios

The simulation of land use changes in Xining City for the year 2030 under three distinct scenarios—the urban development scenario, the cropland protection scenario, and the ecological protection scenario—reveals significant insights (Figure 6). Under the urban development scenario (Figure 6a), the land use pattern in 2030 closely resembles that of 2020, with a notable decrease in cropland and grassland areas and a continuous uptrend in construction land. Specifically, compared to 2020, cropland area diminished by 3545 hectares, constituting a reduction of approximately 34.41%, while grassland area decreased by 2300 hectares, equivalent to around 12.44%. Conversely, the area designated for construction land expanded by 5931 hectares, marking an increase of about 36.10%. In contrast, the cropland protection scenario (Figure 6b) depicts a relatively modest change in cropland and grassland areas. Here, the cropland area experiences a slight reduction of about 874 hectares, representing a decrease of 8.49%, while the grassland area decreases by approximately 2100 hectares, accounting for a reduction of 11.36%. Meanwhile, construction land area increases by 3043 hectares, reflecting a growth rate of 18.52%. Notably, the change in cropland area under this scenario exhibits a notably lower rate compared to the urban development scenario, indicative of substantial efforts to preserve arable land amidst urban development. Finally, under the ecological protection scenario (Figure 6c), there is a notable surge in forest land proportion and a mitigated rate of grassland area decrease. Forest land area increases by 90 hectares, marking a growth of about 25% compared to 2020, while the rate of grassland area reduction is relatively subdued, with a decrease of approximately 1394 hectares, translating to a reduction of 7.54% (Figure 6d).
Based on the changes in land use types such as cropland, grassland, and forest land under different scenarios, it can be observed that, in the urban natural development scenario, the expansion of construction land is unrestricted, leading to large-scale conversion of cropland and grassland to construction land. Conversely, in the cropland protection scenario, although restrictions on the probability of cropland transfer are imposed, urban development inevitably requires the transfer of cropland from neighboring areas, resulting in a smaller amount of cropland transfer compared to the urban development scenario. In the ecological protection scenario, an increase in forest area and a decrease in grassland area are observed, but the proportion of grassland transfer is significantly smaller compared to the cropland protection scenario. In conclusion, after evaluating the pros and cons of urban development, cropland protection, and ecological protection, we believe that the cropland protection scenario balances urban development with the preservation of cropland and food security, effectively mitigating the ecological crisis caused by urban development. It might be considered the best path forward.
It is noteworthy that this study primarily centers on the main urban area of Xining City. While this study establishes restrictions on the transfer of land classes under varied scenarios, the exigencies of urban development dictate that land class conversion can merely be mitigated in the developmental process, yet it remains unable to comprehensively prohibit interclass conversion. Consequently, in contrast to the stringent limitations imposed in other studies, the constraints on land class transfers in diverse scenarios within this research exhibit a relatively lenient stance, albeit their probability of occurrence remains restricted.

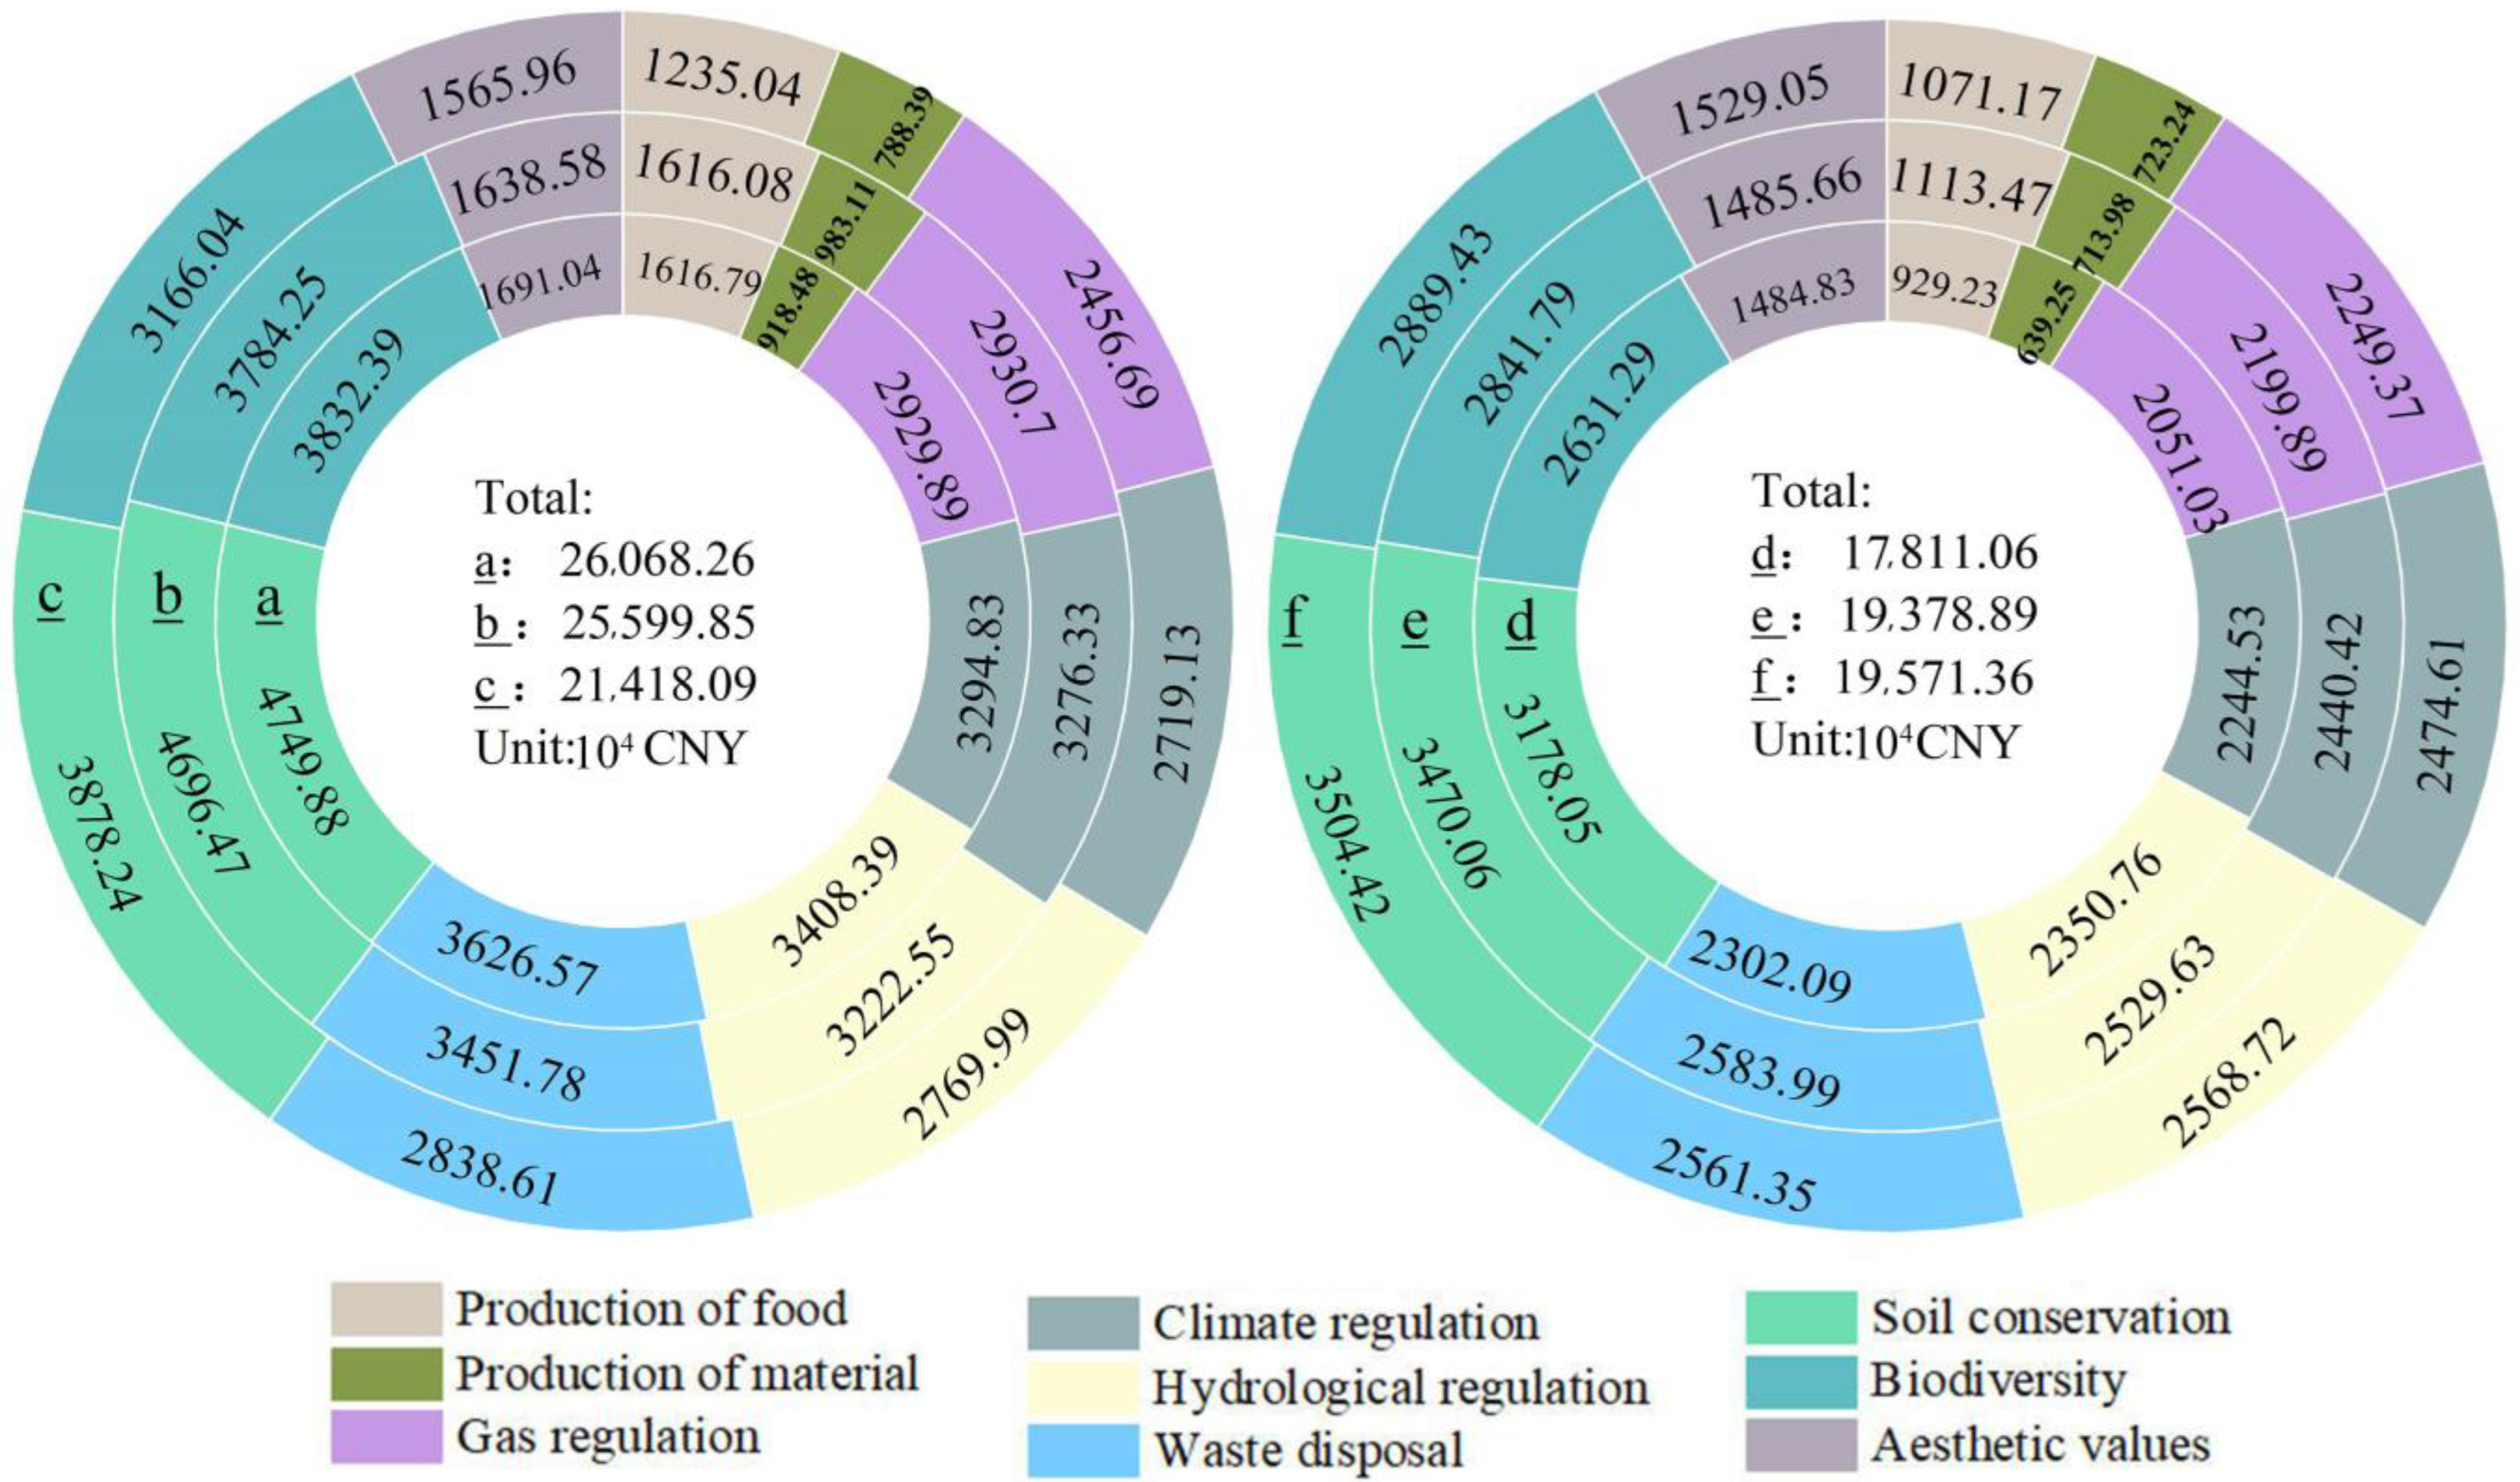
3.3. Analysis of Changes in the Ecosystem Services Value in Xining

Utilizing the formula (Equation (4)), we compute the ESV of Xining City spanning from 2000 to 2030 inclusive. Notably, this study exclusively accounts for the aesthetic value of construction land. The computed results reveal a general downward trajectory in the ESV of Xining City over the past two decades. Specifically, the ESV stood at 26,058.26 × 104 CNY in 2000, declined to 25,599.85 × 104 CNY in 2010, and further decreased to 21,418.09 × 104 CNY in 2020. Through simulations projecting future land use scenarios in Xining City, the ESV for 2030 is projected as 17,811.06 × 104 CNY under the urban development scenario, 19,378.89 × 104 CNY under the cropland protection scenario, and 19,571.36 × 104 CNY under the ecological protection scenario. Analysis of individual land categories reveals a consistent decreasing trend in ESV for all categories except construction land and water, paralleling their diminishing areas. Notably, construction land experienced the most significant shift, surging from 140.58 × 10⁴ CNY in 2000 to 357.52 × 10⁴ CNY, marking a growth rate of 154.32%; cropland dwindled from 7649.83 × 104 CNY in 2000 to 3556.48 × 104 CNY under the urban development scenario, registering a decrease rate of 53.51%; meanwhile, grassland decreased from 17,283.28 × 104 CNY in 2000 to 12,583.29 × 104 CNY under the urban development scenario, indicating a decrease rate of 27.19%.
Broadly, the progression of urbanization in Xining City delineates a consistent decline in ESV over the span of nearly two decades from 2000 to 2020 (refer to Figure 7). However, in 2030, amidst various scenarios, meticulous comparative scrutiny reveals an inexorable truth: irrespective of the policy stance adopted, underpinning urban development, farmland preservation, and ecological conservation, the expansion and advancement of urban areas inexorably precipitate a reduction in ecosystem services.

4. Discussion

(1) Comparing and analyzing Sun’s study of Xining City’s urban spatial expansion reveals several differences [22]. Sun’s study spans a longer timeframe, from 1986 to 2020. However, high-resolution satellite images indicate that Xining City’s most significant urban spatial expansion occurred between 2000 and 2020, with the period from 2010 to 2020 showing a particularly rapid increase. Secondly, Sun’s analysis of the drivers of urban spatial expansion in Xining City primarily focused on the quantitative aspects of population and GDP, without providing quantitative descriptions for other influencing factors. In contrast, our study employs the PLUS model to quantitatively analyze these drivers, elucidating the constraints and importance of various factors influencing spatial expansion in plateau cities like Xining. Additionally, we calculated changes in land use and ecosystem service values resulting from future expansion under different scenarios. Our findings indicate that, regardless of the scenario, the ecosystem service value of urban areas is in a continuous decline due to urban development.
(2) In this study, the kappa coefficient of land use simulation outcomes for Xining City in 2030 registers at 0.72, with an overall accuracy of 0.81. Concurrently, within the simulation process, the transition pathways between classes are rigorously constrained across diverse scenarios, alongside restricted interclass conversion probabilities. Nevertheless, given the substantial impact of policy factors on the spatial expansion of the urban area, there exists a need for further deliberation regarding the integration of prevailing policy factors into scenario quantification and its practical manifestation within the simulation process, underscoring the potential for enhancement in future endeavors.
The distance from government institutions was used as an indicator of policy regulation factors. However, this factor was not significant in the analysis of spatial expansion drivers using the PLUS model, suggesting that the quantification and simulation of policy impacts could be further refined in future research. Additionally, due to the gradual implementation of the “Northwest China, North China and Northeast China Protective Forests” project in Xining City during the 1990s, the forests planted in the southern and northern mountains were not fully developed by 2000. This resulted in a lack of forest land data in the 2000 land use dataset, leading to a relatively low ecosystem service value (ESV) for Xining City for that year. Nevertheless, this discrepancy does not affect the overall trend of ESV changes in Xining City from 2000 to 2030.
(3) Furthermore, as urbanization accelerates, a plethora of challenges emerge, encompassing not only ecological preservation but also various social dilemmas. Notably, urban expansion precipitates the conversion of substantial agricultural tracts into construction zones, a phenomenon ubiquitous on a global scale [43,44]. Consequently, this transformation engenders a significant population of landless peasants within urban–rural interfaces. For these individuals, whose livelihoods undergo metamorphosis amidst the alteration of their native habitats, ensuring future sustenance proves daunting, constrained by cultural and skill proficiency disparities. Additionally, the sudden accrual of wealth among local farmers, juxtaposed with their limited financial acumen, heightens the propensity for social discord. Consequently, elucidating mechanisms to safeguard future livelihoods and welfare provisions for landless farmers, thereby ensuring a steady income stream to mitigate social tensions, emerges as a pivotal avenue for prospective inquiry [45].

5. Conclusions and Suggestions

5.1. Conclusions

This study utilizes land use data pertaining to the primary urban zone of Xining City spanning the period from 2000 to 2020. It conducts an analysis of the city’s land dynamics over the past two decades utilizing a land use transfer matrix. Additionally, employing the PLUS model, it quantitatively examines the expansion of urban construction land in Xining City over the same period and identifies its driving factors. Moreover, the study simulates future urban land utilization scenarios for Xining City and integrates an enhanced unit area equivalent factor method to estimate the ecosystem services value within the primary urban area of Xining City for the years 2000 and 2020. Subsequently, the following conclusions are drawn:
(1) Over the last two decades, the urban spatial expansion of Xining City has been conspicuous, predominantly expanding along the coastlines of the Huangshui River, Beichuan River, and Nanchuan River, exhibiting a “northwest-southeast” and “north-southwest” orientation. The conversion of land for urban construction has primarily occurred at the expense of cropland and grassland. Simulation results projecting different scenarios for 2030 indicate a continued decline in the area of cropland, forest land, and grassland.
(2) Quantitative analysis of the driving forces behind urban spatial expansion in Xining City reveals that topographical factors exert the primary influence, followed by urban transportation planning considerations. Moreover, the expansion of construction land exhibits varied responses to different road hierarchies, with third-level roads demonstrating the most extensive distribution and consequential impact. Conversely, the influence of population density, GDP, and proximity to government institutions remains relatively marginal.
(3) The ecosystem service value (ESV) of Xining City experienced a general decline from 2000 to 2030, marked by pronounced losses in arable land and grassland, resulting in substantial fluctuations in ESV. Simultaneously, simulation outcomes for 2030 across varied scenarios indicate that irrespective of policy orientation, urban expansion and development invariably engender diminished ecosystem service functionality. Hence, for river valley cities situated amidst the fragile ecological milieu of the Tibetan Plateau, prioritizing urban development while safeguarding ecosystem stability becomes imperative. This approach aims to foster the robust development of the urban ecosystem while averting irreversible harm to the Tibetan plateau ecology.

5.2. Policy Recommendations

(1) Scientific planning for sustainable urban expansion.
To achieve sustainable urban expansion, we can begin by focusing on the development of existing built-up areas. Firstly, priority should be given to the renovation and expansion of these areas by correcting and updating inadequate planning, promoting infill development, enhancing infrastructure, and ensuring an equitable distribution of healthcare and education resources. Additionally, from the urban fringe areas, attention must be given to the ecological red line and the farmland protection zones. Strengthening ecological conservation and moderately developing unused lands can help mitigate the ecological issues resulting from the extensive use of farmland and grasslands. On the other hand, attention should also be directed towards the urban peripheries. By focusing on restricted development zones, such as ecological red lines and farmland protection areas, enhancing environmental conservation efforts, and developing unused lands judiciously, we can address the ecological challenges posed by the historical overuse of agricultural and pastoral lands.
(2) Expand and improve urban green spaces to establish the city as a premier international eco-tourism destination.
In pursuit of establishing Xining as a key destination for international eco-tourism, efforts should be concentrated around key sites such as Huangshui Wetland Park, Haihu Wetland Park, and Beichuan Wetland Park. The goal is to develop a network of wetland parks within the city, enhance urban park infrastructure, expand street green spaces, and improve leisure plazas. This will enrich the urban landscape with green vegetation, mitigate the ecological service value lost due to the reduction of farmland and grassland, and contribute to the vision of a “Happy Xining, Garden City”.
(3) Leverage the development of the “Lanzhou-Xining” urban agglomeration to mitigate the expansion pressures faced by the provincial capital.
As a vital urban agglomeration in the western region, the Lanxi city cluster holds significant importance for the development of Qinghai Province and Gansu Province. Future expansion of Xining City should focus on strengthening regional cooperation and enhancing connections with Haidong City to the east. This will amplify the clustering effect of Xining, facilitate the transfer of non-core industries and inefficient sectors to less developed peripheral cities such as Huangzhong District and Datong County, and improve land use efficiency in Xining. These measures will effectively mitigate the expansion pressures on the provincial capital.

Author Contributions

Conceptualization, Z.Z., W.M. and F.L.; Data curation, Q.C.; Formal analysis, Z.Z.; Funding acquisition, F.L.; Methodology, Z.Z., Q.C. and Q.Z.; Software, Z.Z.; Supervision, Q.Z.; Writing—original draft, Z.Z.; Writing—review and editing, Z.Z. and W.M. All authors have read and agreed to the published version of the manuscript.

Funding

This research was financially supported by the Second Tibetan Plateau Scientific Expedition and Research (2019QZKK0603), the National key research and development plan (2019YFA0606902), the Chinese Academy of Sciences Strategic Pilot Class A Special Project (XDA2009000002), and the National Natural Science Foundation of China (Grant No. 42061023).

Institutional Review Board Statement

Not applicable.

Informed Consent Statement

Not applicable.

Data Availability Statement

The data presented in this study are available on request from the corresponding author. The data are not publicly available due to privacy.

Conflicts of Interest

The authors declare no conflicts of interest.

References

  1. Liu, S.; Yan, Y.; Hu, B. Satellite Monitoring of the Urban Expansion in the Pearl River–Xijiang Economic Belt and the Progress towards SDG11.3.1. Remote Sens. 2023, 15, 5209. [Google Scholar] [CrossRef]
  2. Wu, R.; Li, Z.; Wang, S. The varying driving forces of urban land expansion in China: Insights from a spatial-temporal analysis. Sci. Total Environ. 2021, 766, 142591. [Google Scholar] [CrossRef] [PubMed]
  3. Wang, L.; Jia, Y.; Li, X.; Gong, P. Analysing the Driving Forces and Environmental Effects of Urban Expansion by Mapping the Speed and Acceleration of Built-Up Areas in China between 1978 and 2017. Remote Sens. 2020, 12, 3929. [Google Scholar] [CrossRef]
  4. Li, C.; Li, J.; Wu, J. What drives urban growth in China? A multi-scale comparative analysis. Appl. Geogr. 2018, 98, 43–51. [Google Scholar] [CrossRef]
  5. Manioudis, M.; Meramveliotakis, G. Broad strokes towards a grand theory in the analysis of sustainable development: A return to the classical political economy. New Political Econ. 2022, 27, 866–878. [Google Scholar] [CrossRef]
  6. Meramveliotakis, G.; Manioudis, M. History, Knowledge, and Sustainable Economic Development: The Contribution of John Stuart Mill’s Grand Stage Theory. Sustainability 2021, 13, 1468. [Google Scholar] [CrossRef]
  7. Zhang, C.; Sun, Z.; Xing, Q.; Sun, J.; Xia, T.; Yu, H. Localizing Indicators of SDG11 for an Integrated Assessment of Urban Sustainability—A Case Study of Hainan Province. Sustainability 2021, 13, 11092. [Google Scholar] [CrossRef]
  8. Akuraju, V.; Pradhan, P.; Haase, D.; Kropp, J.P.; Rybski, D. Relating SDG11 indicators and urban scaling—An exploratory study. Sustain. Cities Soc. 2020, 52, 101853. [Google Scholar] [CrossRef]
  9. Hou, Y.; Kuang, W.; Dou, Y. Analysis of urban expansion and fractal features in global 33 megacities from 2000–2020. Acta Geogr. Sin. 2022, 77, 2687–2702. [Google Scholar]
  10. Wang, W. From spatial expansion to functional transformation—The urban regeneration and reconstruction of Shanghai. Sci. Sin. (Technol.) 2023, 53, 721–728. [Google Scholar] [CrossRef]
  11. Shi, T.; Shi, H. Urban expansion and its temporal and spatial driving forces of Urumqi based on geo-detector method. Arid Land Geogr. 2021, 44, 867–876. [Google Scholar]
  12. Chen, Q.; Zhou, Q.; Liang, S.; Luo, Z. An Analysis of Land Use Pattern Change of Xining City Based on GIS. Econ. Geogr. 2010, 30, 244–248. [Google Scholar]
  13. Li, W.; Xie, S.; Wang, Y.; Huang, J.; Cheng, X. Effects of urban expansion on ecosystem health in Southwest China from a multi-perspective analysis. J. Clean. Prod. 2021, 294, 126341. [Google Scholar] [CrossRef]
  14. Gao, L.; Tao, F.; Liu, R.; Wang, Z.; Leng, H.; Zhou, T. Multi-scenario simulation and ecological risk analysis of land use based on the PLUS model: A case study of Nanjing. Sustain. Cities Soc. 2022, 85, 104055. [Google Scholar] [CrossRef]
  15. Xie, G.; Zhang, C.; Zhang, L.; Chen, W.; Li, S. Improvement of the Evaluation Method for Ecosystem Service Value Based on Per Unit Area. J. Nat. Resour. 2015, 30, 1243–1254. [Google Scholar]
  16. Costanza, R.; d’Arge, R.; de Groot, R.; Farber, S.; Grasso, M.; Hannon, B.; Limburg, K.; Naeem, S.; O’neill, R.V.; Paruelo, J. The value of the world’s ecosystem services and natural capital. Nature 1997, 387, 253–260. [Google Scholar] [CrossRef]
  17. Xie, G.; Zhen, L.; Lu, C.; Xiao, Y.; Chen, C. Expert Knowledge Based Valuation Method of Ecosystem Services in China. J. Nat. Resour. 2008, 23, 911–919. [Google Scholar]
  18. Jiang, W.; Lü, Y.; Liu, Y.; Gao, W. Ecosystem service value of the Qinghai-Tibet Plateau significantly increased during 25 years. Ecosyst. Serv. 2020, 44, 101146. [Google Scholar] [CrossRef]
  19. Liu, Y.; Hou, X.; Li, X.; Song, B.; Wang, C. Assessing and predicting changes in ecosystem service values based on land use/cover change in the Bohai Rim coastal zone. Ecol. Indic. 2020, 111, 106004. [Google Scholar] [CrossRef]
  20. Zhang, X.; Ren, W.; Peng, H. Urban land use change simulation and spatial responses of ecosystem service value under multiple scenarios: A case study of Wuhan, China. Ecol. Indic. 2022, 144, 109526. [Google Scholar] [CrossRef]
  21. Liu, F.; Chen, W.; Gao, L. Research on Optimization Strategies for Urban Rail Transit Line Network Planning in River Valley Band-shaped City as Xining. Urban Mass Transit 2023, 26, 103–107. [Google Scholar]
  22. Sun, a. Spatial Expansion Process and Mechanism of Plateau Valley City. Master’s Thesis, Qinghai Normal University, Xining, China, 2021. [Google Scholar]
  23. Jia, w.; Gao, X. Analysis of Urban Heat Island Environment in a Valley City for Policy Formulation: A Case Study of Xining City in Qinghai Province of China. J. Geo-Inf. Sci. 2014, 16, 592–601. [Google Scholar]
  24. Xining Statistics Bureau. Xining Statistical Yearbook of 2020; Xining Statistics Bureau: Xining, China, 2021.
  25. Xining Statistics Bureau. Xining Statistical Yearbook of 2016; Xining Statistics Bureau: Xining, China, 2017.
  26. Xining Statistics Bureau. Xining Statistical Yearbook of 2017; Xining Statistics Bureau: Xining, China, 2018.
  27. Xining Statistics Bureau. Xining Statistical Yearbook of 2018; Xining Statistics Bureau: Xining, China, 2019.
  28. Xining Statistics Bureau. Xining Statistical Yearbook of 2019; Xining Statistics Bureau: Xining, China, 2020.
  29. Zhang, A.; Pan, Y.; Ming, Y.; Wang, J. Research of GDP Spatialization based on Multi-source Information Coupling: A Case Study in Beijing. Remote Sens. Technol. Appl. 2021, 36, 463–472. [Google Scholar]
  30. Wang, X.; Wu, J.; Wang, H. Comparison of GDP Spatialization in Beijing-Tianjin-Hebei Based on Night Light and Population Density Data. J. Geo-Inf. Sci. 2016, 18, 969–976. [Google Scholar]
  31. Liang, X.; Guan, Q.; Clarke, K.C.; Liu, S.; Wang, B.; Yao, Y. Understanding the drivers of sustainable land expansion using a patch-generating land use simulation (PLUS) model: A case study in Wuhan, China. Comput. Environ. Urban Syst. 2021, 85, 101569. [Google Scholar] [CrossRef]
  32. Zhou, L.; Dang, X.; Mu, H.; Wang, B.; Wang, S. Cities are going uphill: Slope gradient analysis of urban expansion and its driving factors in China. Sci. Total Environ. 2021, 775, 145836. [Google Scholar] [CrossRef] [PubMed]
  33. Peng, K.; Jiang, W.; Ling, Z.; Hou, P.; Deng, Y. Evaluating the potential impacts of land use changes on ecosystem service value under multiple scenarios in support of SDG reporting: A case study of the Wuhan urban agglomeration. J. Clean. Prod. 2021, 307, 127321. [Google Scholar] [CrossRef]
  34. Liu, Z.; Huang, H.; Werners, S.E.; Yan, D. Construction area expansion in relation to economic-demographic development and land resource in the Pearl River Delta of China. J. Geogr. Sci. 2016, 26, 188–202. [Google Scholar] [CrossRef]
  35. Li, C.; Gao, B.; Wu, Y.; Zheng, K.; Wu, Y. Dynamic simulation of landscape ecological risk in mountain towns based on PLUS model. J. Zhejiang Agric. For. Univ. 2022, 39, 84–94. [Google Scholar] [CrossRef] [PubMed]
  36. Wang, Z.; Huang, C.; Li, J.; Lin, J. Ecological zoning planning and dynamic evaluation coupled with Invest-HFI-Plus model:A case study in Bortala Mongolian Autonomous Prefecture. Acta Ecol. Sin. 2022, 42, 5789–5798. [Google Scholar]
  37. Sun, N.; Chen, Q.; Liu, F.; Zhou, Q.; He, W.; Guo, Y. Land Use Simulation and Landscape Ecological Risk Assessment on the Qinghai-Tibet Plateau. Land 2023, 12, 923. [Google Scholar] [CrossRef]
  38. Li, H.; Dai, Q.; Hu, Z.; Gui, Y. Temporal and Spatial Evolution of Carbon Storage in Guiyang City Based on PLUS InVEST Model and Multi-scenario Simulation and Prediction. Bull. Soil Water Conserv. 2024, 1–11. [Google Scholar] [CrossRef]
  39. Wang, Q.; Xi, Y.; Liu, X.; Zhou, W.; Xu, X. Spatial-temporal response of ecological service value to land use change: A case study of Xuzhou City. Remote Sens. Nat. Resour. 2021, 33, 219–228. [Google Scholar]
  40. Hu, C.; Guo, X.; Lian, G.; Zhang, Z. Effects of Land Use Change on Ecosystem Service Value in Rapid Urbanization Areas in Yangtze River Delta: A Case Study of Jiaxing City. Resour. Environ. Yangtze Basin 2017, 26, 333–340. [Google Scholar]
  41. Xie, G.; Xiao, Y.; Zhen, L.; Lu, C. Study on ecosystem services value of food production in China. Chin. J. Eco-Agric. 2005, 13, 10–13. [Google Scholar]
  42. Jiang, Y.; Zhou, L.; Chen, Z. Slope-Climbing Characteristics of Typical Valley-Type Urban Construction Land and Its Ecological Quality Influence. Mt. Res. 2022, 40, 570–580. [Google Scholar]
  43. Coxhead, I.; Jayasuriya, S. Technical change in agriculture and land degradation in developing countries: A general equilibrium analysis. Land Econ. 1994, 70, 20–37. [Google Scholar] [CrossRef]
  44. Reenberg, A. Agricultural land use pattern dynamics in the Sudan–Sahel—Towards an event-driven framework. Land Use Policy 2001, 18, 309–319. [Google Scholar] [CrossRef]
  45. Chen, Q.; Cai, Y.; Liu, F.; Wei, X.; Zhou, Q.; Zhang, H. Farmers’ value and attitude model of farmland non-agriculture conversion: A questionnaire from farmers in Xining city. Geogr. Res. 2018, 37, 2447–2458. [Google Scholar]
Figure 1. Overview map of the study area ((a): Xining’s position in the Yellow River-Huangshui Valley; (b): main urban area of Xining city).
Sustainability 16 04537 g001
Figure 2. Spatial distribution of GDP in Xining City in 2020 ((a): the spatial distribution of GDP, (b) the importance distribution of each indicator in the random forest model).
Sustainability 16 04537 g002
Figure 3. Spatial distribution of drive factors. (a): Elevation, (b): Slope, (c): Distance from river, (d): Density of population, (e): Spatial distribution of GDP, (f): Distance from government, (g): Distance from highway, (h): Distance from trunk, (i): Distance from primary road, (j): Distance from secondary road, (k): Distance from tertiary road.
Sustainability 16 04537 g003
Figure 4. Spatial distribution of built-up land in the main urban area of Xining City, (a): built-up land in 2000, (b): built-up land in 2010, (c): built-up land 2020.
Sustainability 16 04537 g004
Figure 5. The contribution of driving factors of urban built-up land expansion.
Sustainability 16 04537 g005
Figure 6. Spatial distribution of land use in Xining City under different scenarios ((a) is the Urban development scenario, (b) is the Cropland protection scenario, (c) is the Ecological protection scenario, and (d) is the number of changes in different land categories under the three scenarios).
Sustainability 16 04537 g006
Figure 7. Changes of ESV in Xining, 2000–2030 ((a) for 2000, (b) for 2010, (c) for 2020, (d) for Urban development scenarios, (e) for Cropland protection scenarios, (f) for Ecological protection scenarios).
Sustainability 16 04537 g007
Table 1. The source and utilization of each dataset in the study.
DataResolution/mAgeSourceWebsiteApplication in the Paper
Land 2000302000Globeland 30https://www.webmap.cn/ (Accessed on 5 April 2024).Analysis of urban spatial expansion
Land 2010302010Globeland 30
Land 2020302020Globeland 30
POINone2020Amaphttps://lbs.amap.com/ (Accessed on 5 April 2024).Production of GDP spatial data
Night lighting1202020Luojia 1-01http://59.175.109.173:8888/index.html (Accessed on 5 April 2024).
POI (government)None2020Euclidean distance in Arcgis 10.7https://lbs.amap.com/ (Accessed on 5 April 2024).Analysis of drivers of urban expansion
GDP1002020Production of GDP spatial dataNone
Population1002020Worldpophttps://www.worldpop.org/ (Accessed on 5 April 2024).
Elevations302020STRM DEMhttps://www.gscloud.cn/ (Accessed on 5 April 2024).
Slope302020STRM DEMExtraction from Elevation
Road1002020Euclidean distance in Arcgis 10.7https://www.openstreetmap.org (Accessed on 5 April 2024).
River1002017Euclidean distance in Arcgis 10.7https://www.webmap.cn/main.do?method=index (Accessed on 5 April 2024).
Production of cropsNone2016–2020Statistical Yearbook of Xining City [24,25,26,27,28]Xining Statistical BureauCalculation of the ecosystem services value
Prices of cropsNone2020Statistical Yearbook of Xining City [24]Xining Statistical Bureau
Table 2. Land conversion matrix under different future scenarios.
Urban Development ScenarioCropland Protection ScenarioEcological Protection Scenario
CLGLWBBLFLCLGLWBBLFLCLGLWBBLFL
CL111111111111111
GL111111111101111
WB111110010000100
BL000100001000010
FL111111111100001
CL—Cropland, GL—Grassland, WB—Waterbody, BL—Built-up Land, FL—Forest Land.
Table 3. Ecosystem service equivalent value per unit area of China (2007).
Primary ServicesSecondary ServicesForestGrasslandCroplandWetlandRiver/LakeBarren
Supply servicesProduction of food0.330.431.000.360.530.02
Production of material2.980.360.390.240.350.04
Regulatory servicesGas regulation4.321.500.722.410.510.06
Climate regulation4.071.560.9713.552.060.13
Hydrological regulation4.091.520.7713.4418.770.07
Waste disposal1.721.321.3914.4014.850.26
Support servicesSoil conservation4.022.241.471.990.410.17
Biodiversity4.511.871.023.693.430.40
Cultural servicesAesthetic values2.080.870.174.694.440.24
Total28.1211.677.954.7745.351.39
Table 4. Standard coefficient of ecosystem service equivalent value per unit area of in Xining.
Primary ServicesSecondary ServicesForestGrasslandCroplandWaterBuilt-Up Land
Supply servicesProduction of food219.83 286.44 666.14 353.05 0
Production of material1985.10 239.81 259.79 233.15 0
Regulatory servicesGas regulation2877.72 999.21 479.62 339.73 0
Climate regulation2711.19 1039.18 646.16 1372.25 0
Hydrological regulation2724.51 1012.53 512.93 12,503.45 0
Waste disposal1145.76 879.30 925.93 9892.18 0
Support servicesSoil conservation2677.88 1492.15 979.23 273.12 0
Biodiversity3004.29 1245.68 679.46 2284.86 0
Cultural servicesAesthetic values1385.57 579.54 113.24 2957.66 159.87
Total18,731.86 7773.85 5262.51 30,209.4159.87
Table 5. The transfer matrix of land use for the main urban area of Xining City (2000–2020).
2000–2020CroplandGrasslandWaterBuilt-UpForestTotalTotal Transfers OutPercentage Transfer Out
Cropland8319.06202.0560.855882.8429.6814,494.486175.4257.32%
Grassland1783.2118,133.4026.011947.76291.7522,182.134048.7337.58%
Water35.2039.6596.33131.3221.60324.10227.772.12%
Built-up164.91116.7428.128472.2311.088793.08320.852.98%
Total10,302.3918,491.84211.3016,434.14354.1245,793.7910,772.77100%
Total transfers in1983.32358.44114.987961.92354.1110,772.77
Percentage transfer in18.41%3.33%1.07%73.91%3.29%100%
Disclaimer/Publisher’s Note: The statements, opinions and data contained in all publications are solely those of the individual author(s) and contributor(s) and not of MDPI and/or the editor(s). MDPI and/or the editor(s) disclaim responsibility for any injury to people or property resulting from any ideas, methods, instructions or products referred to in the content.

