1. Introduction
Within the food industry, a substantial volume of waste is produced, most notably in the form of surplus fruits and sugars. These by-products, often dismissed as trivial waste, in fact possess significant potential for reuse and sustainability initiatives. The organic content in these discarded items could be transformed into a variety of useful products, largely through the process of solid-state fermentation [
1,
2] or thermochemical processes (such as hydrothermal liquefaction [
3] and aqueous phase reforming [
4]). However, solid-state fermentation, albeit effective, is time-consuming due to its reliance on microbial growth, and it also poses a risk of contamination from unwanted bacteria and fungi. On the other hand, thermochemical methods demand high temperatures and/or pressures. In 2020, the Reisner group unveiled the potential for converting food waste into value-added commodities (predominantly H
2) via a photocatalytic reforming process [
5]. This new method harnesses photo-generated electrons and holes to drive the reduction of water and the oxidation of food waste, respectively. Requiring no external energy other than sunlight, this technique is capable of producing H
2 (from water) that is suitable for fuel cells, thereby offering an enticing fusion of waste treatment and energy production [
6,
7,
8,
9]. However, such light-driven reactions are limited to transparent wastewater, as the presence of solids (e.g., fruits) can obstruct light penetration.
Recently, the concept of piezoelectric catalysis, which is driven by mechanical energy, has garnered significant attention [
10,
11,
12]. When piezoelectric materials, lacking a center of symmetry, are subjected to mechanical vibrations, they generate positive and negative charges on the opposite sides of their surface. These charges, reminiscent of the charge separation in photo-reforming reactions, have the potential to catalyze the dissociation of water molecules to release H
2 [
13], as well as to promote the oxidative degradation of organic compounds [
14]. Given that mechanical energy can readily penetrate solutions containing solids or even navigate through opaque solutions without hindrance, piezoelectric catalysis has emerged as a promising approach for food processing applications where light-based methods may be less effective.
The selection and engineering of piezoelectric catalytic materials are critical to the success of H
2 production. The present research in piezoelectric catalysis primarily focuses on perovskite-based oxides (such as BaTiO
3, PbTiO
3, etc. [
15,
16,
17,
18,
19]), ZnO [
20], BiOX [
13,
21,
22] (where X = Cl, Br, I), and MoS
2 [
23,
24]. These materials are not only characterized by high piezoelectric coefficients but are also often structured in one-dimensional (1D) [
25] or two-dimensional (2D) [
13,
26] forms. Such morphological features are conducive to the effective harnessing of mechanical energy through deformation. Nevertheless, these materials require intricate fabrication methods (e.g., hydrothermal and solvent-thermal methods) to attain such specific forms, which presents substantial obstacles to their large-scale production. On the other hand, g-C
3N
4, known for its unique 2D structure and scalability in synthesis, has emerged as a promising candidate. While predominantly recognized for its role as a photocatalyst [
27,
28], recent research has unveiled that g-C
3N
4, featuring triangular nanopores within its tri-s-triazine layers, can display significant in-plane piezoelectric effects. It has been effectively applied in piezoelectric reactions for tasks such as H
2 production, H
2O
2 generation, and the degradation of dyes and antibiotics [
29,
30,
31,
32,
33]. With its demonstrated efficacy, we believe that g-C
3N
4 holds great potential as a piezoelectric catalyst to turn waste sugars and fruits into valuable materials by harnessing mechanical energy.
In our current research, we have engineered thin g-C3N4 nanosheets embellished with Au nanoparticles as co-catalysts for H2 production through the piezoelectric reforming of discarded sugars and fruits. The Au/CN composite showcased an enhanced H2 evolution rate in comparison to unmodified g-C3N4. We thoroughly examined the reaction conditions and elucidated the core mechanisms responsible for the observed enhancement in H2 production.
2. Materials and Methods
2.1. Chemicals
Urea (CH4N2O, ≥99.0%), tetrachloroauric (III) acid (HAuCl4, ≥99.9%), chloroplatinic (IV) acid (H2PtCl6, Pt 37.5%), sodium tetrachloropalladate (II) (Na2PdCl4, 98%), silver nitrate (AgNO3, ≥99.0%), and ruthenium chloride hydrate (RuCl3·xH2O, 99.95%) were obtained from Aladdin Holding Group Co., Ltd. (Beijing, China). Sodium sulfate (Na2SO4, ≥99%), D-glucose (C6H12O6, ≥99.5%), fructose (C6H12O6, ≥99%), sucrose (C12H22O11, ≥99.5%), and maltose (C12H22O11, ≥98.0%) were purchased from Sinopharm (Shanghai, China). All these chemicals were used without further purification.
2.2. Preparation
Typically, a crucible containing 10 g of urea was capped and placed in a muffle furnace. The temperature was ramped up at a rate of 5 °C/min to 550 °C and held constant for 4 h. The resultant light-yellow substance was identified as g-C3N4, denoted as CN. For the synthesis of gold-decorated g-C3N4, 10 mg of the as-synthesized CN was dispersed in 20 mL of an aqueous solution with 5 g of glucose and a specified quantity of HAuCl4 to achieve a gold loading of 2 wt.%. The reactor was sealed tightly with a silicone plug and flushed with argon gas through needles for 30 min to expel any air. Subsequently, the mixture was subjected to UV light from a 395 nm LED lamp while stirring magnetically for 1 h. The transformation of the powder from light-yellow to red evidenced the successful deposition of Au nanoparticles onto the g-C3N4, yielding the composite designated as Au2/CN. The sample was collected through centrifugation, cleansed consecutively with water and ethanol, and subsequently oven-dried at 60 °C to ready it for subsequent characterizations. The preparation of Pt-, Pd-, Ag-, and Ru-loaded g-C3N4 used the same method except H2PtCl6, Na2PdCl4, AgNO3, and RuCl3 were used as the precursors, respectively.
2.3. Characterizations
X-ray diffraction (XRD) patterns were obtained using a Shimadzu Lab XRD-6100 X-ray diffractometer (Kyoto, Japan), employing Cu Kα radiation (λ = 0.1541 nm). The AFM (atomic force microscopy) and PFM (Piezoresponse Force Microscopy) analyses were performed utilizing the Bruker Dimension Icon platform (Billerica, MA, USA). X-ray photoelectron spectroscopy (XPS) measurements were conducted on a Shimadzu/Kratos AXIS SUPRA+ instrument (Kyoto, Japan). Transmission electron microscopy (TEM) and high-resolution TEM (HRTEM) images were examined on a Tecnai F20 system operating at an acceleration voltage of 200 kV (Hillsboro, OR, USA). UV–Vis diffuse reflectance spectroscopy (UV-Vis DRS) data were collected via a Shimadzu UV-3101PC spectrophotometer (Kyoto, Japan), utilizing BaSO4 as a standard reference. Photoluminescence (PL) emission spectra were acquired using a Shimadzu RF-6000 spectrometer (Kyoto, Japan), with a 365 nm laser serving as the excitation source.
2.4. Electrochemical Analysis
Electrochemical characterization was performed using a CHI630E electrochemical workstation (Shanghai, China) equipped with a traditional three-electrode configuration, employing a 0.5 M Na2SO4 solution as the electrolyte. A platinum net served as the counter electrode, while an Ag/AgCl electrode saturated with 3.5 M KCl was utilized as the reference electrode, exhibiting a potential of 0.2046 V versus the Normal Hydrogen Electrode (NHE). The working electrode was fashioned by depositing the sample onto fluorine-doped tin oxide (FTO) glass (1 cm × 1 cm) through the following procedure: initially, 10 mg of the sample was dispersed in an 80 μL of Nafion (5%, used as a conductive and stable adhesive) and 5 mL of ethanol mixture using ultrasonic agitation; subsequently, 10 μL of this dispersion was applied onto the surface of the cleaned FTO glass; and ultimately, the coated FTO glass was cured on a hot plate set to 80 °C for a duration of 1 h. Piezoelectric current measurements were conducted by intermittently activating the ultrasonic agitation to acquire the current–time (i-t) response. Electrochemical impedance spectroscopy (EIS) analyses were executed at an applied overpotential of 600 mV over a frequency range from 0.01 Hz to 100 kHz, with a signal amplitude of 5 mV. Mott–Schottky plots were generated within a potential window extending from −1 V to 1 V relative to the Ag/AgCl electrode, at designated frequencies of 0.7, 1.2, and 1.7 kHz.
2.5. Piezoelectric H2 Evolution Test
After the above-mentioned photo-deposition process, the Au2/CN sample immersed in glucose solution (or other sugar solutions) was readied for piezo-catalytic assessment by purging with argon to clear any residual H2 from the process. The glass reactor containing the sample was placed in an ultrasonic cleaner (SN-QX-13, Shanghai, China, operating at 40 kHz, with a 1.3 L capacity and 160 W power), which was filled with water up to a specific level to accentuate vibrations. To ensure consistent test reproducibility, it is crucial to conduct all experiments under the same conditions: utilizing the same ultrasonic cleaner, maintaining the reactor centrally positioned within the sonication bath, and restricting the daily ultrasonication duration to no more than 3 h to circumvent potential attenuation that could result from extended usage. To mitigate thermal effects, the water in the bath was replenished regularly (e.g., every 15–20 min). To quantify the produced H2, 0.1 mL of gas was extracted using a syringe at hourly intervals during sonication and subsequently injected into a gas chromatograph (s·sun GC-9860, Shanghai, China) equipped with a thermal conductivity detector (TCD) for analysis. For tests using fruits as sacrificial reagents, 5 g of fruit pulp was blended with 20 mL of water in a crusher for one minute, ensuring the breakdown of the solid contents. Then, 10 mg of Au2/CN powder was dispersed into the fruit mixture. After an argon purge, the mixture was subjected to the identical sonication and gas sampling protocol.
3. Results and Discussion
g-C
3N
4 nanosheets were synthesized through the thermal decomposition of urea at 550 °C for a duration of 4 h [
27]. The atomic force microscopy (AFM) image presented in
Figure 1a illustrates the bidimensional architecture of the material, with lateral dimensions spanning between 1 and 2 µm and a thickness ranging from 4 to 6 nm. To ascertain the ferroelectric attributes of the g-C
3N
4 nanosheets, piezo-response force microscopy (PFM) was utilized. The amplitude image showcased in
Figure 1b displays a pattern of distinct ferroelectric domains scattered randomly, while the phase map in
Figure 1c exhibits pronounced phase shifts across various sections of the nanosheets, indicative of heterogeneous polarization directions. In
Figure 1d, a local hysteresis loop captures a substantial phase angle shift of approximately 175° upon the application and subsequent reversal of a 10 V DC bias field, suggestive of definitive polarization switching within the g-C
3N
4 nanosheets [
25]. Moreover, the loop’s pronounced butterfly shape in the amplitude profile provides strong confirmation of the material’s piezoelectric response [
30].
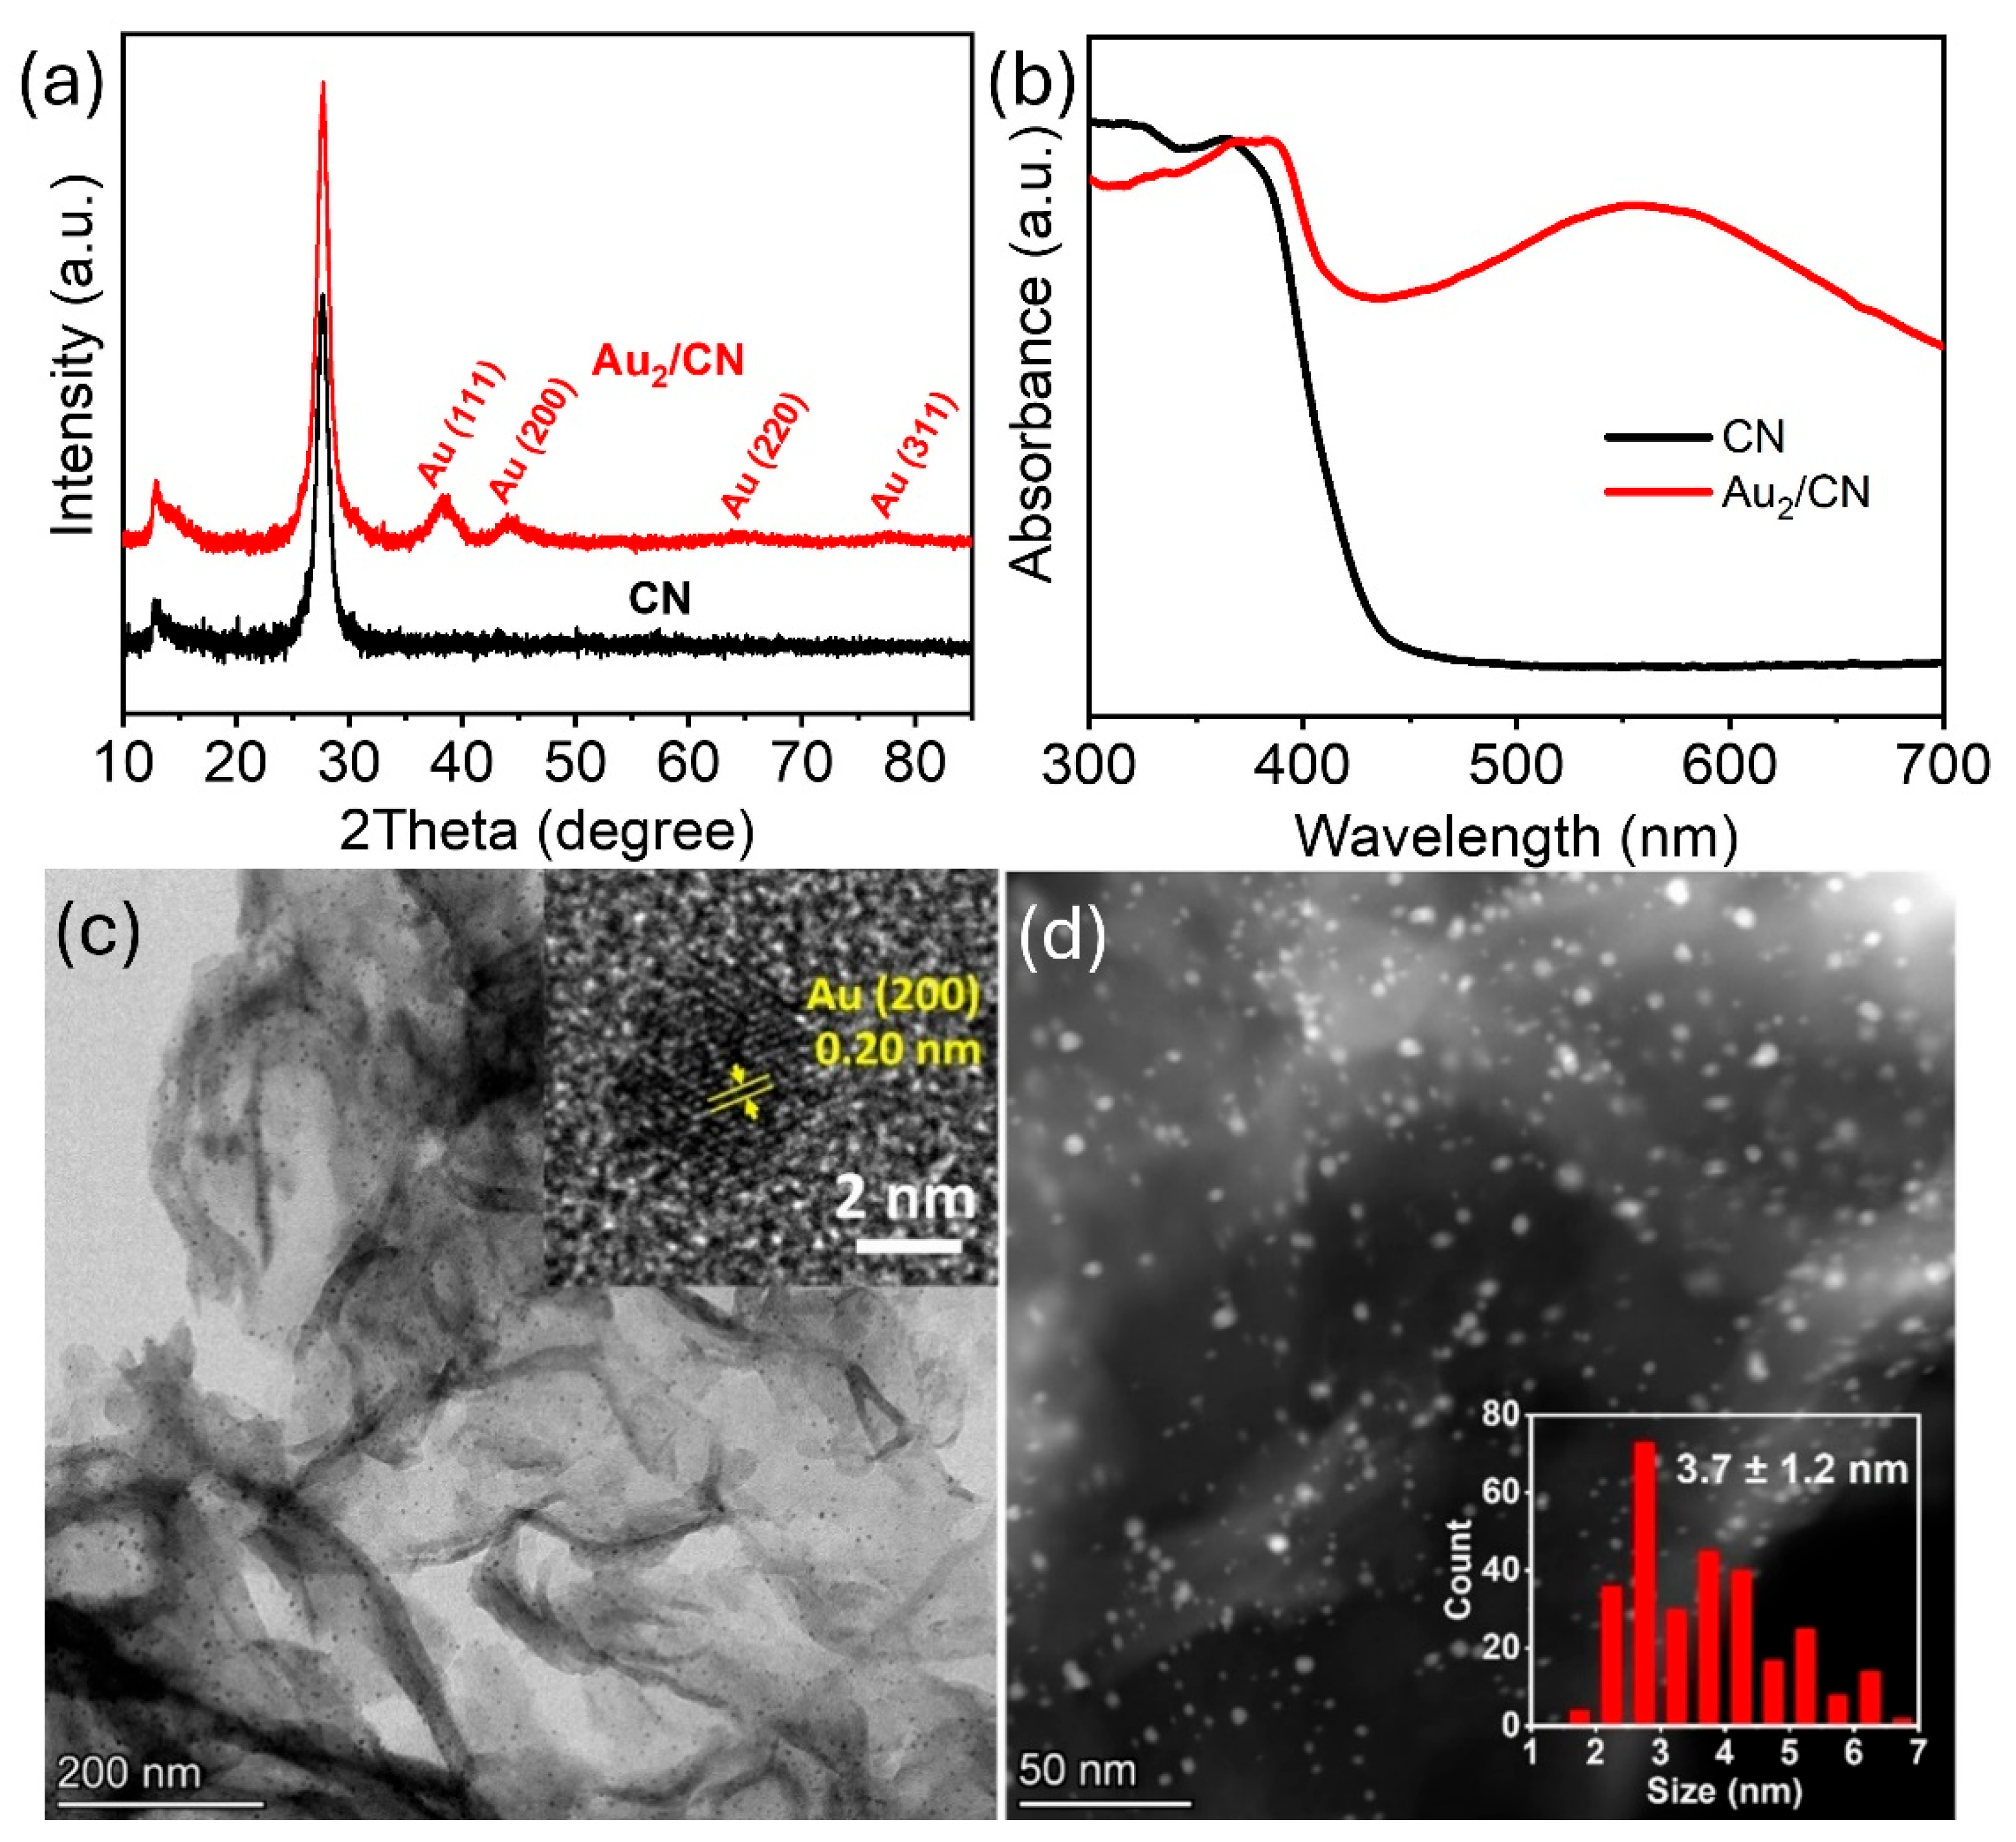
Au nanoparticles were anchored onto g-C
3N
4 nanosheets via a photo-deposition technique [
27]. As depicted in
Figure 2a, the unmodified g-C
3N
4 demonstrated two distinct XRD peaks at 2θ values of 13.7° and 27.8°, corresponding to the in-plane structural packing and the interlayer stacking of conjugated aromatic systems within the g-C
3N
4 framework, respectively [
27]. Subsequent to Au nanoparticle incorporation, additional peaks at 38.4°, 44.0°, 64.8°, and 77.5° materialized, ascribed, respectively, to the (111), (200), (220), and (311) crystal planes of cubic gold [
34]. The ultraviolet–visible diffuse reflectance spectroscopy (UV–Vis DRS) results, shown in
Figure 2b, further corroborate the presence of Au by revealing a pronounced absorption peak at approximately 560 nm, which originates from the localized surface plasmon resonance (LSPR) associated with Au nanoparticles [
35]. Transmission electron microscopy (TEM) images, both bright and dark field, verified a homogeneous distribution of Au nanoparticles across the g-C
3N
4 nanosheets, with a narrow size distribution averaging 3.7 ± 1.2 nm. The high-resolution TEM (HRTEM) image inset in
Figure 2c exposes a lattice spacing of 0.20 nm, which matches the (200) plane of cubic Au [
27], thereby confirming the successful deposition of Au nanoparticles on the g-C
3N
4 substrate.
Figure 3 presents the XPS spectra of Au
2/CN. The survey spectrum identified the characteristic peaks corresponding to C 1s, N 1s, O 1s, and Au 4f core levels. In the detailed C 1s spectrum shown in
Figure 3b, three distinct peaks can be observed at 288.3, 286.1, and 284.8 eV, which are attributed to the graphitic N-C=N moieties, C-OH functionalities, and C-C bonding frameworks, respectively [
33]. The N 1s spectrum featured in
Figure 3c has four peaks at 405.3, 401.6, 400.1, and 399.4 eV, which are, respectively, delineated as π citations [
36], N atoms in amine-associated N-H and tertiary nitrogen (N-(C)
3), and C-N=C linkages [
33]. The Au 4f spectrum had four notable peaks, with the dominant doublet peaks appearing at 84.0 eV and 87.7 eV, which correlate to the 4f
5/2 and 4f
7/2 orbitals of metallic gold (Au
0) [
27]. The other doublet peaks at 86.0 eV and 89.7 eV indicate that approximately 25.6% of the Au was in its oxidized state (Au
+), which stems from the surface oxidation of gold nanoparticles when exposed to air. This kind of surface oxidation is typical when noble metal particles are diminished to the nanometer scale [
27].
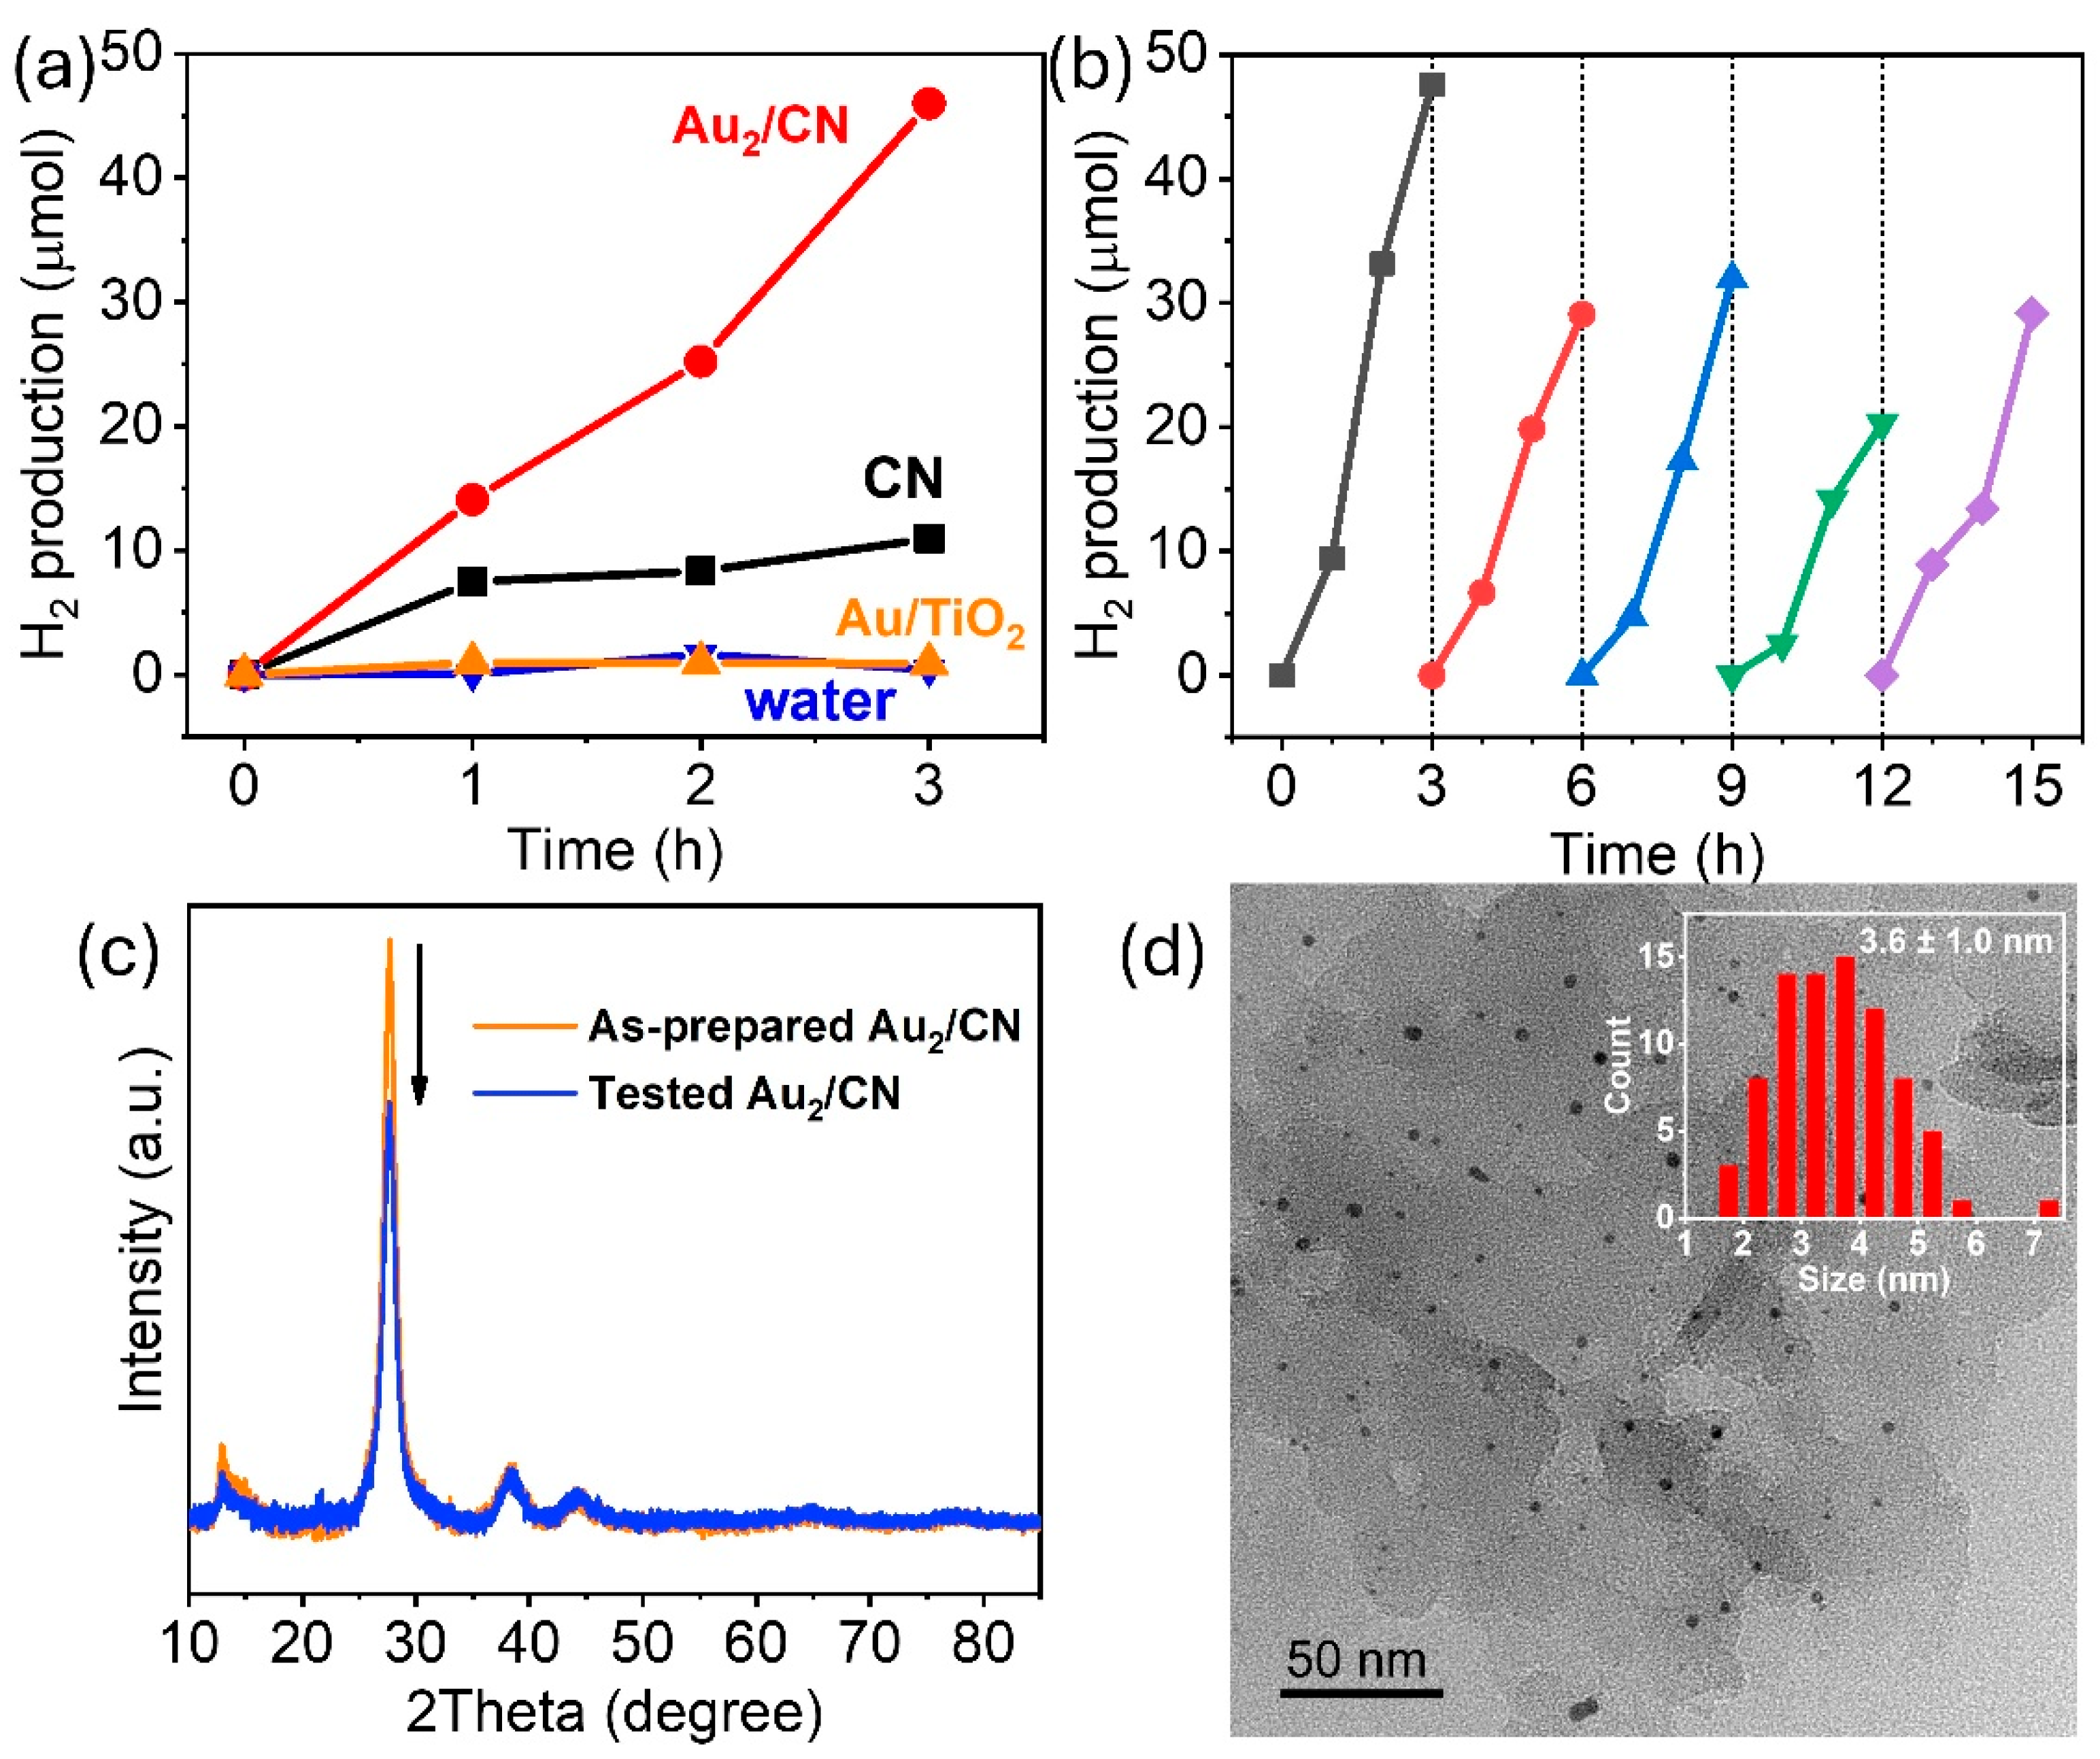
The piezoelectric activities of pristine g-C
3N
4 (CN) and Au
2/CN were initially appraised via the sonication of a glucose solution (5 g in 20 mL). As depicted in
Figure 4a, H
2 production progressed linearly over the course of a three-hour sonication for both samples. However, the H
2 yield derived from Au
2/CN was markedly superior to that obtained from CN, recording rates of 1533.3 versus 364.9 µmol/g/h, respectively (based on the values noted in
Figure 4a). A control experiment, employing a non-piezoelectric material, such as Au/TiO
2, as the catalyst resulted in a reaction rate of only 29.6 µmol/g/h, substantiating that H
2 was indeed generated through the piezoelectric effect within the g-C
3N
4 nanosheets. The sonication of pure water without any catalyst revealed a minimal H
2 production rate of 13.7 µmol/g/h, effectively dismissing the likelihood of water splitting through sonocatalysis—a chemical reaction propelled by ultrasonic waves [
37].
The durability of the Au
2/CN sample was evaluated over five testing cycles, showcased in
Figure 4b. A significant reduction in H
2 production was observed during the second testing cycle, after which, the rate of production stabilized (notably, the fourth cycle exhibited a somewhat reduced production rate, which is attributed to the displacement of the reactor from the central position of the sonication bath). Recent studies have indicated that the sonication process can lead to the exfoliation of g-C
3N
4, which in turn may result in a diminished piezoelectric response [
14]. This phenomenon could account for the observed decrease in H
2 evolution during repeated testing. The XRD analysis in
Figure 4c revealed a notable decrease in the intensity of the g-C
3N
4 peak at 27.8° (indicating a decrease in the interlayer stacking of conjugated aromatic systems within the g-C
3N
4 framework) after the cyclability test, whereas the peak intensity corresponding to Au remained largely unchanged. Furthermore, the TEM image in
Figure 4d corroborates the maintained dimensional consistency of the Au nanoparticles and reveals a diminished thickness in the g-C
3N
4 sheets (compared to
Figure 2c).
The subsequent experiments were conducted to elucidate the contribution of metal co-catalysts to the H
2 evolution process. Initially, a volcano-shaped trend in activity was noted with ascending Au concentrations, peaking at 2 wt.%. While Au nanoparticles functioned as co-catalysts in the evolution of H
2, a superabundance of Au deposited on the g-C
3N
4 could potentially interfere with the effective capture of mechanical energy. Moving forward, comparisons were made between different metals (2 wt.%), revealing an activity sequence as follows: Au > Ag ≈ Pt ≈ Pd > Ru. Ideally, the inherent H
2 evolution activities of these metal nanoparticles should adhere to the order Pt ≈ Pd > Ru > Au > Ag, based on their respective affinities for H* adsorption [
38]. To comprehend the significant difference in the observed trend, we performed a TEM analysis on Ag
2/CN, Pt
2/CN, Pd
2/CN, and Ru
2/CN. As shown in
Figure S1, these four samples exhibited considerable variance in the size of the metal co-catalysts and their dispersion on g-C
3N
4. For Ag
2/CN, scarcely any metal nanoparticles were visible in the TEM mode, indicating that Ag was atomically dispersed on the g-C
3N
4. The Pt, Pd, and Ru co-catalysts were broadly dispersed on the g-C
3N
4, with the average size being 1.0 nm, 3.8 nm, and 7.7 nm, respectively. A minor aggregation of nanoparticles was noted in Pd
2/CN. Although a concrete conclusion could not been reached yet, the tests suggested that the actual catalytic performance may be substantially affected by other factors such as particle size [
39], geometric configuration [
40], and the chemical state [
41] of the metal components. Our recent investigations also revealed that Au nanoparticles anchored onto g-C
3N
4 exhibited a larger size and a more pronounced metallic character when compared to Pt nanoparticles synthesized using the identical photo-deposition method, and these Au nanoparticles showcased superior performance in the photocatalytic H
2 evolution during the process of glucose reforming [
27].
The impact of the solution’s pH and glucose concentration on H
2 production was also examined. As illustrated in
Figure 5c, the apex of H
2 evolution occurred under neutral pH conditions, with a gradual decrease in reaction rate upon lowering the pH. The prevailing theory suggests that at a pH value below the isoelectric point (IEP) of g-C
3N
4, which is approximately 5 [
42], the g-C
3N
4 assumes a positive charge, thereby diminishing its interaction with protons (H
+). It is particularly noteworthy that H
2 production was significantly hindered in alkaline solutions (pH = 9–11), contrary to the observations for photocatalysis, where elevated pH values have been reported to improve the H
2 evolution by promoting the generation of hydroxyl radicals (OH
− + h
+ → ·OH) [
27]. It was proposed that the introduction of NaOH might enhance the solution’s viscosity, thereby dampening the vibrational intensity. Concerning the concentration of glucose, within the range of 0.1 to 1 g per 20 mL, there was no significant impact on the rate of H
2 production. However, elevating the glucose concentration to above 5 g per 20 mL resulted in a substantial enhancement of the reaction’s activity.
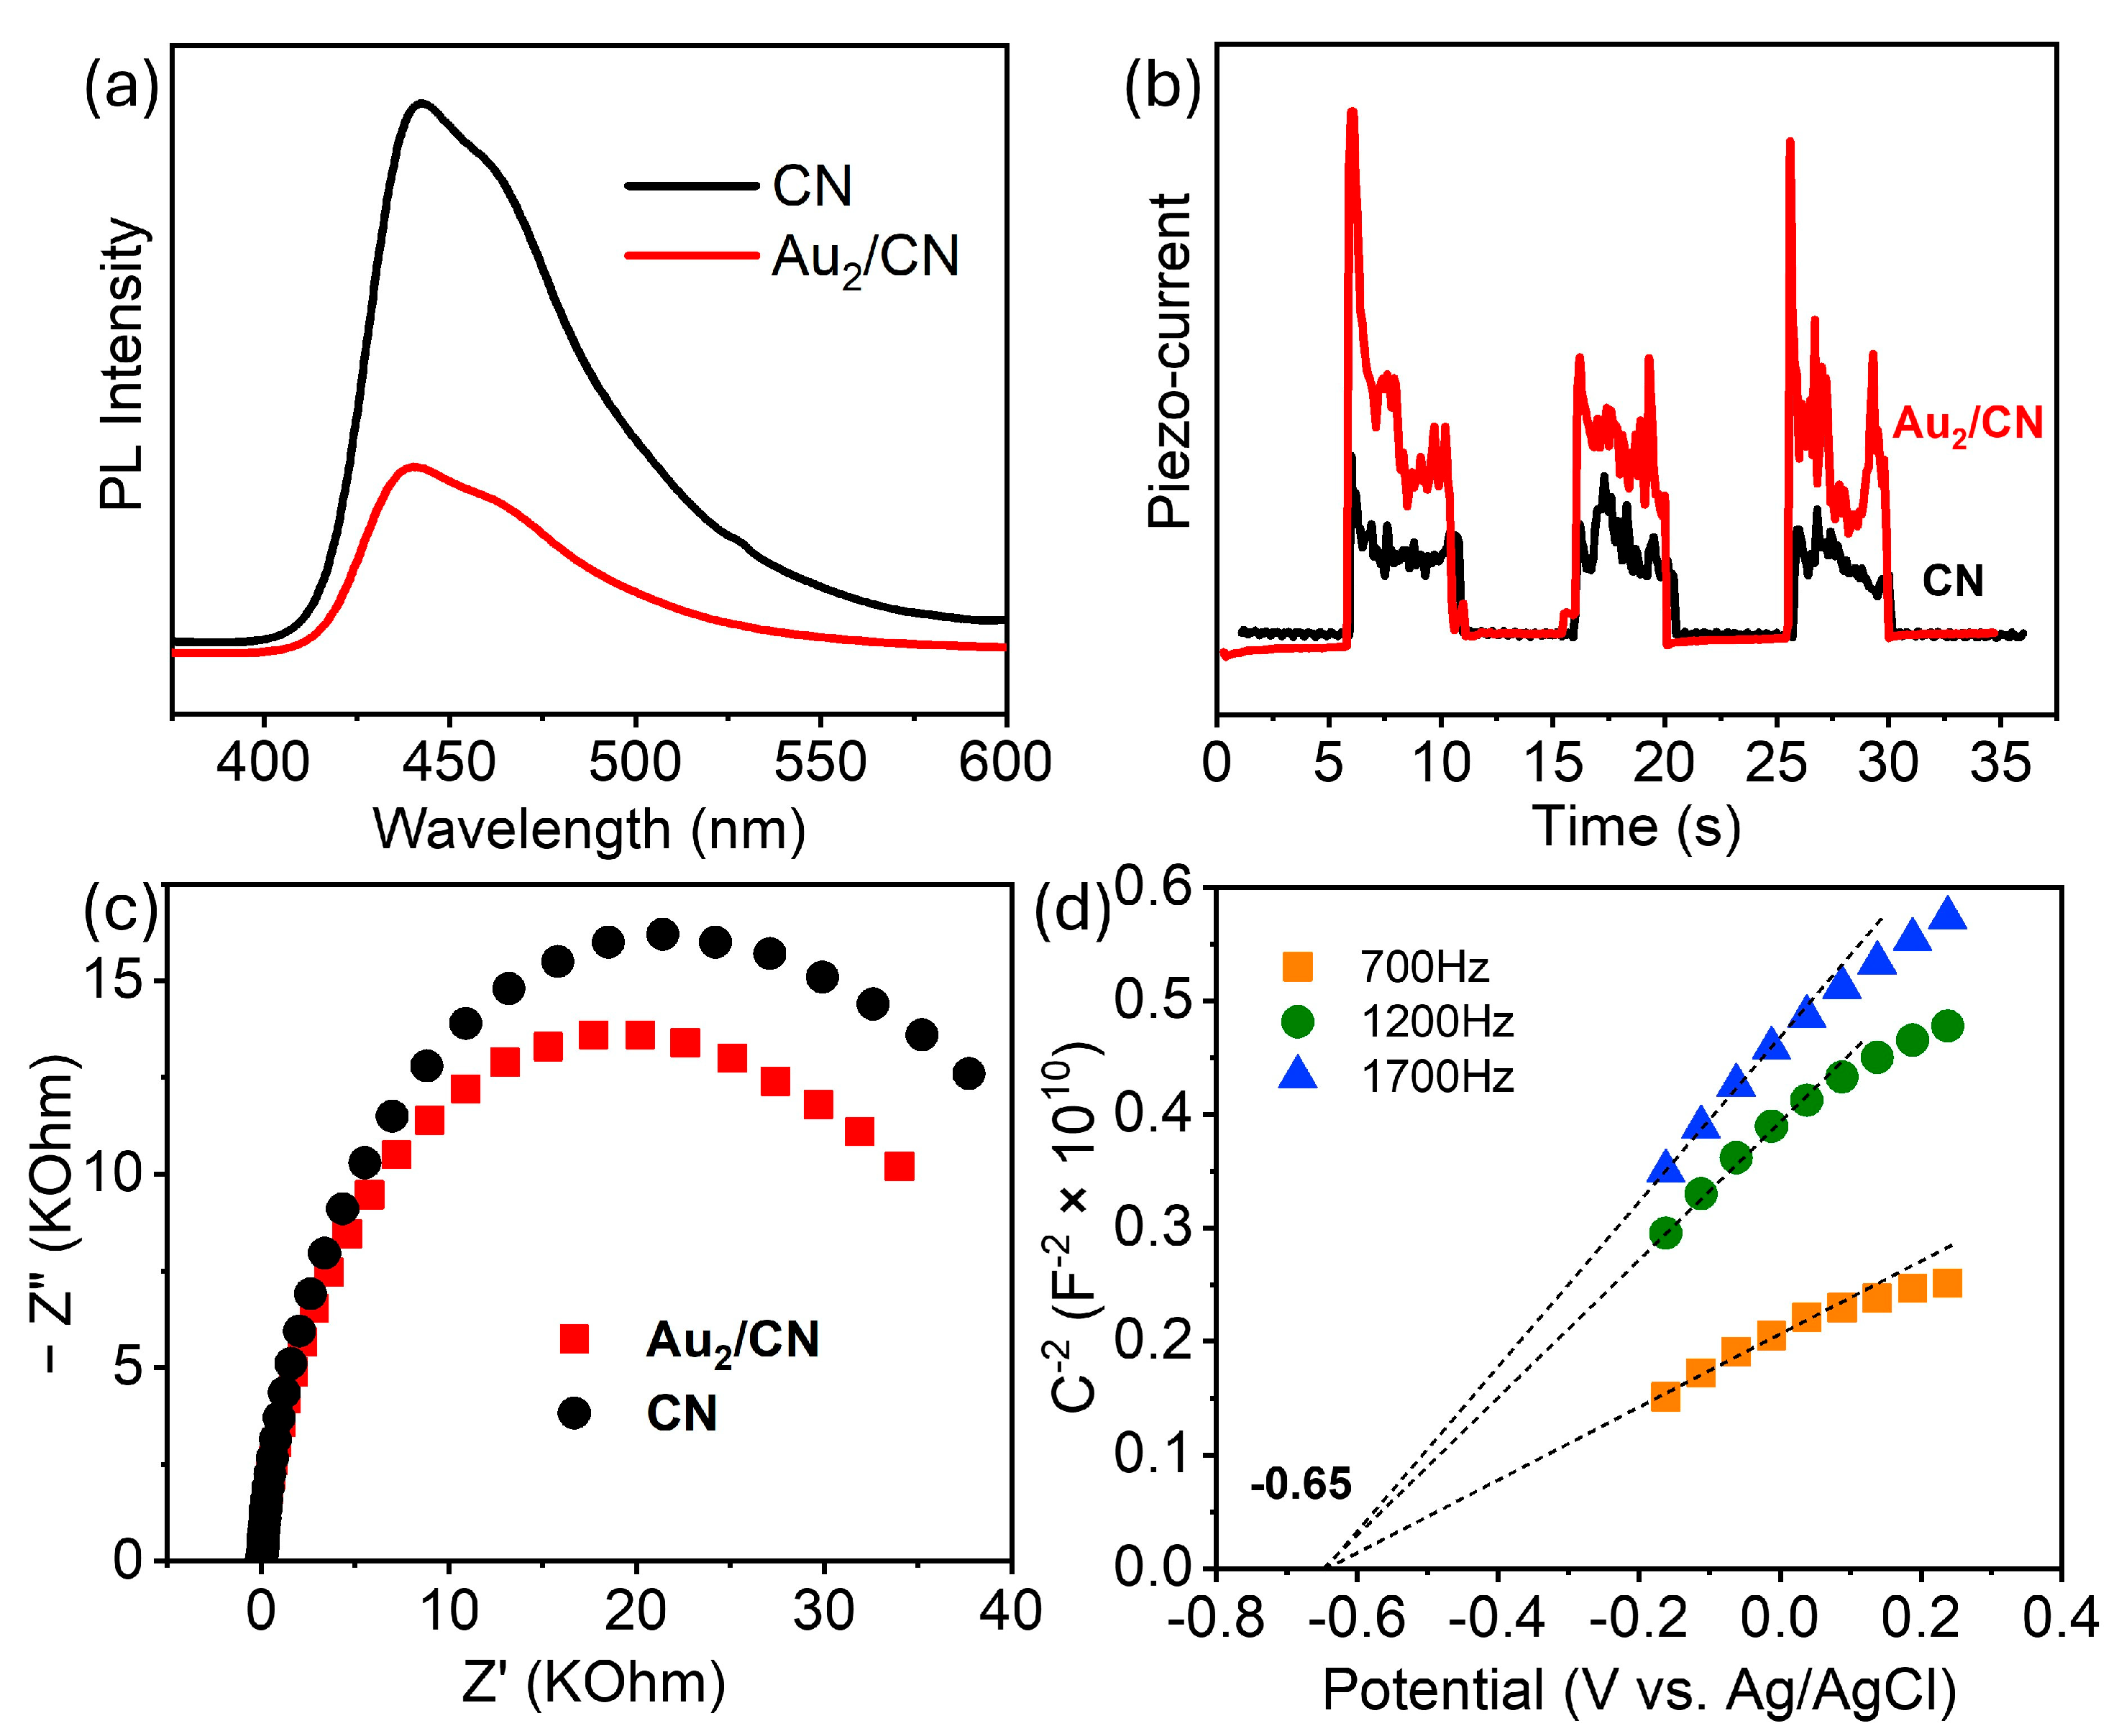
To elucidate the superior activity of Au
2/CN in comparison to its pristine counterpart (CN), the charge separation efficiency of both samples was scrutinized through photoluminescence (PL) spectroscopy and electrochemical analyses. Upon subjecting the samples to 345 nm laser irradiation, PL emission peaks were detected at ~440 nm, as depicted in
Figure 6a, which aligns with their adsorption edges shown in
Figure 2b. Notably, the more catalytically active Au
2/CN demonstrated a diminished PL intensity, indicative of a reduction in positive–negative charge recombination events. Furthermore, when examining the piezoelectric current responses under sonication, Au
2/CN manifested a piezo-current approximately twice that of CN, as evidenced in
Figure 6b. The EIS spectra in
Figure 6c demonstrated a smaller radius of Au
2/CN compared to CN, indicating a lower charge-transfer resistance. Collectively, these experiments substantiate the premise that the architectural configuration of Au
2/CN is conducive to the enhanced generation and separation of piezoelectrically induced charge carriers. Furthermore, to gain insight into its band edge position, Mott–Schottky analyses of CN were performed. As depicted in
Figure 6d, CN demonstrated a flat band potential of −0.65 V versus Ag/AgCl, which corresponds to −0.45 V versus the Normal Hydrogen Electrode (NHE). Taking into account that the conduction band of g-C
3N
4, being an n-type semiconductor, is typically situated approximately 0.3 V more negative relative to the flat band potential [
43], it can be inferred that the conduction band edge of g-C
3N
4 should lie near −0.75 V versus the NHE. Combined with the 2.90 eV bandgap obtained from the Tauc plot (
Figure S2a), the valence band edge was calculated to be 2.15 V versus the NHE, as depicted in the band structure diagram (
Figure S2b). This estimation aligns with the values reported in the literature [
28] and affirms the capability of CN to facilitate proton reduction to H
2 (i.e., more negative than the reduction potential of H
2/H
+).
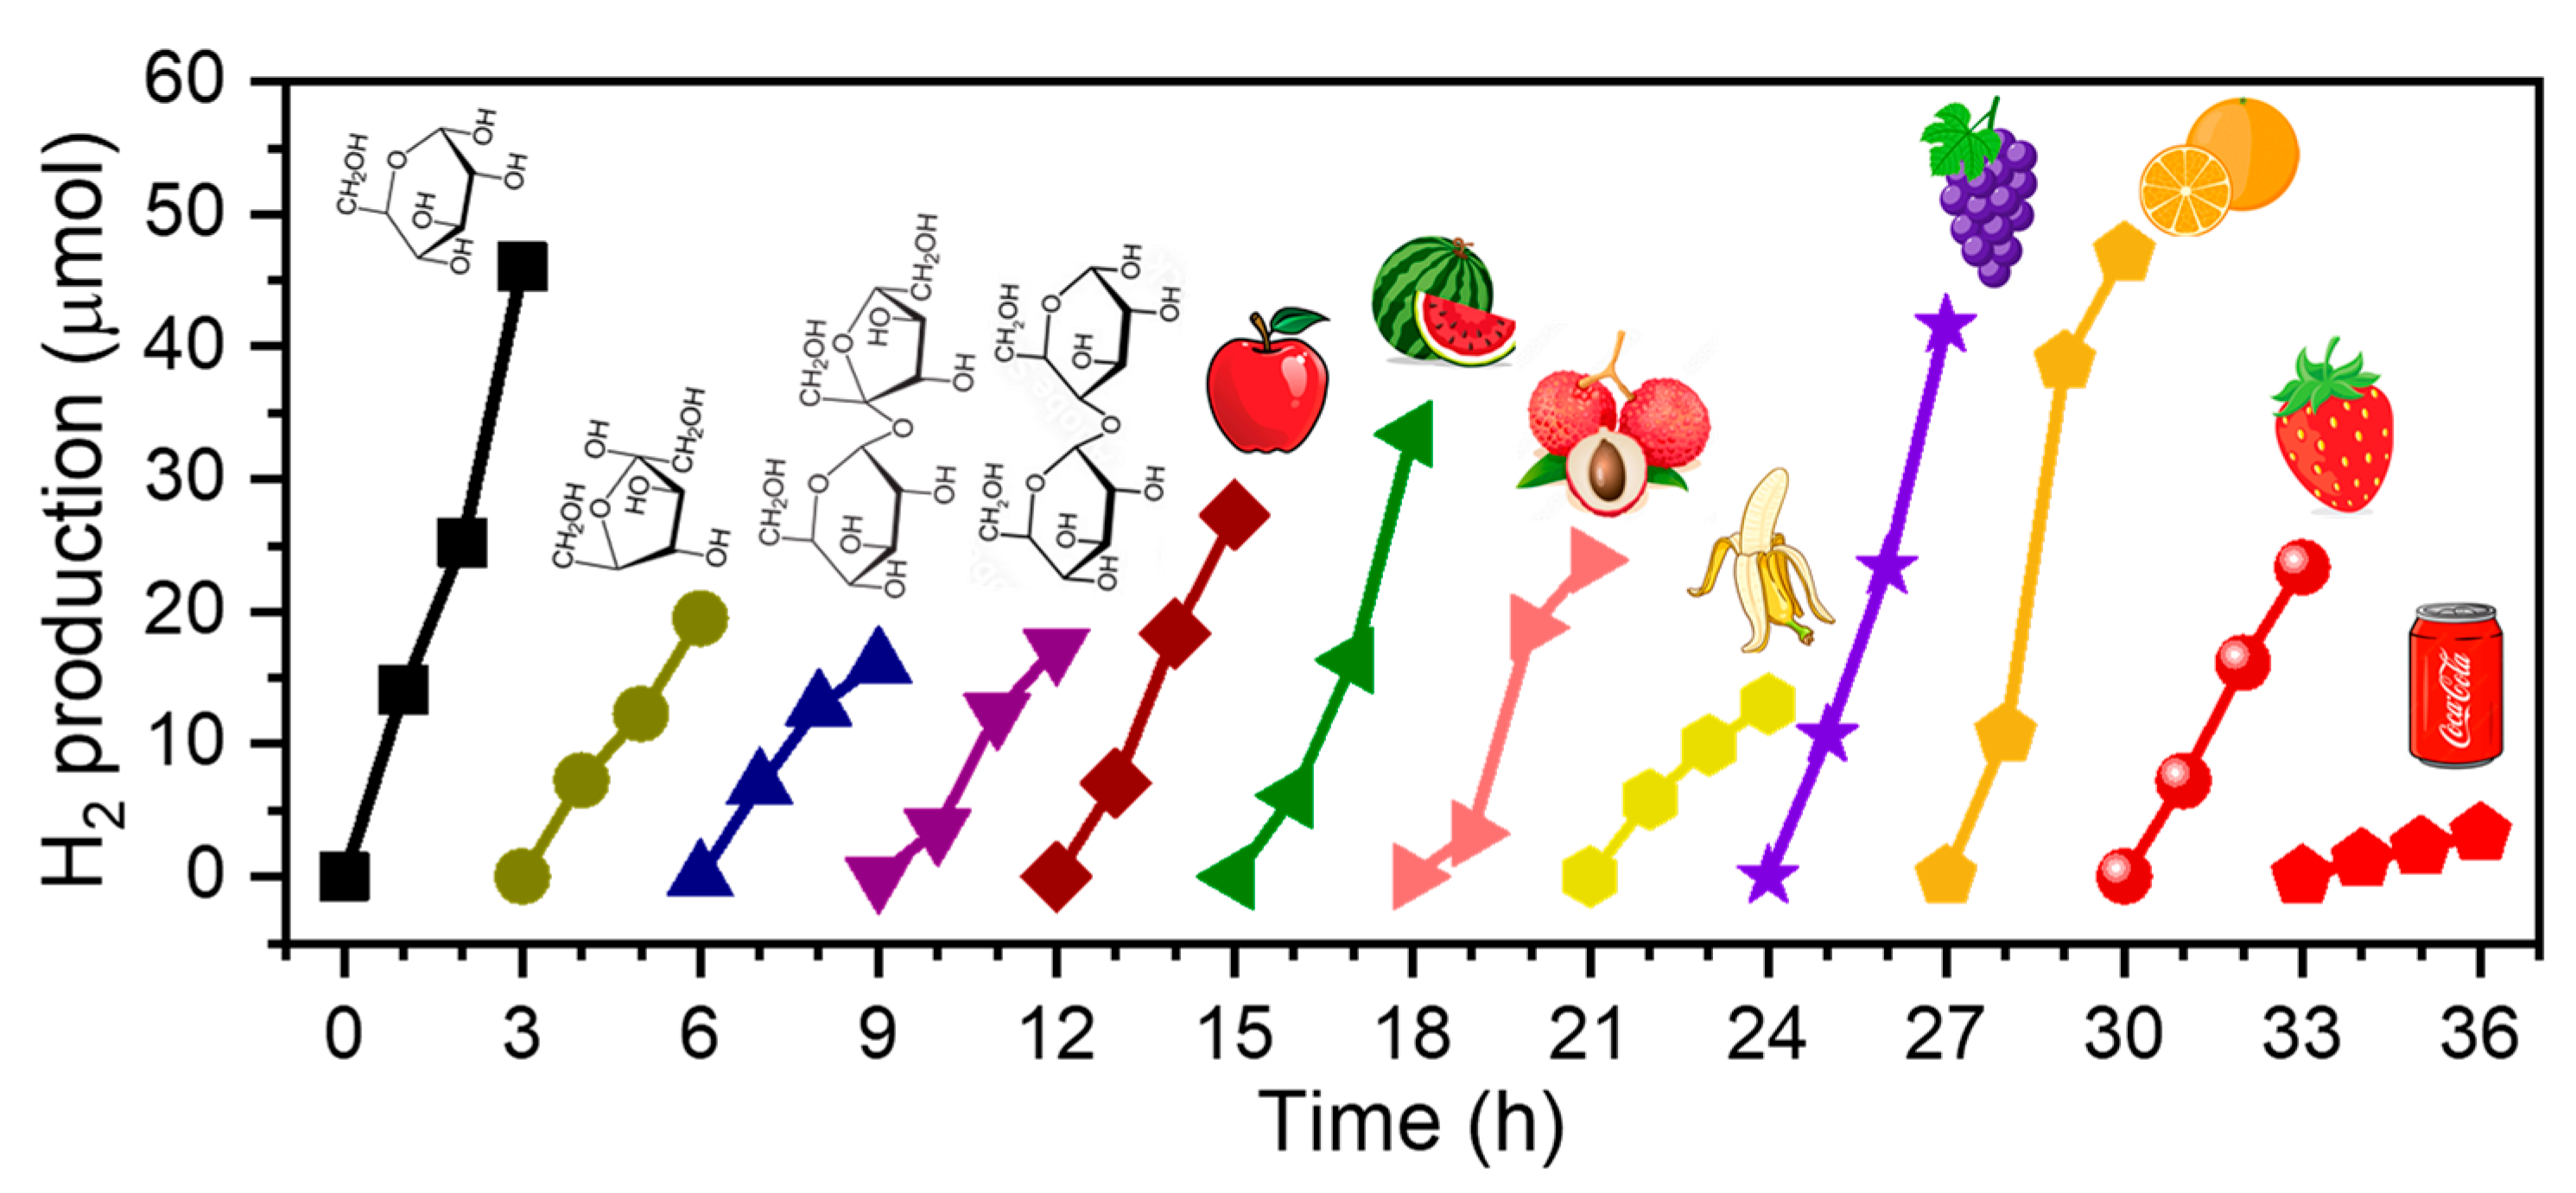
The top-performing catalyst, Au
2/CN, was put to the test with an assortment of sacrificial reagents, including a range of sugars, fruits, and a beverage (Coca-Cola). The findings, delineated in
Figure 7, revealed that out of the four sugars analyzed (namely, glucose, fructose, sucrose, and maltose), glucose demonstrated superior efficacy. This can be attributed to the more hydrolytically amenable structure of glucose’s six-membered pyranose ring, as opposed to the five-membered furanose ring of fructose. Additionally, glucose outstripped the reactivity of disaccharides such as sucrose, which consists of glucose and fructose bound by a glycosidic linkage, and maltose, comprising two glucose units similarly linked. In our assay of various fruits, including apple, watermelon, litchi, banana, grape, orange, and strawberry, we processed 5 g of fruit pulp blended with 20 mL of water in a crusher for one minute to disrupt the solid matter. Subsequently, Au
2/CN was introduced directly to the fruit mixture for experimentation. The data depicted in
Figure 7 indicate that H
2 generation occurred incrementally over time across all fruit samples. Notably, oranges (1568.0 µmol/g/h) and grapes (1385.8 µmol/g/h) exhibited a remarkable H
2 production efficiency, which could be ascribed to their higher sugar content, higher glucose ratio, and/or the more fluid nature of their juices. Conversely, banana, in spite of its significant sugar content, resulted in a lower yield of H
2 (i.e., 434.7 µmol/g/h). This can be attributed to the dense, viscous consistency of banana pulp, which hampers the seamless diffusion of reactants within the mixture and consequently decelerates the pace of the catalytic H
2 production. Furthermore, Coca-Cola, a beverage distinguished by its significant sugar concentration (approximately 2.1 g per 20 mL), underwent evaluation after the elimination of dissolved CO
2 via sonication. This led to a somewhat moderate yield of H
2, quantified at 107.4 µmol/g/h. This outcome is likely attributed to the predominant use of disaccharides (such as cane sugar) as sweeteners in the Chinese formulation of the drink, and the presence of other additives (e.g., carbonate, caramel color, phosphoric acid, natural flavors, caffeine, etc.) that could potentially inhibit the H
2 evolution reaction.
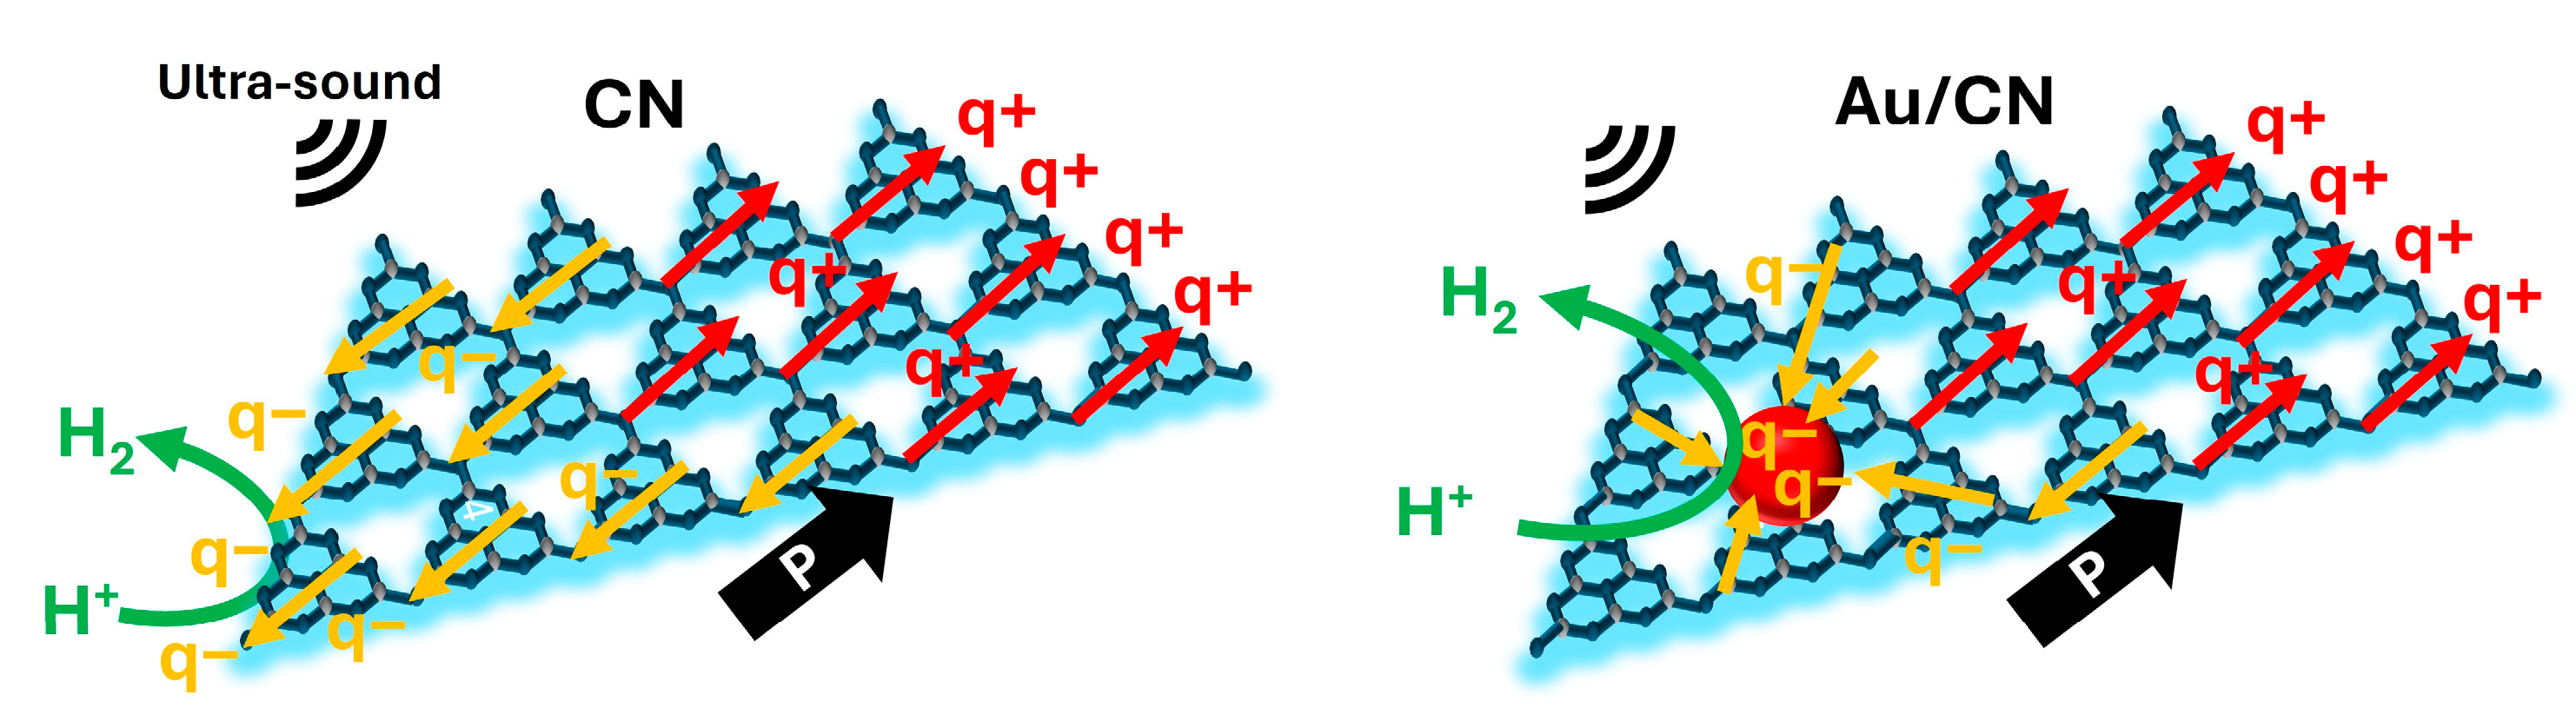
The proposed reaction mechanism is illustrated in
Scheme 1. During ultrasound sonication, cavitation bubbles form and crash in the water, exerting transient stress on the CN nanosheets [
37]. This stress leads to deformation and lateral stretching of the tri-s-triazine layers, which contain triangular nanopores and subsequently results in in-plane polarization [
29]. This polarization induces a charge separation, causing positive and negative charges to migrate towards the peripheries of the CN sheets. In the presence of Au nanoparticles, these charges tend to accumulate on the nanoparticles, which not only promotes a high charge separation efficiency as indicated in reference, but also acts as a co-catalyst for the H
2 evolution process [
27]. Moreover, given the even distribution of Au nanoparticles across the nanosheets, the charges can be transferred directly to the nanoparticles rather than traveling to the edges of the CN, thereby significantly reducing the charge transfer distance [
30]. This shortened path, in conjunction with the catalytic effect of the Au nanoparticles, can markedly amplify the piezoelectric H
2 evolution activity. The waste sugars and fruits also served a crucial function within the overall reaction. They acted as scavengers for positive charges to inhibit their recombination with negative charges [
5]. Such a role is pivotal in prolonging the lifetime of negative charges, facilitating a more sustained H
2 evolution reaction.


