Article

Adaptive Grazing of Native Grasslands Provides Ecosystem Services and Reduces Economic Instability for Livestock Systems in the Flooding Pampa, Argentina

by
Elizabeth J. Jacobo
1,*,
Ulises J. Martínez Ortiz
2,
Santiago M. Cotroneo
1 and
Adriana M. Rodríguez
3
1
Área de Agroecología, Facultad de Agronomía, Universidad de Buenos Aires, Av. San Martín 4453, Buenos Aires C1417DSE, Argentina
2
Departamento de Economía, Desarrollo y Planeamiento Agrícola, Facultad de Agronomía, Universidad de Buenos Aires, Av. San Martín 4453, Buenos Aires C1417DSE, Argentina
3
Departamento de Producción Animal, Facultad de Agronomía, Universidad de Buenos Aires, Av. San Martín 4453, Buenos Aires C1417DSE, Argentina
*
Author to whom correspondence should be addressed.
Sustainability 2024, 16(10), 4229; https://doi.org/10.3390/su16104229
Submission received: 26 February 2024 / Revised: 1 May 2024 / Accepted: 6 May 2024 / Published: 17 May 2024
(This article belongs to the Special Issue Plants, Biodiversity and Sustainable Ecosystem)

Abstract

:
There is a widespread concern about the negative impact of intensive livestock farming on climate change and biodiversity loss. We analyzed the trade-off between meat production and environmental variables related to global warming—energy consumption, use efficiency of energy, greenhouse gas (GHG) emissions, carbon footprint, and GHG balance—of two alternative intensification strategies of livestock farming in the Flooding Pampa: conventional intensification (CI) based on external inputs, and ecological intensification (EI) based on maintaining native grassland in good condition through adaptive multi-paddock grazing (AMPG). We also explored the relationship between meat production and the economic variables gross margin and its year-to-year variation. Energy consumption was positively correlated with meat production (ρ = 0.95, p = 0.0117), and EI farms consumed less fuel energy and showed higher energy use efficiency than CI farms (294 ± 152 vs. 2740 ± 442 MJ ha−1 y−1, 38.4 ± 28.8 vs. 1.23 ± 0.13 MJ kg LW−1 y−1, p < 0.05, respectively). GHG emissions and carbon footprint did not show significant differences between EI and CI strategies. As soil carbon sequestration was significantly higher in EI farms than in CI farms (1676 ± 304 vs. −433 ± 343 kg CO2eq ha−1 y−1, p < 0.05), GHG balance resulted almost neutral and higher under the EI strategy (−693 ± 732 vs. −3520 ± 774 kg CO2eq ha−1 y−1, p < 0.05). CI strategy obtained higher meat production but a similar gross margin to the EI strategy and a more unstable economic return, as the coefficient of variation in the gross margin doubled that of the EI strategy (84 + 13.3 vs. 43 + 2.6, respectively, p < 0.05). Ecological intensification of cattle production in the Flooding Pampa demonstrates the potential for a positive relationship between individual cattle farmers’ profits and overall societal benefits, as reflected in improved environmental performance.

1. Introduction

Agricultural production over the last five decades has been based on a set of technologies that have significantly increased production but with severe environmental impacts [1]. Agricultural production is now considered to be a major driver of the Earth’s system exceeding planetary boundaries, such as land system change, biosphere integrity, biogeochemical cycles, and climate change [2]. In particular, there is widespread concern about the negative impacts of intensive livestock production on climate change and biodiversity loss [3,4,5]. In Argentina, the process of agricultural intensification over the last two decades has led to a drastic change in land use. In areas of extensive agricultural production, such as the Pampas region, where agriculture in the early 20th century was based on a rotation between annual crops and cultivated pastures for livestock feed, pastures, and other forage crops have been replaced by annual crops, mainly soybean [6]. This change in land use has drastically reduced the area devoted to livestock production in the country [7], which in turn has changed beef production systems. The most important change occurred in the final stage of cattle production, as the traditional pastoral fattening that characterized the Argentine beef system was gradually replaced by feedlot fattening. At the same time, this intensification process led to an increase in stocking rates in areas with edaphic constraints, where native grasslands were the dominant land cover and were replaced by annual forage crops or cultivated pastures [8].
The Pampas region is a grassland ecosystem that originally covered 40 million hectares in the central-eastern part of Argentina [9]. The replacement of grassland commenced in the late 19th century and has accelerated in the last 25 years, with a significant area of native grassland having been lost [6,10]. The Pampa region encompasses various subregions based on their biophysical characteristics. The process of grassland replacement is most prevalent in subregions with deep and fertile soils, such as the Rolling and Flat Inland subregions. These subregions have experienced a significant loss of natural grassland, with approximately 75% of the area replaced by annual crops [11]. In contrast, the Flooding Pampa subregion (9 million ha) is notable for its preservation of a significant area of natural or semi-natural vegetation (68%) [12] due to the limitations imposed by shallow soil depth, soil salinity, and frequent flooding on crop production. Consequently, extensive cattle grazing has constituted the principal economic activity in the region since the Iberian colonization until the present day.
Grassland ecosystems provide several goods and services to society [13], both directly through the provision of food and indirectly through supporting and regulating services [14]. Livestock farming often involves a trade-off between livestock production and regulating and cultural services [15]. This is especially true in systems dominated by natural grasslands because they have lower forage production compared to improved pastures [16,17]. However, the provision of ecosystem goods and services heavily depends on the state and condition of the grassland, which is influenced by human interventions [18]. Therefore, appropriate management practices can modify or avoid the trade-off between provision and supporting and regulating services [19]. Furthermore, the transformation of rangeland beef cattle production systems in response to the combined impact of climate and societal drivers could result in the emergence of different scenarios with varying relative weights of provisioning, regulating, and cultural services [20]. In the Flooding Pampa, the trade-offs and synergies between grazing livestock production and other ecosystem services have been poorly documented.
The Flooding Pampa grasslands are currently in a severely degraded state due to almost a century of continuous grazing [21] and over 20 years of glyphosate application [22]. The degradation processes have resulted in reduced stocking rates, secondary productivity, and economic profits [23]. The medium-scale traditional farmer currently achieves a low meat production of approximately 87.5 kg PV ha−1 year−1 [24]. To increase this low meat production, an intensification strategy that includes the replacement of native grasslands with pastures, an increase in the proportion of grains in cattle diets, and, thus, an increase in stocking rates is currently widespread. In addition, increasing stocking rates may exacerbate overgrazing of remnant native grasslands, with negative impacts on aboveground net primary production; plant, bird, and mammal species diversity; soil organic carbon; and erosion [12].
When deciding whether to maintain or replace natural grasslands, producers primarily consider provisioning over-regulating or supporting ecosystem services. This decision is influenced partly by profitability expectations between cattle grazing on natural grasslands or grassland replacement by cultivated forage and grain crops and partly by other economic parameters such as risk minimization and income continuity throughout the year [25]. Modeling to estimate the costs of different forage supplies in Flooding Pampa cattle farms concluded that livestock production systems require feeding regimes that diversify the forage base to improve carrying capacity while reducing dependence on external inputs and vulnerability to economic risks [26]. Ecological intensification is an alternative to improve farm production while reducing external inputs [27]. Ecological intensification of grazing livestock systems involves reducing the dependence on non-renewable resources by harnessing ecosystem services for support and regulation and implementing management practices to maintain or enhance natural capital and ecosystem services [28].
It is well recognized that grazing is the main tool for managing grassland when ranchers understand and apply management principles that support ecosystem health and resilience and the proper functioning of economic and social processes [29]. Controlling forage allowance is the main variable that can be adjusted in grazing management to improve productivity and profitability while preserving biodiversity and enhancing resilience [30]. Adaptive multi-paddock grazing (AMPG) is a grazing system that manages forage availability through high-intensity, short-term grazing and long periods of rest. Research in several regions, including North America [18,31,32,33], Australia [34], and the Flooding Pampas of Argentina [35,36], has shown that AMPG can maintain productivity while preserving and restoring native grasslands. In addition, AMPG was recently found to be positively associated with the physical well-being of Canadian ranchers [37]. Therefore, this strategy could be a crucial factor in the ecological intensification processes of livestock systems in the Flooding Pampa.
The aim of this paper is to analyze the trade-off between production output and environmental variables related to global warming of the two alternative intensification strategies of livestock farming in the Flooding Pampa: conventional intensification (CI) based on external inputs and ecological intensification (EI) based on maintaining native grassland in good condition through AMPG. To achieve this, we examined the relationship between meat production, a provision good/service, and variables related to global warming (as regulating services): energy consumption, the use efficiency of energy, greenhouse gas (GHG) emissions, the carbon footprint, and the GHG balance of livestock farms that have adopted CI or EI intensification strategy. We also studied the relationship between meat production and the economic variables gross margin and its year-to-year variation in livestock farms that have adopted CI or EI intensification strategy.

2. Materials and Methods
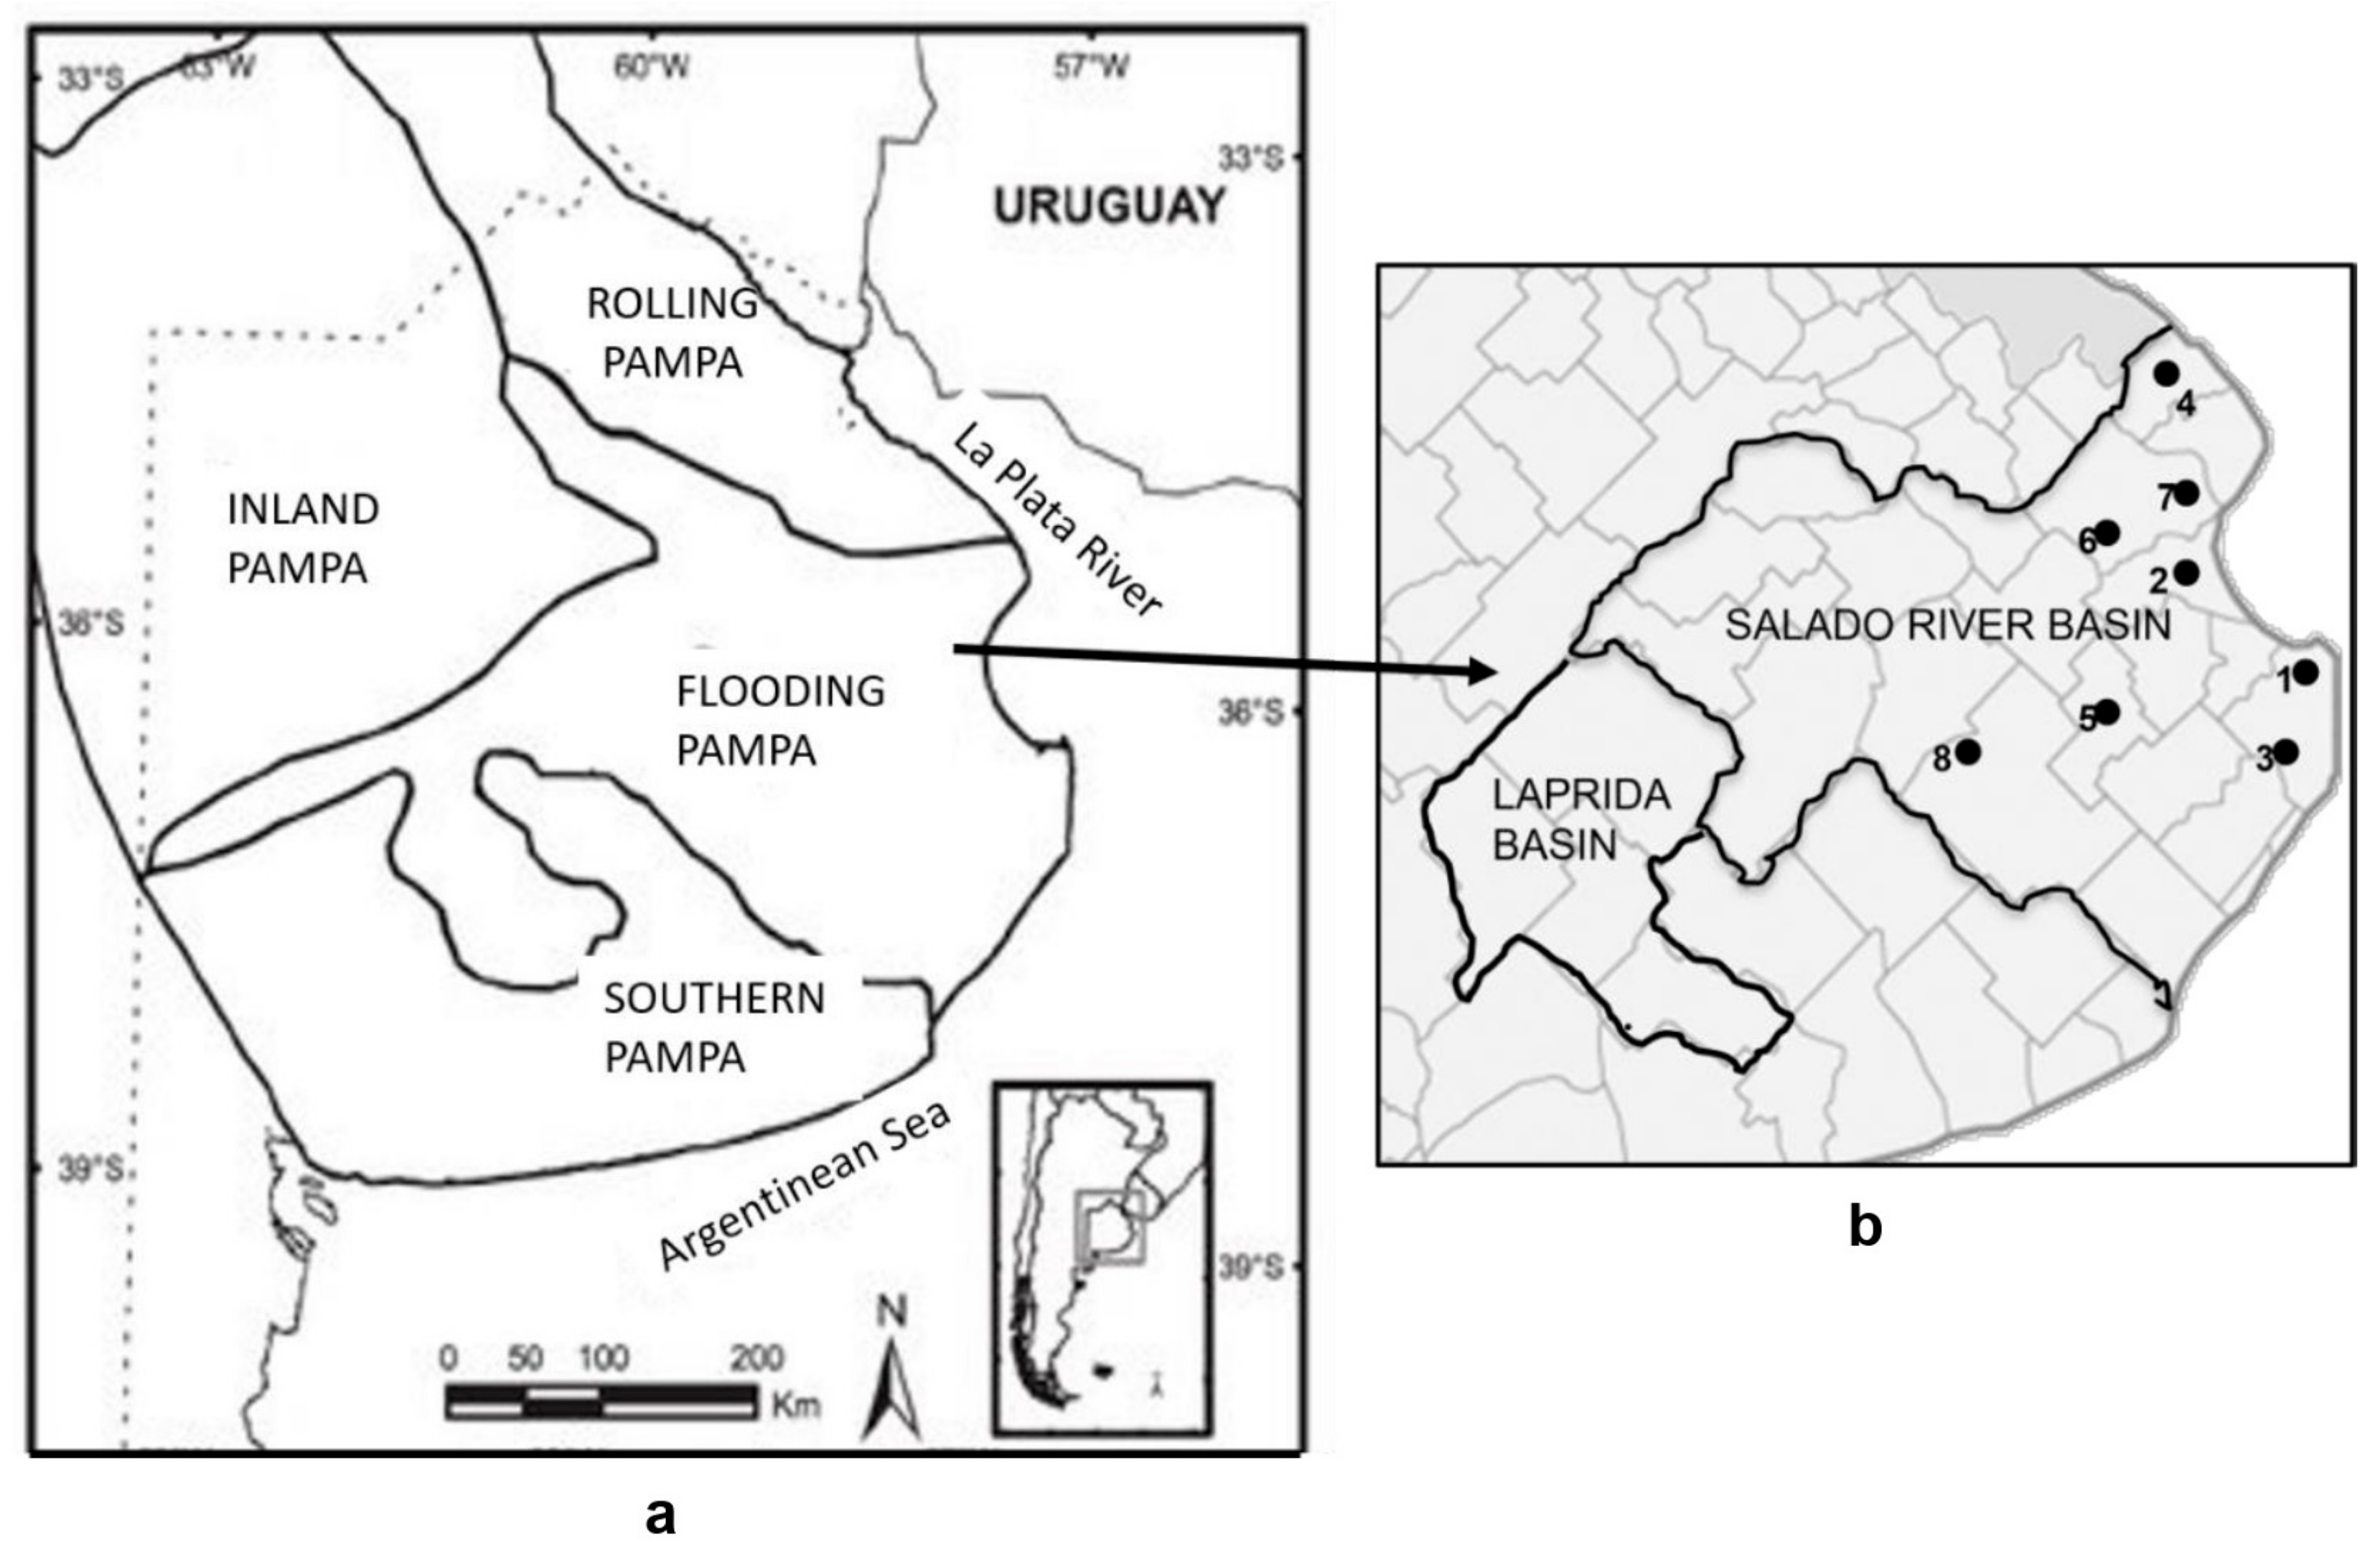
2.1. Study Site

The study was conducted in the Salado River basin, which covers the largest area (6 M ha) of the Flooding Pampa subregion (9 M ha) (Figure 1). The climate is temperate subhumid, with mean annual temperatures ranging from 15.9 °C in the north to 13.8 °C in the south. The average annual rainfall is about 900 mm, with no strong seasonal pattern. The relief is extremely flat, with relative elevation differences rarely exceeding 4 m. Most soils are saline and/or alkaline, with poor drainage, which determines the occurrence of frequent flooding [38].
Native grasslands remain productive throughout the year because they contain cool-season (C3) and warm-season (C4) grasses that peak in late winter and summer, respectively [39]. Although cultivated pastures produce more biomass than degraded native grasslands [12], the annual aboveground primary production of native grasslands in good condition is high, around 5300 kg DM ha−1 [40].
The Salado River basin is the main area for cow–calf operation in Argentina, supporting 13 percent of the national stock [7]. Livestock intensification has increased the stocking rate from 0.7 EV ha−1 in 2003 [41] to 1.54 EV ha−1 in 2007 [42]. Native grasslands are the main source of forage for cattle. However, the contribution of cultivated grassland, forage crops, and cereals has been increasing with the increase in stocking rate. The average farm size is 605 ha. Seventy percent of the area is owned by farmers, while the rest is owned by companies or rented [12]. The number of farms did not change between 1999 and 2019, even with an increase in the smallest ones [43], which shows a different process from the rest of the Pampa region, where the intensification process concentrated productive activity and reduced the number of small farms [44]. Therefore, a significant number of family producers remain in the lower basin of the Salado River.

2.2. Experimental Layout and Data Collection

We selected eight cattle farms to represent two intensification strategies: CI and EI. The farms were selected from the cases studied by Jacobo et al. [45]. We chose those farms where the area of natural grassland, cultivated pastures, and fodder crops remained stable for several years, indicating a stabilized production system. We collected data from 2013 to 2018 through semi-structured interviews with farm owners and managers. We considered a stabilized production system when the variation among variables between years did not exceed 10%. CI is a high input strategy including the replacement of native grassland by pastures or forage crops and increased contribution of grains in the cattle diet (four cases), and EI is a low input strategy based on maintaining native grassland in good condition through “controlled grazing” and low use of external inputs (four cases). Controlled grazing was developed by Deregibus et al. [21] and considered AMPG by Mann and Sherren [46]. Therefore, we refer to it as AMPG from here on. Within each different intensification strategy, the selected farms included different farm areas, proportion of not-flooded soils, producer typologies, and types of beef production systems (Table 1). The farm owners or managers voluntarily participated in the study due to the complexity and comprehensiveness of the data collection.
The semi-structured interviews with farm owners or managers were performed using questionnaires [47]. The questionnaires gathered information related to land use (area and type of native grassland, cultivated pastures, and annual forage crops); agricultural practices (tillage, fertilization, sowing of pastures and crops, agrochemical use); type of beef production system (cow–calf operations, backgrounding, and full cycle); livestock breed (Angus in all cases); livestock management (breeding, stocking rate, grazing methodology and practices, feed supplements, and meat production); and the use of machinery and inputs, including fertilizers, seeds, pesticides, and herbicides. These data allowed for the calculation of the variables: consumption of fossil energy, energy use efficiency, emission of GHGs, balance of GHG, carbon footprint, average gross margin, and the coefficient of variation in the gross margin.
Table 1. Main characteristics of the selected farms.
CaseType of
Producer
Farm Area (ha)Native
Grasslands Area (ha)
Not-Flooded Soils (%)Type of Beef
Production System
Grazing
Methodology of Native Grasslands
Feeding
Supplements
FinishingMeat
Production
(kg LW ha−1 year−1)
1Enterprise *200420040Cow–calfAMPG ***- 99
2Familiar **2802607Full cycleAMPG-Native grassland137
3Familiar2502107Cow–calfAMPG- 146
4Familiar15611513Cow–calf and backgroundingAMPG- 196
5Enterprise251410818Full cycleContinuous448 kg ha−1 corn grain
60 kg ha−1 soybean expeller
8.8 kg ha−1 urea
870 g ha−1 mineral mix
Feedlot316
6Familiar2506060Full cycleContinuous1280 kg ha−1 corn grain
80 kg ha−1 sunflower expeller
48 kg ha−1 urea
400 g ha−1 mineral mix
Feedlot389
7Familiar1982221Full cycleContinuous240 kg ha−1 corn grain
97 kg ha−1 barley grain
600 g ha−1 mineral mix
Feedlot251
8Familiar121028Full cycle -Cultivated pastures246
* Enterprise: The objective of the productive unit is to maximize profits and utilize salaried labor [48]. ** Familiar: The objective of the productive unit is to satisfy the needs of the family and utilize predominantly family labor [48]. *** AMPG: adaptive multi-paddock grazing.

2.3. Variables Calculation

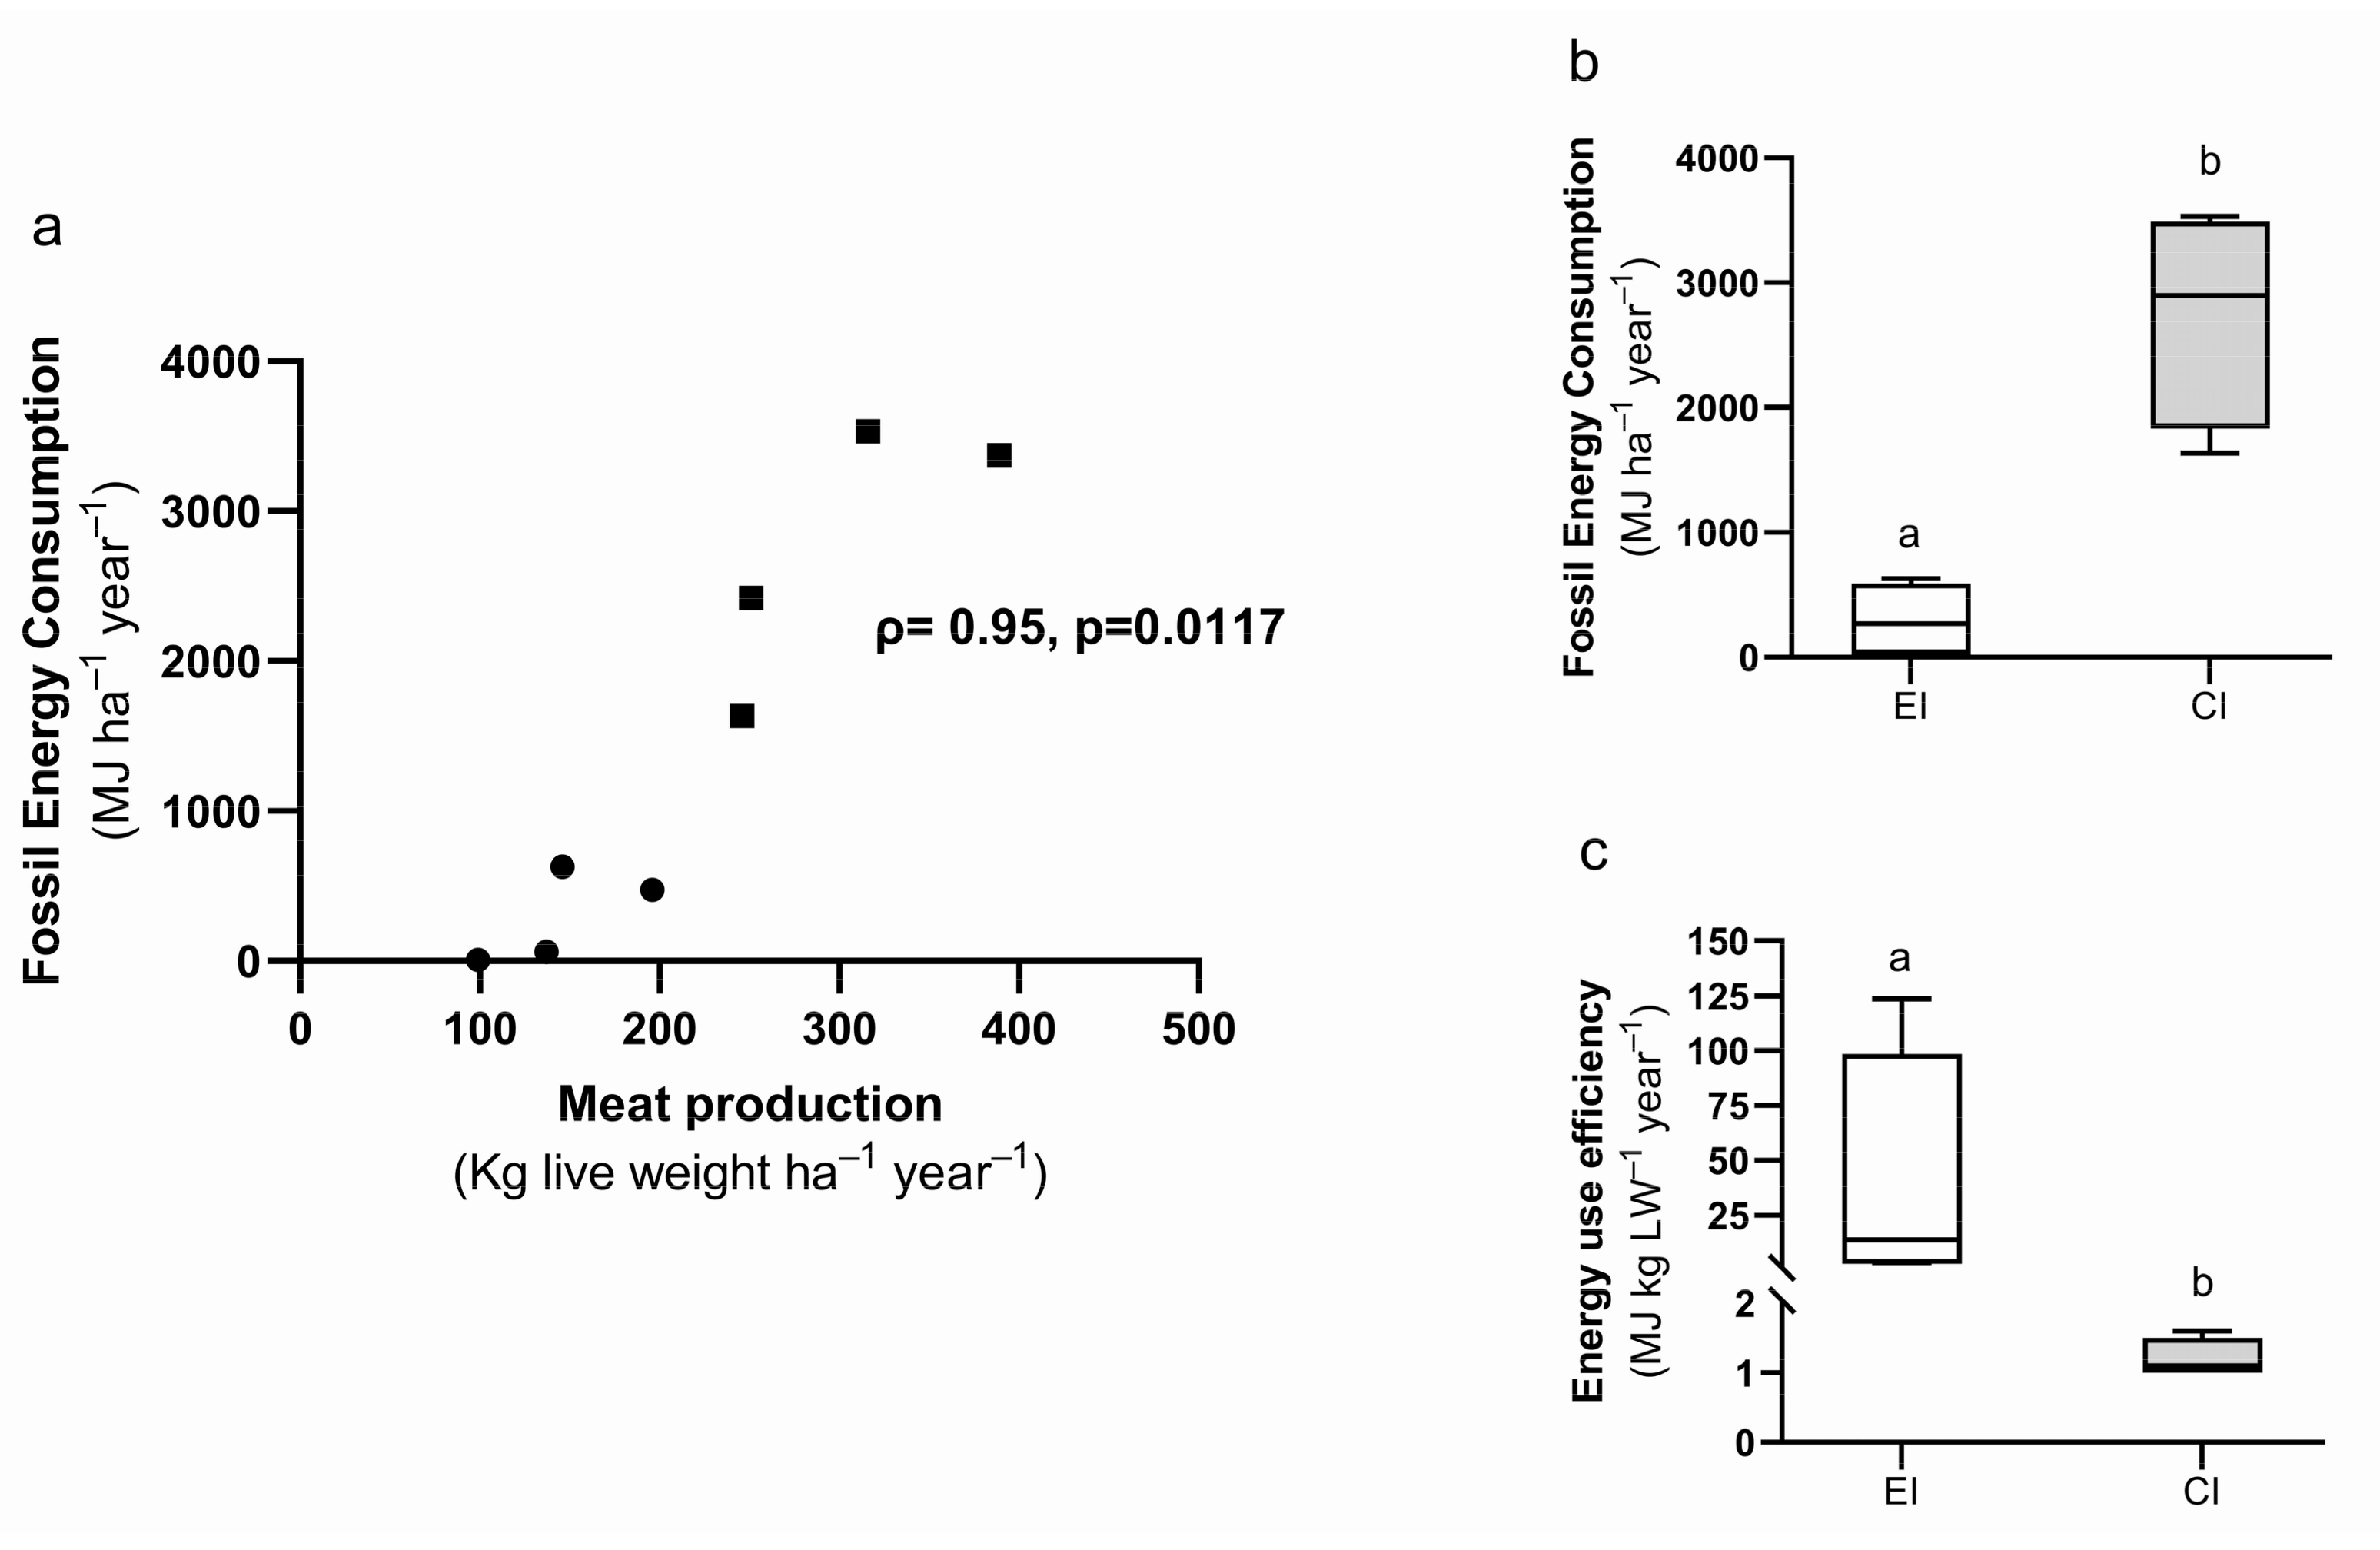
2.3.1. Consumption and Use Efficiency of Fossil Energy

The calculation of fossil energy consumption of each farm included the direct use of fossil energy (diesel fuel), the fossil energy used to produce the inputs (seed, diesel fuel, fertilizer, and agrochemicals), and the farm machinery. We did not consider the fossil energy used for the following: (i) storage and transportation of inputs and products; (ii) human labor, because in extensive systems, it represents less than 0.2% of the total energy input [49]; (iii) veterinary products, because their energy coefficient was not available; (iv) fossil energy used related to the farm structure (heat and electricity for the house and diesel fuel for personal transportation). We applied the energy coefficients provided by Iermanó [50]. The consumption of fossil energy of each farm was expressed in megajoules per hectare per year (MJ ha−1 year−1), and the fossil energy use efficiency was calculated as the fossil energy input used to produce one kilogram of meat (MJ kg−1 live weight).

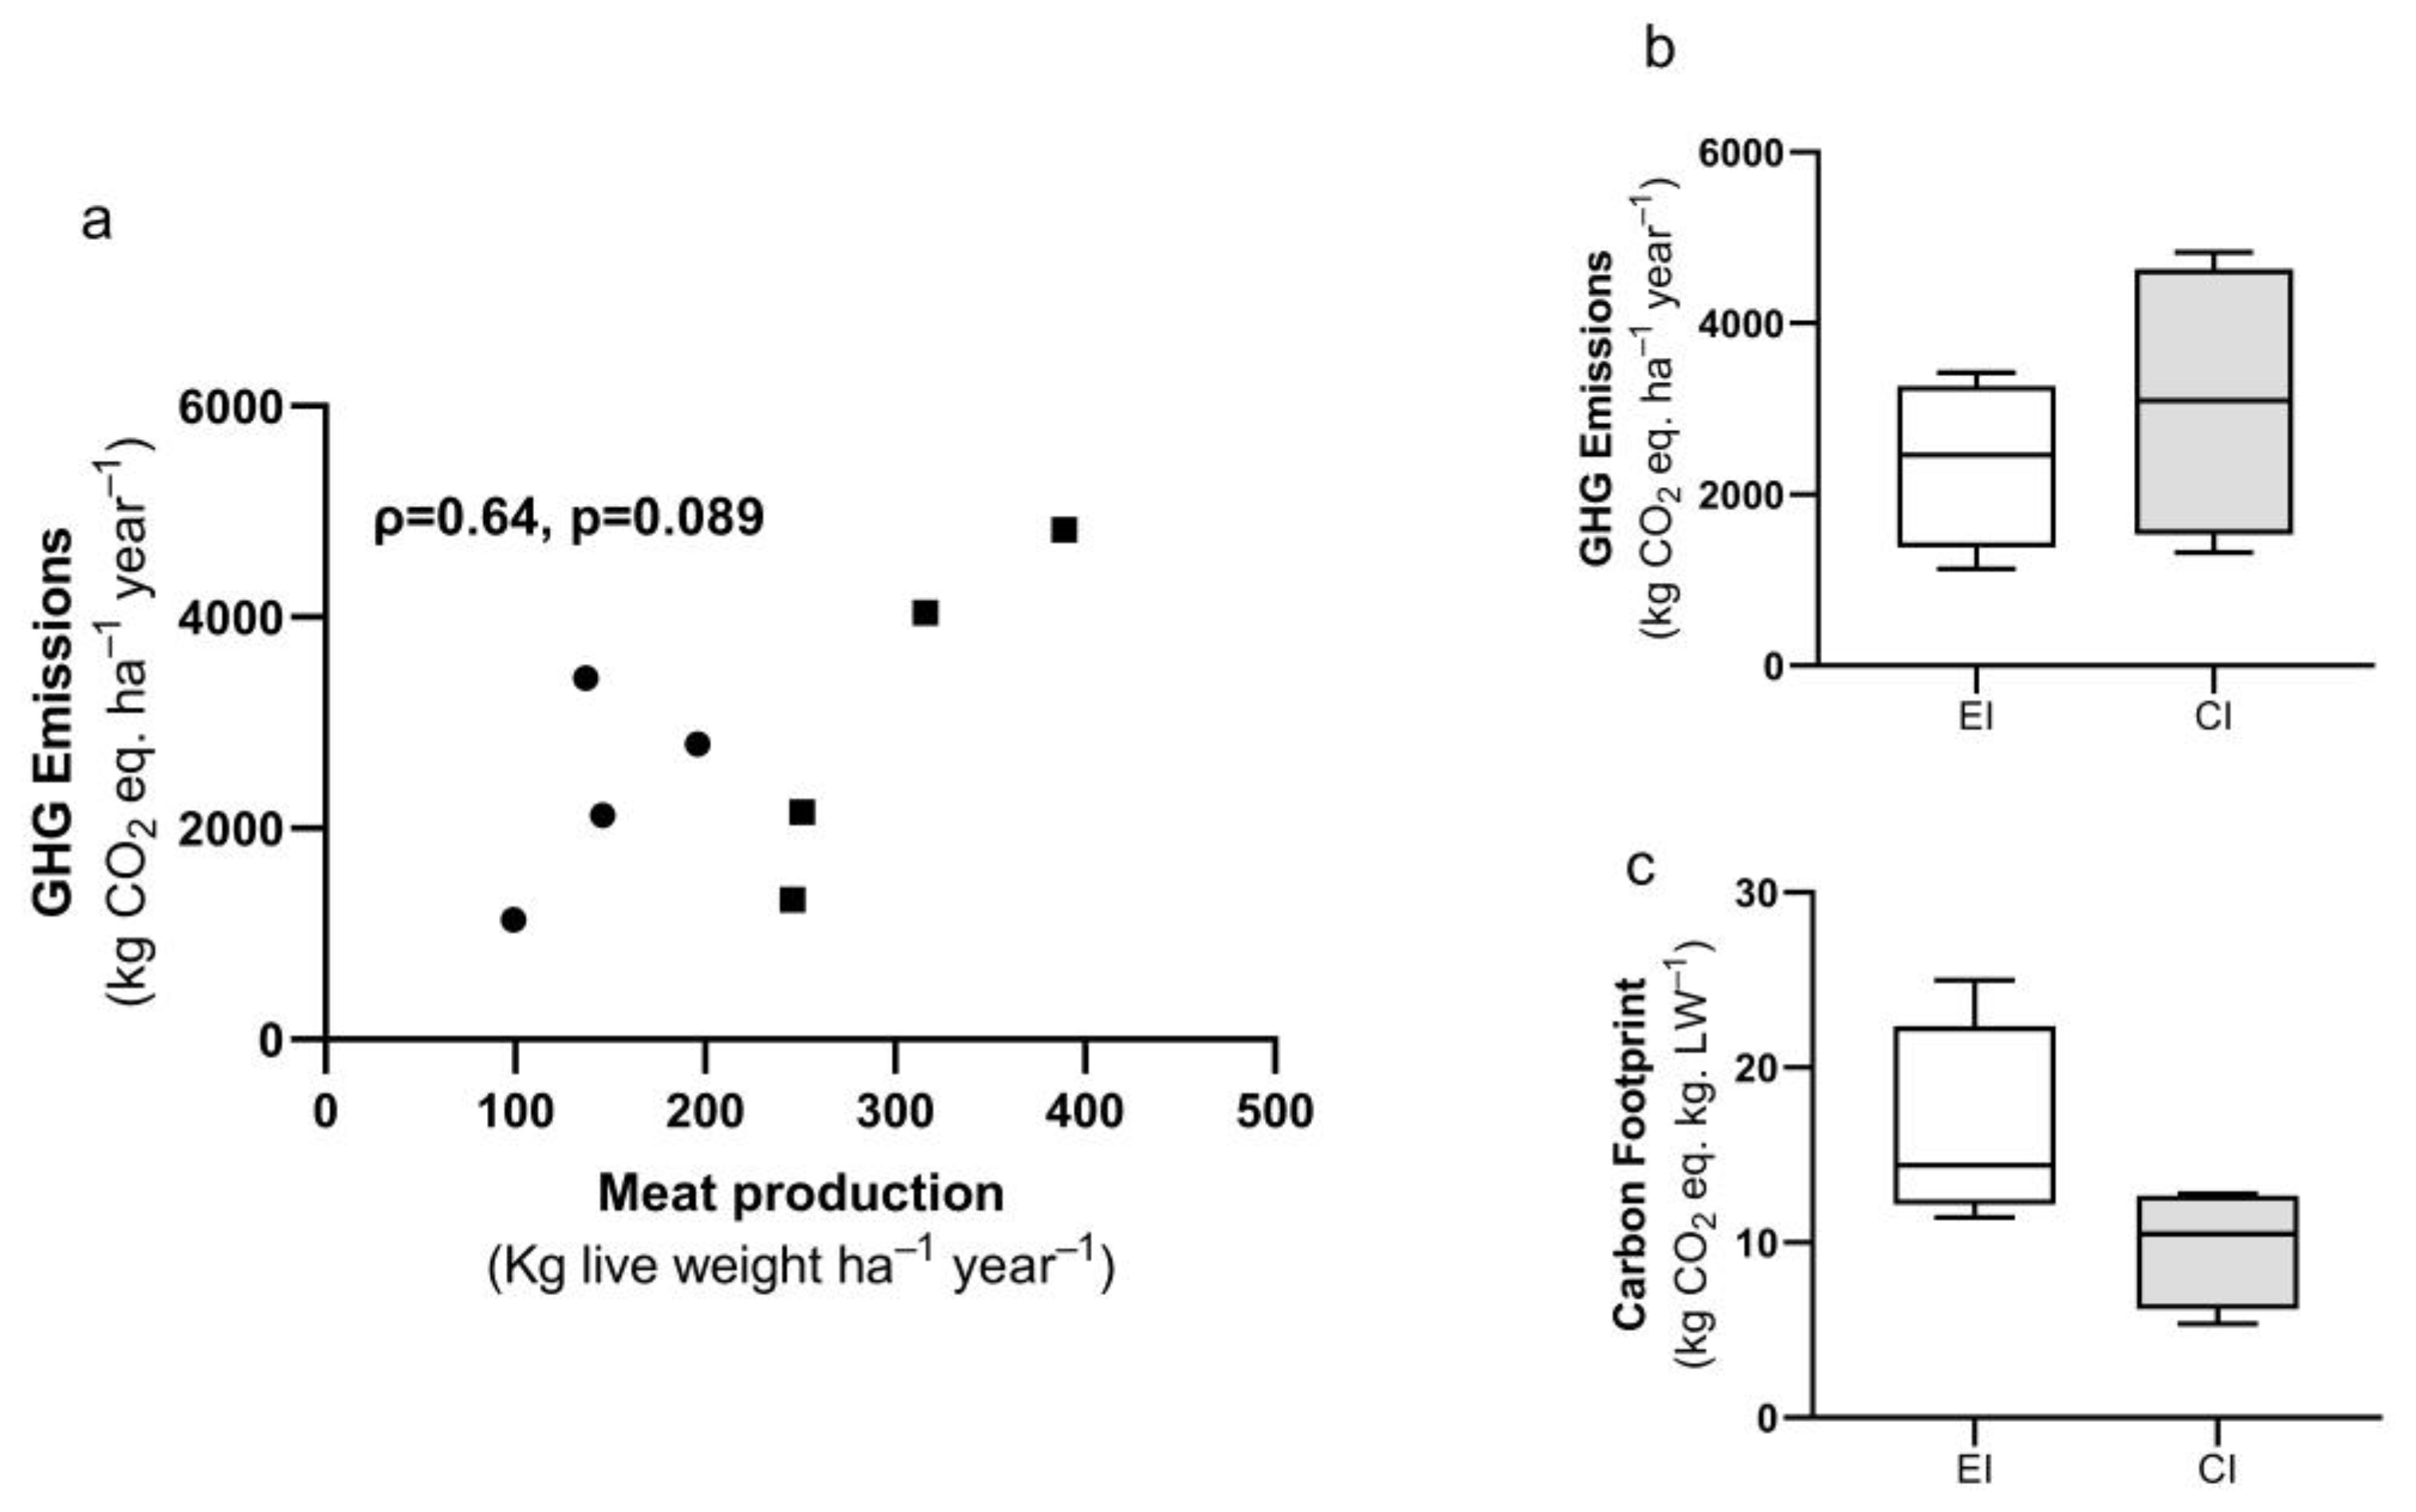
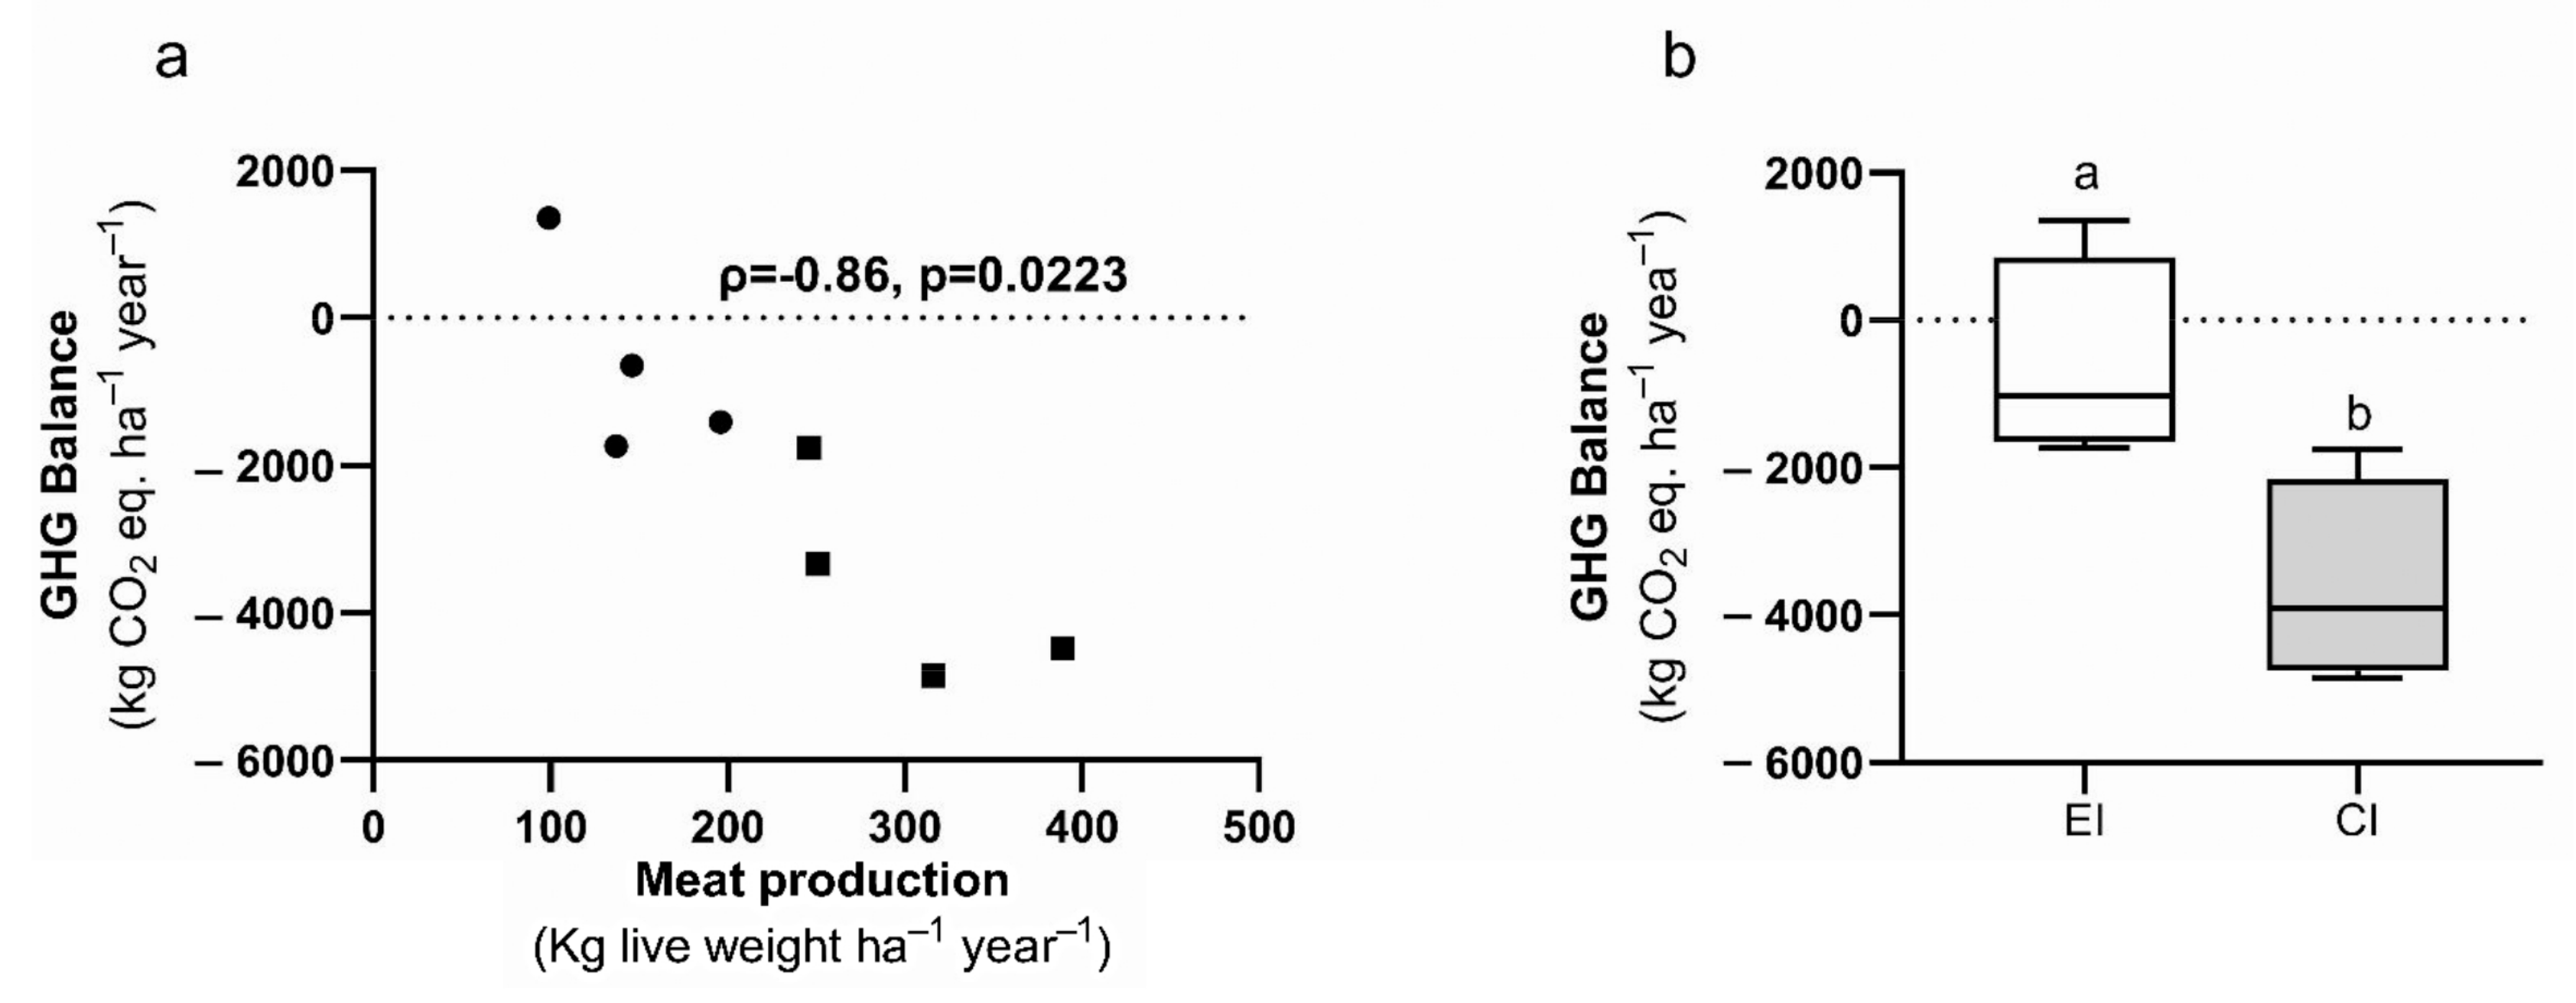
2.3.2. Emission of GHGs, Carbon Footprint, and GHG Balance

We calculated the emissions of GHG as the sum of emissions generated during the production process (primary emissions) and those generated during the production of the resources and machinery used in the production process (secondary emissions) [51].
Primary emissions are gasses produced during the care and handling of animals and manure, such as CH4 emissions from enteric fermentation and fecal deposition; N2O emissions from fecal deposition in pastures or feedlots and cultivated soils; and CO2 emissions from urea fertilization, decomposition of dead vegetation, mineralization of organic matter, atmospheric deposition, leaching, runoff, and soil C stock changes. We calculated primary GHG emissions using IPCC 2006 [52] tier 2 or tier 1 equations according to the availability of emission factors, as described in Jacobo et al. [53]. For the estimation of emissions from the care and handling of animals and manure, we applied tier 2 because we recorded or estimated all variables (number of animals per category, live and adult weight, daily weight gain, grazing time, digestibility and crude protein content of feeds, average winter temperature, etc.) of each farm to obtain the emission factors proposed in the IPCC equations [52]. For the estimation of N2O emissions from cultivated soils and CO2 emissions by urea fertilization, we used tier 1 due to the lack of specific emission factors for the different conditions studied, and we registered or estimated variables (area per type of crop for animal feed, agronomic management (seeding, crop rotation, fertilization, etc.) of each farm) that were used in the equations or allowed us to select the corresponding emission factor proposed by the IPCC [52]. CH4 and N2O emissions were multiplied by the conversion coefficient (25 and 298, respectively) [52] to express the results in terms of CO2-C equivalent per hectare and year.
Secondary emissions include CO2 and N2O generated during the production of electricity, fuel, machinery, fertilizers, agrochemicals, and purchased feed used for animal care, manure handling, and feed production [51]. We calculated secondary emissions according to the methodology proposed by Stackhouse–Lawson et al. [54]. For this, the amount of each input used was multiplied by the corresponding emission factors [54], and the results were expressed per unit of area (ha) to be summed to the primary emissions.
The carbon footprint was calculated as the ratio between the total GHG emissions and meat production and expressed as kg CO2eq. kg LW−1.
To calculate the GHG balance, we considered total (primary and secondary) emissions and the variation in SOC stock. The variation in SOC stock of each farm was calculated as the sum of the SOC stock variation in each type of forage resource (grassland, cultivated pasture, annual forage crop) multiplied by the area of this resource relative to the total area of the farm. To estimate the SOC stock variation in cultivated pastures and annual forage crops, we used tier 1 [52] because specific emission factors for each forage resource condition were not available. The SOC stock variation in native grasslands under different grazing management and agronomic practices was estimated using coefficients provided by our own studies in the same area [55,56].

2.3.3. Average Gross Margin and the Coefficient of Variation in the Gross Margin

The gross margin was calculated as the difference between direct livestock income and direct livestock costs [57]. Direct costs were calculated based on information obtained through the semi-structured interviews performed from 2013 to 2018, which detailed management practices, inputs used, labor, and technical assistance. Income was estimated based on livestock productivity and the proportion of the different categories (calves, heifers, or steers) sold. To evaluate the economic stability of livestock farming, we calculated the gross margin using prices from 2003 to 2023 and calculated the ratio of standard deviation to gross margin [58].
The price series were obtained mainly from the Agroseries Online database of AACREA [59] and from those published in the magazine Márgenes Agropecuarios [60] as a secondary source. The results are expressed in USD ha−1. The period considered (2003–2023) included different market scenarios of the recent history of Argentina in terms of relative product/input (wages, fertilizers, and crops) relationships.

2.4. Statistical Analysis

We explored the relationships between meat production and GHG emissions, GHG balance, fossil energy consumption, gross margin, and the coefficient of variation in the gross margin using the Spearman’s rank-order correlation (ρ: Spearman’s correlation coefficient) due to the non-normal data distribution. We performed a multi-response permutation procedure (MRPP) [61] to test for multivariate differences among livestock farms grouped by intensification strategies, using the variables grassland proportion (hectares of grassland per hectare of total land) and meat production (from Table 1), consumption of fossil energy, energy use efficiency, emission of GHG, balance of GHG, average gross margin, and the coefficient of variation in the gross margin. A nonparametric one-way Kruskal–Wallis test was performed on each variable to detect differences (p < 0.05) between the intensification strategies.

3. Results

The MRPP technique showed a significant difference between CI and EI groups of livestock farms (p = 0.021).
Fossil energy consumption was positively and very strongly correlated with meat production (ρ = 0.95, p = 0.0117) (Figure 2a). EI livestock farms consumed significantly less fossil energy than CI farms (p < 0.05) (Figure 2b). Concomitantly, the energy use efficiency was significantly higher in the EI farms with respect to the CI farms (p < 0.05) (Figure 2c).
Emission of GHG showed a moderate correlation with meat production (ρ = 0.64, p = 0.0890) (Figure 3a), and there were no significant differences between EI and CI farms in GHG emissions (Figure 3b) and in carbon footprint (Figure 3c).
The greenhouse gas balance resulted from the summation of GHG emissions and the variation in SOC stock. The variation in SOC stock was positive and significantly higher in EI farms with respect to CI farms: 1676 ± 304 vs. −433 ± 343 kg CO2eq ha−1 y−1, p < 0.05, respectively. GHG balance was negatively and very strongly correlated with meat production (ρ = −0.86, p = 0.0233) (Figure 4a), and in EI farms, it was positive or slightly negative and significantly higher than that of CI farms (p < 0.05) (Figure 4b).
The average gross margin was not correlated with meat production (ρ = −0.24, p = 0.5287) (Figure 5a), and neither were there differences in average gross margin between EI and CI farms (Figure 5b). However, the coefficient of variation in the gross margin was positively and very strongly correlated with meat production ρ = 0.98, p = 0.0098) (Figure 5c). Therefore, the coefficient of variation in the gross margin in EI farms was significantly lower with respect to CI farms (p < 0.05) (Figure 5d).
The average gross margin valued at annual current prices from 2003 to 2021 was not significantly different between intensification strategies for almost all years, except for 2008 and 2009 when the average gross margin of CI farms was negative and lower (p < 0.05) with respect to EI farms (Figure 6).

4. Discussion

The Flooding Pampa region preserves a large area of temperate grasslands characterized by great floristic richness and diversity and high productive potential [38,62]. These grasslands were not grazed by domestic herbivores before the Spanish colonization. Cattle then roamed freely until the early 20th century, when wire fences were erected to demarcate land ownership. The erection of wire fences prevented the movement of cattle, which were confined to paddocks. Consequently, the practice of grazing became continuous, which resulted in a modification of the floristic composition and structure of the native grassland, thereby initiating a degradation process [21]. Furthermore, in recent decades, farmers have adopted a new technology that involves the use of glyphosate and nitrogen fertilization to increase winter forage productivity. This has been demonstrated to result in a significant reduction in species richness and diversity, with the local extinction of several native perennial species [22] and a reduction in the annual amount of ANPP [55]. This degradation process has intensified due to the increase in stocking rate resulting from the movement of livestock from other sub-regions of the Pampas, where the area of land cultivated with crops increased [7].
Adaptative Multi Paddock Grazing has been shown to be the most important tool to stop and reverse the degradation processes caused by continuous grazing and high stocking rates in the Flooding Pampa region [36]. It consists of (i) subdividing the land surface into homogeneous environments according to the type of plant community and (ii) applying disturbances, mainly grazing with high instantaneous stocking rates followed by a resting period of variable duration. The intensity and timing of grazing, as well as the duration of the resting period, are determined according to the plant community, the season, and the objective pursued, such as restoring the vigor of species of high forage value, controlling selectivity, modifying the competitive relationships between functional groups, promoting germination and establishment, as well as flowering and fruiting of the desired species [21]. A study conducted in the Flooding Pampa revealed that cattle farms applying AMPG exhibited significantly superior grassland conditions, a reliable indicator of grassland health and productivity [63], in comparison to those applying traditional continuous grazing methods [45]. Furthermore, the study indicates that farmers who employed AMPG maintained a high proportion of native grassland, whereas those who applied continuous grazing, which resulted in grassland degradation, opted to replace it with cultivated pastures or forage crops in order to enhance the low productivity of degraded grassland. The reduction in native grassland conditions through inappropriate use and the conversion of native grassland to other uses are the main drivers of grassland degradation on a global scale [64].
The maintenance of a substantial proportion of the cattle farmland on healthy, high-forage grassland serves to minimize the inputs required to sustain fertility; control weeds, pests, and disease; and mainly to use grains to feed the cattle. Consequently, the fossil energy use per unit area was found to be negligible (9–629 MJ ha−1 year−1) on the EI farms. The reduction in input requirements by feeding animals with natural vegetation is one of the key principles for optimizing the ecological processes of animal production systems [65]. On the other hand, the consumption of fossil fuels increased in farms where cattle were fed primarily on cultivated pastures, forage crops, grains, and supplements. Consequently, the use of fossil energy was considerably higher (1635–3530 MJ ha−1 year−1) in the CI farms. As expected, meat production increases as the use of inputs increases. However, since the increase in secondary production is not proportional to the increase in fossil energy consumption, the efficiency of fossil energy use (energy input per unit of output) of cattle farms under CI was lower. Meat production of farms under EI was quite variable. In pure cow–calf systems on farms without an agricultural environment (case 1) and therefore with grassland covering the entire area, EI allows for achieving 99 kg ha−1 year−1. In backgrounding systems, on farms where the non-flooded area of native grasslands was replaced by forage crops (13% del area, case 4), meat production achieved 196 kg ha−1 year−1. The results indicate that a satisfactory level of secondary productivity can be achieved by replacing a small proportion of grassland area, thereby increasing slightly the energy consumption. Moreover, replacing a small area of the farm without environmental constraints with pastures increases meat production more than proportionally, as has been documented in pastoral goat systems in Spain [66] and in peasant systems in the Argentine Chaco [67,68]. This may be an appropriate strategy to reconcile conservation and production in small family farms in fragile environments.
The carbon footprint of EI farms was found to be 16.31 ± 2.97 CO2 equivalent (CO2 eq.) kg LW, while that of CI farms was 9.79 ± 1.75 CO2 eq. kg LW. Despite the observed difference in the media, no significant difference was found between them. Additionally, the calculation of the carbon footprint, resulting from expressing CO2 emission rates per kg of live weight (LW), involves a dilution effect; this effect is considered an artifact that is often used to portray intensive livestock systems, such as feedlots, as being more sustainable than graze-based systems [28]. There are two main reasons to explain this dilution effect. A diet that includes cereal grains for cattle (cases 5, 6, and 7) has been demonstrated to promote bypass rumination, which in turn leads to a reduction in methane emissions per unit of dry matter consumed by the animals [69]. Furthermore, the production system employed in cases 1, 3, and 4 of EI farms did not include the fattening stage, which is more efficient in terms of the conversion of meat. The only case that included fattening (case 2) involved animals being slaughtered at an older age than CI farms. As emission rates are calculated over the entire life span of an animal, shorter life spans result in an additional dilution effect on the average emission rate per unit of live weight.
The balance of GHG of the farms, which integrated total (primary and secondary) emissions and the variation in SOC stock, was negatively correlated with meat production. Although emission rates per unit of land area were found to be similar between the two intensification strategies (2369 ± 490 CO2eq. ha−1 year−1 under EI and 3087 ± 813 CO2eq. ha−1 year−1 under CI), the overall GHG balance exhibited significant differences between them. The GHG balance of CI farms was −3520 ± 774 kg CO2 eq. ha−1 year−1, while the GHG balance of EI farms was −693 ± 732 kg CO2 eq. ha−1 year−1. The difference in the balance of GHG was sustained by the variation in SOC stock levels of soils under both intensification strategies. Soil carbon sequestration has a great potential to partially mitigate GHG emissions from ruminant production. A review of the literature shows that avoiding tillage, converting grasslands to cropland, and replacing heavy tillage with light tillage are management practices that reduce C losses and increase C sequestration [70]. In Flooding Pampa grasslands, AMPG has been shown to increase C sequestration in soils of different grassland communities [55,56]. Our results showed that soils from cattle farms that used moderate stocking rates and maintained a high area of native grassland under AMPG sequestered carbon at rates ranging from 1041 to 2492 kgCO2 eq. ha−1 year−1. These estimated carbon sequestration rates were higher than those estimated for pastoral systems in the USA and Australia [71,72,73] and similar to those measured for pastoral systems in Europe [74]. The high C sequestration potential of the soils of EI farms in the Flooding Pampa could be attributed to the temperate humid climate of the region, as C sequestration capacity is positively related to the relationship between rainfall and potential evapotranspiration [72]. On the other hand, farms under CI showed lower or negative C sequestration rates, as carbon was sequestered at a rate of 342 kgCO2 eq. ha−1 year−1 or lost at a rate of 88 to 1179 kgCO2 eq. ha−1 year−1., probably due to the replacement of grassland and continuous grazing of the remaining grassland. Although emissions from both CI or EI strategies were higher than those measured in other grazing systems [74,75], the high sequestration capacity of grassland soils under AMPG [76] is effective in mitigating GHG emissions, and therefore cattle farms under EI reduced or reversed net GHG emissions. The reduced or even negative carbon sequestration of cattle farms under CI resulted in a net source of GHGs to the atmosphere.
Exploring the trade-off between economics and environmental variables related to global warming at the farm level is a key issue for livestock sustainability [77]. However, there are few studies regarding this relationship in beef cattle. Our results showed no relationship between meat production and average gross margin. Conventional input-based intensification strategy increased meat production significantly more than EI, and therefore, their income was higher. However, this higher income did not translate into higher profits with respect to EI, as the average gross margin did not differ between intensification strategies. According to these results, it is possible to achieve satisfactory levels of productivity and profitability under EI, as has been reported in livestock farms on native grasslands in Uruguay [78,79]. Feeding strategy is one of the main farm management strategies affecting both environmental performance and farm profitability of beef production [80]. The feeding strategy of the EI was to increase the productivity of forage, the quality of forage, and the harvesting efficiency of the native grassland through AMPG [36]. As a result, feeding costs were very low or negligible when native grassland was the only forage source provided (Case 1). High variability in average gross margin among ecologically intensified farms (72–225 USD ha−1 year−1) was related to the different proportions of native grassland (from 100 to 74%) and the different production system (cow–calf, cow–calf and backgrounding, and full cycle) within this group. Highlighting the role of grasslands in sustainable livestock production, Italian beef cattle farms based on permanent grasslands showed that the farms with lower environmental impacts tended to be characterized by better economic results [81]. Even in systems with higher demands for nutritional quality, such as dairy farming, low-input grass-based dairy production has allowed for both improved environmental performance and higher net food production [82]. Farmers also emphasized the central role of pastures and grazing in the achievement of autonomy and better cost control [83]. Good economic performance of cattle farms under EI has occurred even when the output product is not overpriced, as is the case with organic meat. In Argentina, the market for organic meat is still incipient, and the premiums are minimal. This contrasts with other countries where prices of organic beef were up to 25% higher than conventional prices [84].
In Argentina, the stability of the gross margin is a very relevant indicator since the interannual variation in the input–output price ratio is very high [85]. Neither the producers who sell calves (cow–calf operations) nor those who sell finished animals (full cycle) determine the output prices, and therefore their position in the food supply chain determines the fragile income situation of the farms [86]. Since EI farms are less dependent on inputs, the year-to-year variation in gross margin depends only on the variation in meat price, while the year-to-year variation in gross margin of the CI farm depends on both input and meat prices. We found that the farms that maintain a higher proportion of native grassland in good condition through AMPG are characterized by a lower year-to-year variability of the gross margin; that is, more predictable economic results and better response to unfavorable price situations. On the other hand, in the face of less favorable price situations, the profitability of conventionally intensified farms is significantly depressed, in some cases even negative (e.g., 2008–2009). The more stable returns of ecologically intensified farms compared to conventionally intensified farms constitute a key feature in coping with exogenous perturbations, thus contributing to greater resilience of these socio-ecological systems [87]. Therefore, our results suggest that there is no trade-off between provisioning and regulating services or environmental and economic goals under EI.

5. Conclusions

The most sustainable cattle ranching in the Flooding Pampa emerged as those that combined increased environmental efficiency with satisfactory profitability and increased economic stability. This was made possible by reducing production costs by minimizing inputs such as fertilizers, pesticides, and externally purchased feed. A key driver of success is the adoption of AMPG, which effectively exploits the potential productive capacity of the temperate native grasslands of the Pampas. The study’s central finding indicates that there is no trade-off between provisioning and regulating services related to global warming under EI. These encompass indispensable provisioning services, exemplified by increased beef production and income generation. Additionally, the practice facilitates crucial regulating services, including carbon sequestration, climate change mitigation, and the reduced utilization of non-renewable energy sources. These findings indicate the potential of livestock systems in the Flooding Pampa for the simultaneous achievement of individual and local benefits while contributing to societal and planetary benefits.

Author Contributions

Conceptualization, E.J.J., A.M.R. and U.J.M.O.; methodology, E.J.J. and A.M.R.; software, A.M.R., U.J.M.O. and S.M.C.; validation, E.J.J.; formal analysis, A.M.R.; investigation, E.J.J. and A.M.R.; resources, E.J.J., A.M.R., U.J.M.O. and S.M.C.; data curation, A.M.R. and U.J.M.O.; writing—original draft preparation, E.J.J. and A.M.R.; writing—review and editing, E.J.J., A.M.R. and S.M.C.; visualization, A.M.R. and S.M.C.; supervision, A.M.R. and S.M.C.; project administration, E.J.J.; funding acquisition, A.M.R. and E.J.J. All authors have read and agreed to the published version of the manuscript.

Funding

This research and the article processing charge (APC) were funded by the University of Buenos Aires, grant numbers: UBACyT 20020170100538BA and UBACyT 20020220300046BA.

Informed Consent Statement

Not applicable.

Data Availability Statement

The raw data supporting the conclusions of this article will be made available by the authors on request.

Conflicts of Interest

The authors declare no conflict of interest.

References

  1. Millennium Ecosystem Assessment (MAE); Island Press: Washington, DC, USA, 2005.
  2. Campbell, B.M.; Beare, D.J.; Bennett, E.M.; Hall-Spencer, J.M.; Ingram, J.S.; Jaramillo, F.; Shindell, D. Agriculture production as a major driver of the Earth system exceeding planetary boundaries. Ecol. Soc. 2017, 22, 8. [Google Scholar] [CrossRef]
  3. De Vries, M.; de Boer, I.J. Comparing environmental impacts for livestock products: A review of life cycle assessments. Livest. Sci. 2010, 128, 1–11. [Google Scholar] [CrossRef]
  4. Alkemade, R.; Reid, R.S.; van den Berg, M.; de Leeuw, J.; Jeuken, M. Assessing the impacts of livestock production on biodiversity in rangeland ecosystems. Proc. Natl. Acad. Sci. USA 2013, 110, 20900–20905. [Google Scholar] [CrossRef] [PubMed]
  5. Gerber, P.J.; Steinfeld, H.; Henderson, B.; Mottet, A.; Opio, C.; Dijkman, J.; Falcucci, A.; Tempio, G. Tackling Climate Change through Livestock: A Global Assessment of Emissions and Mitigation Opportunities; Food and Agriculture Organization of the United Nations (FAO): Rome, Italy, 2013. [Google Scholar]
  6. Paruelo, J.M.; Guerschman, J.P.; Pineiro, G.; Jobbagy, E.G.; Verón, S.R.; Baldi, G.; Baeza, S. Cambios en el uso de la tierra en Argentina y Uruguay: Marcos conceptuales para su análisis. Agrocienc. Urug. 2006, 10, 47–61. [Google Scholar] [CrossRef]
  7. Rearte, D. Situación actual y prospectiva de la ganadería argentina, un enfoque regional. Arch. Latinoam. Prod. Anim. 2011, 19, 46–49. [Google Scholar]
  8. Paruelo, J.M.; Guerschman, J.P.; Verón, S.R. Expansión agrícola y cambios en el uso del suelo. Cienc. Hoy 2005, 15, 14–23. [Google Scholar]
  9. Matteucci, S.D. Ecorregión Pampa. In Ecorregiones y Complejos Ecosistémicos de Argentina; Rodriguez, A.F., Morello, J., Matteucci, S.D., Eds.; Orientación Gráfica Editora: Buenos Aires, Argentina, 2012; pp. 391–445. [Google Scholar]
  10. Aizen, M.A.; Garibaldi, L.A.; Dondo, M. Expansión de la soja y diversidad de la agricultura argentina. Ecol. Austral 2009, 19, 45–54. [Google Scholar]
  11. Lara, B.; Gandini, M.; Salese, S. Cambios en los servicios ecosistémicos de regulación y su relación con los cambios en el uso del suelo en la región pampeana (Argentina). Rev. Chapingo Ser. Cienc. For. Ambiente 2024, 29, 3–16. [Google Scholar] [CrossRef]
  12. Modernel, P.; Rossing, W.A.; Corbeels, M.; Dogliotti, S.; Picasso, V.; Tittonell, P. Land use change and ecosystem service provision in Pampas and Campos grasslands of southern South America. Environ. Res. Lett. 2016, 11, 113002. [Google Scholar] [CrossRef]
  13. Sala, O.E.; Paruelo, J.M. Ecosystem services in grasslands. In Nature’s Services: Societal Dependence on Natural Ecosystems; Daily, G.C., Ed.; Island Press: Washington, DC, USA, 1997; pp. 237–251. [Google Scholar]
  14. Fisher, B.; Turner, R.K.; Morling, P. Defining and classifying ecosystem services for decision making. Ecol. Econ. 2009, 68, 643–653. [Google Scholar] [CrossRef]
  15. Dumont, B.; Ryschawy, J.; Duru, M.; Benoit, M.; Chatellier, V.; Delaby, L.; Donnars, C.; Dupraz, P.; Lemauviel-Lavenant, S.; Méda, B.; et al. Associations among goods, impacts and ecosystem services provided by livestock farming. Animal 2019, 13, 1773–1784. [Google Scholar] [CrossRef] [PubMed]
  16. Lemaire, G. Intensification of animal production from grassland and ecosystem services: A trade-off. CAB Rev. Perspect. Agric. Vet. Sci. Nutr. Nat. Resour. 2012, 7, 1–7. [Google Scholar] [CrossRef]
  17. Lindborg, R.; Hartel, T.; Helm, A.; Prangel, E.; Reitalu, T.; Ripoll-Bosch, R. Ecosystem services provided by semi-natural and intensified grasslands: Synergies, trade-offs and linkages to plant traits and functional richness. Appl. Veg. Sci. 2023, 26, e12729. [Google Scholar] [CrossRef]
  18. Teague, R.; Kreuter, U. Managing grazing to restore soil health, ecosystem function, and ecosystem services. Front. Sustain. Food Syst. 2020, 4, 534187. [Google Scholar] [CrossRef]
  19. Bengtsson, J.; Bullock, J.M.; Egoh, B.; Everson, C.; Everson, T.; O’connor, T.; O’Farrell, P.J.; Smith, H.G.; Lindborg, R. Grasslands—More important for ecosystem services than you might think. Ecosphere 2019, 10, e02582. [Google Scholar] [CrossRef]
  20. Briske, D.D.; Archer, S.R.; Burchfield, E.; Burnidge, W.; Derner, J.D.; Gosnell, H.; Hatfield, J.; Kazanski, C.E.; Khalil, M.; Lark, T.J.; et al. Supplying ecosystem services on US rangelands. Nat. Sustain. 2023, 6, 1524–1532. [Google Scholar] [CrossRef]
  21. Deregibus, V.A.; Jacobo, E.; Rodríguez, A. Perspective: Improvement in rangeland condition of the Flooding Pampa of Argentina through controlled grazing. Afr. J. Range Forage Sci. 1995, 12, 92–96. [Google Scholar] [CrossRef]
  22. Rodríguez, A.M.; Jacobo, E.J. Glyphosate application changes plant functional groups proportion and reduces floristic richness and diversity in Flooding Pampa rangeland (Argentina). Agric. Ecosyst. Environ. 2010, 138, 222–231. [Google Scholar]
  23. Martínez Ortiz, U.; Jacobo, E.J.; Cañada, P.; Sobredo, M. Análisis Económico del Manejo de Pastizales Naturales en la Depresión del Salado. Boletín Técnico de la Fundación Vida Silvestre Argentina, Diciembre 2017. Available online: https://wwfar.awsassets.panda.org/downloads/kit_pampas___manual_analisis_economico_del_manejo_de_pastizales.pdf (accessed on 15 April 2024).
  24. Faverin, C.; Machado, C. Typologies and characterization of cow-calf system the flooding pampas. Chil. J. Agric. Anim. Sci. 2019, 35, 3–13. [Google Scholar]
  25. Jaurena, M.; Durante, M.; Devincenzi, T.; Savian, J.V.; Bendersky, D.; Moojen, F.G.; Pereira, M.; Soca, P.; Quadros, F.L.F.; Pizzio, R.; et al. Native Grasslands at the Core: A New Paradigm of Intensification for the Campos of Southern South America to Increase Economic and Environmental Sustainability. Front. Sustain. Food Syst. 2021, 5, 11. [Google Scholar] [CrossRef]
  26. Bilotto, F.; Vibart, R.; Wall, A.; Machado, C.F. Estimation of the inter-annual marginal value of additional feed and its replacement cost for beef cattle systems in the Flooding Pampas of Argentina. Agric. Syst. 2021, 187, 103010. [Google Scholar] [CrossRef]
  27. Garnett, T.; Appleby, M.C.; Balmford, A.; Bateman, I.J.; Benton, T.G.; Bloomer, P.; Burlingame, B.; Dawkins, M.; Dolan, L.; Fraser, D.; et al. Sustainable intensification in agriculture: Premises and policies. Science 2013, 341, 33–34. [Google Scholar] [CrossRef] [PubMed]
  28. Tittonell, P. Beyond CO2: Multiple ecosystem services from ecologically intensive grazing landscapes of South America. Front. Sustain. Food Syst. 2021, 5, 664103. [Google Scholar] [CrossRef]
  29. Teague, W.R.; Provenza, F.; Kreuter, U.; Steffens, T.; Barnes, M. Multi-paddock grazing on rangelands: Why the perceptual dichotomy between research results and rancher experience? J. Environ. Manag. 2013, 128, 699–717. [Google Scholar] [CrossRef]
  30. Modernel, P.; Picasso, V.; Do Carmo, M.; Rossing, W.A.; Corbeels, M.; Soca, P.; Dogliotti, S.; Tittonell, P. Grazing management for more resilient mixed livestock farming systems on native grasslands of southern South America. Grass Forage Sci. 2019, 74, 636–649. [Google Scholar] [CrossRef]
  31. Biondini, M.E.; Manske, L. Grazing frequency and ecosystem processes in a northern mixed prairie, USA. Ecol. Appl. 1996, 6, 239–256. [Google Scholar] [CrossRef]
  32. Teague, W.R.; Dowhower, S.L.; Baker, S.A.; Haile, N.; DeLaune, P.B.; Conover, D.M. Grazing management impacts on vegetation, soil biota and soil chemical, physical and hydrological properties in tall grass prairie. Agric. Ecosyst. Environ. 2011, 141, 310–322. [Google Scholar] [CrossRef]
  33. Dahl, K.M.; Bork, E.W.; Parkins, J.R.; Sherren, K. Assessing variation in range health across grazed northern temperate grasslands. Rangel. Ecol. Manag. 2021, 74, 135–146. [Google Scholar] [CrossRef]
  34. Sanjari, G.; Ghadiri, H.; Ciesiolka, C.A.; Yu, B. Comparing the effects of continuous and time-controlled grazing systems on soil characteristics in Southeast Queensland. Soil Res. 2008, 46, 348–358. [Google Scholar] [CrossRef]
  35. Jacobo, E.J.; Rodriguez, A.M.; Rossi, J.L.; Salgado, L.P.; Deregibus, V.A. Rotational stocking and production of Italian ryegrass on Argentinean rangelands. Rangel. Ecol. Manag. J. Range Manag. 2000, 53, 483–488. [Google Scholar]
  36. Jacobo, E.J.; Rodríguez, A.M.; Bartoloni, N.; Deregibus, V.A. Rotational grazing effects on rangeland vegetation at a farm scale. Rangel. Ecol. Manag. 2006, 59, 249–257. [Google Scholar] [CrossRef]
  37. Sherren, K.; Hodbod, J.; MathisonSlee, M.; Chappell, E.; King, M. Adaptive multi-paddock grazing and wellbeing: Uptake, management practices and mindset among Canadian beef producers. Agroecol. Sustain. Food Syst. 2022, 46, 1304–1329. [Google Scholar] [CrossRef]
  38. Soriano, A.; León, R.J.C.; Sala, O.E.; Lavado, R.S.; Deregibus, V.A.; Cauhépé, M.A.; Scaglia, O.A.; Velázquez, C.A.; Lemcoff, J.H. Río de la Plata grasslands. In Natural Grasslands: Introduction and Western Hemisphere; Coupland, R., Ed.; Elsevier: Amsterdam, The Netherlands, 1992; pp. 367–407. [Google Scholar]
  39. Deregibus, V.A.; Soriano, A. Los pastizales de la zona de cría de la depresión del Salado desde el punto de vista ecológico. RAPA 1981, 1, 60–83. [Google Scholar]
  40. Sala, O.; Deregibus, V.A.; Schlichter, T.; Alippe, H. Productivity dynamics of a native temperate grassland in Argentina. Rangel. Ecol. Manag. J. Range Manag. 1981, 34, 48–51. [Google Scholar] [CrossRef]
  41. Vázquez, P.; Rojas, M. Zonificación Agroecológica del Área de Influencia de la EEA Cuenca del Salado. Publicación Técnica 2, INTA EEA Cuenca del Salado; Ediciones INTA: Buenos Aires, Argentina, 2006. [Google Scholar]
  42. Vázquez, P.; Rojas, M.; Burges, J. Caracterización y tendencias de la ganadería bovina en la cuenca del Salado. Vet. Argent. 2008, 25, 572–584. [Google Scholar]
  43. Cieza, R.I. Transformaciones productivas en la Cuenca del Salado y persistencia de la ganadería familiar (1999–2019). Cienc. Agron. 2022, 36, e008. [Google Scholar] [CrossRef]
  44. Bisang, R.; Anlló, G.; Campi, M. Una revolución (no tan) silenciosa. Claves para repensar el agro en Argentina. Desarro. Econ. 2008, 48, 165–207. [Google Scholar]
  45. Jacobo, E.J.; Rodríguez, A.M.; González, J.; Golluscio, R.A. Effects of livestock intensification on fossil energy use efficiency and rangeland conservation in the lower basin of the Salado river, Buenos Aires province, Argentine. Agriscientia 2016, 33, 1–14. [Google Scholar] [CrossRef]
  46. Mann, C.; Sherren, K. Holistic management and adaptive grazing: A trainers’ view. Sustainability 2018, 10, 1848. [Google Scholar] [CrossRef]
  47. Ander-Egg, E. Investigación Social; Hvmanitas: Buenos Aires, Argentina, 1989. [Google Scholar]
  48. Román, M.E. Agricultura familiar: Concepto, polémicas y algunas cifras para la Argentina. Ciencia Hoy 2017, 24, 41–46. [Google Scholar]
  49. Zentner, R.P.; Lafond, G.P.; Derksen, D.A.; Nagy, C.N.; Wall, D.D.; May, W.E. Effects of tillage method and crop rotation on non-renewable energy use efficiency for a thin Black Chernozem in the Canadian Prairies. Soil Tillage Res. 2004, 77, 125–136. [Google Scholar] [CrossRef]
  50. Iermanó, M.J. Sistemas Mixtos Familiares de Agricultura y Ganadería Pastoril de la Región Pampeana: Eficiencia en el uso de la Energía y rol Funcional de la Agrobiodiversidad. Ph.D. Thesis, Universidad Nacional de La Plata, La Plata, Argentina, 2015. [Google Scholar]
  51. Rotz, C.A.; Montes, F.; Chianese, D.S. The carbon footprint of dairy production systems through partial life cycle assessment. J. Dairy Sci. 2010, 93, 1266–1282. [Google Scholar] [CrossRef] [PubMed]
  52. IPCC 2006 Guidelines for National Greenhouse Gas Inventories, Volume 4, Agriculture, Forestry and Other Land Use. Available online: https://www.ipcc-nggip.iges.or.jp/public/2006gl/vol4.html (accessed on 15 April 2024).
  53. Jacobo, E.J.; Cadaviz, N.; Vecchio, M.C.; Rodriguez, A.M. Estimación del balance de gases de efecto invernadero en sistemas de producción ganadera de la cuenca del río Salado. Agriscientia 2020, 37, 15–32. [Google Scholar] [CrossRef]
  54. Stackhouse-Lawson, K.R.; Rotz, C.A.; Oltjen, J.W.; Mitloehner, F.M. Carbon footprint and ammonia emissions of California beef production systems. J. Anim. Sci. 2012, 90, 4641–4655. [Google Scholar] [CrossRef] [PubMed]
  55. Rodríguez, A.M.; Jacobo, E.J.; Golluscio, R.A. Glyphosate Alters Aboveground Net Primary Production, Soil Organic Carbon and Nutrients in Pampean Grasslands (Argentina). Rangel. Ecol. Manag. 2018, 71, 119–125. [Google Scholar] [CrossRef]
  56. Vecchio, M.C.; Golluscio, R.A.; Rodríguez, A.M.; Taboada, M.A. Improvement of saline-sodic grassland soils properties by rotational grazing in Argentina. Rangel. Ecol. Manag. 2018, 71, 807–814. [Google Scholar] [CrossRef]
  57. Pagliettini, L.L.; González, M.C. Los Costos Agrarios y sus Aplicaciones; Editorial Facultad de Agronomía: Buenos Aires, Argentina, 2013. [Google Scholar]
  58. Mapp, H.P.; Hardin, M.L.; Walker, O.L.; Persaud, T. Analysis of risk management strategies for agricultural producers. Am. J. Agric. Econ. 1979, 61, 1071–1077. [Google Scholar] [CrossRef]
  59. Agroseries Online. Available online: http://intranet.aacrea.org.ar/series/ (accessed on 15 April 2024).
  60. Margenes Agropecuarios. Available online: https://www.margenes.com/ (accessed on 15 April 2024).
  61. Biondini, M.E.; Mielke, P.W.; Redente, E.F. Permutation techniques based on Euclidean analysis spaces: A new and powerful statistical method for ecological research. In Computer Assisted Vegetation Analysis. Handbook of Vegetation Science; Feoli, E., Orlóci, L., Eds.; Springer: Dordrecht, The Netherlands, 1991; Volume 11, pp. 221–240. [Google Scholar]
  62. Irisarri, J.G.N.; Gundel, P.E.; Clavijo, M.D.P.; Durante, M.; Sosa, P. Estimación de la PPNA y la capacidad de carga por ambientes mediante información satelital en un establecimiento ganadero en la Pampa Deprimida. RAPA 2013, 33, 1–10. [Google Scholar]
  63. Parera, A.; Viglizzo, E. Índice de Contribución a la Conservación de Pastizales Naturales del Cono Sur de Sudamérica (ICP): Criterios y parámetros para su desarrollo. In Índice de Contribución a la Conservación de Pastizales Naturales del Cono Sur. Una Herramienta para Incentivar a los Productores Rurales; Parera, A., Paullier, I., Weyland, F., Eds.; Aves Uruguay: Buenos Aires, Argentina, 2014; Volume 2, pp. 41–56. [Google Scholar]
  64. Bardgett, R.D.; Bullock, J.M.; Lavorel, S.; Manning, P.; Schaffner, U.; Ostle, N.; Chomel, M.; Durigan, G.; Fry, E.L.; Johnson, D.; et al. Combatting global grassland degradation. Nat. Rev. Earth Environ. 2021, 2, 720–735. [Google Scholar] [CrossRef]
  65. Dumont, B.; Fortun-Lamothe, L.; Jouven, M.; Thomas, M.; Tichit, M. Prospects from agroecology and industrial ecology for animal production in the 21st century. Animal 2013, 7, 1028–1043. [Google Scholar] [CrossRef] [PubMed]
  66. Mena, Y.; Gutierrez-Peña, R.; Ruiz, F.A.; Delgado-Pertíñez, M. Can dairy goat farms in mountain areas reach a satisfactory level of profitability without intensification? A case study in Andalusia (Spain). Agroecol. Sustain. Food Syst. 2017, 41, 614–634. [Google Scholar] [CrossRef]
  67. Cotroneo, S.M.; Jacobo, E.J.; Brassiolo, M.M. Degradation processes and adaptive strategies in communal forests of Argentine dry Chaco. Integrating stakeholder knowledge and perceptions. Ecosyst. People 2021, 17, 507–522. [Google Scholar] [CrossRef]
  68. Cotroneo, S.M.; Walsh, A.; Jacobo, E.J. Agroecology in semiarid Chaco forests of Argentina: Transdisciplinary analysis of a sustainable peasant farm. Agroecol. Sustain. Food Syst. 2021, 45, 1139–1164. [Google Scholar]
  69. Takahashi, M. Nutritional manipulation of methane emission from ruminants. In Greenhouse Gases and Animal Agriculture, Proceedings of the 1st International Conference on Greenhouse Gases and Animal Agriculture, Obihiro, Japan, 7–11 November 2001; Takashi, J., Young, B., Eds.; Elsevier: Amsterdam, The Netherlands, 2002. [Google Scholar]
  70. Soussana, J.F.; Tallec, T.; Blanfort, V. Mitigating the greenhouse gas balance of ruminant production systems through carbon sequestration in grasslands. Animal 2010, 4, 334–350. [Google Scholar] [CrossRef] [PubMed]
  71. Bruce, J.P.; Frome, M.; Haites, E.; Janzen, H.; Lal, R.; Paustian, K. Carbon sequestration in soils. J. Soil Water Conserv. 1999, 54, 382–389. [Google Scholar]
  72. Conant, R.T.; Paustian, K.; Elliott, E.T. Grassland management and conversion into grassland: Effects on soil carbon. Ecol. Appl. 2001, 11, 343–355. [Google Scholar] [CrossRef]
  73. Gifford, R.M.; Cheney, N.P.; Noble, J.C.; Russel, J.S.; Wellington, A.B.; Zammit, C.; Barson, M.M. Australian land use, primary production of vegetation and carbon pools in relation to atmospheric carbon dioxide concentration. In Australia’s Renewable Resources: Sustainability and Global Change; Gifford, R.M., Barson, M.M., Eds.; Australian Government Publishing Service: Canberra, Australia, 1992; pp. 151–187. [Google Scholar]
  74. Soussana, J.F.; Allard, V.; Pilegaard, K.; Ambus, P.; Amman, C.; Campbell, C.; Ceschia, E.; Clifton-Brown, J.; Czobel, S.; Domingues, R. Full accounting of the greenhouse gas (CO2, N2O, CH4) budget of nine European grassland sites. Agric. Ecosyst. Environ. 2007, 121, 121–134. [Google Scholar] [CrossRef]
  75. Freibauer, A.; Rounsevell, M.D.; Smith, P.; Verhagen, J. Carbon sequestration in the agricultural soils of Europe. Geoderma 2004, 122, 1–23. [Google Scholar] [CrossRef]
  76. Viglizzo, E.F.; Ricard, M.F.; Taboada, M.A.; Vázquez-Amábile, G. Reassessing the role of grazing lands in carbon-balance estimations: Meta-analysis and review. Sci. Total Environ. 2019, 661, 531–542. [Google Scholar] [CrossRef] [PubMed]
  77. Garnett, T. Livestock-related greenhouse gas emissions: Impacts and options for policy makers. Environ. Sci. Policy 2009, 12, 491–503. [Google Scholar] [CrossRef]
  78. Ruggia, A.; Dogliotti, S.; Aguerre, V.; Albicette, M.M.; Albin, A.; Blumetto, O.G.; Cardozo, G.; Leoni, C.; Quintans, G.; Scarlato, S.; et al. The application of ecologically intensive principles to the systemic redesign of livestock farms on native grasslands: A case of co-innovation in Rocha, Uruguay. Agric. Syst. 2021, 191, 103148. [Google Scholar] [CrossRef]
  79. Orcasberro, S.; Astigarraga, L.; Kohmann, M.M.; Modernel, P.; Picasso, V.D. Ecological intensification in grasslands for resilience and ecosystem services: The case of beef production systems on the Campos Grasslands of South America. In Creating Resilient Landscapes in an Era of Climate Change; Rastandeh, A., Jarchow, M., Eds.; Routledge: London, UK, 2022; pp. 94–115. [Google Scholar]
  80. Kamali, F.P.; van der Linden, A.; Meuwissen, M.P.; Malafaia, G.C.; Lansink, A.G.O.; de Boer, I.J. Environmental and economic performance of beef farming systems with different feeding strategies in southern Brazil. Agric. Syst. 2016, 146, 70–79. [Google Scholar] [CrossRef]
  81. Bonnin, D.; Tabacco, E.; Borreani, G. Variability of greenhouse gas emissions and economic performances on 10 Piedmontese beef farms in North Italy. Agric. Syst. 2021, 194, 103282. [Google Scholar] [CrossRef]
  82. Dentler, J.; Kiefer, L.; Hummler, T.; Bahrs, E.; Elsaesser, M. The impact of low-input grass-based and high-input confinement-based dairy systems on food production, environmental protection and resource use. Agroecol. Sustain. Food Syst. 2020, 44, 1089–1110. [Google Scholar] [CrossRef]
  83. Perrin, A.; Milestad, R.; Martin, G. Resilience applied to farming: Organic farmers’ perspectives. Ecol. Soc. 2020, 25, hal-03227316. [Google Scholar] [CrossRef]
  84. Van Wagenberg, C.P.; de Haas, Y.; Hogeveen, H.; Van Krimpen, M.M.; Meuwissen, M.P.; van Middelaar, C.E.; Rodenburg, T.B. Animal Board Invited Review: Comparing conventional and organic livestock production systems on different aspects of sustainability. Animal 2017, 11, 1839–1851. [Google Scholar] [CrossRef] [PubMed]
  85. Secretaría de Agricultura Ganadería y Pesca, Ministerio de Economía, Argentina. Resultados Económicos Ganaderos. Informe Trimestral N° 43. Junio 2023; pp. 69–75. Available online: https://www.magyp.gob.ar/sitio/areas/bovinos/modelos/resultados/_archivos//000001_Bolet%C3%ADn%20trimestral/000001-2023/000001-Bolet%C3%ADn%20N%C2%BA%2046%20junio%202023.pdf (accessed on 15 April 2024).
  86. Borychowski, M.; Stępień, S.; Polcyn, J.; Tošović-Stevanović, A.; Ćalović, D.; Lalić, G.; Žuža, M. Socio-economic determinants of small family farms’ resilience in selected central and eastern european countries. Sustainability 2020, 12, 10362. [Google Scholar] [CrossRef]
  87. Folke, C.; Biggs, R.; Norström, A.V.; Reyers, B.; Rockström, J. Social-ecological resilience and biosphere-based sustainability science. Ecol. Soc. 2016, 21, 41. [Google Scholar] [CrossRef]
Figure 1. (a) Location of the Flooding Pampa subregion in the Pampa region, Argentina; (b) Subdivision of the Flooding Pampa and location of the eight farms studied (black circle), identified with a numbered case, in the Salado River basin.
Sustainability 16 04229 g001
Figure 2. (a) Relationship between meat production and fossil energy consumption under ecological intensification strategy (EI, black circles) and under conventional intensification (CI, black squares). Insert: Spearman’s correlation coefficient ρ and p-value. (b) Fossil energy consumption and (c) energy use efficiency under ecological intensification (EI, white boxes) or conventional intensification (CI, light grey boxes). The horizontal line inside the boxes indicates the median; the upper and lower boundaries of the boxes indicate the lower and upper quartiles; the vertical lines (whiskers) indicate the lower and upper extremes of each data set. Different letters above the boxes indicate significant differences between intensification strategies according to the Kruskal–Wallis test (p < 0.05).
Sustainability 16 04229 g002
Figure 3. (a) Relationship between meat production and GHG emissions under ecological intensification strategy (EI, black circles) and under conventional intensification (CI, black squares). Insert: Spearman’s correlation coefficient ρ and p-value. (b) GHG emissions and (c) carbon footprint under ecological intensification (EI, white boxes) or conventional intensification (CI, light grey boxes). The horizontal line inside the boxes indicates the median; the upper and lower boundaries of the boxes indicate the lower and upper quartiles; the vertical lines (whiskers) indicate the lower and upper extremes of each data set.
Sustainability 16 04229 g003
Figure 4. (a) Relationship between meat production and GHG balance under ecological intensification strategy (EI, black circles) and under conventional intensification (CI, black squares). Insert: Spearman’s correlation coefficient ρ and p-value. (b) GHG balance under ecological n (EI, white boxes) or conventional intensification (CI, light grey boxes). The horizontal line inside the box indicates the median; the upper and lower boundaries of the boxes indicate the lower and upper quartiles; the vertical lines (whiskers) indicate the lower and upper extremes of each data set. Different letters above the boxes indicate significant differences between intensification strategies according to the Kruskal–Wallis test (p < 0.05).
Sustainability 16 04229 g004
Figure 5. Relationship between meat production and (a) the average 2003–2021 gross margin and (c) the coefficient of variation in the gross margin under ecological intensification strategy (EI, black circles) and under conventional intensification (CI, black squares). Insert: Spearman’s correlation coefficient ρ and p-value. (b) Average 2003–2021 gross margin and (d) coefficient of variation in the gross margin under ecological (EI, white boxes) or conventional intensification (CI, light grey boxes). The horizontal line inside the box indicates the median; the upper and lower boundaries of the boxes indicate the lower and upper quartiles; the vertical lines (whiskers) indicate the lower and upper extremes of each data set. Different letters above the boxes indicate significant differences between intensification strategies according to the Kruskal–Wallis test (p < 0.05).
Sustainability 16 04229 g005
Figure 6. Average gross margin 2003–2021 under ecological intensification strategy (E1: black circles) and under conventional intensification strategy (C1: black squares). Horizontal lines are standard error of mean.
Sustainability 16 04229 g006
Disclaimer/Publisher’s Note: The statements, opinions and data contained in all publications are solely those of the individual author(s) and contributor(s) and not of MDPI and/or the editor(s). MDPI and/or the editor(s) disclaim responsibility for any injury to people or property resulting from any ideas, methods, instructions or products referred to in the content.

