Next Article in Journal
Functional Traits Mediate the Natural Enemy Response to Land Use at the Local Scale
Previous Article in Journal
A Sustainable Approach to Dyed Cotton Fabric Stripping Using Ozone
Previous Article in Special Issue
Soil Heavy Metal Absorption Potential of Azolla pinnata and Lemna gibba with Arbuscular Mycorrhizal Fungi in Rice (Oryza sativa L.) Farming
 
 
Correction published on 14 August 2024, see Sustainability 2024, 16(16), 6949.
Article

Sustainable Intensification of Cropping Systems under Conservation Agriculture Practices: Impact on Yield, Productivity and Profitability of Wheat

1
Department of Agronomy, Punjab Agricultural University, Ludhiana 141004, India
2
Department of Agronomy, Eternal University, Baru Sahib 173101, India
3
Department of Microbiology, Eternal University, Baru Sahib 173101, India
4
Department of Horticulture, Eternal University, Baru Sahib 173101, India
5
Department of Soil Science, Punjab Agricultural University, Ludhiana 141004, India
6
Department of Climate Change and Agricultural Meteorology, Punjab Agricultural University, Ludhiana 141004, India
7
Agricultural and Processed Food Products Export Development Authority, New Delhi 110016, India
8
School of Biotechnology, IFTM University, Moradabad 244102, India
9
Independent Researcher, 46022 Valencia, Spain
*
Authors to whom correspondence should be addressed.
Sustainability 2023, 15(9), 7468; https://doi.org/10.3390/su15097468
Submission received: 14 January 2023 / Revised: 18 April 2023 / Accepted: 24 April 2023 / Published: 1 May 2023 / Corrected: 14 August 2024

Abstract

:
The continuous rice–wheat cropping system in South Asia has caused irreversible environmental damage, raising concerns about the long-term sustainability of the region’s agricultural systems. To address this issue, farm experiments were conducted for two successive years (2019–20 and 2020–21) to assess the impact of different cropping systems under conservation agriculture (CA) practices on the yield, productivity, and profitability of wheat. Results showed that the highest grain yield of wheat was observed in scenarios Sc6, Sc4, and Sc2, which involved full CA permanent-bed soybean (PB)–permanent-bed wheat (PB)–permanent-bed summer moong (PB), full CA permanent-bed maize (PB)–permanent-bed wheat (PB)–permanent-bed summer moong (PB), and partial CA puddled transplanted rice–Happy Seeder wheat–zero-till summer moong (ZT). Additionally, the highest irrigation water productivity (IWP), wheat grain macronutrient uptake, net return, and benefit–cost ratio (B:C ratio) were recorded under Sc6, full CA permanent-bed soybean (PB)–permanent-bed wheat (PB)–permanent-bed summer moong (PB) compared to farmers’ practice puddled transplanted rice (PTR)–conventional-till wheat–summer moong (Sc1) during both years. The system productivity also increased in scenarios Sc2, Sc4, and Sc6 (by 9.72%, 9.65%, and 14.14% in the first year and 10.68%, 14.14%, and 15.55% in the second year) compared to Sc1—farmers’ practice puddled transplanted rice (PTR)–conventional-till wheat–summer moong, Sc3—farmers’ practice fresh-bed maize (FB)–conventional-till wheat–summer moong, and Sc5–farmers’ practice fresh-bed soybean (FB)–conventional-till wheat (CT)–summer moong. The findings suggest that the conservation agriculture soybean–wheat–summer moong (Sc6) on permanent-bed cropping systems with inclusion legumes can be a potential option to enhance yield attributes, productivity, and profitability, as well as the sustainability of natural resources in the region while decreasing environmental footprints.

1. Introduction

The Indo-Gangetic Plains of South Asia cover an area of 13.5 million hectares, which are mainly cultivated with the rice–wheat (RW) cropping system. This system is predominant in the region, as evidenced by numerous studies [1]. The rice–wheat has high productivity at the expense of overusing soil and water resources, especially when it is raised with conventional management practices [2]. In the majority of the RW area of northwest (NW) India, surface-to-ground water depth has steadily increased since the beginning of the 1970s [3,4]. Due to its greater tolerance to various environmental and edaphic conditions, wheat is the most frequently farmed food crop in the world. In case of acreage and production, rice is the top crop in India, and wheat is the country’s principal cereal. Although water acts as fuel for achieving a high productivity of wheat, crop yields are being increasingly limited in most of north-western India, where rice–wheat (RW) is the predominant cropping system [3]. RW systems in India are responsible for more than over 80% of the nation’s total production of cereals and about 50% of the calories consumed. Since more than 90% of the RW area is irrigated, there are issues with yield stagnation, degrading soil, a diminishing ground water table, and air pollution [5]. In order to maintain crop output while reducing irrigation demand, irrigation water productivity must be increased. In comparison with two irrigations at the CRI and late tillering stages, introducing more irrigations led to significantly higher yields of 18–40%. This was due to an increase in the number of productive tillers by 15–20%, as well as an increase of more than 60.2% in the accumulation of photosynthates [6]. Large amounts of water are needed for irrigated PTR production; for example, 1 kg of rice requires 2500 L of water: most of that water is subject to deep drainage and evaporation losses, compared to the lone 600 L necessary for1 kg of grain for maize crops [7].
The rising agricultural production in South Asia produces a lot of crop waste in extensive irrigated RW systems. Farmers frequently burn the leftovers in open areas because the main residue management depends on mechanization, and significantly less time is devoted to rice and wheat crops, and they lack alternate applications for rice residue. For instance, farmers burn over 16 million tonnes of rice straw per year in the Indian Punjab region alone, resulting in significant air pollution [8]. Additionally, adding rice straw produces low yields by delaying wheat seeding. Burning crop wastes also depletes nutrients, especially N, P, and S, and degrades organic matter [8]. Thus, air pollution would be significantly reduced and soil health would be increased through technologies that allow the retention of rice residues. A crucial agronomic technique to prevent moisture loss from the soil surface is mulching. In north-western India, Ref. [9] found that mulching effectively preserves soil moisture, leading to greater crop productivity and irrigation water productivity (IWP), and better soil conditions for the rice–wheat–summer moong cropping system. Recently, a new device known as the Happy Seeder has been developed to reduce rice straw waste. This device cuts the straw and distributes it evenly over the planted area, which benefits the soil [10]. As surface mulch, the rice straw can help improve the soil water status and control the soil temperature. This leads to better root growth, a larger crop canopy, higher wheat production, and increased water productivity [11,12,13]. Subsequent to the wheat harvest and before the following rice and maize crop is planted, a bare period of approximately 65–70 days is available. Farmers’ profits can be raised by growing quick-pulse crops in RW, MW, and SW systems for the fallow season, such as summer moong (Vigna radiata). According to prior study findings, CA-based agronomic management strategies can assist farmers in achieving high crop yields, conserving irrigation water, and boosting economic benefits [14,15]. The impact of a sustainable intensification cropping system on wheat production, productivity, and profitability is poorly understood. The current and upcoming cropping systems in the northwest IGP urgently require the improvement and adoption of reduced tillage technologies to lower cultivation costs and boost profitability. Consequently, the present study was carried out to assess the effects of CA-based sustainable systems of intensification (establishment of crop, management of residue, precision irrigation practices, and summer moong integration) on productivity, IWP, and profitability in the NW IGP using MW and SW systems as alternatives to RW systems.

2. Material Methods

2.1. Experiment Site

The current experimentation was performed at a new-area agronomy experiment farm, Punjab Agricultural University (PAU), Ludhiana. The investigation was carried out during Rabi 2018–19, but the actual treatments were imposed in Kharif 2019, considering Rabi and the summer season. Both crops were used as a zero cycle, ensuring that the establishment of crop, tillage, management of residues, nitrogen, and irrigation management effects are captured in first experimental rice crop. Six management scenarios involving different cropping systems were evaluated in a large plot size (189 m2; 18 m × 10.5 m) by adopting RCBD (randomized complete block design), a statistical design, through four replications. Ludhiana is sited at 30°54′ N, 75°48′ E and 247 m over mean sea level.

2.2. Experimental Treatments and Design

The farm experimentation was arranged in RCBD (randomized complete block design) for four replicates of every six cropping systems, treatments changing in sequence of crops, tillage, and management of residues. The summary of the particulars of the treatments are presented in Table 1. The experimental soils had a sandy loam texture and low levels of organic carbon (OC) and nitrogen, medium levels of phosphorus, and average potassium levels. The soil had a normal response with a pH of 7.31. The climate of the area is semi-arid and subtropical.

2.3. Agronomic Management of Crops

The experiment was started in Rabi, 2018–2019, and wheat and summer moong (SM) were adopted as zero-cycle crops. Before planting, dynamic pre-sowing heavy irrigation (75 mm) was conducted, as recommended by the suggested irrigation package for the crop. Subsequent crops also followed the same treatments. The wheat variety was PBW 725, developed by PAU Ludhiana, Punjab, released in 2015, with a mean plant height of 105 cm. It attains maturity in 154 days. It shows resistance against yellow as well as brown rust. This variety produces an average grain yield of 5.72 t ha−1. The crop geometry for wheat varies from method to method (conventional sowing seed rate 100 kg ha−1, raised bed sowing seed rate 75 kg ha−1). The irrigation for the conventional-till treatments was supplied at critical growth periods through the flood method and in permanent bed treatments supplied based on soil matric potential-based scheduling (−40 ± 1 kpa), respectively. Additionally, the wheat crop was treated with captan fungicide (3 kg ha−1) to protect it from fungal attacks. For both years, all crops were fertilized using the recommended dose of fertilizer (RDF). The full amounts of phosphorus, potassium, and zinc were applied when the crops were planted or transplanted. At the same time, the remaining nitrogen was top dressed in two or three equal splits, depending on the most sensitive stages of the crops. For the application of fertilizer in conventional-till plots (N:P2O5:K2O kg ha−1, Wheat—125:62.5:30 kg ha−1), and conservation-based plots (N:P2O5:K2O kg ha−1,Wheat—100:62.5:30 kg ha−1), the complete amount of phosphorus and potassium was used as the basal dose, and the application of nitrogen was 3 splits. The crop’s nitrogen dose was met through urea (46% N), while the phosphorus supply was made through DAP (46% P2O5). A pre-plant application of glyphosate 1.25 L ha−1 was conducted to control the permanent beds’ weeds and zero-till plots. The experimental plots’ weeds were restricted by using pre- and post-emergence weedicides in accordance with the standard approval. In the wheat plots, a tank mix-up solution of Clodinafopethyl + Metsulfuron (60 + 4 g ha−1) was used at 30–35 DAS to manage all categories of weeds. In the wheat crop, Imidacloprid 30.3% SL, an insecticide, was applied to prevent aphids (Lipophis erysimi) and jassids (Amrasca biguttula) at the milking stage during both years. All the suggested cultural operations excluding treatments were pursued for crop growing.

2.4. Details of Biometric Observations of Wheat

2.4.1. Plant Height, Tillers, and Biomass Accumulation

The number of tillers was counted from a section of one m2 randomly selected in all six scenarios, followed by calculating the average values articulated as the number of tillers per m2 at periodic growth stages. The dry weight accumulation of the crop plants was observed from four randomly chosen spots using a 0.5 m × 0.5 m quadrate in every scenario at periodic growth stages and harvest. The crops were harvested near the ground from each quadrate. The drawn samples were sun dried at first, followed by oven drying at 65 ± 5 °C until an unvarying weight was attained.

2.4.2. Yield Attributes (Effective Tillers, Number of Grains/Spike, Spike Length, Number of Filled Grains/Spike and Thousand Grain Weight)

During harvesting, the effective tillers (ear-/spike-bearing tillers) were mentioned for the area of one square meter from four spots in every treatment, averaged and articulated as effective tillers per m−2 area. Ten plants were chosen from every experimental unit for counting the total number of grains/spike, spike length (cm), and number of filled grains/spike, and their means were worked out. Subsequent to the process of drying and cleaning, test weight was noted in grams.

2.4.3. Crop Harvest, Yield Estimation, and Economics

Grain yield and straw yield were calculated by manual harvesting from three spots, a size of 2 m × 2.25 m (4.5 m2) in every experimental unit. The grain yield of wheat was tested at a grain moisture content of 12% by using Indosaw’s digital grain moisture meter (Model SH-6D), followed by weight conversion into q ha−1. To articulate the impact as a whole, a scenario of cropping system productivity was computed on a rice-equivalent yield (REY) basis for maize, soybean, wheat, and summer moong grain yields.
The system productivity ( q   ha 1 ) was calculated [8] based on REY using the following formulas [(1), (2), (3), and (4)]:
REY   of   Wheat   q   ha 1 = Wheat   yield   q   ha 1 ×   MSP   of   Wheat   Rs · q   ha 1 MSP   of   Rice   Rs · q   ha 1
REY   of   Maize   q   ha 1 = Maize   yield   q   ha 1 ×   MSP   of   Maize   Rs ·   q   ha 1 MSP   of   Rice   Rs ·   q   ha 1
REY   of   Summer   moong   q   ha 1 = Summer   moong   yield   q   ha 1 ×   MSP   of   Summer   moong   Rs ·   q   ha 1 MSP   of   Rice   Rs · q   ha 1
REY   of   Soybean   q   ha 1 = Soybean   yield   q   ha 1 ×   MSP   of   Soybean   Rs ·   q   ha 1 MSP   of   Rice   Rs · q   ha 1
where MSP: Minimum Support Price; India National Rupee.
Total   System   productivity   q   ha 1 = REY   of   Wheat +   REY   of   Maize +   REY   of   Summermoong +   REY   of   Soybean  
A common data collection format was used to capture the information on agronomic practices inputs for every crop, including the quantity of tillage operations, consumption of fuel, water appliance, weedicides, fertilizer, seed rate, labour use, and pesticide appliance, as well as their costs for every treatment. The overall production cost was determined by adding up all of these expenses. Gross returns were computed following the commodity’s (grains and straws/stovers) average market prices over the studied years. The whole cost of cultivation was subtracted from the gross returns to determine net returns. The B:C ratio was calculated as the ratio of net return to cost of cultivation.

2.5. Irrigation Water Management and Measurement of Soil Moisture

The irrigation water depth for wheat through every irrigation event was 75 mm for flat sowing and 50 mm for bed sowing. The amount of supplied irrigation water was computed considering water depth (mm/ha), and the irrigation water productivity (IWP) was calculated [14] as below (Equations (5) and (6)).
Irrigation   water   mm   ha a = Volume   of   irrigation   water   kilolitre   ha a 10
IWP   kg   grain   m 3 = Grain   yield   kg   ha a Irrigation   water   used   m 3   ha a
where:
1 ha-mm irrigation depth = 10 kL = 10,000 L = 10 m3.
Soil metric potential was recorded with the help of a gauge-type soil tensiometer which was placed at a distance of 5 m from the bund.

2.6. Statistical Analysis

The results of the experiments were statistically analysed in RCBD using statistical package SAS software [16]. The treatments were contrasted by the use of least statistical variation at a 5% level of probability. Tukey’s HSD test was employed to calculate the differences among treatment means.

3. Results

3.1. Effect of Sustainable Intensification of Cropping Systems (SICP) under Conservation Agriculture Practices on Growth Attributes

The growth characteristics of wheat crop in terms dry weight production and number of tillers was influenced significantly by different management practices (Figure 1). The growth characteristics observed at different periods were relatively greater under CA-based management practices (Sc2, Sc4, and Sc6) than in farmers’ practice (Sc1, Sc3, and Sc5) in both years of study. As compared to the zero-till wheat (Sc2) and permanent-bed wheat (Sc4 and Sc6) scenarios in both years, conventional-till wheat (CT-wheat) (Sc1) produced considerably less tillers. Under CA-based management approaches applied in scenario Sc6, more tillers and dry matter accumulation were discovered at all stages of crop growth over the two years of the study, and it was comparable to Sc4. In comparison to Sc1, Sc6 increased the number of tillers by 15.81% and 14.00% in the first and second years of maturity, respectively.

3.2. Effect of SICP on Yield Parameters of Wheat

The lowest numbers of tillers per m−2 was obtained in Sc1 for both years. Scenarios Sc6, Sc4, and Sc2 recorded higher effective tillers by 15.31, 9.99, and 7.12 per cent during first year and 14.64, 11.9, and 8.77 per cent during second year, in comparison with Sc1 (Table 2). In CA-dependent scenarios, the effective tillers were in descending order, Sc6 > Sc4 > Sc2, and the lowest was in the Sc1 scenario for both years. The number of grains per spike, spike length (cm), and 1000 grain weight (g) varied statistically, owing to the layering of different management practices through both seasons. Greater no. of grain spike−1 and spike lengths (cm) were produced under CA-based management scenarios (Sc2, Sc4, and Sc6), and lower values were produced under Sc1, Sc3, and Sc5, while the lowest no. of grain spike−1 and spike length (cm) were obtained in Sc1 for both years. At the harvesting time, differences among scenarios for yield attributes were significant in both years. In 2019–20, scenario Sc6 attained maximum effective tillers per m−2, number of grains per spike, spike length (cm), and 1000 grain weight (g), which were on par with Sc4 and Sc2 throughout both years, and significantly more than Sc1, Sc3, and Sc5. However, the difference between effective tillers per m−2, number of grains per spike, spike length (cm), and 1000 grain weight (g) attained by scenarios Sc6, Sc4, and Sc2 was notable. In 2020–21, scenario Sc6 attained maximum effective tillers per m−2, number of grains per spike, spike length (cm), and 1000 grain weight (g), which was on par with Sc4 and Sc2 except in no. of grains and 1000 grain weight for both years, and significantly more than Sc1, Sc3, and Sc5.

3.3. Effect of SICP on Crop Productivity

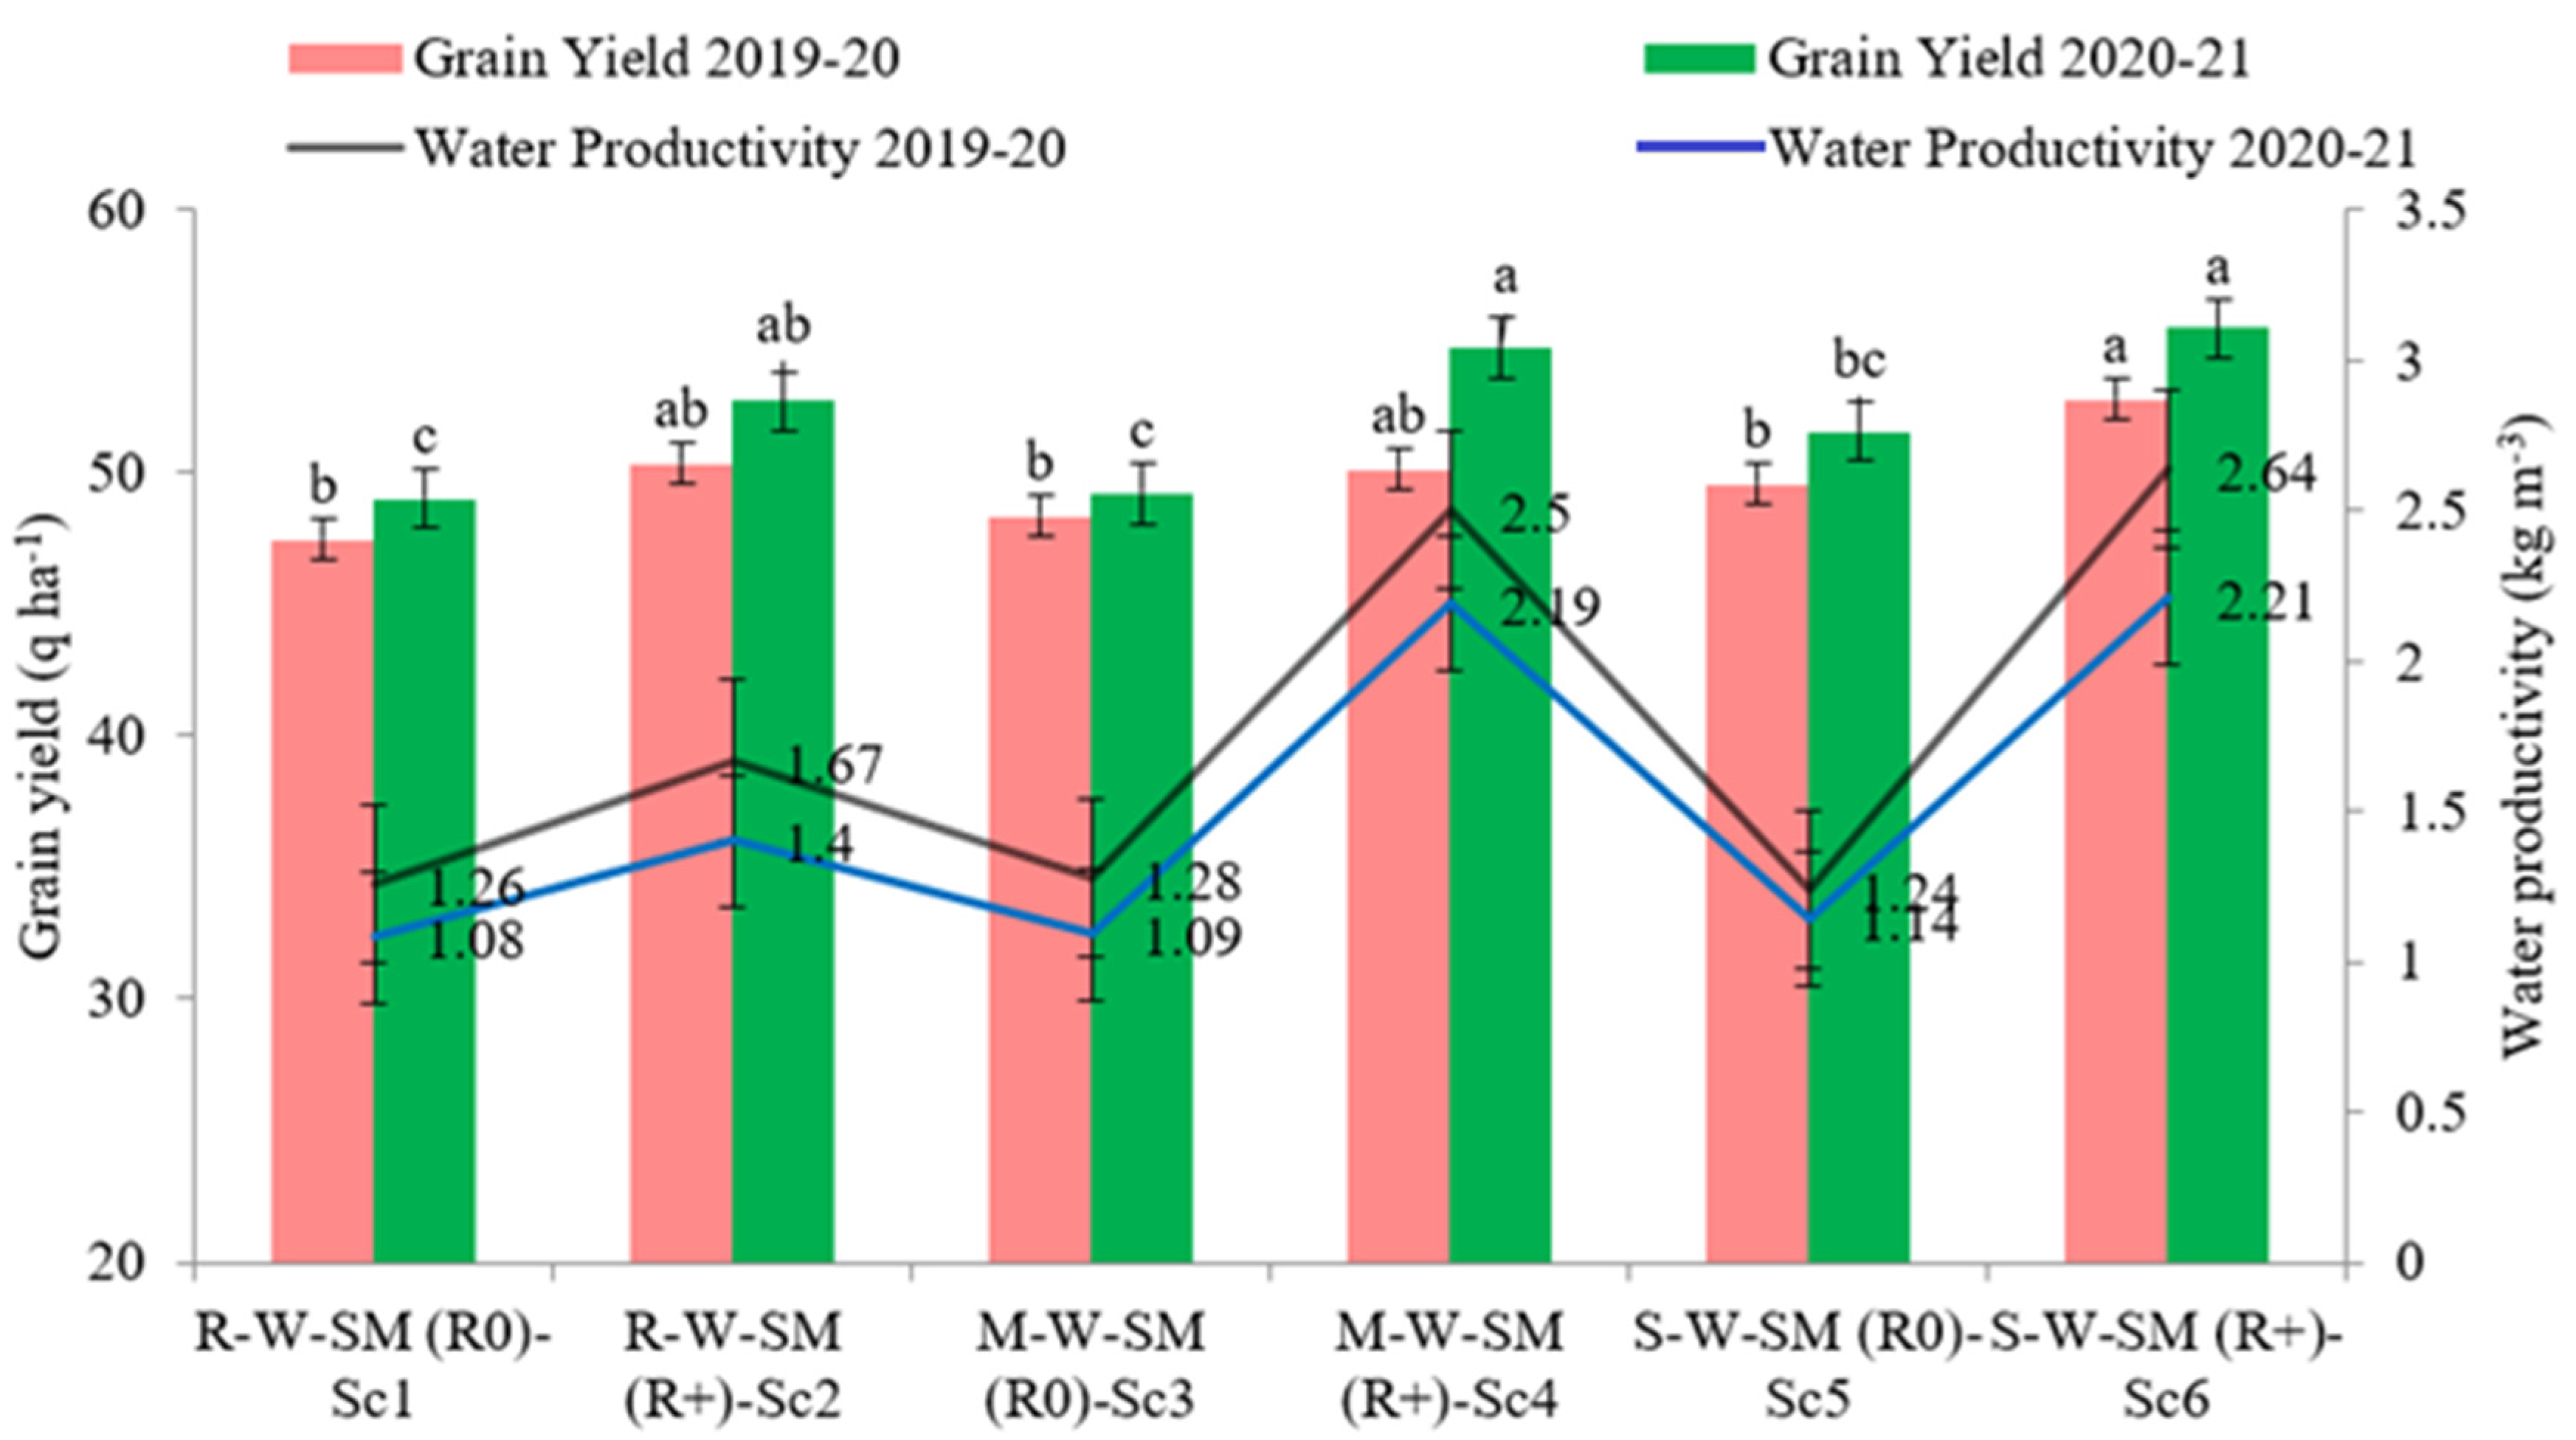
The outcomes illustrated that the yield of grains was lower in 2019–20 than in 2020–21 with the same agronomic management, except for weather conditions (Table 3). Scenarios Sc6, Sc4, and Sc2 produced 11.22, 5.58, and 6.06 per cent (during the first year) and 13.25, 11.78, and 7.65 per cent (during the second year) higher grain yields compared to Sc1 (47.4 and 48.9 q ha−1 for the first and second years, respectively). Similarly, CA-based soybean (scenario Sc6) and CA-based maize (scenario Sc4) produced 6.55 and 3.66 per cent greater grain yields in 2019–20 and 7.58 and 11.28 per cent greater grain yields in 2020–21 in comparison with farmers’ practice soybean–wheat–summer moong and maize–wheat–summer moong cropping systems (Sc5 and Sc3) in both years, respectively. Scenario Sc6 noted the highest yield among all the scenarios, and it was 11.22 per cent higher in the first year and 13.25 per cent higher in the second year compared to Sc1 (47.4 and 48.9 q ha−1).

3.4. Effect of SICP on Irrigation Water Applied and Irrigation Water Productivity (IWP) of Wheat

In wheat, scenarios Sc1, Sc3, and Sc5 received higher irrigation water depth compared to Sc2, Sc4, and Sc6 during both years. In R-W-SM, M-W-SM, and S-W-SM cropping systems, the irrigation water depth varied from 200 to 375 and 250 to 450 mm ha−1 for the first and second years (Table 3 and Figure 2). Scenario Sc6 saved 46.66 per cent (during the first year) and 44.44 per cent (during the second year) more water compared to Sc1 (375 and 450 mm ha−1 in the first and second years, respectively). Scenario Sc6 recorded 109.5 per cent higher IWP in the first year and 104.6 per cent greater IWP in the second year than Sc1.

3.5. Effect of SICP on Economics Profitability of Wheat

Different management practices resulted in statistical variations in the economics profitability of various scenarios in wheat for both years of experimentation (Table 3). Scenarios Sc1, Sc3, and Sc5 associated with conventional till (CT) wheat led to a higher cost of cultivation and lower net return than Sc2 (Happy Seeder wheat), Sc4, and Sc6 (both Sc4 and Sc6 were PB-wheat) in both years. In the first year, the cost of cultivation of Sc2 (Happy Seeder wheat), Sc4, and Sc6 (both Sc4 and Sc6 were PB-wheat) was lower than that of Sc1, Sc3, and Sc5 for both years. The highest benefit–cost ratio (B: C ratio) was noted under Sc2, Sc4, and Sc6 (2.18, 2.19, and 2.35 for the first year and 2.40, 2.53, and 2.59 for the second year) compared to Sc1, Sc3, and Sc5 for both years. The highest net returns from the R-W-SM, M-W-SM, and S-W-SM systems were recorded with Sc2, Sc4, and Sc6 (HS/PB + tensiometer) compared to conventional systems (CT).

3.6. Effect of SICP on Nutrient Uptake by Grain and Straw of Wheat

The nutrient uptake by the grain and straw of wheat crop was statistically affected by different management practices, which significantly differed in all management scenarios for both years (Table 4). Amongst various management practices, scenario Sc6 resulted in statistically more significant grain macronutrient uptake than scenario Sc1, which was significantly higher than Sc4, except for straw N content and K grain content for both years of study. The macronutrient uptake was greater in 2020–21 than in 2019–20. The CA scenarios resulted in a statistically greater uptake of available N, P, and K over conventional till for both years.

3.7. Principal Component Analysis (PCA)

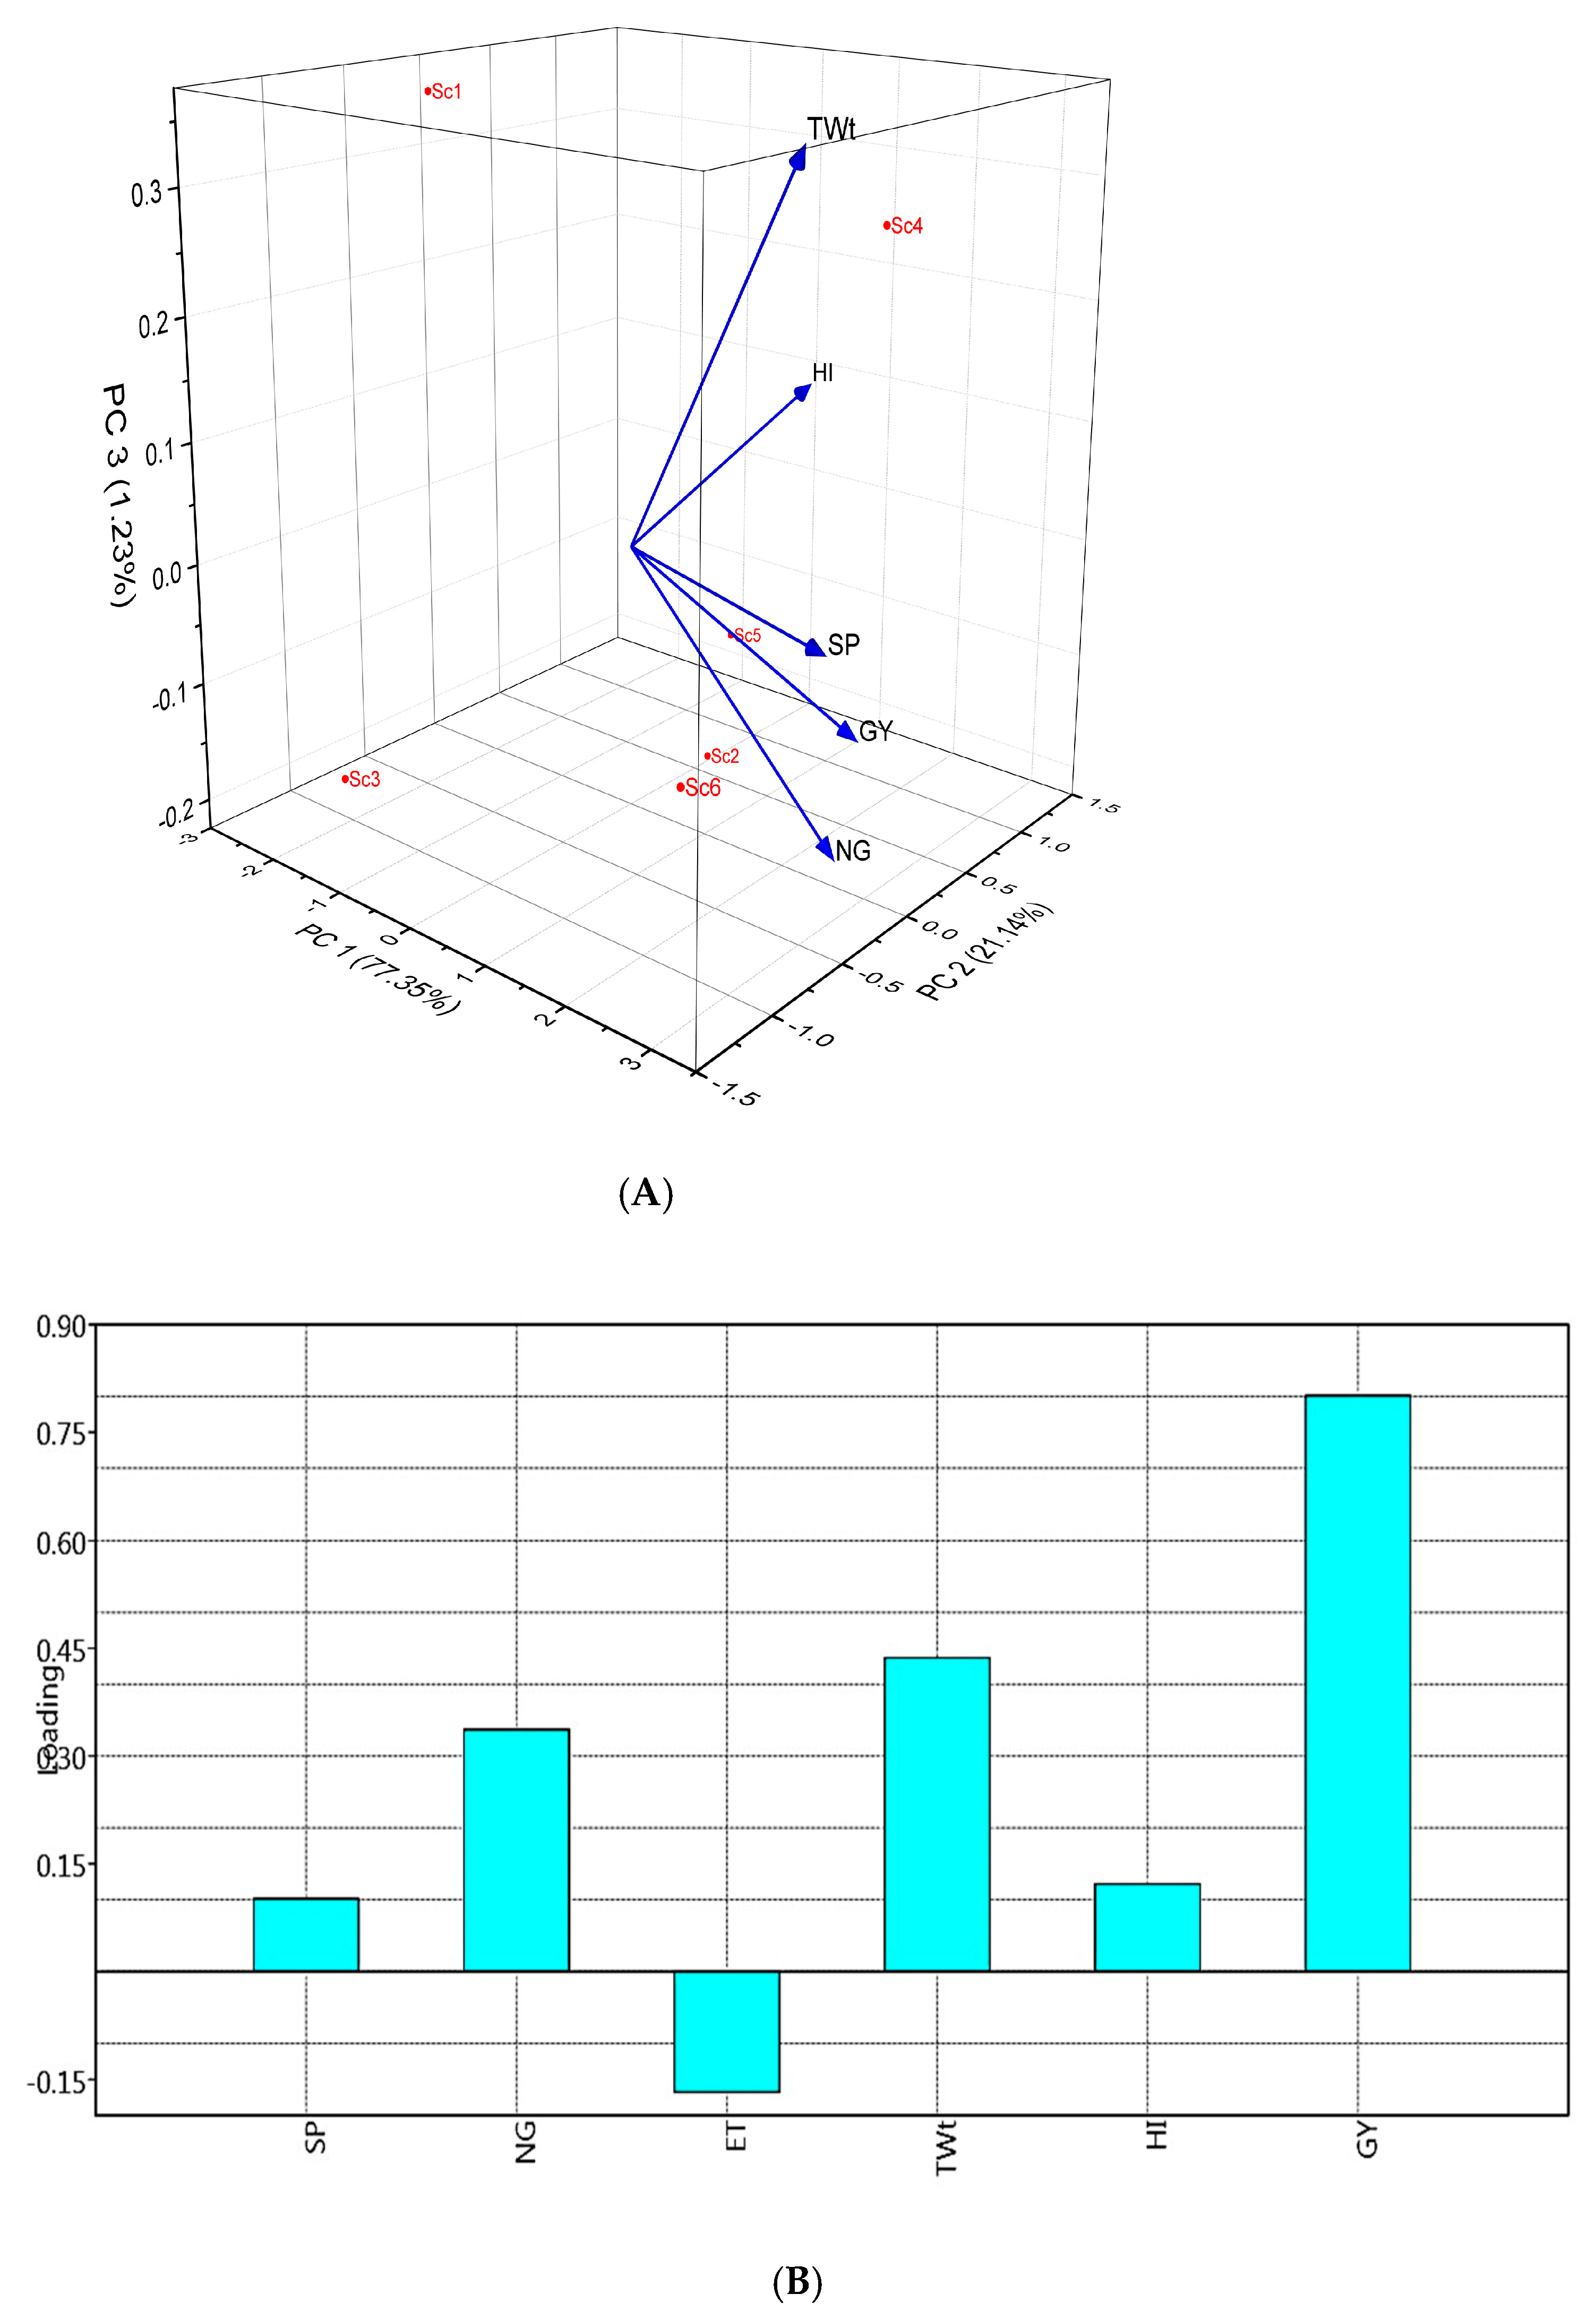
Only the variables from each PCA with high loading factors were chosen as the minimum datasets using the principal component analysis (PCA) technique. The parameters in PC1 produced loadings of roughly 77.35% based on PCA, which can be used as important markers for evaluating variances. The findings revealed a significant and favourable association between all of the variables, i.e., test weight, no. of grains/spike, grain yield, harvest index, and spike length; out of all of the variables, grain yield and no. of grains/spike contributed the most influence on the PCA. The PCA had the highest significance for scenario Sc6, followed by Sc2, compared to Sc1. The two principal constituents produced 77.35 and 21.14%, respectively, constituting 98.49% of the total variation for the five variables recorded in 2020–21 (Figure 3).

3.8. Total System Productivity Based on Rice Equivalent Yield

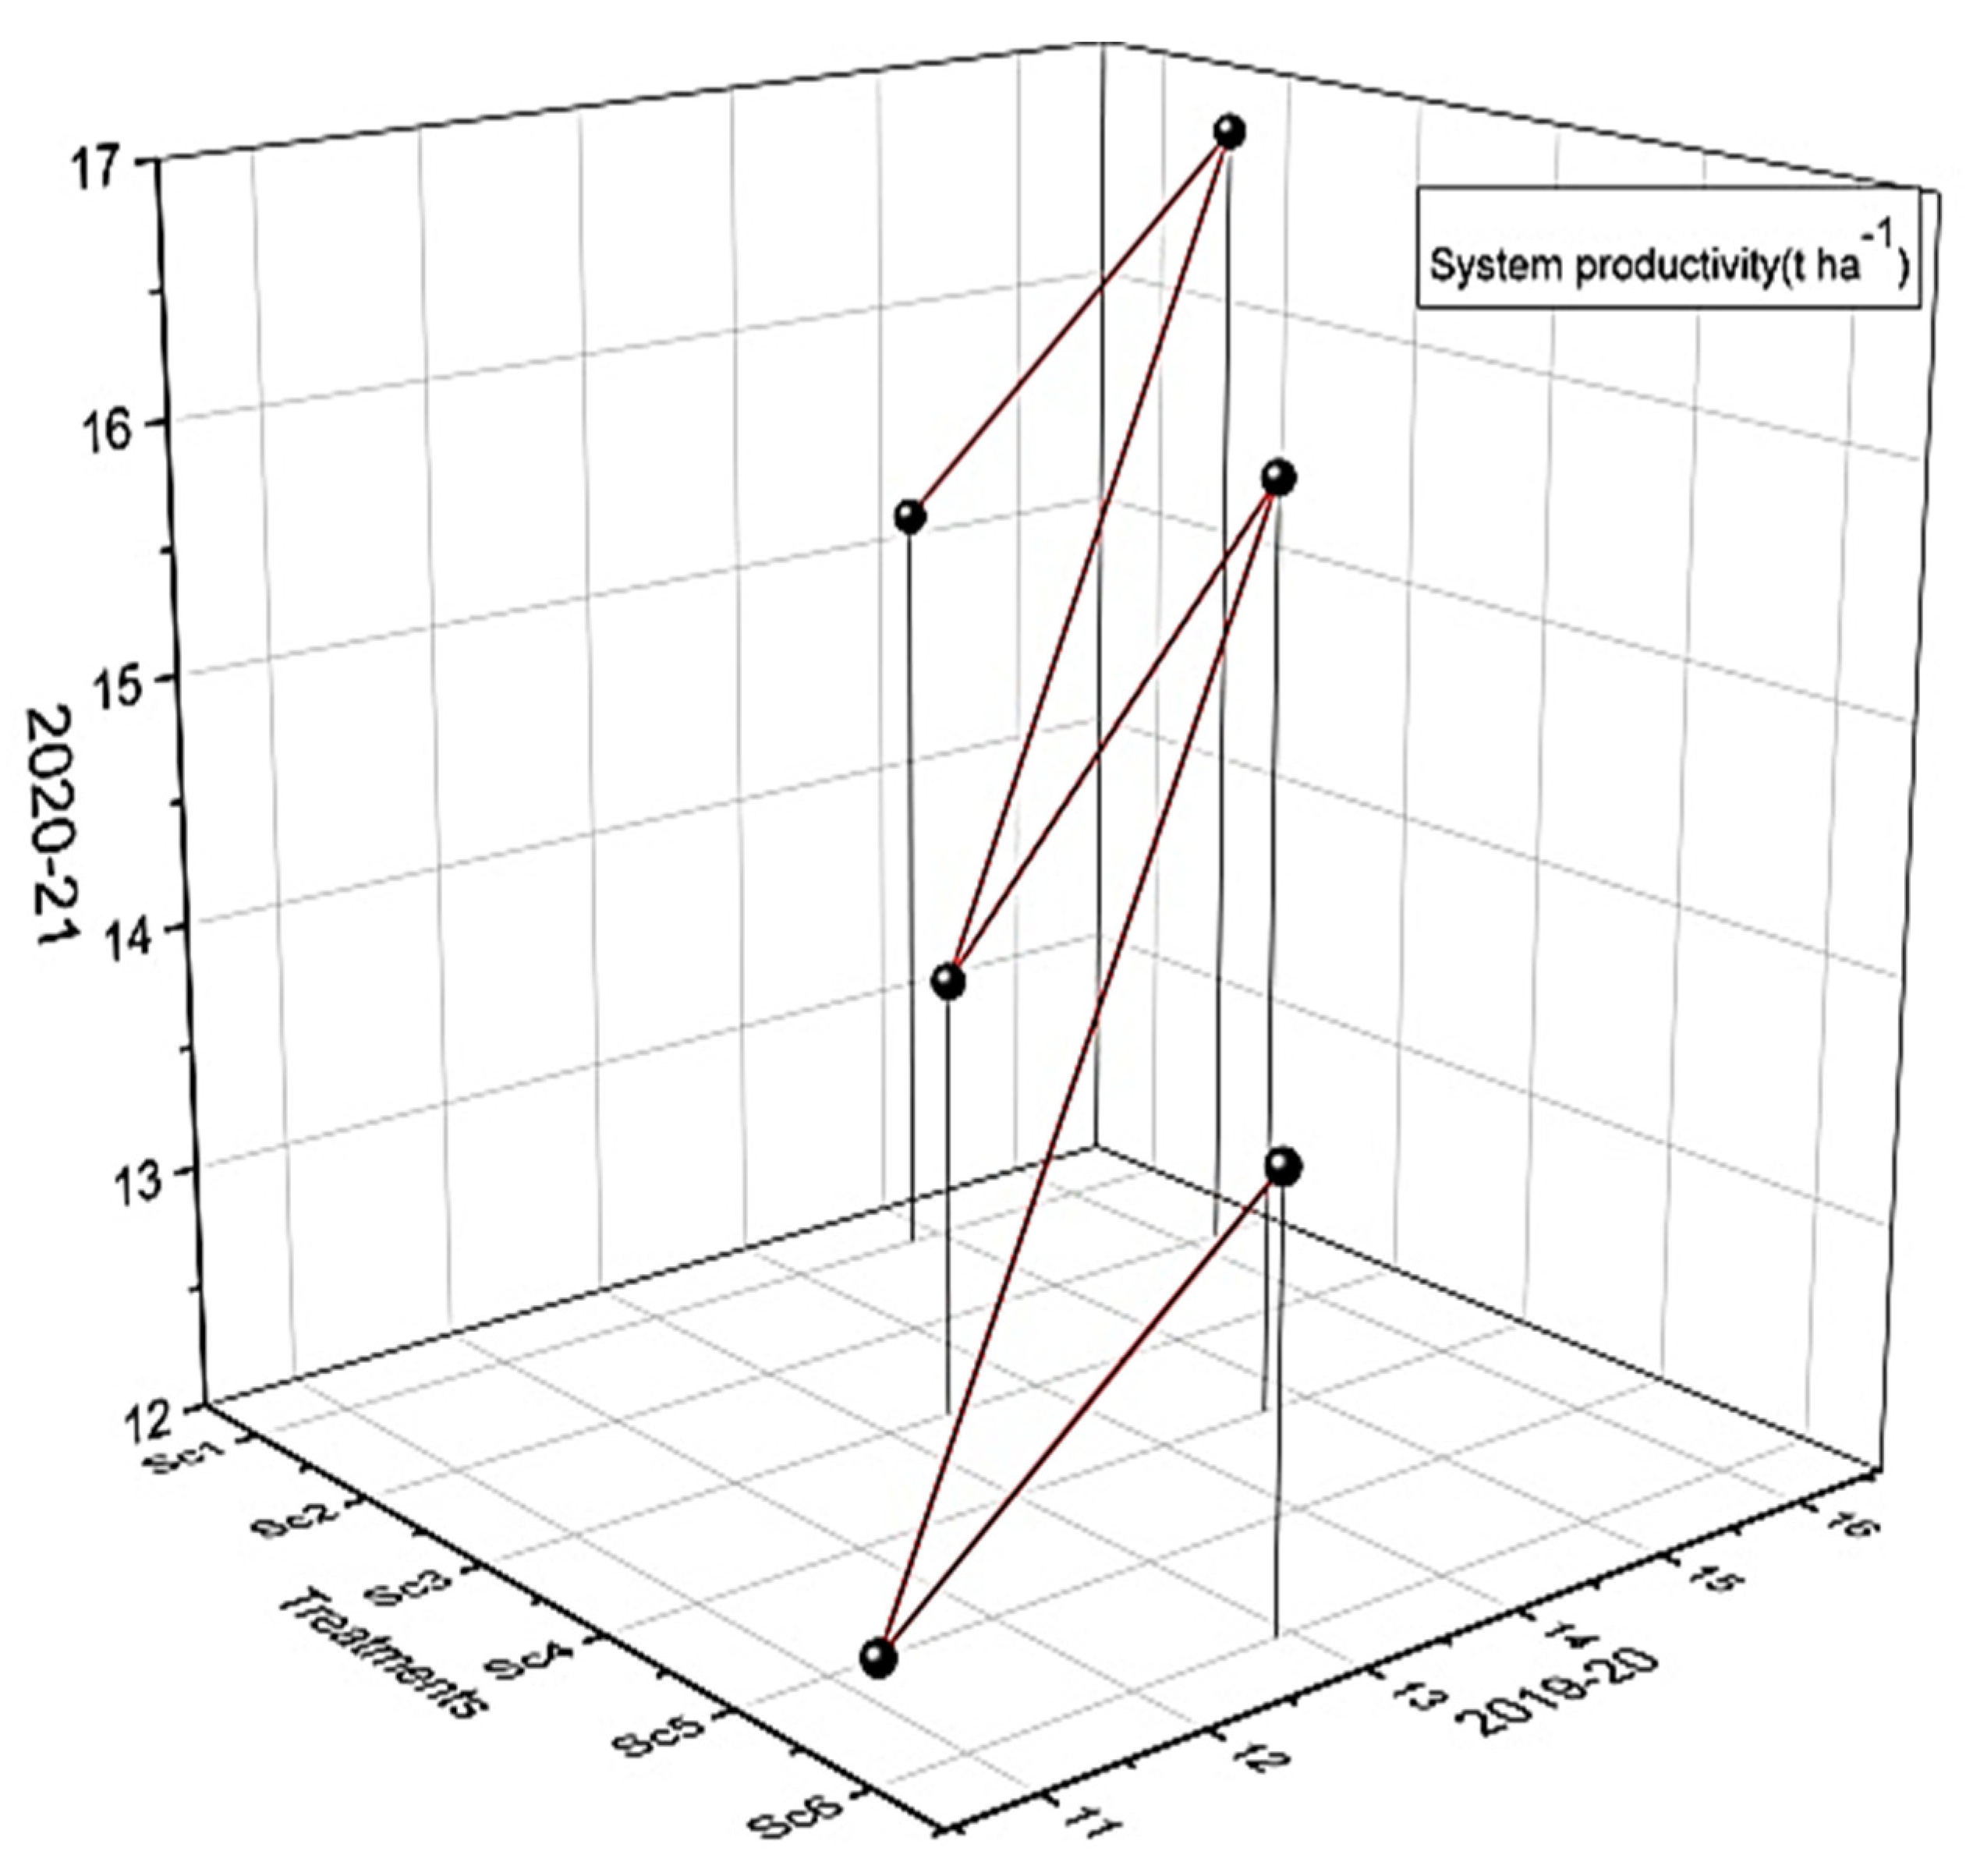
During the two experimental years, different scenarios with varied management techniques significantly increased the system productivity of the rice–wheat–summer moong, maize–wheat–summer moong, and soybean–wheat–summer moong cropping systems (Figure 4). In both years, the productivity of the R-W-SM, M-W-SM, and S-W-SM systems (rice equivalent yield) was higher in the CA-based scenarios (Sc2, Sc4, and Sc6) than in the farmers’ practice scenarios (Sc1, Sc3, and Sc5). In Sc2, Sc4, and Sc6, the system productivity increased in comparison to Sc1, Sc3, and Sc5 by 9.72, 9.65, and 14.14% in the first year and 10.68, 14.14, and 15.55% in the second year. Improved management techniques, accurate land levelling, efficient cultivars, effective crop establishment, precise water management, efficient weed control, and integration of summer moong crop production may all contribute to higher system productivity in CA-based scenarios.

4. Discussion

4.1. Effect of SICP on Growth Attributes

The growth characteristics observed in various periods were relatively greater under CA-based management practices (Sc2, Sc4, and Sc6) than farmers’ practice (Sc1, Sc3, and Sc5) during both years of study. This is attributed to precise input placement in the narrow space created by the zero-seed drill (ZSD), the early emergence and vigorous growth of wheat, and the availability of more soil moisture, all of which allowed the crops to perform better than the crops sown according to farmers’ practice. These outcomes are in agreement with those reported by [17]. Also, Ref. [18] reported improved growth parameters of wheat crop under ZT compared to CT. According to studies, shallow hard pans brought on by frequent wet tillage or puddling typically result in less root growth [19,20], which, in turn, causes less tillering and, ultimately, less grain yield. Moreover, Ref. [21] observed that permanent beds with residue outperformed no-residue beds under both zero-till and traditional till techniques in terms of plant height, dry matter accumulation, LAI, CGR, and RGR.

4.2. Effect of SICP on Yield Attributes

Generally, the values of these characteristics were greater in CA-dependent scenarios (Sc2, Sc4, and Sc6) than in farmers’ practice in R-W-SM, M-W-SM, and S-W-SM under conventional tillage in Sc1, Sc3, and Sc5. The cumulative effect of CA-based management practices over cropping cycles resulted in an enhancement in yield characteristics. The higher number of productive tillers, in conjunction with a higher number of total tillers, was likely due to an increase in the accumulation of photosynthetic products in the sink (i.e., the grain) as a result of improved growth and development and higher dry matter production, which was then translocated to reproductive plant parts [22,23]. The length of the spike, which indicates the number of spikelets, affects the number of grains. The ear’s differentiation and development depends upon the availability of carbohydrates during the early growth period when it competes with other tough sinks, such as tillers, leaves, and stems. The sink capacity of the grains is determined by the number of grains set and the growth characteristics of the individual grains. The increased length of the spikes may also have helped to increase the number of grains per spike. The precise use of inputs may have increased the grains per spike by preventing the degeneration of spikelets during grain development [24]. Conservation agriculture-based scenarios with the furrow irrigation method and irrigation applied based on a tensiometer (Sc6) further augmented the values of growth attributes, yield characteristics, and yields of wheat compared to farmers’ practice (Sc1, Sc3, and Sc5), which may be ascribed to the enhanced accessibility of the soil moisture, the modest temperature of the soil, and the enhanced fertility of the soil owing to the constant delivery of nutrients by the mineralization of crop residues [21]. A similar study was conducted by [23].

4.3. Effect on Irrigation Water Applied and Irrigation WP

In R-W-SM, M-W-SM, and S-W-SM cropping systems, the irrigation water depth varied from 200 to 375 and 250 to 450 mm ha−1 in first and second years. Scenario Sc6 recorded 109.5 per cent higher WPI during the first year and 104.6 per cent higher IWP for the second year over Sc1 due to the higher yield and frequently distributed rains. The greater water productivity (WPI and WPI + R) of wheat under the R-W-SM, M-W-SM, and S-W-SM rotations were recorded with CA scenarios compared to farmers’ practice due to lower water input and higher grain yield [3]. Full leftover retention in the ZT wheat-based system lowered water use by preserving soil moisture, decreasing evaporation losses, and reducing crop–weed competition due to the reduced population of weeds [14,23,25,26]. Surface residues have been shown to minimize evaporation losses and save soil moisture, resulting in wheat crops using less irrigation water [6,27]. Furrow irrigation had higher water productivity than flood irrigation owing to the exact management of irrigation water predicated on the tensiometer with furrow irrigation as opposed to flood irrigation [28], achieving comparable results in wheat crop irrigation and reporting lower water input with increased water productivity [8]. The greater IWP in residue-maintained plots compared to Sc1 and Sc4 plots could be due to a superior soil cover with residue, which may have reduced weed development [12] and also helped in soil moisture conservation, allowing the crop to remain available for more extended periods of time [25]. Similar findings were reported by [15], as they found that permanent raised beds consumed less irrigation water and resulted in higher water productivity and savings of 24.5 and 29.2%, respectively, compared to no-till flat systems.

4.4. Effect on Crop Productivity and Economic Profitability of Wheat

The grain yield was lower in 2019–20 than in 2020–21 with the same agronomic management except for weather conditions. Scenario Sc6 noted the highest yield among all the scenarios, and it was 11.22 per cent higher in first year and 13.25 per cent higher in second year than Sc1 (47.4 and 48.9 q ha−1). The increase in grain yield under conservation-based cropping systems was accompanied by a statistically significant increase in the number of grains/spike, spike length, and grain weight. Intensive tillage-based scenarios resulted in water stagnation over long periods, due to the formation of hardpans, leading to lower grain yield; however, such factors did not affect the grain yield under ZT scenarios [29,30]. The improved performance of wheat, followed by conservation agriculture-based rice with residue retention, can be attributed to better soil physical conditions [31,32] and high soil organic matter [26,33,34], which allowed for deeper root penetration and increased water and nutrient uptake. One of the chief advantages of the Happy Seeder technology is that it grants a substitute for rice residue management with its maintenance on the surface of the soil [10]. The higher net returns from RWSM, MWSM, and SWSM systems recorded with Sc2, Sc4, and Sc6 (HS/PB + tensiometer) compared to conventional systems (CT) were primarily due to the greater crop yields, avoiding tillage operations, and lower production cost of the PB system [35]. The lower production cost in the PB system was generally due to the lower costs of tillage, irrigation, and weeding [36].

4.5. Effect on Nutrient Uptake

Among the different management practices, scenario Sc6 was noted to have a more statistically significant grain macronutrient uptake than scenario Sc1, which itself had a significantly higher uptake than Sc4, except for straw N content and K grain content in both years of study. The CA scenarios resulted in statistically more N, P, and K uptake than the remaining scenarios for both years. The improvement as a whole in the growth of wheat crop was because of the residual impact of superior practices that may be due to their crucial function in enhancing numerous physiological [37,38] and biochemical activities, viz. root development, photosynthesis, and energy transformation (ATP and ADP) [39,40] resulting in the greater available N, P, and K uptake in CA-based management practices.

4.6. Principal Component Analysis (PCA)

Scenario Sc6 had the greatest levels of most of the evaluated variables, followed by scenarios Sc2 and Sc4 (Figure 3). All variables, including test weight, grains per spike, grain yield, harvest index, and spike length, were significantly and favourably correlated. Out of all the variables, grain yield and number of grains per spike were most strongly influenced by PCA. The PCA had the highest significance for scenario Sc6, followed by Sc2. These two principal components produced 77.35 and 21.14%, respectively, constituting 98.49% of the whole variations for the five variables recorded in 2020–21 (Figure 3). This indicates that the sustained incorporation of carbon sources through previous crop residue steadily increases microbial activity together with the accessibility of different microbe populations in the soil, nutrients, and rhizo deposits [17].

4.7. Effect on System Productivity

A higher system productivity in terms of rice equivalent yield was recorded for CA-based scenarios (Sc2, Sc4, and Sc6) compared to farmers’ practice (Sc1, Sc3, and Sc5) in both years. The system productivity was increased by 9.72, 9.65, and 14.14% during the first year and 10.68, 14.14, and 15.55% during the second year in Sc2, Sc4, and Sc6, respectively, compared to Sc1, Sc3, and Sc5. The higher system productivity in CA-based scenarios might be due to the improved management practices, precise land levelling, efficient cultivar, proper crop establishment, precise water management [41], efficient weed management, and integration of summer moong crop [14,15]. Several other studies [42,43,44] have found that zero-till and permanent-bed methods produce larger profits than traditional tilling in maize–wheat, soybean–wheat, and rice–wheat cropping systems.
Although the results from this study may not be conclusive, they can still provide valuable insights into the potential impacts of these practices. We suggest that conventional-till cropping systems could be replaced with permanent-bed planting systems to maximize crop productivity, profitability, and sustainability. However, more studies are needed to evaluate the integration of summer moong in the sustainable intensification of wheat-based cropping systems under conservation agriculture.

5. Conclusions

Sustainable intensification cropping systems through conservation agriculture (CA)-based cropping systems are able to address pressing agricultural concerns, boost farm revenue, and ensure the ecological and human health of smallholder farming systems in South Asia. Our research showed that, when compared to CT-based rice–wheat–summer moong systems, sustainable intensification cropping systems with CA-based management optimized the boosted yield, irrigation water productivity, profitability, and nutrient uptake. The wheat crop in the agriculture-based scenarios S-W-SM (R+)—Sc6, M-W-SM (R+)—Sc4, and R-W-SM (R+)—Sc2 produced 11.22, 5.58, and 6.06 per cent (during the first year) and 13.25, 11.78, and 7.65 per cent (during the second year) higher grain yields compared to R-W-SM (R0)—Sc1. The irrigation water productivity (WPI) scenario S-W-SM (R+)—Sc6 recorded 109.5 and 104.6 per cent higher WPI for the first year and second year in comparison to R-W-SM (R0)—Sc1 (farmers’ practice puddled transplanted rice (PTR)–conventional-till wheat–summer moong). In comparison, the system productivity increased in scenarios Sc2, Sc4, and Sc6 (by 9.72, 9.65, and 14.14% in the first year and 10.68, 14.14, and 15.55% in the second year) compared to Sc1, Sc3, and Sc5 (farmers’ customary practice), based on the agro-ecological attributes, i.e., productivity, economic viability, conservation of natural resources, and resource use efficiency. The soybean–wheat–summer moong system on permanent beds was determined to be the most effective production cropping system.
Furthermore, in order to solve resource use efficiency, nutrition, productivity, economic, and environmental challenges in the region, evidence for the long-term impact of the sustainable intensification of cropping systems under conservation agriculture practices must be researched in different soil type locations and cropping systems. Undoubtedly, such a study should not only be extended over time, but also repeated in various agro-ecologies.

Author Contributions

Writing—original draft preparation, A.K. and K.S.S.; Conceptualization, K.S.S. and A.K.; Methodology, K.S.S. and A.K.; Supervision, P.K. and K.S.S.; Formal analysis, A.K.; Software, A.K., K.D., Y.S.B., M.Y. and H.D.; Data validation, H.D., R.K., A.C., S.K. and D.M. All authors have read and agreed to the published version of the manuscript.

Funding

This research received no external funding.

Institutional Review Board Statement

Not applicable.

Informed Consent Statement

Not applicable.

Data Availability Statement

Data are available on request.

Acknowledgments

The authors thank the anonymous reviewers for their thorough reading and corrections. The Punjab Agricultural University in Ludhiana, India, and the Department of Science and Technology (DST) in New Delhi, India, both provided the resources needed to conduct these investigations, for which the authors are thankful.

Conflicts of Interest

The authors declare no conflict of interest.

References

  1. Gupta, R.; Seth, A. A review of resource conserving technologies for sustainable management of the rice-wheat cropping systems of the Indo-Gangetic plains (IGP). Crop Prot. 2007, 26, 436–447. [Google Scholar] [CrossRef]
  2. Ladha, J.K.; Pathak, H.; Tirol-Padre, A.; Dawe, D.; Gupta, R.K. Productivity trends in intensive rice-wheat cropping systems in Asia. In Improving the Productivity and Sustainability of Rice-Wheat Systems: Issues and Impacts; Ladha, J.K., Hill, J.E., Duxbury, J.M., Gupta, R.K., Buresh, R.J., Eds.; American Society of Agronomy: Madison, WI, USA, 2003; Volume 65, pp. 45–76. [Google Scholar]
  3. Hira, G.S. Water management in northern states and the food security of India. J. Crop Improv. 2009, 23, 136–157. [Google Scholar] [CrossRef]
  4. Rodell, M.; Velicogna, I.; Famiglietti, J.S. Satellite-based estimates of groundwater depletion in India. Nature 2009, 460, 999–1002. [Google Scholar] [CrossRef] [PubMed][Green Version]
  5. Bijay-Singh; Shan, Y.H.; Johnson-Beebout, S.E.; Yadvinder-Singh; Buresh, R.J.; Donald, L.S. Crop residue management for lowland rice-based cropping systems in Asia. Adv. Agron. 2008, 98, 117–199. [Google Scholar]
  6. Kumar, A.; Sharma, D.K.; Sharma, H.C. Response of wheat (Triticum aestivum) to irrigation and nitrogen in sodic soils. Ind. J. Agron. 1995, 40, 38–42. [Google Scholar]
  7. Bouman, B.A.M.; Peng, S.B.; Castañeda, A.R.; Visperas, R.M. Yield and water use of irrigated tropical aerobic rice systems. Agric. Water Manag. 2005, 74, 87–105. [Google Scholar] [CrossRef]
  8. Yadvinder-Singh; Sidhu, H.S.; Manpreet-Singh; Humphreys, E.; Kukal, S.S.; Brar, N.K. Straw mulch, irrigation water and fertiliser N management effects on yield, water use and N use efficiency of wheat sown after rice. In Permanent Beds and Rice-Residue Management for Rice–Wheat Systems in the Indo-Gangetic Plain, Proceedings of a Workshop Held at PAU, Ludhiana, India, 7–9 September 2006; ACIAR Proceedings No. 127; Humphreys, E., Roth, C.H., Eds.; Australian Centre for International Agricultural Research: Canberra, ACT, Australia, 2008; pp. 171–181. [Google Scholar]
  9. Kumar, A.; Saini, K.S. Conservation agriculture effects on root traits, productivity and profitability of rice in Rice-Wheat-Summer moong cropping system. AMA-Agric. Mech. Asia Afr. Lat. Am. 2022, 53, 5245–5254. [Google Scholar]
  10. Sidhu, H.S.; Singh, M.; Humphreys, E.; Singh, Y.; Singh, B.; Dhillon, S.S.; Blackwel, J.; Bector, V.; Singh, M.; Singh, S. The Happy seeder enables direct drilling of wheat into rice stubble. Aust. J. Exp. Agric. 2007, 47, 844–854. [Google Scholar] [CrossRef][Green Version]
  11. Li, F.M.; Wang, P.; Wang, J.; Xu, Z.J. Effects of irrigation before sowing and plastic film mulching on yield and water uptake of spring wheat in semi-arid Loess Plateau of China. Agric. Water Manag. 2004, 67, 77–88. [Google Scholar] [CrossRef]
  12. Balwinder-Singh; Humphreys, E.; Eberbacha, P.L.; Katupitiya, A.; Yadvinder-Singh; Kukal, S.S. Growth, yield and water productivity of zero till wheat as affected by rice straw mulch and irrigation schedule. Field Crops Res. 2011, 121, 209–225. [Google Scholar] [CrossRef]
  13. Chakraborty, D.; Garg, R.N.; Tomar, R.K.; Singh, R.; Sharma, S.K.; Singh, R.K.; Trivedi, S.M.; Mittal, R.B.; Sharma, P.K.; Kamble, K.H. Synthetic and organic mulching and nitrogen effect on winter wheat (Triticum aestivum) in a semi-arid environment. Agric. Water Manag. 2010, 97, 738–748. [Google Scholar] [CrossRef]
  14. Gathala, M.K.; Kumar, V.; Sharma, P.C.; Saharawat, Y.S.; Jat, H.S.; Singh, M.; Kumar, A.; Jat, M.L.; Humphreys, E.; Sharma, D.K.; et al. Optimizing intensive cereal-based cropping systems addressing current and future drivers of agricultural change in the North-Western Indo-Gangetic Plains of India. Agric. Ecosyst. Environ. 2013, 177, 85–97. [Google Scholar] [CrossRef]
  15. Jat, H.S.; Gurbachan, S.; Singh, R.; Choudhary, M.; Jat, M.L.; Gathala, M.K.; Sharma, D.K. Management influence on maize-wheat system performance, water productivity and soil biology. Soil Use Manag. 2015, 31, 534–543. [Google Scholar] [CrossRef]
  16. SAS Institute Inc. SAS/STAT® 9.4 Interface to North Carolina State University-SFA-T: Reference; SAS Institute Inc.: Cary, NC, USA, 2013. [Google Scholar]
  17. Bera, T.S.; Sharma, S.; Thind, H.S.; Singh, Y.; Sidhu, H.S.; Jat, M.L. Soil biochemical changes at different wheat growth stages in response to conservation agriculture practices in rice-wheat system of north-western India. Soil Res. 2017, 56, 91–104. [Google Scholar] [CrossRef]
  18. Gupta, D.K.; Bhatiaa, A.; Kumar, A.; Das, T.K.; Jain, N.; Tomar, R.; Sandeep, K.M.; Fagodiy, R.K.; Dubey, R.; Pathak, H. Mitigation of greenhouse gas emission from rice-wheat system of the Indo-Gangetic plains: Through tillage, irrigation and fertilizer management. Agric. Ecosyst. Environ. 2016, 230, 1–9. [Google Scholar] [CrossRef]
  19. Saharawat, Y.S.; Singh, B.; Malik, R.K.; Ladha, J.K.; Gathala, M.; Jat, M.L.; Kumar, V. Evaluation of alternative tillage and crop establishment methods in a rice-wheat rotation in North Western IGP. Field Crops Res. 2010, 116, 260–267. [Google Scholar] [CrossRef]
  20. Gathala, M.K.; Ladha, J.K.; Saharawat, Y.S.; Kumar, V.; Kumar, V.; Sharma, P.K. Effect of tillage and crop establishment methods on physical properties of a medium-textured soil under a seven-year rice-wheat rotation. Soil Sci. Soc. Am. J. 2011, 75, 1851–1862. [Google Scholar] [CrossRef]
  21. Ram, H. Micro-Environment and Productivity of Maize-Wheat and Soybean-Wheat Sequences in Relation to Tillage and Planting Systems. Ph.D. Dissertation, Punjab Agricultural University, Ludiana, Punjab, India, 2006. [Google Scholar]
  22. Kumar, V.; Saharawa, Y.S.; Gathala, M.K.; Jat, A.S.; Singh, S.K.; Chaudhary, N.; Jat, M.L. Effect of different tillage and seeding methods on energy use efficiency and productivity of wheat in Indo-Gangetic plains. Field Crops Res. 2013, 142, 1–8. [Google Scholar] [CrossRef]
  23. Kumar, A.; Saini, K.S.; Rolaniya, L.K.; Singh, L.K.; Kaushik, P. Root System Architecture and Symbiotic Parameters of Summer Mung Bean (Vigna radiata) under Different Conservation Agriculture Practices. Sustainability 2022, 14, 3901. [Google Scholar] [CrossRef]
  24. Reddy, A.S.; Bhardwaj, R.B.L. Effect of nitrogen and phosphorus on growth and yield of wheat under limited and adequate irrigation. Indian J. Agron. 1984, 29, 505–509. [Google Scholar]
  25. Erenstein, O.; Laxmi, V. Zero tillage impacts in India’s R-W systems: A review. Soil Tillage Res. 2008, 100, 1–14. [Google Scholar] [CrossRef]
  26. Sidhu, H.S.; Singh, M.; Singh, Y.; Blackwell, J.; Lohan, S.K.; Humphreys, E.; Jat, M.L.; Singh, V.; Singh, S. Development and evaluation of the Turbo Happy Seeder for sowing wheat into heavy rice residues in NW India. Field Crops Res. 2015, 184, 201–212. [Google Scholar] [CrossRef]
  27. Ram, H.; Singh, Y.; Saini, K.S.; Kler, D.S.; Timsina, J.; Humphreys, E. Tillage and planting methods effects on yield, water use efficiency and profitability of soybean–wheat system on a loamy sand soil. Exp. Agric. 2013, 48, 1–19. [Google Scholar]
  28. Sidhu, H.S.; Jat, M.L.; Singh, Y.; Sidhu, R.K.; Gupta, N.; Singh, P.; Singh, P.; Jat, H.S.; Gerard, B. Sub-surface drip fertigation with conservation agriculture in a rice-wheat system: A breakthrough for addressing water and nitrogen use efficiency. Agric. Water Manag. 2019, 216, 273–283. [Google Scholar] [CrossRef]
  29. Kakraliya, S.K.; Sutaliya, J.M.; Singh, L.K.; Singh, I.; Jat, H.S.; Jat, M.L. Developing portfolios of climate smart agriculture practices for a rice-wheat cropping system in Western Indo-Gangetic plains of South Asia. In Proceedings of the 4th International Agronomy Congress, New Delhi, India, 22–26 November 2016; Volume 1, pp. 88–89. [Google Scholar]
  30. Aryal, J.P.; Sapkota, T.B.; Stirling, C.M.; Jat, M.L.; Jat, H.S.; Rai, M.; Mittal, S.; Sutaliya, J.M. Conservation agriculture-based wheat production better copes with extreme climate events than conventional tillage-based systems: A case of untimely excess rainfall in Haryana, India. Agric. Ecosyst. Environ. 2016, 233, 325–335. [Google Scholar] [CrossRef]
  31. Jat, R.K.; Sapkota, T.B.; Singh, R.G.; Jat, M.L.; Kumar, M.; Gupta, R.K. Seven years of conservation agriculture in a rice–wheat rotation of Eastern Gangetic Plains of South Asia: Yield trends and economic profitability. Field Crop Res. 2014, 164, 199–210. [Google Scholar] [CrossRef]
  32. Farooq, M.; Nawaz, A. Weed dynamics and productivity of wheat in conventional and conservation rice-based cropping systems. Soil Tillage Res. 2014, 141, 1–9. [Google Scholar] [CrossRef]
  33. Saharawat, Y.S.; Ladha, J.K.; Pathak, H.; Gathala, M.; Chaudhary, N.; Jat, M.L. Simulation of resource-conserving technologies on productivity, income and greenhouse gas (GHG) emission in rice-wheat system. J. Soil Sci. Environ. 2012, 3, 9–22. [Google Scholar]
  34. Busari, M.A.; Kukal, S.S.; Kaur, A.; Bhatt, R.; Dulazi, A.A. Conservation tillage impacts on soil, crop and the environment. Int. Soil Water Conser. Res. 2015, 3, 119–129. [Google Scholar] [CrossRef][Green Version]
  35. Malik, R.K.; Yadav, A.; Singh, S. Resource conservation technologies for maintaining health of natural resources in ricewheat cropping system. In Proceedings of the Workshop on Sustaining Agriculture: Problems and Prospects, November 2004; Punjab Agricultural University: Ludhiana, India, 2004; pp. 9–11. [Google Scholar]
  36. Sayre, K.D.; Moreno-Ramos, O.H. Applications of Raised-Bed Planting Systems to Wheat; International Wheat Special Report; CIMMYT: Mexico City, Mexico, 1997; Volume 31, p. 28. [Google Scholar]
  37. Bijarniya, D.; Parihar, C.M.; Jat, R.K.; Kalvania, K.; Kakraliya, S.K.; Jat, M.L. Portfolios of climate smart agriculture practices in smallholder Rice-Wheat systemof eastern Indo-Gangetic Plains-crop productivity, Resource Use Efficiency and Environmental Foot Prints. Agronomy 2020, 10, 1561. [Google Scholar] [CrossRef]
  38. Sapkota, T.B.; Majumdar, K.; Jat, M.L.; Kumara, A.; Bishnoi, D.K.; McDonaldd, A.J.; Pampolino, M. Precision nutrient management in conservation agriculture based wheat production of Northwest India: Profitability, nutrient use efficiency and environmental footprint. Field Crops Res. 2014, 155, 233–244. [Google Scholar] [CrossRef]
  39. Seema, S.; Singh, D.K.; Pandey, P.C. Productivity and economic of aerobic rice and soil bulk density under conservation tillage. Am. Int. J. Res. Form. Appl. Nat. Sci. 2015, 9, 36–40. [Google Scholar]
  40. Choudhary, K.M. Diversification with Sustainable Intensification Options for Cereal Systems of Western Indo-Gangetic Plains through Conservation Agriculture and Water Management. Ph.D. Thesis, Department of Agronomy, CCS HAU, Hisar, India, 2016. [Google Scholar]
  41. Jat, M.L.; Gathala, M.K.; Ladha, J.K.; Saharawat, Y.S.; Jat, A.S.; Kumar, V.; Sharma, S.K.; Kumar, V.; Gupta, R. Evaluation of precision land leveling and double zerotill systems in the rice–wheat rotation: Water use productivity, profitability and soil physical properties. Soil Tillage Res. 2009, 105, 112–121. [Google Scholar] [CrossRef]
  42. Choudhary, R.; Singh, P.; Sidhu, H.S.; Nandal, D.P.; Jat, H.S.; Singh, Y.; Jat, M.L. Evaluation of tillage and crop establishment methods integrated with relay seeding of wheat and Mungbean for sustainable intensification of cotton-wheat system in South Asia. Field Crops Res. 2016, 199, 31–41. [Google Scholar] [CrossRef]
  43. Jat, R.K.; Bijarniya, D.; Kakraliya, S.K.; Sapkota, T.S.; Kakraliya, M.; Jat, M.L. Precision Nutrient Rates and Placement in Conservation Maize-Wheat System: Effects on Crop Productivity, Profitability, Nutrient-Use Efficiency, and Environmental Footprints. Agronomy 2021, 11, 2320. [Google Scholar] [CrossRef]
  44. Gora, M.K.; Kumar, S.; Jat, H.S.; Kakraliya, S.K.; Choudhary, M.; Dhaka, A.K.; Jat, R.D.; Kakraliya, M.; Sharma, P.C.; Jat, M.L. Scalable diversifcation options delivers sustainable and nutritious food in Indo-Gangetic plains. Sci. Rep. 2022, 12, 14371. [Google Scholar] [CrossRef]
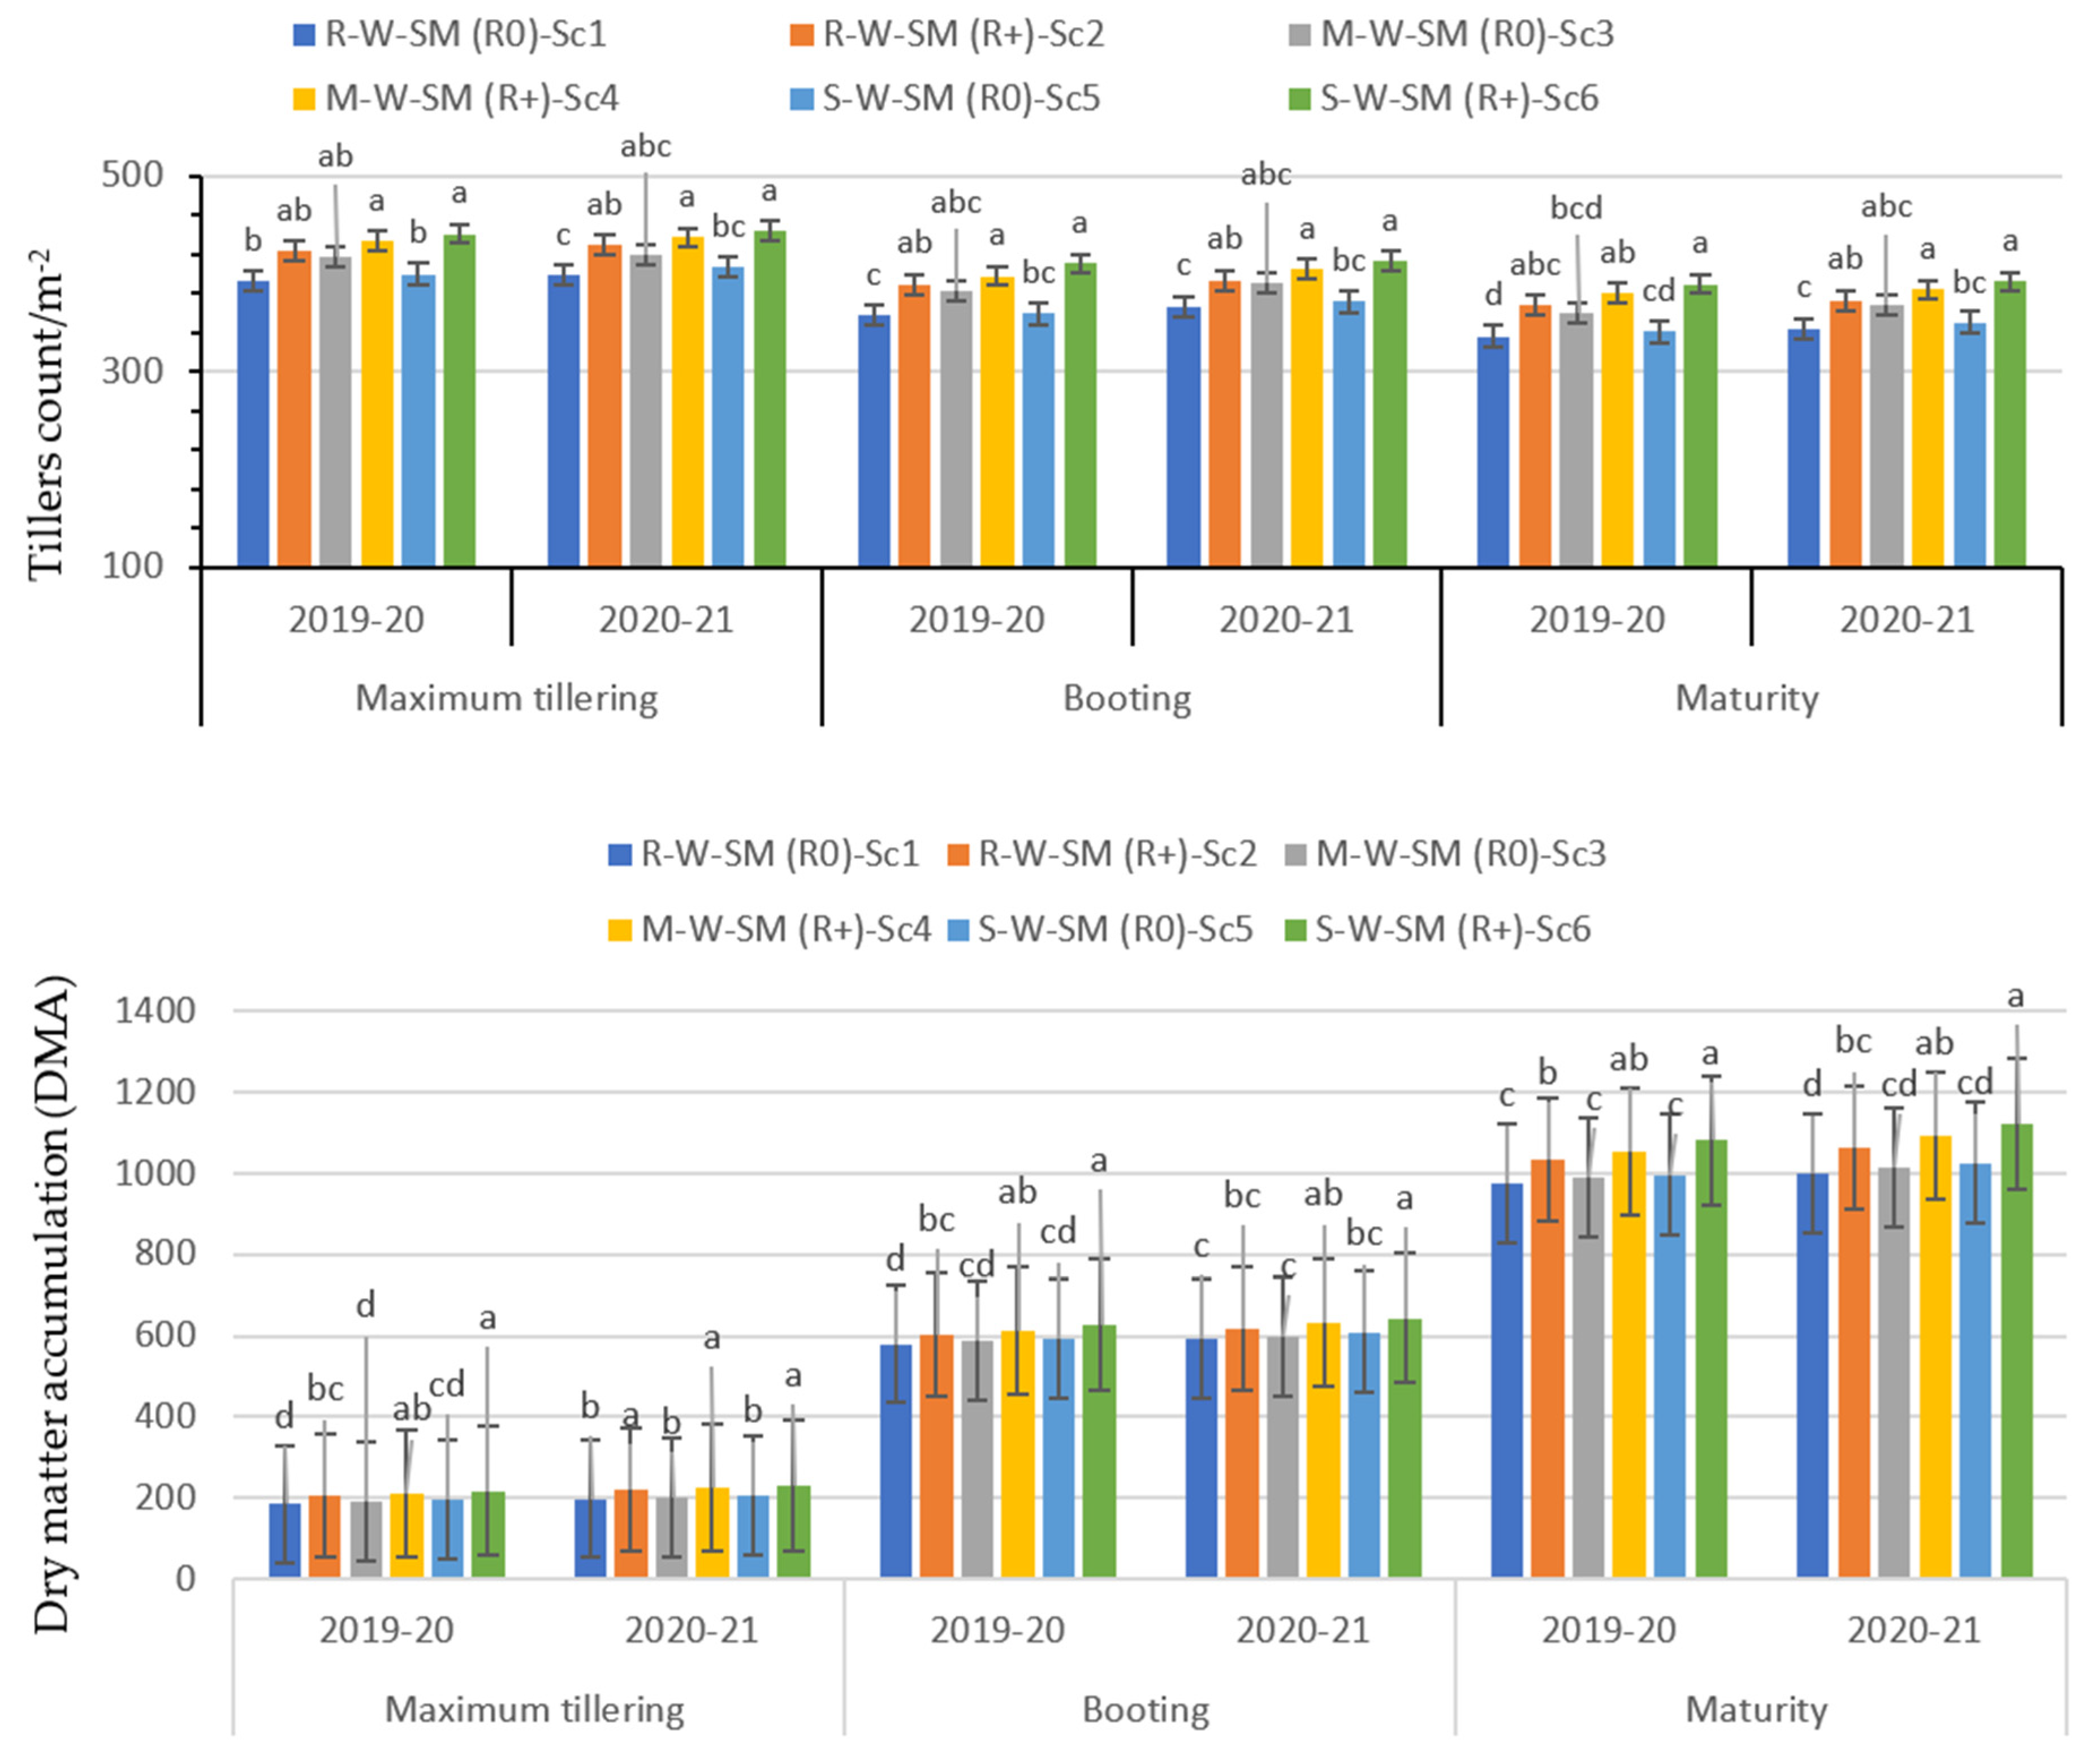
Figure 1. Effect of different CA and CT management practices on tillers count per m−2 and dry matter accumulation of wheat in R/M/S-W-SM cropping systems. Note: MS = maturity stage, BS = booting stage, MTS = maximum tillering stages. Note: Using Tukey’s HSD test, similar lowercase letters within a column in a year do not indicate any statistical difference at the 0.05 level of probability.
Sustainability 15 07468 g001
Figure 2. Effect of different CA (conservation agriculture) and CT (conventional till) management practices on grain yield and irrigation water productivity (IWP) of wheat in R/M/S-W-SM cropping systems. The blue line shows that the irrigation water productivity (IWP) of wheat in 2020–21. Using Tukey’s HSD test, similar lowercase letters within a column in a given year do not indicate any statistically significant difference at the 0.05 level of probability.
Sustainability 15 07468 g002
Figure 3. Principal component analysis after completing cropping systems cycle (2020–21). Note: Sc1 = farmers’ practice puddled rice (PR)–CT wheat–summer moong) (R0 or complete removal of residues), Sc2 = partial CA PR–HS wheat–zero-till summer moong (ZT) (R+ or retention of residues on the soil surface), Sc3 = farmers’ practice fresh-bed maize (FB)–CT wheat–summer moong (R0), Sc4 = full CA permanent-bed maize (PB)–wheat (PB)–summer moong (PB) (R+), Sc5 = farmers’ practice soybean (FB)–wheat (CT)–summer moong (R0), and Sc6 = full CA soybean (PB)–wheat (PB)–summer moong (PB) (R+). Image (A) and (B): PCA of different treatments with yield attributes of wheat; Twt = test weight, SP = spike length, GY = grain yield, NG = no. of grains/spike, HI = harvest index, HS = Happy Seeder, CT = conventional till.
Sustainability 15 07468 g003
Figure 4. Influences of different CA and CT management practices on system productivity of different cropping systems in both years. This is 3D graph of total system productivity and these lines show the total system productivity of different scenarios. The highest total systems (rice equivalents) productivity was recorded in Sc2 (16.8 t ha−1) followed by Sc4 (15.8 t ha−1) and lowest in Sc5 (12.0 t ha−1).
Sustainability 15 07468 g004
Table 1. Details of the experiment.
ScenarioCropping SystemResidue Management
Kharif/Rabi/Zaid
Irrigation ManagementNutrient Requirement
R/M/SWSM
R-W-SM (R0)-Sc1Farmers’ practice puddled transplanted rice (PTR) —conventional—till wheat—summer moongAll residues removedRecommended PracticeFarmers’ fertilizer practice
R-W-SM (R+)-Sc2Partial CA puddled transplanted rice—Happy Seeder wheat—zero-till summer moong (ZT)20–25% wheat residue—100% SM residue—100% rice residue20 ± 1 kpa
40 ± 1 kpa
40 ± 1 kpa
80%RDF + N management with green seeker
M-W-SM (R0)-Sc3Farmers’ practice fresh-bed maize (FB) —conventional-till wheat—summer moongAll residues removedRecommended PracticeState fertilizer recommended
practice
M-W-SM (R+)-Sc4Full CA permanent-bed maize (PB) —permanent-bed wheat (PB) —permanent-bed summer moong (PB)20–25% wheat residue—100% SM residue—50–60% maize residue50 ± 1 kpa
40 ± 1 kpa
40 ± 1 kpa
80%RDF + N management with green seeker
S-W-SM (R0)-Sc5Farmers’ practice fresh-bed soybean (FB) —conventional-till wheat (CT) —summer moongAll residues removedRecommended
Practice
State fertilizer recommendedpractice
S-W-SM (R+)-Sc6Full CA permanent—bed soybean (PB) —permanent-bed wheat(PB) —permanent-bed summer moong (PB)20–25% wheat residue—100% SM residue—100% soybean50 ± 1 kpa
40 ± 1 kpa
40 ± 1 kpa
80%RDF + N management with green seeker
Irrigation at 20 ± 1 kpa in PTR, 50 ± 1 kpa in maize/soybean, 40 ± 1 kpa in wheat and summer moong; CA = conservation agriculture.
Table 2. Effect of different CA and CT management practices on yield and yield attributes of wheat in R/M/S-W-SM cropping systems.
ScenarioSpike Length (cm)Number of Grains/SpikeEffective Tillers
(m−2)
1000 Grain wt. (g)Harvest Index
(%)
2019–202020–212019–202020–212019–202020–212019–202020–212019–202020–21
R-W-SM (R0)-Sc18.9b9.2c46.0b47.0b321.3d329.2c38.6c39.9b38.639.0
R-W-SM (R+)-Sc29.4ab9.7bc47.2ab49.0ab344.2bcd358.1ab39.1bc40.7b38.839.3
M-W-SM (R0)-Sc39.2b9.4c47.7ab48.0ab335.5ab353.9abc38.7c40.0b38.938.7
M-W-SM (R+)-Sc49.9a10.2ab48.5a50.5a353.4abc368.5a40.3b43.8a37.739.4
S-W-SM (R0)-Sc59.2b9.5c48.7a48.6ab325.9cd335.4bc39.0bc39.8b39.239.5
S-W-SM (R+)-Sc610.0a10.4a49.2a51.0a370.5a377.4a42.6a44.6a38.538.8
Using Tukey’s HSD test, similar lowercase letters within a column in a given year do not indicate any statistically significant difference at the 0.05 level of probability.
Table 3. Effect of different CA and CT management practices on grain yield, IWP, and economics of wheat in R/M/S-W-SM cropping systems.
ScenarioGrain Yield
(q ha−1)
IWP
(kg Grain m−3)
Net Return
(Rs. ha−1)
B:C Ratio
2019–202020–212019–202020–212019–202020–212019–202020–21
R-W-SM (R0)-Sc147.4b48.9c1.26d1.08c72,56580,2471.841.93
R-W-SM (R+)-Sc250.3ab52.7ab1.67c1.40b75,95686,6142.182.40
M-W-SM (R0)-Sc348.3b49.2c1.28d1.09c74,28281,0451.881.95
M-W-SM (R+)-Sc450.1ab54.7a2.50b2.19a76,28491,3312.192.53
S-W-SM (R0)-Sc549.5b51.5bc1.24d1.14c76,85286,0151.952.07
S-W-SM (R+)-Sc652.8a55.4a2.64a2.21a81,62493,4082.352.59
Using Tukey’s HSD test, similar lowercase letters within a column in a given year do not indicate any statistically significant difference at the 0.05 level of probability.
Table 4. Effect of various CA and CT management practices on nitrogen, phosphorus, and potassium uptake by grain and straw of wheat in R/M/S-W-SM cropping systems.
ScenarioNitrogen Uptake
(kg ha−1)
Phosphorus Uptake
(kg ha−1)
Potassium Uptake
(kg ha−1)
GrainStrawGrainStrawGrainStraw
2019–202020–212019–202020–212019–202020–212019–202020–212019–202020–212019–202020–21
R-W-SM (R0)-Sc180.9d84.24c35.5e35.2d16.3c17.1e3.9d4.1d20.9c22.0de122.3d124.9d
R-W-SM (R+)-Sc287.5ab91.75b41.2c39.0c17.8b18.9c4.3c4.5c22.7b25.3c129.1bc133.9c
M-W-SM (R0)-Sc382.2cd84.1c37.1de36.5d16.1c16.7e4.0d4.2d19.8d21.2e122.0d124.3d
M-W-SM (R+)-Sc487.2b96.4a43.7b42.2b18.0b20.8b4.6b4.9b23.1b27.4b135.3ab140.9b
S-W-SM (R0)-Sc585.8bc89.7b38.4d38.5c16.4c18.0d3.9d4.1d22.8b22.7d122.9cd126.6d
S-W-Sm (R+)-Sc691.7a98.2a45.5a44.5a20.1a22.2a4.9a5.2a25.3a28.8a139.9a148.3a
Using Tukey’s HSD test, similar lowercase letters within a column in a given year do not indicate any statistically significant difference at the 0.05 level of probability.
Disclaimer/Publisher’s Note: The statements, opinions and data contained in all publications are solely those of the individual author(s) and contributor(s) and not of MDPI and/or the editor(s). MDPI and/or the editor(s) disclaim responsibility for any injury to people or property resulting from any ideas, methods, instructions or products referred to in the content.