Article

A Novel Rectangular-Section Combined Beam of Welded Thin-Walled H-Shape Steel/Camphor Pine Wood: The Bending Performance Study

1
Department of Civil Engineering, Lanzhou University of Technology, Lanzhou 730050, China
2
Western Engineering Research Center of Disaster Mitigation in Civil Engineering Ministry of Education, Lanzhou 730050, China
3
China Construction First Construction Group Co., Ltd., Shanghai 201103, China
*
Author to whom correspondence should be addressed.
Sustainability 2023, 15(9), 7450; https://doi.org/10.3390/su15097450
Submission received: 21 February 2023 / Revised: 26 April 2023 / Accepted: 27 April 2023 / Published: 30 April 2023
(This article belongs to the Special Issue Sustainable Structures and Construction in Civil Engineering)

Abstract

:
At present, the development of green building materials is imminent. Traditional wood structures show low strength and are easy to crack. Steel structures are also prone to instability. A novel rectangular-section composite beam from the welded thin-walled H-shape steel/camphor pine was proposed in this work. The force deformation, section strain distribution law, and damage mechanism of the combined beam were studied to optimize the composite beam design, clarify the stress characteristics, present a more reasonable and more efficient cross-section design, and promote green and environmental protection techniques. Furthermore, the effect of different factors such as steel yield strength, H-type steel web thickness, H-type steel web height, H-type steel flange thickness, H-type steel upper flange covered-board thickness, and combined beam width was investigated. The ABAQUS simulation with the finite element software was also performed and was verified through empirical experiments. According to the results: (1) the damage process of the composite beam was divided into three steps, namely elastic stage, elastic–plastic step, and destruction stage, and the cross-middle section strain met the flat section assumption; (2) additionally, the bond connection was reliable, the two deformations were consistent, and the effect of the combination was significant. The study of the main factors showed that an increase in the yield strength, the H-type steel web height, the steel H-beam upper flange thickness, and the combined beam width caused a significant enhancement in the bending bearing capacity. The combined beam led to high bending stiffness, high bending bearing capacity, and good ductility under bending.

1. Introduction

The gradual shortage of limited resources and energy has become more and more serious due to the rapid development of urbanization and industrialization. Traditional reinforced concrete buildings need to dismantle after the structure expiration, which inevitably produces a large amount of construction waste. The improper disposal of construction waste can cause environmental pollution, low efficiency of construction waste recovery, and difficulties in construction waste recovery. The discovery of a solution to manage construction waste has converted into an urgent problem. Nowadays, human societies search for green environmental protection, energy saving, ecology, and health [1,2,3,4,5,6,7,8]. Because of the need for development in the construction industry, world research for steel–wood combinations has gradually increased. Borri et al. [9] performed 21 double-shear tests to reinforce the bent wood beams and study the ductility, stiffness, and strength response of reinforcement wood beams. Nadir et al. [10] performed the bending tests on carbon fiber and glass fiber paste wood composite beams and concluded that the bending stiffness of the wood beam can be significantly improved, and the bending bearing capacity calculation formula was deduced. Hassanieh et al. [11] investigated the short-term behaviour of innovative steel-timber composite (STC) floors comprising cross-laminated timber panels connected to steel girders by various mechanical fasteners and/or glue. The results of four-point bending tests performed on full-scale STC beams are reported and the structural behaviour of the proposed STC system is studied. Shekarchi et al. [12] performed a three-point bending test on 20 strengthened beams and four un-strengthened (control) beams to investigate the bending performance of the squeezed glass fiber reinforced polymer. Tohid et al. [13] investigated the bending and shear strengths of lightweight composite I-beams made of timber. The result of both experiments and simulation confirmed the carrying capacity of the I-beam beam is greatly improved. Dar [14] performed the bending test on a rectangular thin-walled steel box and wood-filled composite beam and concluded the composite beam showed good bending performance. Pan et al. [15] investigated a new structural cantilever member bolted by steel cores and wood. Moreover, an analytical model of the cantilever members was developed using ANSYS. The result of both experiments and simulation confirmed the desired mechanical properties of the new cantilever members. Fujita et al. [16] performed the bending tests on steel and wood composite and concluded that the fracture of the composite occurred because of the initial crack at the outer edge of the wood on the tensile side of the member. Hassanieh et al. [17] performed four-point bending tests on seven steel-timber composite (STC) beams to investigate the load–deflection curve, stiffness diagram, maximum load curve, and failure mode of STC beams. McConnell et al. [18] carried out four-point bending tests on unreinforced, reinforced, and post-tensioned glulam timber beams. Compared with the unreinforced beam, the bending strength and stiffness of the reinforced beam and the post-tensioned beam improved. Lee Teng-hui [19] proposed a new type of steel–wood composite beam and studied its bending performance and theoretical analysis. Li Yushun et al. [20] investigated the bonding stress and slip distribution of steel–bamboo interface, the interface of two types of steel and bamboo plate is designed, and the calculation method of the interface bearing capacity under short-term load is proposed. Chen Aiguo et al. [21] proposed a new type of steel–wood composite beam was presented and the bending performance test of 9 steel–wood composite beams was conducted. The results show that H-shaped steel and wood boards have good overall working performance and significant combination effects. Wu [22] discussed the ultimate bending stiffness and the ultimate bending bearing capacity of the combined beam of inner-filled square thin-walled rectangular steel pipe. Zhang Yi et al. [23] took the bolt spacing and shear span ratio as the essential factor to conduct the bending test of the I-type combined beam under the action of a concentrated load. The results showed that the bending stiffness of the combined beam increased by 201%. Liu Degui et al. [24] proposed a built-in thin-walled H-shape steel–wood combination beam. The bending test was carried out with the width of the flange board, the bolt spacing, the thickness of the thin wall steel H-beam, the thickness of the flange board, and the height and the thickness of the board at the web. The results represented that the H-shape steel improved the bending bearing capacity, bending stiffness, energy consumption, and combined beam ductility. Zhang et al. [25] performed a hollow glulam beam design with stiffening plates in a hollow rectangular cross-section with high flexural behaviour and stability. To increase the carrying capacity, the bottom of the beam was reinforced with a fiber-reinforced polymer. The results show that the bearing capacity of reinforced glulam beams is slightly improved.
According to the literature review, a new type of rectangular-section combination beam from welded thin-walled steel H-beam/camphor pine was studied. The combination beam of three thin-walled steel plates was welded into an H-type skeleton by argon arc. The sides of the upper flange and web were covered with pine wood using strong epoxy resin AB glue in the rectangular section combination beam. The section of this combined beam is shown in Figure 1.
The green ecological steel–wood composite beam combines the advantages of wood and steel, and the advantages of the two materials are complementary. The coordinated work not only plays the optimal performance of the two materials, but also resists various stresses with reasonable division of labor, enhances the strength of the structure, and extends the span. In addition, both materials are renewable resources, showing their advantages of sustainable development, and can be widely used in green buildings.

2. Materials and Methods

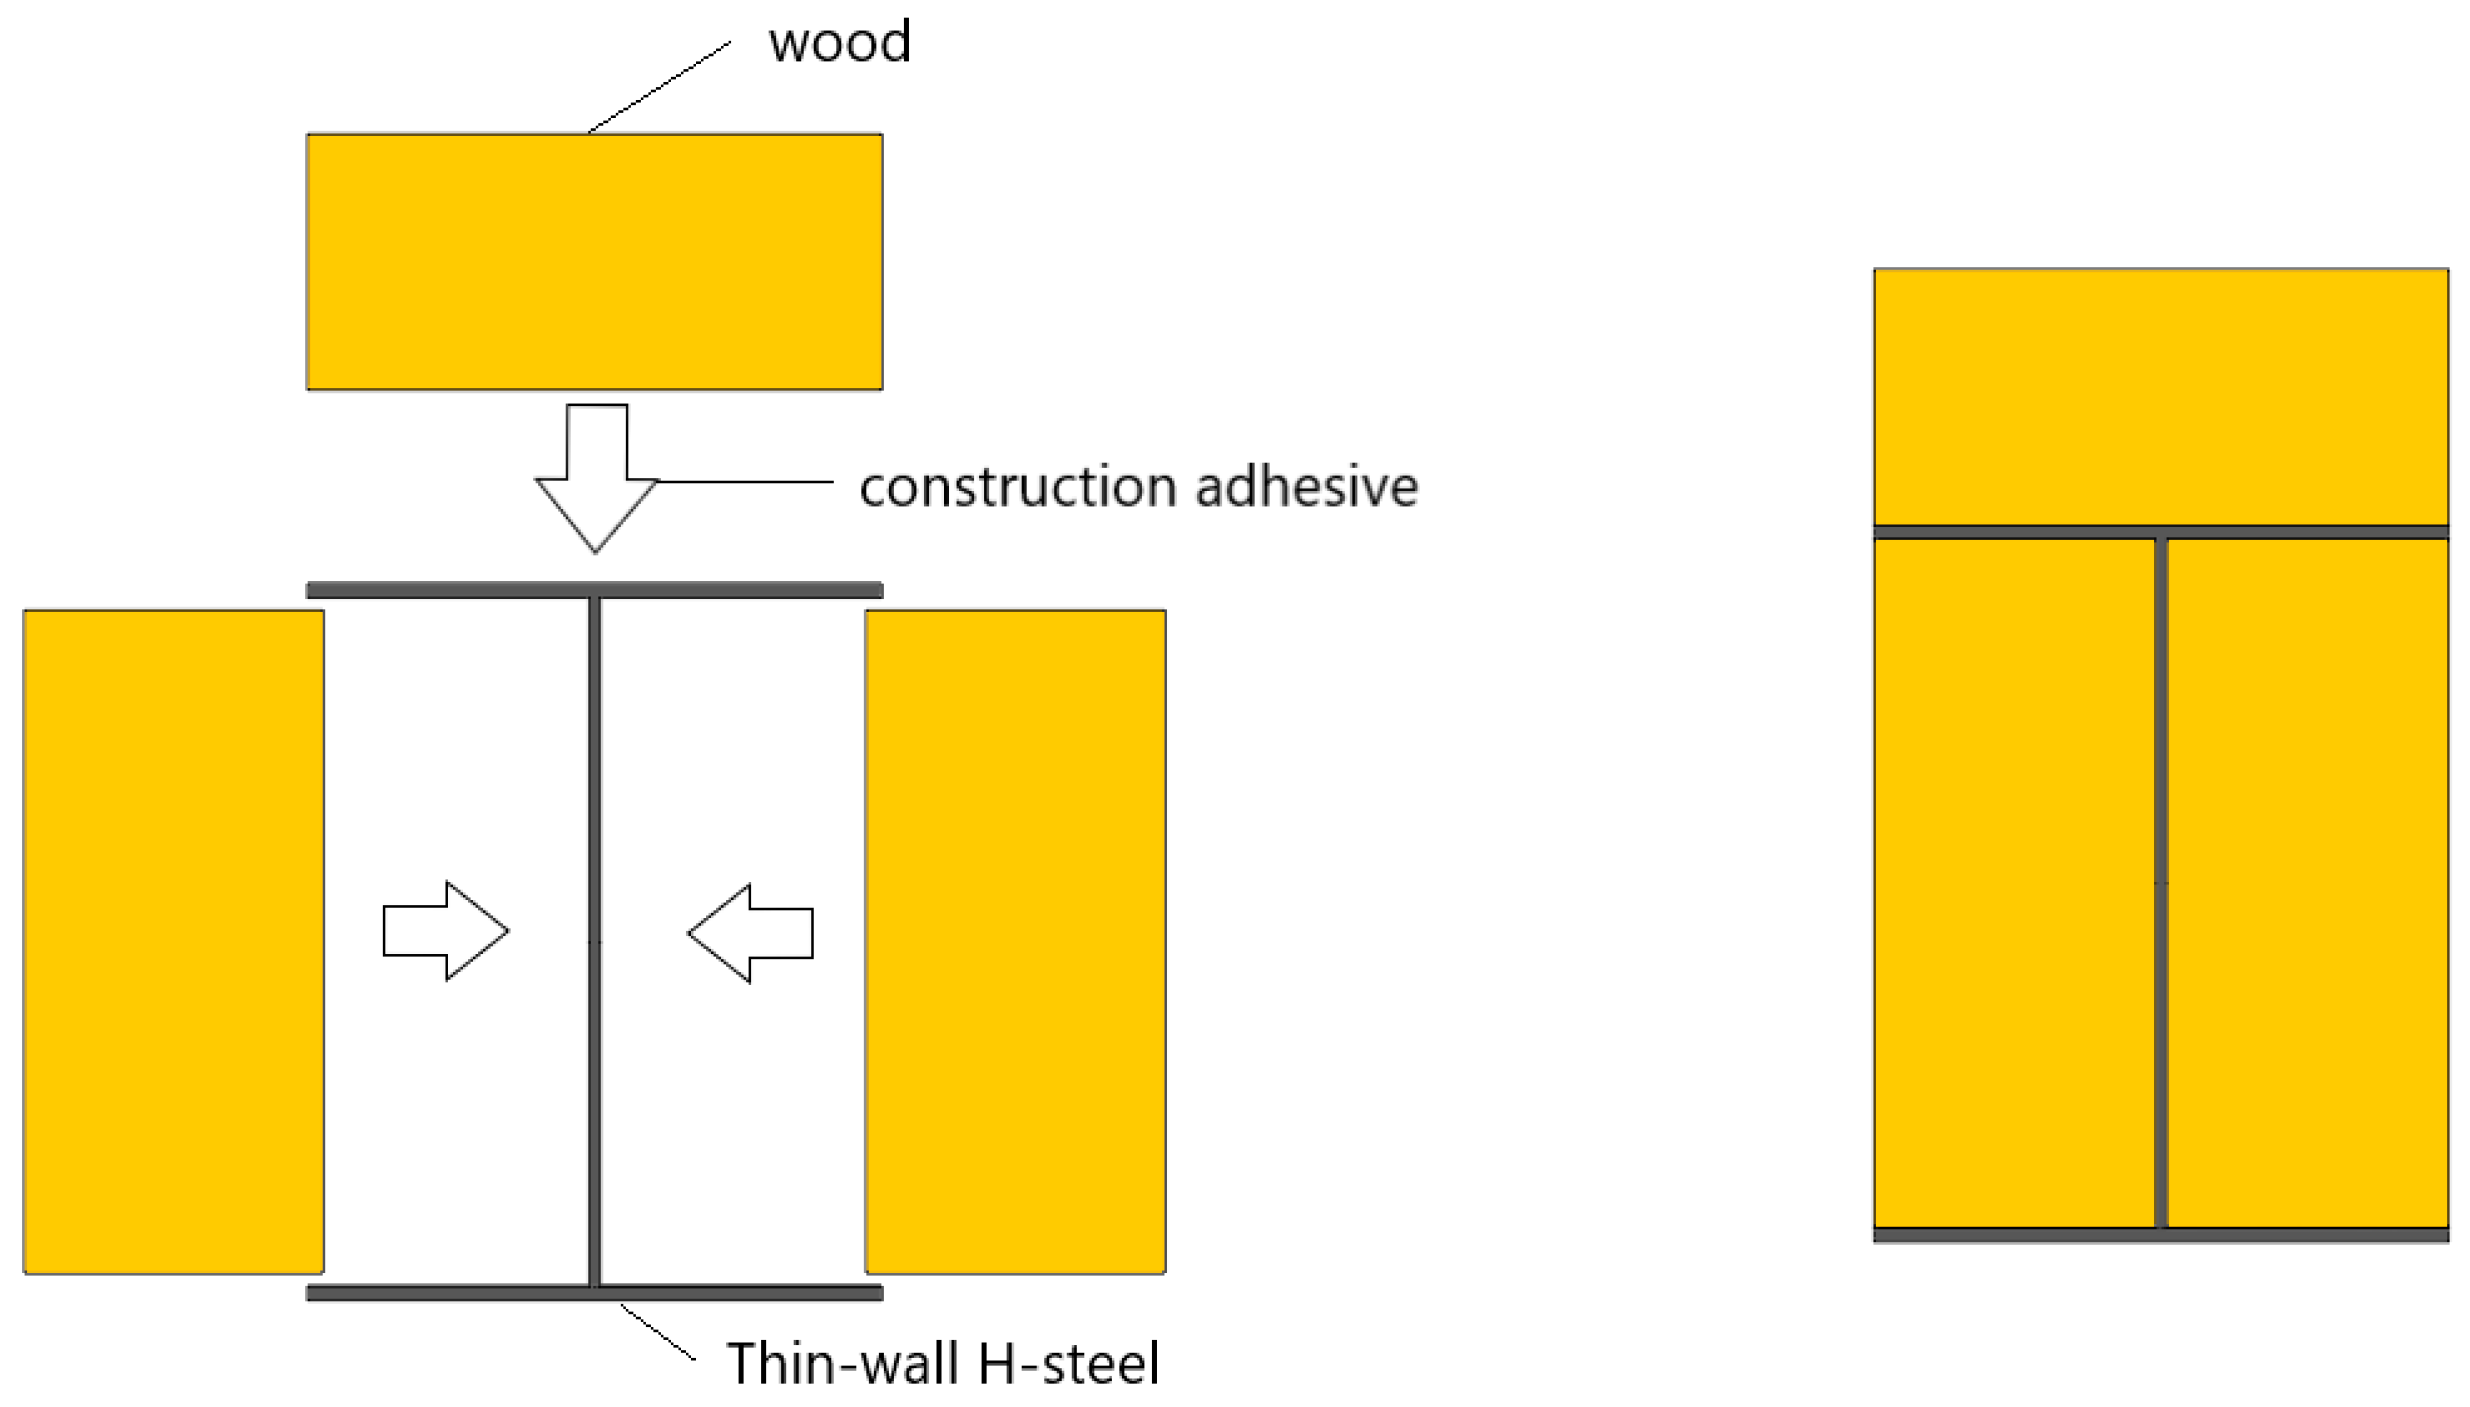
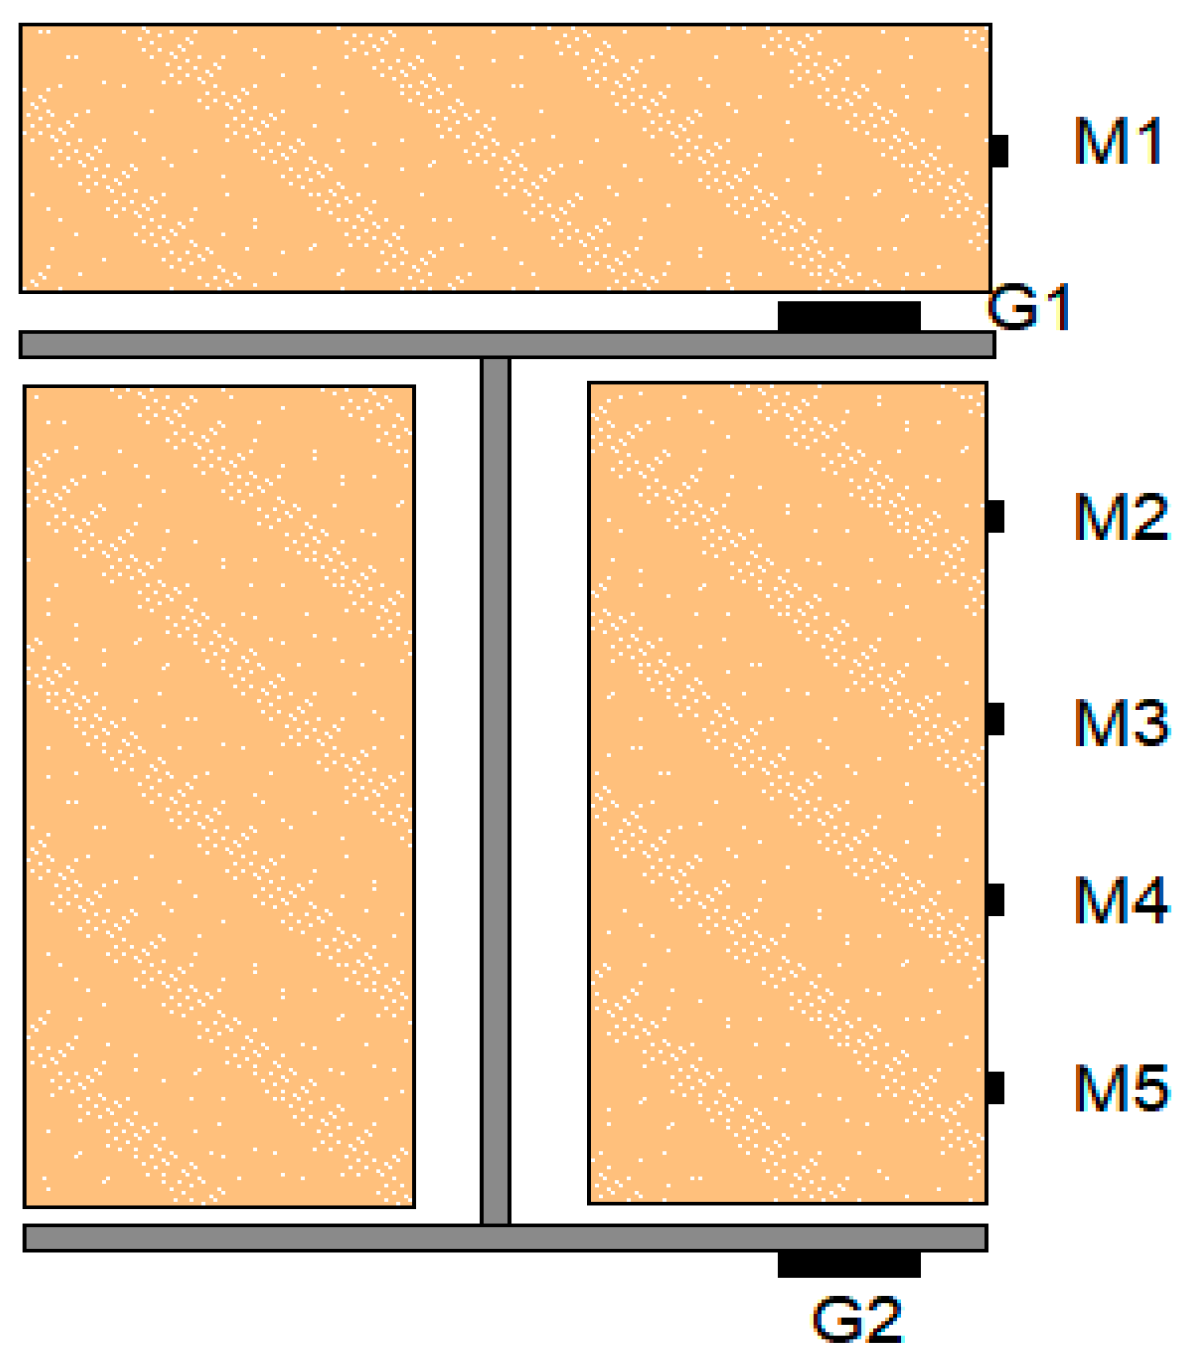
2.1. Design of Test Specimen

The main parameters for the design of the steel–wood composite beam included the top board thickness, the flange thickness of the added steel, and the steel type on the failure form, bending stiffness, and bending bearing capacity. The values for the thickness of the upper flange-covered board in the steel section were 30 mm, 40 mm, and 50 mm. The thickness of the welded thin-walled H-shape steel flange was considered 1.5 mm, 2 mm, and 2.5 mm. Table 1 represents the parameters including the dimension of specific components.
This composite beam is light in weight. Take the L-Z-2 composite beam as an example, the air-dry density of wood is 0.523 g/cm3, the density of Q235 steel is 7.85 g/cm3, and the density of epoxy resin AB glue is 1.45 g/cm3. The mass of steel required for each meter of composite beam is 3.8 kg, the mass of wood is 7.26 kg, the mass of epoxy resin AB glue is 1.57 kg, and the total mass of one running mass is 12.63 kg.
The structural adhesive used is Deyi brand E44 epoxy resin AB adhesive, in which component A includes: epoxy resin, filler, toughening agent, etc. Group B includes amination/anhydride curing agent polythiol, coupling agent, etc. After curing, the temperature resistance of epoxy resin AB adhesive is 20~80. In the process of using the member, the ambient temperature on the strength after curing can be ignored.

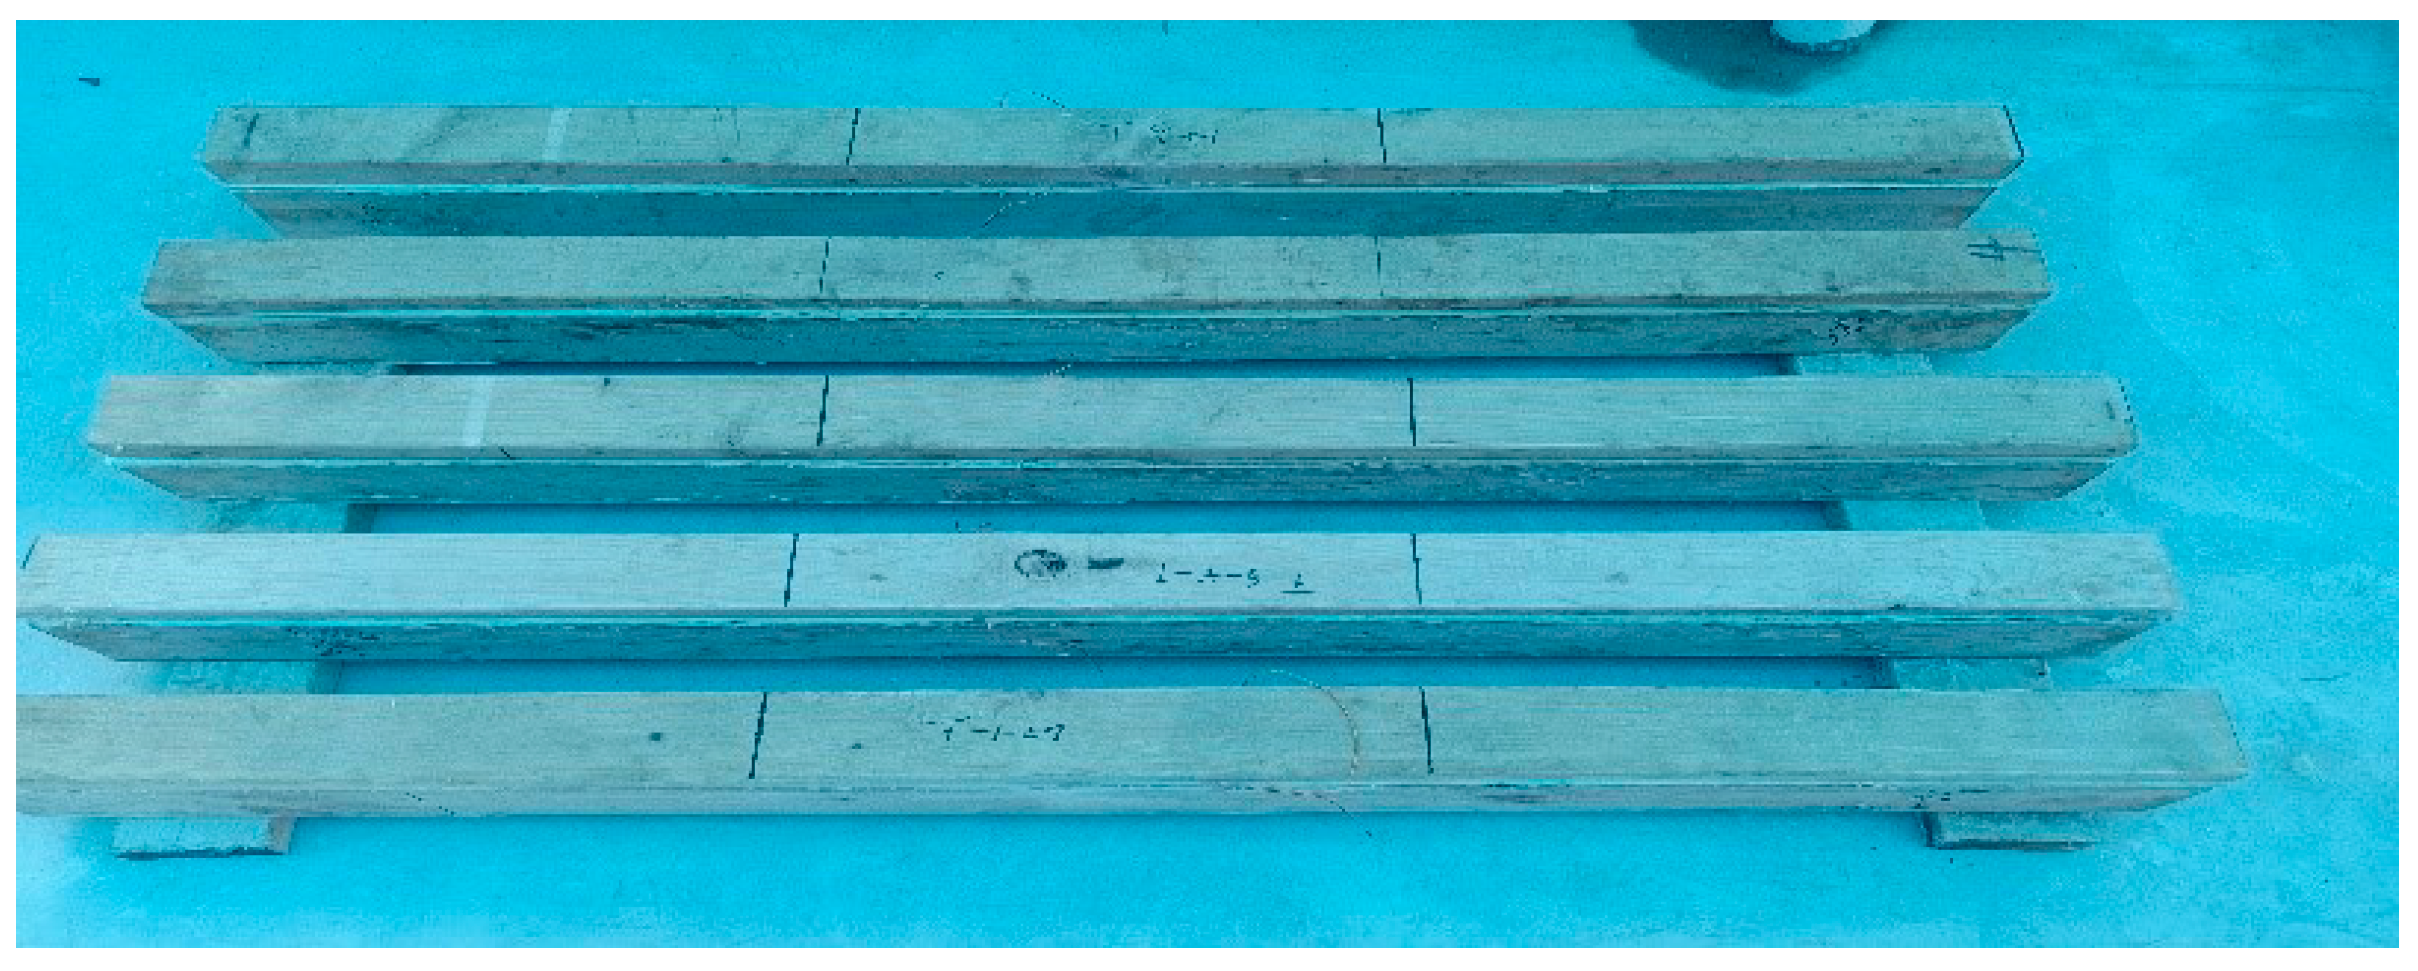
2.2. Test Piece Production
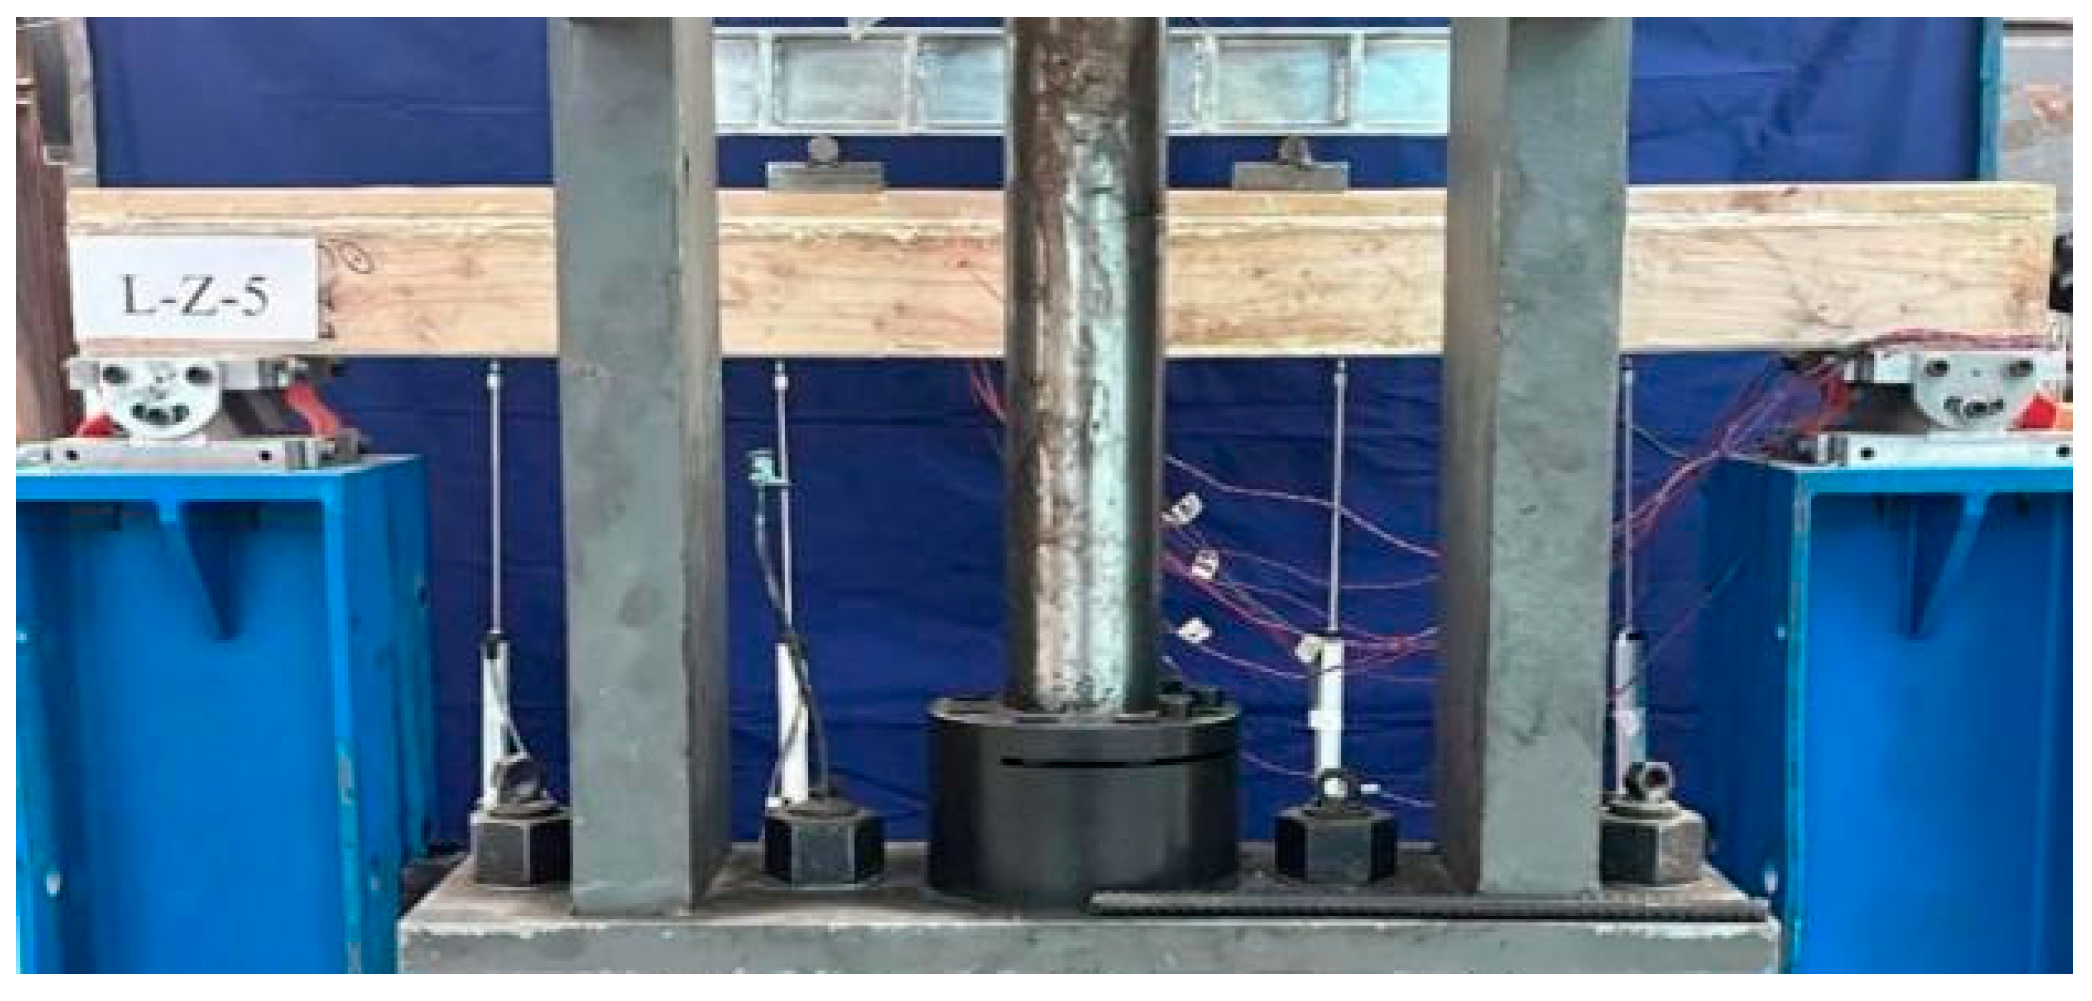
The steps of experiment piece production were as follows:
Stage 1: the welded thin-walled H-shaped steel and wood were polished.
Stage 2: alcohol was used to wipe the steel and wood, remove the dust, and remove impurities, and grease from the wood surface.
Stage 3: the binder (epoxy AB glue) was mixed.
Stage 4: the binder was applied.
Stage 5: the bonding surface remained immobile for complete adhesion. The molded member is shown in Figure 2.

2.3. Loading Test

The test adopts the controlled displacement loading method. The speed was 1 mm·min−1 and held the load for two minutes to read the number of each instrument. Five linear displacement sensors were arranged on the lower side of the beam in the upper flange middle on the side of the wood with M1, and the web with four sheets M2, M3, M4, and M5. The two strain sheets were adjusted at the edge of the upper and lower flanges of the H-shape steel, numbered G1 and G2. The DH3816 static strain measurement system was used to collect the data. The strain sheets were arranged as shown in Figure 3. The field of loading is shown in Figure 4.

3. Results and Discussion

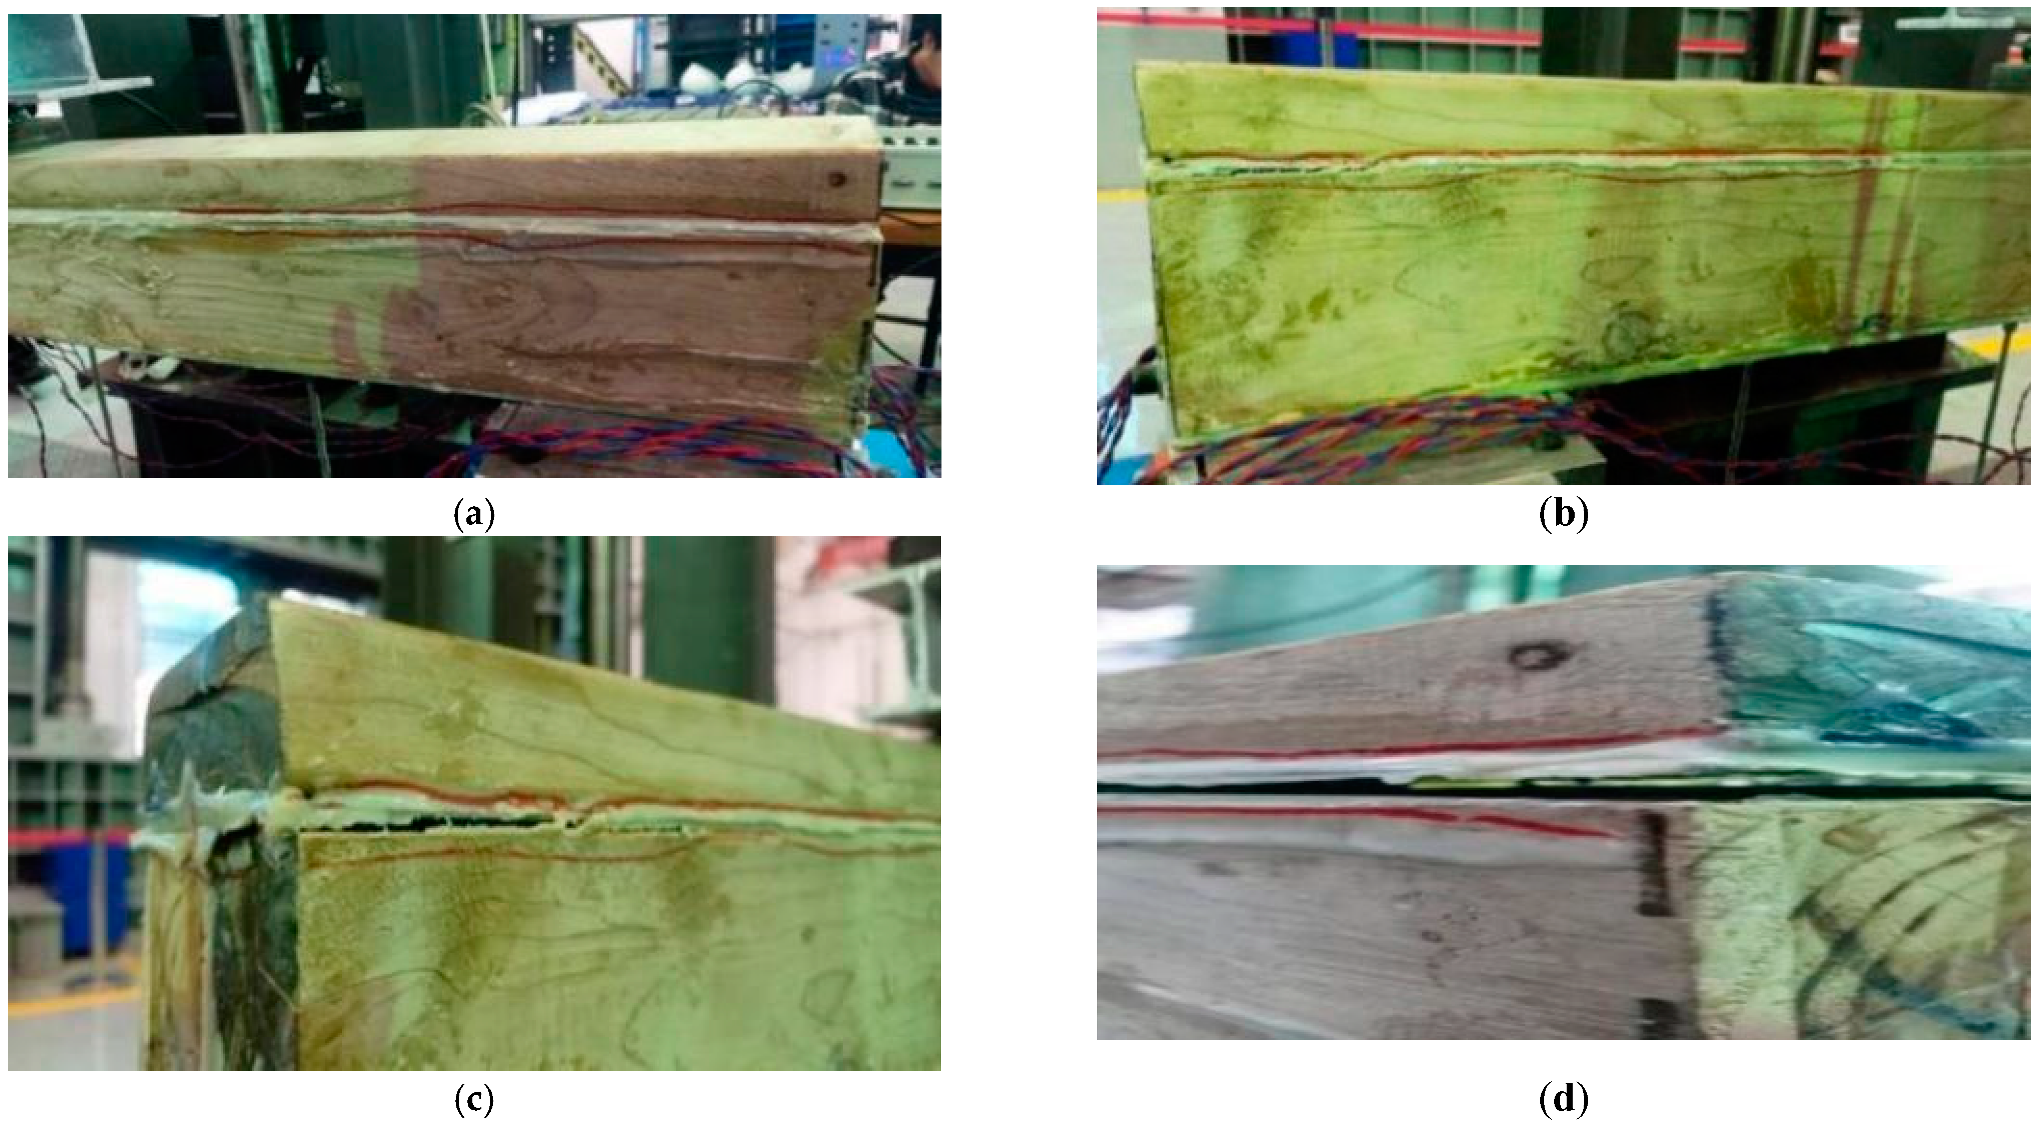
3.1. Loading Test and Destruction Process

The beams L-Z-1~L-Z-5 showed similar destructive forms, and the final brittle fracture in the wood on both sides of the H-type steel web reached the ultimate tensile strength. It made the combined beam ineffective. The L-Z-2 composite beam is taken as an example for analysis. At the beginning of loading, the L-Z-2 combination beam was deformed with an increase in the load. When the load measurement showed 35.07 kN, the “click” sound of the wood fiber inside the composite beam and the “crackling sound” of degassing was heard for the first time. The greater the load, the denser and the louder the sound. After the load of 45.19 kN, the primary crack occurred at the right end of the specimen and gradually extended to the span of pure bending (Figure 5a). Figure 5b shows the left end of the composite beam in this stage. When the load value represented 49.31 kN, the crack was gradually enlarged (Figure 5c). As the load reached 56.47 kN, the composite beam entered the elastic–plastic step. The upper flange alongside the right side of welded steel H-beam web is shown in Figure 5d. When the load measurement represented 59.72 kN, there was a ‘loud bang’ in the zone of the lower flange of the steel H-beam. The lower flange of the steel H-beam reached the yield strength toward the outside, and the steel bent. Therefore, the 45° inclined crack took place in the wood in the same position (Figure 5e), and the composite beam was damaged.

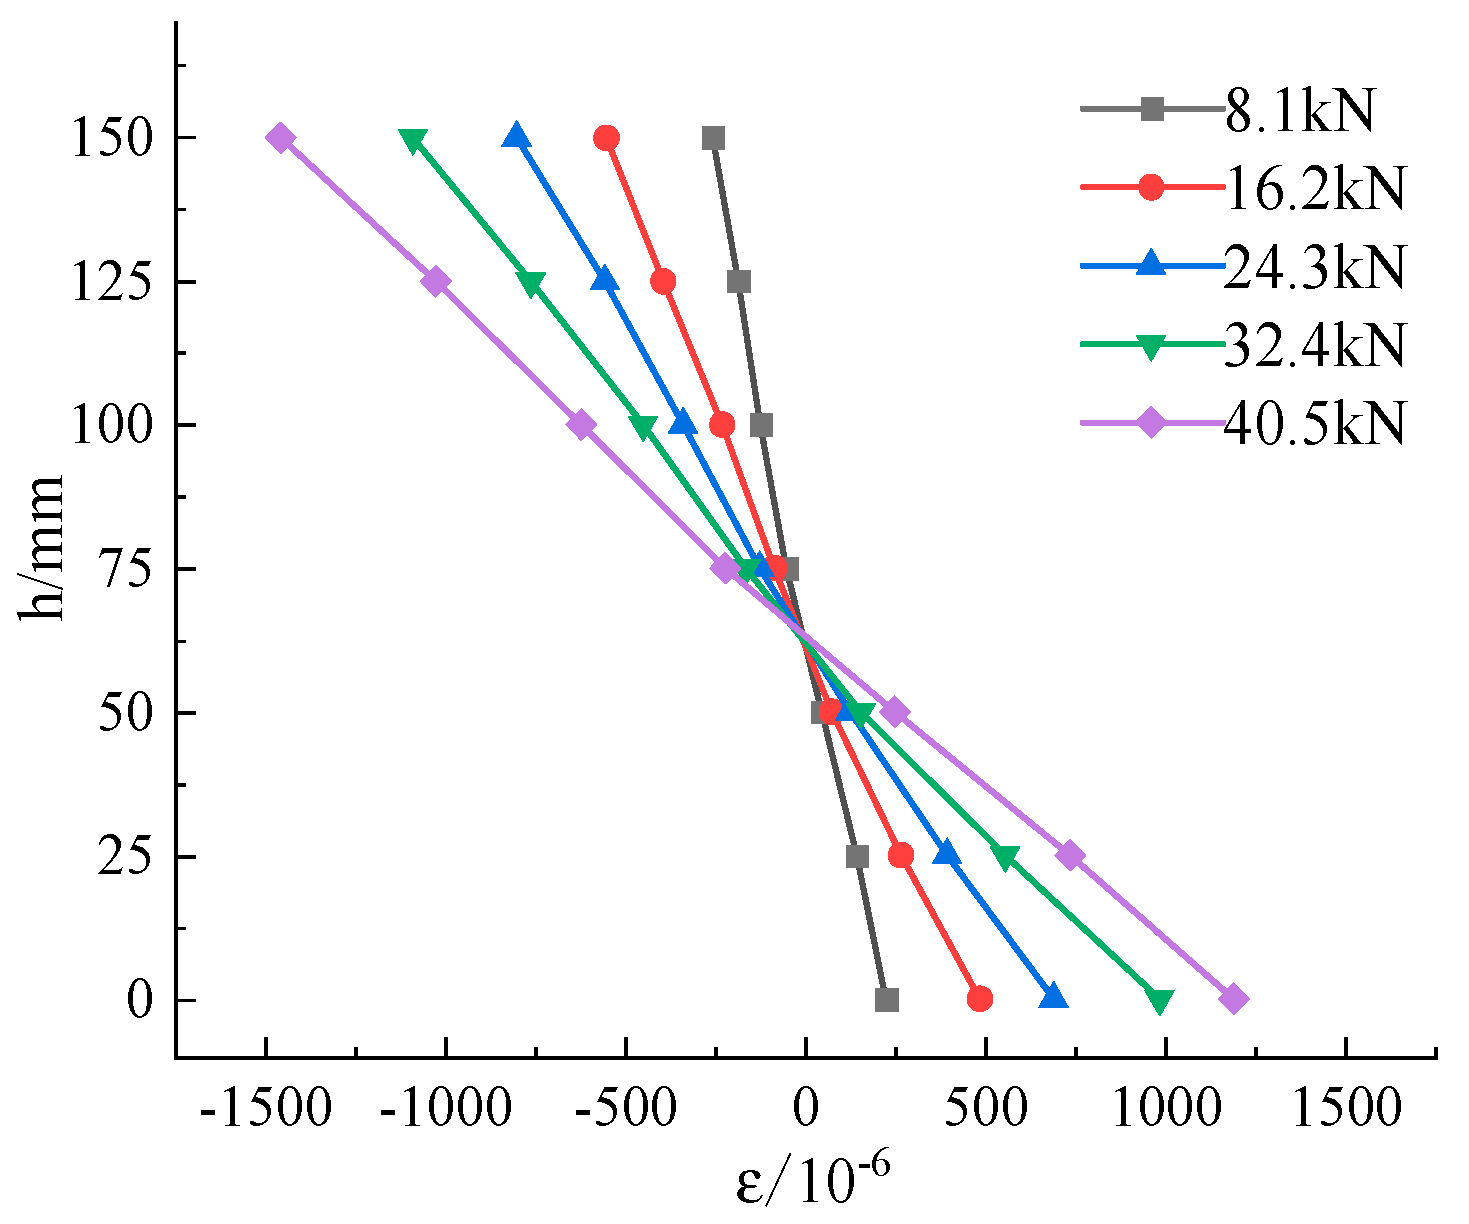
3.2. Mid-Span Cross-Section Strain

Cross-section strain curves across L-Z-2 are shown in Figure 6. The maximum component load value in the figure was taken as the corresponding yield load. The strain value above the neutral axis was negative, indicating that the section above the neutral axis was pressed under the load, making the strain sheet and the value to be negative. The strain value below the neutral axis was positive, indicating that the section below the neutral axis was pulled under the load. It straightened the strain sheet, and the value was positive. The position of the neutral axis in the pure bend section of the component was always unchanged throughout the whole process from the initial load to the yield load, representing that the high-strength epoxy AB glue connection was effective.

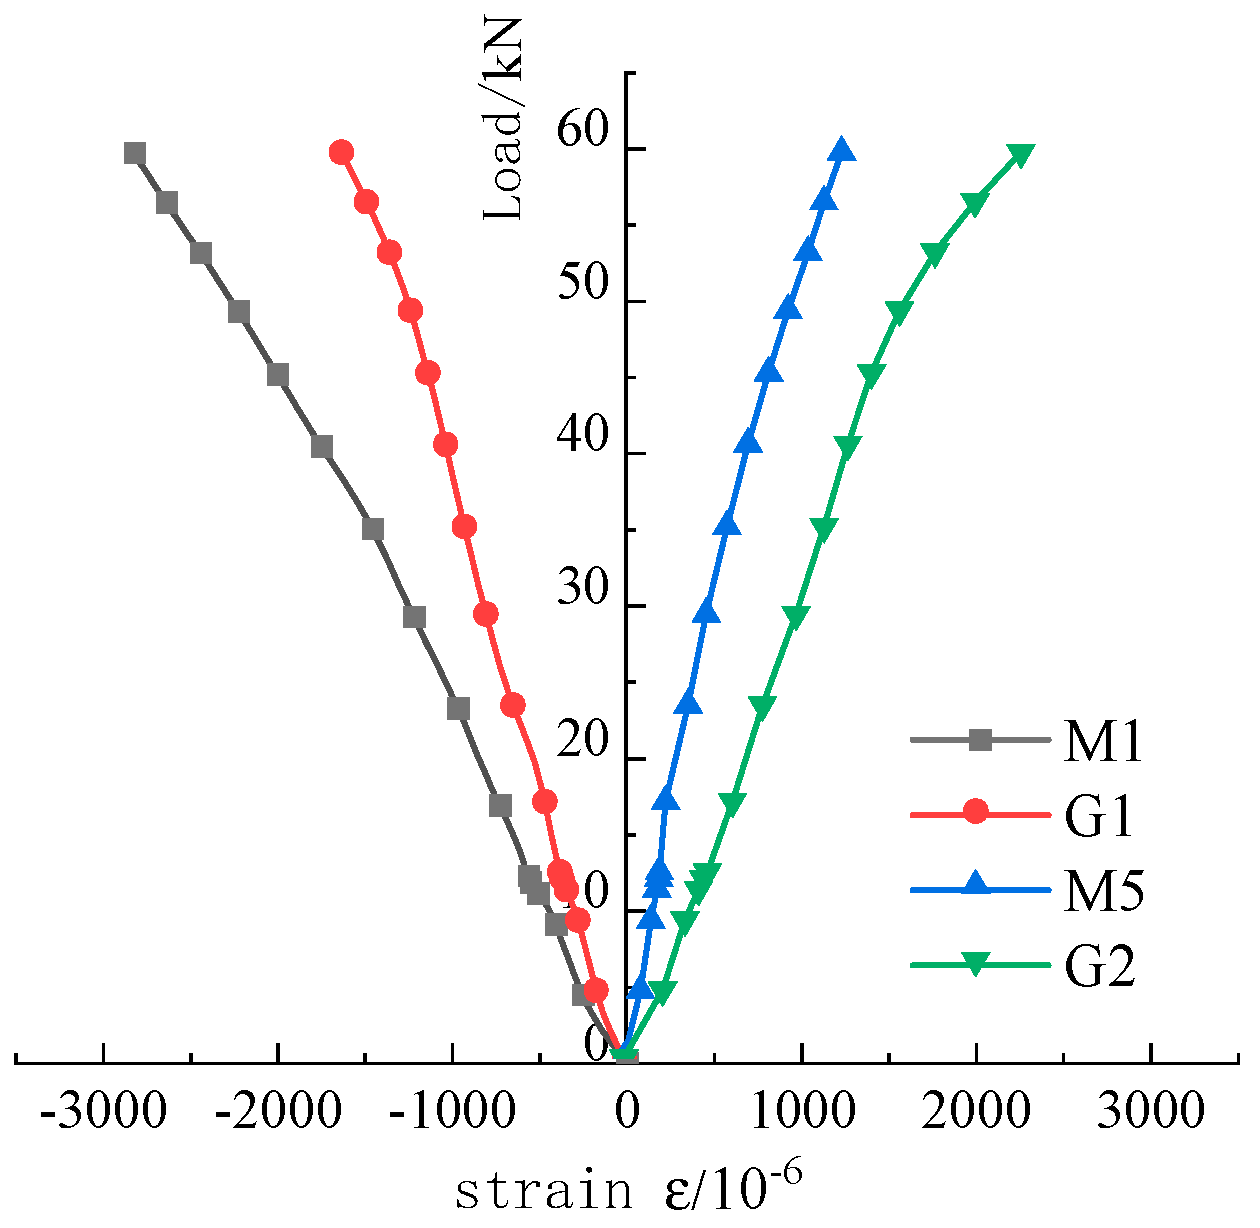
3.3. Cross-Span Section Load–Strain Relationship

The cross-sectional load–strain curve for the combined beam L−Z−2 is shown in Figure 7. The values of the left strain abscissa half-axis were negative, representing the sticking position of the strain sheets M1 and G1 in the compression area of the member. The values of the right strain abscissa half-axis were positive, indicating the sticking position of the strain sheets M5 and G2 in the tensile area. From the figure, the strain measurement of each point in the section increased proportionally from the initial load to the yield load. The strain between the pressure area and tensile region was almost symmetric around the ordinate. The strain change of steel and wood in the tensile and compression areas was almost synchronized, showing a very reliable glue connection between the steel and wood. Furthermore, the two deformations could work together, and the combined effect was significant. Furthermore, the value of strain G1 in the compression area was higher than that of M1 in the compression area. It indicated that the steel–wood combination beam played a complete role in the bending test of the steel.

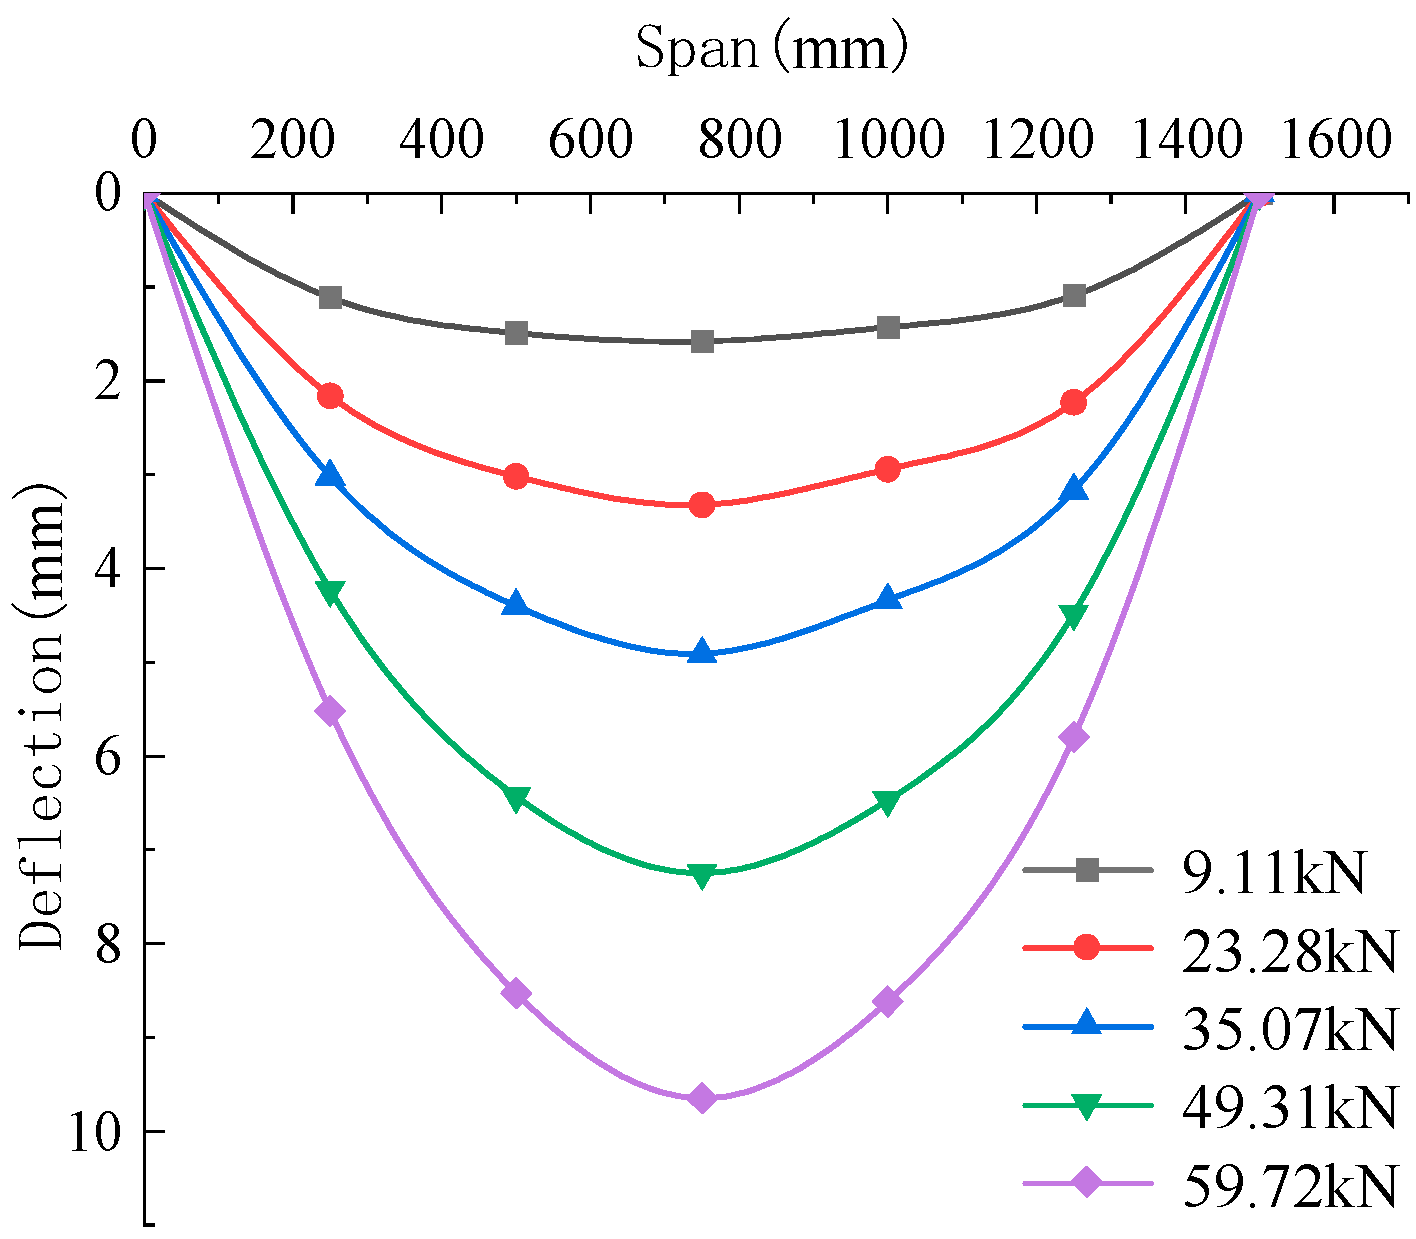
3.4. Overall Deformation

The curve of overall deformation for the combined beam L−Z−2 under different loads is shown in Figure 8. The abscissa in the figure was the net span length of the combined beam, and the ordinate was the corresponding deflection. In the early step of loading, both steel and wood were in the elastic stage, playing a complete role in the tensile performance of H-shape steel and the compression performance of wood. The overall performance was desired, and the overall deformation curve in the whole stress process of components was basically symmetrical. In the early step of loading, the deflection enhancement in each measurement point followed a less linear development, and the overall curve was relatively gentle. With the further increase in the load, the steel entered the yield stage, and the cementing surface was serious, leading to a reduction in the overall stiffness of the combined beam. In the late step of loading, the deflection developed more rapidly than in the early stage, and increased significantly higher, until the component was destroyed. In the whole process of loading, the span deflection of the pure bending section was always the largest.

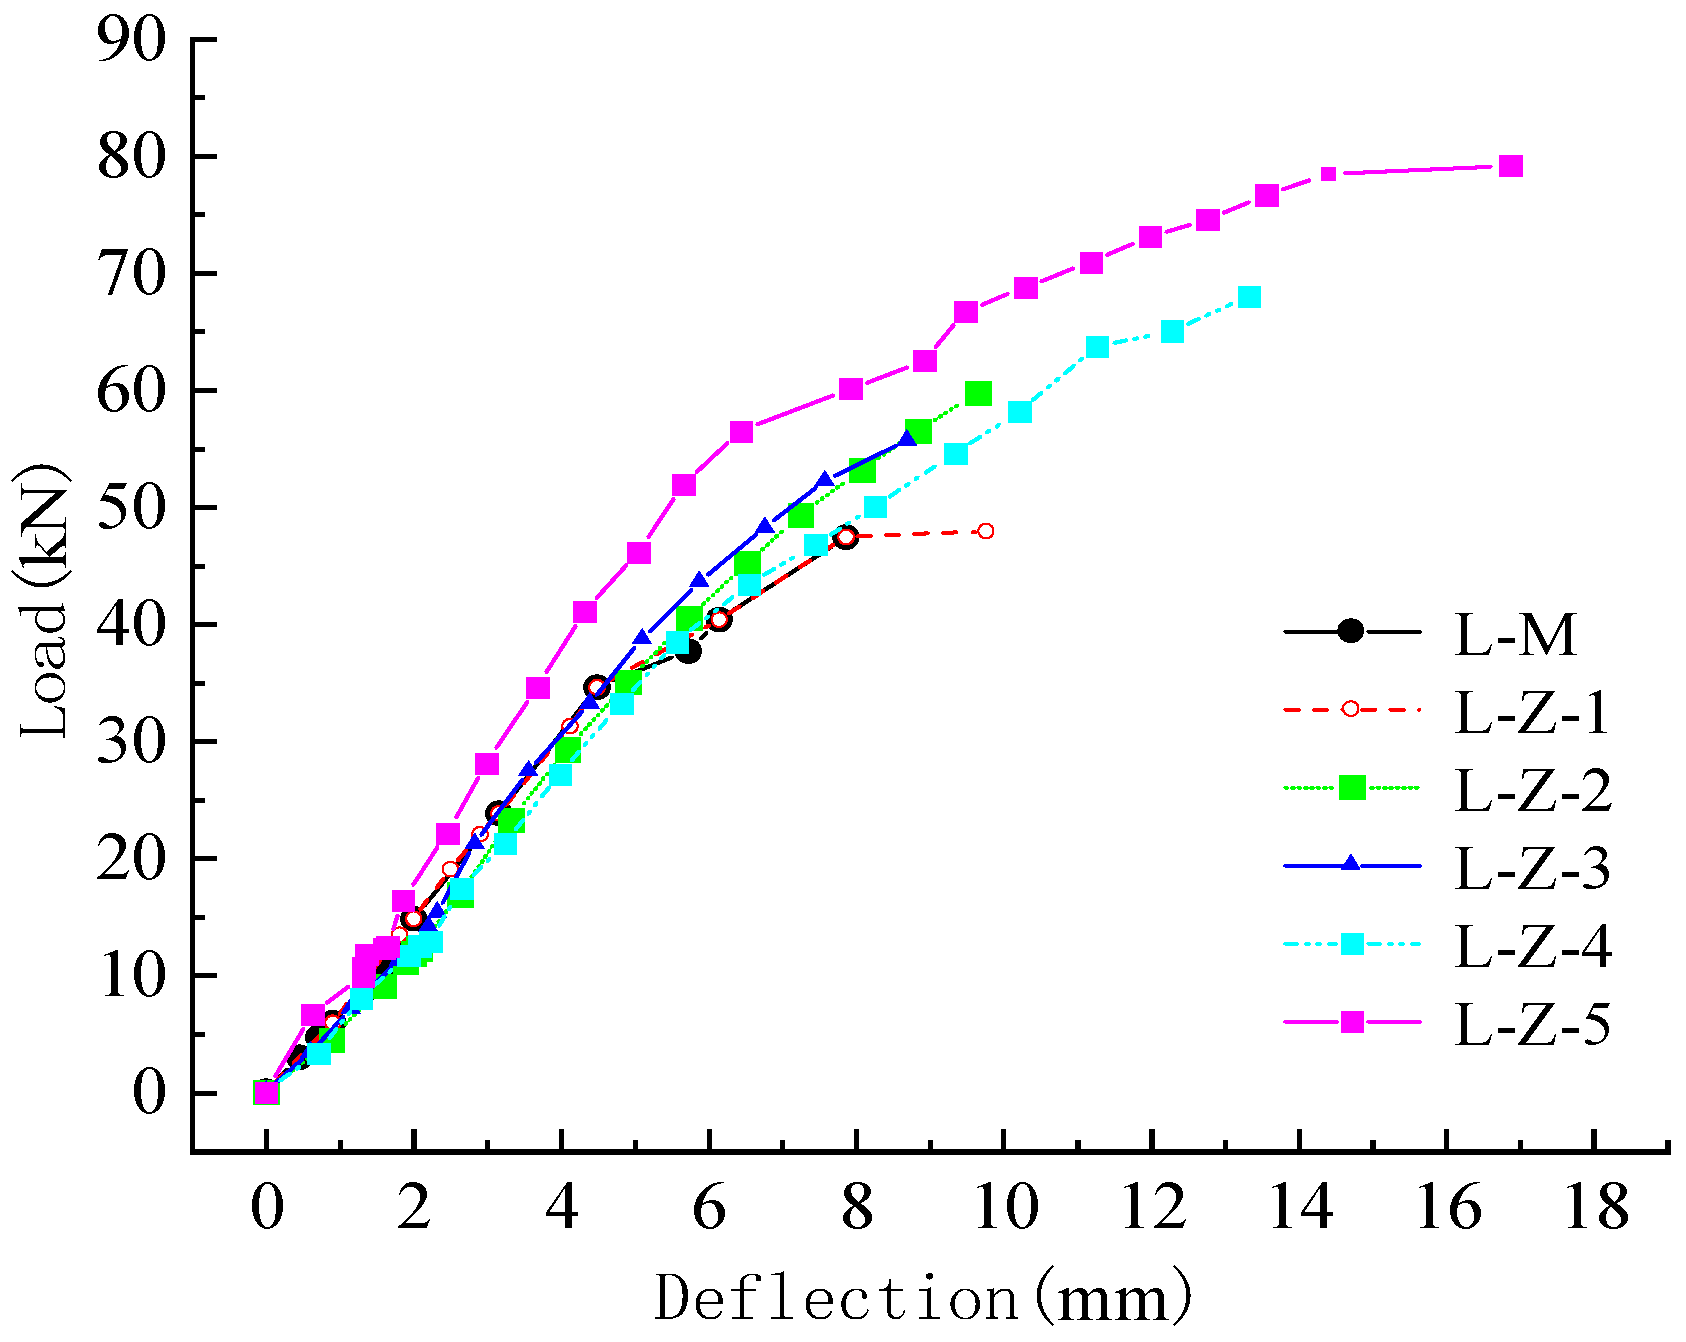
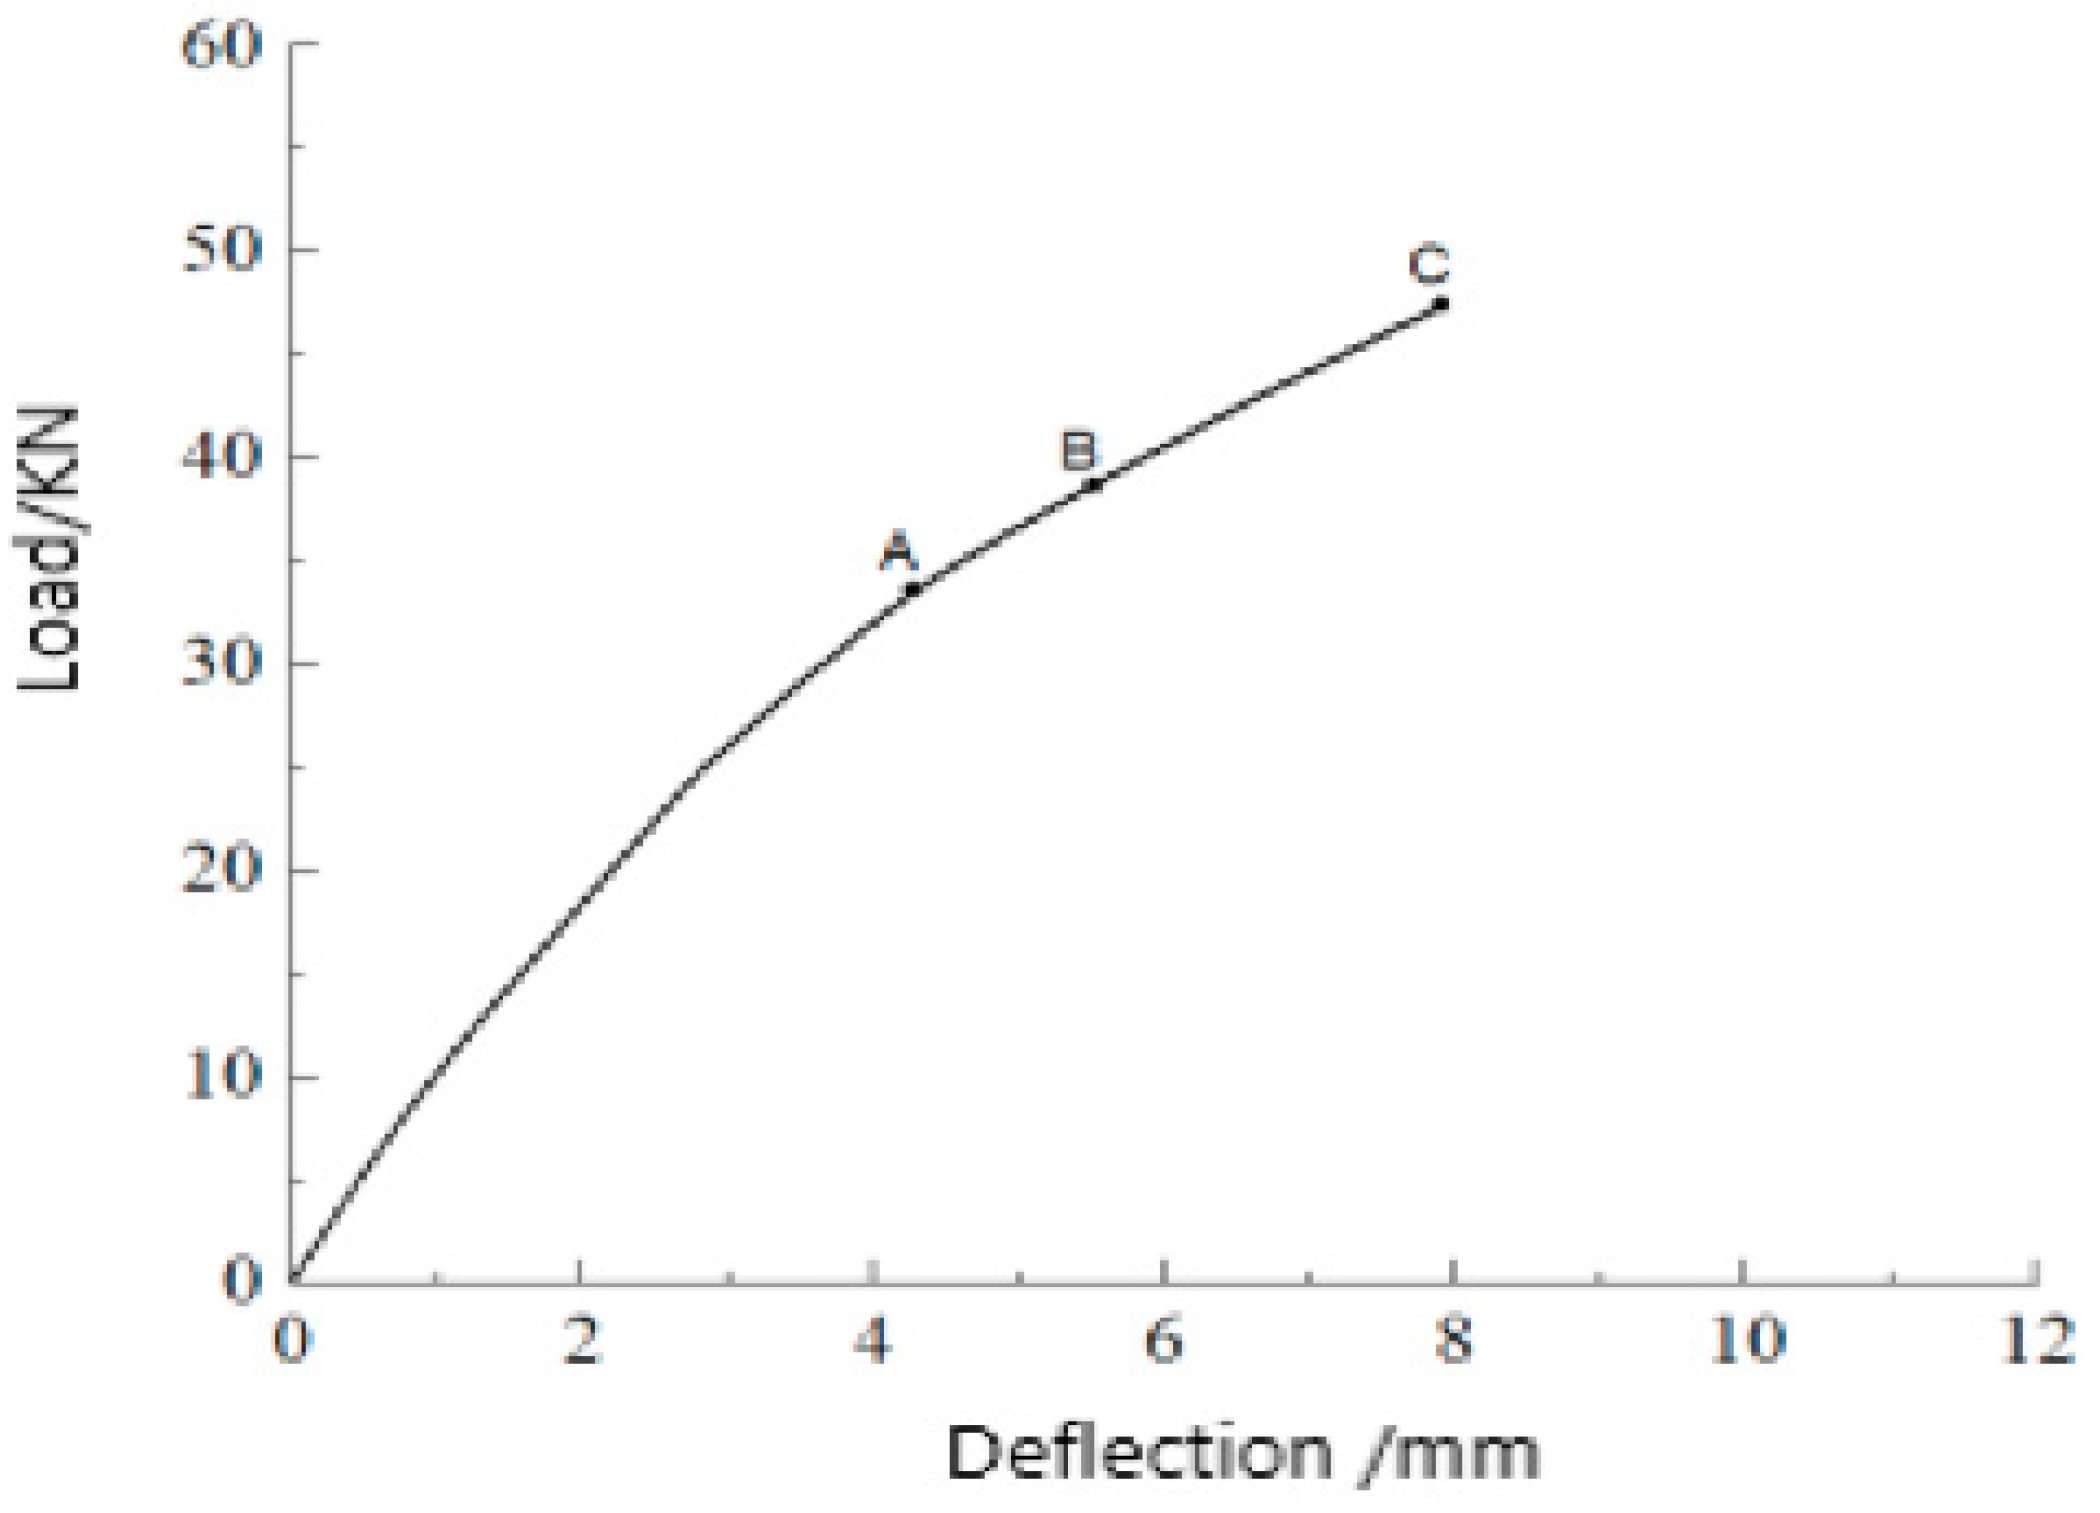
3.5. Load–Cross Deflection Relationship

The load–span median deflection diagram of the L-M, L-Z-1~L-Z-5 specimens are shown in Figure 9. The test period from the loading beginning to the failure was divided into three steps: elastic stage, elastic–plastic step, and destructive stage. Among the samples, the whole stress process of specimens L-M and L-Z-5 was the most representative. In the elastic step, the welding of the wood from the thin-walled H-shape steel and the left and right sides of the web, and the wood at the upper flange, under the strength of the high-strength binder, made the span deflection show an increasing linear trend with the load enhancement and always remained linear before the yield load of the component. The adhesive cracking started when the load exceeded the strength of the binder. At the same time, the welded thin-walled H-shape steel began to yield and entered the elastic–plastic stage. From the figure, there was a clear yield platform, after which the slope of the curve started to decrease and became nonlinear. It meant that the bending stiffness of the component gradually decreased, and the carrying capacity began to decrease. A gradual increase in the load caused a gradual reduction in the stiffness, which entered the destruction step. With an equal amount of load, the deformation expanded deflection rather than in the previous stage. When the load increased gradually, the component was damaged. According to the load–span medium deflection diagram, the final deflection of the member L-M was about 8 mm, and the final damage phenomenon indicated a brittle failure. The final deflection of the remaining combined components exceeded the final deflection of the components L-M, and the final damage phenomenon occurred as ductility damage. The component L-Z-5 was a typical representative component of ductile failure, and its final deflection was 16.87 mm, which also represented that the component delayed the damage when the steel was in the destructive stage. This kind of combined beam resulted in a good deformation ability and ductility under the bending process.

4. The Results of the Effective Factors

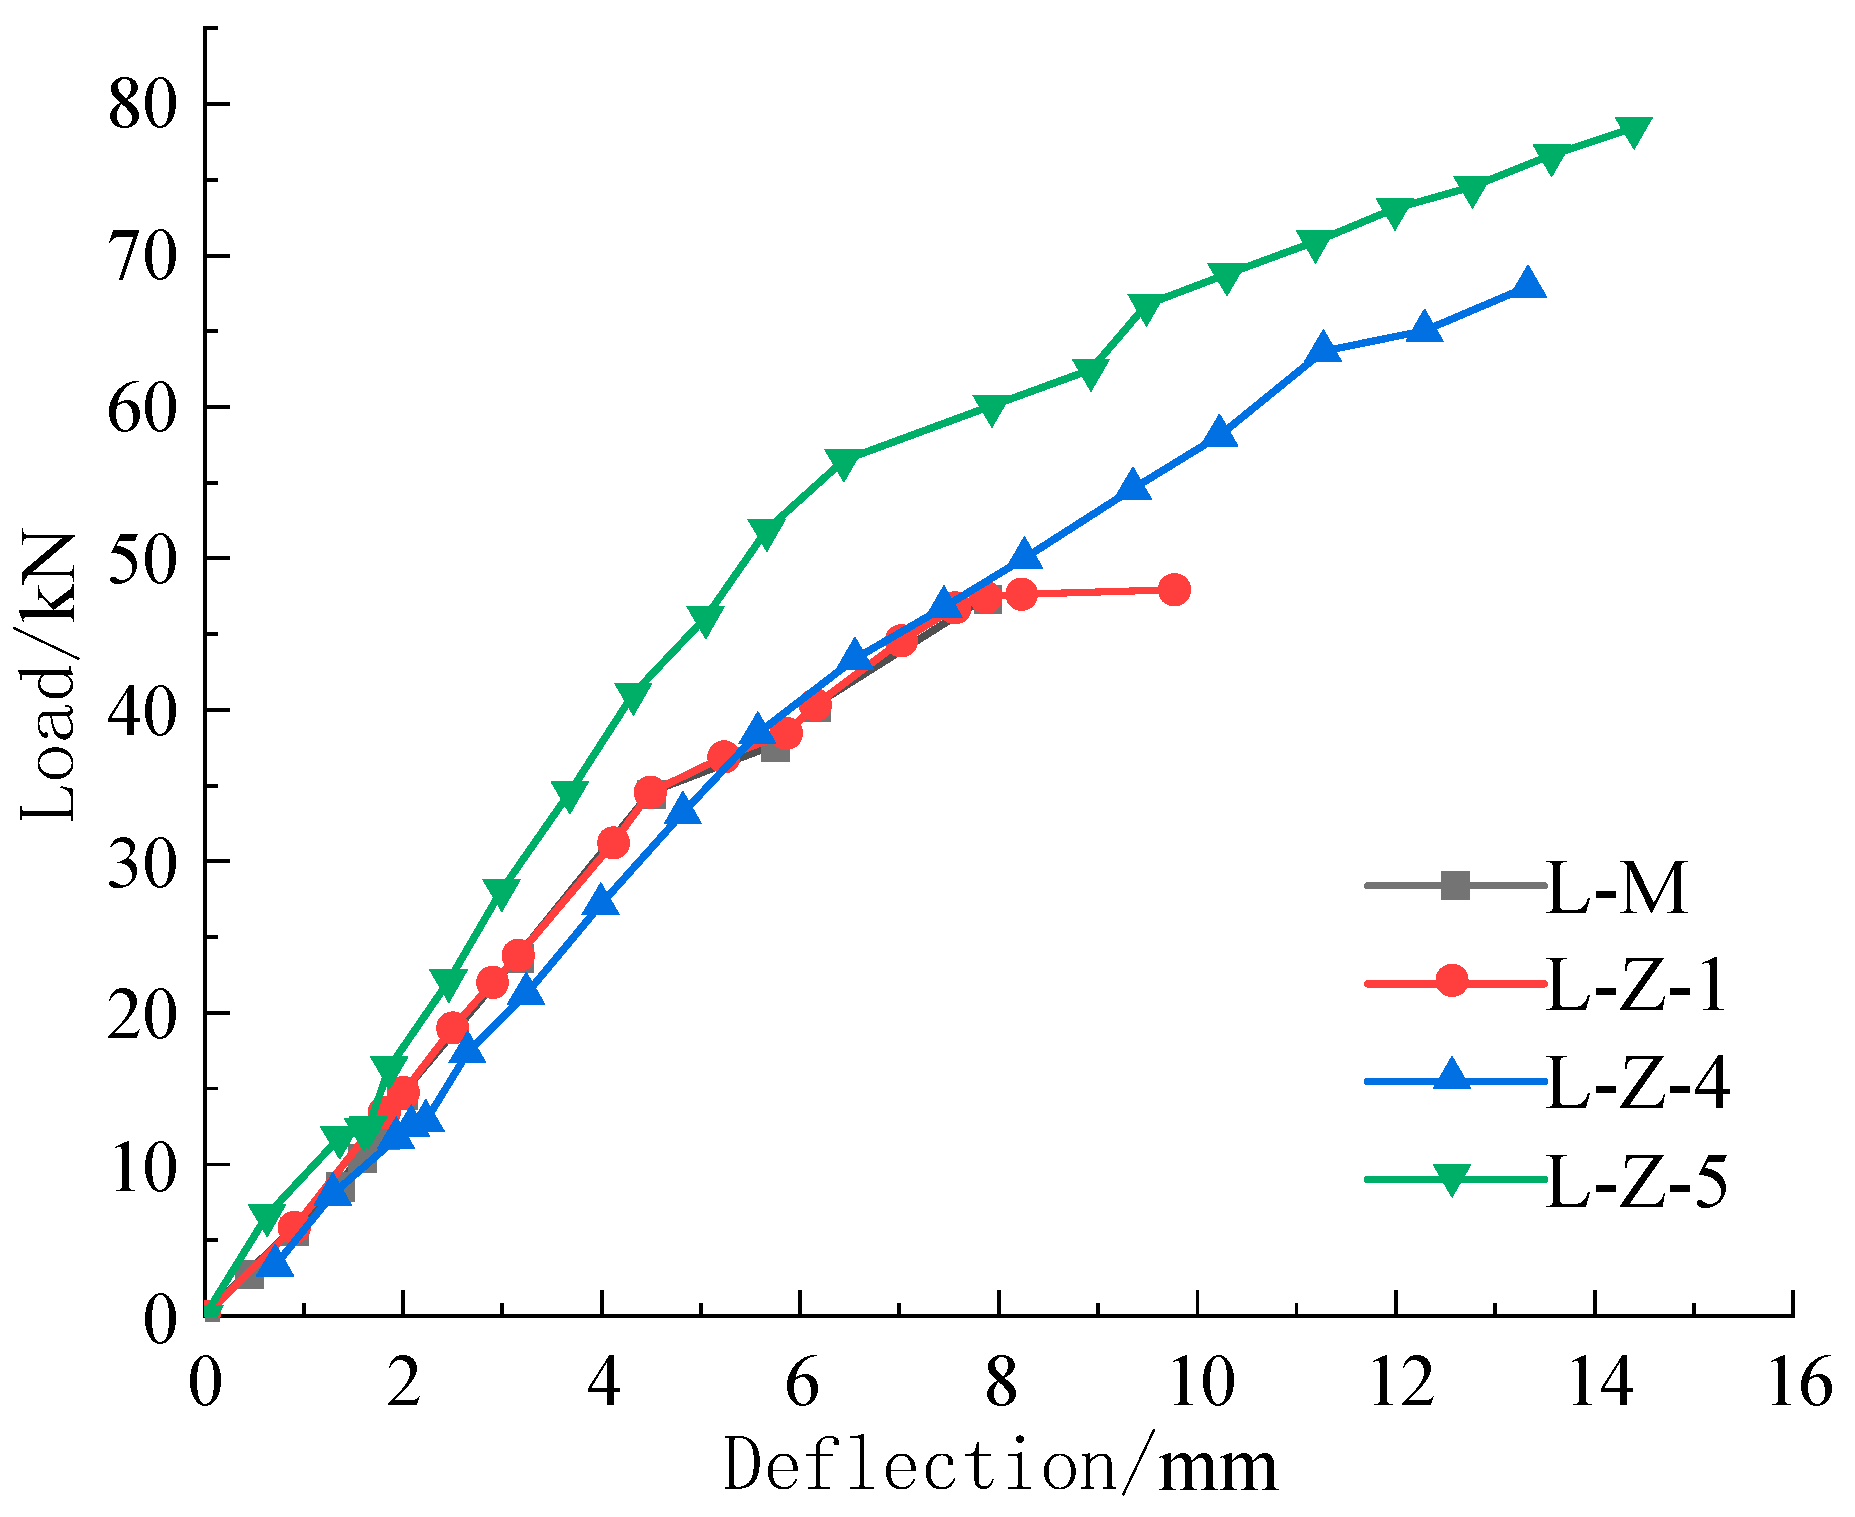
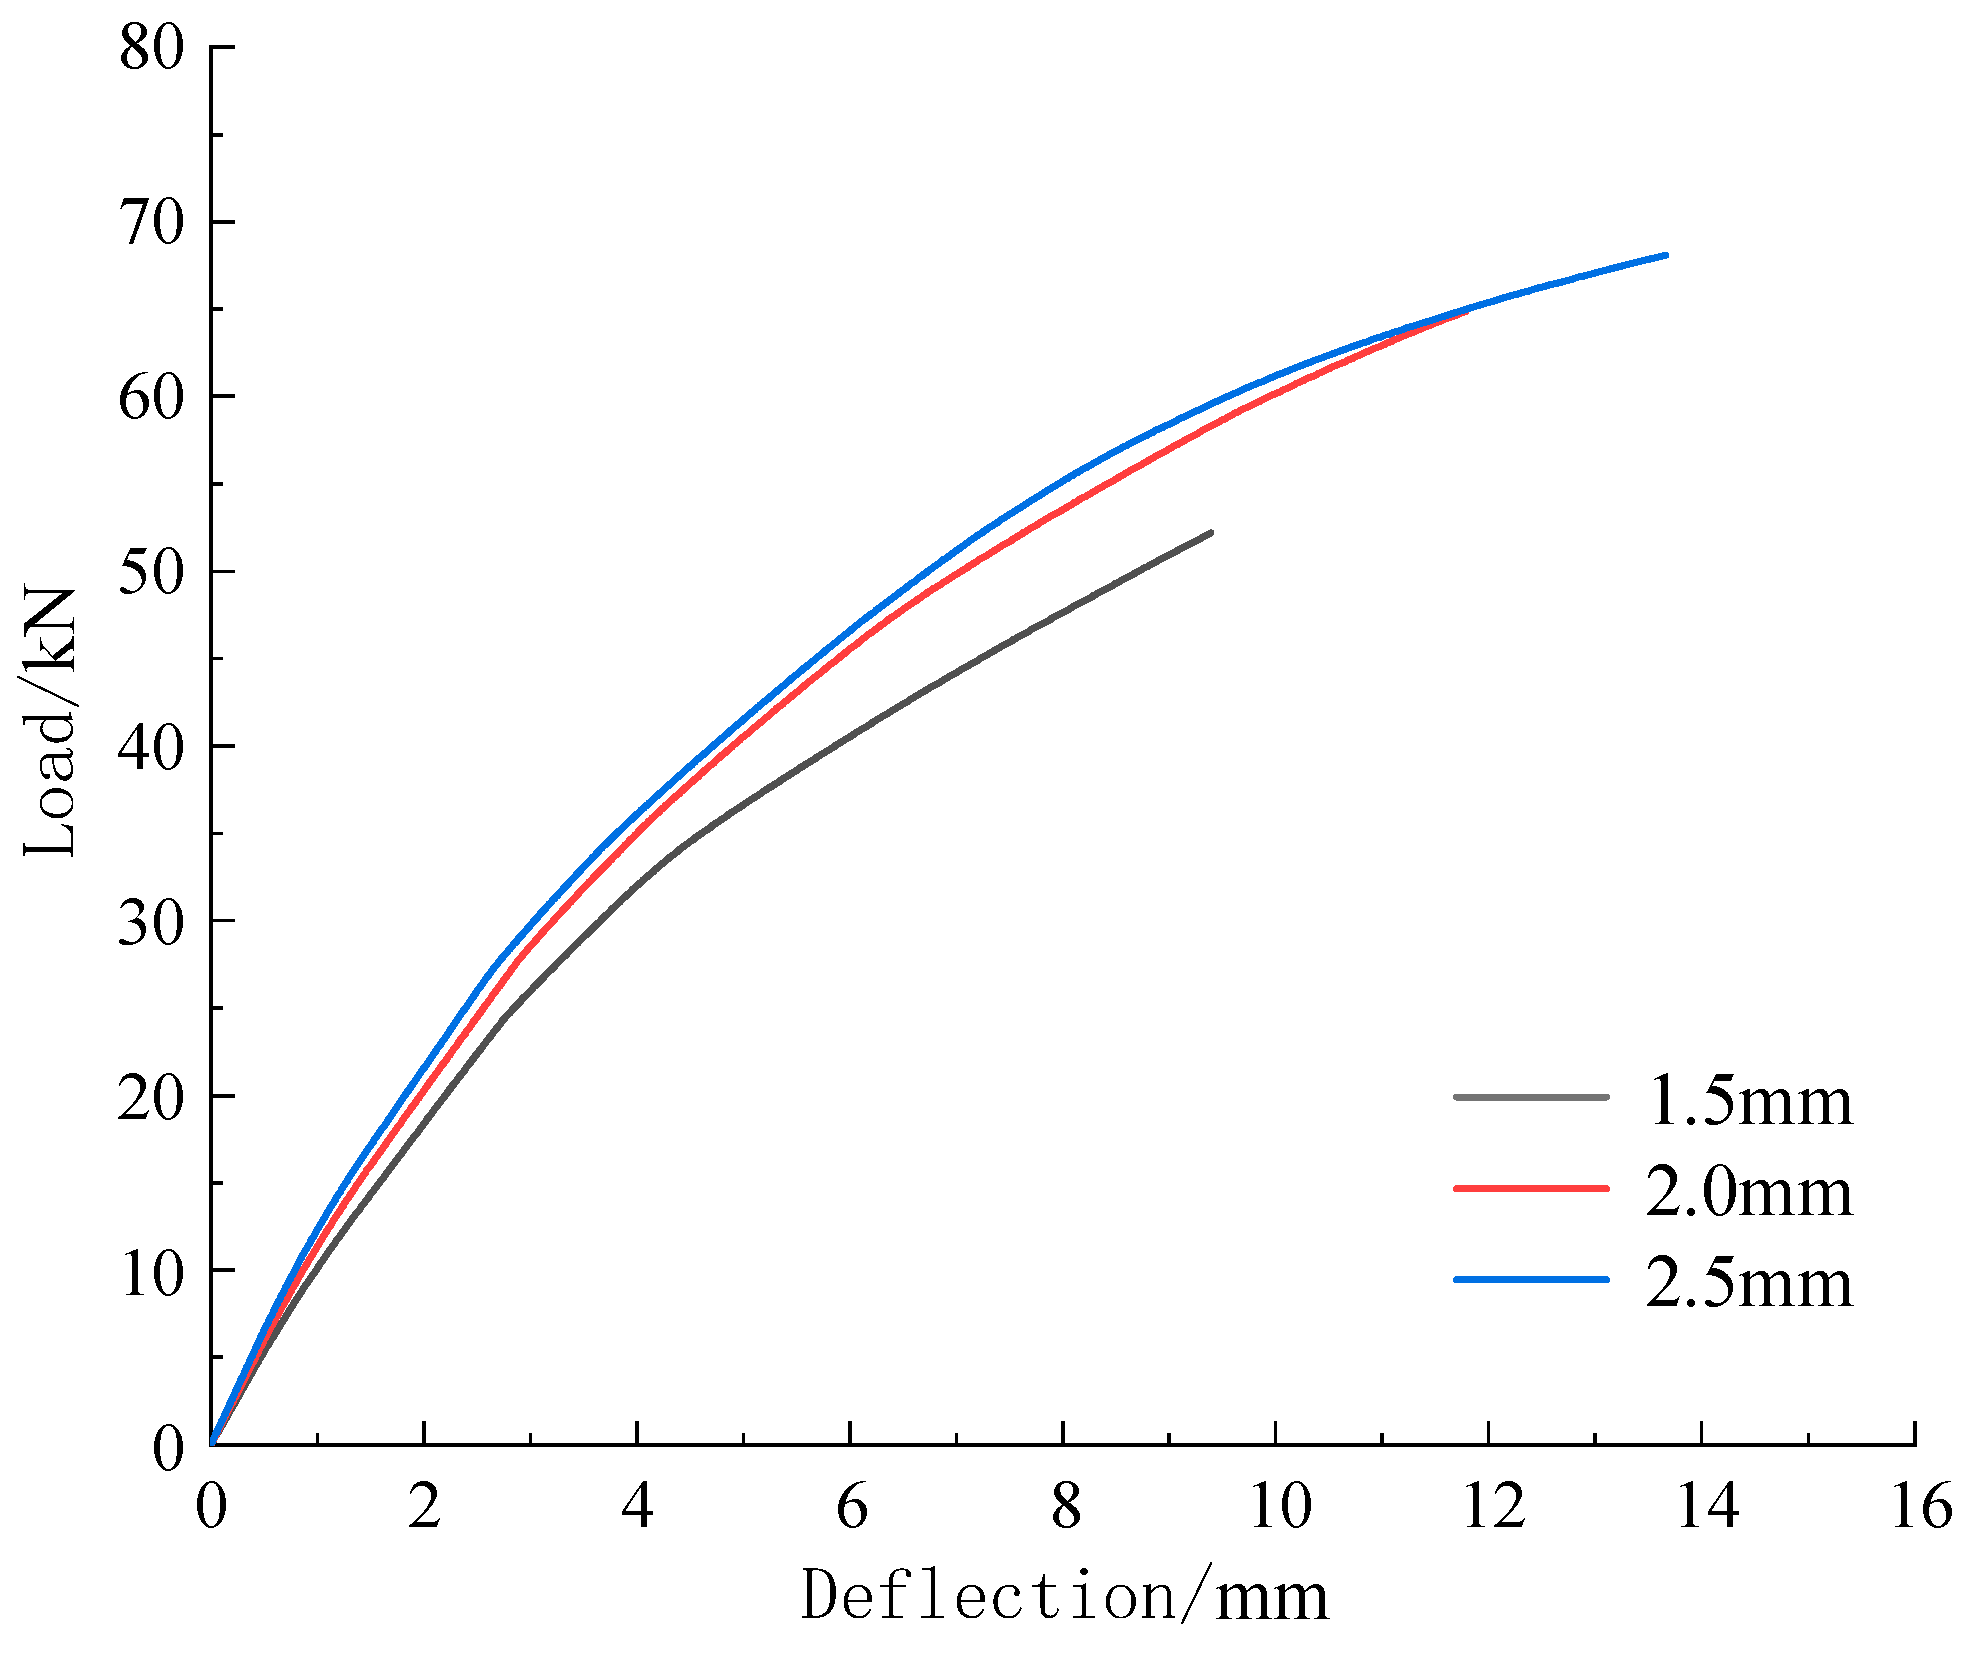
4.1. Effect of Welding Thin-Walled H-Shape Steel

The influence of welded thin-walled steel H-beam was studied on the bending capacity of the combined beam, as shown in Figure 10 and Table 2. As a comparison between the combined beam L-Z-1 and pure wood beam L-M, the bending bearing capacity of these beams was 47.934 kN and 47.429 kN, respectively. The thin-walled H-shape steel was welded was about 1.94%, and the bending bearing capacity was not much different. The maximum bearing capacity increased only by 0.505 kN, and the enhancement range was about 1.06%. The analysis reasons were that the combination beam L-Z-1 was the first processing and assembly component, with uneven coating, uneven thickness, insufficient bonding strength, maintenance, and not in place, so that the bending bearing capacity was not higher than that of the pure wood beam L-M, and the effect is not obvious. Compared with combined beam L-Z-4 and pure wood beam L-M, the bending capacity of combined beam L-Z-4 was 67.958 kN, that of L-M beam was 47.429 kN, the welded thin-walled H-shape steel was about 3.76%, the bending capacity significantly increased, the maximum bearing capacity increased by 20.529 kN, the increased range was about 42.0%. Compared with combined beam L-Z-5 and pure wood beam L-M, the bending bearing capacity of combined beam L-Z-5 was 79.169 kN, and that of pure wood beam L-M was 47.429 kN. Welded thin-walled H-shape steel was added to about 4.41%. Compared with the combination beam L-Z-5 and pure wood beam L-M, the maximum bearing capacity increased by 31.19 kN and by about 67.87%. It was known from the analysis that after welding, the maximum bending bearing capacity of different sizes was higher than that of the pure wood beam.

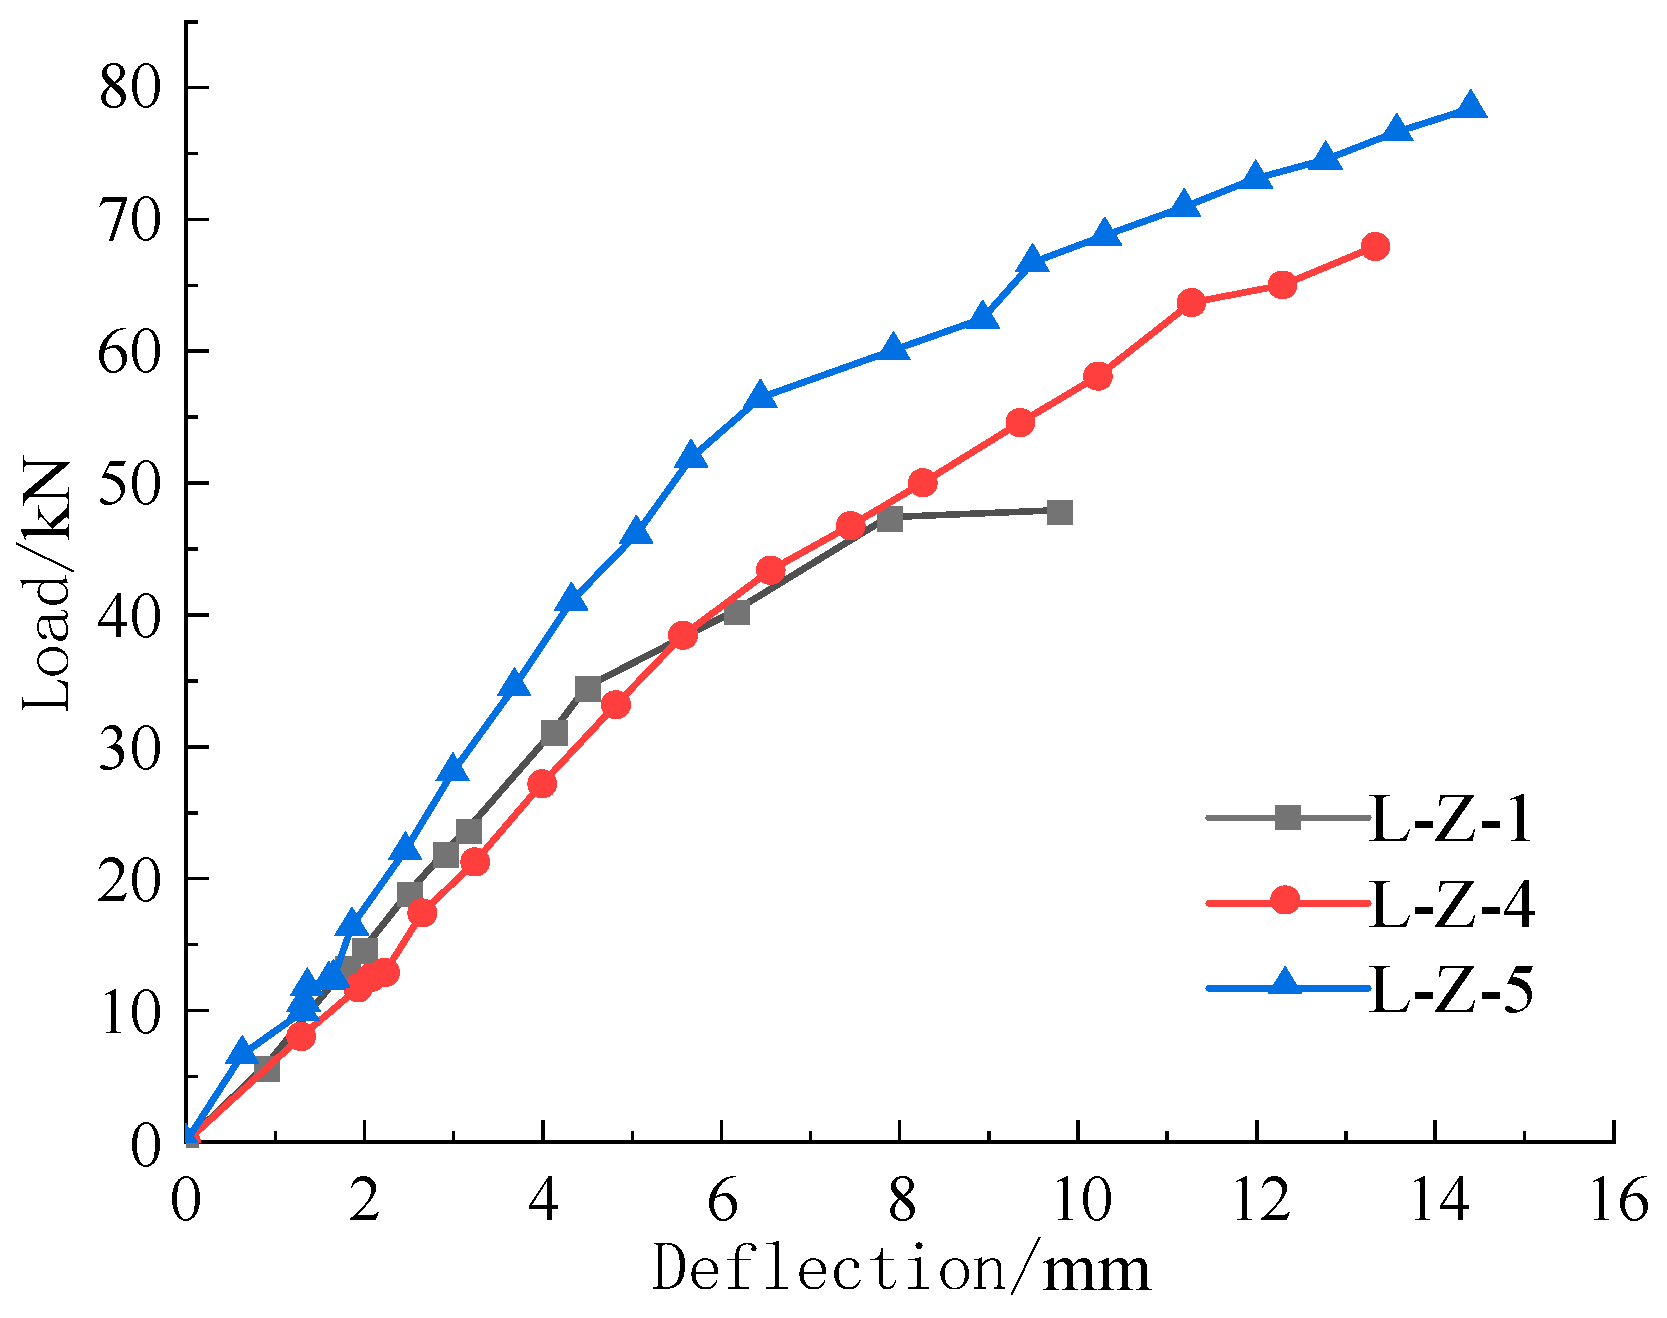
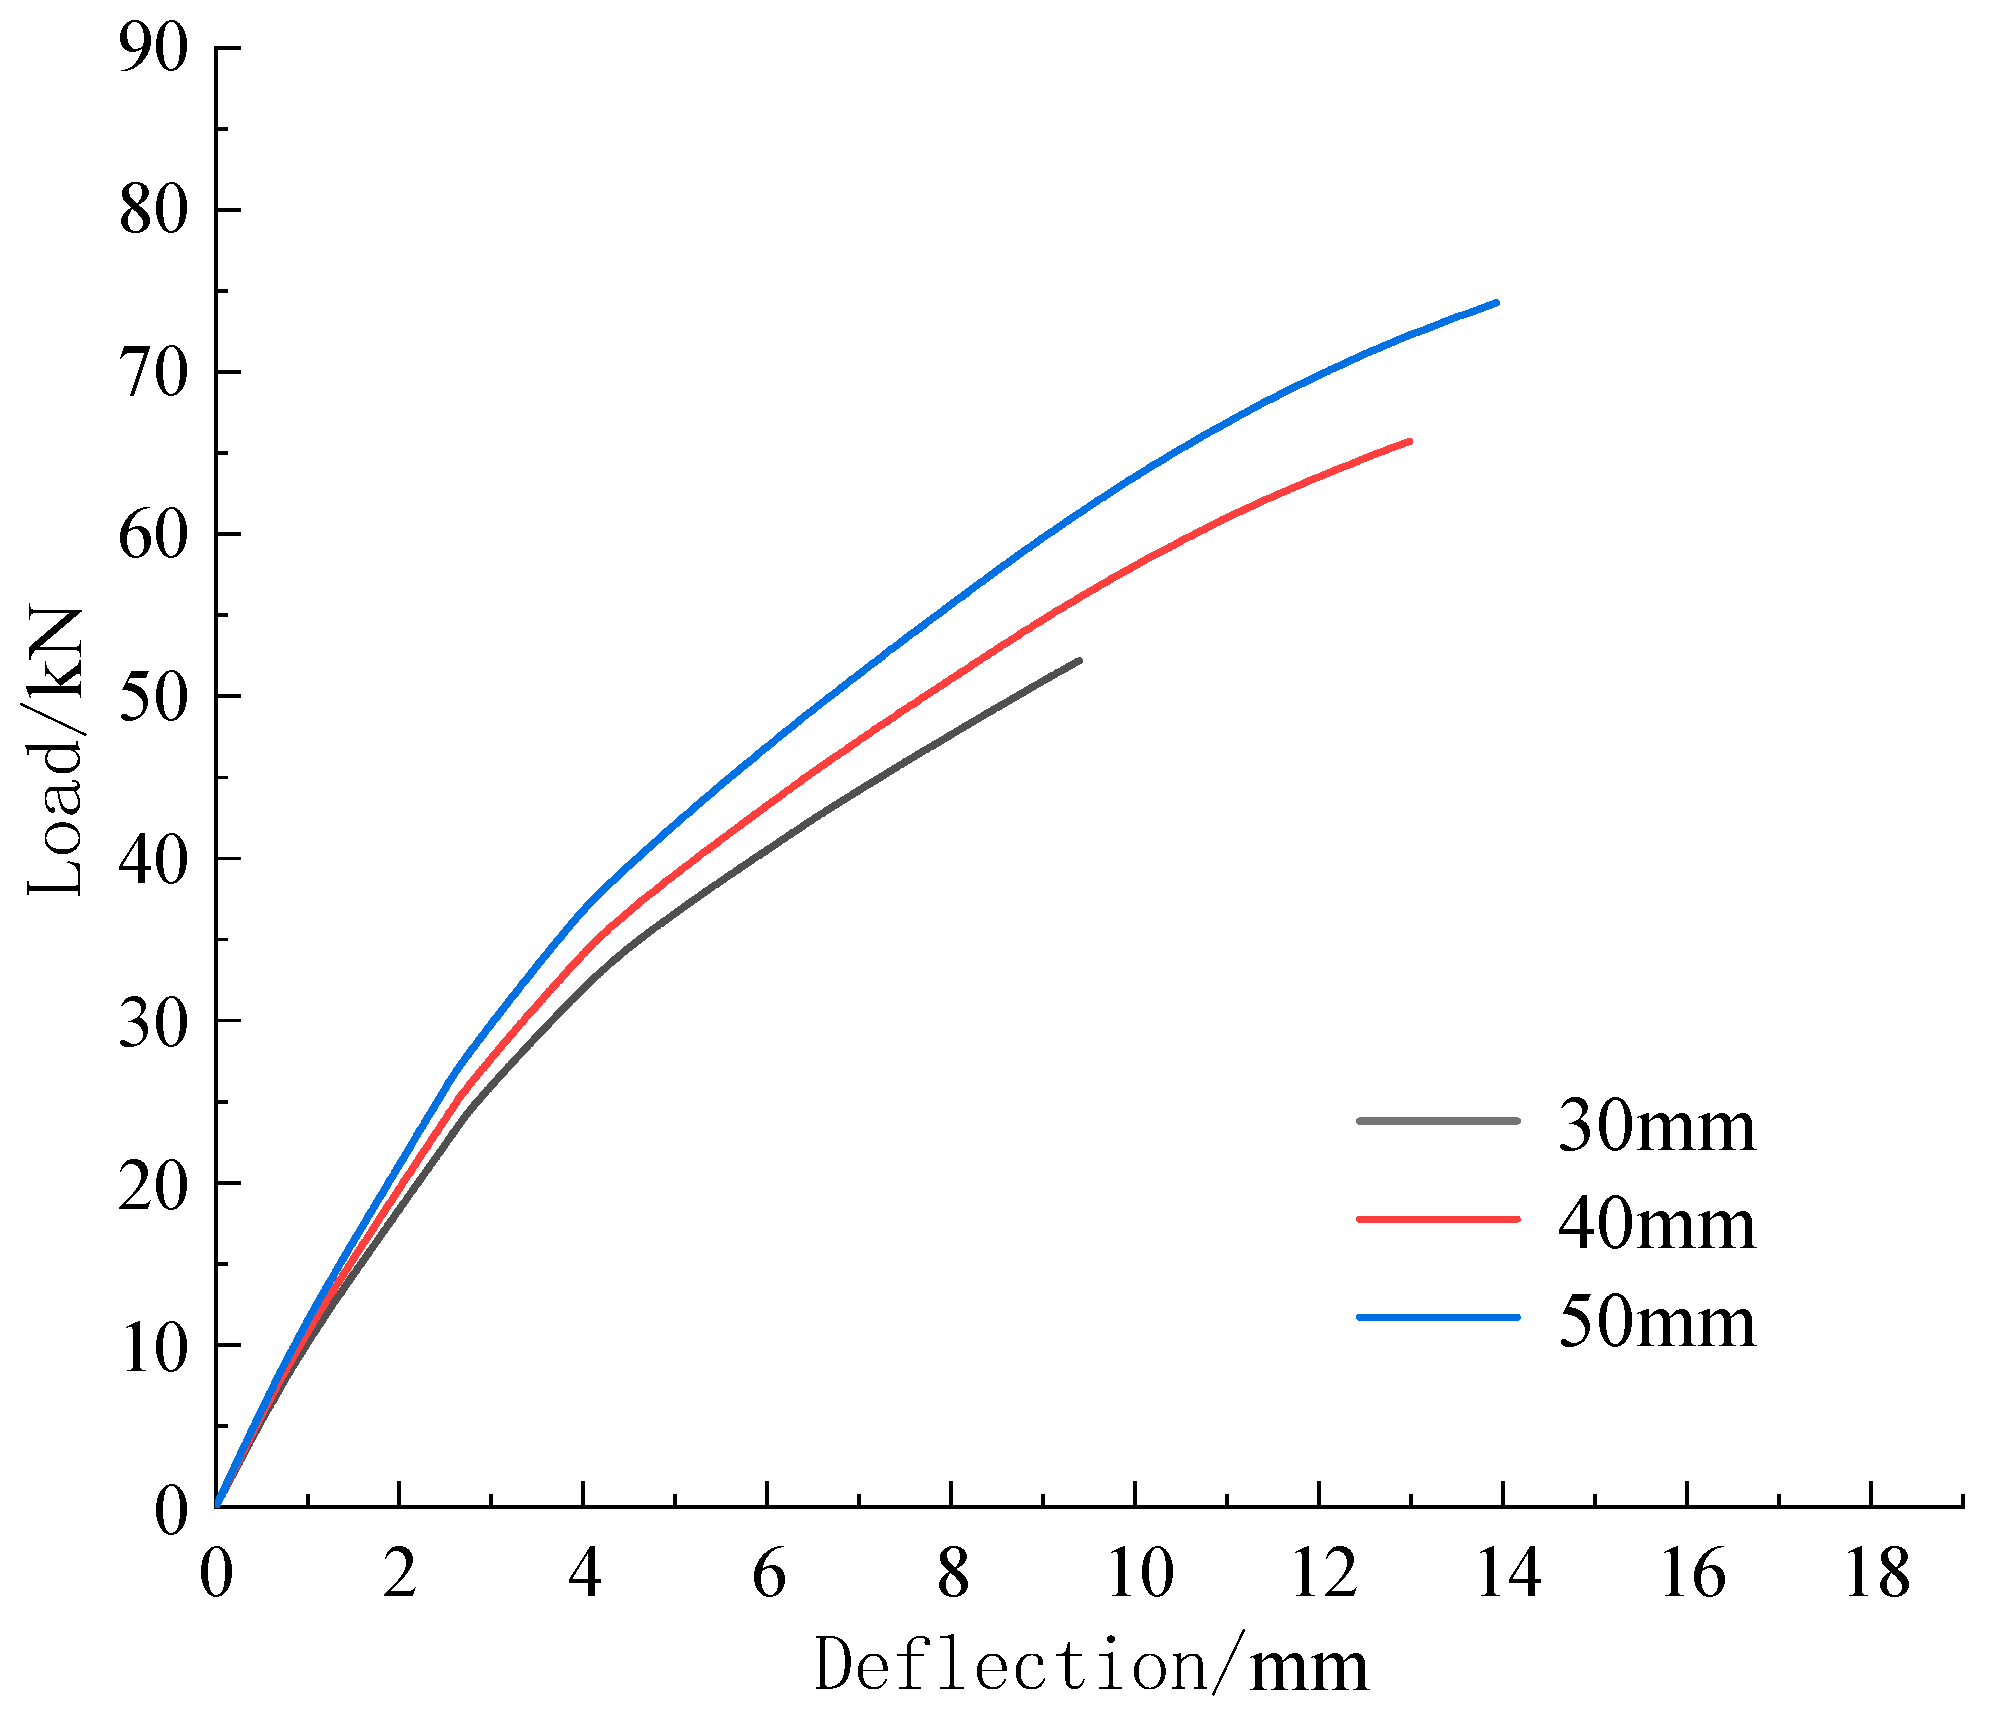
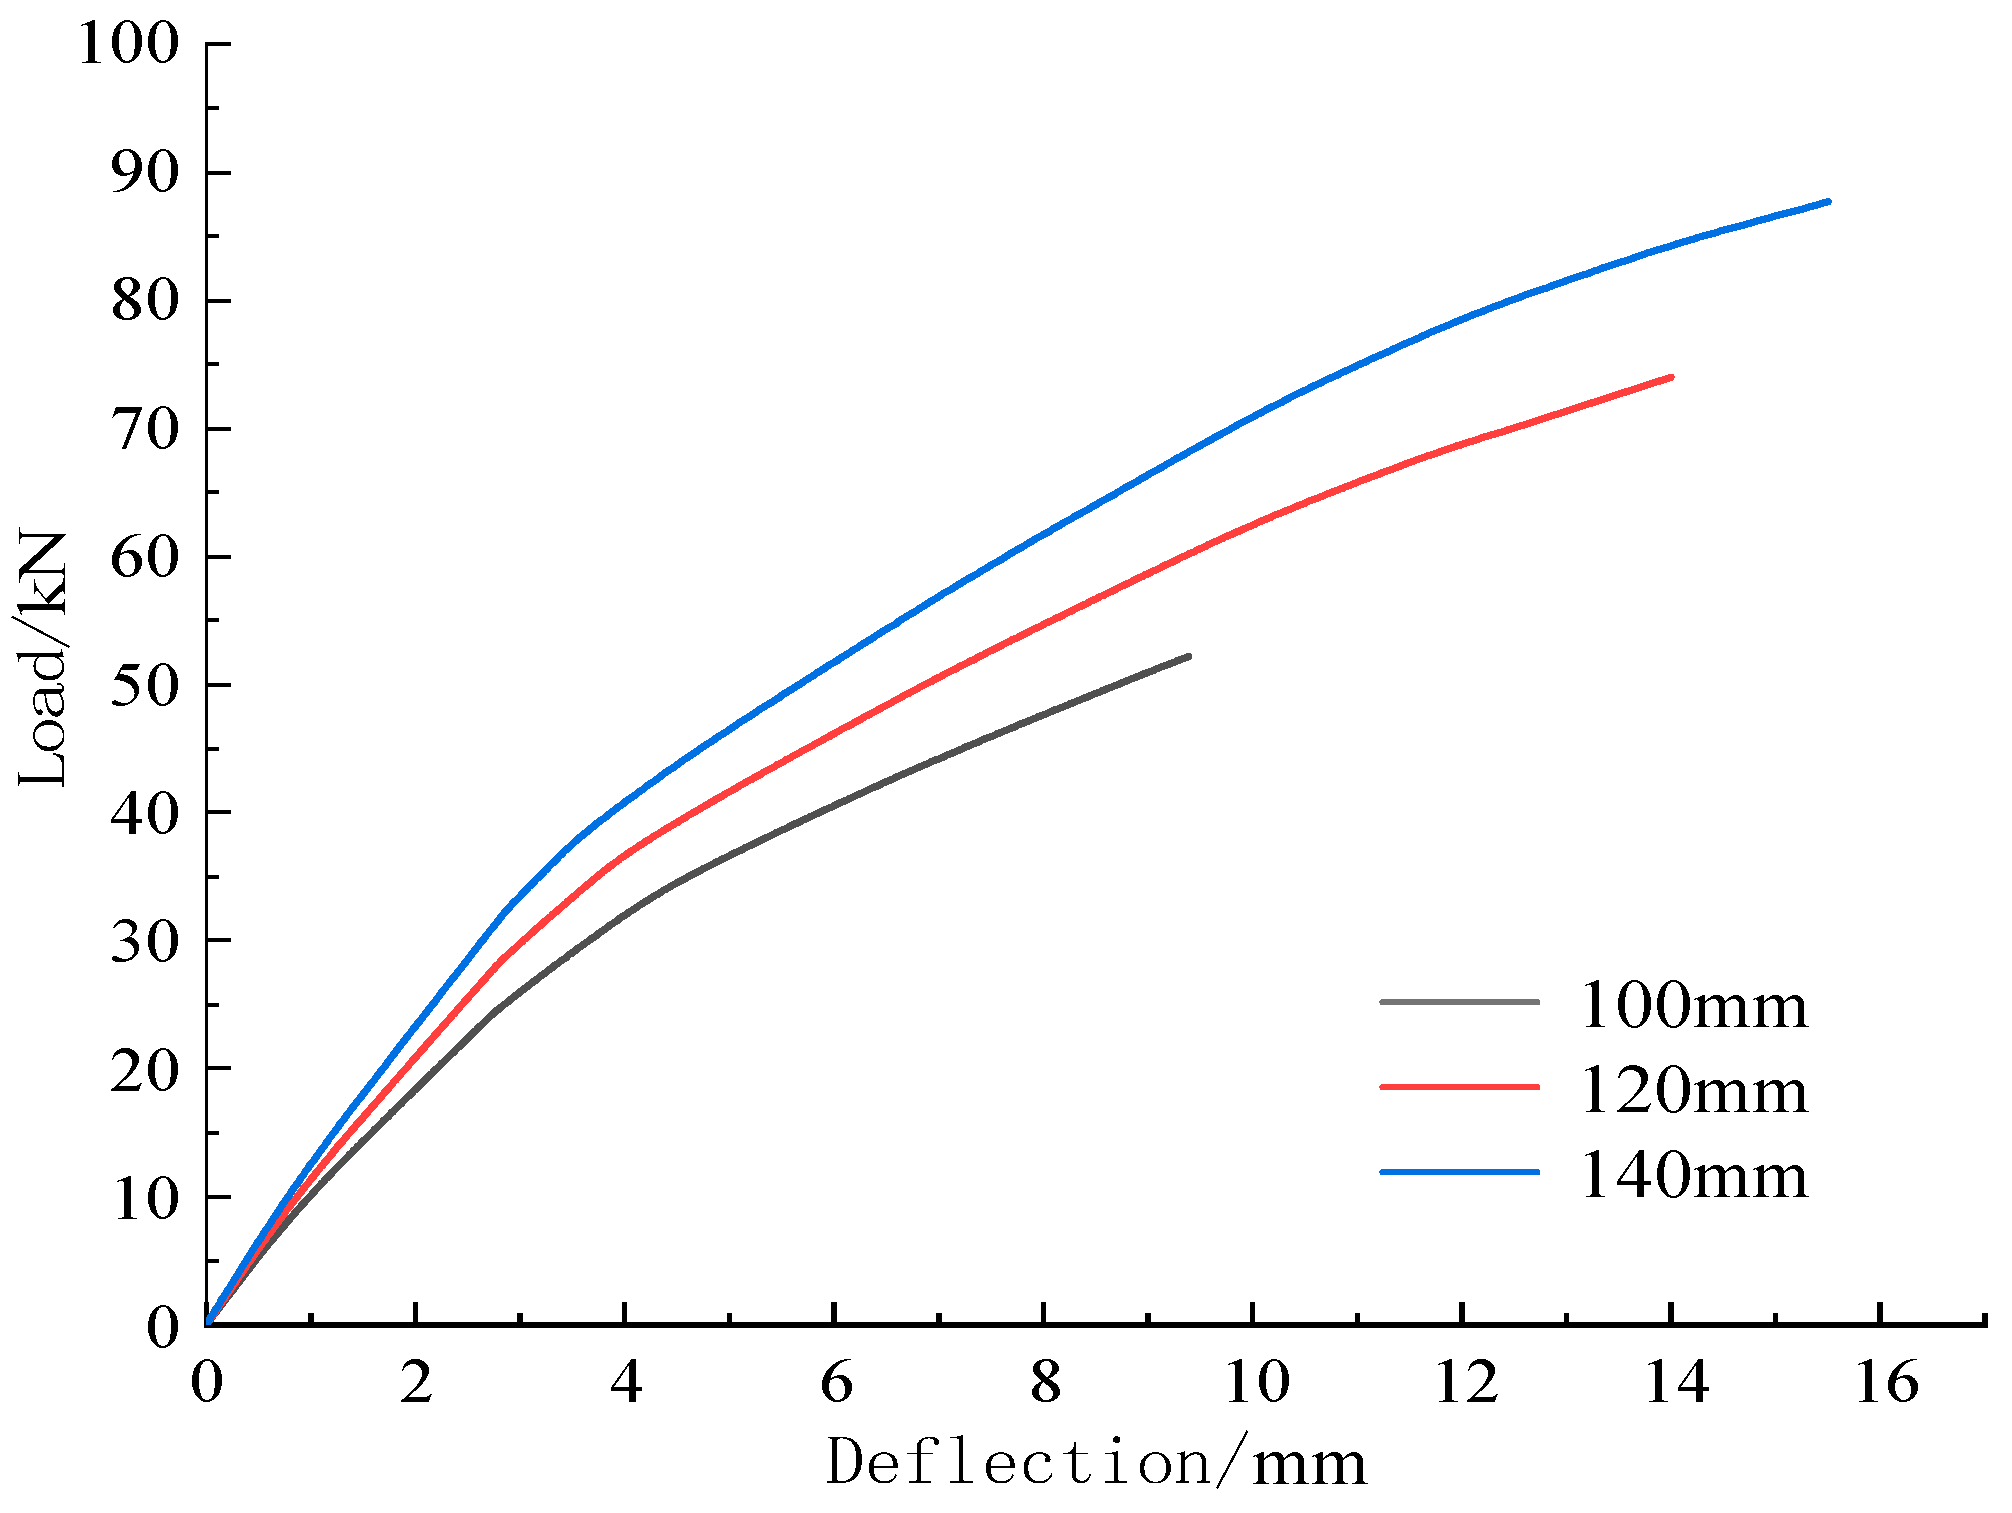
4.2. Influence of the Flange Thickness of Welded Thin-Walled H-Shape Steel

The effect of the flange thickness was investigated on the bending capacity of the combined beam, as shown in Figure 11 and Table 3. When the thickness of the flange of the beam L-Z-1 increased from 1.5 mm to 2 mm to the thickness of the beam L-Z-4, the bending capacity increased from 47.934 kN of the beam L-Z-1 to 67.958 kN of the beam L-Z-4, and the maximum bending capacity increased by 20.024 kN, with an increase of about 41.77%. When the thickness of beam L-Z-4 increased from 2 mm to 2.5 mm of beam L-Z-5, the maximum bending bearing capacity increased from 67.958 kN of beam L-Z-4 to 79.169 kN of beam L-Z-4, increasing the bending bearing capacity by 11.211 kN by about 16.50%. Consequently, the maximum bending bearing capacity of the corresponding combined beam was also different due to the various thicknesses of the welded thin-walled H-type steel flange. With the gradual increase in the flange thickness of the welded thin-walled H-shape steel, the maximum bending bearing capacity was gradually enhanced, but the increase was gradually smaller. Therefore, the optimum flange thickness was 2 mm.

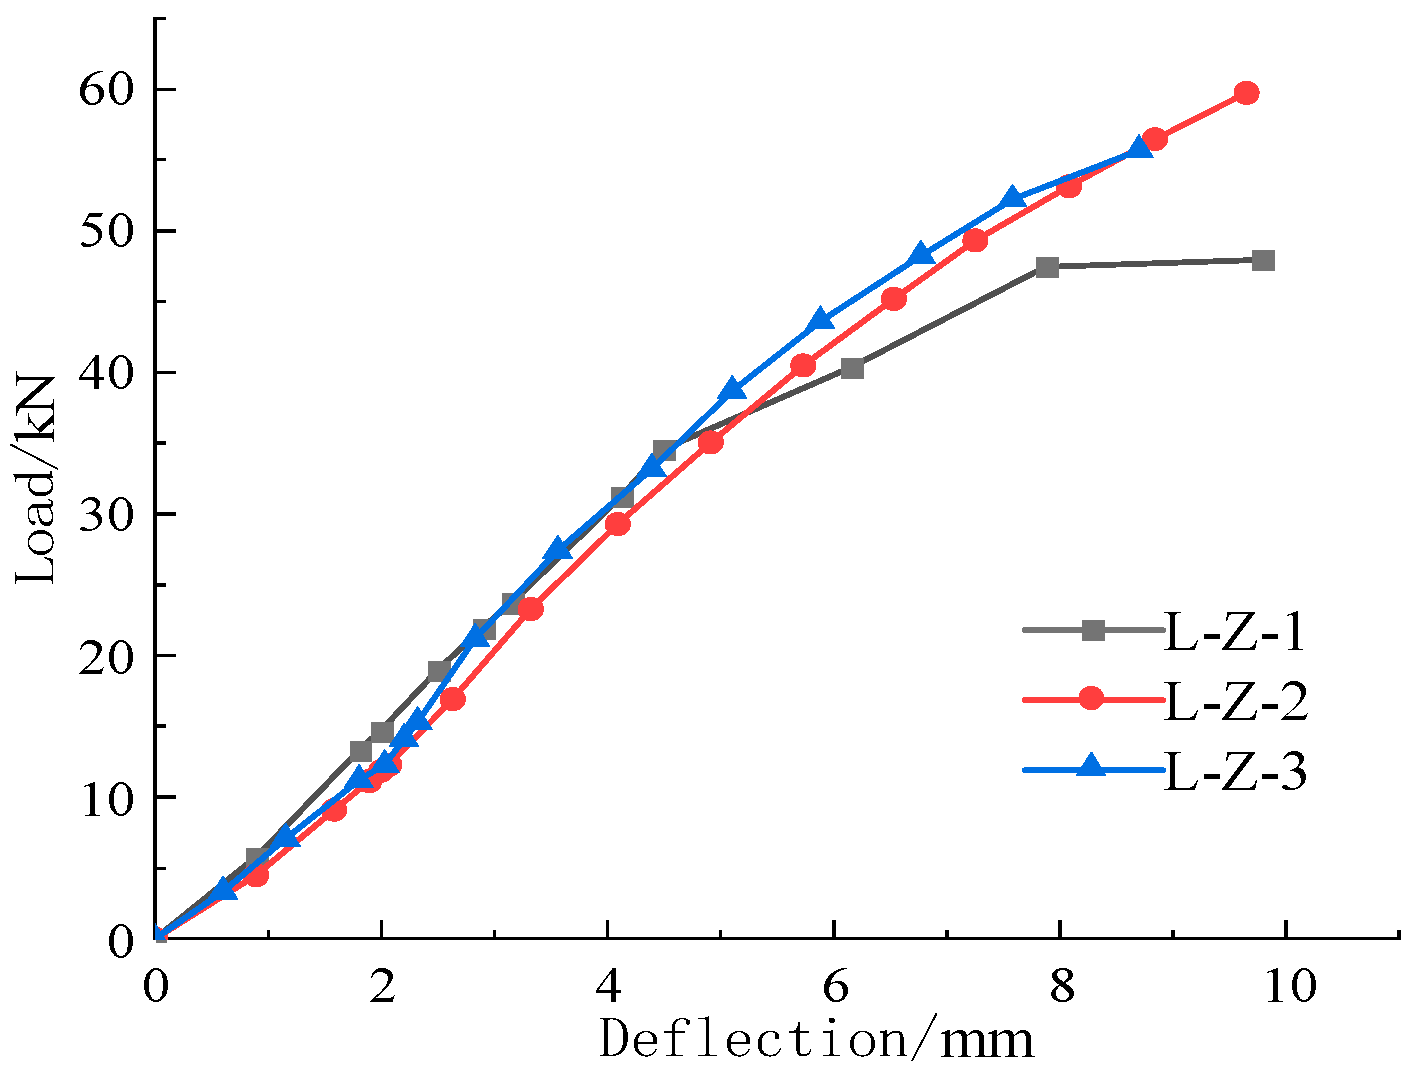
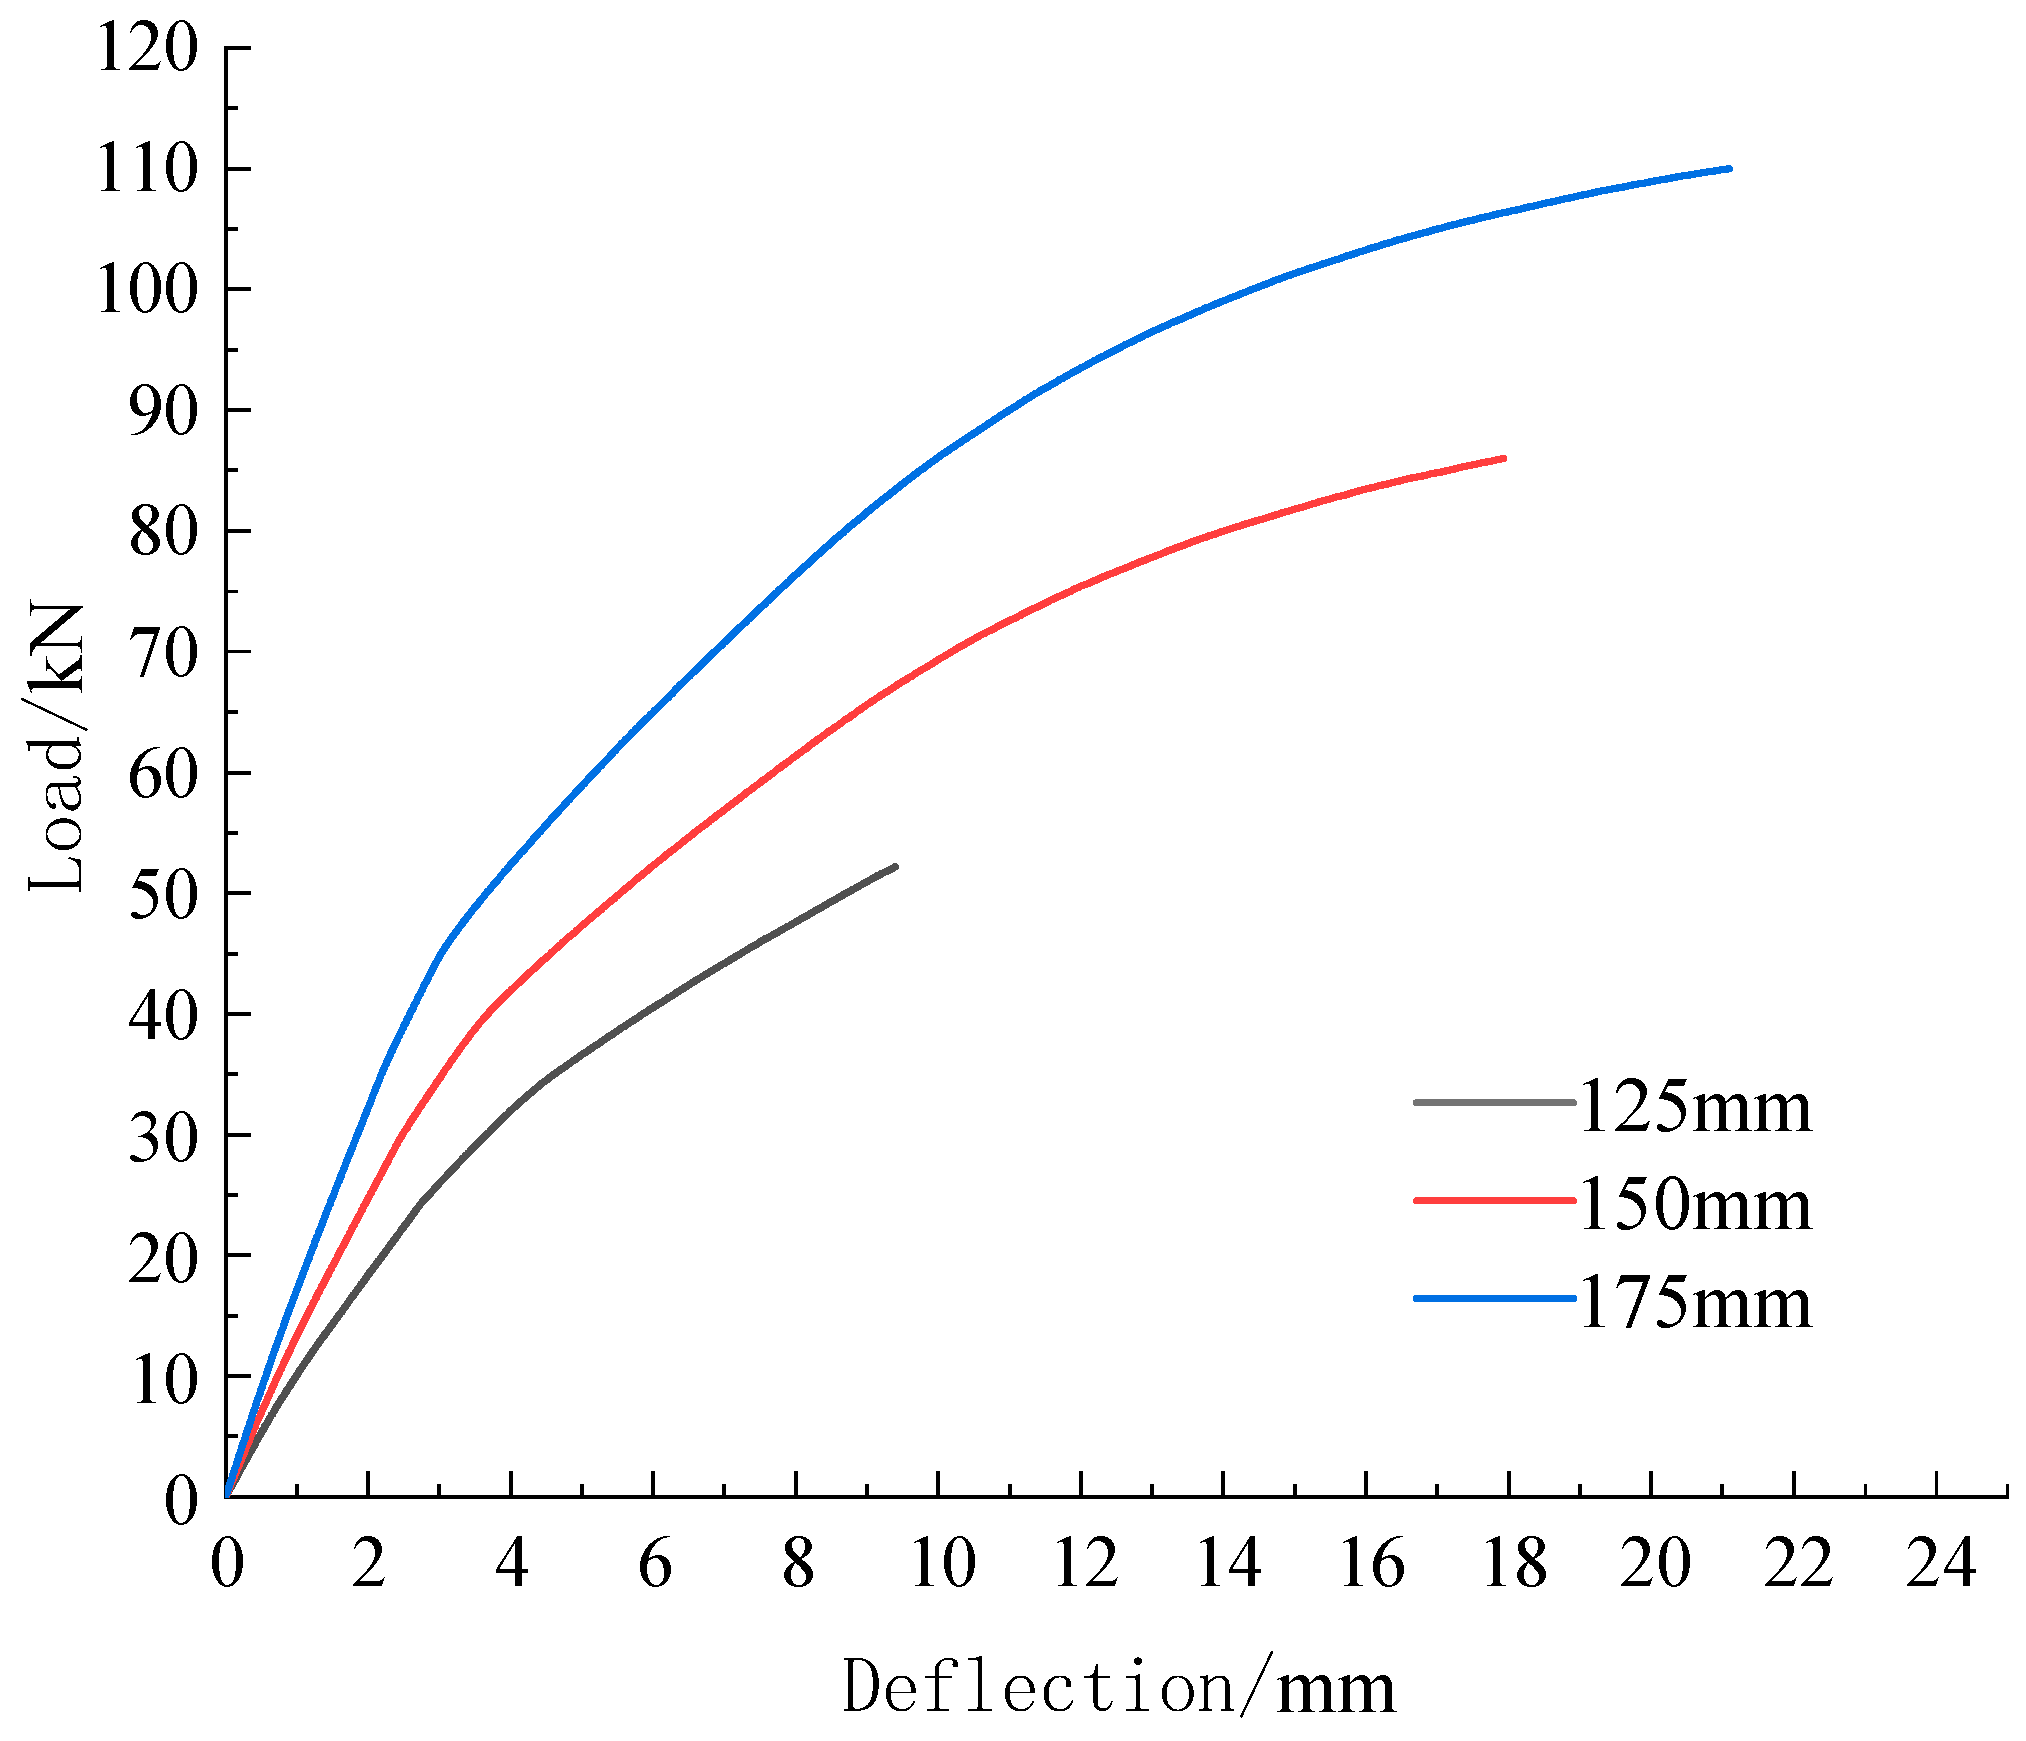
4.3. Effect of the Upper Flange Thickness

The combined beam load-mid-span deflection curve is shown in Figure 12. Compared with the L-Z-1 combined beam and L-Z-2 combined beam, the thickness of the upper flange covered-board of H-shape steel increased from 30 mm to 40 mm, and the corresponding bending bearing capacity was enhanced from 47.934 kN to 59.720 kN, with an increase by 24.59%. Compared with the beam L-Z-2 and the beam L-Z-3, when the thickness of the upper flange covered-board increased from 40 mm to 50 mm, the bending bearing capacity was not much different. The reasons might be due to the processing error of the component and the uneven coating on the adhesive surface. However, from the three curves in the figure, the overall bending stiffness of combination beam L-Z-3 was constantly greater than that of combination beam L-Z-2. Before the mid-span displacement reached 8.77 mm, the bending bearing capacity of combined beam L-Z-3 was steadily higher than that of combined beam L-Z-2. Overall, the bending bearing capacity is improved. According to the analysis, the thickness of the flange of the steel H-beam caused a significant influence on the bending bearing capacity of the combined beam. After the increase in the board thickness, the overall height of the composite beam was enhanced, and the bending bearing capacity also gradually increased.

5. Finite Element Parameter and Results Comparison

5.1. Finite Element Model Establishment

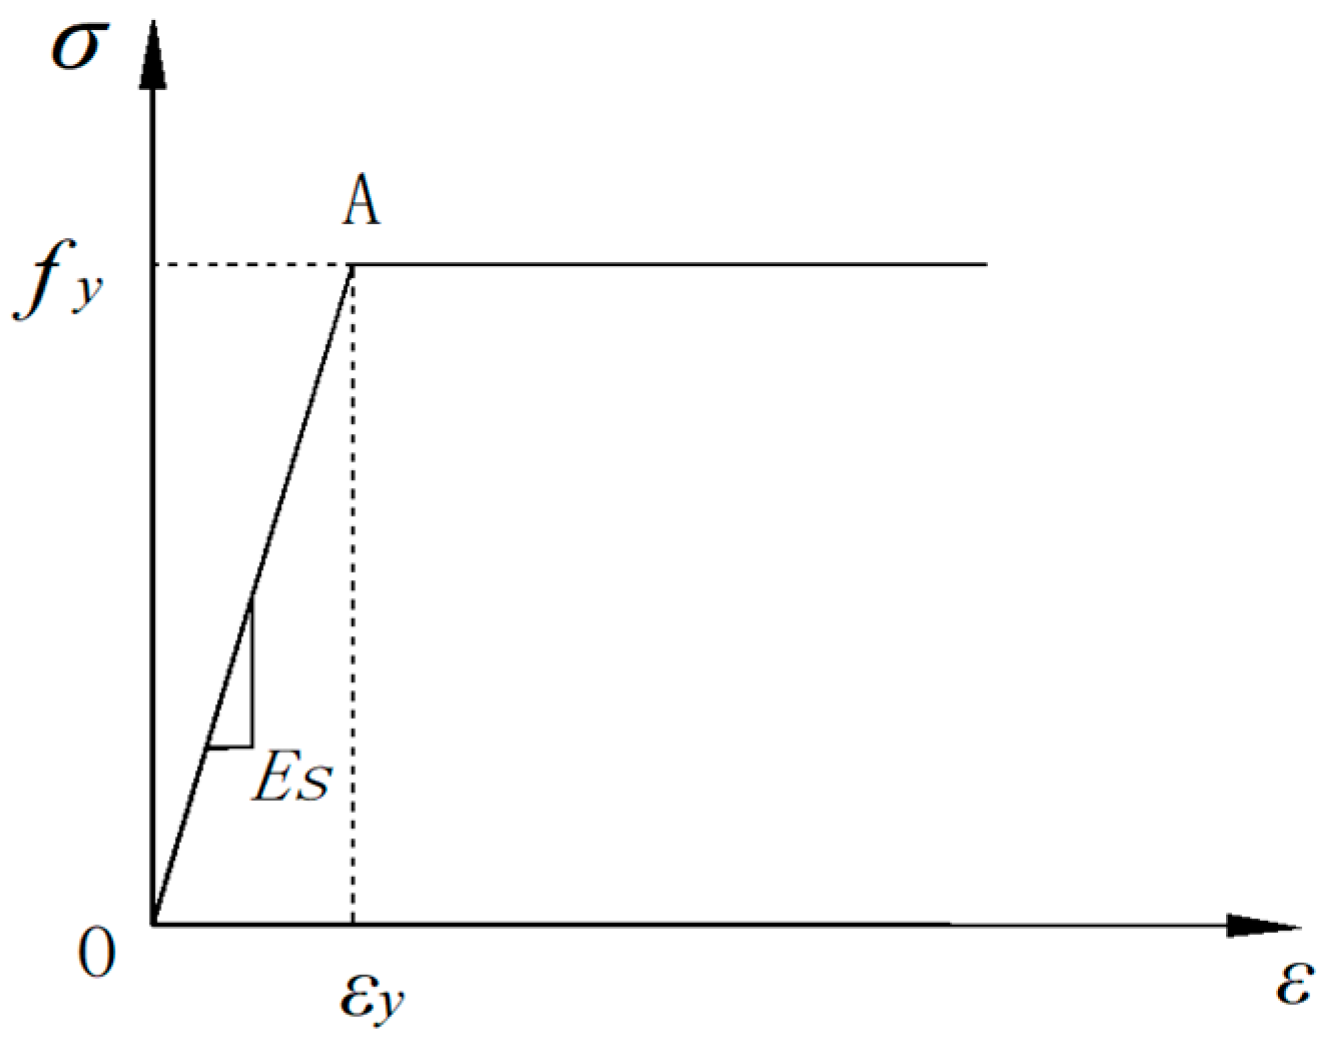
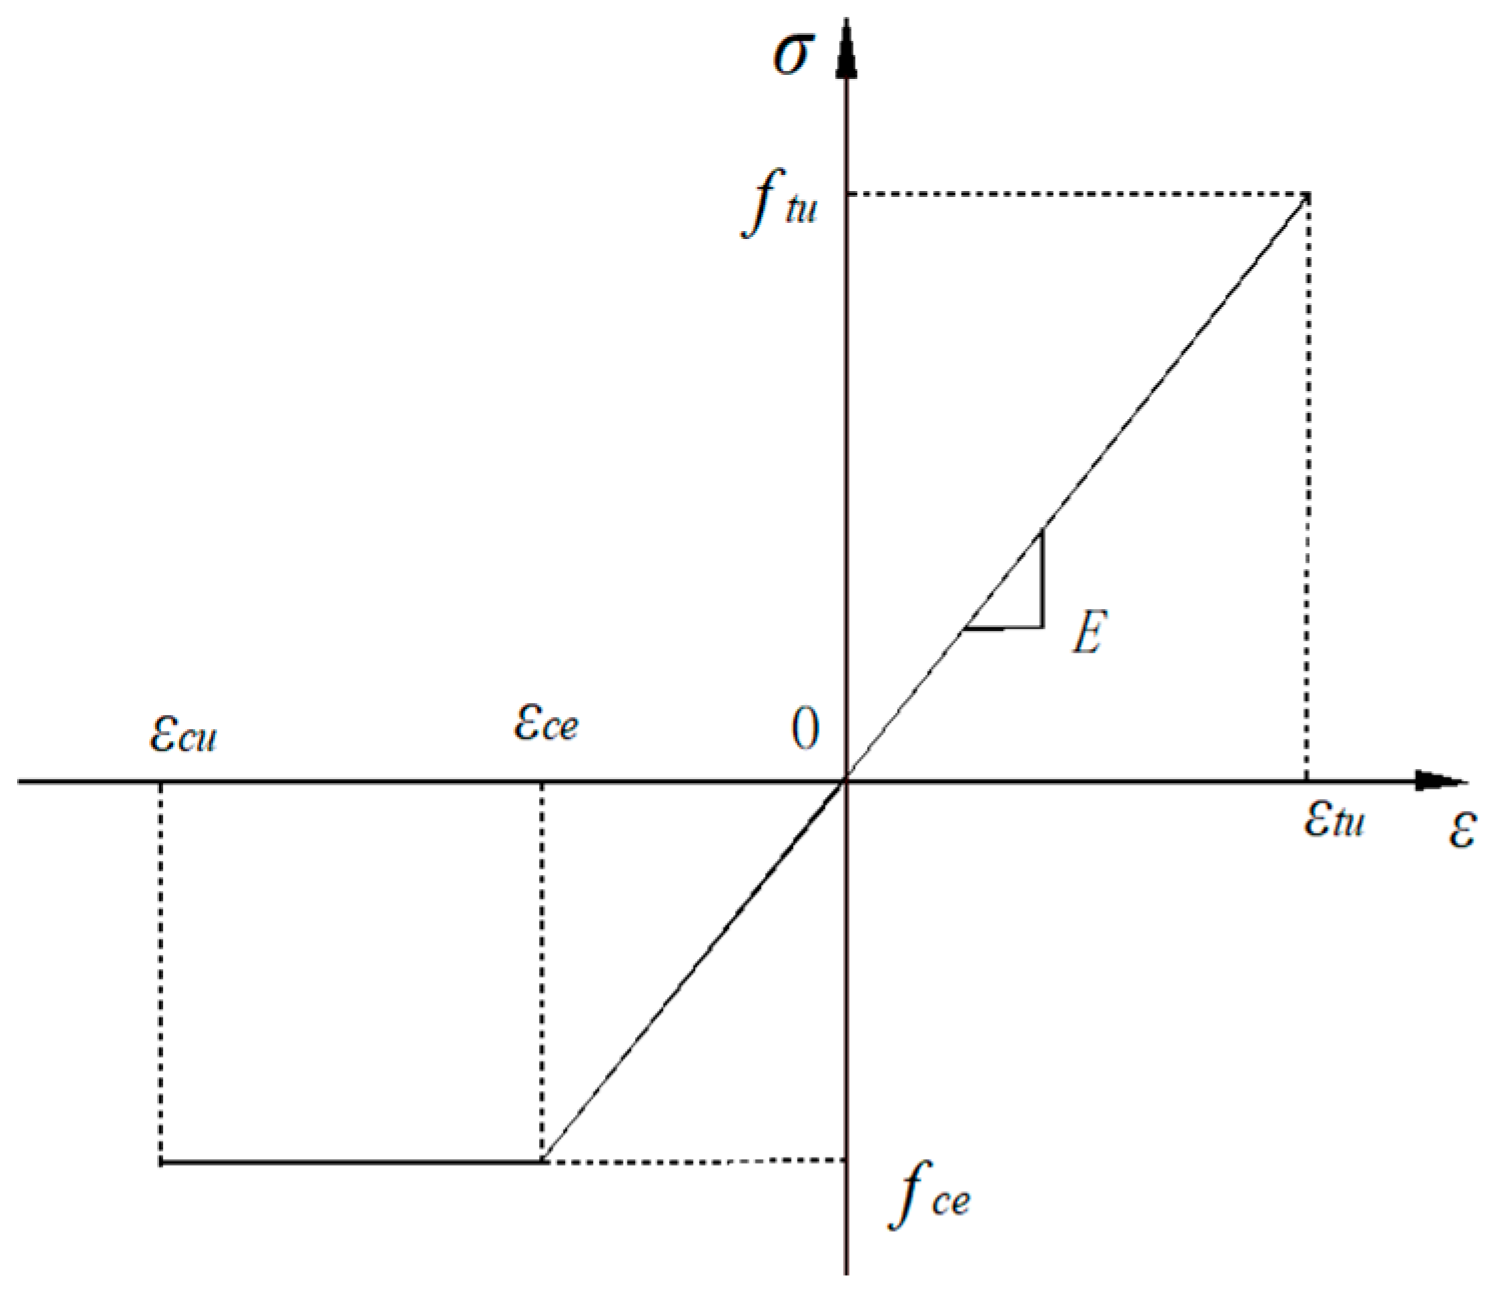
5.1.1. Basic Assumptions and Material Constitutive Relationship

(1)
Basic assumption
  • The wood when pulled and pressed; There was no relative sliding between;
  • Steel and wood; without considering the influence of slip;
  • The influence of residual stress and residual deformation was not considered during steel welding;
  • The natural defects, creep, and stress relaxation of the wood itself were not considered.
(2)
Steel constitutive structure
The failure of the combined beam was due to the failure of the wood on both sides of the H-shape steel web after reaching the tensile strength, and the steel failed to play the ultimate tensile strength role. The steel conformed to the ideal elastic–plastic model. Its constitutive relationship is shown in Figure 13.
(3)
Wood constitutionality
Wood constitutive followed the Chen [26] constitutive relation as an ideal elastoplastic model as shown in Figure 14.

5.1.2. Material Properties

Wood belonged to the orthogonal anisotropic material. The longitudinal direction (L) was the wood length direction, as indicated by the main direction 3. Radial (R) was indicated by primary direction 2, and tangential (T) was represented by primary direction 1. The engineering constant was selected in the elastic type. The timber property index parameters of the wood were inputted as shown in Table 4. The material direction of the wood was assigned.
The properties included Q235B steel, elastic modulus 2.03 × 10⁵ MPa, Poisson ratio 0.3, yield strength 285.64 MPa. The steel pad block was set as a rigid body.

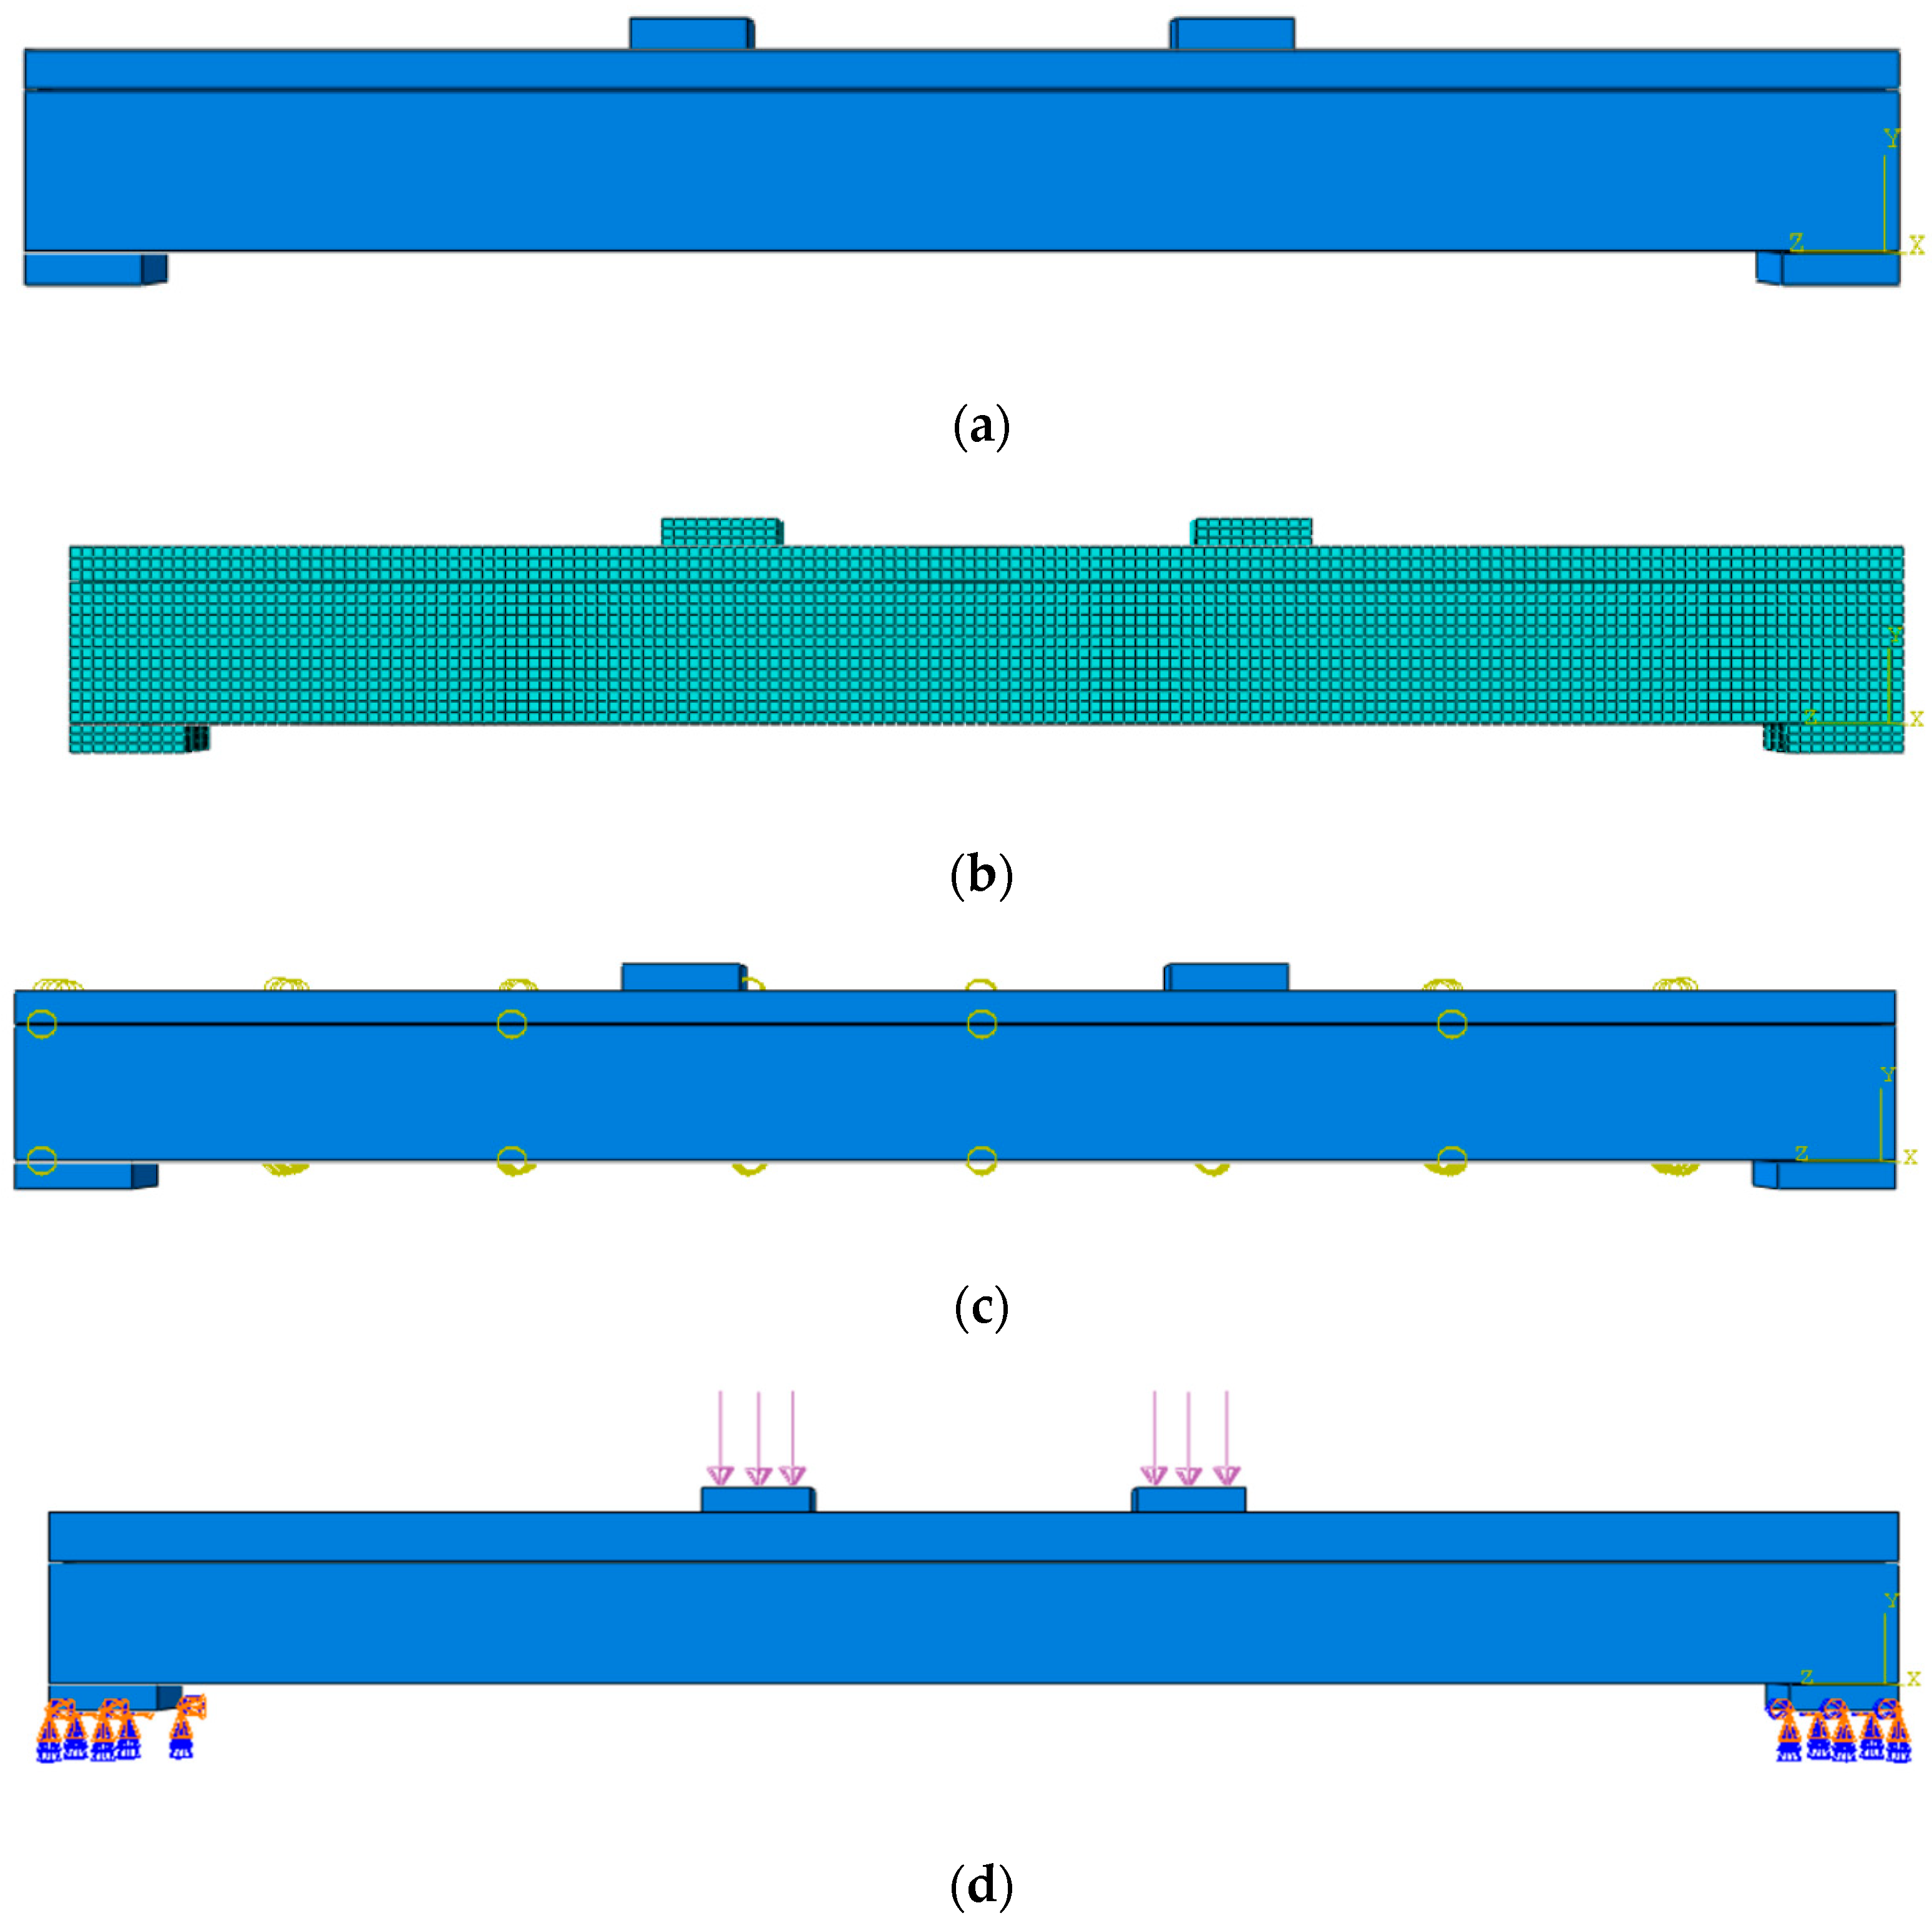
5.1.3. Model Establishment

The components were divided into three categories for modeling, including wood, steel, and pads. The overall model of the combined beam is shown in Figure 15a.

5.1.4. Grid Division

A structured partition geometric model was used. The model grid size was 10 mm. The components were gridded by swept-through arranging seeds on the geometric model (Figure 15b).

5.1.5. Definition of Interface Interactions

This paper uses the overall combination beam as the research object, and the connection between the components is not the focus of this paper. The connections at different sites used the “Tie” binding constraints. The connection of each part was made to achieve the purpose of common force and coordinated deformation. After the interface, the interaction is shown in Figure 15c.

5.1.6. Boundary Conditions and Loads

The model could be reduced to boundary condition constraints in the form of simple branch beams. Constraints at the support were Ux = Uy = Uz = 0 and URx = URy = 0 at one end. The other end formed sliding support with Ux = Uy = 0 and URx = URy = 0. Loading on the upper surface of the two upper steel pads was applied in an equivalent pressure form (Figure 15d).

5.2. Results of Finite Element Calculation

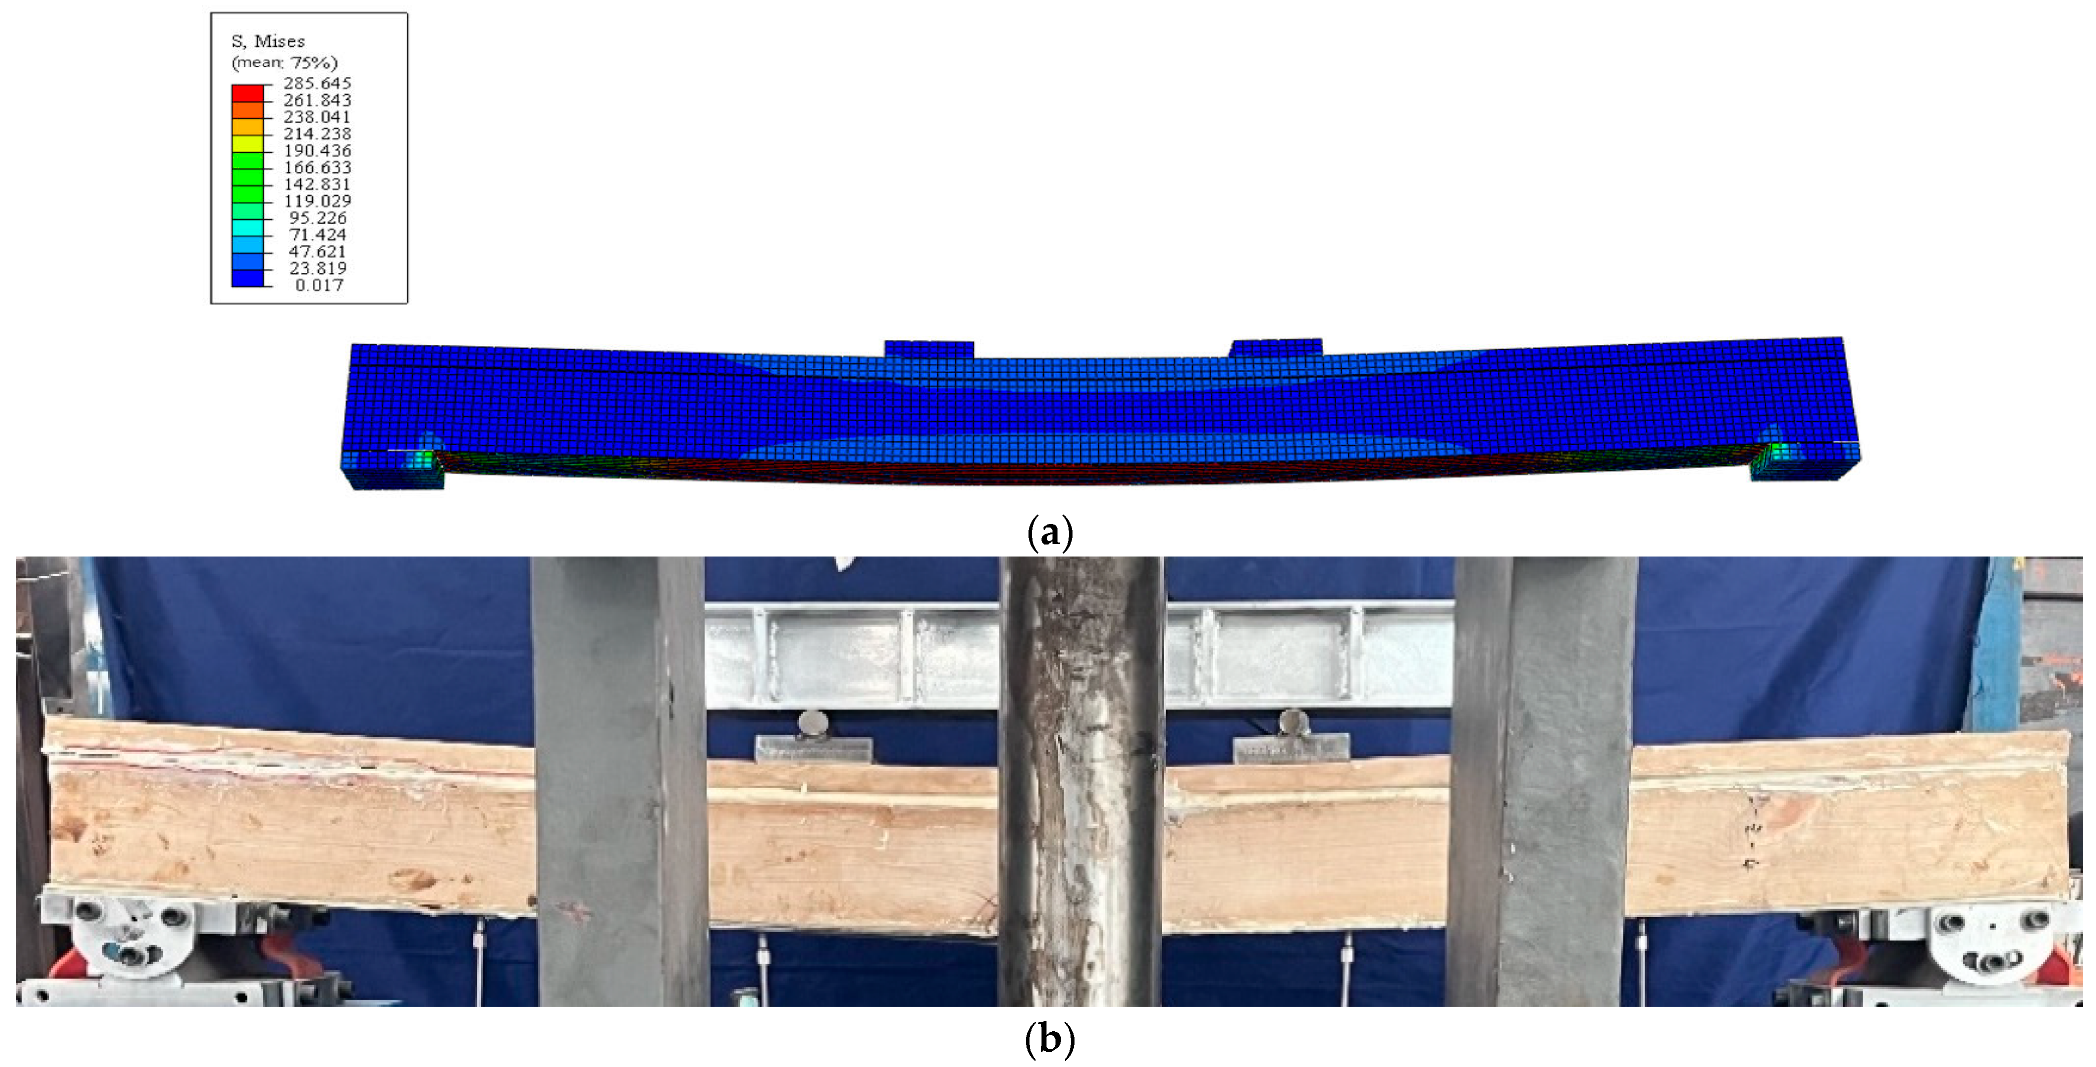
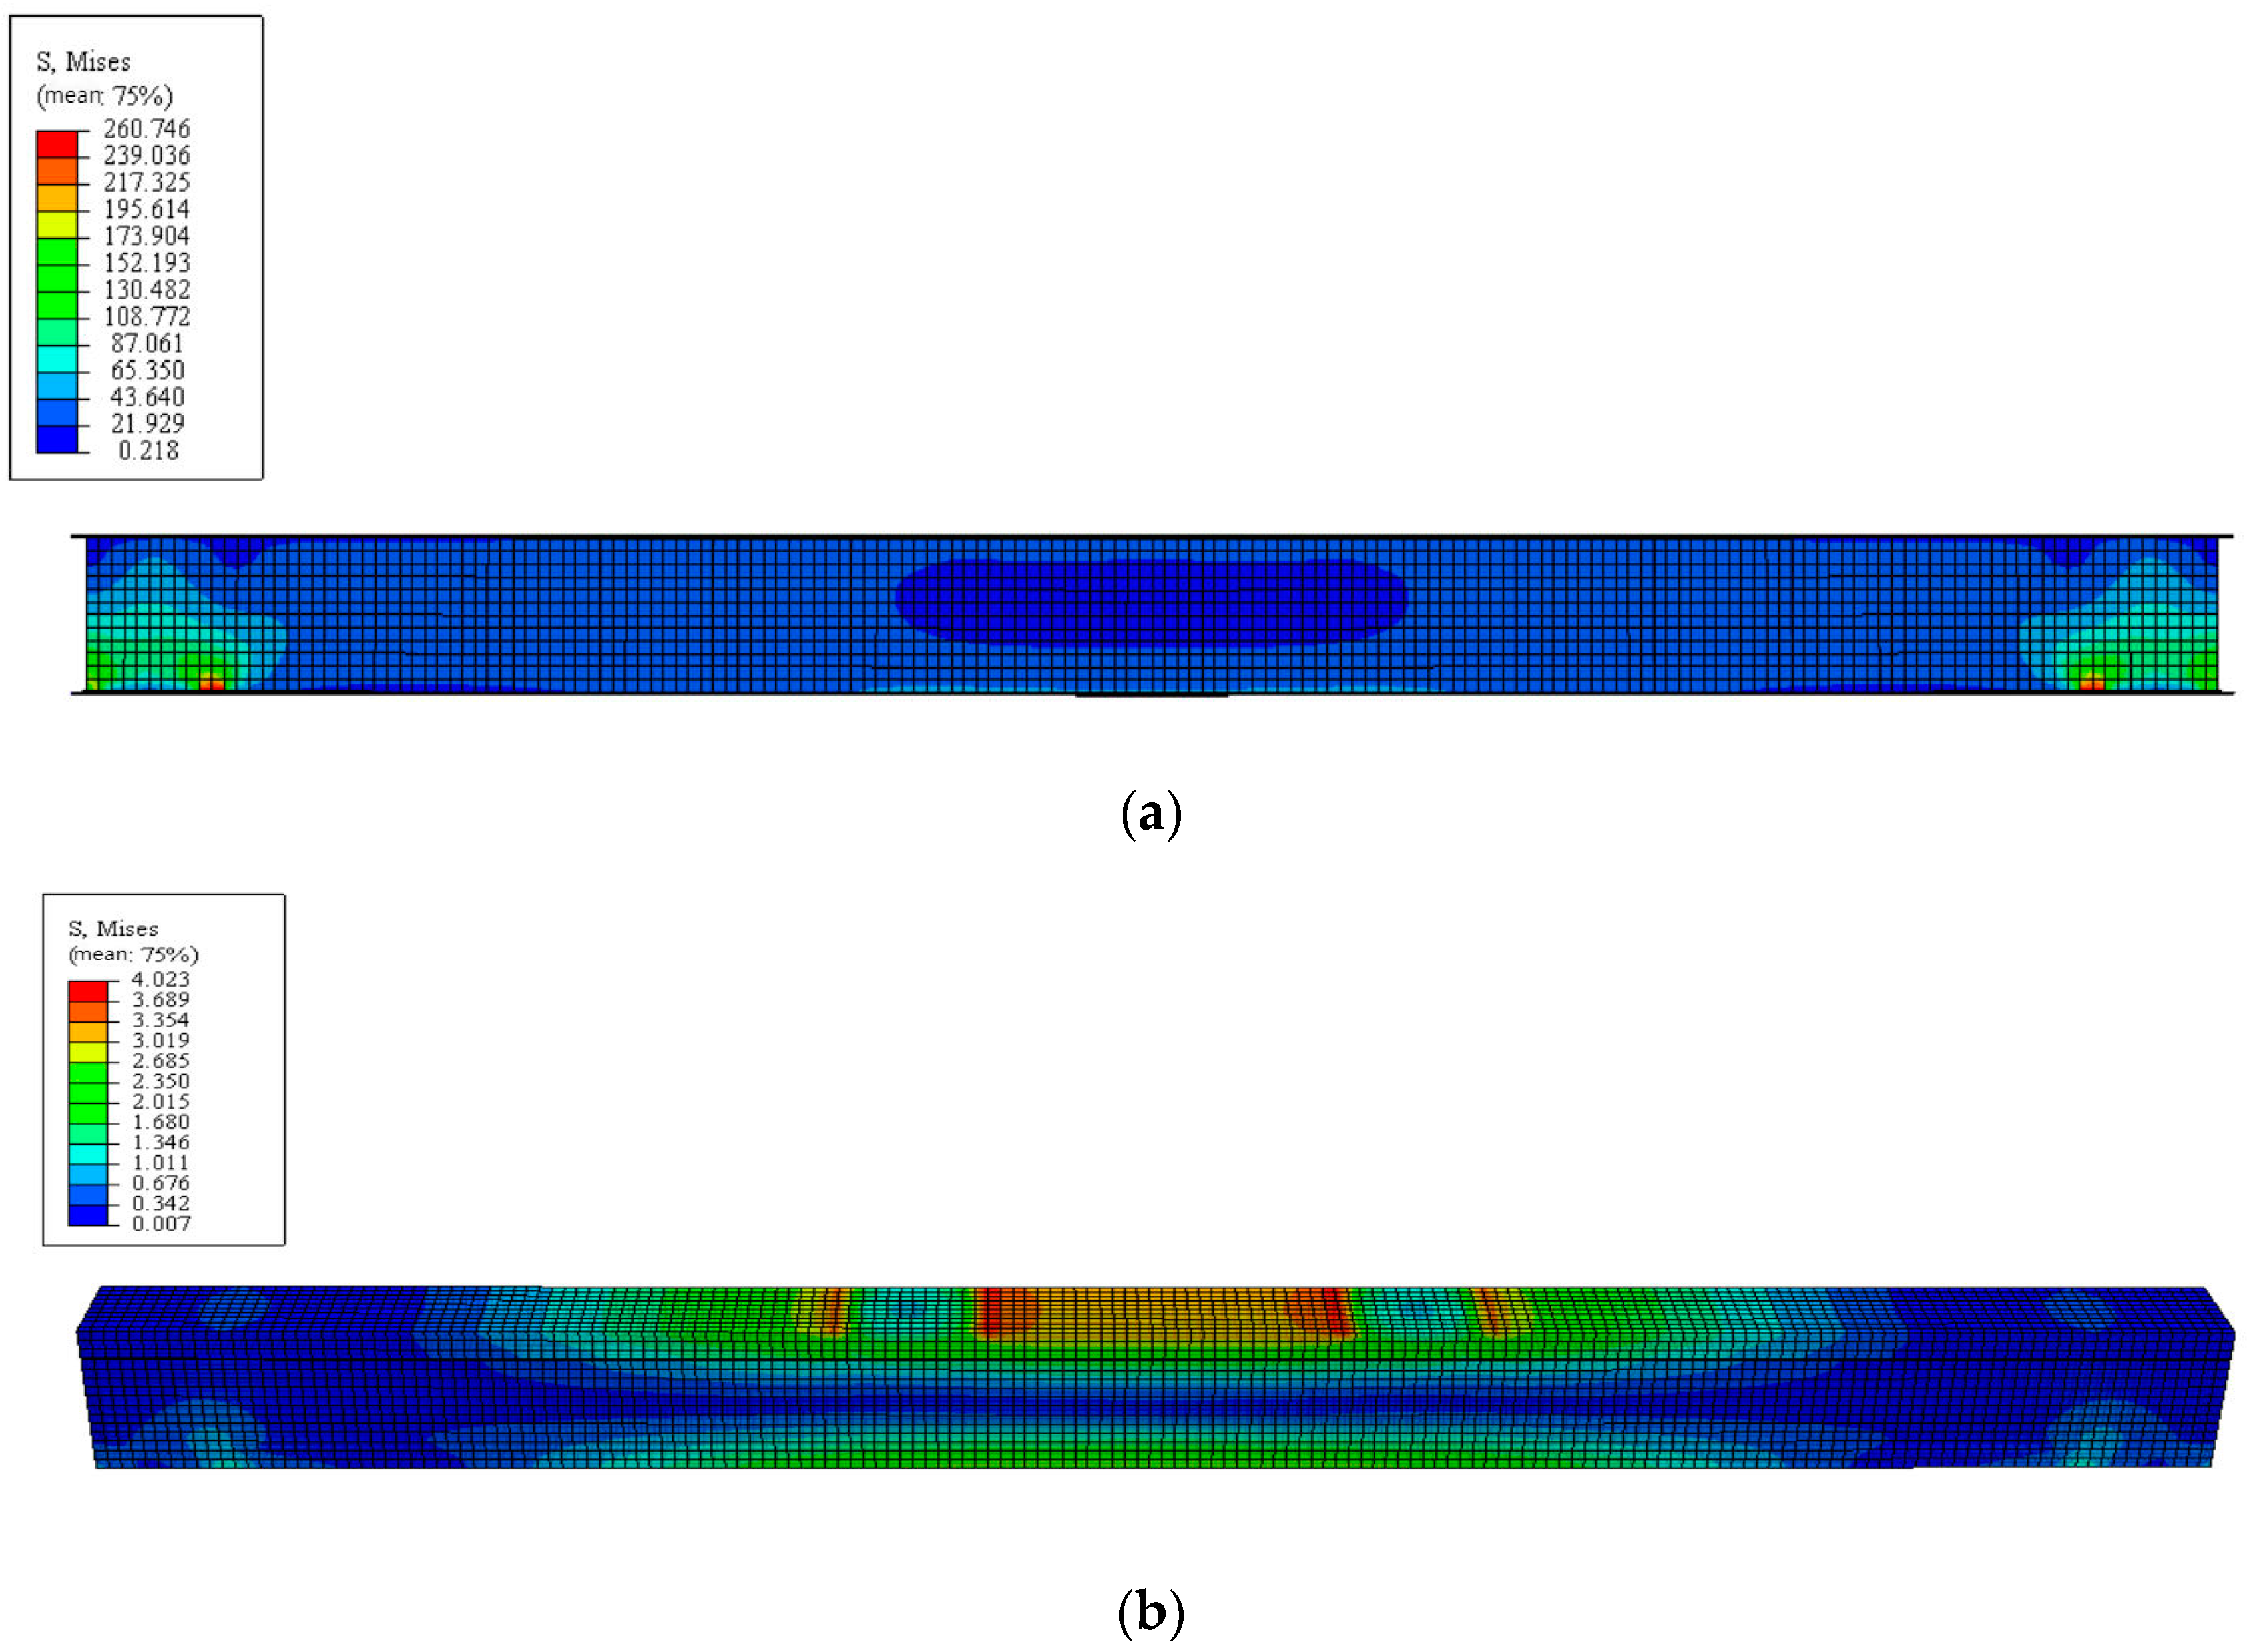
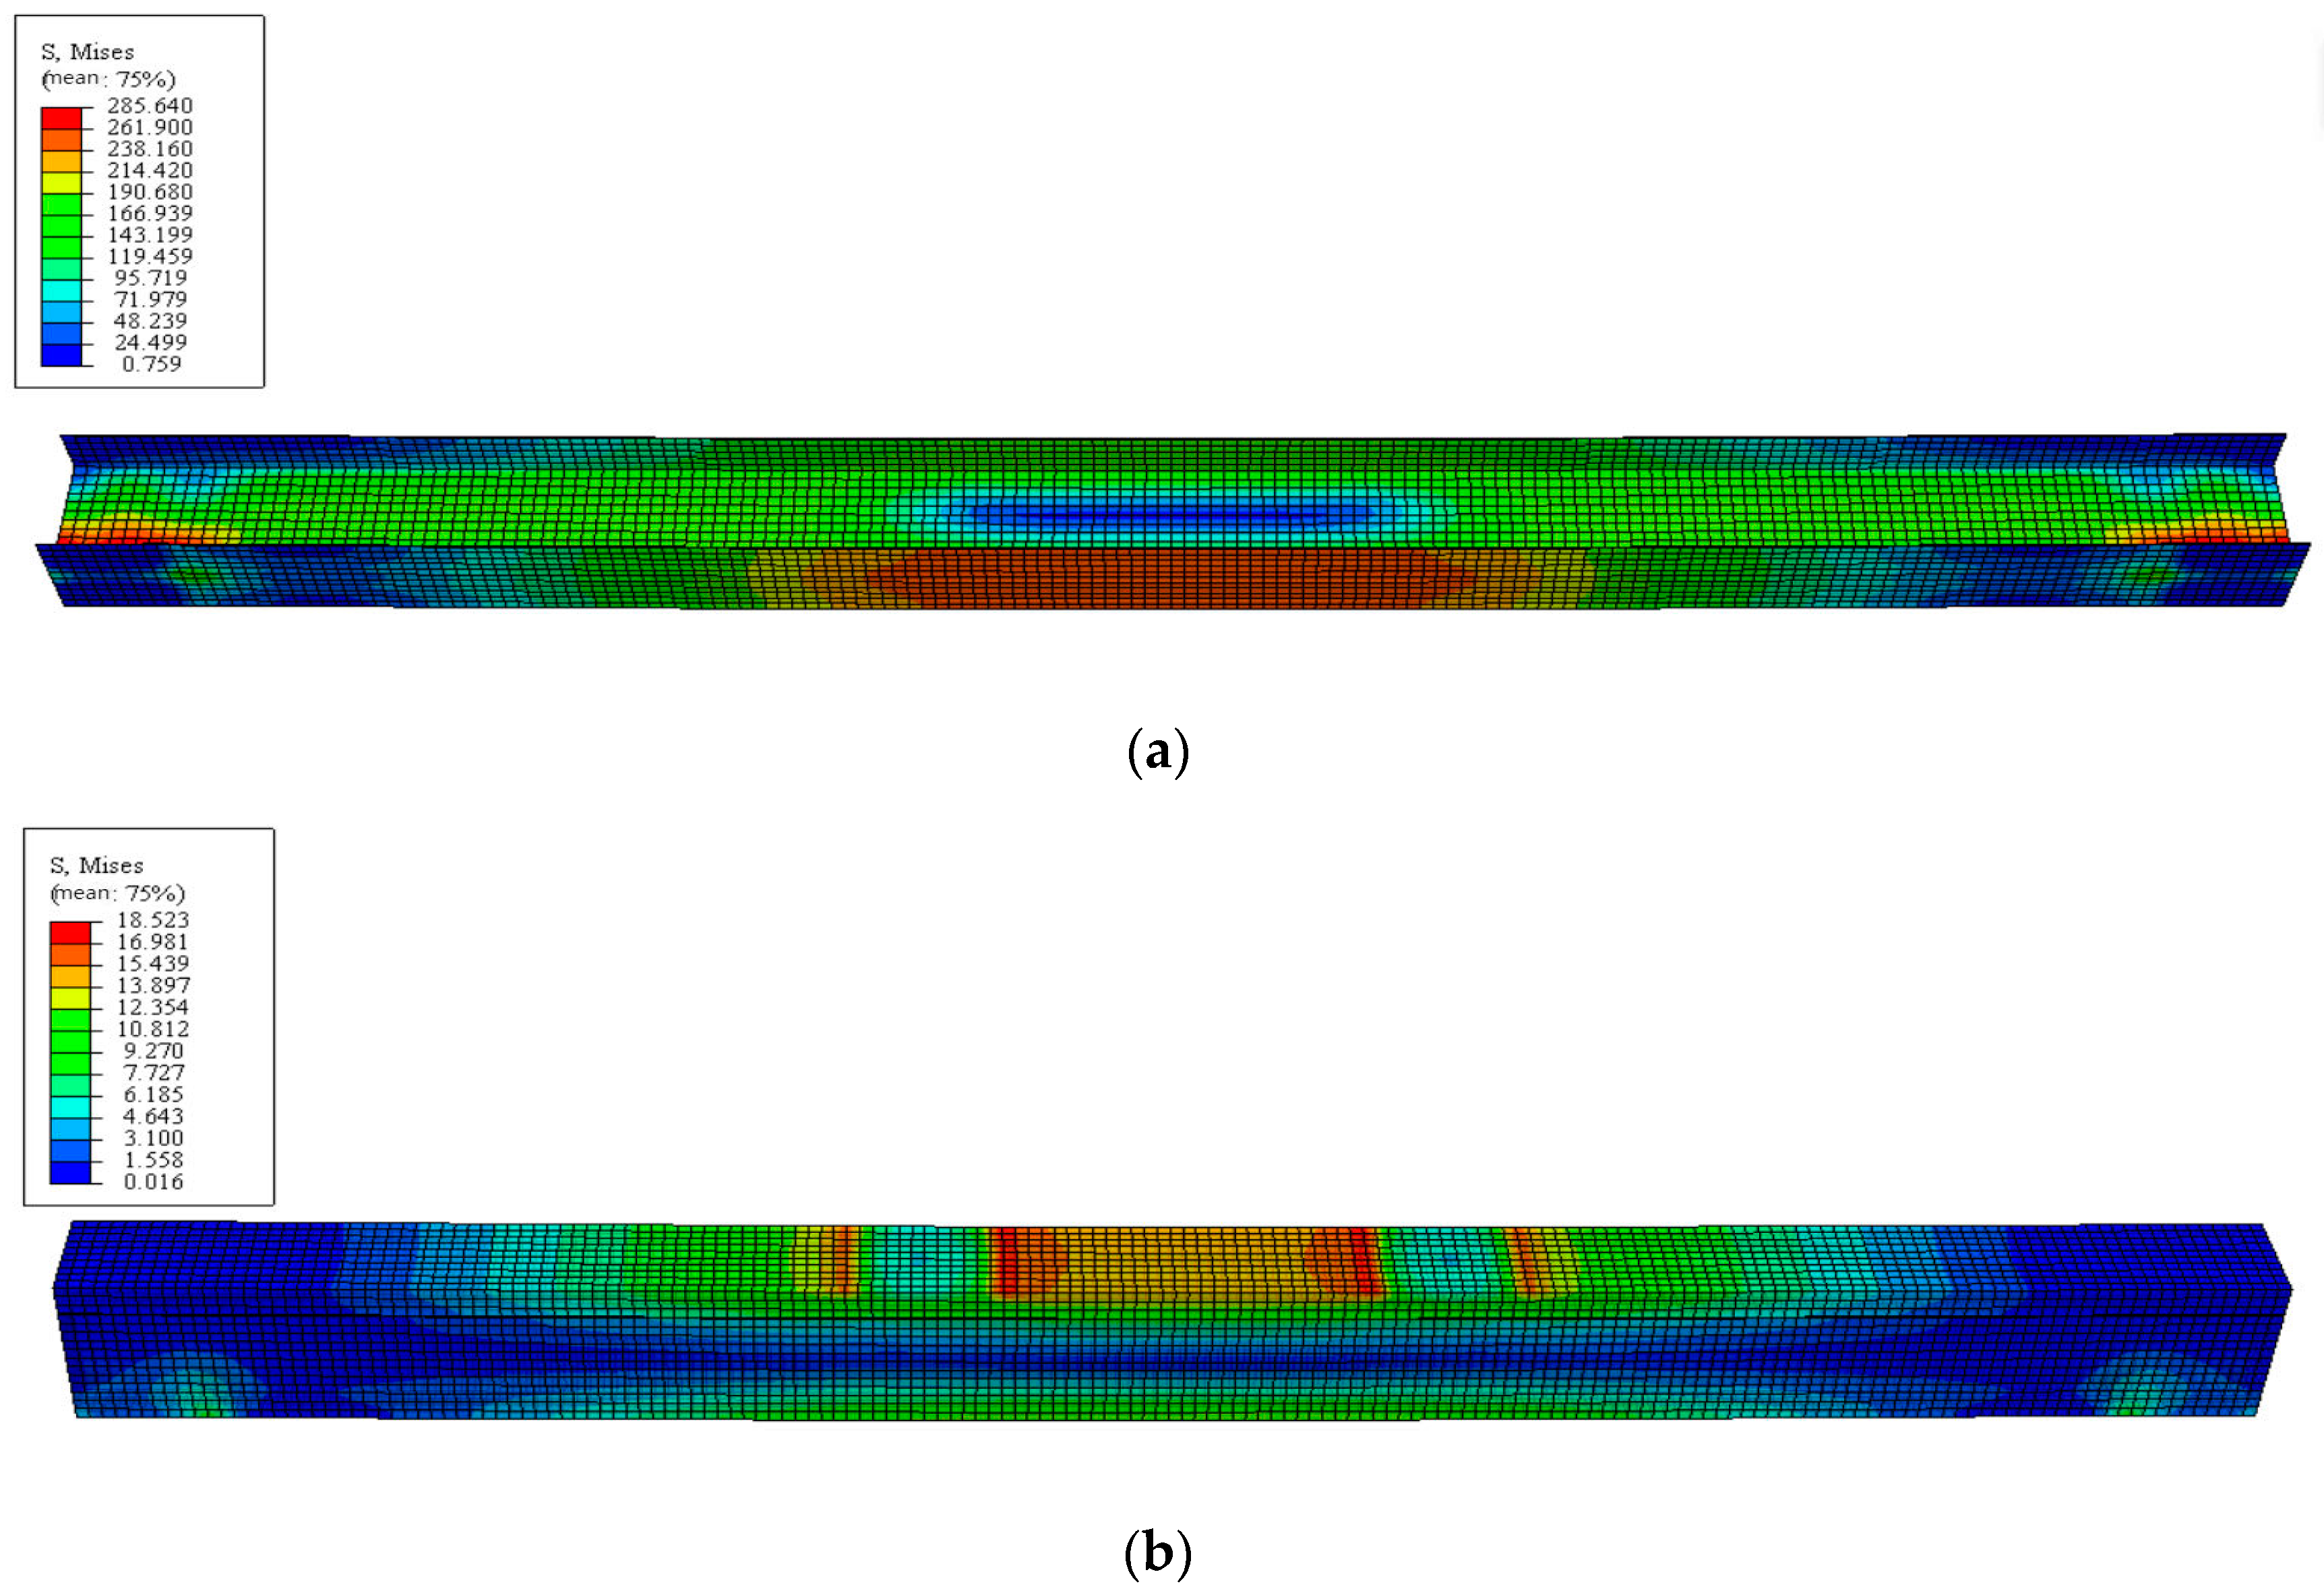
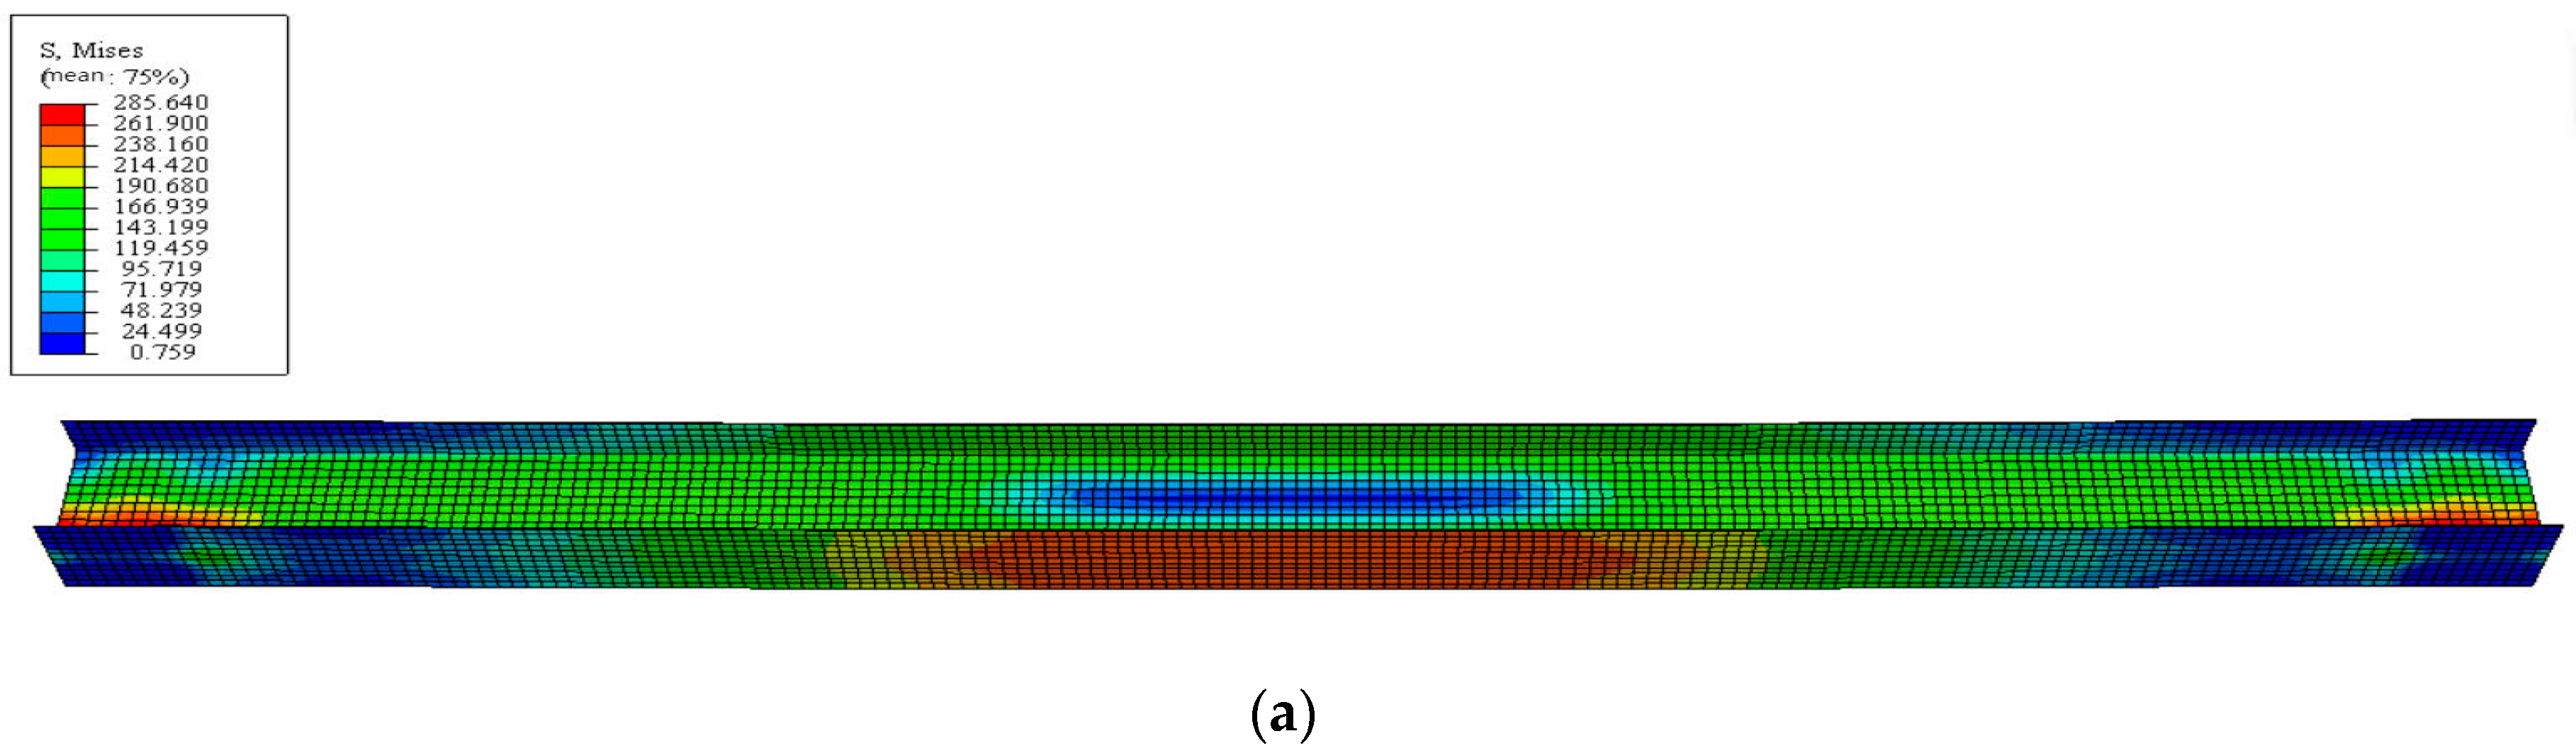
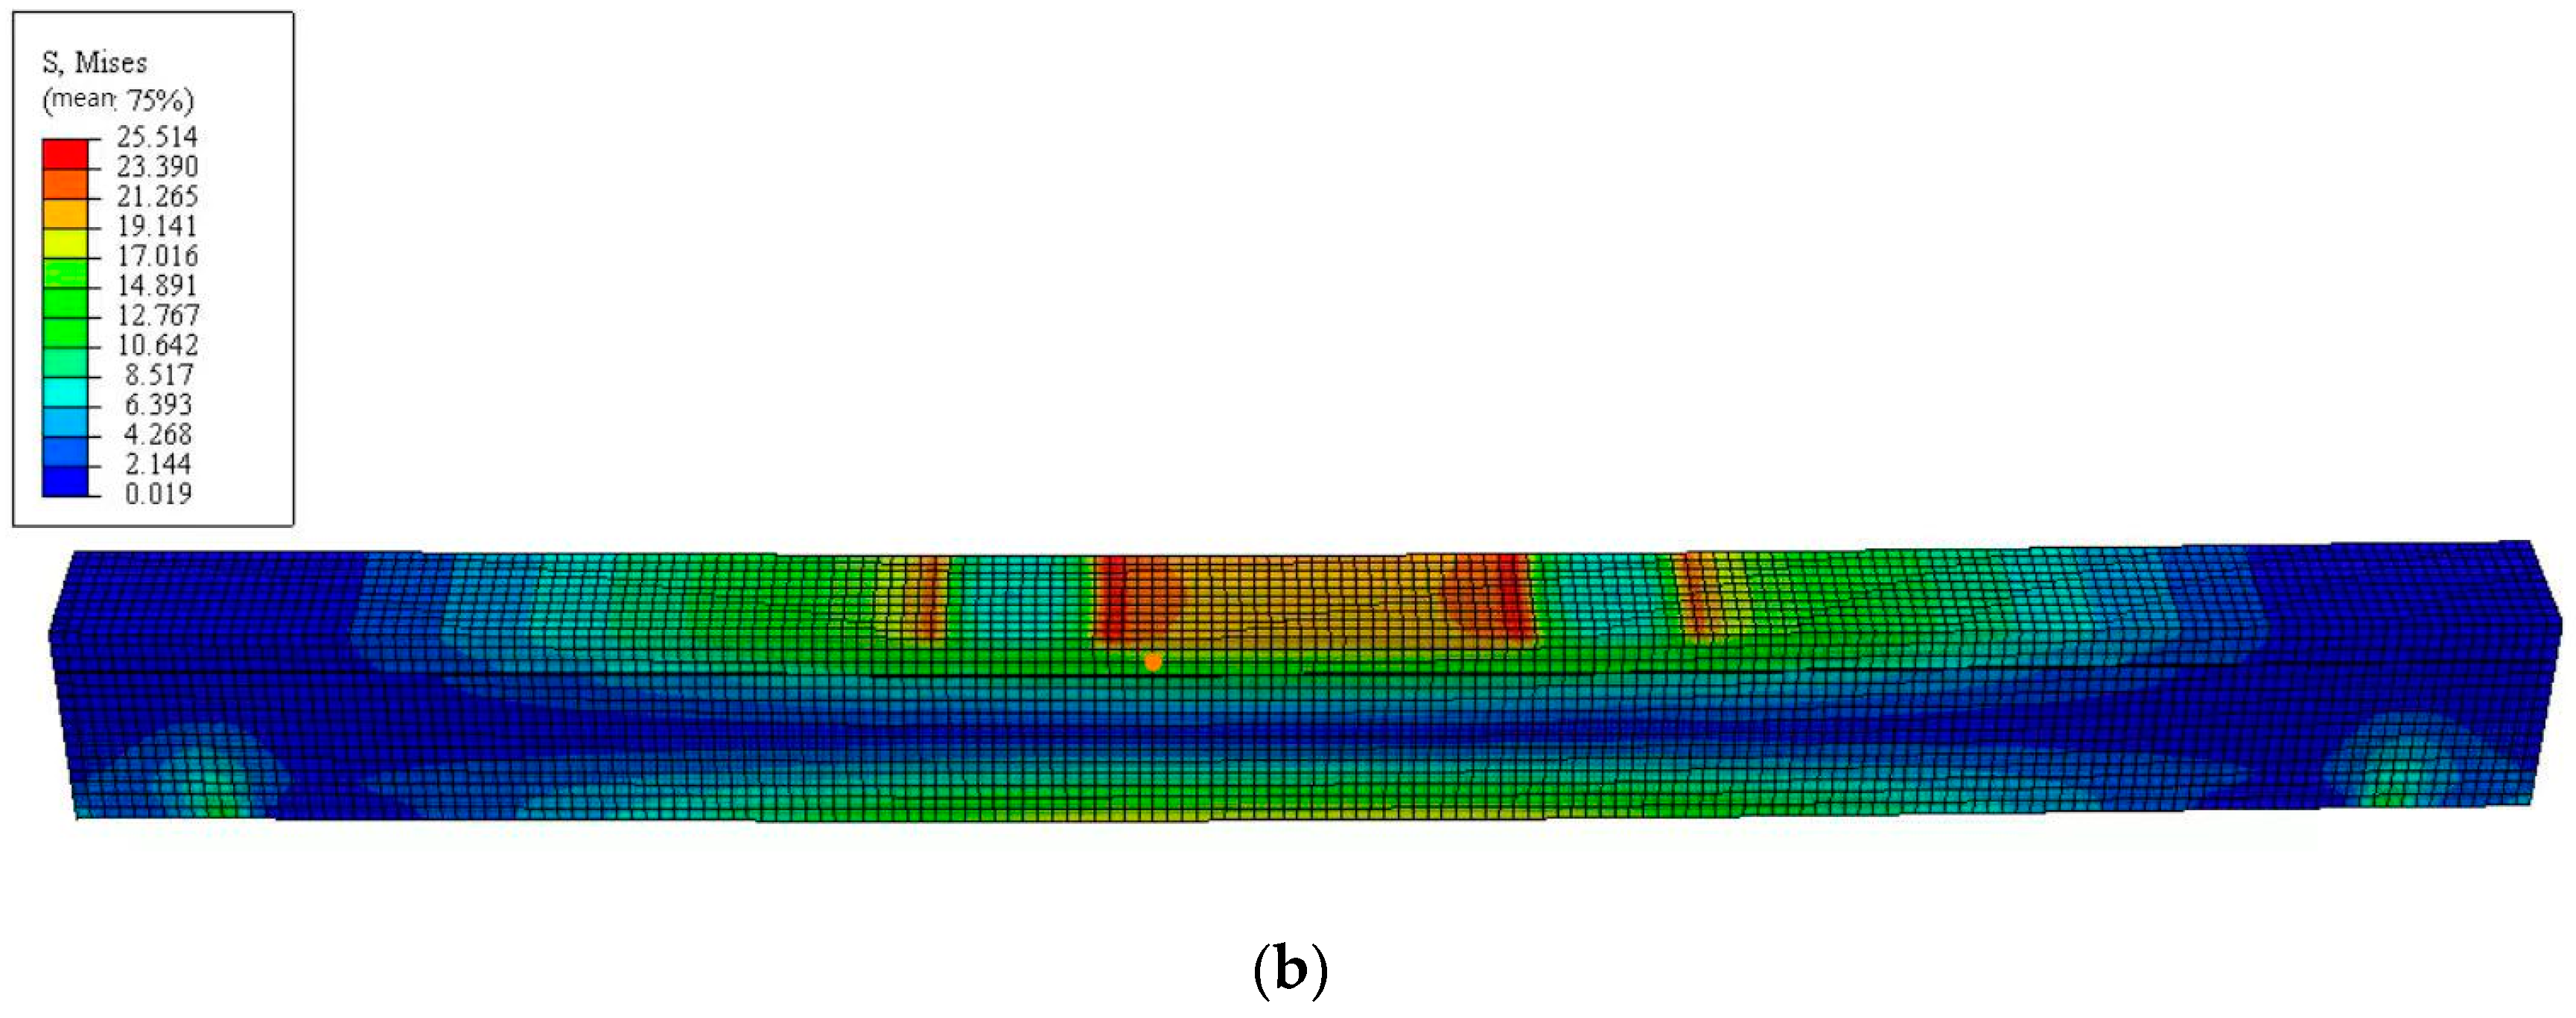
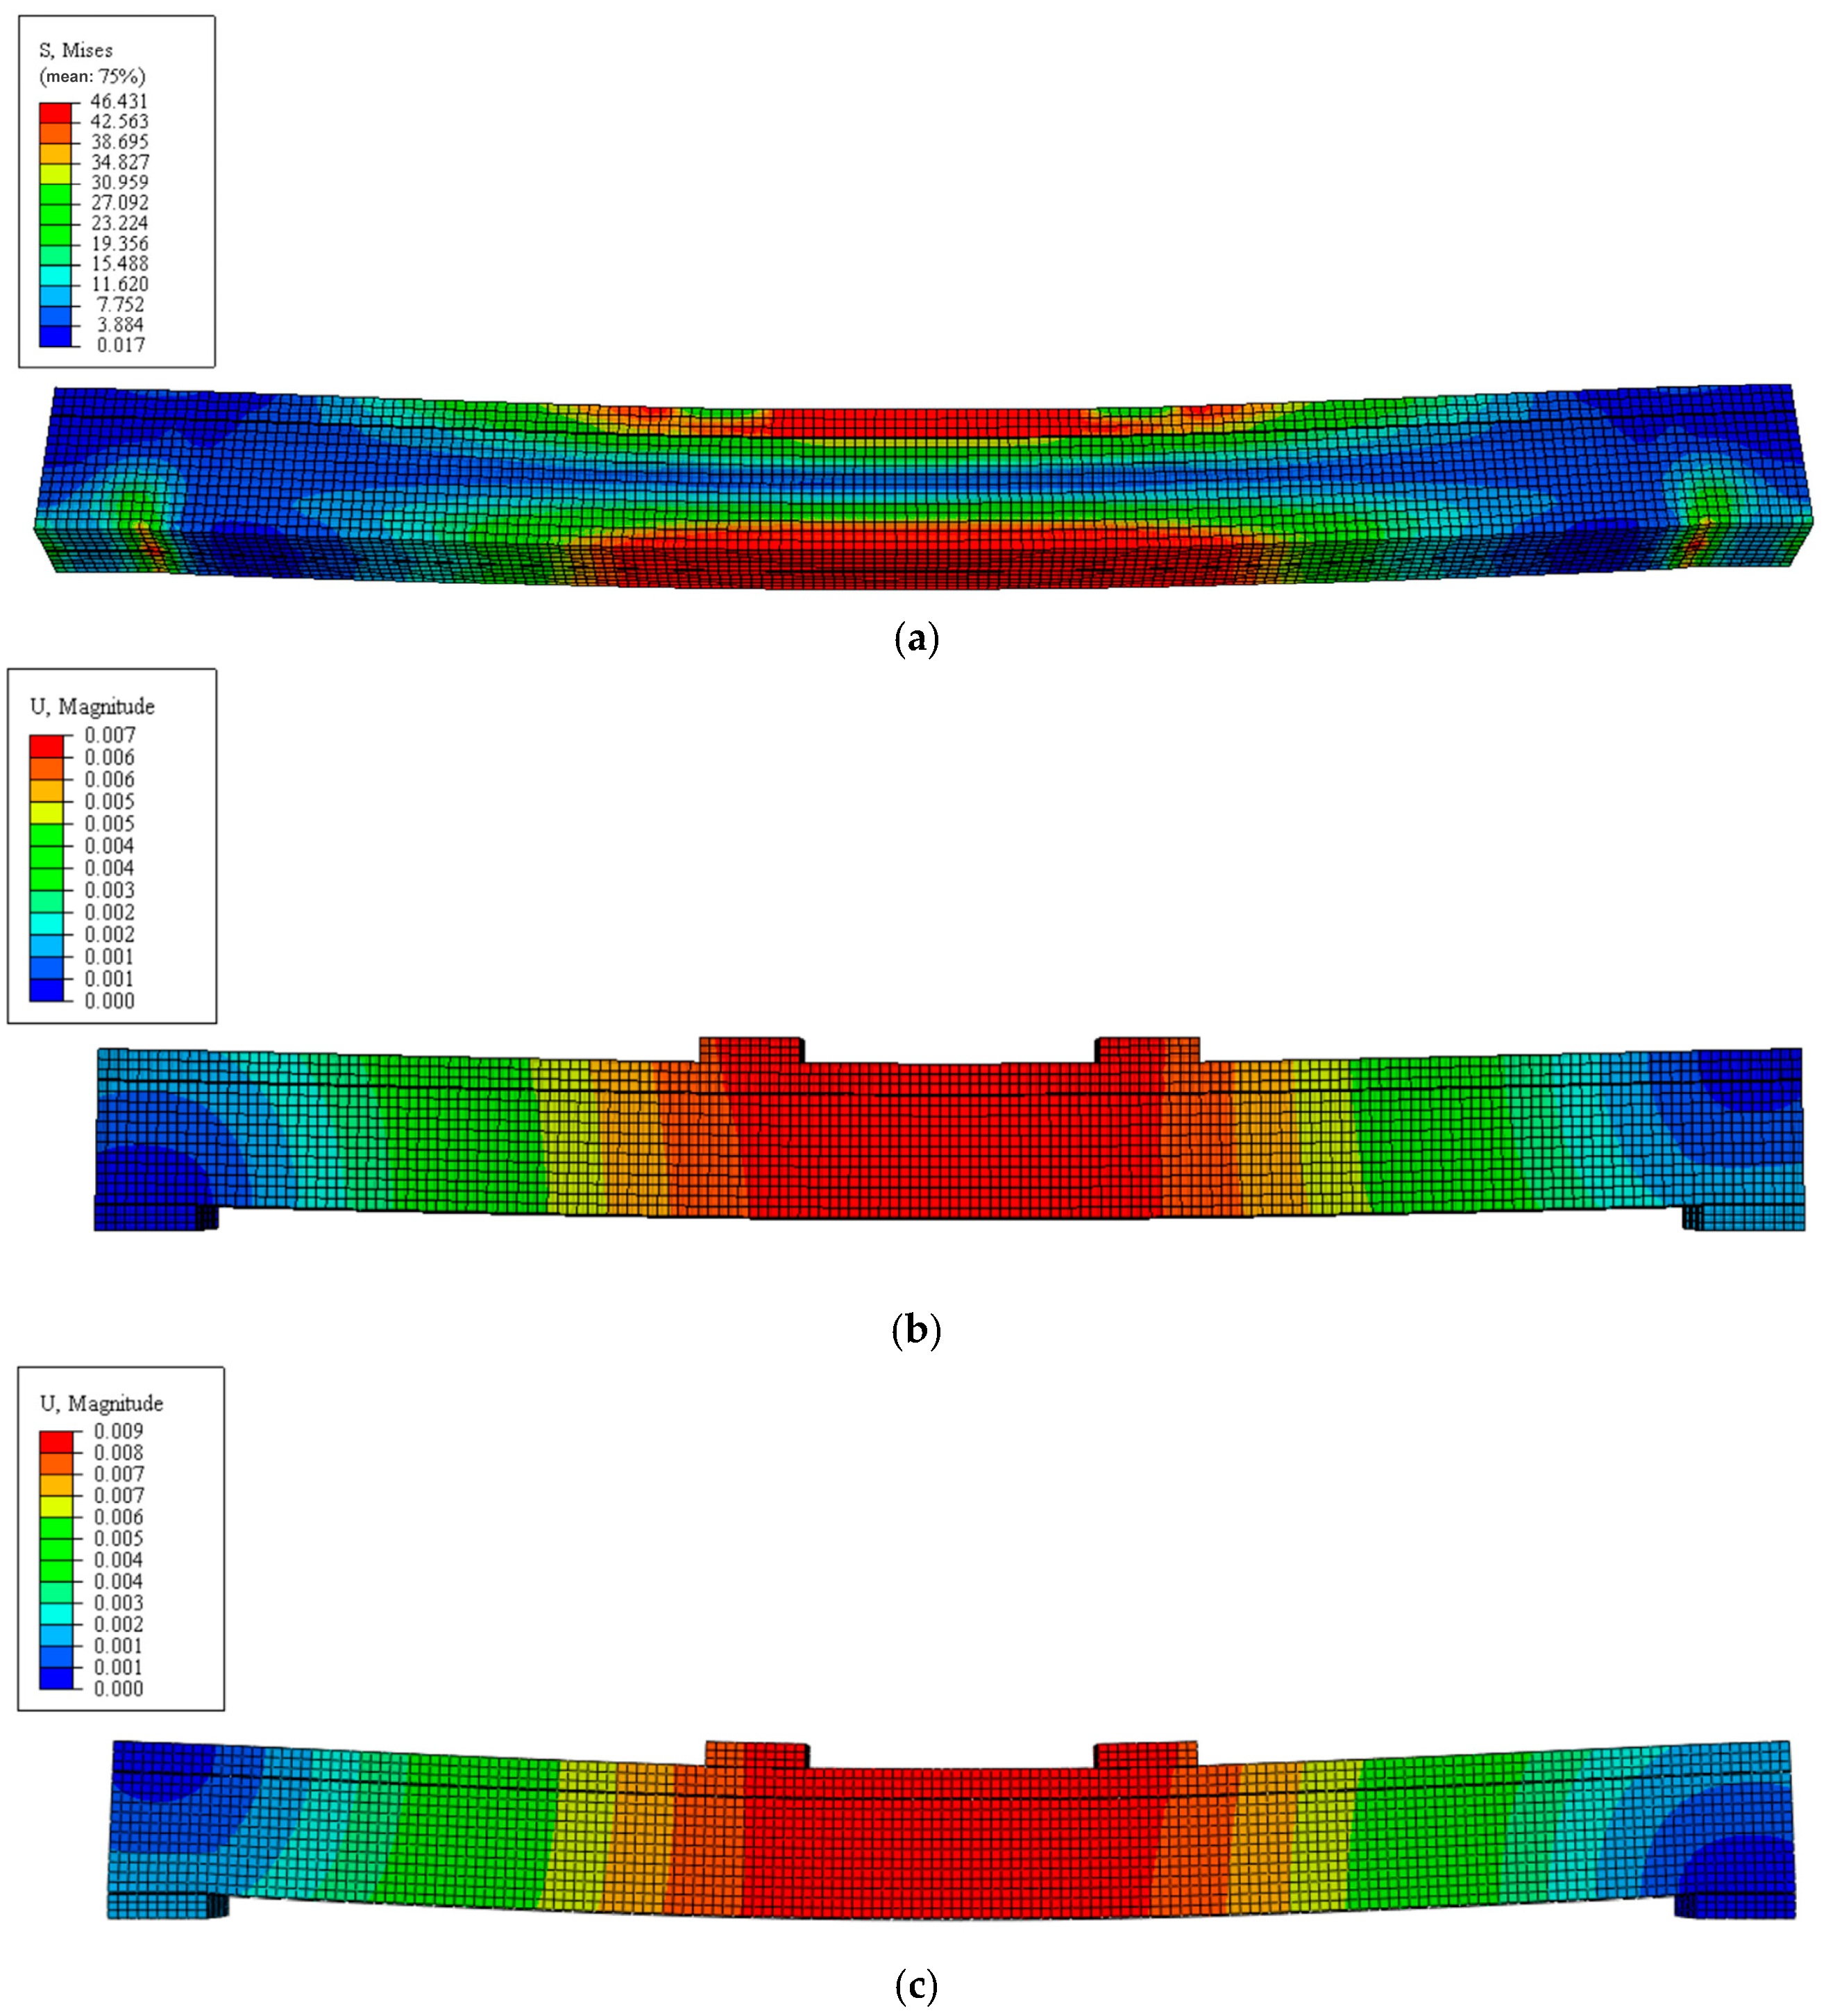
5.2.1. The Stress Process of Components

Figure 16 shows a comparison of the overall deformation stress cloud map of the combined beam and the test damage map. From Figure 16, the two deformations and damage were consistent. Figure 17 shows the load–span deflection curve of the ABAQUS simulation member L-Z-1. Three points A, B, and, C are important nodes during loading. A indicates how well the lower flange at the steel pad just reached its yield. At this time, the wood at the upper flange of the steel H-beam and the wood on both sides of the steel H-beam web did not approach the yield strength. Point B was that after the upper and lower flanges of H-shape steel reached the yield strength, the wood at the upper flange of H-shape steel approached the tensile yield strength, and the wood tensile area on both sides of the H-shape steel web did not reach the tensile yield strength. At point C, both the upper and lower flange and the web of the H-shape steel approached the yield strength, and the wood at the upper flange reached the smooth grain compressive yield strength. At the same time, the wood tensile area on both sides of the H-shape steel web approached the tensile yield strength.
Before point A, neither the lower flange nor the web of the H-shaped steel reached the yield strength. The stress cloud chart is shown in Figure 18, and the lower side of the H-shape steel web at the lower cushion block support did not reach the yield, and the stress was 260.70 MPa. The reason was that with an increase in load, the H-shape steel web in the lower pad support. Therefore, the stress was too large but did not approach the yield stress. At the moment, only the wood at the position of the upper flange pad on the H-type steel showed the largest compression stress, and the maximum stress was 4.20 MPa. It was not 1/10 of the compression yield stress. The wood on both sides of the H-type steel web did not yield and the compressive stress is much lower than that of the wood at the upper flange pad.
Figure 19 represents a cloud diagram of the stress distribution for the H-type steel and wood at point A. At point A, the H-shape steel webs of the lower flange span of the H-shape steel and the support pad also reached the yield strength of the steel, and the stress was 285.60 MPa. At this time, the wood at the upper flange and the wood on the sides of the steel H-beam web did not reach the yield strength, the maximum compression stress at the wood pad at the upper flange was 18.52 MPa, and the maximum compression stress on the sides of the steel H-beam web was approximately 7.73 MPa. The maximum tensile stress of the wood area on both sides of the H-type steel web was about 13.90 MPa.
Figure 20 shows a cloud map of the stress distribution for the H-type steel and wood at point B. After the further increase in the load, the stress generated by the member also increased immediately. When point B was reached, the overall H-type steel approached the yield strength, and the stress was 285.60 MPa. At this time, the wood compressive strength at the upper flange reached the yield compressive strength of 25.52 MPa, and the maximum wood compressive stress on both sides of the H-shape steel web was about 17.02 MPa. The maximum tensile stress of the wood area on both sides of the H-type steel web was about 19.14 MPa.
Figure 21 represents a cloud map of the stress distribution for steel and wood H-beam. When point C was reached, the H-shape steel web and the upper and lower flange approached the yield strength, and the stress was 285.6 MPa. The wood at the upper flange of the H-shape steel reached the compressive strength of 25.52 MPa, and the wood could continue to bear it despite the yield strength. The wood tensile area on both sides of the H-shape steel web also achieved tensile yield strength, and the stress was 46.43 MPa. According to the test phenomenon, the wood on both sides of the member H-type steel web was a brittle fracture, and the member was damaged.

5.2.2. The Change in Component Deflection in the Span

Figure 22 shows the diagram of the interspan deflection of composite beam L-Z-1 as an ABAQUS simulation component under the load. Figure 22a represents the graph corresponding to the important node A in Figure 17, namely the cross-medium deflection graph corresponding to the end of the elastic phase. When the component was in the elastic–plastic phase, the span medium deflection increased nonlinearly. Figure 22b shows the cross-medium deflection diagram corresponding to the main node of B in Figure 17. A transmedian deflection diagram was observed at the end of the elastoplastic phase. After the maximum bearing capacity was achieved in the damage stage, the failure occurred. Figure 22 represents the cross-medium deflection diagram corresponding to the important node of C in Figure 17, i.e., the cross-medium deflection diagram corresponding to the breaking moment.

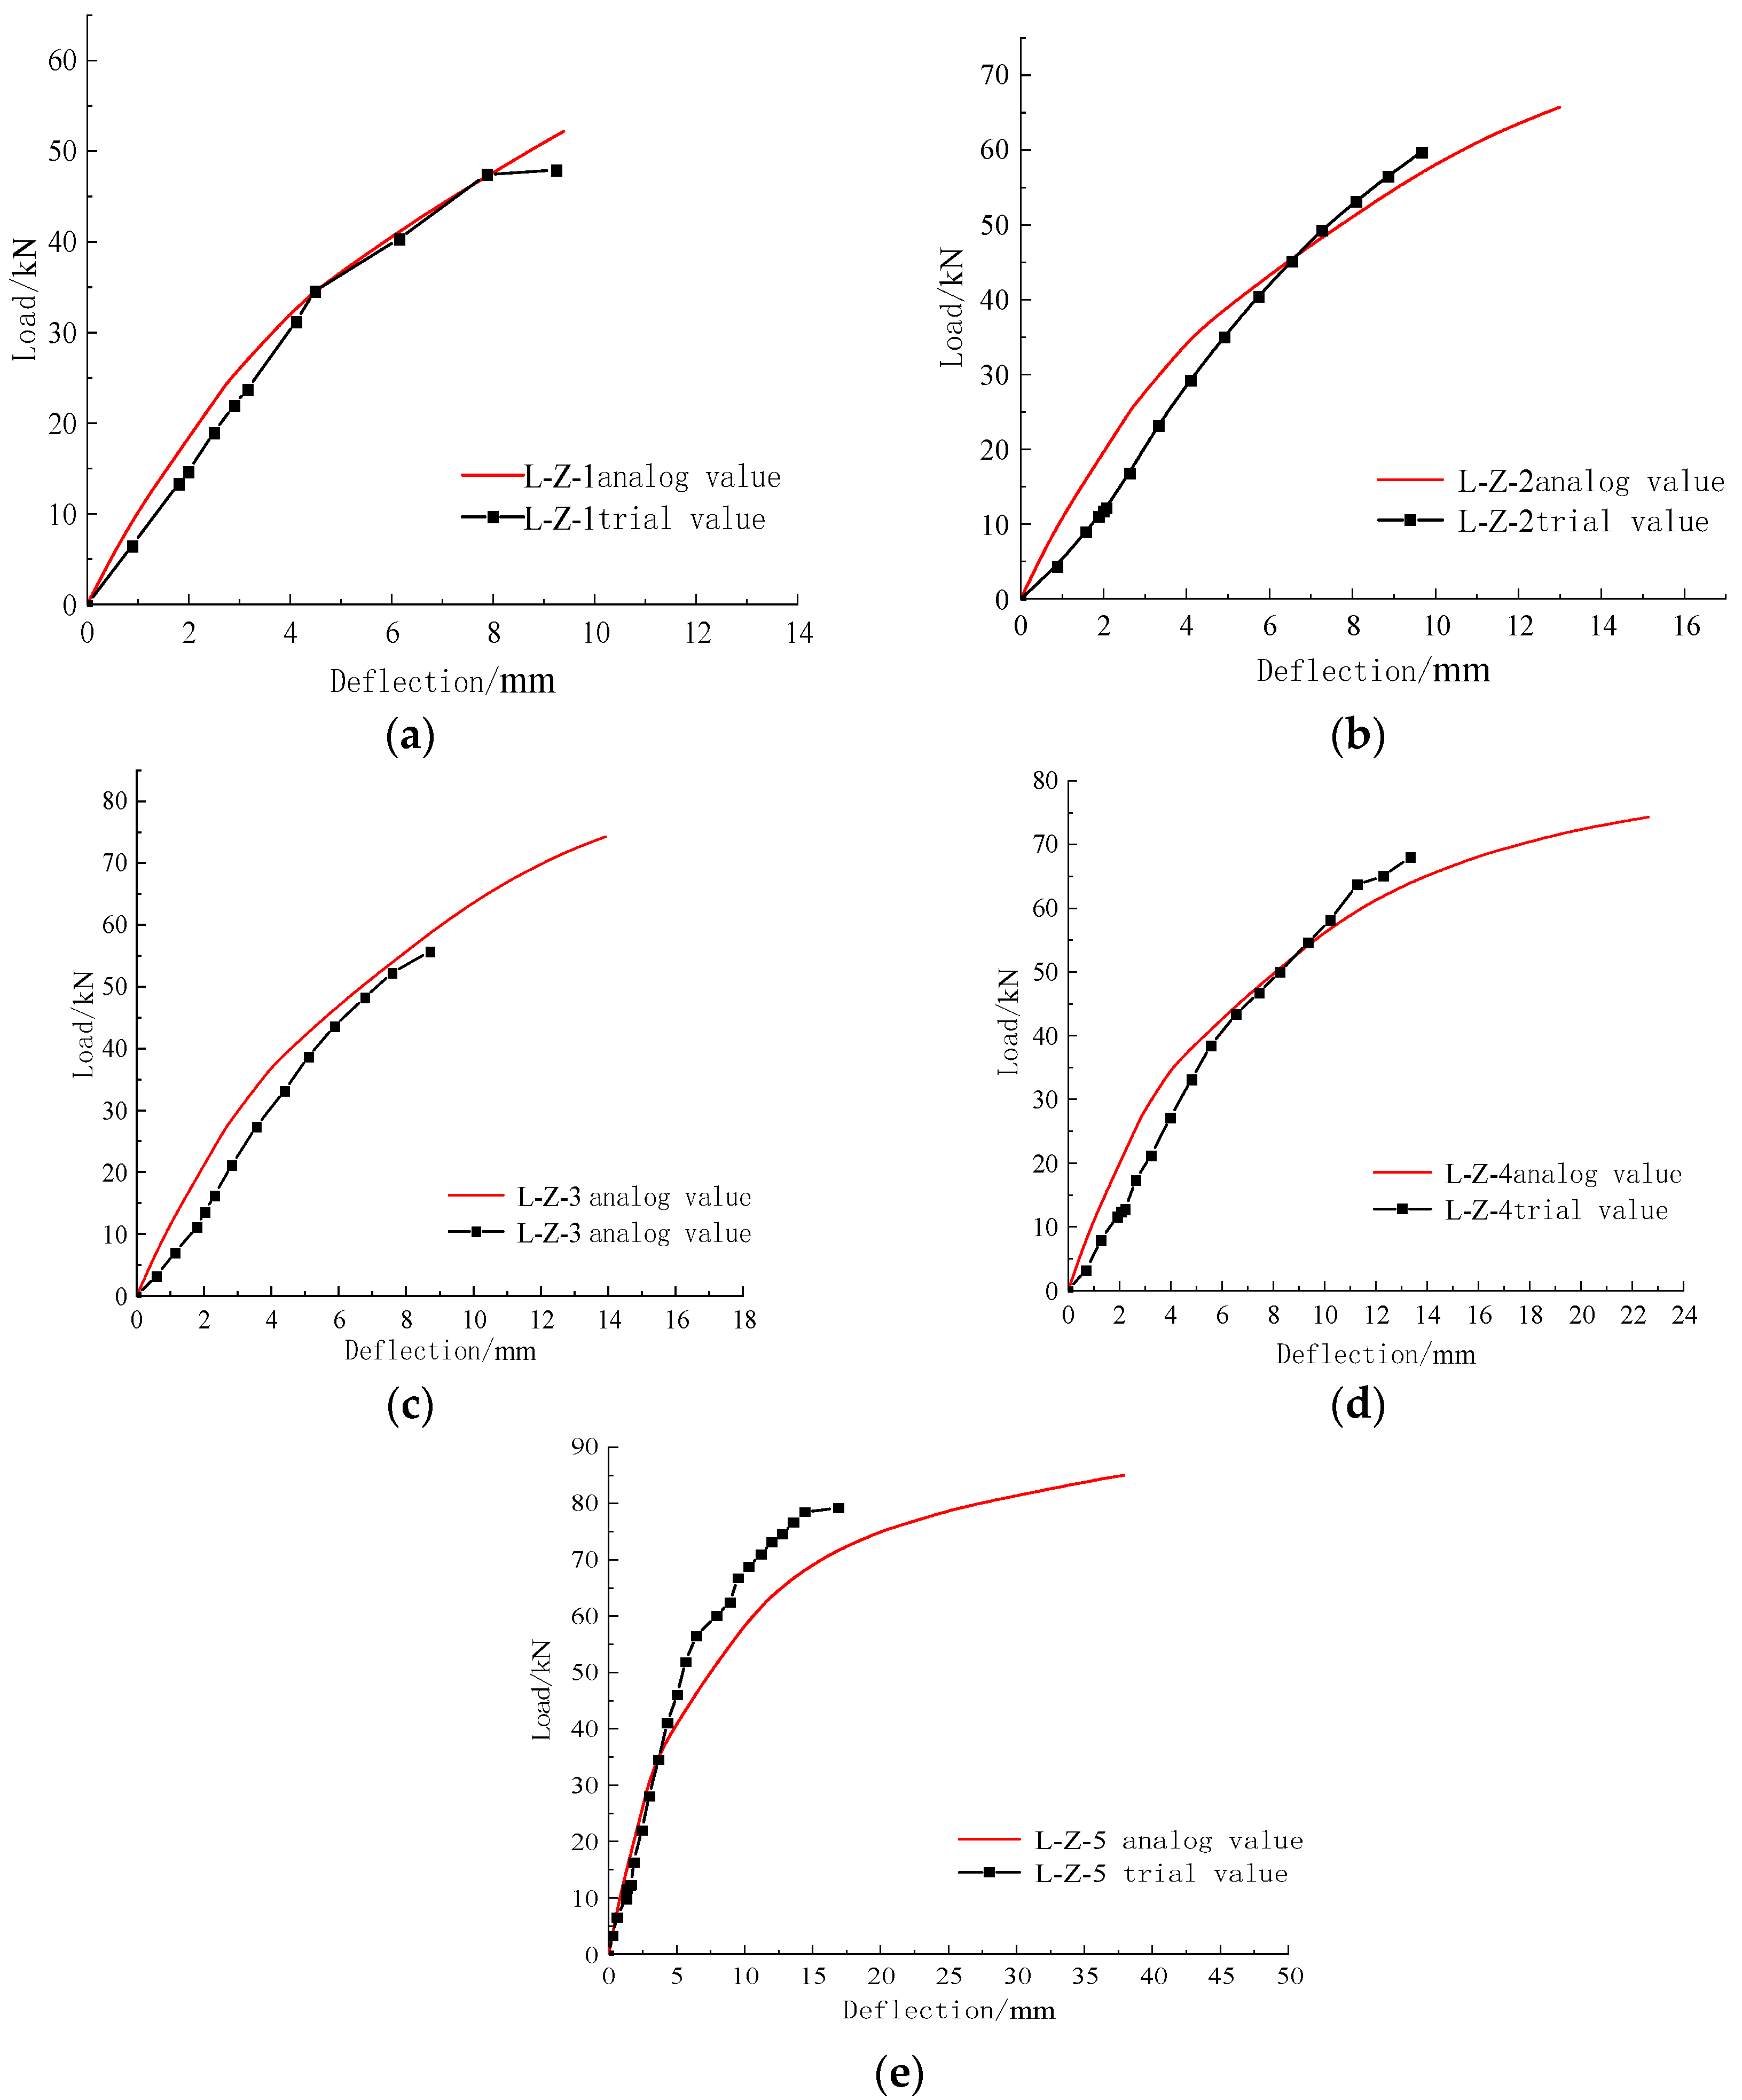
5.2.3. The Combined Beam Load–Span Medium Deflection during the Simulation and Experiments

The relationship between the simulation results and the experiment results is represented in Figure 23. The overall situation change of each combination beam was the same, and the overall error was small. It showed that the simulation value confirmed the test value and that the finite element simulation was reliable. In the elastic phase, the stiffness of the simulated combination beam was greater than that of the test combination beam. In the elastic range, the curve of load and deflection was linear. After the load value reached about 1/2 of the maximum load, the curve gradually offset the straight trend development. The overall stiffness decreased from the elastic stage. The growth rate of the maximum deflection in the span was gradually reduced until the ultimate tensile strength of the wood was reached. It resulted in the overall destruction of the combined beam and the loss of bearing capacity.

5.3. Main Factors in the Combined Beam Bending Performance

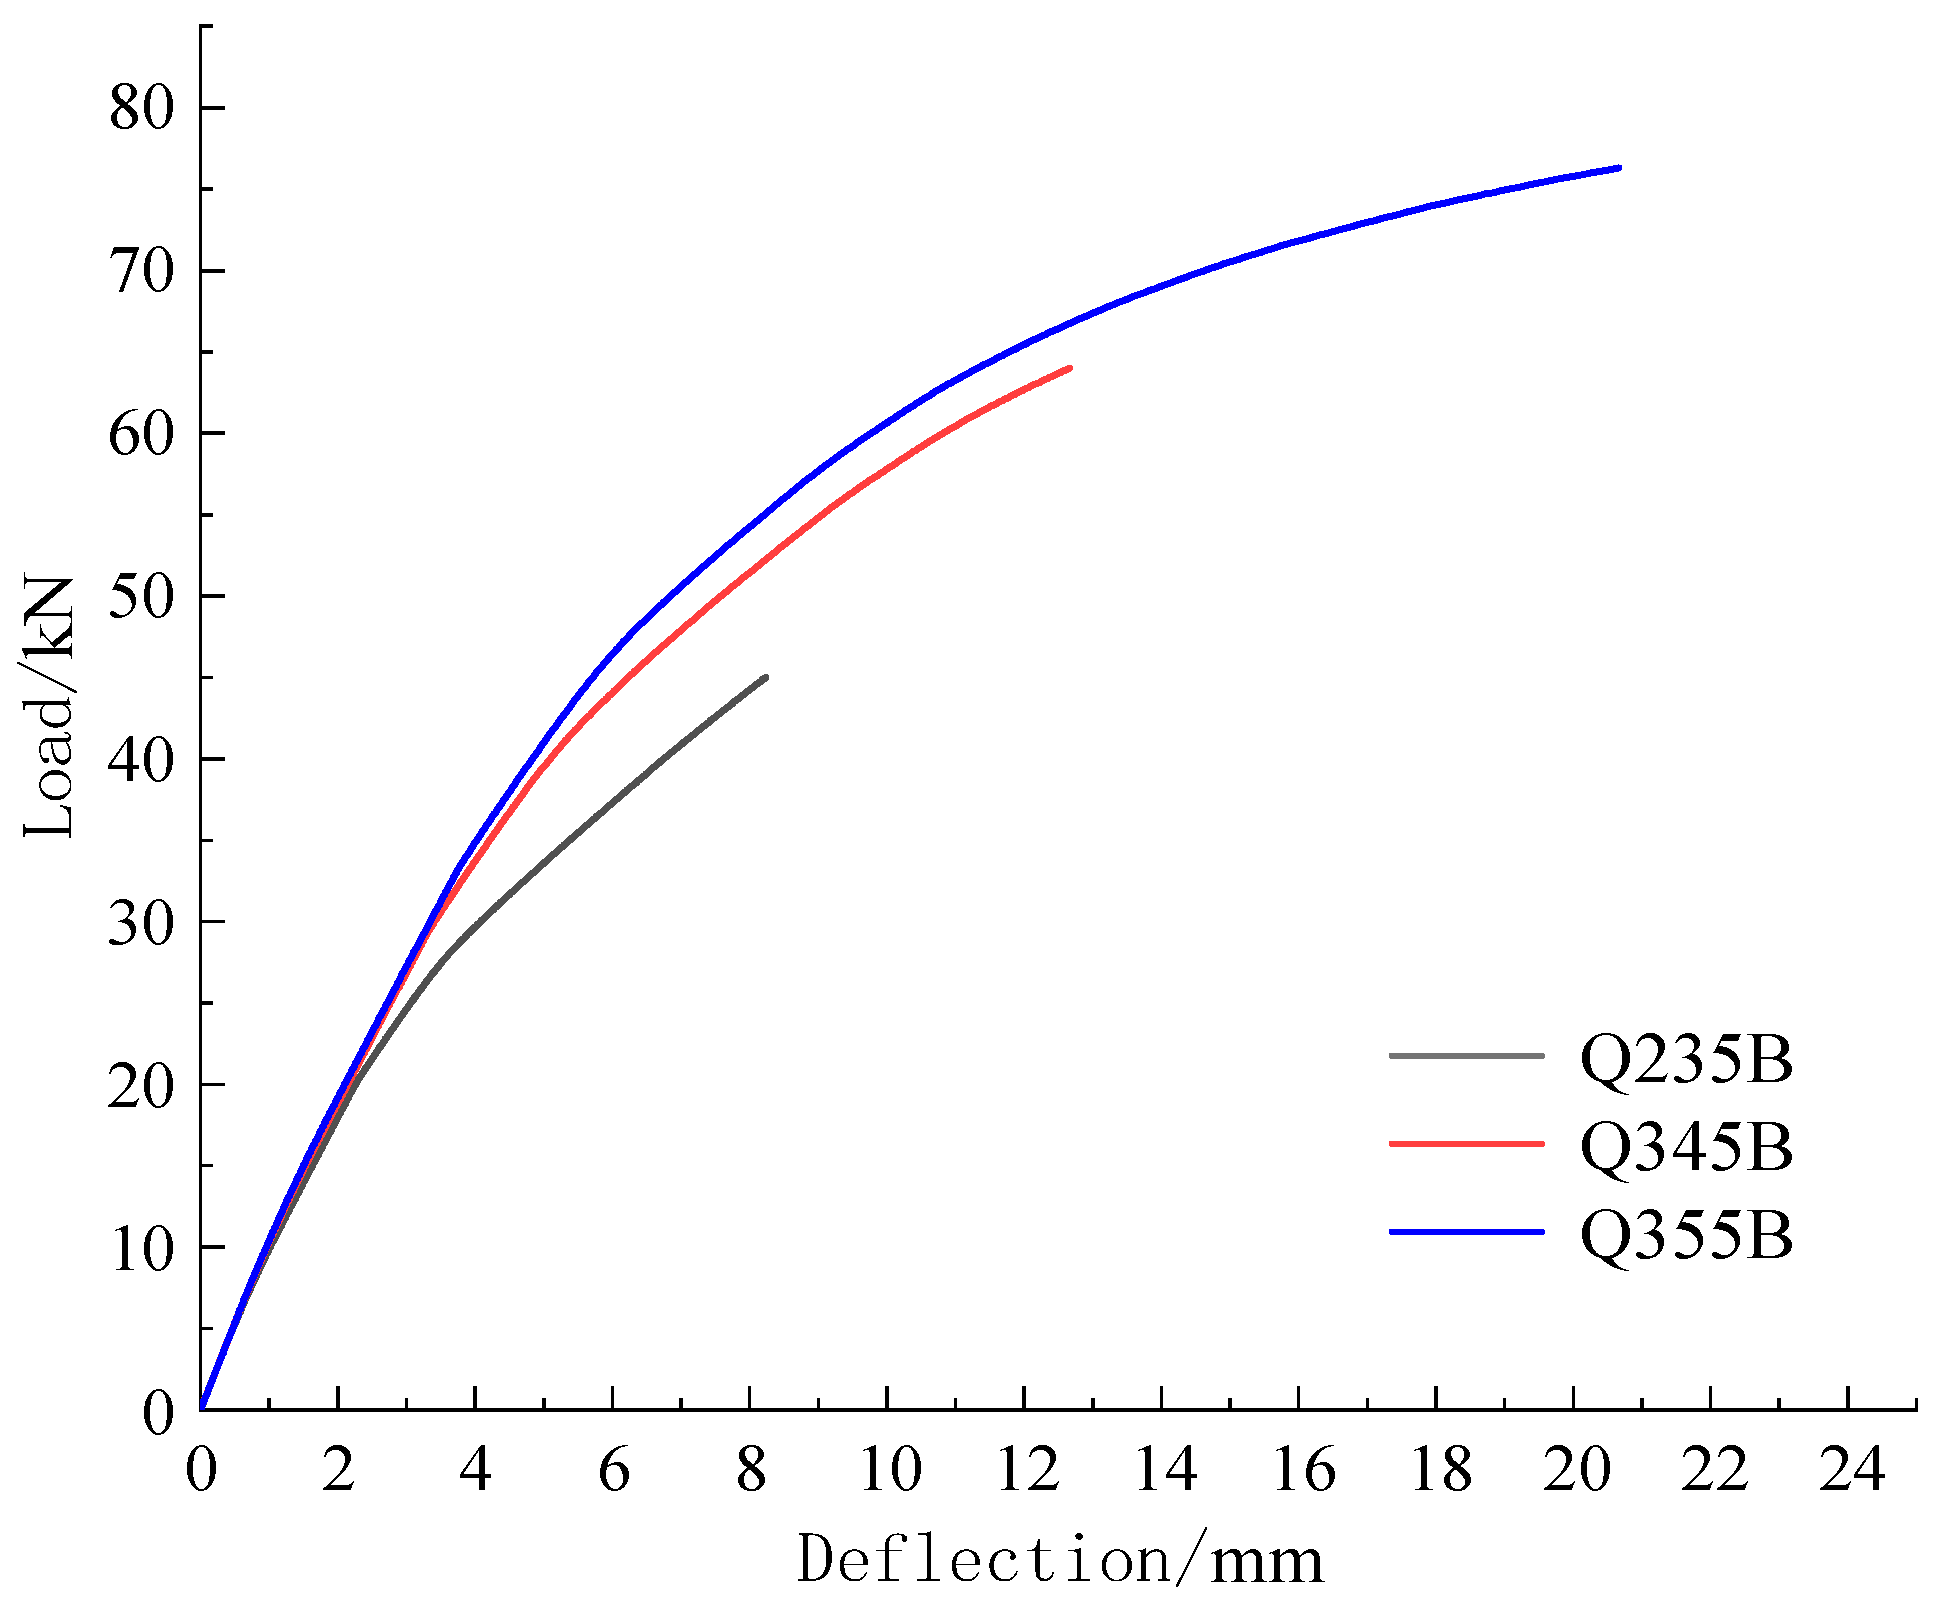
5.3.1. Influence of Steel Yield Strength

The yield strength of steel types Q235B, Q345B, and Q355B was selected for simulation. The remaining parameters of the combined beam remained unchanged, and the load–cross range deflection curve is shown in Figure 24. In the elastic range, the three curves almost coincided. When the yield strength increased from Q235B to Q345B, the carrying capacity was enhanced by 42.22%. When the yield strength increased from Q345B to Q355B, the carrying capacity was enhanced by 19.22%. Therefore, the bending bearing capacity increased with the yield strength, but the load enhancement rate showed a gradually decreasing trend. Although the yield strength of steel improved the bearing capacity to a certain extent, the improvement rate in the bearing capacity gradually became smaller.

5.3.2. Influence of the Flange Thickness of Type Steel H-Beam

The combined beam of three flange thicknesses of 1.5 mm, 2 mm, and 2.5 mm was selected for simulation analysis. The effect of steel thickness on the load deflection is shown in Figure 25. When the flange thickness increased from 1.5 mm to 2 mm, the maximum bearing capacity was enhanced by 22.12 kN, and the maximum bearing capacity increased by 42.38%. When the flange thickness was enhanced from 2 mm to 2.5 mm, the maximum bearing capacity increased by 10.81 kN, and the maximum bearing capacity was enhanced by 14.55%. Therefore, the maximum bearing capacity increased with the thickness of the H-shape steel flange. The thickness of the H-shape steel flange improved the maximum bearing capacity significantly.

5.3.3. Effect of the H-Type Steel Web Thickness

The values of 1.5 mm, 2 mm, and 2.5 mm were considered to study the H-type steel thickness influence on the bearing capacity of the combined beam. A comparison diagram of the load versus deflection is shown in Figure 26. According to the figure, the increase in the maximum bearing capacity was smaller. The maximum bearing capacity of the combined beam with a web thickness of 1.5 mm and 2 mm was 52.20 kN and 64.86 kN, respectively. The maximum bearing capacity increased by 24.25%. The load-deflection curve of the combined beam with a web thickness of 2 mm and 2.5 mm was very close, the deformation trend was consistent, and the maximum bearing capacity increased by 5%. From the perspective of the steel quantity of H-shape steel, the thickness of the web was adjusted from 1.5 mm to 2 mm, the steel volume increased by 33.33%, the maximum bearing capacity was enhanced by 24.25%, the steel volume increased by 1%, and the maximum bearing capacity was enhanced by 0.73%. When the thickness of the web was changed from 2 mm to 2.5 mm, the steel volume increased by 25%, and the maximum bearing capacity was enhanced by 5%. The amount of steel used increased by 1%, and the maximum bearing capacity was enhanced by 0.2%. Consequently, the thickness of the H-type steel web was 2 mm as the optimized web thickness.

5.3.4. Influence of the H-Type Steel Web Height

The effect of the three web heights of 125 mm, 150 mm, and 175 mm was investigated on the bearing capacity of the combined beam. The curve of load–span medium deflection is shown in Figure 27. According to the figure, with a gradual increase in the height of the H-shape steel web, the maximum capacity of the corresponding combined beam was enhanced significantly. The height of the web increased from 125 mm to 150 mm, and the maximum bearing capacity was enhanced by 64.56%. The height of the H-shape steel web increased from 150 mm to 175 mm, and the maximum bearing capacity was enhanced by 27.93%. The maximum bearing capacity of the combined beam was analyzed from the amount of type steel. When the height of the H-type steel web increased from 125 mm to 150 mm, the amount of steel H-beam of the composite was enhanced by 20.49%, the maximum bearing capacity increased by 64.56%, the amount of H-shape steel was enhanced by 1%, and the maximum bearing capacity increased by 3.15%. When the height of the H-type steel web was enhanced from 150 mm to 175 mm, the amount of H-type steel for the combined beam increased by 17.00%, the maximum bearing capacity was enhanced by 27.93%, the amount of H-type steel increased by 1%, and the maximum bearing capacity was enhanced by 1.64%. Finally, an increase in the height of the H-shape steel web significantly improved the bearing capacity of the combined beam, and the optimum web height should be 150 mm.

5.3.5. The Thickness of Steel H-Beam

The thickness of 30 mm, 40 mm, and 50 mm represented the maximum bearing capacity of the combined beam. The load–cross deflection curve pair is shown in Figure 28. The three curves changed consistently. As the thickness of the upper flange of the steel H-beam gradually increased, the maximum bearing capacity also was enhanced. When the board thickness of the upper flange cover of H-shape steel increased from 30 mm to 40 mm, the corresponding maximum bearing capacity was enhanced by 15.52 kN and 25.90%. The thickness of the upper flange-covered board of H-shape steel was enhanced from 40 mm to 50 mm, corresponding to the maximum bearing capacity increase of 8.53 kN and 12.98%. As the thickness of the flange of the H-type steel increased step by step, the maximum bearing capacity was enhanced significantly, and the thickness of the flange of the H-type steel indirectly increased the overall height of the combined beam, and the maximum bearing capacity was enhanced immediately. In summary, the thickness of the upper flange of the H-shape steel composite beam was 40 mm.

5.3.6. Effect of the Composite Beam Section Width

The influence of setting the width of 100 mm, 120 mm, 120 mm, and 140 mm was studied. The curve of load–span deflection is shown in Figure 29. The three curves resulted in the same trend. As the width of the combined beam gradually increased, the maximum carrying capacity occurred. The width of the combined beam was enhanced from 100 mm to 120 mm, corresponding to the maximum bearing capacity increased by 17.86 kN. It was enhanced by 34.21%. The width of the combined beam increased from 120 mm to 140 mm, corresponding to the maximum bearing capacity of 17.64 kN, and was enhanced by 25.18%. Therefore, the maximum bearing capacity increased step-by-step with the width of the combined beam.
In this thesis, the combination of experimental and numerical simulations of composite beams has shown good performance, and the addition of steel sections to wood can effectively improve the flexural load capacity of pure wood beams. In countries where wood resources are abundant, such as Japan and Canada, the practical application of composite beams in residential housing is gradually realized, and the research in this paper has some value.

6. Conclusions

Based on the experimental and numerical simulation method, this paper studied the novel rectangular-section combined beam of welded thin-walled H-shape steel/camphor pine wood under the bending performance study The conclusions are as follows:
(1)
The combined beam can be roughly divided into three stages from loading to destruction: elastic stage, elastic–plastic stage, and destruction stage. The final damage is caused by the yielding of the steel section, the yielding of the wood in the compression zone, and the maximum tensile strength of the wood in the tension zone, and the wood is damaged by the tensile break.
(2)
The overall deformation curve of the combined beam shows that the deflection in the span of the pure bending section is always the largest during the loading process. The gluing connection between steel and wood is very reliable, the deformation of both is coordinated, and the combined effect is significant.
(3)
Improving the yield strength of steel can effectively improve the flexural load-carrying capacity of the combined beam. the thickness of the H-beam flange has a significant improvement in the maximum load-carrying capacity. The effect of web thickness is smaller. the height of the H-beam web has obvious improvement on the combined beam bearing capacity. The maximum bearing capacity is increased by increasing the thickness of the cladding plate on the flange of the H-beam. The width of the combined beam has less effect on the bearing capacity.
In summary, this test combination beam performs better in the test and simulation, there will be some problems in the research, but with the depth of the subsequent research, gradually overcome the shortcomings, and provide a reference for the research in related fields.

Author Contributions

Conceptualization, C.W.; Methodology, C.W.; Software, J.D. Writing—original draft, J.D.; Writing—review & editing, Z.Y., Z.Z. and Y.X. All authors have read and agreed to the published version of the manuscript.

Funding

This work is supported by the National Natural Science Foundation of China (52268029) and the Open Fund of Shock and Vibration of Engineering Materials and Structures Key Laboratory of Sichuan Province (Grant No. 20kfgk03).

Institutional Review Board Statement

Not applicable.

Informed Consent Statement

Not applicable.

Data Availability Statement

Not applicable.

Conflicts of Interest

The authors declare no conflict of interest.

References

  1. Chen, S. Talk about green and environmental protection building materials. Sci. Technol. Entrep. Mon. 2010, 23, 118–119. [Google Scholar]
  2. Zhou, R.; Qing, L. Green environmental building materials and their application. Resour. Inf. Eng. 2017, 32, 82–83. [Google Scholar]
  3. Zhang, J.; Gu, L. The development status, challenges and policy suggestions of green building in China. Energy China 2012, 34, 19–24. [Google Scholar]
  4. Chau, C.K.; Hui, W.K.; Ng, W.Y.; Powell, G. Assessment of CO2 emissions reduction in high-rise concrete office buildings using different material use options. Resour. Conserv. Recycl. 2012, 61, 22–34. [Google Scholar] [CrossRef]
  5. Wang, S.; Zhou, C.; Li, G.; Feng, K. CO2, economic growth, and energy consumption in China’s provinces: Investigating the spatiotemporal and econometric characteristics of China’s CO2 emissions. Ecol. Indic. 2016, 69, 184–195. [Google Scholar] [CrossRef]
  6. Ramage, M.H.; Burridge, H.; Busse-Wicher, M.; Fereday, G.; Reynolds, T.; Shah, D.U.; Wu, G.; Yu, L.; Fleming, P.; Densley-Tingley, D.; et al. The wood from the trees: The use of timber in construction. Renew. Sustain. Energy Rev. 2017, 68, 333–359. [Google Scholar] [CrossRef]
  7. Akbarnezhad, A.; Jianzhuang, X. Estimation and Minimization of Embodied Carbon of Buildings: A Review. Buildings 2017, 7, 5. [Google Scholar] [CrossRef]
  8. Chiniforush, A.A.; Akbarnezhad, A.; Valipour, H.; Xiao, J. Energy implications of using steel-timber composite (STC) elements in buildings. Energy Build. 2018, 176, 203–215. [Google Scholar] [CrossRef]
  9. Borri, A.; Corradi, M. Strengthening of timber beams with high strength steel cords. Compos. Part B Eng. 2011, 42, 1480–1491. [Google Scholar] [CrossRef]
  10. Nadir, Y.; Nagarajan, P.; Ameen, M.; Arif, M.M. Flexural stiffness and strength enhancement of horizontally glued laminated wood beams with GFRP and CFRP composite sheets. Constr. Build. Mater. 2016, 112, 547–555. [Google Scholar] [CrossRef]
  11. Hassanieh, A.; Valipour, H.; Bradford, M. Experimental and numerical investigation of short-term behaviour of CLT-steel composite beams. Eng. Struct. 2017, 144, 43–57. [Google Scholar] [CrossRef]
  12. Shekarchi, M.; Oskouei, A.V.; Raftery, G.M. Flexural behavior of timber beams strengthened with pultruded glass fiber reinforced polymer profiles. Compos. Struct. 2020, 241, 112062. [Google Scholar] [CrossRef]
  13. Ghanbari-Ghazijahani, T.; Russo, T.; Valipour, H.R. Lightweight timber I-beams reinforced by composite materials. Compos. Struct. 2020, 233, 111579. [Google Scholar] [CrossRef]
  14. Dar, A.R. An experimental study on the flexural behavior of cold-formed steel composite beams. Mater. Today Proc. 2020, 27 (Pt 1) Pt 1, 340–343. [Google Scholar] [CrossRef]
  15. Pan, F.T.; Kou, L.; Wang, C.Y. Mechanical Properties Analysis of Steel-Timber Combined Member. Adv. Mater. Res. 2012, 347–353, 1477. [Google Scholar] [CrossRef]
  16. Fujita, M.; Iwata, M. Bending Test of the Composite Steel-Timber Beam. Appl. Mech. Mater. 2013, 351–352, 415–421. [Google Scholar] [CrossRef]
  17. Hassanieh, A.; Valipour, H.R.; Bradford, M.A. Experimental and numerical study of steel-timber composite (STC) beams. J. Constr. Steel Res. 2016, 122, 367–378. [Google Scholar] [CrossRef]
  18. McConnell, E.; McPolin, D.; Taylor, S. Post-tensioning of glulam timber with steel tendons. Constr. Build. Mater. 2014, 73, 426–433. [Google Scholar] [CrossRef]
  19. Denghui, L. Study on Bending Properties of Steel-Wood Composite Beam. Master’s Thesis, Beijing Jiaotong University, Beijing, China, 2016. [Google Scholar]
  20. Yushun, L.; Jialiang, Z.; Xiuhua, Z.; Yu, W.; Jun, G. Study on bond stress and bond slip of bamboo-steel interface under static load. J. Build. Struct. 2015, 36, 114–123. [Google Scholar]
  21. Aiguo, C.; Teng-Hui, L.; Chao, F.; Qingguo, Z.; Jihui, X. Experimental study on flexural behavior of H-shaped steel-wood composite beams. J. Build. Struct. 2016, 37 (Suppl. 1), 261–267. [Google Scholar]
  22. Xianzhe, W. Study on Flexural Capacity of Thin-Walled Flitch Filled Rectangular Steel Tube Composite Beams. Master’s Thesis, Southwest University of Science and Technology, Mianyang, China, 2018. [Google Scholar]
  23. Ye, Z.; Feiyang, X.; Hongda, Y.; Xinmiao, M.; Ying, G. Experimental Study and Finite Element Analysis of Steel and Wood Combined Beam under Centralized load. J. Beijing For. Univ. 2021, 43, 127–136. [Google Scholar]
  24. Degui, L.; Yuhao, W.; Yong, W.; Wei, Z.; Tao, W. Study on the bending properties of thin-wall H-steel-wood composite beam. J. Build. Struct. 2022, 43(05), 149–163. [Google Scholar]
  25. Zhang, X.; Zhang, Y.; Xie, X. Experimental and analytical investigation of the flexural behaviour of stiffened hollow glulam beams reinforced with fibre reinforced polymer. Structures 2023, 50, 810–822. [Google Scholar] [CrossRef]
  26. Chen, Y.X. Flexural Analysis and Design of Timber Strengthened with High-Strength Composites. Ph.D. Thesis, Rutgers The State University of New Jersey, New Brunswick, NJ, USA, 2003. [Google Scholar]
Figure 1. The section of steel and wood composite beam.
Sustainability 15 07450 g001
Figure 2. The test piece of steel and wood composite.
Sustainability 15 07450 g002
Figure 3. The layout of the strain sheets.
Sustainability 15 07450 g003
Figure 4. The field of loading.
Sustainability 15 07450 g004
Figure 5. The combination beam L-Z-2 destruction process (a) the opened glue at the right upper flange; (b) the opened glue at the left upper flange; (c) the opened glue and widened at the right upper flange; (d) the unwelded H-shape steel web and upper flange; (e) the lower flange buckling, wood cracking.
Sustainability 15 07450 g005aSustainability 15 07450 g005b
Figure 6. The diagram of cross-section strain for the L-Z-2 span.
Sustainability 15 07450 g006
Figure 7. The diagram of cross-section load–strain for the L-Z-2 span.
Sustainability 15 07450 g007
Figure 8. The diagram of overall deformation.
Sustainability 15 07450 g008
Figure 9. The diagram of beam load–span medium deflection.
Sustainability 15 07450 g009
Figure 10. The diagram of load-deflection for the comparison among the beams.
Sustainability 15 07450 g010
Figure 11. The load-deflection diagram for comparison among the three beams.
Sustainability 15 07450 g011
Figure 12. A comparison of load-deflection curves.
Sustainability 15 07450 g012
Figure 13. The diagram of steel constitutive relationship.
Sustainability 15 07450 g013
Figure 14. The diagram of wood constitutive relationship.
Sustainability 15 07450 g014
Figure 15. Model establishment. (a) Overall model of the combined beam; (b) Meshing of the combined beam; (c) The diagram of interface interaction; (d) The boundary conditions and loads.
Sustainability 15 07450 g015
Figure 16. A comparison between (a) the cloud diagram of combined beam overall deformation stress; (b) the failure test diagram.
Sustainability 15 07450 g016
Figure 17. The diagram of load–span medium deflection of beam L-Z-1.
Sustainability 15 07450 g017
Figure 18. The cloud diagram of the stress distribution during early loading for (a) H-shape steel; (b) wood.
Sustainability 15 07450 g018
Figure 19. The cloud map of stress distribution at point A for (a) steel H-beam; (b) wood.
Sustainability 15 07450 g019
Figure 20. The cloud diagram of the stress distribution at point B for (a) H-type steel; (b) wood.
Sustainability 15 07450 g020aSustainability 15 07450 g020b
Figure 21. The cloud map of the stress distribution at point C for (a) steel H-beam; (b) wood.
Sustainability 15 07450 g021
Figure 22. The Medium deflection diagram of (a) the A-point span; (b) the B-point span; (c) the C-point span.
Sustainability 15 07450 g022
Figure 23. The comparison of the curves of combined beam load–span medium deflection for (a) L-Z-1; (b) L-Z-2; (c) L-Z-3; (d) L-Z-4; (e) L-Z-5.
Sustainability 15 07450 g023
Figure 24. A comparison of load–span deflection curves for different yield strengths.
Sustainability 15 07450 g024
Figure 25. The comparison of load–span medium deflection curves for different flange thicknesses.
Sustainability 15 07450 g025
Figure 26. A comparison of load–span medium deflection curves under different web thicknesses.
Sustainability 15 07450 g026
Figure 27. The comparison of load–span medium deflection curves for different web heights.
Sustainability 15 07450 g027
Figure 28. A Comparison of load–span deflection curves for the upper flange covered with different board thicknesses.
Sustainability 15 07450 g028
Figure 29. The comparison of the load–span medium deflection curves at different widths.
Sustainability 15 07450 g029
Table 1. The Parameters of the tests (mm).
Specimen Codetftwh1t1t2t3b1lb × h
L-M-------1700100 × 155
L-Z-11.51.512549.2549.25301001700100 × 155
L-Z-21.51.512549.2549.25401001700100 × 165
L-Z-31.51.512549.2549.25501001700100 × 175
L-Z-421.512549.2549.25301001700100 × 155
L-Z-52.51.512549.2549.25301001700100 × 155
Note: tf, tw, and h1 are the H-type steel flange, web thickness, and height, respectively; t1 is the thickness of the left board of the web, t2 is the thickness of the right board; t3 is the upper flange board; b1 is the upper flange width and the steel H-beam width; l is the total length of the test beam; b is the combined beam width; h is the total height of the combined beam, the thickness of the upper flange board and the height of the H-shape steel.
Table 2. Flexural load capacity of specimens.
Specimen NumberP/kNγP/%
L-M47.429-
L-Z-147.9341.06
L-Z-467.95842
L-Z-579.16968.87
Note: γp is the percentage improvement of built-in thin-walled H-shaped steel and wood composite beam P relative to pure wood beam P.
Table 3. Flexural load capacity of specimens with different flange thickness.
Specimen NumberH-Beam Flange Thickness/mmP/kNγP/%
L-Z-11.547.934
L-Z-4267.95841.77
L-Z-52.579.16916.5
Note: γp is the percentage improvement of built-in thin-walled H-shaped steel and wood composite beam P relative to composite beam L-Z-1 P.
Table 4. The parameters of wood materials performance elasticity.
EL
(MPa)
ER
(MPa)
ET
(MPa)
μRTμLRμLTGLTGLRGRT
11,0221102.2551.10.370.0220.37661.32826.65198.40
Disclaimer/Publisher’s Note: The statements, opinions and data contained in all publications are solely those of the individual author(s) and contributor(s) and not of MDPI and/or the editor(s). MDPI and/or the editor(s) disclaim responsibility for any injury to people or property resulting from any ideas, methods, instructions or products referred to in the content.

