Article

Seismic Performance Comparison of Three-Type 800 m Spherical Mega-Latticed Structure City Domes

1
Key Lab of Structures Dynamic Behavior and Control of the Ministry of Education, Harbin Institute of Technology, Harbin 150090, China
2
Key Lab of Smart Prevention and Mitigation of Civil Engineering Disasters of the Ministry of Industry and Information Technology, Harbin 150090, China
*
Author to whom correspondence should be addressed.
Sustainability 2023, 15(9), 7240; https://doi.org/10.3390/su15097240
Submission received: 13 March 2023 / Revised: 5 April 2023 / Accepted: 24 April 2023 / Published: 26 April 2023
(This article belongs to the Special Issue Sustainable Structures and Construction in Civil Engineering)

Abstract

:
With changes in the city environment and advances in engineering technologies, there is an increasing demand for the construction of super-large span city domes that can cover a large area to create a small internal environment within a specific region. However, the structural design must overcome various challenges in order to break the current structural span limitations. Moreover, there is little research on structures achieving such large spans. The seismic performance of the selected Kiewitt-type, Geodesic-type, and Three-dimensional grid-type mega-latticed structures is further investigated upon previous studies of the model selection, static and stability analysis results of the 800 m span mega-latticed structures. Finite element models were established with ANSYS to analyze the modal properties and earthquake response of the structures. The study evaluated the impact of earthquake directionality on the structural response as well as the response pattern of the structure under frequent and rare earthquake actions. It was found that the overall integrity of the structures is good, with strong coupling effects in three directions. The multi-dimensional seismic input method should be applied to solve the structural response. Combining the plastic development of the structure under rare earthquakes, the top and the circumferential trusses of the third and fourth rings are relatively weak parts of the structures. According to this study, given the known static analysis results, the maximum displacement and maximum stress of the structures under frequent and rare earthquake actions can be estimated. Furthermore, the study highlights that Three-dimensional grid-type mega-latticed structures should be prioritized designing structures with spans of 800 m, providing helpful guidance for the practical application of this type of structure.

1. Introduction

Structural engineers in the field of space structure have been pursuing larger structural spans. The reinforced concrete Centennial Hall in Wroclaw [1], with a span of 65 m that was built in 1913, is still in use today. After more than a century, the structural materials have advanced from concrete to steel [2] and aluminum alloys [3], and the structural span has increased from tens of meters to hundreds of meters. At the same time, structural forms are also becoming increasingly varied and complicated [4,5]. With the continuous breakthrough of the structural span, people’s living demands and the pursuit of environmental quality are gradually rising. In recent years, climate change has intensified, and extreme weather has occurred frequently [6], causing many inconveniences to people’s normal lives and leading to losses of life and property, thus prompting people to think about protecting existing cities. Engineers are currently exploring the possibility of constructing super-large-span structures, and such a kilometer-level “city dome” could create many new challenges [7]. The “city dome” could reduce the huge costs of air conditioning and snow removal in winter, while creating a comfortable indoor environment. Additionally, because of the considerable interior space, the dome may experience uplift due to the hot air inside, which will offset some of the gravity loads of the structure. Although there are already a few structures that exceed 300 m [8,9,10], the development of kilometer-level “city domes” requires continuous exploration and innovation of structural systems.
The increase in span leads to more complex structural forms having an increasing number of structural members and a greater weight. As a result, structural designs encounter new challenges to increase the bearing capacity against static and dynamic loads and improve structural stability. The mega-latticed structure proposed by He and Zhou [11] has a dual force transmission system of the main structure and substructure, which is more reasonable when the span reaches more than 200 m. He and Zhou first studied cylindrical mega-latticed structures with a double-layer grid shell as the substructure [12], providing a preliminary understanding of their static performance and buckling modes. Then, they investigated the cylindrical mega-latticed structure with a single-layer-latticed membranous shell substructure [13] and a cylindrical mega-latticed structure with the single-layer intersectional grid cylindrical shell substructure [14] and gave a range of values for the rise/span ratio of the substructure and the main structure. When the rise/span ratio for both the main structure and substructure is 1/6, the ultimate bearing capacity of the structure reaches its peak [14]. It is also noted that the buckling mode of the structure depends on the stiffness ratio between the main structure and the substructure, and for safety considerations, the instability of the main structure should occur after that of the substructure [13]. By studying the stability during the construction process of the spherical mega-latticed structures [15], it was concluded that the geometric nonlinearity of the structure should be considered in the stability analysis during construction. However, their studies on this structural form have primarily been concentrated on spans between 80 m and 160 m, without delving into even larger spans. Zhang [16,
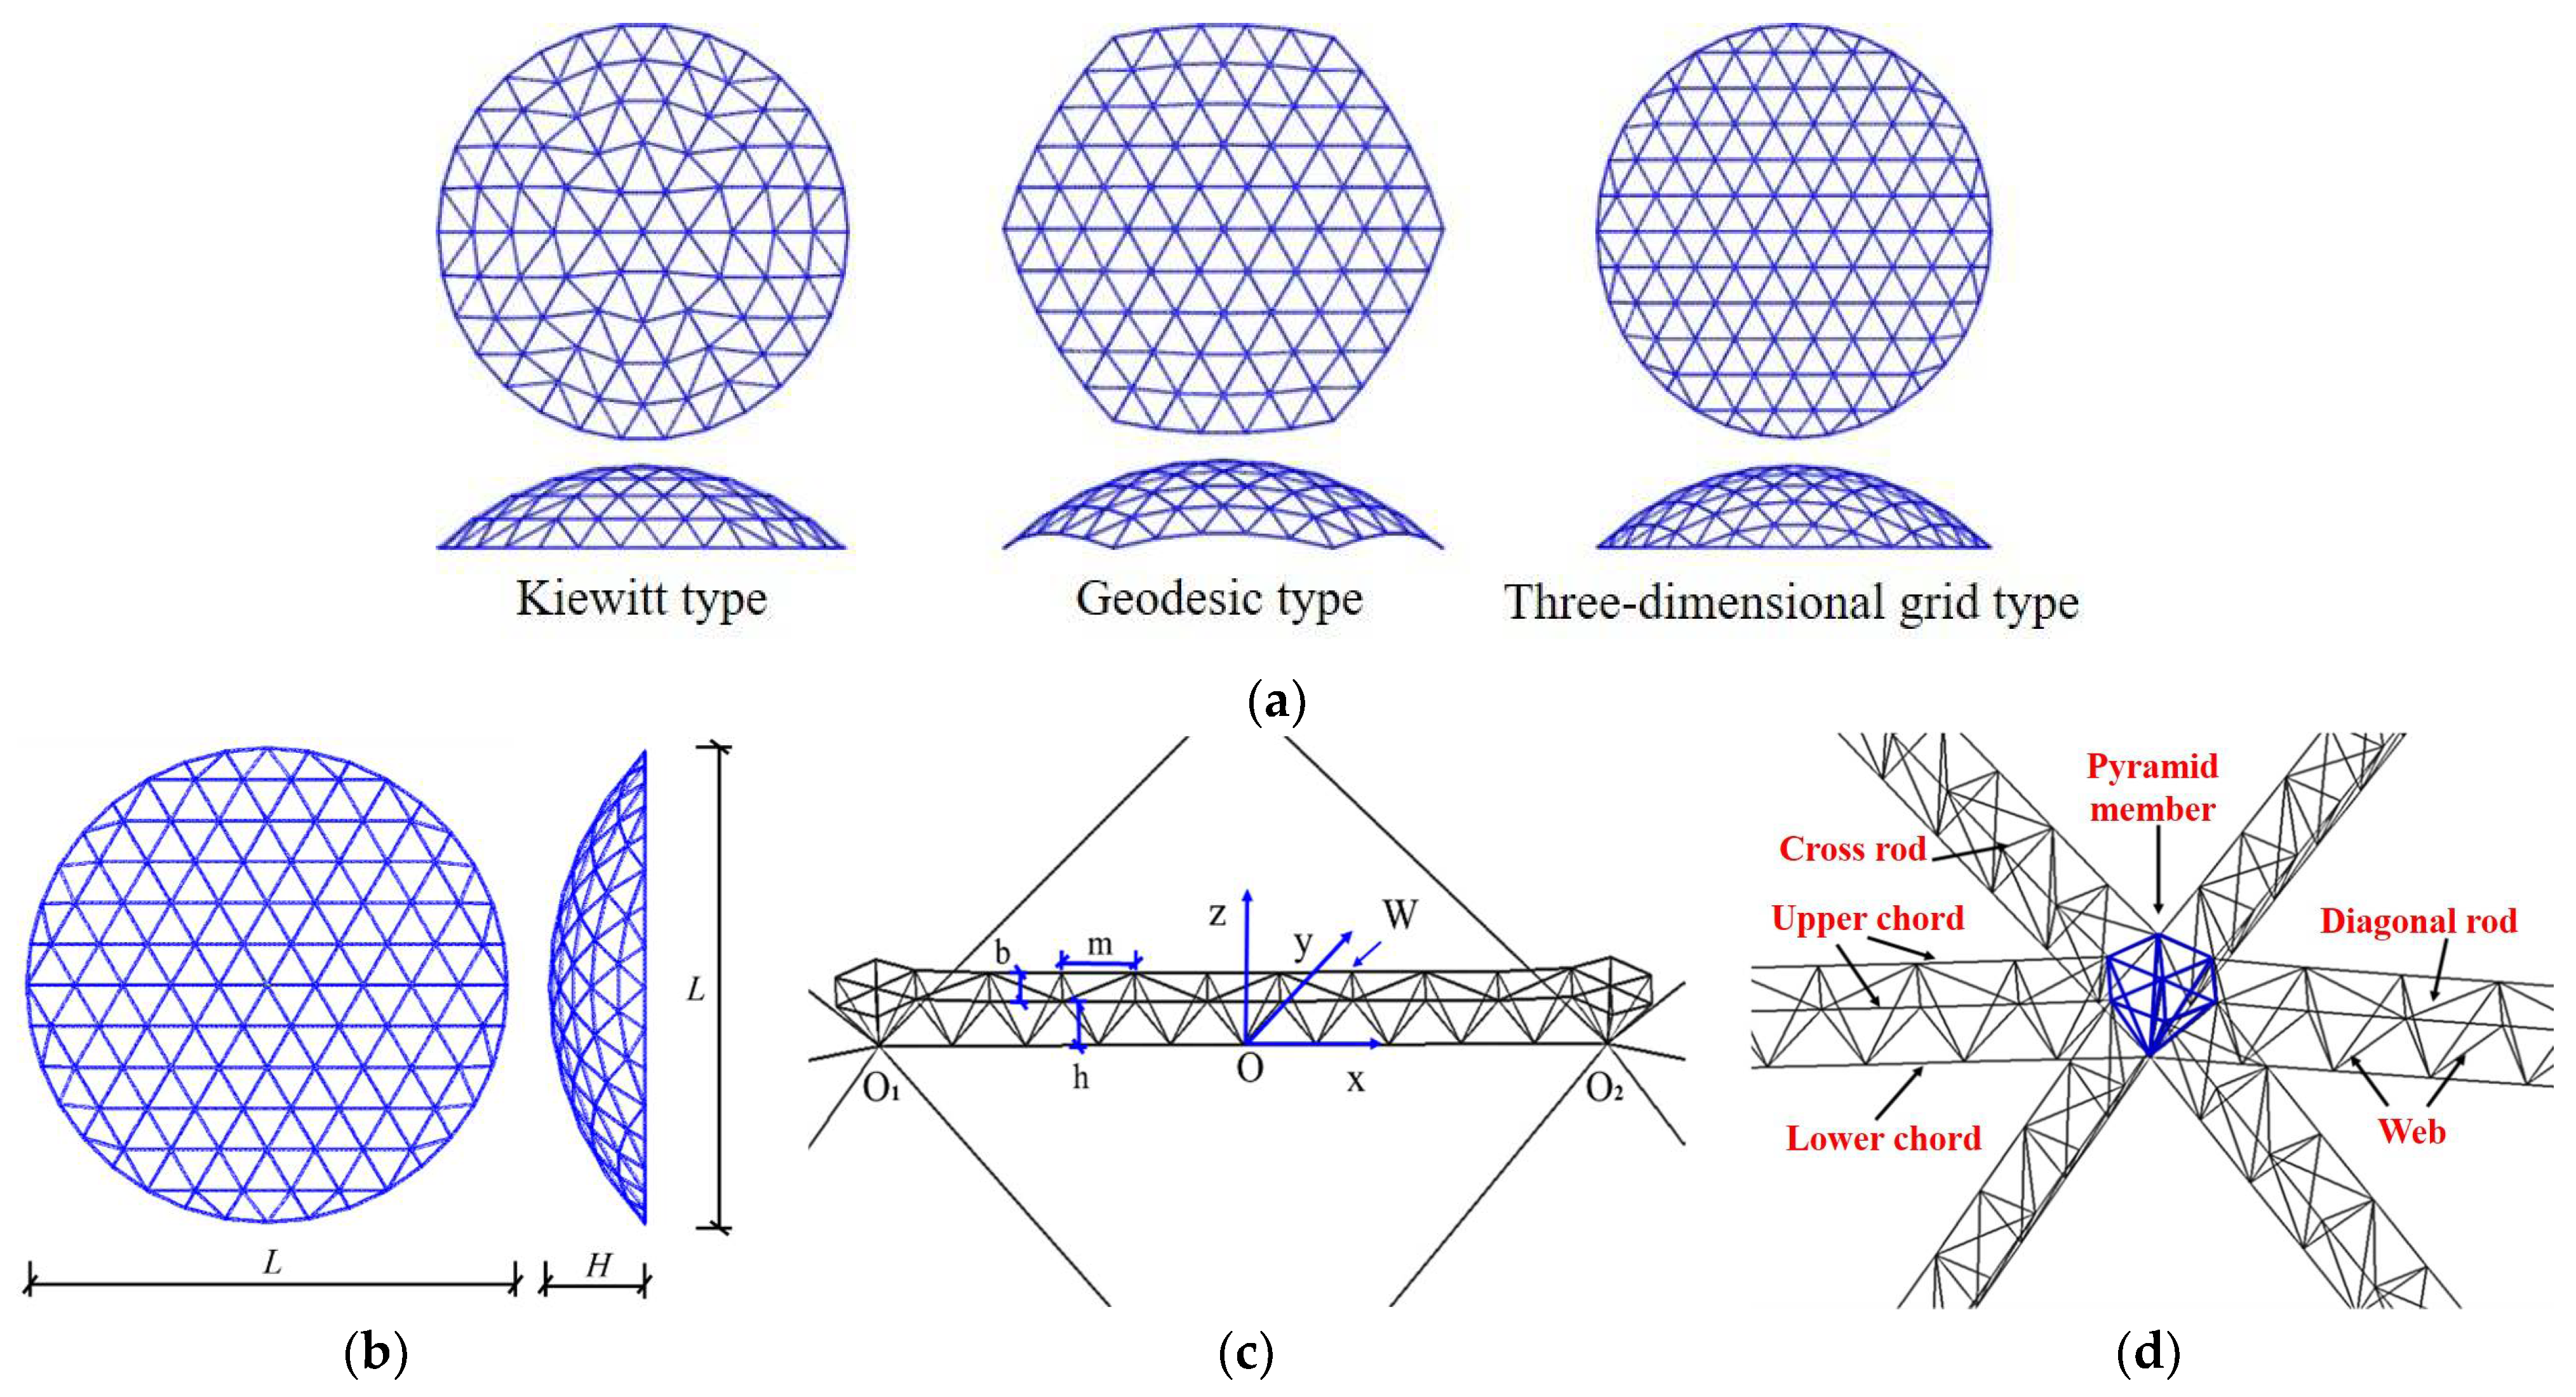
17] carried out studies on the optimization and model selection of spherical mega-latticed structures with a span of 800 m, as well as the static and stability performance of the structures. It is shown that at the span of 800 m, the maximum displacement and the structural steel consumption under static forces of the Kiewitt-type, Geodesic-type, and Three-dimensional grid-type mega-latticed structures are smaller than those of the Ribbed-type, Schwedler-type, and Sunflower-type mega-latticed structures, and their stability capacity is higher, making them suitable as structural forms for spans up to 800 m [17]. The mega-latticed structure has better light transmittance and requires less steel than traditional double-layer-reticulated shell structures, which can effectively reduce the carbon emissions of the structure and play an important role in energy saving and emission reduction.
Earthquakes are sudden natural disasters that can have significant impacts on personal safety, the natural environment, and human society. Both high-rise structures and large-span space structures are voluminous architectural structures which often accommodate a high concentration of people. If they suffer damage during an earthquake, it could result in unpredictable and devastating consequences. Thus, it is essential to conduct seismic research on them. Research on the seismic resistance of high-rise buildings is relatively mature, with current efforts focused on energy dissipation and vibration reduction in structures. Wang [18] and Zhang [19] conducted research on the seismic performance of steel-truss-reinforced concrete core walls and steel frames with replaceable energy dissipation elements, respectively. The steel truss reinforcement significantly improved the load-bearing capacity, ductility, and energy dissipation capability of reinforced concrete core walls, while the replaceable energy dissipation elements effectively reduced the structural damage and maintenance cost. Applying the numerical simulation method, Barkhordari compared the performance of different types of passive damping systems under seismic action [20]. The results showed that friction-based and viscous-based damping systems were the most effective type of passive damping systems. In terms of seismic research on large-span space structures, Abdalla [21] analyzed the dynamic characteristics of spherical and parabolic reinforced-concrete domes and obtained the relationship between the structural frequency and dome height as well as thickness. Feizolahbeigi [22] discussed the seismic performance of double-shell spherical domes in Iran during the 16th to 18th centuries. Through the study of many cases, it was found that rational geometric shapes and proportions can improve the overall stability of the structure, while appropriate construction techniques can reduce the structure’s seismic response. Research on isolation systems for large-span spatial structures is also being conducted. The use of hybrid three-directional isolation systems can significantly reduce the seismic response of dome structures while possessing a good energy dissipation capacity and control effect [23].
The seismic analysis of super-large-span structures becomes more complex as the span increases. The significant increase in the number of rods increases the number of low-order vibration modes [24], and the relatively dense structural frequencies and the similarity of the periods of the different modes reflect the complexity of the dynamic properties of the structure due to the existence of multiple symmetry axes [25]. In addition, the height of the structure increases at the same time as the span of the structure increases, resulting in the dual characteristics of large-span and high-rise structure. Therefore, it is necessary to conduct research on the dynamic performance of the structures based on the previous static and stability studies [17]. The analysis of the dynamic characteristics of the structures and the discussion of the influence of the earthquake direction on their response can help to understand the overall stiffness. The calculation of the structures’ response under frequent and rare earthquakes provides a rough estimate of the response at a specific seismic intensity with known static results. Studying the plastic development of the structure under rare earthquakes contributes to identifying weak parts and enables appropriate design measures. Finally, we propose the optimal structural model for an 800 m span spherical mega-latticed structure based on the structures’ dynamic performance, providing guidance for practical applications.

2. Spherical Mega-Latticed Structure Model

2.1. Geometric Model of the Spherical Mega-Latticed Structure

Based on the static calculation results by Zhang [17], a spherical mega-latticed structure can be adopted with three structural forms: Kiewitt-type, Geodesic-type, and Three-dimensional grid-type, as shown in Figure 1a, for spans of up to 800 m. These three structural forms all divide the sphere into relatively uniform triangular grids, exhibiting good and similar mechanical performances. The primary geometric parameters that need to be determined to establish a structural model include structural span L, rise/span ratio H/L (Figure 1b), the number of circumferential divisions nK, the number of radial divisions nN, the height of the truss h, the width of the truss b, and the length of the truss internodes m (Figure 1c). At the same time, all members in the structure are classified into eight categories, including upper chord, lower chord, web member, cross rod between upper chords, diagonal rod between upper chords, and members at the pyramid position, as well as pyramid adjacent lower chords and pyramid adjacent webs listed separately in consideration of the stress characteristics of the structure. The positions of the rods are shown in Figure 1d, and the size of the section is identical for the same rod type in the same ring.

2.2. Finite Element Model Parameters

In this study, ANSYS [26] was used to model, calculate, and analyze the structure. The element selection of the finite element model, the number of element mesh divisions, model materials, and load value are described as follows:
a. Element selection: The overall stress state of the mega-latticed structure is between that of the single-layer reticulated shell and the double-layer reticulated shell. To improve the structural safety while considering a simplified calculation model, it is assumed that the connections between the structural members are rigid; meaning that the rods not only bear the axial force but also the bending moment, the torque, the shear force, etc. [27]. In addition, to consider the subsequent analysis of the plastic development of the structure under the rare earthquake excitation, the PIPE20 element that specifically simulates the pipe structure was selected.
b. The number of element mesh divisions and support form: To achieve a balance between computational accuracy and efficiency, it is necessary to determine the number of element mesh divisions. Fan [28] studied the ultimate bearing capacity of the structure with the rods divided into different element numbers. The results show that the bearing capacity remained stable when the rod was divided into more than three elements, as shown in Figure 2. Therefore, the rods of the structures were divided into three elements along the length. The three-direction-hinged supports were set at the lower chord nodes of the outermost ring.
c. Materials: All members in the research structures were made of Steel Q420, which has a yield strength of 420 MPa. Additionally, the ideal elastoplastic model was used as the constitutive model. Considering that the structural members may enter the plastic stage under the rare earthquake excitation, the Bilinear kinematic (BKIN) hardening [29] was adopted to calculate the structural response. The material’s elastic modulus, the Poisson’s ratio, and the density are 210 GPa, 0.3, and 7850 kg/m3, respectively.
d. Gravity standard value: In accordance with the Code for Seismic Design of Buildings (GB50011-2010) [30], the representative value of the gravity load is composed of the standard value of the dead load and 0.5 times the standard value of snow load, where the standard value of snow load is 50 kg/m2, and the combined representative value of the gravity load is 120 kg/m2. The load is converted into concentrated mass and applied to the node of the finite element model in the form of the MASS21 element.
To obtain the influence of different structural forms on the seismic performance more intuitively, the geometric parameters of the structures in Figure 1 were kept the same. After selecting the member section under the static action, the steel consumption of the Kiewitt-type, the Geodesic-type, and the Three-dimensional grid-type mega-latticed structures was 201.90 kg/m2, 165.58 kg/m2, and 157.21 kg/m2, respectively.

3. Structural Dynamic Characteristic Analysis

This section conducted a modal analysis on three spherical mega-latticed structures of Kiewitt-type, Geodesic-type, and Three-dimensional grid-type. The first 3000 modes of frequencies, periods, and vibration modes of the three structures were calculated. The frequency and period distribution diagrams of the modes that cause the structure’s cumulative effective mass coefficient to exceed 90% were plotted, and the vibration modes were analyzed to understand the basic dynamic characteristics of the three spherical mega-latticed structures.

3.1. Analysis of Structural Spectral Characteristics

Spectral analysis of the three spherical mega-latticed structures was performed to obtain their spectral characteristics. Figure 3a shows the frequency and period distributions. The fundamental frequency f1 and fundamental period T1 of Kiewitt-type, Geodesic-type, and Three-dimensional grid-type mega-latticed structures are 0.426 Hz and 2.35 s, 0.429 Hz and 2.33 s, and 0.407 Hz and 2.46 s, respectively. The fundamental period exceeds that of the ordinary-span-reticulated shell and is far from the predominant period of the ground. Taking the Three-dimensional grid-type mega-latticed structure as an example, Figure 3b shows the frequency change rate pi% (pi = 100 × (fi+1fi)/fi) of the first 1000 modes. About 71.8% of the values fall in the interval [0.01–1%], and only 3.9% of the values are distributed in [1–10%]. The mega-latticed structure of the Kiewitt-type and the Geodesic-type exhibit similar distribution laws. It shows that the frequency changes of the structure are not significant, and the distribution is uniform, reflecting the complexity of the dynamic characteristics of such super-large-span structures.

3.2. Characteristic of Structural Mode

Since the three spherical mega-latticed structures studied in this paper are similar in many respects, the Three-dimensional grid-type structure is taken as an example. Figure 4 shows the first 6 modes of the structure. Due to the presence of multiple axes of symmetry, the frequency and period of two adjacent modes are the same, such as Mode-II and Mode-III, Mode-IV, and Mode-V.
The order of the mode occurrence can reflect the stiffness levels of the structure in different directions. In all three types of mega-latticed structures, the vertical mode is the first to occur, suggesting that the horizontal stiffness of these three mega-latticed structures is greater than the vertical stiffness. Considering the relatively small rise/span ratio of the structures, the conclusion of weak vertical stiffness is reasonable. In addition, the first several modes are all global modes, indicating that there are no obvious weaknesses in the stiffness of the structure.

3.3. Determination of Rayleigh Damping

Rayleigh damping [31] is commonly used in engineering applications to approximate the damping of the structure. The damping matrix of the structure is assumed to be a linear combination of the mass and the stiffness matrices, as shown in Formula (1), where α and β are the mass damping coefficient and the stiffness damping coefficient, respectively. These coefficients can be obtained by Formulas (2) and (3), which involve the frequencies of the i-th and j-th modes (denoted by ωi and ωj), as well as the corresponding damping ratios (ξi and ξj). For space structures, a typical value of 0.02 is often used as the damping ratio [27]. Once α and β are obtained, the damping ratio of the k-th mode can be calculated from Formula (4).
In Formulas (2) and (3), the i-th mode is typically one of the first few modes that contribute significantly to the effective mass coefficient, while the j-th mode is the mode whose cumulative effective mass coefficient reaches 60–70% and has an effective mass coefficient exceeding 5%. Figure 5 shows the damping ratio of each mode when i is the 2nd mode, and j takes different values. Notably, the damping ratios of the modes between the 2nd and the j-th mode are typically lower than 0.02, while the damping ratios of the modes outside this range are greater than 0.02.
C = α M + β K
α = 2 ω i ω j ξ i ω j ξ j ω i / ω j 2 ω i 2
β = 2 ξ j ω j ξ i ω i / ω j 2 ω i 2
ξ k = α / 2 ω k + β ω k / 2
Based on the results depicted in Figure 5, selecting the 130th, 100th, and 111th modes as the j-th mode yields more suitable Rayleigh damping coefficients for the Kiewitt-type, the Geodesic-type, and the Three-dimensional grid-type mega-latticed structures, respectively.

3.4. Earthquake Selection

To meet the requirements of seismic design, the earthquake selected should satisfy three characteristics: spectral characteristics, effective peak value, and duration. The spectral characteristics can be characterized by the seismic influence coefficient, and the designed response spectrum can be obtained from the seismic fortification intensity, the site category, and the design earthquake grouping [30]. When the seismic fortification intensity is degree 8 (The design basic ground motion acceleration is 0.02 times the gravitational acceleration), the site category is Class II (Cohesive soil with an allowable bearing capacity of foundation soil [σ0] > 150 kPa), and the seismic design group is the first group, the design response spectrum of the structure can be determined.
The selected seismic records and earthquake information are shown in Figure 6. The seismic acceleration time history was amplitude modulated according to Formula (5), where a’(t) is the amplitude modulated acceleration time history, a(t) is the original acceleration time history, Amax is the maximum value of the amplitude modulated acceleration time history obtained based on the specification [30], and Amax is the maximum value of the original acceleration time history. Additionally, the effective duration of the earthquake should generally be 5 to 10 times the fundamental period of the structure according to the specification [30]. For this study, a duration of 30 s has been selected.
a t = A max A max a t

4. Effect of Seismic Direction on Structural Response

According to the Code for Seismic Design of Buildings (GB50011-2010) [30], vertical seismic should be considered for large-span structures with fortification degrees 8 and 9. Therefore, this study utilizes three-dimensional earthquakes for seismic analysis. To illustrate the impact of earthquake direction on the structural responses, taking the Three-dimensional grid-type mega-latticed structure as an example, the structural responses due to one-dimensional and two-dimensional earthquakes were calculated separately for comparison.
The structure was divided into five rings in the radial direction, designated as Ring 1 to Ring 5. In the ring direction, sectors were defined every 60°, starting with Sector 0 in the positive direction of the X-axis. The counterclockwise direction was considered positive, while the clockwise direction was negative, resulting in Sector ± 1, Sector ± 2, and Sector ± 3. Notably, Sector 3 and Sector − 3 were coincident, as shown in Figure 7.
Due to the large number of elements and nodes in the 800 m mega-latticed structure, only specific elements and nodes were analyzed. Specifically, the elements and nodes located at the pyramid position as well as the upper and lower chords at the mid-span, 1/4-span, and 3/4-span of each ring, were selected as the characteristic objects for analysis.
For the seismic analysis, Record 1 in Figure 6 was modulated to the effective amplitudes of 70 gal for frequent earthquakes in X, Y, Z, XY, and XZ directions and input to the structure. Subsequently, the time history analysis method was applied to assess the coupling degree of the structural responses when two horizontal earthquakes or horizontal and vertical earthquakes act simultaneously.

4.1. Effect of Seismic Direction on Displacement Response

4.1.1. Effect of X, Y, and XY Direction Seismic Action on Displacement Response

This section studies the distribution of the displacement increment relative to the static displacement of the characteristic nodes in the X, Y, and Z directions with the number of rings and sectors under the seismic action in X, Y, and XY directions. The results are presented in Figure 8.
The displacement increments in the X, Y, and Z directions are of similar magnitudes, with the largest increment occurring in the Y direction. Figure 8a reveals that the seismic action in the Y direction contributes significantly to displacement increments in the X direction, especially at the 1.5 ring and the 4–5 ring, as well as the 0.5 sector and −2.5 sector in rotationally symmetric positions. It indicates a strong coupling between the X and Y directions. Furthermore, Figure 8c demonstrates that seismic action in the X and Y directions considerably contributes to displacement increments in the Z direction, suggesting a strong coupling across the three directions.

4.1.2. Effect of X, Z, and XZ Direction Seismic Action on Displacement Response

This section analyzes the coupling degree between horizontal and vertical seismic responses by comparing the displacement increments of the structure under X, Z, and XZ seismic action. The results, as shown in Figure 9, align with those observed in Section 4.1.1, wherein the displacement increments in the three directions are greater under XZ seismic action than under the one-dimensional seismic action. Furthermore, under vertical seismic action rather than horizontal seismic action, the displacement increment in the horizontal direction is smaller.
As seen in Figure 9c, the vertical displacement increment increases within the range of 0 to 0.75 ring under X-direction seismic action, whereas it decreases within the same range under Z-direction seismic action. After 0.5 rings, the vertical displacement increment under the X-direction seismic action exceeds that under the Z-direction seismic action. However, the distribution of Z-direction displacement increment under XZ-direction seismic action is consistent with that under X-direction seismic action, signifying that the influence of X-direction seismic action is dominant when considering the coupling of the earthquakes in the direction of X and Z.

4.2. Effect of Seismic Direction on Stress Response

To reflect the extent of the structural stress affected by seismic direction, the distributions of the equivalent stresses of the elements with the number of rings under various seismic action directions were compared, as shown in Figure 10.
Equivalent stress increments in elements are larger than those observed under one-dimensional seismic action, however they nevertheless have a comparable magnitude, regardless of whether the earthquake action is XY or XZ. According to Figure 10b, the horizontal earthquake has a greater effect than the vertical earthquake in terms of the equivalent stress increment of the element. The stress response in the horizontal direction is more influenced by seismic action in the Y direction than in the X direction, which is consistent with the displacement response result. Because the X-direction seismic action passes longitudinally through one of the primary directions of the Three-dimensional grid-type mega-latticed structure, where the structural stiffness is comparatively high, while the Y-direction seismic action is transversely perpendicular to the truss, causing a more significant response from the structure.
Based on the observed effects of seismic action direction on structural displacements and stresses, it can be concluded that there is a high degree of coupling between the horizontal and vertical directions in the structures. Additionally, the results suggest that the vertical seismic action does not necessarily play a controlling role in the structural response; on the contrary, the horizontal seismic action may have a more significant impact. Therefore, seismic analysis should consider the joint action of horizontal and vertical earthquakes simultaneously, and the three-dimensional seismic input should be adopted to accurately capture the structural response.

5. Response Analysis of Structures under Frequent Earthquakes

The method used to analyze the displacement and stress response of structures subjected to frequent earthquakes involved the application of time history analysis. The selected seismic records were amplitude modulated to 70 gal before being input into the Kiewitt-type, Geodesic-type, and Three-dimensional grid-type mega-latticed structures, respectively. Since the selected seismic motions were chosen based on the structural spectral characteristics, each input motion can relatively accurately reflect the structures’ response. Therefore, in the subsequent analysis, when displaying the results of a specific input motion, they correspond to the seismic action of Record 1 in Figure 6. The maximum envelope values at each position are displayed on the displacement and stress distribution curves.

5.1. Displacement Response under Frequent Earthquakes

Figure 11 illustrates the radial and circumferential displacement envelope of the Kiewitt-type, Geodesic-type, and Three-dimensional grid-type mega-latticed structure under the static force and Record 1 seismic action. Similar displacement distributions are observed under seismic and static loads across the three structures from the comparison of the displacement envelope. The maximum displacement in the X and Y horizontal directions increases and then decreases radially from the top of the dome to the supports. Due to the support constraints, the maximum displacement mostly occurs within Rings 3 to 4. The maximum vertical displacement occurs at the center of the dome and gradually decreases towards the supports. The distribution of the maximum displacement along the circumferential direction shows an opposing pattern in the X direction compared to the Y direction, as observed in Figure 11d,e.
In addition, the curves of the ratio of dynamic displacement to static displacement along the radial direction are drawn in Figure 12. The ratios of the two horizontal directions are relatively high within the 0–2 ring. The reason could be that the structural displacements within the 0–2 ring are relatively small in the static case, while the seismic action leads to a uniform increase in structural displacement. Conversely, the ratio in the Z direction is lower than that in horizontal directions, with no significant change observed along the radial direction.
Due to the unique characteristics of individual seismic records, different seismic records may result in varying responses from a structure. Therefore, the responses of the three mega-latticed structures were calculated separately under the action of the other four seismic records presented in Figure 6, and the statistical results are listed in Table 1. Among them, the displacements in the two horizontal directions of the Kiewitt-type mega-latticed structure were greater than those of the Geodesic-type and Three-dimensional grid-type. However, the vertical displacements of the three structures were comparable magnitudes.
Based on the average displacement response of the three structures under the action of five seismic records, the ratio of dynamic displacement to the static displacement of the structures was estimated to be approximately 1.10~1.50, with the Z direction value ranging between 1.10~1.15. It can be observed that the displacement ratio in all three directions of the Three-dimensional grid-type mega-latticed structure is relatively uniform, which could be attributed to the topology of the structure. The mega grids in the Three-dimensional grid-type structure are positively triangular in the horizontal projection plane, except for the outermost ring, resulting in an equal representation of behavior in all three directions.

5.2. Stress Response under Frequent Earthquake

The stress responses of the structural members were calculated based on the 8 types mentioned in Section 2.1, and the distribution laws of the maximum stress along the radial direction were investigated under the frequent seismic action. In consideration of the complex stresses of the structural members, the von Mises stress is utilized to describe the stresses levels.
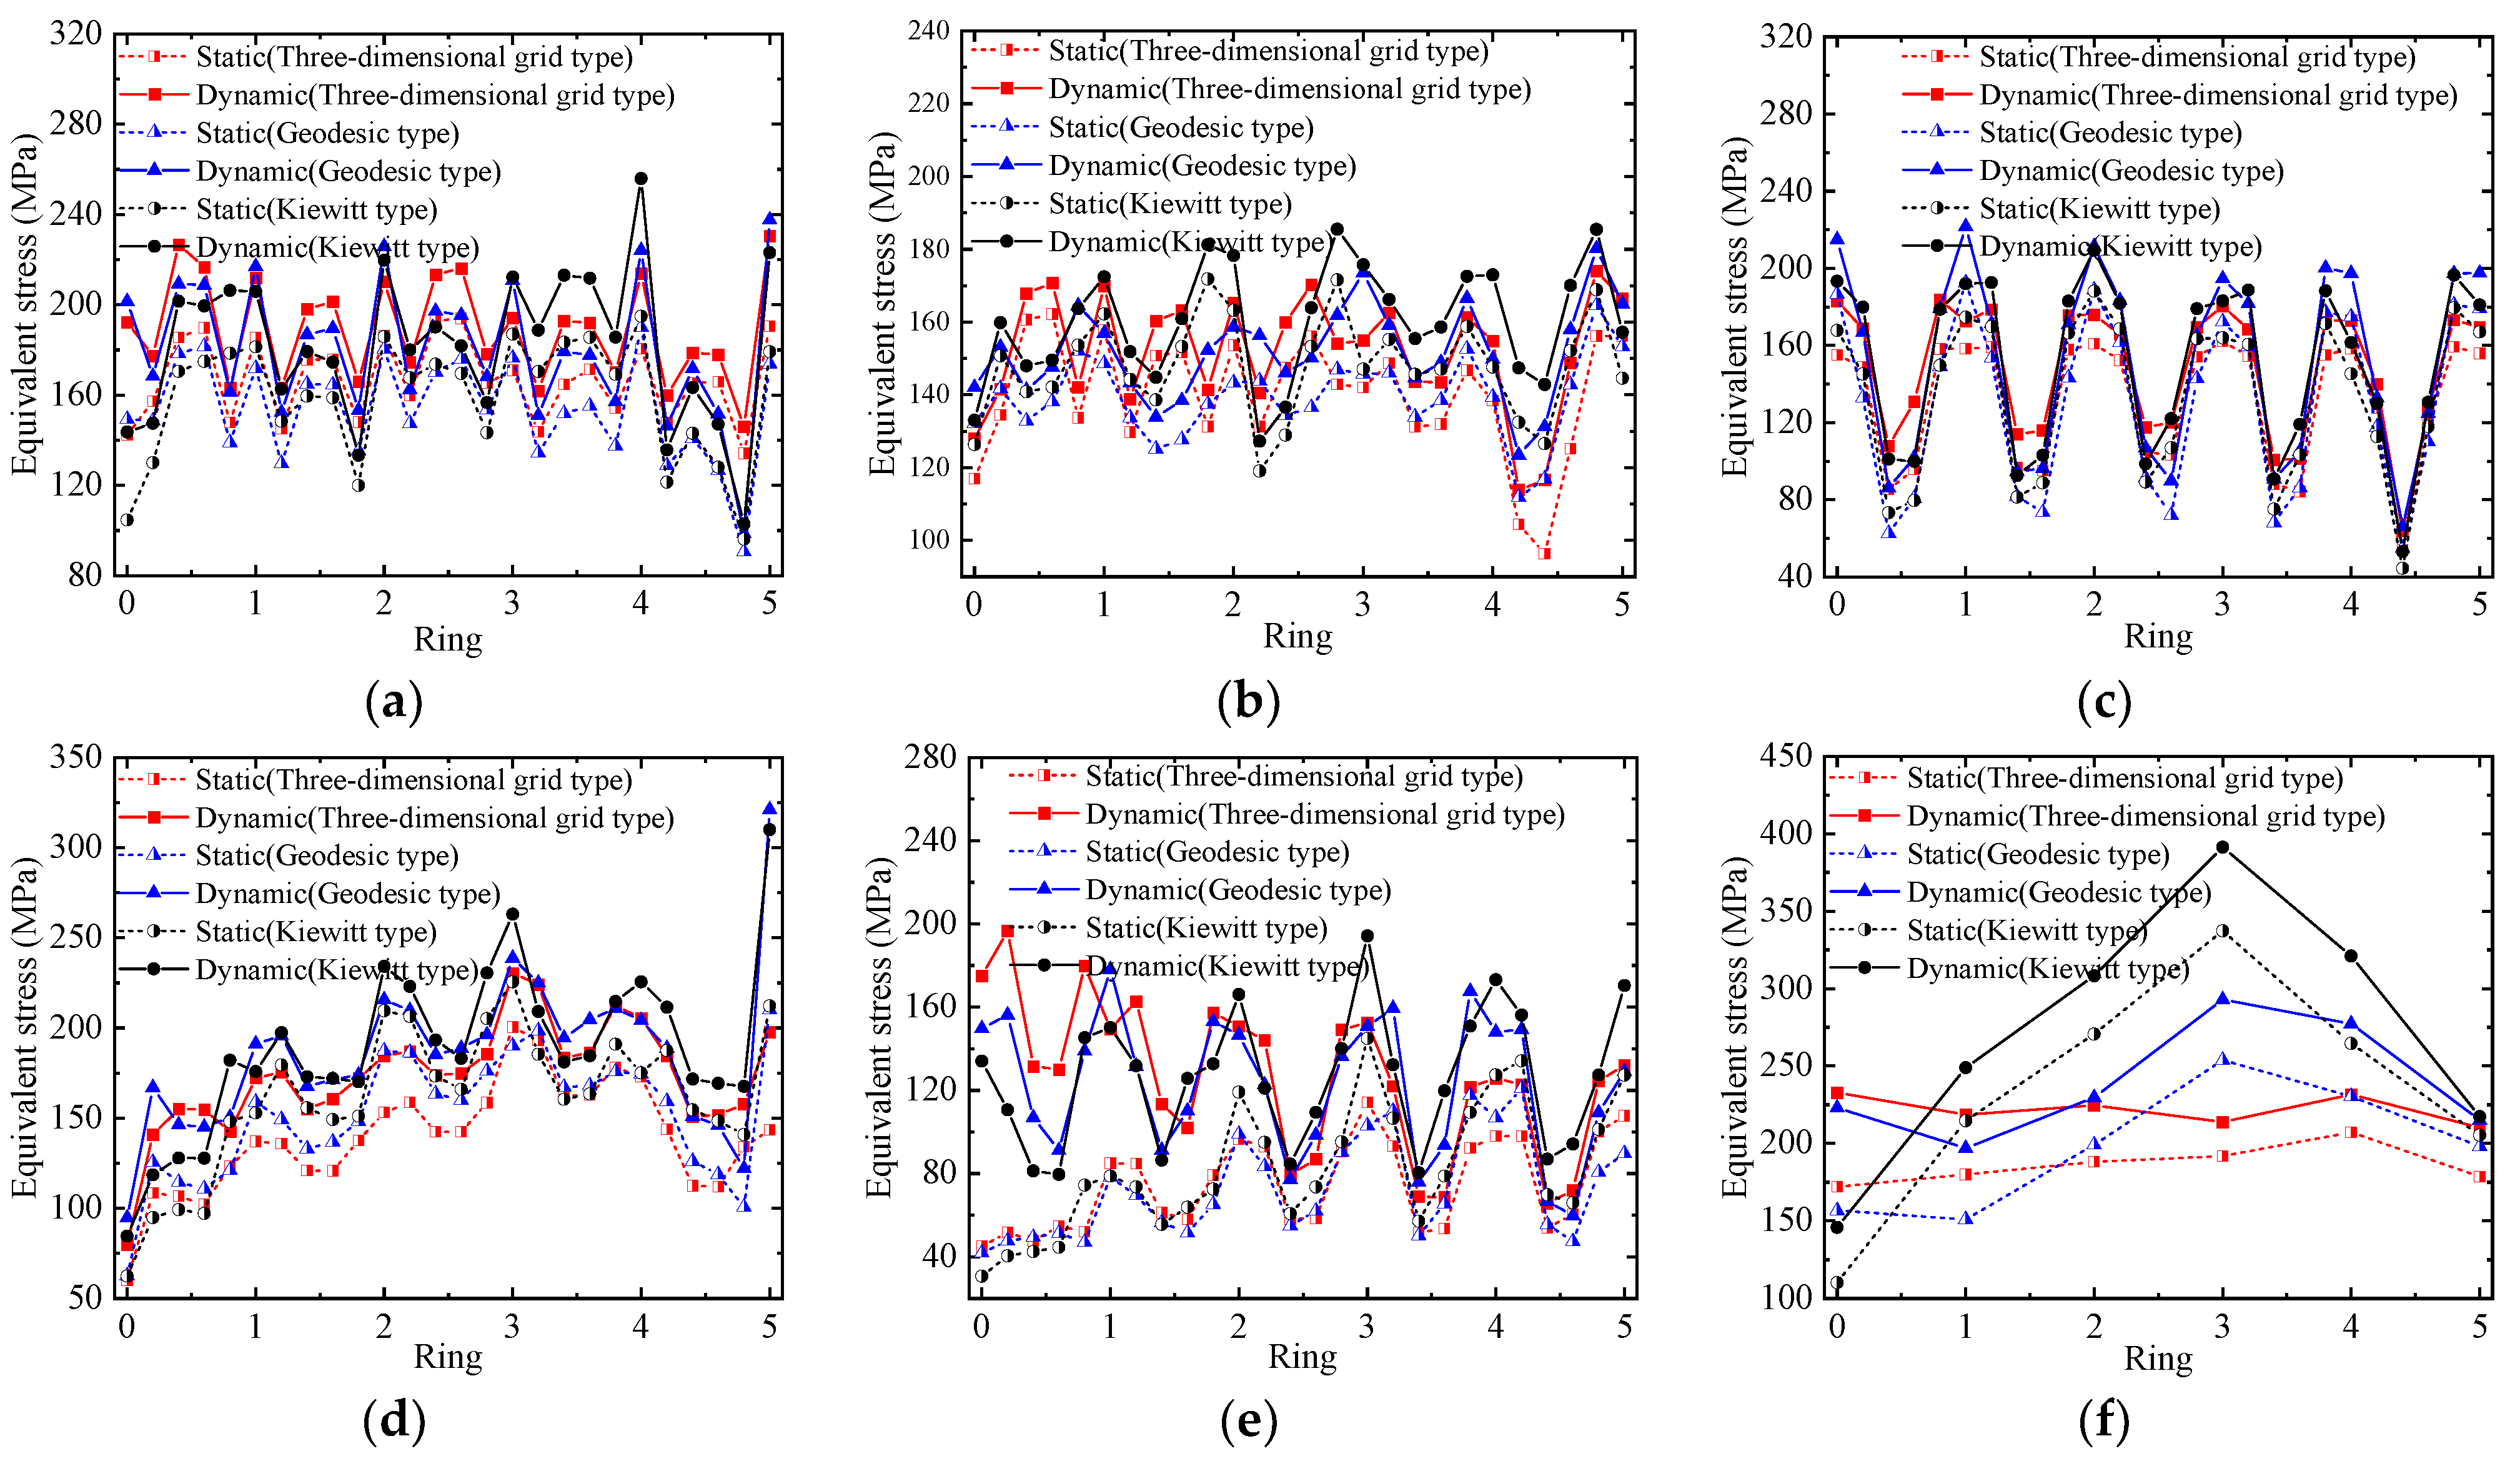
Figure 13 presents the radial distributions of the maximum equivalent stress of the upper chords, the lower chords, the web members, the cross rods between upper chords, the diagonal rods between upper chords, and the members at the pyramid position in the three types of spherical mega-latticed structures under the static force and Record 1 seismic action. Under frequent earthquakes, the distribution of the maximum equivalent stress in the radial direction follows a similar pattern to that observed under the static force. The high equivalent stresses near the structural intersection are due to the high density of the rods at these locations, resulting in an increased stiffness. Moreover, Figure 13f demonstrates that the equivalent stresses of the pyramid members at the intersection position are greater than those of the other member types.
Furthermore, from Figure 13a,d, the equivalent stresses of the upper chord and the cross rod between upper chords at the outermost ring near the support position are higher than those of the nearby rods, which may be related to the separate classification of the lower chords and web members near the pyramid when selecting the member sections. However, when considering the overall magnitude of the equivalent stresses for each member type, the values are evenly distributed.
The radial distributions of the ratio of the maximum equivalent stresses under the seismic action to that under the static force for each member type in the three structures are drawn in Figure 14. The stress ratios of the diagonal rods between the upper chords fluctuate more strongly along the radial distribution compared to other types of members, indicating a more significant impact on the stresses of the diagonal rods at the top of the spherical mega-latticed structure.
The stress responses of the three spherical mega-latticed structures under the action of the other four seismic records were also calculated, and the statistical results are listed in Table 2. The ratio of equivalent stress under seismic action to that under static force ranges from 1.10 to 1.85.
The stresses of the Kiewitt-type mega-latticed structure are significantly larger than those in the other two structures, indicating that the impact of the non-uniformity in the grid is amplified by dynamic loads, particularly in the pyramid position, where the maximum dynamic stresses have exceeded the stress ratio limit of 0.85 for the section selection in the static case, but have not yet reached the yield stress of the material.
Based on the above analysis of the displacement and stress response in the three 800 m-span spherical mega-latticed structures under the frequent earthquakes, and considering the steel consumption obtained from the section selection in the static case, it can be concluded that compared to the Geodesic-type and the Three-dimensional grid-type mega latticed structures, the Kiewitt-type structure has the higher steel consumption and member stresses under frequent earthquakes. Therefore, the Kiewitt-type structure may not be a suitable structural scheme for 800 m-span. Thus, only the Geodesic-type and the Three-dimensional grid-type mega-latticed structures will be studied in analyzing structures under rare earthquakes.

6. Response Analysis of Structure under Rare Earthquake

When the structure encounters a rare earthquake, properly designed structures should allow certain members to yield and develop into plasticity, and the stresses redistribute without causing damage to the structure [30]. The strategy sacrifices the secondary components of the structure to protect the primary ones. For instance, connecting beams in shear wall structures can have their stiffness deliberately reduced to absorb seismic energy and protect the primary structure. Similarly, in frame-core tube structures with outriggers, the outriggers can yield and dissipate energy while the core tube and outer frame remain elastic. After the 2022 M6.8 Luding earthquake in China, Qu [32] conducted field research in the disaster area and observed structures presenting this type of behavior. Therefore, this chapter performs an elastic–plastic analysis under the action of rare earthquakes using the Bilinear Kinematic Hardening (BKIN) model, which considers the Bauschinger effect. The model uses the Mises yield criterion and the kinematic hardening criterion to describe the stress–strain relationship of the material in two straight lines. The steel parameters are consistent with the previous analysis, and the tangent modulus is about 6300 MPa, which is 3% of the elastic modulus. Figure 15 depicts the stress–strain curve of the BKIN model. The seismic records in Figure 6 are amplitude-modulated to a peak effective acceleration of 400 gal for this analysis.

6.1. Displacement Response under Rare Earthquake

Figure 16 illustrates the maximum dynamic displacements distributions in the X, Y and Z directions along the radial and circumferential directions for the Geodesic-type and Three-dimensional grid-type mega-latticed structures under the action of Record 1 seismic action.
In the case of rare earthquakes, the distribution of the maximum dynamic displacements along the circumferential direction no longer exhibits a symmetrical shape. In the radial direction, certain locations experience significantly higher maximum dynamic displacements in the horizontal direction than under frequent earthquakes. Consequently, the radial distribution no longer shows a relatively smooth curve but one with jagged fluctuations at some positions. Conversely, the distribution of the maximum vertical dynamic displacement from the top of the supports is similar to that under frequent earthquakes, displaying a gradually decreasing curve.
To compare the radial variation of the maximum dynamic displacement ratios in the Geodesic-type and the Three-dimensional grid-type mega-latticed structures under rare and frequent earthquakes, α represents the ratio of elastic–plastic displacement under rare earthquakes to elastic displacement under frequent earthquakes. Meanwhile, αmax expresses the ratio of the maximum elastic–plastic displacement response to the maximum elastic displacement response. The curves of αmax along the radial direction are shown in Figure 17. In the horizontal direction, the values of αmax are relatively high at the top and the locations near the supports, indicating significant impact on nodal displacements at these positions with increasing seismic intensity. In contrast, the αmax in the vertical direction is smaller than in the horizontal directions, and the curves have slight fluctuations along the radial direction.
The displacement responses of the Geodesic-type and the Three-dimensional grid-type mega-latticed structures under four additional seismic records were also calculated, and the statistical results are listed in Table 3. Compared to the Geodesic-type mega-latticed structure, the Three-dimensional grid-type has a higher αmax in the horizontal direction and a lower αmax in the vertical direction. The significant difference between the values of αmax in horizontal and vertical directions implies greater impact on the structure’s horizontal direction due to the seismic intensity. The average displacement response results of both structures under five seismic records indicate that the ratio of maximum elastic–plastic displacement to maximum elastic displacement is about 2.5 to 3.0 in the horizontal direction and approximately 1.5 to 2.0 in the vertical direction.

6.2. Stress Response under Rare Earthquake

When the Geodesic-type and the Three-dimensional grid-type mega-latticed structures are subjected to the rare earthquake of Record 1 in Figure 6, the radial distribution of the maximum stresses for six types of members mentioned in Section 2.1 are shown in Figure 18. The maximum equivalent stresses take place near the intersection of the structure under rare earthquakes. However, the equivalent stresses at the intersection of the upper chord and the intersection of the 3rd and 4th rings of the lower chord are particularly sensitive to the seismic intensity and increase significantly. Compared to the Geodesic-type, the Three-dimensional grid-type exhibits a more uniform increase in stresses, with greater increase in the equivalent stresses observed in the web members of the innermost ring.
The ratio of the elastic–plastic stress under the rare earthquakes is denoted by β, and the maximum ratio of elastic–plastic stress to elastic stress is represented as βmax. Figure 19 shows the radial distribution of βmax for each member type in the Geodesic-type and the Three-dimensional grid-type mega-latticed structures. The diagonal rod between the upper chords exhibits a larger βmax than other types of members. The distributions of βmax for the upper chord, the lower chord and the members at the pyramid position are relatively stable, while other member types demonstrate sharp fluctuations.
Table 4 provides the stress statistics of the Geodesic-type and the Three-dimensional grid-type mega-latticed structures under rare earthquakes. The Geodesic-type has more elements reaching the yield stress, whereas the Three-dimensional grid-type has fewer elements entering the elastic–plastic stage. For the 800 m-span mega-latticed structures of both types, the βmax of the structures can be taken to be 1.35 to 2.10.

6.3. Structural Plastic Development under Rare Earthquake

Under rare earthquakes, numerous members in the Geodesic-type and the Three-dimensional grid-type mega-latticed structures enter the plastic stage. Therefore, this section studies the plastic development in the structure, including exploration of the degree and process of plasticity in each member type to pinpoint the weak positions. The finite element model employs the PIPE20 element with 8 integration points denoted by 1P to 7P representing at least 1 to 7 of the 8 integration points yielding into the plastic state, while 8P indicates that the entire section has yielded into plasticity.
The extent and distribution of plasticity in members of the Geodesic-type and the Three-dimensional grid-type mega-latticed structures subjected to rare earthquakes were first analyzed. Colored circles represent elements with varying degrees of plasticity, where larger circles indicate more integral points yielding into plasticity. Figure 20 depicts the distribution of plasticity degree of each member type in both structures, along with the statistical results of the proportions of each plasticity status.
The plastic development process of the Geodesic-type mega-latticed structure, which has a relatively higher degree of plasticity of the two structures, was also analyzed. Figure 21 shows the maximum degree of the plastic status at different moments. The cross rod between the upper chords at the outermost ring close to the support enters the plastic phase first, followed by the upper chords and the cross rods between the upper chords from near the supports to the inside of the structure. However, except for the cross rods between the upper chords at the outermost ring of the structure which quickly reach full-section yield, the plasticity of the remaining elements develops slowly and to a limited extent. The plastic development of the structure mainly occurs in the members at the pyramid position and the diagonal rods between the upper chords after 10 s of the action of the rare earthquake, progressing from the top of the structure towards the supports.
Throughout the plastic development process of the structure, the pyramid members and the diagonal rods at the top of the structure, along with the pyramid members and the cross rods of the 3rd and 4th ring trusses, and the cross rods near the supports exhibit a high degree of plasticity, which are the weak parts of the structure. Hence, particular attention should be paid to the members at these positions in the design, and certain measures should be taken, such as increasing the cross-section of the rods to avoid the structure from being damaged by these positions during rear earthquakes.

7. Discussion and Conclusions

Following the results of the model selection based on the static performance of the structure [17], this study further investigated the seismic performance of the selected Kiewitt-type, Geodesic-type, and Three-dimensional grid-type mega-latticed structures at 800 m span by applying the time history analysis method. In this study, the method for seismic motion input in time history analysis was determined through seismic directionality analysis. The responses of the structure under seismic actions were calculated to determine the response amplification factor compared to static or frequent seismic actions. The study of the plastic development under rare earthquakes revealed the plastic development process and the weak areas of the structure, and gave conclusions on the model selection, which are of guidance for the practical application of this type of structure.
The following conclusions can be drawn:
  • The fundamental periods of the three studied spherical mega-latticed structures with 800 m spans are far from the characteristic period of the site, possessing low fundamental frequencies and a dense spectrum. The vertical vibration modes are primarily excited in all three structures, indicating that the vertical stiffness is smaller than the horizontal stiffness. Strong coupling exists among the three directions of the structures, thus multi-dimensional seismic motions should be input when calculating the structural response.
  • The response analysis under frequent seismic actions is studied in combination with static analysis. By comparing the maximum response of different positions of the structure with the static results, the amplification factor of the structure under frequent seismic actions were obtained, which can estimate the dynamic response results from the static results. The dynamic displacement ratio ranges from 1.10 to 1.50 and the dynamic stress ratio ranges from 1.10 to 1.85.
  • The amplification factor of the elastic–plastic response of the structure under rare seismic actions relative to the elastic response under frequent seismic actions can be taken as 2.50 to 3.00 for horizontal displacement ratios and 1.50 to 2.00 for vertical displacement ratios, while the stress ratios range from 1.35 to 2.10. The deformation of the structure is more affected by seismic intensity than stresses, and the horizontal displacement is more sensitive to seismic intensity.
  • Under rare seismic actions, only less than 5% of the elements enter the plastic stage, with higher plastic development degree observed in the cross rods, the diagonal rods, and the members at the pyramid positions. The cross rods close to the support first enter the plastic phase, and the top of the structure and the third and fourth rings from the top to the supports show a high degree of plastic development, which are the relatively weakness of the structure.
  • The Kiewitt-type mega-latticed structure requires a large amount of steel and experiences high stress under the seismic actions, making it not applicable to the 800 m span. Under the rare seismic actions, the number of elements entering plasticity and the degree of plastic development of the Geodesic-type mega-latticed structure are higher than those of the Three-dimensional grid-type. Therefore, when designing an 800 m span spherical mega-latticed structure, priority should be given to the Three-dimensional grid-type.

Author Contributions

Conceptualization, Y.Z.; methodology, Y.Z. and Z.Z.; software, Z.Z.; validation, Y.Z. and Z.Z.; formal analysis, Z.Z.; resources, Y.Z.; data curation, Z.Z.; writing—original draft preparation, Z.Z.; writing—review and editing, Y.Z.; supervision, Y.Z.; project administration, Y.Z.; funding acquisition, Y.Z. All authors have read and agreed to the published version of the manuscript.

Funding

This research was funded by National Natural Science Foundation of China, grant No. 51978207 and 51927813; National Science Fund for Distinguished Young Scholars, grant No. 51525802; Creative Research Groups of National Natural Science Foundation of China, grant No. 51921006; Heilongjiang Natural Science Foundation for Excellent Youth project, grant No. YQ2021E030.

Institutional Review Board Statement

Not applicable.

Informed Consent Statement

Not applicable.

Data Availability Statement

The data used to support the findings of this study are available from the corresponding author upon request.

Acknowledgments

This work was financially supported by the Funds for Creative Research Groups of National Natural Science Foundation of China (Grant No. 51921006), National Natural Science Foundation of China (Grant No. 51978207, 51927813), National Science Fund for Distinguished Young Scholars (Grant No. 51525802), and Heilongjiang Natural Science Foundation for Excellent Youth project (Grant No. YQ2021E030), which is gratefully acknowledged.

Conflicts of Interest

The authors declare no conflict of interest.

References

  1. Mariangela, L. The Centennial Hall of Wroclaw: History of A Modern Architecture in Reinforced Concrete Classified World Heritage Site. J. Archit. Conserv. 2021, 27, 17–52. [Google Scholar]
  2. Hladik, P.; Lewis, C.J. Singapore National Stadium Roof. Int. J. Archit. Comput. 2010, 8, 257–277. [Google Scholar] [CrossRef]
  3. Wang, H.; Li, P.; Wang, J. Shape Optimization and Buckling Analysis of Novel Two-Way Aluminum Alloy Latticed Shells. J. Build. Eng. 2021, 36, 102100. [Google Scholar] [CrossRef]
  4. El-Sheikh, A. Development of A New Space Truss System. J. Constr. Steel Res. 1996, 37, 205–227. [Google Scholar] [CrossRef]
  5. Shen, S.Z.; Lan, T.T. A Review of the Development of Spatial Structures in China. Int. J. Space Struct. 2001, 16, 157–172. [Google Scholar] [CrossRef]
  6. Kron, W.; Löw, P.; Kundzewicz, Z.W. Changes in Risk of Extreme Weather Events in Europe. Environ. Sci. Policy 2019, 100, 74–83. [Google Scholar] [CrossRef]
  7. Balling, R.J. Tall buildings + skybridges + envelope + green = greenplex: A sustainable urban paradigm for the 21st century. In Proceedings of the Council on Tall Building and Urban Habitat 2011 Seoul Conference, Seoul, Republic of Korea, 10–12 October 2011; TS 19-03. pp. 340–347. [Google Scholar]
  8. Liddell, I.; Westbury, P. Design and Construction of the Millennium Dome, UK. Struct. Eng. Int. 1999, 9, 172–175. [Google Scholar] [CrossRef]
  9. Ren, X. Architecture and Nation Building in the Age of Globalization: Construction of the National Stadium of Beijing for the 2008 Olympics. J. Urban Aff. 2008, 30, 175–190. [Google Scholar] [CrossRef]
  10. Zhou, G.P.; Li, A.Q.; Li, N.; Li, J.H. Design and analysis of the health monitoring system for the steel arch of the main stadium roof in Nanjing Olympic sports center. In Applied Mechanics and Materials; Trans Tech Publications Ltd.: Stafa-Zurich, Switzerland, 2017; Volume 858, pp. 3–9. [Google Scholar]
  11. He, Y.J.; Zhou, X.H.; Liu, Y.J.; Dong, S.L.; Li, J. Super-Span Reticulated Mega-Structure. J. Archit. Civ. Eng. 2005, 22, 25–29. (In Chinese) [Google Scholar]
  12. He, Y.J.; Zhou, X.H. Static Properties and Stability of Cylindrical ILTDBS Reticulated Mega-Structure with Double-Layer Grid Substructures. J. Constr. Steel Res. 2007, 63, 1580–1589. [Google Scholar] [CrossRef]
  13. Zhou, X.H.; He, Y.J.; Xu, L. Formation and Stability of a Cylindrical ILTDBS Reticulated Mega-Structure Braced with Single-Layer Latticed Membranous Shell Substructures. Thin-Walled Struct. 2009, 47, 537–546. [Google Scholar] [CrossRef]
  14. Zhou, X.H.; He, Y.J.; Xu, L. Stability of A Cylindrical ILTDBS Reticulated Mega-Structure with Single-Layer LICS Substructures. J. Constr. Steel Res. 2009, 65, 159–168. [Google Scholar] [CrossRef]
  15. He, Y.J.; Zhou, X.H. Formation of the Spherical Reticulated Mega-Structure and Its Stabilities in Construction. Thin-Walled Struct. 2011, 49, 1151–1159. [Google Scholar] [CrossRef]
  16. Zhang, Q.; Zhang, Y.; Yao, L.; Fan, F.; Shen, S. Finite Element Analysis of the Static Properties and Stability of A 800 m Kiewitt Type Mega-Latticed Structure. J. Constr. Steel Res. 2017, 137, 201–210. [Google Scholar] [CrossRef]
  17. Zhang, Q.; An, Y.; Zhao, Z.; Fan, F.; Shen, S. Model Selection for Super-Long Span Mega-Latticed Structures. J. Constr. Steel Res. 2019, 154, 1–13. [Google Scholar] [CrossRef]
  18. Wang, B.; Jiang, H.J.; Lu, X.L. Experimental and Numerical Investigations on Seismic Behavior of Steel Truss Reinforced Concrete Core Walls. Eng. Struct. 2017, 140, 164–176. [Google Scholar] [CrossRef]
  19. Zhang, D.W.; Li, Y.Q.; Huang, B.H. Investigation on Seismic Performance of the Fully Assembled Steel Frame Applying Beam-Column Joints with Replaceable Energy-Dissipating Elements. Sustainability 2023, 15, 5488. [Google Scholar] [CrossRef]
  20. Barkhordari, M.S.; Tehranizadeh, M. Ranking Passive Seismic Control Systems by Their Effectiveness in Reducing Responses of High-Rise Buildings with Concrete Shear Walls Using Multiple-Criteria Decision Making. Int. J. Eng. 2020, 33, 1479–1490. [Google Scholar]
  21. Abdalla, J.A.; Mohammed, A.S. Dynamic characteristics of large reinforced concrete domes. In Proceedings of the 14th World Conference on Earthquake Engineering, Beijing, China, 12–17 October 2008. [Google Scholar]
  22. Feizolahbeigi, A.; Lourenço, P.B.; Golabchi, M.; Ortega, J.; Rezazadeh, M. Discussion of the Role of Geometry, Proportion and Construction Techniques in the Seismic Behavior of 16th to 18th century bulbous discontinuous double shell domes in central Iran. J. Build. Eng. 2021, 33, 101575. [Google Scholar] [CrossRef]
  23. Zhang, H.D.; Liang, X.; Gao, Z.Y.; Zhu, X.Q. Seismic Performance Analysis of a Large-Scale Single-Layer Latticed Dome with A Hybrid Three-Directional Seismic Isolation System. Eng. Struct. 2020, 214, 110627. [Google Scholar] [CrossRef]
  24. Fan, F.; Wang, M.; Cao, Z.G.; Shen, S. Seismic Behavior and Design of Spherical Reticulated Shells with Semi-Rigid Joint System. China Civ. Eng. J. 2010, 43, 8–15. (In Chinese) [Google Scholar]
  25. Sun, J.; Zhang, Q. Seismic Performance of Long-Span Space Reticulate Shells and Its Analysis. J. Nat. Disasters 2011, 20, 193–198. (In Chinese) [Google Scholar]
  26. ANSYS, Inc. Theory Manual. 001369, 12th ed.; SAS IP, Inc.: Cheyenne, WY, USA, 2009. [Google Scholar]
  27. JGJ 7-2010; Technical Specification for Space Frame Structures. China Architecture & Building Press: Beijing, China, 2010. (In Chinese)
  28. Fan, F.; Cao, Z.G.; Ma, H.H.; Yan, J.C. Elasto-Plastic Stability of Reticulated Shells; Science Press: Beijing, China, 2015; p. 16. (In Chinese) [Google Scholar]
  29. Resapu, R.R.; Perumahanthi, L.R. Numerical Study of Bilinear Isotropic & Kinematic Elastic–Plastic Response under Cyclic Loading. Mater. Today Proc. 2021, 39, 1647–1654. [Google Scholar]
  30. GB50011-2010; Code for Seismic Design of Buildings. China Architecture & Building Press: Beijing, China, 2010. (In Chinese)
  31. Dasgupta, S.P. Computation of Rayleigh Damping Coefficients for Large Systems. Electron. J. Geotech. Eng. 2003, 8, 83–88. [Google Scholar]
  32. Qu, Z.; Zhu, B.J.; Cao, Y.T.; Fu, H.R. Rapid Report of Seismic Damage to Buildings in the 2022 M6.8 Luding Earthquake, China. Earthq. Res. Adv. 2023, 3, 100180. [Google Scholar] [CrossRef]
Figure 1. Schematic diagram of the mega-latticed structures (a) Three types of spherical mega-latticed structure models; (b) Geometric parameters of mega-latticed structure; (c) Geometric parameters of truss; and (d) Location of mega-latticed structure members.
Sustainability 15 07240 g001
Figure 2. Comparison of the bearing capacity of different number of divided elements [28].
Sustainability 15 07240 g002
Figure 3. Spectral characteristics of the structures (a) Distribution of structural frequency and period; (b) Frequency change rate of Three-dimensional grid-type mega-latticed structure.
Sustainability 15 07240 g003
Figure 4. First 6 modes of Three-dimensional grid-type mega-latticed structure (a) Mode-I, T1 = 2.46 s; (b) Mode-II, T2 = 2.30 s; (c) Mode-III, T3 = 2.30 s; (d) Mode-III, T4 = 2.30 s; (e) Mode-V, T5 = 2.11 s; and (f) Mode-VI, T6 = 1.98 s.
Sustainability 15 07240 g004
Figure 5. Damping ratios of the three types of spherical mega-latticed structure (a) Kiewitt-type; (b) Geodesic-type; and (c) Three-dimensional grid-type.
Sustainability 15 07240 g005
Figure 6. Acceleration response spectrum and earthquake information.
Sustainability 15 07240 g006
Figure 7. Schematic diagram of structural location.
Sustainability 15 07240 g007
Figure 8. Distribution of displacement increment under the action of X, Y, and XY-direction earthquakes (a) Radial distribution in X-direction; (b) Radial distribution in Y-direction; (c) Radial distribution in Z-direction; (d) Circumferential distribution in X-direction; (e) Circumferential distribution in Y-direction; and (f) Circumferential distribution in Z-direction.
Sustainability 15 07240 g008
Figure 9. Distribution of displacement increment under the action of X, Z and XZ-direction earthquakes (a) Radial distribution in X-direction; (b) Radial distribution in Y-direction; (c) Radial distribution in Z-direction; (d) Circumferential distribution in X-direction; (e) Circumferential distribution in Y-direction; and (f) Circumferential distribution in Z-direction.
Sustainability 15 07240 g009
Figure 10. Effect of seismic direction on equivalent stress increment of structural members (a) Radial distribution of equivalent stress increment under horizontal earthquakes; and (b) Radial distribution of equivalent stress increment under horizontal and vertical earthquakes.
Sustainability 15 07240 g010
Figure 11. Displacement distribution of three spherical mega-latticed structures under static and seismic action: (a) Radial distribution in X-direction; (b) Radial distribution in Y-direction; (c) Radial distribution in Z-direction; (d) Circumferential distribution in X-direction; (e) Circumferential distribution in Y-direction; and (f) Circumferential distribution in Z-direction.
Sustainability 15 07240 g011
Figure 12. Radial distribution curves of dynamic displacement to static displacement ratio of structures: (a) Kiewitt-type; (b) Geodesic type; and (c) Three-dimensional grid-type.
Sustainability 15 07240 g012
Figure 13. Stress distribution of three spherical mega-latticed structures under static and seismic action (a) Upper chord; (b) Lower chord; (c) Web member; (d) Cross rod between upper chords; (e) Diagonal rod between upper chords; and (f) Member at the pyramid position.
Sustainability 15 07240 g013
Figure 14. Radial distribution curve of dynamic equivalent stress to static equivalent stress ratio of structures: (a) Kiewitt-type; (b) Geodesic-type; and (c) Three-dimensional grid-type.
Sustainability 15 07240 g014
Figure 15. Stress–strain curve of the Bilinear Kinematic Hardening (BKIN).
Sustainability 15 07240 g015
Figure 16. Displacement distribution of the Geodesic-type and the Three-dimensional grid-type mega-latticed structure under the action of frequent and rare earthquakes: (a) Radial distribution in X-direction; (b) Radial distribution in Y-direction; (c) Radial distribution in Z-direction; (d) Circumferential distribution in X-direction; (e) Circumferential distribution in Y-direction; and (f) Circumferential distribution in Z-direction.
Sustainability 15 07240 g016aSustainability 15 07240 g016b
Figure 17. Radial distribution curves of elastic–plastic displacement to elastic displacement ratio of structures: (a) Geodesic type; and (b) Three-dimensional grid-type.
Sustainability 15 07240 g017
Figure 18. Equivalent stress distribution of the Geodesic-type and the Three-dimensional grid-type mega-latticed structure under the action of the frequent and rare earthquake (a) Upper chord; (b) Lower chord; (c) Web member; (d) Cross rod between upper chords; (e) Diagonal rod between upper chords; and (f) Member at the pyramid position.
Sustainability 15 07240 g018
Figure 19. Radial distribution curves of elastic–plastic equivalent stress to elastic equivalent stress ratio of structures (a) Geodesic-type; and (b) Three-dimensional grid-type.
Sustainability 15 07240 g019
Figure 20. Plasticity distribution of the two structures and the percentage of each plasticity development degree (a) Distribution of plasticity of the Geodesic-type mega-latticed structure; (b) Distribution of plasticity of the Three-dimensional grid-type mega-latticed structure; and (c) Elements proportion of each plastic development degree.
Sustainability 15 07240 g020
Figure 21. Plastic development process of the Geodesic-type mega-latticed structure.
Sustainability 15 07240 g021
Table 1. Average displacement responses under the action of five seismic records of three structures.
Structure TypeAverage Maximum Dynamic Displacement/mMaximum Static Displacement/mAverage Dynamic and Static Displacement Ratio
XYZXYZXYZ
Kiewitt-type0.2430.2240.5430.1890.1660.4931.291.351.10
Geodesic-type0.1770.1650.5660.1310.1120.5051.351.471.12
Three-dimensional grid-type0.1690.1710.5570.1550.1370.4691.091.251.12
Table 2. Average stress responses under the action of five seismic records of three structures.
Type of
Member
Kiewitt-TypeGeodesic-TypeThree-Dimensional Grid-Type
Average Maximum Dynamic Stress /MPaMaximum Static Stress /MPaAverage Dynamic and Static Stress
Ratio
Average Maximum Dynamic Stress /MPaMaximum Static Stress /MPaAverage Dynamic and Static Stress
Ratio
Average Maximum Dynamic Stress /MPaMaximum Static Stress /MPaAverage Dynamic and Static Stress
Ratio
Upper chord250.92194.911.29247.79190.151.30247.80195.681.27
Lower chord189.98171.841.11186.19164.561.13197.62180.661.09
Web member213.51188.161.13228.84192.511.19185.91162.171.15
Cross rod293.79225.591.30310.67210.121.48236.15200.511.18
Diagonal rod188.36144.911.30221.18121.011.83199.11114.211.74
Pyramid member384.62337.321.14299.80253.771.18260.76207.281.26
Table 3. Average displacement response results of the structures under the action of rare earthquakes.
Structure TypeAverage Maximum Elastic–Plastic Displacement/mMaximum Elastic Displacement/mAverage αmax
XYZXYZXYZ
Geodesic-type0.4420.4440.9150.1770.1650.5662.502.691.62
Three-dimensional grid-type0.4080.4420.9920.1700.1710.5572.412.581.78
Table 4. Average stress response results of the structures under the action of rare earthquake.
Type of MemberGeodesic-TypeThree-Dimensional Grid-Type
Average
Maximum Elastic–Plastic Stress /MPa
Maximum Elastic Stress/MPaAverage βmaxAverage
Maximum
Elastic–Plastic Stress/MPa
Maximum Elastic Stress/MPaAverage βmax
Upper chord436.76247.791.76428.92241.931.77
Lower chord338.96186.191.85316.62182.621.74
Web member396.09228.841.73388.46185.912.09
Cross rod422.73310.671.36402.40232.901.73
Diagonal rod427.00221.181.93418.37216.371.93
Pyramid member426.24299.801.42416.07272.461.53
Disclaimer/Publisher’s Note: The statements, opinions and data contained in all publications are solely those of the individual author(s) and contributor(s) and not of MDPI and/or the editor(s). MDPI and/or the editor(s) disclaim responsibility for any injury to people or property resulting from any ideas, methods, instructions or products referred to in the content.

