Article

Integrated Management to Address Structural Shortage: The Case of Vega Baja of the Segura River, Alicante (Southeast Spain)

by
José Alberto Redondo-Orts
*,
María Inmaculada López-Ortiz
and
Patricia Fernández-Aracil
University Institute of Water and Environmental Sciences, University of Alicante, Carretera San Vicente del Raspeig s/n, San Vicente del Raspeig, 03690 Alicante, Spain
*
Author to whom correspondence should be addressed.
Sustainability 2023, 15(9), 7313; https://doi.org/10.3390/su15097313
Submission received: 29 March 2023 / Revised: 21 April 2023 / Accepted: 25 April 2023 / Published: 27 April 2023

Abstract

:
The principal objective of this study is the detailed analysis of the water deficit based on the information gathered by hydrological planning in terms of both the supply of water resources from different sources (surface and groundwater natural sources, transferred from other basins and non-conventional sources based on the reuse of regenerated waters and the desalination of seawater) and the demand for water (urban, agricultural, environmental, industrial, and recreational uses). To do this, the balance between resources and demand is determined, identifying the water deficit and its repercussions, mainly in the agricultural sector. Subsequently, a series of recommendations are proposed that can contribute to the management of water resources in accordance with their origin and availability. The study focuses on the district of Vega Baja del Río Segura, which is located in Southeast Spain, specifically in the Segura River Basin of the province Alicante, and characterized by being one of the European spaces with the greatest structural shortage of water resources. The 27 municipalities, which it constitutes and are the object of analysis in this study, have a semi-arid climate with mild temperatures and scarce torrential rainfall, which generates a continuous situation of water stress and structural shortage. The management of water resources in this area is vitally important for socio-economic development and the maintenance of the natural ecosystems. According to the climate change predictions, this deficit situation is set to worsen, which will aggravate the water imbalance.

1. Introduction

Water is a fundamental resource for the development of societies throughout the world, essential for both domestic needs (consumption and sanitation), economic activities (agriculture, industry, and energy), and the environment. The increase in consumption due to these activities has generated impacts on the sustainability of the management model, causing deficit and scarcity situations that limit the development of many regions [1,2]
Within the European Union, Spain is one of the countries where water stress is the most severe. In most parts of the country, the consumption of water accounts for over 40% of the available resources, contrasting with the majority of other European countries with consumptions less than 30% [3].
Meanwhile, the Segura River Basin (SRB), located in Southeast Spain, is the only Spanish basin with a structural shortage [3]. This situation has given rise to a limitation in its economic development [4]. These adverse effects caused by the severity of the scarcity have fostered the development of an integrated management of water resources in order to obtain greater efficiency in the distribution of natural resources, incorporating external resources mainly through the Tajo-Segura Transfer (TST) and the application of non-conventional resources (reuse of regenerated water and the desalination of seawater), so as to increase the limited supply of resources [5,6]. This integrated management of water resources has converted the SRB into one of the basins with the highest capacity of resilience. Moreover, this is within the context of severe structural shortage due to the foreseeable effects of climate change in this area [7].
The emission of greenhouse gases causes an increase in global warming, resulting in changes in the climate and an intensification of extreme events [8], generating impacts that are already being seen worldwide [1]. Predictions indicate an increase in precipitations in wet areas and their reduction in the most arid areas [9], generating a decrease in available water resources, particularly in the most sensitive areas affected by water stress [10], aggravating, therefore, situations of scarcity (permanent and anthropogenic) and drought (temporary and natural) [11,12,13]. Recent studies in the Mediterranean area have shown that it is a critical area with respect to the impacts generated by climate change during the twenty-first century, with an increase in temperature above the global average in the summer season, leading to a considerable warming of the earth’s surface and a significant reduction in rainfall, mainly in the winter months, and negatively affecting the irrigated crops and the regulation of reservoirs, which are filled during this season [14].
The study focuses on the district of Vega Baja del Segura River, which is located in Southeast Spain, specifically in the Segura Basin of the province of Alicante, and is characterized by being one of the European spaces with the greatest structural shortage of water resources. The 27 municipalities, which it constitutes and are the object of analysis in this study, have a semi-arid climate, with mild temperatures and scarce torrential rainfall, which generates a continuous situation of water stress and structural shortage. Therefore, the management of water resources is vital for the socio-economic development and the maintenance of the natural ecosystems.
The principal objective of this study is the detailed analysis of the water deficit based on the information gathered by hydrological planning in terms of both the supply of water resources from different sources (surface and underground natural sources, transferred from other basins and non-conventional sources based on the reuse of regenerated waters and the desalination of seawater) and the demand for water (urban, agricultural, environmental, industrial, and recreational). With regard to this, the balance between resources and demand is determined, identifying the water deficit and its repercussions, mainly on the agricultural sector, so as to ultimately propose a series of recommendations that can contribute to the management of water resources in accordance with their origin and availability.
To this end, first, an exhaustive characterization was made of the area of study, with a special focus on the water scarcity situation and the importance of non-conventional resources in compensating this scenario. Second, the methodology used is described, identifying, on the one hand, the supply of water and, on the other, the demands for water. Finally, a balance is made between the resources and demands, which reveals the deficit that exists and the need for new management tools that will enable the availability of the resource to be expanded.

2. Characterization of the Area of Study

The SRB has an area of 19,025 km2 (continental part), covering the whole of the Autonomous Region of Murcia (60% of the total surface area of the basin) and part of the Autonomous Region of Castilla-La Mancha (25% in the province of Albacete), the Autonomous Region of Andalucia (6% in the province of Almería and 3% in the province of Jaén), and the Region of Valencia (6% in the province of Alicante, where the area of study is located) [15]. Figure 1 shows the territorial distribution of the SRB and the location of the area of study.
In this area, the distribution of the precipitations is heterogeneous on both an inter-annual and spatial level, with the autumn and spring months being those with the most rainfall and the summer months the driest period. With respect to the spatial distribution of these precipitations, in the north-east part of the basin, values of over 1000 mm/year are recorded, while in the coastal areas, precipitations barely reach 100 mm/year. According to the data published in the review of the Segura Basin Hydrological Plan 2022/27 (SBHP 22/27) in the SRB, average rainfall fluctuates between 376 mm (series of 1940/41–2017/18) and 364 mm (series of 1980/81–2017/18) [17], making it the river basin with the lowest rainfall in the European continent [18]. These data reveal the situation of water stress suffered by this space and the importance of the management of the available water resources.
With respect to the volume of available resources, currently the SBHP 22/27 estimates total resources at 1520 hm3/year, with 46% (700 hm3/year) corresponding to the surface and underground natural resources. Another 20% (315 hm3/year) is obtained from external transfers via the TST, one of the most relevant and essential infrastructures of the SRB. These transfers amount to 295 hm3/year (of a maximum of 600 hm3/year approved in the Law 52/1980, which generates a permanent situation of under-endowment). With respect to the non-conventional resources, reuse represents 13% (205 hm3/year), corresponding to both regenerated water and returns of irrigation water; and finally, desalination contributes to the remaining 20% (300 hm3/year) [6,17].
The application of these resources is insufficient to meet the demands, which amount to 1823 hm3/year, of which 14% (250 hm3/year) corresponds to urban demand and 83% (1522 hm3/year) to agricultural uses, with 3% (51 hm3/year) attributable to the rest of the demand (environmental, industrial uses, and irrigation of golf courses) [19]. These data reveal that the majority of total demand is concentrated in the agricultural sector for irrigating a net surface area of 260,000 ha (gross surface area of 490,000 ha) [20]. This sector represents one of the main economic engines of the basin, employing more than 115,000 people and generating a value of production of EUR 3000 M/year, a net margin of EUR 1400 M, and gross value added of EUR 1600 M/year [21].
The Vega Baja del Segura, which is the focus of this study, has a surface area of 957 km2, located in the part of the province of Alicante within the SRB, accounting for 5% of the total of the SRB and 4% of the total of the Region of Valencia. Within this space there is a large area of traditional irrigation with flows originating in the Segura River, directed with waterwheels to the weirs and the return water is channeled through ditches that allow its reuse in orchards downstream [22]. The area of study includes 27 municipalities (Figure 2) of the province of Alicante, whose water management corresponds to the Segura Hydrographic Confederation (SHC), which implies that the principal decision-making center with respect to water resources is located outside of the territorial area analyzed i.e., in Murcia.
Similarly to the rest of the province of Alicante, Vega Baja is characterized by a semi-arid Mediterranean climate with an average annual temperature of 18 °C. The rainfall in the province fluctuates between 230 and 900 mm/year. This volume is just 250–350 mm/year in the 27 municipalities under study, with the unique feature that rainfall episodes exceeding 200–300 mm in 3 or 4 h have been recorded [25,26]. The province of Alicante is the fifth most populated in Spain, with a current total population of 1,901,594 inhabitants [27] who mainly reside in coastal areas, with significant temporary increases due to tourism in the summer season [28], reaching over four million tourists and 16 million overnight stays [27]. The district of Vega Baja has a population of 355,924 inhabitants, representing 7.18% of the total population of the Region of Valencia, with a very high population density of over 400 inhabitants per km2 [29].
Due to agricultural, urban, and industrial development, and together with the climate characteristics of the region, the province faces severe problems in terms of scarcity of resources and water deficit. The quantitative deterioration of water bodies directly affects the natural resources and it is particularly worth mentioning the overexploitation of groundwater bodies [30]. On another level, the lack of a state water policy and the disputes between territories for the control and use of the resources has substantiated a type of “water war”, in which, through different mechanisms, the transfer of resources via the TST has been questioned, as it is perceived that there is a lack of guarantee of fundamental resources for both urban supply and the agri-food sector [31]. With the approval of the Tajo Basin Hydrological Plan [32], reductions in the flow transfer could be implemented of up to 147 hm3/year as a result of the increase in the ecological flow of the Tajo River (higher than those proposed in the characterization studies [33]), due to the modification of the regulations of the TST (by way of Royal Decree 638/2021 [34]) and the construction of the pipeline to the Manchego Plain (flows derived from the Guadiana Basin [35]. In order to mitigate this situation of imbalance, a proposal has been made to substitute the resources transferred from the Tajo with the use of non-conventional resources, such as the reuse of regenerated water and desalination. These resources should be complementary, due to their high cost, but are able to provide a solution with an integrated management to the structural shortage in this area [5,36].
From an institutional point of view, all of the levels of government participate in the water management structure of the province of Alicante [37]. As well as managing the water uses, the state also intervenes through the autonomous body attached to the Ministry for the Ecological Transition and the Demographic Challenge (MITERD), called Mancomunidad de los Canales del Taibilla (MCT), which has the objective of supplying potable water in the primary phase network. In the case of Vega Baja del Segura, the MCT is responsible for the supply to the primary network of all the municipalities analyzed [3]. Furthermore, the state activity in terms of water management includes other organizations belonging to the institutional administration of the State that undertake more specific activities, such as those related to the execution of infrastructures, including those carried out by Waters of the Mediterranean Basins (ACUAMED), which plays a highly active role in the construction of desalination plants [3,6,18,36].
Meanwhile, the Regional Government of Valencia exercises important competencies referring to agriculture and the environment through different bodies and departments. In the territory under study, the Entidad Pública de Saneamiento de Aguas Residuales (Public Wastewater Treatment Entity) (EPSAR) is particularly relevant. It controls the construction and exploitation of wastewater treatment plants in collaboration with town councils and associations with a broader territorial scope [3,37,38]. On 13 November 2018, by way of the resolution of the Conselleria de Vivienda, Obras Públicas y Vertebración del Territorio (Regional Department of Housing, Public Works and Territorial Planning), the Territorial Action Plan (TAP) of the Vega Baja del Segura (27 municipalities) was approved as a comprehensive instrument of territorial planning on a supra-municipal scale [29].
The local entities are the main players in water management in the secondary phase (water supply to final users) for urban supply. The local legislation declares this as a minimum and obligatory service for all municipalities, which may choose the specific form of management, which may be direct (concentrated, deconcentrated, or decentralized), indirect, or through the formation of joint ventures, with the majority being mixed mode [3,36]. The Provincial Government of Alicante provides legal, economic, and technical support and assistance to the municipalities for the provision of the municipal water service. The internal de-concentration of the functions related to the integral water cycle in a specific department of the provincial body, such as Water Cycle, has produced very good results [39].
Together with the territorial administrations and institutional public entities, there is another group of organizations that constitute a fundamental pillar in water management in this province. These are the user communities, to which the Water Law grants the condition of corporate administrators [37]. There are many grassroots communities in the province due to the enormous importance of the farming sector, and, in particular, the irrigated agricultural sector. Moreover, the complexity of the distribution of the scarce available water resources has led to the creation of derived, or second degree communities, which defend the common interests of the Irrigation Communities and individual users. These include the Tajo-Segura Aqueduct Central Irrigation Union (SCRATS), which manages the Tajo-Segura transfer water in the Alicante districts; and the Comunidad General de Regantes Riegos de Levante, Izquierda del Segura (RLMI), which covers both municipalities of the Vega Baja del Segura and other districts of the province of Alicante [3,31,36].
On the other hand, the application of the Water Framework Directive (WFD), approved in the year 2000, is significant. It determines that the Member States of the European Union should establish the necessary measures to obtain a good status of the surface, ground, and coastal water bodies, no later than 15 years after coming into force. In order to carry out the monitoring of the parameters required, the competent authorities have a network of stations and control programmes that show the evolution of these parameters. However, in those water bodies where the overall environmental objectives are not fulfilled (good status or good potential), the regulations allow the possibility of establishing exemptions in terms of time (extensions) or in terms of objectives (less rigorous objectives) [40]. The Segura Basin Hydrological Plan 2009/15 (SBHP 09/15) was the first to be developed under the guidelines of the WFD [41]. Subsequently, the Segura Basin Hydrological Plan 2015/21 (SBHP 15/21) revised and updated the content of the SBHP 09/15, and the status of all of the water bodies of the basin [42]. Finally, by Royal Decree 35/2023 of 24 January 2023, the PHDS 22/27 was approved, [43] constituting a new update for the third planning cycle 2022/27.
With respect to the economic regime of water use, the WFD determines that cost recovery principles and that of who pollutes pays should be taken into account. It should be noted that the WFD does not oblige all of the costs of the water services to be recovered but that there is transparency in relation to the water services costs and revenue and that appropriate economic incentives exist in order to prevent pollution and to foster an efficient use of water [40]. According to what is set out in the SBHP 22/27, the total cost recovery index (financial and environmental) of water services for the year 2019 was 65% of the total provision of water services [44]. The exceptions to the recovery of financial costs (considered as not compromising the fulfilment of the environmental objectives) due to socio-economic reasons are social irrigation and the hydraulic infrastructures necessary for the substitution of non-renewable groundwater resources with new external resources.
Finally, it is important to note that there is an increasing number of studies that conduct a comprehensive evaluation of the economic benefits in the production systems and the environmental impacts that occur, applying different approaches such as the nitrogen footprint, the carbon footprint, the water footprint, and the economic return obtained [45]. Some conclusions that have been obtained show that higher agricultural consumptions increase the use of fertilizers (nitrates and phosphates), herbicides (glyphosates), and pesticides (chlorpyriphos), generating a greater carbon and grey water footprint [46]. With respect to the SRB, it has been estimated that of the total average water footprint of 5.907 hm3/year, 25% would correspond to the grey water footprint, defined as the amount of freshwater necessary to assimilate the polluting load of the discharges [19].

3. Methodology

The methodological development for analyzing the water resource balance in the 27 municipalities in Vega Baja requires, first, the identification of the possible sources of water resources, including natural resources (endogenous), surface and groundwater, the external transfers such as water transfers (exogenous) and non-conventional or alternative resources, mainly the reuse of both regenerated urban water and those derived from irrigation returns and the desalination of seawater. Second, it is necessary to consider the demands for water, principally agricultural and urban demand, while taking into account other demands, such as industrial, recreational (watering of golf courses), and environmental uses. Main data on resources and demands were gathered from [17] and [19], respectively, where information is defined at a watershed scale.
In order to complement these sources of information and establish this water balance by connecting watershed delimitation to a smaller scale, information from different sources has been gathered and contemplated. Of particular interest for this study is the information drawn from the basin organization of the SRB, the MCT, the SCRATS, the EPSAR, the Water Cycle department of the Provincial Government of Alicante, Hidraqua (the company responsible for the water supply in secondary phase of the municipalities of Vega Baja), and the contents in the research studies listed in the bibliography.
As stated before, information on both resources and demands could be found without municipal disaggregation, integrated into a global watershed scale, because administrative boundaries were normally stablished without paying attention to the natural water boundaries. But a local scale is required for the scope of this study, thus, an exhaustive pre-selection work for the data scrutiny to transform global data into local had to be implemented. In this vein, some of the graphic information has been processed using Geographic Information System (GIS) tools [23], together with spreadsheets, in order to enable data disaggregation and adequacy to the study case. This software combination has provided valuable support in analyzing database, whose geographical subdivision finally matches the detailed quantification of water.
Figure 3 represents, in diagram form, the conceptual model which explains cause–effect relationships in this complex structure, by systematizing the links between the inflows (water resources from all sources) and outflows (demands) for an average year, obtaining the water balance as a result, which usually shows a significant deficit. It also helps to choose some of the variables to be quantified thanks to the aforementioned data-processing software.
The Mediterranean region of Spain is characterized by endemic water scarcity, especially the southeast, where this case-study is located. This shortage of water resources constitutes a limiting factor and, in this context, to minimize the situation of water stress prevailing on Spain’s Eastern Coast, water governance is based on constant efforts directed at increasing water availability, which needs more analysis to optimize the integral management of the endogenous, exogenous, and non-conventional water resources. This quantification at a smaller scale, as shown in the results section, will allow to delimit the problem to deal with the different considerations of the water deficit (institutional, socioeconomic, and environmental spheres) by specific measures and recommendations, whose systematization could be extrapolated to other areas with similar concerns.

4. Water Resources Supply (Inputs)

4.1. Surface Resources: Endogenous and Exogenous

Surface water resources are classified as endogenous or exogenous depending on their origin: from the Vega Baja del Segura River or from other areas, respectively. The endogenous resources include water bodies such as reservoirs, rivers, or lakes, while the endogenous resources refer to pipelines, canals, and transfers from other places not included in the area of action. Figure 4 represents the River Segura, the River Chícamo, and the coastal watercourses called the River Nacimiento and the River Seco, which are responsible for endogenous surface contributions. The TST and MCT channels are also represented, which transport and distribute the exogenous resources. Finally, the storage elements are shown, such as the La Pedrera reservoir, the Laguna del Hondo, the Crevillente reservoir, and the La Mata and Torrevieja lagoons, whose function is to regulate the resources to adapt them to the needs of the demands.
The surface hydrology of the province of Alicante is characterized by the scarce presence of permanent water courses. The most relevant of the area of study is the Segura River, with a length of approximately 325 km and a basin of 18,521 km3, which, in its final stretch, includes many municipalities of the province of Alicante, after passing through the town of Beniel (Murcia). Its artificial mouth in the municipality of Guardamar del Segura enables the drainage of large volumes of water in the case of floods, a fundamental feature of the river in its final stretch, which is prone to significant changes in its flow, at times reaching values of over 1000 m3/s. Along its course through the different stages, water is carried from the river mainly for agricultural use. Its current flow in Orihuela is 5 m3/s, which contrasts with the average recorded at the end of the 1970s, which was slightly higher than 21 m3/s. The flow reaching the Mediterranean Sea is even lower, at less than 1 m3/s. The Chícamo river starts in a natural upwelling of the Quibas aquifer and drains the Abanilla basin (Murcia), where its waters disappear due to infiltration. It is considered as a natural river and in the final stretch there is an ecological reserve flow throughout the year of 0.01 m3/s. The Nacimiento and Seco rivers are temporary flows and form the two large natural watercourses that evacuate to the sea the water from the torrential rains falling on the Sierra de Escalona and Dehesa de Campoamor [48].
The surface resources in the SBHP 2022/27 for the current horizon (2019) are quantified at 444 hm3/year, while for the future horizon (2027) they are estimated at 428 hm3/year (reduction of 4% due to climate change). The surface resources applied in la Vega represent 23% of the total resources for the SRB, corresponding to 102 hm3/year in 2019 and 98 hm3/year in 2027 [17].
With respect to the storage systems, the La Pedrera reservoir has a current capacity of 246 hm3. Located in the Alcoriza watercourse, its average annual contribution is 141 hm3. It is the largest reservoir existing in the province of Alicante and regulates the contributions from the TST intended for irrigation and urban supply, although the principal users are the Campo de Cartagena Irrigation Communities and the Right Bank Canal. The Crevillente reservoir has a capacity of 13 hm3. While not being geographically located in the area of study, it also stores, together with La Pedrera, the contributions of the TST, which are used by many of the Vega Baja Irrigation Communities. The irrigation surplus and the treated waters that are returned to the natural channels are stored in the El Hondo reservoir and are fundamental for its high biodiversity, as it has also been declared a natural park and a Ramsar wetland. The group of lagoons of La Mata and Torrevieja, which cover an area of 3753 ha (57% correspond to the water sheet), is also classified as a natural park and Ramsar wetland. Furthermore, the lagoon of Torrevieja has a high saline content and supplies the salt industry and adjusts its rhythms with contributions of both salt water and mineral salts (thanks to a 53.8 km-long brine pipeline, which connects with the Pinoso salt diapir and began operating in 1973) [49].
Finally, with respect to the compliance with the objectives established by the WFD regarding the good status of the water bodies, it should be indicated that the Segura River when passing through the Vega Baja del Segura has an ecological potential lower than good due to non-compliance in the biological indicators, the macroinvertebrate indicators (IBMWP), and physiochemical indicators in terms of the saturation rate of oxygen, ammonium, nitrates, and phosphates. On the other hand, the chemical state of the mass also indicates a status lower than good as it exceeds the thresholds of chlorpyrifos and benzo [g,h,i] perylene. Therefore, the global status of the water body is below good and it has been established that the environmental objectives must be fulfilled by the year 2027. With respect to the River Chícamo, its global status is also lower than good due to a biological non-compliance in diatoms (IPS) and physiochemical non-compliance in nitrates and the oxygen saturation rate. It has been established that the environmental objectives must be fulfilled by the year 2027. With respect to the reservoirs, those of La Pedrera and Crevillente have an overall good status. However, the status of the Laguna del Hondo is lower than good due to biological non-compliances based on the populations of wetlands fish and the presence of exotic species. An environmental objective of a good status has been set for 2027. The case of the La Mata and Torrevieja lagoons is similar, with an overall status lower than good due to the biological non-compliance in the indicators of chlorophyll, macrophytes and hydrophytes, macroinvertebrates (IBCAEL) and phosphorous. Again, it has been established that the environmental objectives must be fulfilled by the year 2027 [50].
With respect to exogenous resources, the importance of the TST has been evident since it came into operation in 1979 [51], generating economic progress in the receiving areas and alleviating its historical situation of scarcity. However, the management of the uses related to the TST and the water deficit is a problem that has still not been resolved [52].
With the passing of the fifteenth additional provision of the Law 21/2013, the TST exploitation regulation was established and, through the Royal Decree 773/2014, the regulating norms of the TST were passed, up to a maximum of 650 hm3 per water year, with 600 hm3 corresponding to the SRB and 50 hm3 to the Guadiana basin. The distribution of the TST flows in the SRB is 400 hm3/year for irrigation, 110 hm3/year for supply, and 90 hm3/year corresponds to losses, reaching a total of 600 hm3/year [53].
Figure 5 shows the historical volumes transferred by the TST from the La Bujeda reservoir (headwaters of the Tajo-Segura aqueduct, as shown in Figure 6), differentiating between irrigation and supply; here it may be observed that 57% of the volume transferred is used by irrigated agriculture. We can also observe how, between 1979 and 2022, an annual average of 320 hm3 was transferred to be used for irrigation and supply. The average annual transferred volume for supply was 120 hm3, while that for irrigation was 200 hm3/year, which is exactly half of the value that could have been transferred as a maximum for this use according to that established in Law 52/1980 [54].
In the SBHP 2022/27, the resources transferred through the TST in 2019 amounted to 295 hm3/year, with 200 hm3/year corresponding to irrigation and 95 hm3/year to supply. These figures are expected to remain the same for 2027 [17]. With respect to the municipalities in Vega Baja del Segura, the water from the TST guarantees urban and industrial supply through the MCT, annually distributing 36.8 hm3 among the municipalities of Vega Baja del Segura (taking the figures of 2019 into account) [55]. On the other hand, the agricultural consumption of water from exogenous sources is satisfied by the corresponding quota of each irrigation area of the TST, with a total of 125 hm3/year of a maximum of 400 hm3/year for the whole of the province of Alicante and 63 hm3/year for the area of study, which translates into an average application of 33 hm3/year [54], situation that would be continued, according to SBHP 22/27, in the year 2027.
Therefore, the natural, endogenous, and exogenous resources have been quantified at 759 hm3/year for the whole of the SRB in the year 2019, representing 50% of the total resources, falling to 743 hm3/year for 2027 due to climate change. With respect to the Vega Baja, these resources are quantified at 135 hm3/year for 2019 and 131 hm3/year for 2027, representing 18% of the surface resources of the SRB.

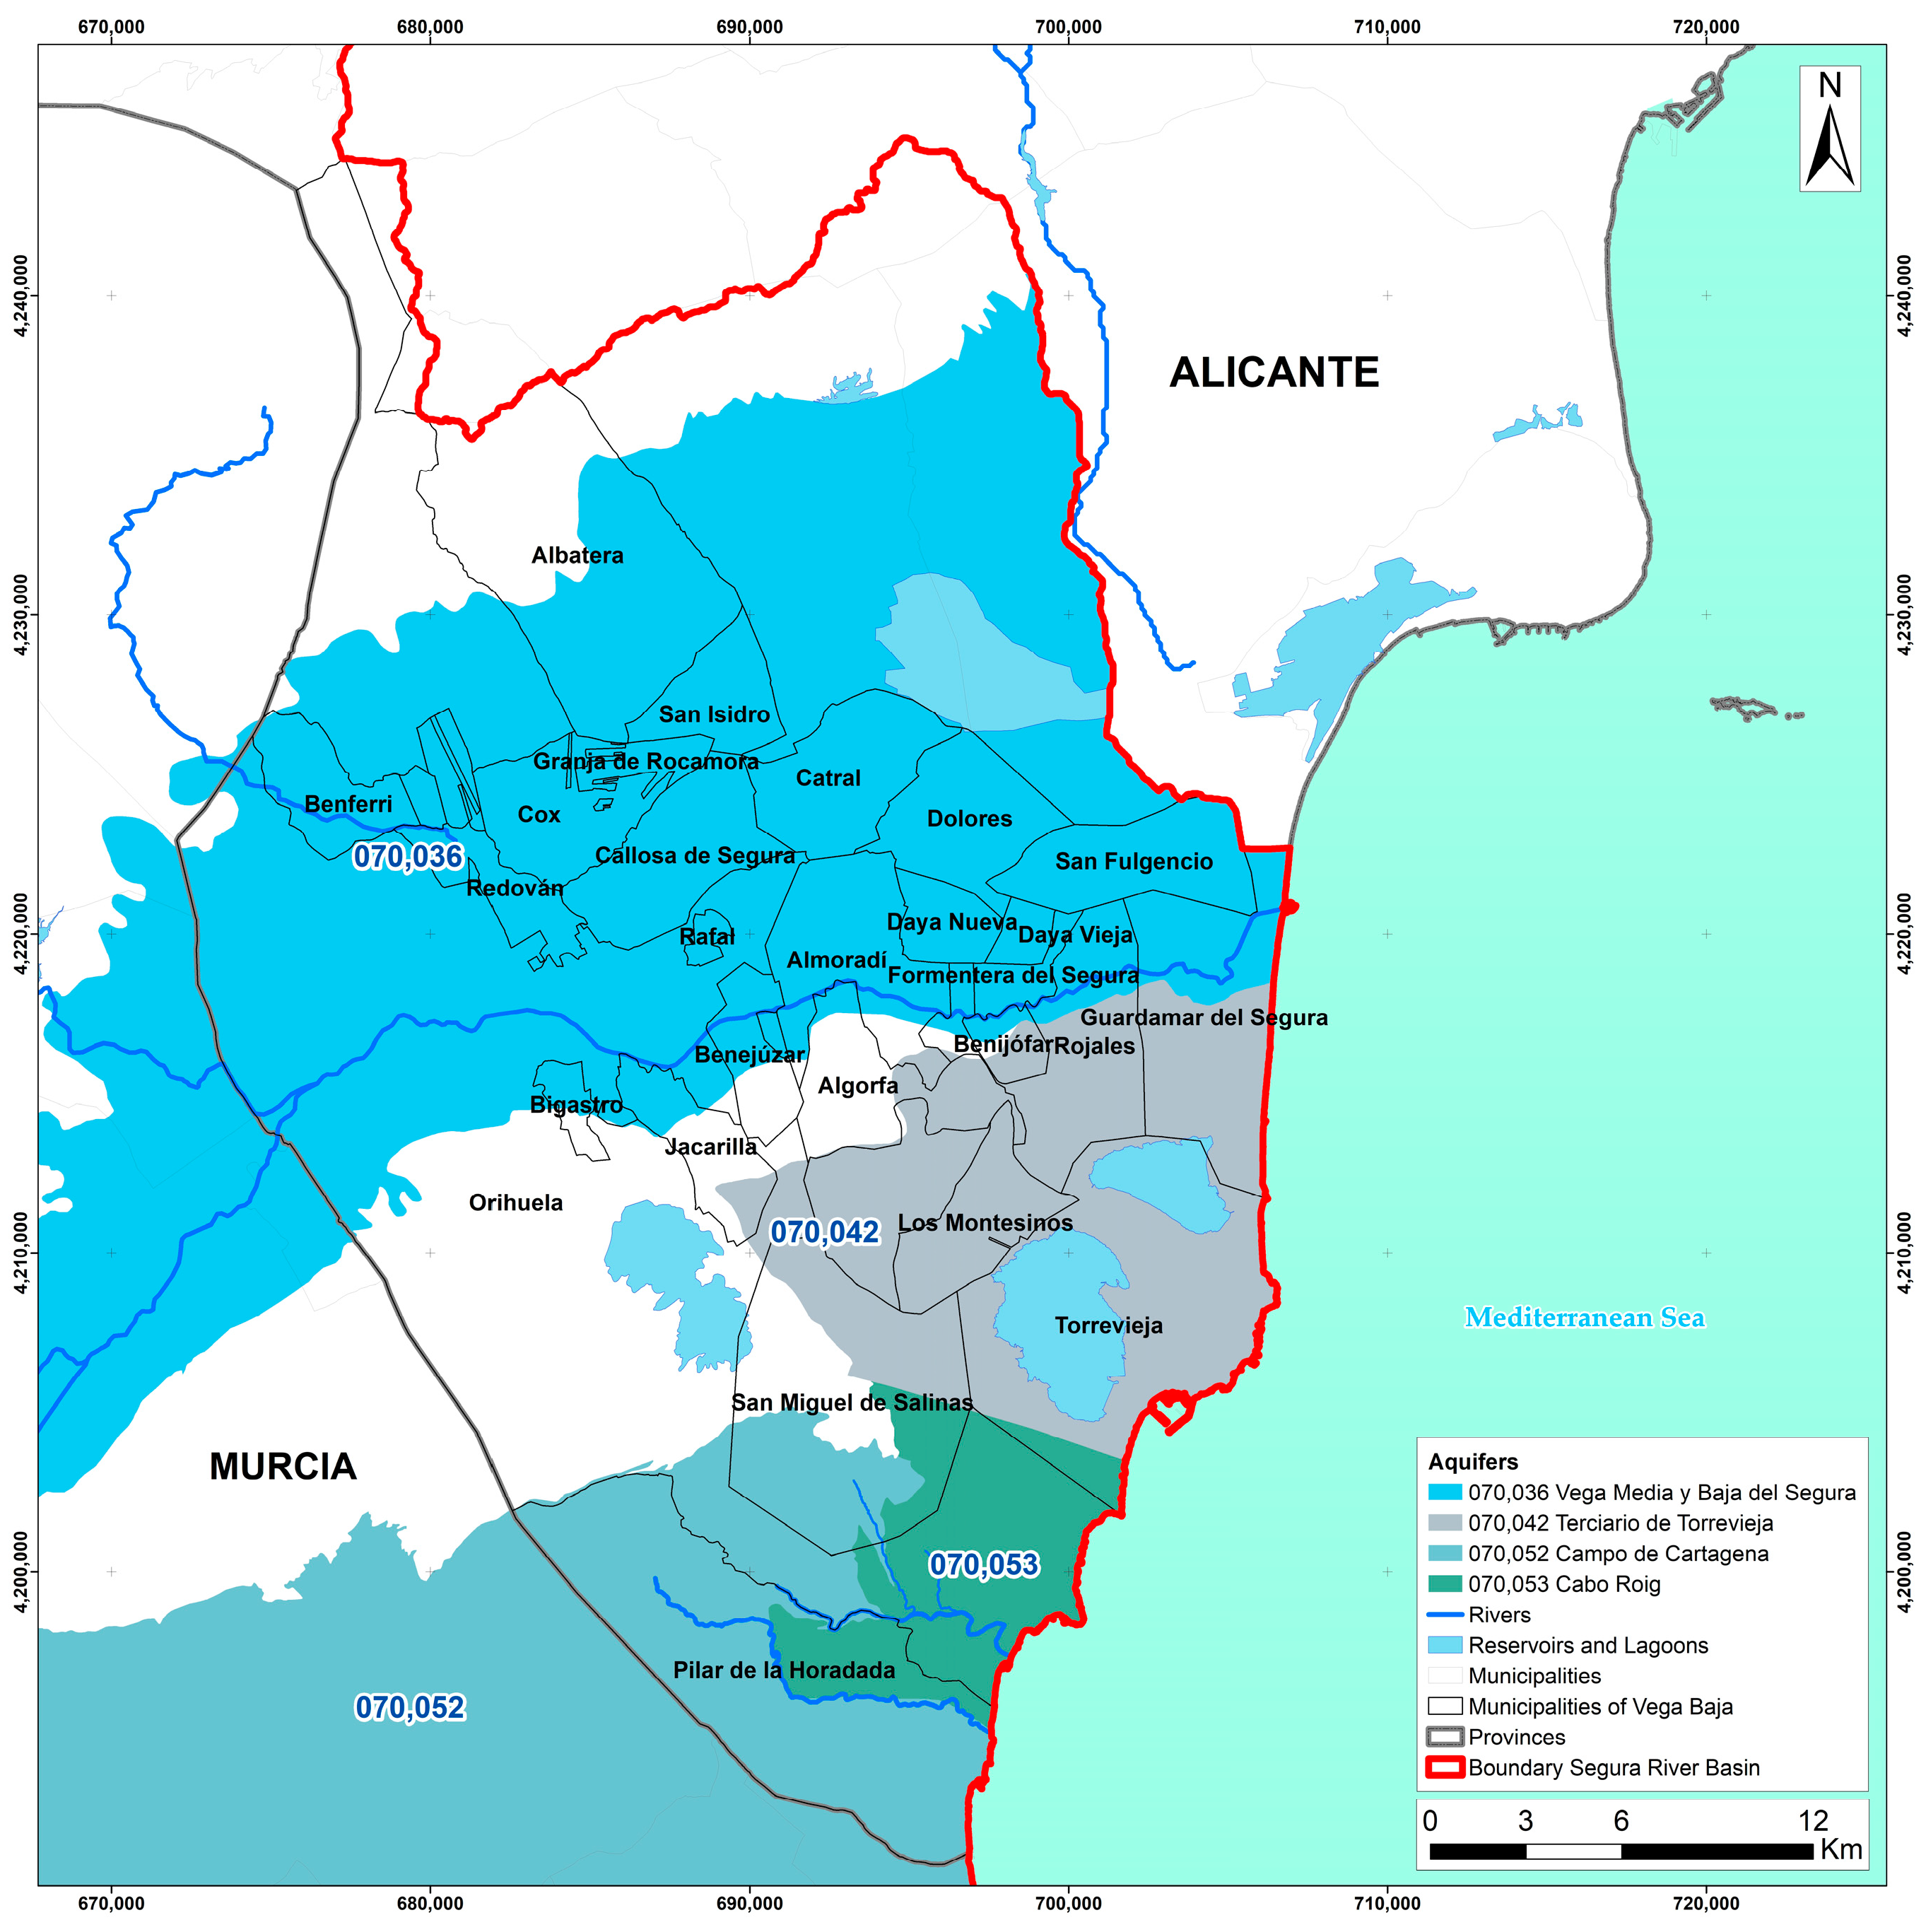
4.2. Groundwater Resources

The groundwater resources (MASub in Spanish), located under the municipalities in the area of study are shown in Figure 7 and their significant parameters are described in Table 1. It should be borne in mind that the contributions of the MASub 070.052 (Campo de Cartagena) belong mainly to the province of Murcia, so they are not included in the final balance. For the whole of the SRB, the ground and renewable resources amount to 255 hm3/year for the year 2019, falling by 4% (considering climate change), to 245 hm3/year in 2027. For the area of study, these resources account for 8% of the total ground resources of the SRB, equivalent to 22 hm3/year for 2019 and 21 hm3/year for 2027 [17].
According to [56], the MASub described in this study are under considerable pressure due to sources of diffuse pollution (mainly nitrates and derived, largely from intensive agriculture and cattle farming), the overexploitation of groundwater (mainly agricultural uses, although also urban and industrial), or sea intrusion caused by increases in pumping which leads to a reduction in the volume of groundwater discharged into the sea and resulting in reduction in piezometric levels.
Table 1. Groundwater bodies under the municipalities studied and volumes. Source: own elaboration based on [17,57,58].
Aquifer CodeAquifer NameTotal Resources (hm3/year)Environmental Reserve (hm3/year)Available Resources (hm3/year)Extraction (hm3/year)Negative Impacts
070,036Vega Media y Baja del Segura30.399.1421.2517.81Diffuse pollution and subsidence
070,042Terciario de Torrevieja1.240.330.913.56Diffuse pollution and overexploitation
070,052Campo de Cartagena67.001.2165.7958.80Diffuse pollution and overexploitation
070,053Cabo Roig1.400.361.041.94Diffuse pollution, overexploitation, and sea intrusion
Finally, with regard to the compliance with the objectives established by the WFD in terms of the good status of the water bodies, it should be indicated that all of those included in the area of study have been found to be non-compliant due to the presence of high concentrations of nitrates (over 50 mg/L). This means that the environmental objectives have had to be extended beyond the year 2027, such as the case of the Terciario water body of Torrevieja which now has a target of 2033 and the Campo de Cartagena water body for which a partial objective has been set for the year 2027 equivalent to a nitrate concentration of 150 mg/L. With respect to the rest of the non-compliances due to overexploitation and marine intrusion, it is considered that the environmental objectives set for the year 2027 can be fulfilled [50].

4.3. Non-Conventional Resources: Reuse and Desalination

With respect to the resources reused, Spain is the country with the highest reused volume in the European Union. Within the context of the SRB, both the reused resources from regenerated waters and the returns of irrigation water amount to a volume of over 200 hm3/year. The reused resources derived from treatment plants equal 142 hm3/year, both for 2019 and for 2027 (assuming constants) [17].
The district of the province of Alicante that records the largest volume of reused water is Vega Baja del Segura, reusing over 20 hm3 per year [59]. The structural drought situation of this geographical area, together with the high demand for water for irrigation and the gradual reduction in the contributions from the TST explain the high volume of reuse [3,60,61]. Table 2 updates the reuse data based on [17]:
The volume directly reused from the WWTP (without being previously discharged into the watercourse) is mainly used for agriculture by irrigation communities, golf courses or public parks, and gardens in population nuclei [4]. In the future, it would be desirable to be able to use all of the treated water so that white waters would not have to be used. For this to happen, separating sanitation networks are required (differentiating the collection of rainwater from that of drainage systems), together with dual distribution networks, differentiating potable water from regenerated water. In the case of Vega Baja, none of the municipalities have a complete rainwater separating network, but practically all of the municipalities have a collector used exclusively for rainwater [62].
With regard to the actions currently proposed by the managing entities of the integral water cycle in the district of Vega Baja, three lines of action can be identified that address the problems caused by rainwater in the urban nuclei: the implementation of sustainable urban drainage systems (SUDS), the development of separating rainwater and sewage networks, and the green lamination and channeling infrastructures [62]. Some of the solutions that have already been carried out in Vega Baja del Segura to contribute to its integral water cycle and the increase in the resilience of the cities are: the use of regenerated water from the WWTP in San Fulgencio next to the municipal sports center, the conditioning of the Europa Park (Daya Nueva), the El Recorral Park (Rojales), and the La Puebla Park (Daya Nueva) [63].
With respect to desalination (Mediterranean Sea), the seawater desalination plant (SWDP) of Torrevieja has a current production capacity of 240,000 m3/day (80 hm3/year), being the largest in Europe. Reverse osmosis is carried out in two steps, the second consisting in the reduction of the concentration of boron in the water permeated with maximum concentrations of 0.5 mg/L, so that it may be used in irrigation without the risk of toxicity for crops sensitive to this element. It is important to maintain these maximum levels of boron concentration in the permeated water as it is a sensitive issue that has been used socially against desalination. The estimated uses of this SWDP are 40 hm3/year for supply and 40 hm3/year for irrigation [64]; however, an extension of 40 hm3/year is contemplated, which would enable the mobilization of 120 hm3/year [17], not all of them applicable in the area of the study. Table 3 shows the current maximum capacity (year 2019) of desalination of the SWDP of Vega Baja del Segura.
In the area of the SRB, the desalinated resources contemplated for the year 2019 total 300 hm3/year, of which only 9% (26 hm3/year) would be applied in the Vega Baja del Segura, despite the fact that eight WWTPs are located there with a capacity of 95 hm3/year. For the year 2027, these resources are expected to increase considerably, partly compensating the reductions generated by climate change, with an application of 346 hm3/year for the whole of the SRB and 30 hm3/year for the area of study [17].
Finally, within the non-conventional resources, we should consider the reuse of agricultural drainage water (ADW), which, as well as constituting an additional resource, can contribute benefits, providing organic content, salts, and nutrients [65]. In Vega Baja, this reuse is carried out through the network of ditches, constituting a complex drainage system which is connected to that of the region of Murcia (Figure 8). The drainage systems were implemented to drain the marshlands and swampy areas of the Segura River and enabled agricultural development in the fertile lands of the south of the province. This action, mainly developed during the eighteenth and nineteenth centuries, was driven by the need to combat plagues and foster the colonization of extensive marshy areas. These systems contribute irrigation surpluses and surpluses associated to the control of the high groundwater levels in the current artificial mouths of both rivers, providing agricultural flows to the coastal transition waters. The network has a structure of artificial bypass channels (reguerones) and escorredores (flood drainage channels), azarbetas (subsidiary irrigation ditches) and azarbes (irrigation ditches) which add to its flows and constantly contribute to the coastal areas of the south of Alicante [48].
The reuse of ADW for the whole of the SRB amounts to 63 hm3/year, both for 2019 and 2027 (it is expected to remain constant). These waters will be mostly used (70%) in the municipalities analyzed of Vega Baja del Segura, thanks to the afore-mentioned network of ditches, which is the equivalent of 45 hm3/year [17].
Additionally, it should be noted that the review of the Flood Risk Management Plans (FRMP) [32] contemplates that the construction of a corridor in some of the irrigation ditches of Vega Baja (Milanares, Abanilla, Convenio, Reina, Señor) enables the channeling of the surface runoffs of urban areas, serving as a drainage system of the Segura River in situations of extreme rains such as those occurring due to the Isolated Depression at High Levels (DANA, by Spanish abbreviation, or also known as cold drop, “gota fría” in Spanish) of 2019. These actions have also been considered in the draft of the TAP for Vega Baja [29].
This, therefore, illustrates how the area of study is a good example in the use of non-conventional resources. In total, there are 28 WWTPs that treat a total volume of 25 hm3/year, directly reusing 22 hm3/year (88%) and indirectly 3 hm3/year (12%); 9 SWDP that have a production capacity of 95 hm3/year, although only 26 hm3/year are applied in Vega Baja; and the ADW reuse, which accounts for around an additional 45 hm3 per year. Consequently, these resources would jointly total 92 hm3/year in 2019 and could increase to up to 97 hm3/year in 2027 [17]. Figure 9 shows the location of the desalination plants and wastewater treatment plants in the municipalities studied in Vega Baja del Segura.

5. Units of Water Demand (Outputs)

5.1. Units of Agricultural, Environmental, and Recreational Demand

The units of agricultural demand (UAD) are composed of crop areas which are subject to both traditional irrigation, characteristic of Vega Baja del Segura and irrigation with water from the TST or non-conventional resources, in the most technified irrigations. Traditional irrigation systems are supplied by water diverted from the Segura River with waterwheels which is distributed through a group of principal aqueducts or ditches that make up the so-called “raw water network” (waters that spring and flow naturally before being used for irrigation and those that are diverted from the river towards croplands). This term is also used when, after collecting the drained water of flood water from a crop area, they are transported downstream to another crop area to be reused for irrigation (reuse of ADW) and are declared as dead waters. The following diagram (Figure 10) shows the fundamental cycle of water within the traditional irrigation system, differentiating two areas: A and B.
In Zone A, the living water is diverted from the river flow through ditches and is transported and distributed through the network of living water aqueducts or irrigation ditches, which branch out so as to cover the whole of the surface to be irrigated. Once the water has been used for irrigation, it is drained from the land through the network of dead water or waterwheels, transporting it to a sole point from where it is drained into the river. In this area, the water reuse cycle begins in the river, when the dead water discharged by the waterwheels reaches a new weir downstream and is diverted to other irrigation ditches, once again being classified as new water. In Zone B, the living water is diverted from the Segura River flow with waterwheels and is transported and distributed through the network of irrigation ditches which branch out across the surface to be irrigated in the same way as in Zone A. However, after its use for irrigation, the water is drained from the land by the dead water network or waterwheels, bringing them all together. Once they have been united, the dead water abandons the irrigated area through the initial living water network and then is declared as living water within the same ditches and is used again for the irrigation of the areas where there is no water supply from the initial living water network [22,66].
The SRB has a total of 64 UADs which cover a gross area of 490,000 ha and a net area of 260,000 ha, with a gross demand of 1522 hm3/year in 2019, with a slight increase, expected for the year 2027, to 1526 hm3/year (outside the area of Vega Baja). Now focusing on the UADs of the area of study, a total of 8 UADs (some partially) are found to have a gross area of more than 58,000 ha and a net area of 42,000 ha, with a gross demand of 255 hm3/year (accounting for 17% of the total agricultural demands of the SRB), calculated through an allocation coefficient that affects the net demand of 173 hm3/year and which contemplates the water losses from the origin of the intake to the roots of the plant, which indicates the degree of technification [19]. Table 4 indicates the principal characteristics of the 8 UADs, considered constant, both for the year 2019 and 2027; and Figure 11 shows their location in Vega Baja del Segura.
Regarding the environmental demands, for the whole of the SRB amount to 31.7 hm3/year, whose fraction for the area of study, due to its difficult calculation, it has been estimated as an average percentage between those considered for the natural spaces of the SHC, finally adopting 15% of total demand (4.8 hm3/year), corresponding to the environmental demand of the abandoned meanders of the Segura River and the lagoons of La Mata and Torrevieja [19], constant for the years 2019 and 2027.
In addition, the demand for recreational use has been calculated (golf courses in the area of study) based on [67], considering an annual average consumption of 8000 m3 per ha, after calculating the golf courses in operation in Vega Baja del Segura, all with 18 holes, except for the one in Los Montesinos, which has 9 holes: Las Ramblas (Orihuela Costa), Campo de Golf La Finca (Algorfa), Real Club de Golf Campoamor (Orihuela Costa), Villamartín (Orihuela Costa), Las Colinas (Orihuela Costa), Vistabella Golf (Jacarilla), Lo Romero Golf (Pilar de la Horadada), La Marquesa (Rojales) and Greenlands (Los Montesinos). The total irrigation demand of the golf courses in the municipalities of Vega Baja is 3.5 hm3/year, of a total of 11.2 hm3/year for the whole of the SRB; it should be noted that these demands are also considered to be constant in both horizons analyzed [19].

5.2. Units of Urban and Industrial Demand: Municipal Supplies and Yields

The urban and industrial demands for the year 2019 amount to a joint volume of 258 hm3/year, representing 14% of total demands. For the year 2027, a moderate increase is predicted of up to 269 hm3/year due to expected future population increases. As indicated in the introduction, the resources used to satisfy these demands are managed almost entirely by the MCT [19]. It should be mentioned that the volume distributed by the MCT is not exclusively derived from the TST, but from a group of water resource origins comprehensively managed for their distribution among all of the municipalities supplied by the organization, considering the following [36]: Taibilla river, TST, extraordinary contributions in situations of drought (licensing contracts with different Irrigation Communities, contributions from the Sinclinal de Calasparra aquifer, contributions from the Júcar river or management agreements with the SHC for extracting groundwater from the Collado de la Reina well and five other wells in Orihuela), water of the City Councils (Murcia, Elche and Alicante from the Villena aquifer) and desalination (mostly from the SWDPs Alicante I, Alicante II, San Pedro del Pinatar I and San Pedro del Pinatar II; and to a lesser extent from SWDP de Águilas, Torrevieja and Valdelentisco).
Between the years 1979 and 2019, the importance of the TST has been fundamental for maintaining the system and guaranteeing the supply in southeast Spain, constituting, on average, 53% of the contributions. Although, during the year 2019, the distribution of the volumes of the MCT, classified according to their origin, was as follows (Figure 12), with desalination acquiring almost the same relevance as the TST [55]:
The urban and industrial demands in the area of study represent 14% of the urban demands of the SRB, amounting to 37 hm3/year in 2019 and this value has remained practically constant since 2003. Figure 13 shows the evolution of the water resources managed by the MCT in the municipalities of Vega Baja del Segura in the period 1979–2019, which, as previously indicated, totaled 37 hm3/year in 2019 and which cover 100% of the needs demanded.
Complementarily, it should be noted that the predominant form of management in the secondary phase of urban-industrial water supply in the municipalities of Vega Baja del Segura is the indirect management by the company Hidraqua, through a concession, whereby the concessionaire manages the service at its own risk [68]. Some exceptions are: Albatera, Benejúzar, Callosa del Segura, Dolores, Granja de Rocamora, San Miguel de Salinas, Torrevieja, Pilar de la Horadada and San Isidro. In the case of Torrevieja, the management is indirect, carried out by a mixed-ownership company called AGAMED (Aguas del Arco Mediterráneo, S.A.).
Figure 14 shows the evolution of the hydraulic technical performance of the network between 2012 and 2019, confirming the lack of investments in the renovation of the potable water distribution and supply infrastructures. Furthermore, during 2020, special emphasis was given to this lack of investment in the renovation of infrastructures both of supply and sanitation, due to the damaging effects of the rainfall episodes occurring in 2019 in Vega Baja (Figure 15), as the breakages and losses were doubled in some municipalities such as Almoradí. However, no substantial reduction could be observed in the supply during the COVID 19 pandemic, due to the industry of Vega Baja del Segura [69].
The volumes distributed by the MCT in each municipality (primary phase) for urban-industrial use and the volumes invoiced (secondary phase) are those shown in Figure 16, where the average performance of the network in 2019 was 82%. The performance of the network shown corresponds to that recorded in 2019 by the managing entity Hidraqua [69]. For those not managed by Hidraqua, the average performance of the network in Vega Baja del Segura in 2019 has been used. Therefore, the volume invoiced in 2019 has been estimated for those municipalities not managed by Hidraqua (water supply), based on the real figures of the volume supplied (distributed in primary phase) in 2019 by the MCT, which, for all of the municipalities of Vega Baja, amounted to a total of 36.8 hm3/year. In the case of a possible increase in demand, the availability of water resources is not a limiting factor, given that the MCT has desalination plants to absorb this potential increase. However, this could have an effect on the increase in the operating costs of the system, with the consequence of having to increase the balancing single tariff applied by the MCT to all of the municipalities when invoicing the volumes of potable water supplied and which has not varied since June 2015.

6. Results and Discussion: Balance between Supply and Demand of Resources

After analyzing both the resources and demands, both in the SRB and the territorial area of study, Table 5 summarizes the results obtained for the year 2019. We can observe that the total resources in the SRB amount to 1520 hm3/year with those applied in the Vega Baja representing 16% of these (248 hm3/year). With respect to the demands, those corresponding to the SRB are 1823 hm3/year, of which 301 hm3/year (16%) are attributable to the area of study. Therefore, the deficit in the SRB is 303 hm3/year, while in the Vega Baja it would be 52 hm3/year, which is the equivalent of 17% of the total deficit of the SRB.
On the other hand, the changes that could occur for the future horizon (year 2027) considered for hydrological planning have been estimated. In this horizon, a reduction of 4% of the natural resources has been considered, generated by the climate change predictions and compensated by an increase in desalinated resources. Table 6 shows the results obtained, with resources calculated at 1539 hm3/year for the whole of the SRB, increasing due to the urban and agricultural demands and 248 hm3/year for the Vega Baja, maintaining the value of 2019. On the other hand, the demands amount to 1838 hm3/year in the SRB and 302 hm3/year, considering the increase in urban demand. Therefore, the deficit in the year 2027 will be slightly lower in the area of the SRB and increase by 2 hm3/year in the Vega Baja del Segura.
After analyzing the results both for the SRB and the Vega Baja, a detailed analysis can be made, as shown below, regarding the availability (supply) and demand of the water resource identified in the area of study. As analyzed in Section 4, the supply of the resources for the year 2019 were classified as surface (endogenous and exogenous), groundwater, and non-conventional (reuse and desalination) resources. The endogenous surface resources reached a total of 101.9 hm3/year (41% of total resources), of which 100.6 hm3/year corresponded to the Segura River (including indirect reuse) and 1.3 hm3/year to the Taibilla river (applied in urban supply). In 2019, the total exogenous surface resources from the TST amounted to 32.7 hm3/year (13%) for both urban supply and irrigation. This figure is slightly higher than the average calculated in Section 4.1, which exceeded the historical series of 30 hm3/year. Groundwater resources accounted for 9% of total resources (21.6 hm3/year) [55,70].
On the other hand, with respect to non-conventional resources, reused resources from the WWTP accounted for 9% of resources, with a volume of 22.0 hm3/year, applied in irrigation. The desalinated resources from the SWDP represented 10% of total resources with a volume of 25.7 hm3/year, for both urban and agricultural use [55,59,64,70]. This volume derived from desalination, as described in Section 4.3, could reach 100 hm3/year (capacity of the SWDP) [64], enabling the liberation of other resources, such as non-renewable groundwater resources, mitigating overexploitation problems. Finally, with respect to the reused ADW resources, 44.5 hm3/year (representing 18%) was used through the irrigation ditch network [70].
However, it should be indicated that some of the figures shown can only be considered as mere estimates, due essentially to the scarcity of information in certain municipalities that have smaller sources of supply that are not officially registered by the competent public entities (the case of wells and underground piping, desalination facilities of individuals, etc.,). Moreover, the figures presented, particularly in the case of the available water resources (supply) are subject to certain environmental restrictions, such as ecological flows, the correct compliance of which completely prevents the use of these resources.
Therefore, the supply of water resources in the year 2019 for the municipalities of Vega Baja del Segura amounted to 248.3 hm3/year, as shown in Figure 17.
As analyzed in Section 5, the demands are classified into agricultural, environmental, and recreational, and on the other hand, into urban and industrial. The first group considers the agricultural demands, amounting to 255.4 hm3/year, environmental demands with 4.8 hm3/year and recreational demands with 3.5 hm3/year, representing 88% of total demand. The second group of water demands concentrates a demand of 36.8 hm3/year 12% of the total. However, it takes priority over the supply of compromised water [17,25].
Emphasis should be placed on the agricultural sector, as it has a considerable socio-economic weight in the SRB and, in particular, in the municipalities of Vega Baja and, despite this, it is being impaired due to a lack of guarantee in terms of the resources transferred by the TST, which generates an opportunity cost with a profitability of its crops that are not produced in other regions of the country [21].
Figure 18 shows the demands for water in 2019 for the municipalities of Vega Baja del Segura, which amounted to a total of 300.5 hm3/year.
When conducting a balance between the supply and demand of water resources, it is estimated that the global deficit in Vega Baja del Segura is 52.2 hm3/year in 2019. This structural deficit is expected to worsen over the next few years due to the climate change effects, increase in demand, and the gradual reduction in exogenous contributions. The water deficit is the result of the sum of two factors: on the one hand, that derived from the demands satisfied by the TST, which is 46.9 hm3/year [71] and on the other hand, that produced through practices implemented in order to obtain an optimum agricultural production, which is difficult to quantify [72]. This deficit is particularly notorious in different irrigated crops, which come close to wilting, according to many experiences in Southeast Spain, specifically in the provinces of Alicante, Murcia, and Almería [73,74,75]. This is due to the strong water stress to which the current production is subjected (volume, calibre, quality, etc.,), which leads to lower economic benefits for the agricultural sector. Therefore, this deficit, caused by the restrictions of traditional irrigation, has been estimated at 5.3 hm3/year [70]. This figure is estimated as the average volume of structural deficit (permanent), although occasionally, it can increase to up to 30–40 hm3/year, as in periods of drought some producers are not able to exercise their irrigation rights. Finally, it is important to point out that the structural deficit is expected to worsen over the coming years due to the increases in demand, the gradual reduction of exogenous contributions, and the effects of climate change, as indicated by the results of regional models, with the rise in the temperature and heat waves that increase the drought episodes, generating impacts on the environment (loss of biodiversity, forest fires), the economy (tourism and agricultural sectors), and society [76].

7. Conclusions

Own water resources derived from the natural water cycle in the district of Vega Baja del Segura are significantly lower than the current needs, taking into account that the balance is negative, with a deficit of 52.2 hm3 in 2019, even with the inclusion of the exogenous contributions received to date. Therefore, in the province, a total consumptive use of own resources is carried out, which are subject to the maximum situation of water stress. As a result, an integrated management of own and exogenous resources and non-conventional resources derived from desalination and reuse is required. The information presented in this study provides the entities responsible for hydrological planning with updated information so that they can address situations of an increase in demand (mainly urban) and recurrent drought episodes. On the other hand, it is important to indicate how the local and regional institutions have contemplated actions in the Vega Baja del Segura which seek to improve the management of the water resources, such as the improvement in the hydraulic infrastructure, the investment in actions to improve urban water drainage and protection, enabling the reuse of retained resources, and improvements in the treatment and reuse of wastewater for agriculture. In view of the above, below are some recommendations derived from this study in accordance with the origin of the resources.
First, with regard to the endogenous resources, it is essential to conserve them and improve the efficiency of their application. In this way, not only will the current demands be met, but environmental preservation will be achieved of both surface ecosystems and of the connection existing between surface and ground waters. With respect to exogenous resources, it is essential to maintain the contributions of the TST to guarantee the urban and agri-food sector supply as they are strategic socio-economic and environmental elements of Vega Baja del Segura. It is also fundamental to introduce in the National Hydrological Plan projections regarding the TST to enable its consolidation and give it greater legal certainty. Therefore, for these resources as a whole, investment in technologies and infrastructures should be favored which will enable an improvement in the technical efficiency and performance, both of urban networks, particularly in small and medium-sized municipalities, and of the agricultural distribution network, with the design of infrastructures that increase the efficiency of the system and guarantee supply. For this, it would be necessary to modernize farms, promote more efficient crop systems, reduce losses in irrigation water transport and storage systems, maintain traditional irrigation systems due to their relationship with the environment, heritage, and agricultural landscape, consider agriculture as a key element for maintaining the natural environment and promote the use of renewable energies in agriculture.
Second, with respect to the non-conventional resources derived from reuse, it would be necessary to increase the urban uses, which would enable the exchange of regenerated waters for white waters, for example, in the irrigation of gardens or street cleaning; to improve the treatment systems, the accumulation and transport infrastructures so as to facilitate use in irrigation and other possible uses, avoiding the salination of wastewater through the control of discharges and saline filtrations in the collectors, favoring its reuse. On the other hand, a study should be made of the cases in which it is feasible to recharge the aquifers with regenerated water to mitigate the cases of overexploitation and liberate additional natural resources that will enable a compensation of the reduction caused by climate change effects. Furthermore, actions should be carried out to recover the treated flows that discharge into the sea through conducting the corresponding feasibility studies that would enable their reuse, all combined with a greater use of renewable energies to complement or replace fossil fuel energy in the WWTPs.
Finally, with respect to non-conventional resources derived from the desalination of seawater, the WWTPs should be kept fully operative for their use when necessary, as they guarantee the supply of water for urban supply, irrigation, and other uses. For this, it is necessary to complete the infrastructures that enable the total use of the desalination plants. In addition, future actions should be undertaken, such as the extension of the existing facilities and the construction of new WWTPs which would enable the existing supply to be increased or the expansion of the mobilization of these resources to areas far from the coast. In the latter case, the most noteworthy action is the connection planned between the La Pedrera reservoir and that of Azud de Ojós for the distribution of desalinated water from the Torrevieja WWTP. Finally, in view of the energy crisis situation, it is essential to reinforce the use of renewable energies to complement or replace fossil fuel energy also in the desalination plants.

Author Contributions

J.A.R.-O. wrote the presented manuscript, compiled and processed private and public data of this study. M.I.L.-O. and P.F.-A. designed the study and revised the manuscript, provided private data and references (literature). All authors have read and agreed to the published version of the manuscript.

Funding

This research was funded by the Water Chair of the University of Alicante-Alicante Provincial Council (2023) and by the Campus Hábitat5U network of excellence.

Institutional Review Board Statement

Not applicable.

Informed Consent Statement

Not applicable.

Data Availability Statement

Data are contained within the article.

Acknowledgments

The author acknowledges Joaquín Melgarejo-Moreno, whose technical support contributed significantly to improve this work.

Conflicts of Interest

The authors declare no conflict of interest.

References

  1. Hervás-Gámez, C.; Delgado-Ramos, F. Drought Management Planning Policy: From Europe to Spain. Sustainability 2019, 11, 1862. [Google Scholar] [CrossRef]
  2. Schewe, J.; Heinke, J.; Gerten, D.; Haddeland, I.; Arnell, N.W.; Clark, D.B.; Dankers, R.; Eisner, S.; Fekete, B.M.; Colon-Gonzalez, F.J.; et al. Multimodel assessment of water scarcity under climate change. Proc. Natl. Acad. Sci. USA 2014, 111, 3245–3250. [Google Scholar] [CrossRef] [PubMed]
  3. Melgarejo-Moreno, J.; Molina-Giménez, A. La Mancomunidad de los Canales del Taibilla en la Provincia de Alicante. Análisis de la Implantación y Evolución de la Mancomunidad de los Canales del Taibilla en la Provincia de Alicante y sus Repercusiones; Mancomunidad de los Canales del Taibilla e Instituto Universitario del Agua y de las Ciencias Ambientales: Alicante, Spain, 2017. [Google Scholar]
  4. Jodar-Abellan, A.; Fernández-Aracil, P.; Melgarejo-Moreno, J. Assessing Water Shortage through a Balance Model among Transfers, Groundwater, Desalination, Wastewater Reuse, and Water Demands (SE Spain). Water 2019, 11, 1009. [Google Scholar] [CrossRef]
  5. Morote, Á.-F.; Olcina, J.; Hernández, M. The Use of Non-Conventional Water Resources as a Means of Adaptation to Drought and Climate Change in Semi-Arid Regions: South-Eastern Spain. Water 2019, 11, 93. [Google Scholar] [CrossRef]
  6. CHS, Confederación Hidrográfica del Segura. Proyecto de Plan Hidrológico de la Demarcación del Segura 2022–2027; Memoria; Ministerio para la Transición Ecológica y el Reto Demográfico: Murcia, Spain, 2022; Available online: https://www.chsegura.es/export/sites/chs/descargas/planificacionydma/planificacion21-27/docsdescarga/docplan2227TrasCNA/01_MEMORIA/Memoria_PHDS_2022-27.pdf (accessed on 15 January 2023).
  7. Redondo-Orts, J.A.; Sáez-García, M.A.; López-Ortiz, M.I. Procedures and Legal Instruments for Drought Declaration in the Segura River Basin (Spain). Water 2022, 14, 2171. [Google Scholar] [CrossRef]
  8. Marcos-García, P.; Pulido-Velázquez, M. Cambio climático y planificación hidrológica: ¿es adecuado asumir un porcentaje único de reducción de aportaciones para toda la demarcación? Ing. Del Agua 2017, 21, 35–52. [Google Scholar] [CrossRef]
  9. IPCC—Intergovernmental Panel on Climate Change. Climate Change 2014: Impacts, Adaptation and Vulnerability. In Part B: Regional Aspects: Working Group II Contribution to the IPCC Fifth Assessment Report, 2; Cambridge University Press: Cambridge, UK, 2014. [Google Scholar]
  10. IPCC—Intergovernmental Panel on Climate Change. Climate change 2007: Synthesis report. In Contribution of Working Groups I, II and III to the Fourth Assessment Report of the Intergovernmental Panel on Climate Change; Core Writing Team; Pachauri, R.K., Reisinger, A., Eds.; IPCC: Geneva, Switzerland, 2007; p. 104. [Google Scholar]
  11. Estrela, T.; Vargas, E. Drought Management Plans in the European Union. The Case of Spain. Water Resour. Manag. 2012, 26, 1537–1553. [Google Scholar] [CrossRef]
  12. CEDEX, Centro de Estudios y Experimentación de Obras Públicas. Evaluación del Impacto del Cambio Climático en los Recursos Hídricos y Sequías en España; Centro de Estudios Hidrográficos (CEH), Ministerio de Agricultura y Pesca, Alimentación y Medio Ambiente: Madrid, Spain, 2017; Available online: https://ceh.cedex.es/web_ceh_2018/documentos/CAMREC/2017_07_424150001_Evaluaci%C3%B3n_cambio_clim%C3%A1tico_recu.pdf (accessed on 28 March 2023).
  13. Vargas, J.; Paneque, P. Challenges for the Integration of Water Resource and Drought-Risk Management in Spain. Sustainability 2019, 11, 308. [Google Scholar] [CrossRef]
  14. Lionello, P.; Scarascia, L. The Relation between Climate Change in the Mediterranean Region and Global Warming. Reg. Environ. Chang. 2018, 18, 1481–1493. [Google Scholar] [CrossRef]
  15. Melgarejo, J.; Trapote, A.; Roca, J.F. La infraestructura hidráulica y la gestión del agua en los regadíos tradicionales de la Vega Baja del Segura (Alicante). Available online: http://hdl.handle.net/10045/33320 (accessed on 28 March 2023).
  16. BOE—Boletín Oficial del Estado. Orden TEC/1399/2018, de 28 de Noviembre, por la que se Aprueba la Revisión de los Planes Especiales de Sequía Correspondientes a las Demarcaciones Hidrográficas del Cantábrico Occidental, Guadalquivir, Ceuta, Melilla, Segura y Júcar; a la Parte Española de las Demarcaciones Hidrográficas del Miño-Sil, Duero, Tajo, Guadiana y Ebro; y al Ámbito de Competencias del Estado de la Parte Española de la Demarcación Hidrográfica del Cantábrico Oriental; B.O.E. núm. 311, de 26 de diciembre de 2018; Ministerio para la Transición Ecológica: Madrid, Spain, 2018; Available online: https://www.boe.es/diario_boe/txt.php?id=BOE-A-2018-17752 (accessed on 14 January 2023).
  17. CHS, Confederación Hidrográfica del Segura. Proyecto de Plan Hidrológico de la Demarcación del Segura 2022–2027; Anejo 2 Inventario de Recursos; Ministerio para la Transición Ecológica y el Reto Demográfico: Murcia, Spain, 2022; Available online: https://www.chsegura.es/export/sites/chs/descargas/planificacionydma/planificacion21-27/docsdescarga/docplan2227TrasCNA/A02_inventario_de_recursos/ANEJO_02_Recursos_hidricos.pdf (accessed on 14 January 2023).
  18. Aldaya, M.M.; Custodio, E.; Llamas, R.; Fernández, M.F.; García, J.; Ródenas, M.A. An academic analysis with recommendations for water management and planning at the basin scale: A review of water planning in the Segura River Basin. Sci. Total Environ. 2019, 662, 755–768. [Google Scholar] [CrossRef]
  19. CHS, Confederación Hidrográfica del Segura. Proyecto de Plan Hidrológico de la Demarcación del Segura 2022–2027; Anejo 3 Usos y Demandas; Ministerio para la Transición Ecológica y el Reto Demográfico: Murcia, Spain, 2022; Available online: https://www.chsegura.es/export/sites/chs/descargas/planificacionydma/planificacion21-27/docsdescarga/docplan2227TrasCNA/A03_usos_y_demandas/ANEJO_03_Usos_demandas.pdf (accessed on 15 January 2023).
  20. Redondo, J.A. Análisis Económico de la Sequía 2015–2018 en el Regadío de la Demarcación Hidrográfica del Segura. In Congreso Nacional del Agua Orihuela. Innovación y Sostenibilidad; Melgarejo Moreno, J., Ed.; Universidad de Alicante: Alicante, Spain, 2019; pp. 481–494. [Google Scholar]
  21. Redondo-Orts, J.A.; López-Ortiz, M.I. The Economic Impact of Drought on the Irrigated Crops in the Segura River Basin. Water 2020, 12, 2955. [Google Scholar] [CrossRef]
  22. Trapote-Jaume, A.; Roca-Roca, J.F.; Melgarejo-Moreno, J. Azudes y acueductos del sistema de riego tradicional de la Vega Baja del Segura (Alicante, España). Investig. Geográficas 2015, 63, 143–160. [Google Scholar] [CrossRef]
  23. ArcGIS. ArcGIS 10.5 (Geographic Information System). Available online: https://support.esri.com/es/downloads (accessed on 22 January 2023).
  24. CHS—Confederación Hidrográfica del Segura. Descarga de Cartografía en Formato SHP. Ministerio para la Transición Ecológica y el Reto Demográfico. 2020. Available online: https://www.chsegura.es/es/cuenca/cartografia/descarga-de-cartografia-en-formato-shp/ (accessed on 28 January 2023).
  25. Valdes-Abellan, J.; Pardo, M.A.; Tenza-Abril, A.J. Observed precipitation trend changes in the western Mediterranean region. Int. J. Climatol. 2017, 37, 1285–1296. [Google Scholar] [CrossRef]
  26. Jodar-Abellan, A.; Valdes-Abellan, J.; Pla, C.; Gomariz-Castillo, F. Impact of land use changes on flash flood prediction using a sub-daily SWAT model in five Mediterranean ungauged watersheds (SE Spain). Sci. Total Environ. 2019, 657, 1578–1591. [Google Scholar] [CrossRef] [PubMed]
  27. Instituto Nacional de Estadística (INE). España. Available online: http://www.ine.es/ (accessed on 21 January 2023).
  28. Sánchez-Galiano, J.C.; Martí-Ciriquián, P.; Fernández-Aracil, P. Temporary population estimates of mass tourism destinations: The case of Benidorm. Tour. Manag. 2017, 62, 234–240. [Google Scholar] [CrossRef]
  29. DOGV—Diario Oficial de la Generalitat Valencia. Resolución de 13 de Noviembre de 2018, de la Consellera de Vivienda, Obras Públicas y Vertebración del Territorio, por la que se Inicia el Plan de Acción Territorial de la Vega Baja del Segura. Conselleria de Vivienda, Obras Públicas y Vertebración del Territorio. DOGV núm. 8457, de 4 de Enero de 2019. Available online: https://politicaterritorial.gva.es/documents/20551069/167230283/00+Resoluci%C3%B3n+de+inicio+PAT+Vega+Baja.pdf/78d83ed2-d929-4dfe-84c3-d55f335312f4?t=1546850787679 (accessed on 22 January 2023).
  30. Pulido-Velazquez, D.; Garcia-Arostegui, J.L.; Molina, J.L.; Pulido-Velazquez, M. Assessment of future groundwater recharge in semi-arid regions under climate change scenarios (Serral-Salinas aquifer, SE Spain). Could increased rainfall variability increase the recharge rate? Hydrol. Process 2015, 29, 828–844. [Google Scholar] [CrossRef]
  31. Molina-Giménez, A.; Melgarejo-Moreno, J. Water policy in Spain: Seeking a balance between transfers, desalination and wastewater reuse. Int. J. Water Resour. Dev. 2015, 32, 781–798. [Google Scholar] [CrossRef]
  32. BOE—Boletín Oficial del Estado. Real Decreto 26/2023, de 17 de enero, por el que se Aprueba la Revisión y Actualización de los Planes de Gestión del Riesgo de Inundación de las Demarcaciones Hidrográficas del Cantábrico Occidental, Guadalquivir, Segura, Júcar y de la Parte Española de las Demarcaciones Hidrográficas del Miño-Sil, Duero, Tajo, Guadiana, Ebro, Ceuta y Melilla. BOE núm 15, de 18 de Enero de 2023. Ministerio de la Presidencia, Relaciones con las Cortes y Memoria Democrática, Madrid, Spain, 2023. Available online: https://www.boe.es/eli/es/rd/2023/01/17/26/con (accessed on 11 February 2023).
  33. Garrote, L.; Mariño, F. Documento de síntesis de los estudios de caudales ecológicos mínimos en el río Tajo en el tramo Aranjuez-Talavera de la Reina; Ingeniería y Ciencia Ambiental (ICA). Universidad Politécnica de Madrid: Madrid, Spain, 2019. Available online: https://www.scrats.es/wp-content/uploads/2021/06/Libro-1-00-DocumentoSintesis-CORFM-271119.pdf (accessed on 18 February 2023).
  34. BOE—Boletín Oficial del Estado. Resolución de 29 de julio de 2021, de la Dirección General del Agua, por la que se Publica el Acuerdo del Consejo de Ministros de 27 de julio de 2021, Sobre Aprobación de las Nuevas Tarifas para Aprovechamiento del Acueducto Tajo-Segura. BOE núm. 188, de 7 de Agosto de 2021, Páginas 97206 a 97207 (2 Págs.). Ministerio para la Transición Ecológica y el Reto Demográfico: Madrid, Spain, 2021. Available online: https://www.boe.es/diario_boe/txt.php?id=BOE-A-2021-13594 (accessed on 18 February 2023).
  35. Redondo-Orts, J.A.; López-Ortiz, M.I.; Melgarejo-Moreno, J.; Fernández-Aracil, P. Análisis y alternativas para paliar el déficit hídrico en la Demarcación Hidrográfica del Segura (2022-2027), sureste de España. Investig. Geográficas 2023, 79, 179–206. [Google Scholar] [CrossRef]
  36. Melgarejo-Moreno, J.; López-Ortiz, M.I.; Fernández-Aracil, P. Water distribution management in South-East Spain: A guaranteed system in a context of scarce resources. Sci. Total Environ. 2019, 648, 1384–1393. [Google Scholar] [CrossRef]
  37. Molina-Giménez, A. Gobernanza e instituciones del agua en la provincia de Alicante. In J. Melgarejo Moreno y M. Fernández Mejuto, El agua en la provincia de Alicante; Diputación Provincial de Alicante y Universidad de Alicante: Alicante, Spain, 2020; pp. 327–367. [Google Scholar]
  38. EPSAR—Entidad Pública de Saneamiento de Aguas residuales; (EPSAR, Valencia, Spain). Personal communication, 2018.
  39. DPA-IGME. Atlas Hidrogeológico de la Provincia de Alicante; Excelentísima Diputación Provincial de Alicante (DPA)-Ciclo Hídrico, Instituto Geológico y Minero de España (IGME): Alicante, Spain, 2015. [Google Scholar]
  40. DMA—Directiva Marco del Agua. Directiva 2000/60/CE del Parlamento Europeo y del Consejo, de 23 de Octubre de 2000, por la que se Establece un Marco Comunitario de Actuación en el Ámbito de la Política de Aguas. Diario Oficial de las Comunidades Europeas. DOUE nº 327, de 22 de diciembre de 2000. Available online: https://www.boe.es/buscar/doc.php?id=DOUE-L-2000-82524 (accessed on 21 January 2023).
  41. BOE—Boletín Oficial del Estado. Real Decreto 594/2014, de 11 de Julio, por el que se Aprueba el Plan Hidrológico de la Demarcación Hidrográfica del Segura. B.O.E. núm. 169, de 12 de julio de 2014; Ministerio de Agricultura, Alimentación y Medio Ambiente: Madrid, Spain, 2014. Available online: https://www.boe.es/eli/es/rd/2014/07/11/594 (accessed on 21 January 2023).
  42. BOE, Boletín Oficial del Estado. Real Decreto 1/2016, de 8 de Enero, por el que se Aprueba la Revisión de los Planes Hidrológicos de las Demarcaciones Hidrográficas del Cantábrico Occidental, Guadalquivir, Ceuta, Melilla, Segura y Júcar, y de la Parte Española de las Demarcaciones Hidrográficas del Cantábrico Oriental, Miño-Sil, Duero, Tajo, Guadiana y Ebro. B.O.E. núm. 16, de 19 de enero de 2016; Ministerio de Agricultura, Alimentación y Medio Ambiente: Madrid, Spain, 2016. Available online: https://www.boe.es/eli/es/rd/2016/01/08/1 (accessed on 21 January 2023).
  43. BOE—Boletín Oficial del Estado. Real Decreto 35/2023, de 24 de Enero, por el que se Aprueba la Revisión de los Planes Hidrológicos de las Demarcaciones Hidrográficas del Cantábrico Occidental, Guadalquivir, Ceuta, Melilla, Segura y Júcar, y de la Parte Española de las Demarcaciones Hidrográficas del Cantábrico Oriental, Miño-Sil, Duero, Tajo, Guadiana y Ebro. B.O.E. núm 35, de 10 de Febrero de 2023; Ministerio para la Transición Ecológica y el Reto Demográfico: Madrid, Spain, 2023. Available online: https://www.boe.es/eli/es/rd/2023/01/24/(1) (accessed on 10 February 2023).
  44. CHS—Confederación Hidrográfica del Segura. Proyecto de Plan Hidrológico de la Demarcación del Segura 2022–2027; Anejo 9 Recuperación de costes; Ministerio para la Transición Ecológica y el Reto Demográfico: Murcia, Spain, 2022; Available online: https://www.chsegura.es/export/sites/chs/descargas/planificacionydma/planificacion21-27/docsdescarga/docplan2227TrasCNA/A09_recuperacion_costes/Anejo_09_Recuperacion_de_costes.pdf (accessed on 22 January 2023).
  45. Arunrat, N.; Sereenonchai, S.; Chaowiwat, W.; Wang, C.; Hatano, R. Carbon, Nitrogen and Water Footprints of Organic Rice and Conventional Rice Production over 4 Years of Cultivation: A Case Study in the Lower North of Thailand. Agronomy 2022, 12, 380. [Google Scholar] [CrossRef]
  46. Toolkiattiwong, P.; Arunrat, N.; Sereenonchai, S. Environmental, Human and Ecotoxicological Impacts of Different Rice Cultivation Systems in Northern Thailand. Int. J. Environ. Res. Public Health 2023, 20, 2738. [Google Scholar] [CrossRef] [PubMed]
  47. MCT, Mancomunidad de los Canales del Taibilla. Sistema de Información Geográfica. Ministerio para la Transición Ecológica y el Reto Demográfico, Madrid, Spain, 2020. Available online: https://www.mct.es/web/mct/sig (accessed on 28 January 2023).
  48. Navarro-Pedreño, J.; Meléndez-Pastor, I.; Gómez-Lucas, I. Masas de aguas superficiales: Ríos. In J. Melgarejo Moreno y M. Fernández Mejuto, El Agua en la Provincia de Alicante; Diputación Provincial de Alicante y Universidad de Alicante: Alicante, Spain, 2020; pp. 17–47. [Google Scholar]
  49. Navarro-Pedreño, J.; Meléndez-Pastor, I.; Gómez-Lucas, I. Masas de aguas superficiales: Embalses y lagos. In J. Melgarejo Moreno y M. Fernández Mejuto, El Agua en la Provincia de Alicante; Diputación Provincial de Alicante y Universidad de Alicante: Alicante, Spain, 2020; pp. 49–74. [Google Scholar]
  50. CHS—Confederación Hidrográfica del Segura. Proyecto de Plan Hidrológico de la Demarcación del Segura 2022–2027; Anejo 8 Objetivos Medioambientales y Exenciones; Anexo I.a. Caracterización de los Objetivos Medioambientales en las Masas de Agua Superficiales; Ministerio para la Transición Ecológica y el Reto Demográfico: Murcia, Spain, 2022; Available online: https://www.chsegura.es/export/sites/chs/descargas/planificacionydma/planificacion21-27/docsdescarga/docplan2227TrasCNA/A08_OMA/Anexos/Anexo_I_fichas/Anexo_Ia_Fichas_OMA_Masup.pdf (accessed on 21 January 2023).
  51. BOE—Boletín Oficial del Estado. Ley 52/1980, de 16 de Octubre, de Regulación del Régimen Económico de la Explotación del Acueducto Tajo-Segura. BOE Núm. 256, de 16 de Octubre de 1980, Páginas 23702 a 23704 (3 Págs.). Jefatura del Estado, Madrid, Spain, 1980. Available online: https://www.boe.es/eli/es/l/1980/10/16/52 (accessed on 3 February 2023).
  52. Melgarejo Moreno, J. Balance económico del Trasvase Tajo-Segura. Investig. Geográficas 2000, 24, 69–95. [Google Scholar] [CrossRef]
  53. BOE, Boletín Oficial del Estado. Real Decreto 773/2014, de 12 de Septiembre, por el que se Aprueban Diversas Normas Reguladoras del Trasvase por el Acueducto Tajo-Segura. BOE Núm. 223, de 13 de Septiembre de 2014, Páginas 71634 a 71639 (6 Págs.). Ministerio de Agricultura, Alimentación y Medio Ambiente, Madrid, Spain, 2014. Available online: https://www.boe.es/eli/es/rd/2014/09/12/773 (accessed on 3 February 2023).
  54. SCRATS, Sindicato Central de Regantes del Acueducto Tajo-Segura. Datos Propios 2022. Available online: https://www.scrats.es/documentos/ (accessed on 3 February 2023).
  55. MCT, Mancomunidad de los Canales del Taibilla. La Gestión del Servicio 2019; Ministerio para la Transición Ecológica y el Reto Demográfico: Madrid, Spain, 2020. [Google Scholar]
  56. Prats-Rico, D.; Jodar-Abellán, A.; (University of Alicante, Alicante, Spain). Posibilidades de Aprovechamiento de Aguas Salobres en la Comunidad. Personal communication, 2016. [Google Scholar]
  57. CHS—Confederación Hidrográfica del Segura. Proyecto de Plan Hidrológico de la Demarcación del Segura 2022–2027; Anejo 8 Objetivos Medioambientales y Exenciones; Anexo I.b. Caracterización de los Objetivos Medioambientales en las Masas de agua Subterráneas; Ministerio para la Transición Ecológica y el Reto Demográfico: Murcia, Spain, 2022; Available online: https://www.chsegura.es/export/sites/chs/descargas/planificacionydma/planificacion21-27/docsdescarga/docplan2227TrasCNA/A08_OMA/Anexos/Anexo_I_fichas/Anexo_Ib_Fichas_OMA_Masub.pdf (accessed on 21 January 2023).
  58. CHS—Confederación Hidrográfica del Segura. Proyecto de Plan Hidrológico de la Demarcación del Segura 2022–2027; Anejo 7 Inventario de Recursos e Impactos; Ministerio para la Transición Ecológica y el Reto Demográfico: Murcia, Spain, 2022; Available online: https://www.chsegura.es/export/sites/chs/descargas/planificacionydma/planificacion21-27/docsdescarga/docplan2227BOE/A07_presiones_impactos/Anejo_07_presiones_e_impactos.pdf (accessed on 28 January 2023).
  59. Prats-Rico, D.; Jodar-Abellán, A. No convencionales: Análisis de la reutilización de aguas residuales urbanas en la provincia de Alicante. In J. Melgarejo Moreno y M. Fernández Mejuto, El agua en la provincia de Alicante; Diputación Provincial de Alicante y Universidad de Alicante: Alicante, Spain, 2020; pp. 105–129. [Google Scholar]
  60. Prats-Rico, D.; Melgarejo Moreno, J. Desalación y Reutilización de Aguas. Situación en la Provincia de Alicante; Confederación Empresarial de la Provincia de Alicante (COEPA): Alicante, Spain, 2006. [Google Scholar]
  61. Melgarejo Moreno, J.; Molina Giménez, A. Incidencia del Trasvase Tajo-Segura en la Provincia de Alicante; Confederación Empresarial de la Provincia de Alicante (COEPA): Alicante, Spain, 2010. [Google Scholar]
  62. GV—Generalitat Valenciana. Plan Vega Renhace. Plan de Regeneración de la Vega Baja: Una Estrategia Integral para la Resiliencia de la Comarca de la Vega Baja del Segura. Generalitat Valenciana, Spain, 2020. Available online: https://vegarenhace.gva.es/documents/169420394/169573237/Plan+Vega+Renhace/04f685c1-87d7-428b-aabd-f203ff072e00 (accessed on 29 January 2023).
  63. García de Consuegra-Priego, M.E. Experiencias y propuestas para aumentar la resiliencia urbana frente a inundaciones. In M.I. López Ortiz y J. Melgarejo Moreno, Riesgo de Inundación en España: Análisis y Soluciones para la Generación de Territorios Resilientes; Universidad de Alicante: Alicante, Spain, 2020; pp. 569–589. [Google Scholar]
  64. Prats-Rico, D.; Jodar-Abellán, A. No convencionales: Análisis de la desalinización en la provincia de Alicante. In J. Melgarejo Moreno y M. Fernández Mejuto, El agua en la Provincia de Alicante; Diputación Provincial de Alicante y Universidad de Alicante: Alicante, Spain, 2020; pp. 131–155. [Google Scholar]
  65. Eltarabily, M.G. Reuse of Agriculture Drainage Water-Case Studies: Central Valley of California and the Nile Delta in Egypt. In The Handbook of Environmental Chemistry; Springer: Berlin/Heidelberg, Germany, 2022. [Google Scholar]
  66. Roca-Roca, J.F. Estudio de la Infraestructura Hidràulica y de la Gestión del agua en los Regadius Tradicionales de la Vega Baja del Segura. Ph.D. Thesis, Universidad de Alicante: Alicante, Spain, 2012; pp. 1–136. [Google Scholar]
  67. Ortuño-Padilla, A.; Civera-Planelles, S. Irrigation of Golf Courses. The Case of Alicante Province (SPAIN) in Comparison to International Standards; Universidad de Alicante (Publicaciones): Alicante, Spain, 2013. [Google Scholar]
  68. CESEL. Actual Cost of Services of Local Entities; Ministry of Finance and Civil Service. Available online: https://www.hacienda.gob.es/es-ES/CDI/Paginas/InformacionPresupuestaria/InformacionEELLs/CosteServicios.aspx (accessed on 4 February 2017).
  69. Hidraqua; (Hidraqua, Valencia, Spain). Volumes and hydraulic technical performance of the network between 2012 and 2019. Personal communication, 2020. [Google Scholar]
  70. CHS, Confederación Hidrográfica del Segura. In Seguimiento del Plan Hidrológico de la Demarcación del Segura (2015/21). Año 2019; Ministerio para la Transición Ecológica y el Reto Demográfico: Murcia, Spain, 2020; Available online: https://www.chsegura.es/export/sites/chs/descargas/planificacionydma/planificacion15-21/docsdescarga/Informe_seguimiento_PHDS_2019.pdf (accessed on 5 February 2023).
  71. Melgarejo-Moreno, J. Prólogo. In J. Melgarejo Moreno y M. Fernández Mejuto, El agua en la provincia de Alicante; Diputación Provincial de Alicante y Universidad de Alicante: Alicante, Spain, 2020; pp. 9–13. [Google Scholar]
  72. Melgarejo-Moreno, P.; Martínez-Nicolás, J.J.; Hernández-García, F.; Legua-Murcia, P.; Martínez-Font, R. Necesidades hídricas de la agricultura en la provincia de Alicante. In J. Melgarejo Moreno y M. Fernández Mejuto, El agua en la Provincia de Alicante; Diputación Provincial de Alicante y Universidad de Alicante: Alicante, Spain, 2020; pp. 281–296. [Google Scholar]
  73. Estrela, T.; Pérez-Martin, M.A.; Vargas, E. Impacts of climate change on water resources in Spain. Hydrol. Sci. J. 2012, 57, 1154–1167. [Google Scholar] [CrossRef]
  74. Bellot, J.; Chirino, E. Hydrobal: An eco-hydrological modelling approach for assessing water balances in different vegetation types in semi-arid areas. Ecol. Model. 2013, 266, 30–41. [Google Scholar] [CrossRef]
  75. Rupérez-Moreno, C.; Senent-Aparicio, J.; Martínez-Vicente, D.; García-Aróstegui, J.L.; Cabezas, F.; Pérez-Sánchez, J. Sustainability of irrigated agriculture with overexploited aquifers: The case of Segura basin (SE, Spain). Agric. Water Manag. 2016, 182, 67–76. [Google Scholar] [CrossRef]
  76. Todaro, V.; D’Oria, M.; Secci, D.; Zanini, A.; Tanda, M.G. Climate Change over the Mediterranean Region: Local Temperature and Precipitation Variations at Five Pilot Sites. Water 2022, 14, 2499. [Google Scholar] [CrossRef]
Figure 1. Study situation map. Source: Special Drought Plans [16], own elaboration.
Sustainability 15 07313 g001
Figure 2. Study area with 27 municipalities (Alicante province, Southeast Spain). Source: own elaboration based on [23,24].
Sustainability 15 07313 g002
Figure 3. Diagram of the water balance (resources and demands) in the area of study. Source: own elaboration based on [4].
Sustainability 15 07313 g003
Figure 4. Endogenous and exogenous surface resources. Source: own elaboration based on [23,24,47].
Sustainability 15 07313 g004
Figure 5. Representation of the historical volumes transferred by the TST for irrigation and supply in the period 1979–2022. Source: own elaboration based on [54].
Sustainability 15 07313 g005
Figure 6. Channel of the Tajo-Segura Transfer, from the La Bujeda reservoir (headwaters of the Tajo) to the Talave reservoir in the headwaters of the Segura). Source: Own elaboration based on [23,24,54].
Sustainability 15 07313 g006
Figure 7. Groundwater resources. The official code and name of each groundwater body (MASub) are shown. Source: own elaboration based on [23,24].
Sustainability 15 07313 g007
Figure 8. Network of principal irrigation ditches of Vega Baja del Segura. Source: own elaboration based on [23,24,48].
Sustainability 15 07313 g008
Figure 9. Non-conventional water resources in Vega Baja del Segura. Source: own elaboration based on [23,24,38,47,58,64].
Sustainability 15 07313 g009
Figure 10. Diagram of the water cycle in the traditional irrigation systems of Vega Baja del Segura. Source: own elaboration based on [22].
Sustainability 15 07313 g010
Figure 11. Units of agricultural demand in Vega Baja del Segura. Source: own elaboration based on [19,23,24].
Sustainability 15 07313 g011
Figure 12. Resources managed by the MCT in 2019 (volumes in hm3 and percentages). Source: own elaboration based on [55].
Sustainability 15 07313 g012
Figure 13. Evolution of the volumes distributed by the MCT among the municipalities of Vega Baja del Segura between 1979 and 2019 (hm3). Source: own elaboration based on [55].
Sustainability 15 07313 g013
Figure 14. Evolution of the hydraulic technical performance of the network between 2012 and 2019 on average of the municipalities of Vega Baja del Segura managed in the secondary phase by Hidraqua (%). Source: own elaboration based on [69].
Sustainability 15 07313 g014
Figure 15. Evolution of the hydraulic technical performance of the network between 2015 and 2019 in the municipalities of Vega Baja del Segura managed in the secondary phase by Hidraqua (%). Source: own elaboration based on [69].
Sustainability 15 07313 g015
Figure 16. Municipal demand for potable water for urban-industrial use, supplied and invoiced (hm3 per year). Source: own elaboration based on [55,69].
Sustainability 15 07313 g016
Figure 17. Supply of water resources in 2019, expressed in hm3 per year and in percentages. Source: own elaboration based on [55,59,64,70].
Sustainability 15 07313 g017
Figure 18. Demand for water resources in 2019, expressed in hm3 per year and in percentages. Source: own elaboration based on [19,67,69].
Sustainability 15 07313 g018
Table 2. Resources from reuse in the wastewater treatment plants (WWTP) of Vega Baja del Segura in the year 2019. Source: own elaboration based on [17].
Wastewater PlantTreated Annual Flow (hm3/year)Discharge Annual Flow 1 (hm3/year)Reused Annual Flow (hm3/year)
Albatera-San Isidro0.7400.74
Algorfa-Benejúzar0.400.400
Almoradí1.0801.08
Almoradí (El Saladar)0.0500.05
Benferri-Orihuela
(La Murada)
0.2500.25
Benijófar0.150.150
Dolores-Catral0.7600.76
Guardamar del Segura1.4101.41
Jacarilla-Bigastro0.500.500
Orihuela2.082.080
Orihuela-Costa3.0203.02
Orihuela (Barbarroja)1.7201.72
Orihuela (Hurchillo)0.0700.07
Orihuela (La Matanza)0.0400.04
Orihuela
(Rincón de Bonanza)
0.490.490
Orihuela (San Bartolomé)0.1900.19
Orihuela (Torremendo)0.0400.04
Orihuela
(Virgen del Camino)
0.0200.02
Pilar de la Horadada1.6101.61
Rojales0.6900.69
Rojales (Ciudad Quesada 1)0.0300.03
Rojales (Ciudad Quesada 2)0.030.030
Rojales (Doña Pepa)0.0600.06
Rojales (Lo Pepín)0.4400.44
San Fulgencio-Daya0.9100.91
San Miguel de Salinas0.1300.13
Sistema Callosa del Segura2.7402.74
Torrevieja7.1007.10
Total25.003.6321.37
1 Part of the treated water that returns to the watercourse is really reused indirectly downstream by traditional irrigation. The volume for this is estimated at 4 hm3/year.
Table 3. Current capacity of desalination in Vega Baja del Segura. Source: own elaboration based on [17,64].
Desalination PlantUsoProduction Capacity Flow
(m3/day)(hm3/year)
Agrícola del Segura ASIrrigation17300.63
Benferri WUAIrrigation40001.46
Golf Las RamblasRecreational15000.55
Santo Domingo WUAIrrigation52001.90
JacarillaIrrigation90003.29
Golf CampoamorRecreational15000.55
TorreviejaUrban supply and irrigation240,00080.00
Villamartín-Orihuela Costa
urbanization
Recreational40001.46
Total 266,93095.00
Notes: AS = Anonymous society; WUA = Water User Association.
Table 4. Synthesis of the UADs existing in Vega Baja del Segura and the level of irrigation technification. Source: own elaboration based on [19].
UAD (Code and Name)Gross Area (ha)Net Area
(ha)
Gross Demand (hm3/year)Net Demand (hm3/year)Mean Efficiency Ratio
UAD 46. Tradicional Vega Baja23,78015,469100.158.00.725
UAD 48. Ampliación al 33. decreto 53. Vega Baja3067191312.38.20.800
UAD 51. Regadíos mixtos de acuíferos y depuradas del Sur de Alicante453816389.97.50.908
UAD 52. Riegos de Levante. margen derecha3439288615.911.90.877
* UDA 53. Riegos de Levante Margen Izquierda-Segura11,046871352.436.10.838
UAD 56. Regadíos Redotados del TST de la ZRT La Pedrera10,563941152.541.40.913
* UAD 58. Regadíos redotados en ZRT Campo Cartagena31,71018,947126.3102.50.950
UAD 72. Regadíos Redotados del TST de la Vega Baja. margen izquierda7672682740.028.50.861
Total58,42942,198255.4173.0
* The information presented considers the entire UAD within the SHC. For a more exact quantification, in the final balance of Section 6, only the volume intended for irrigated areas located in the municipalities of Vega Baja del Segura has been calculated: 40% for UAD 53 and 3% for UAD 58.
Table 5. Summary of resources and demands for the area of the SRB and the Vega Baja del Segura in the year 2019, indicating the percentages of the area of study over the total SRB. Source: own elaboration based on [17,19].
Resources
(hm3/año)
SRBVEGA BAJA%Demands
(hm3/año)
SRBVEGA BAJA%
Superficial resources44410223%Urban-industrial2583714%
ADW634571%Irrigation152225517%
External transfer3153310%Recreational11431%
Groundwater255228%Environmental32515%
Reuse1422215%
Desalination301269%
Total152024816%Total182330116%
Table 6. Summary of resources and demands for the area of the SRB and the Vega Baja del Segura in the year 2027, indicating the percentages of the area of study over the total SRB. Source: own elaboration based on [17,19].
Resources
(hm3/año)
SRBVEGA BAJA%Demands
(hm3/año)
DHSVEGA BAJA%
Superficial resources4289823%Urban-industrial2693814%
ADW634570%Irrigation152625517%
External transfer3153310%Recreational11431%
Groundwater245219%Environmental32515%
Reuse1422215%
Desalination346309%
Total153924816%Total183830216%
Disclaimer/Publisher’s Note: The statements, opinions and data contained in all publications are solely those of the individual author(s) and contributor(s) and not of MDPI and/or the editor(s). MDPI and/or the editor(s) disclaim responsibility for any injury to people or property resulting from any ideas, methods, instructions or products referred to in the content.

