
Improving the Model for Estimating the Number of Construction Workers for Apartment Construction


Abstract
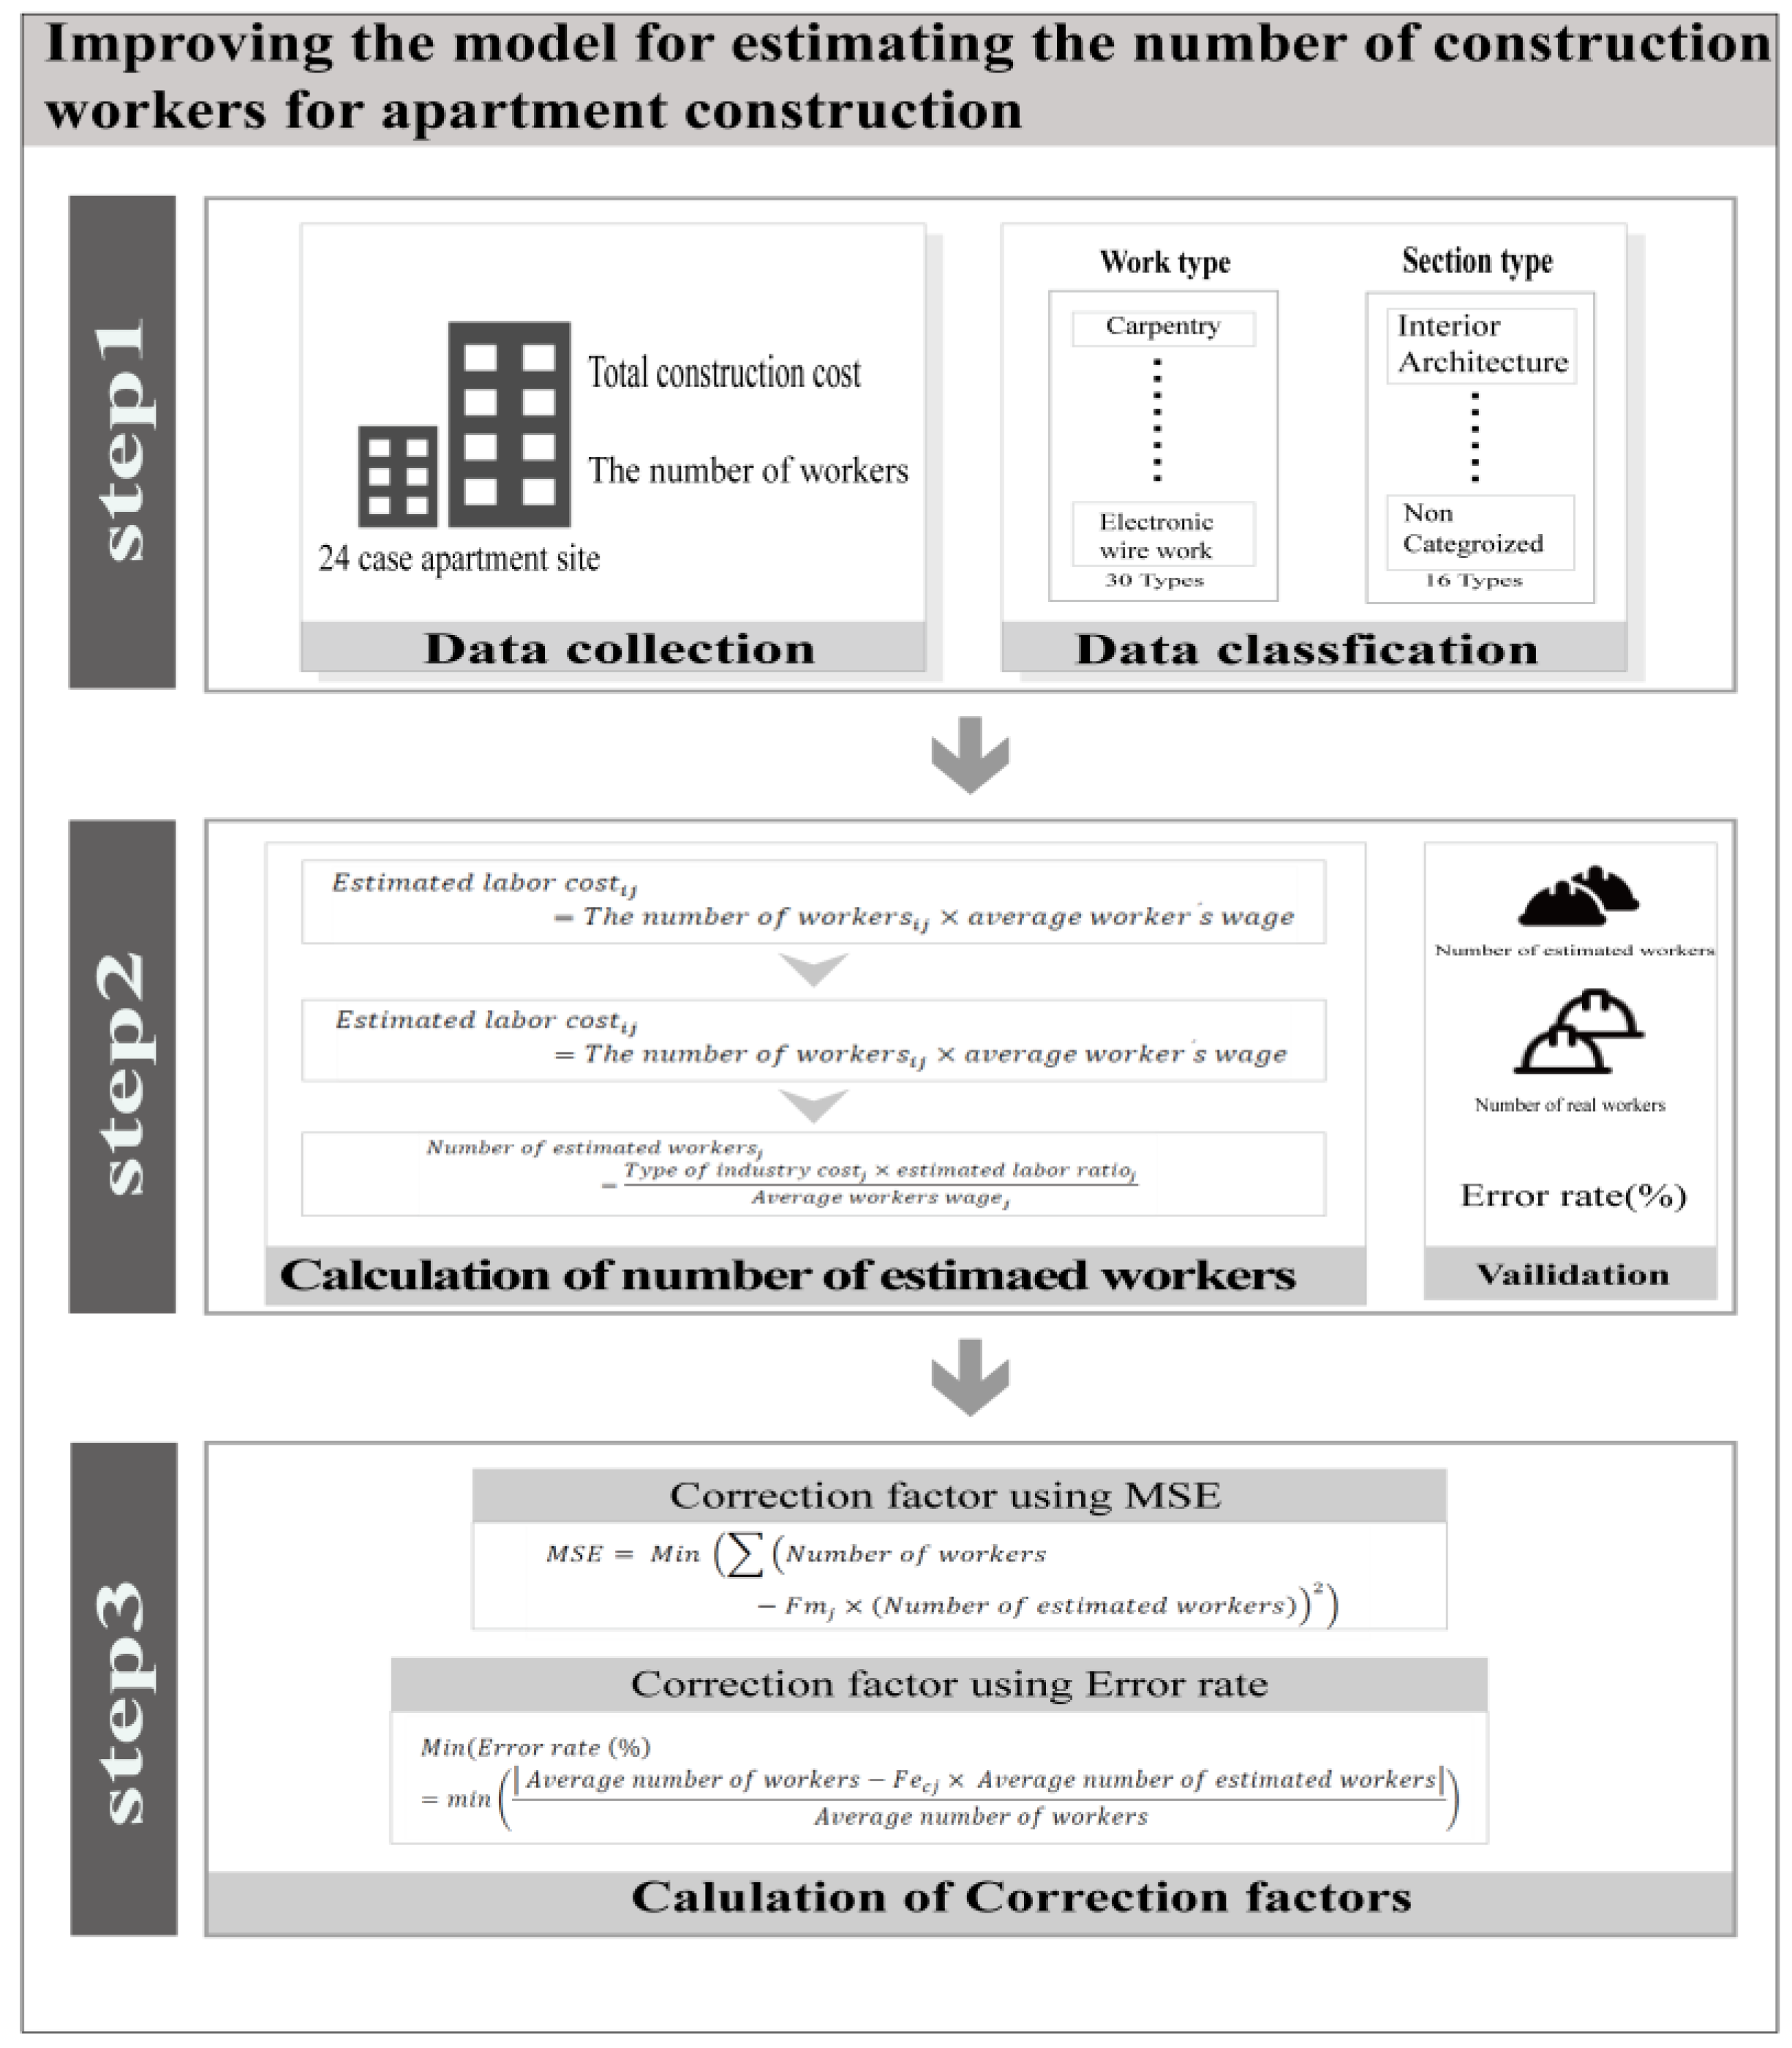
:1. Introduction
- (i)
- Development of a model that estimates the number of workers based on real data
- (ii)
- Considering different labor ratios for each work package type in apartment construction
- (iii)
- Suggestion of correction factors based on a statistical method. These factors improve the reliability of estimating the number of workers available to construction sites
2. Literature Review
2.1. Status of Previous Research
2.2. Research Gap
3. Problem Statement
- Estimating the labor ratio by work package type for the construction of an apartment building
- Development of correction factors to improve reliability, comparing the estimated data to real data
3.1. Summary of the Mathematical Model
3.2. Calculation and Validation of the Estimated Labor Ratio
3.3. Calculation of Correction Factors
3.3.1. Calculation of Fmj
3.3.2. Calculation of Fecj
4. Results
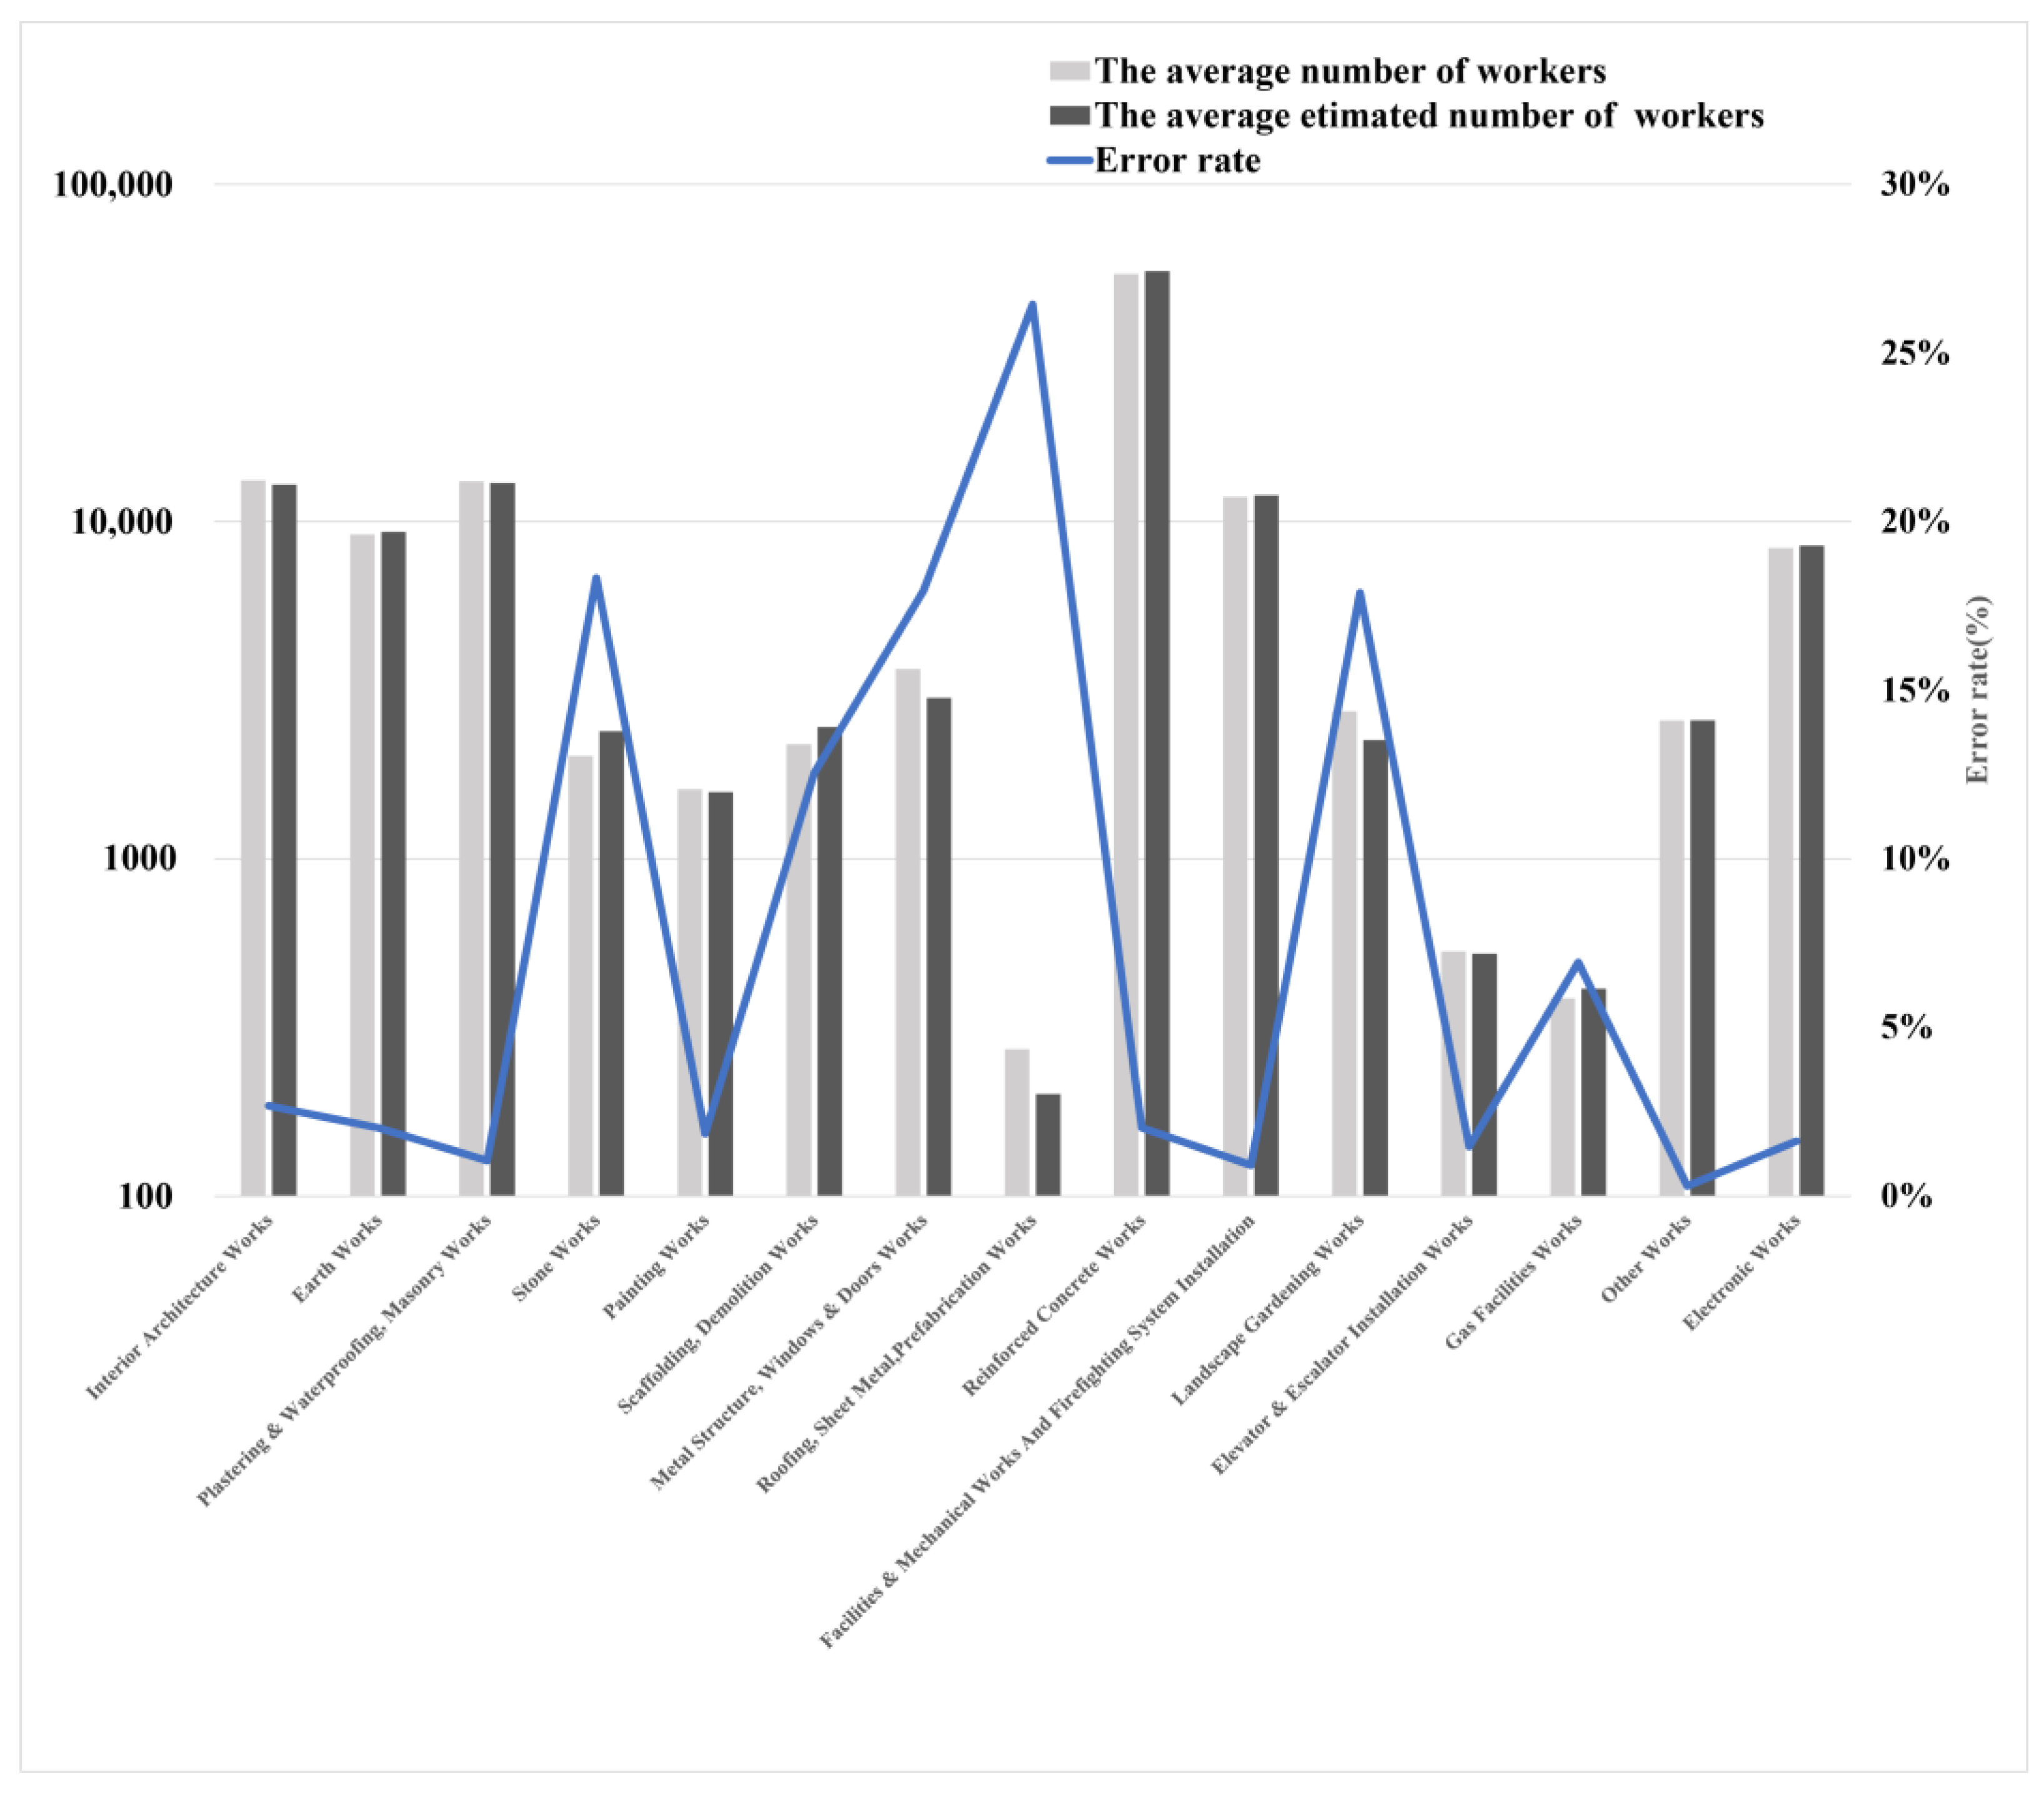
4.1. Results of Estimating the Labor Ratio for Work Package Type in Apartment Construction
4.2. Results of the Correction Factors
4.2.1. Value of Fmj
4.2.2. Value of Fecj
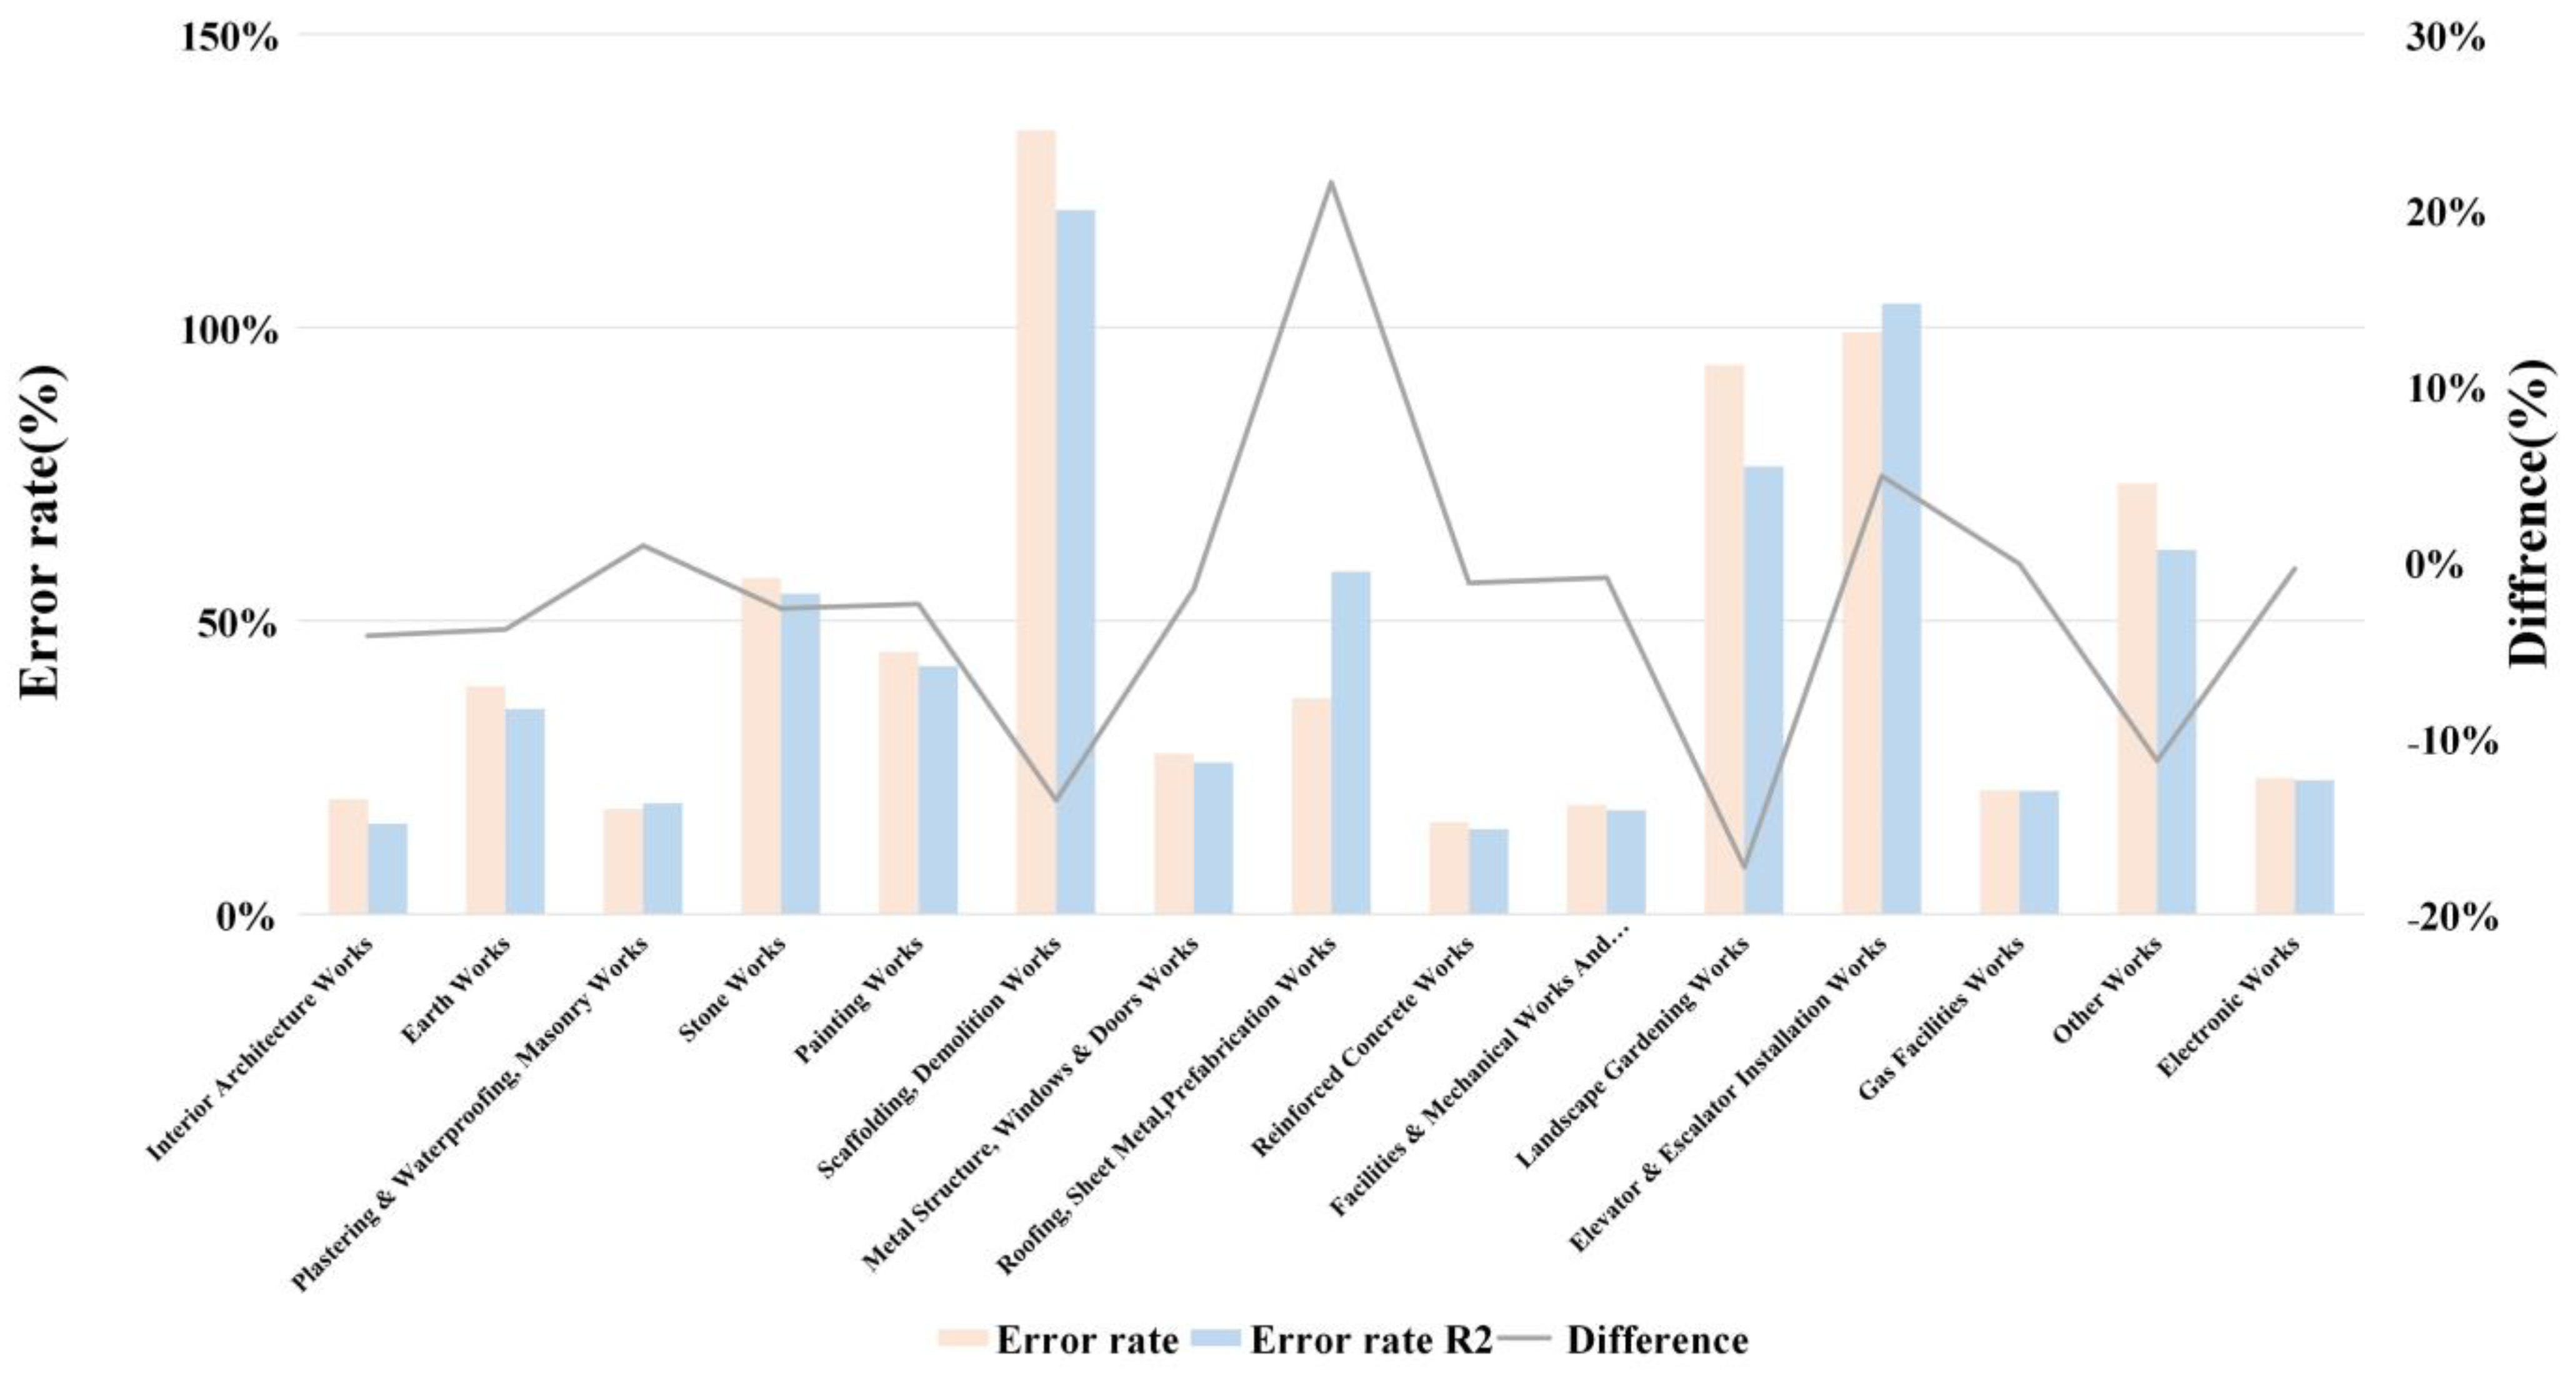
4.3. Analysis of the Correction Factors
4.3.1. Analysis of Fmj
4.3.2. Analysis of Fecj
4.4. Discussion
5. Managerial Insights and Practical Implications
5.1. Economic Implication
5.2. Safety Implication
6. Conclusions
Author Contributions
Funding
Data Availability Statement
Conflicts of Interest
Nomenclature
| Index of construction sites | |
| Index of work package type | |
| Index of classified construction cost | |
| Wj | Average wage for work package type j |
| Nij | The number of workers for work package type j in construction site i |
| Clij | Labor cost for work package type j in construction site i |
| Ctij | Construction total cost for work package type j in construction site i |
| Rij | Labor ratio for work package type j in construction site i |
| Neij | Estimated the number of workers for work package type j in construction site i |
| Rej | Average labor ratio for work package type j |
| Fmj | Minimization MSE for work package type j in construction site i |
| Fecj | Minimization error rate for work package type j in classified construction cost c |
| Nfmij | Estimated number of workers obtained by applying applied Fmj for work package type j at construction site i |
| Nfecij | Estimated number of workers obtained by applying Fecj for work package type j in construction site i classified by construction cost c |
References
- El-Gohary, K.M.; Aziz, R.F. Factors influencing construction labor productivity in Egypt. J. Manag. Eng. 2014, 30, 1–9. [Google Scholar] [CrossRef]
- Office for National Statistics (ONS). Annual Population Survey (APS). Available online: https://www.ons.gov.uk/employmentandlabourmarket/peopleinwork/employmentandemployeetypes/methodologies/annualpopulationsurveyapsqmi (accessed on 21 March 2021).
- The National Bureau of Statistics of China. Available online: http://www.stats.gov.cn/ (accessed on 21 March 2021).
- Ministry of Manpower (MOM). Workplace Safety and Health Report. Available online: https://www.mom.gov.sg (accessed on 28 February 2021).
- Ministry of Employment and Labor (MOEL). Occupational Safety and Health Act, South Korea. Available online: https://elaw.klri.re.kr/kor_service/lawView.do?hseq=55395&lang=ENG (accessed on 2 February 2021).
- Korea Occupational Safety and Health Agency (KOSHA). 2021 Industry Injury Analysis, South Korea. Available online: https://www.kosha.or.kr/kosha/data/industrialAccidentStatus.do?mode=view&articleNo=428212&article.offset=0&articleLimit=10 (accessed on 12 March 2021).
- Ministry of Employment and Labor (MOEL). Labor Standards Act, South Korea. Available online: https://elaw.klri.re.kr/kor_service/lawView.do?hseq=56543&lang=ENG (accessed on 2 February 2021).
- Yi, K.J. New construction accident index based on number of accident and progress payments. J. Korea Inst. Build. Constr. 2022, 22, 293–303. [Google Scholar] [CrossRef]
- Jeong, J.; Jeong, J. Novel approach of the integrated work & risk breakdown structure for identifying the hierarchy of fatal incident in construction industry. J. Build. Eng. 2021, 41, 102406. [Google Scholar] [CrossRef]
- Buchan, R.D.; Kelly, J.R.; Fleming, F.W. Estimating for Builders and Quantity Surveyors, 1st ed.; Newnes: Oxford, UK, 1991; p. 16. [Google Scholar]
- Proverbs, D.; Holt, G.; Olomolaiye, P. A method for estimating labour requirements and costs for international construction projects at inception. Build. Environ. 1998, 34, 43–48. [Google Scholar] [CrossRef]
- Shim, Y.; Jeong, J.; Jeong, J.; Lee, J.; Kim, Y. Comparative analysis of the national fatality rate in construction industry using time-series approach and equivalent evaluation conditions. Int. J. Environ. Res. Public Health 2022, 19, 2312. [Google Scholar] [CrossRef]
- Huang, C.-H.; Hsieh, S.-H. Predicting BIM labor cost with random forest and simple linear regression. Autom. Constr. 2020, 118, 103280. [Google Scholar] [CrossRef]
- Akintoye, A. Analysis of factors influencing project cost estimating practice. Constr. Manag. Econ. 2000, 18, 77–89. [Google Scholar] [CrossRef]
- Dyakova, O.V.; Vasilenko, Z.A.; Usatkina, O.I.; Alexandria, A.V. Economic-mathematical model for calculating the labor cost as a part of the investment construction project’s cost on the estimated standardization and market pricing methods” basis. IOP Conf. Ser. Mater. Sci. Eng. 2020, 913, 052019. [Google Scholar] [CrossRef]
- Korea Occupational Safety and Health Agency (KOSHA). Study on Estimation of the Number of Full-time Workers in the Construction Site. Available online: https://oshri.kosha.or.kr/oshri/publication/researchReportSearch.do?mode=view&articleNo=419771&article.offset=0&articleLimit=10&srSearchVal=%EC%83%81%EC%8B%9C (accessed on 12 October 2022).
- Huang, Q.; Hao, K. Development of CNN-based visual recognition air conditioner for smart buildings. J. Inf. Technol. Constr. 2020, 25, 361–373. [Google Scholar] [CrossRef]
- Zhao, L.; Li, Y.; Liang, R.; Wang, P. A State of Art Review on Methodologies of Occupancy Estimating in Buildings from 2011 to 2021. Electronics 2022, 11, 3173. [Google Scholar] [CrossRef]
- Guo, J.; Amayri, M.; Najar, F.; Fan, W.; Bouguila, N. Occupancy estimation in smart buildings using predictive modeling in imbalanced domains. J. Ambient. Intell. Humaniz. Comput. 2022, 1–13. [Google Scholar] [CrossRef]
- Jeong, J.; Jeong, J. Quantitative risk evaluation of fatal incidents in construction based on frequency and probability analysis. J. Manag. Eng. 2022, 38, 04021089. [Google Scholar] [CrossRef]
- Construction Digital Library (CODIL), Project Cost Estimating, South Korea. 2022. Available online: https://www.codil.or.kr/helpdesk/read.do;jsessionid=ORacB06PBGNl5xI8DzKkFwy9vIxQJuvbJQFgR8vtJcJE1O8fbOuaEGApTj1z16o3.codil_servlet_engine1?bbsId=BBSMSTR_900000000202&nttId=12517&searchWrd= (accessed on 22 October 2022).
- Construction Association of Korea, Construction Average Wage, South Korea, 2014–2019. Available online: http://www.cak.or.kr/board/boardList.do?boardId=spend_wage&menuId=61 (accessed on 21 December 2022).
- Mark, J.; Goldberg, M.A. Multiple regression analysis and mass assessment: A review of the issues. Apprais. J. 1988, 56, 89–109. [Google Scholar]


| No. | Reference | Purpose | Research Gap |
|---|---|---|---|
| Research related to estimating labor cost | |||
| 1 | Huang et al. [13] | The authors suggested the method for estimating labor cost used in nine BIM projects. | This study analyzed the estimated labor cost rate using real data |
| 2 | Dyacova et al. [15] | The authors used standardization and market pricing methods to estimate labor costs in construction project costs. | |
| Research related to estimating the number of workers | |||
| 3 | Kosha guide [16] | The author suggested a labor cost rate to improve the reliability of the estimation of the number of workers. | This study suggests an estimated labor cost rate by work package type and calculates a correction factor to improve reliability |
| 4 | Sim et al. [12] | The authors analyzed the national method of estimating the number of workers. | |
| Research related to estimating methods used in building factors | |||
| 5 | Huang et al. [17] | The authors developed an air conditioner with a visual recognition capacity using a convolutional neural network (CNN). The visual recognition system can recognize human bodies through a camera. | This study suggests a simple estimation model using calculations |
| 6 | Zhao et al. [18] | The author analyzed methods presented in 78 literature reviews related to estimating building occupancy and their accuracies. | |
| 7 | Guo et al. [19] | The authors analyzed small and imbalanced datasets of estimations in buildings using predictive modeling. | |
| This research | This study estimates the number of construction workers with high reliability and accuracy using a correction factor for work package types in an apartment project. | - | |
| Type | Parameter | Unit |
|---|---|---|
| Parameter | Wj | Dollar/Person |
| Nij | Person | |
| Clij | Dollar/Site | |
| Ctij | Dollar/Site | |
| Rij | % | |
| Decision variables | Neij | Person |
| Rej | % | |
| Fmj | Num | |
| Fecj | Num | |
| Nfmij | Person | |
| Nfecij | Person |
| 2013 | 2015 | 2016 | 2017 | |
|---|---|---|---|---|
| Interior architecture work | 81.94 | 90.02 | 99.88 | 106.39 |
| Earth work | 79.57 | 87.47 | 95.00 | 102.64 |
| Plastering and waterproofing, masonry work | 79.09 | 86.70 | 96.45 | 103.48 |
| Stone work | 83.50 | 89.63 | 99.11 | 105.91 |
| Painting work | 76.45 | 83.51 | 91.61 | 98.21 |
| Scaffolding, demolition work | 83.20 | 90.62 | 99.69 | 106.85 |
| Metal structure, window and doors work | 81.43 | 88.78 | 97.96 | 104.58 |
| Roofing, sheet metal, prefabrication work | 77.80 | 83.33 | 92.61 | 99.10 |
| Reinforced concrete work | 88.62 | 100.81 | 111.36 | 119.23 |
| Facilities and mechanical works, firefighting system installation work | 77.49 | 84.56 | 92.76 | 99.37 |
| Landscape gardening work | 78.92 | 87.99 | 94.98 | 101.78 |
| Elevator and escalator installation works | 79.80 | 89.30 | 97.75 | 104.83 |
| Gas facilities work | 90.65 | 98.67 | 108.82 | 114.42 |
| Non-categorized work | 75.59 | 81.45 | 90.06 | 96.20 |
| Electronic work | 74.59 | 81.04 | 89.37 | 95.60 |
| Rej | |
|---|---|
| Interior architecture work | 13.50% |
| Earth work | 26.96% |
| Plastering and waterproofing, masonry work | 38.08% |
| Stone work | 18.35% |
| Painting work | 19.42% |
| Scaffolding, demolition work | 23.08% |
| Metal structure, window and doors work | 4.23% |
| Roofing, sheet metal, prefabrication work | 15.02% |
| Reinforced concrete work | 62.24% |
| Facilities and mechanical work, firefighting system installation | 21.72% |
| Landscape gardening work | 13.72% |
| Elevator and escalator installation work | 5.22% |
| Gas facilities work | 10.72% |
| Other work | 12.79% |
| Electronic work | 22.46% |
| Nj | Nej | Error Rate | |
|---|---|---|---|
| Interior architecture work | 13,252 | 12,897 | 2.68% |
| Earth work | 9153 | 9338 | 2.03% |
| Plastering and waterproofing, masonry work | 13,157 | 13,018 | 1.05% |
| Stone work | 2019 | 2389 | 18.33% |
| Painting work | 1608 | 1578 | 1.85% |
| Scaffolding, demolition work | 2185 | 2460 | 12.55% |
| Metal structure, window and doors work | 3655 | 2999 | 17.95% |
| Roofing, sheet metal, prefabrication work | 273 | 201 | 26.44% |
| Reinforced concrete work | 54,210 | 55,308 | 2.03% |
| Facilities and mechanical work, firefighting system installation | 11,843 | 11,952 | 0.92% |
| Landscape gardening work | 2740 | 2249 | 17.90% |
| Elevator and escalator installation work | 531 | 523 | 1.47% |
| Gas facilities work | 386 | 412 | 6.93% |
| Other work | 2569 | 2577 | 0.30% |
| Electronic work | 8357 | 8493 | 1.63% |
| Max | Min | |
|---|---|---|
| Interior architecture work | 74.58% | 2.98% |
| Earth work | 238.50% | 5.55% |
| Plastering and waterproofing, masonry work | 44.72% | 1.74% |
| Stone work | 508.60% | 3.23% |
| Painting work | 321.58% | 2.93% |
| Scaffolding, demolition work | 1117.70% | 7.88% |
| Metal structure, window and doors work | 81.33% | 0.42% |
| Roofing, sheet metal, prefabrication work | 103.23% | 3.11% |
| Reinforced concrete work | 54.41% | 4.94% |
| Facilities and mechanical work, firefighting system installation | 50.67% | 0.08% |
| Landscape gardening work | 1079.78% | 5.23% |
| Elevator and escalator installation Work | 680.93% | 1.50% |
| Gas facilities work | 69.58% | 0.14% |
| Other work | 417.64% | 2.97% |
| Electronic work | 91.59% | 1.55% |
| MSE | Fmj | |
|---|---|---|
| Interior architecture work | 10,600,897 | 1.04 |
| Earth work | 15,004,013 | 0.90 |
| Plastering and waterproofing, masonry work | 7,818,733 | 1.01 |
| Stone work | 425,468 | 0.82 |
| Painting work | 403,856 | 1.03 |
| Scaffolding, demolition work | 2,362,608 | 0.79 |
| Metal structure, window and doors work | 1,315,173 | 1.26 |
| Roofing, sheet metal, prefabrication works | 24,602 | 1.31 |
| Reinforced concrete work | 92,460,460 | 0.96 |
| Facilities and mechanical work, firefighting system installation | 8,273,049 | 0.99 |
| Landscape gardening work | 12,511,472 | 1.45 |
| Elevator and escalator installation work | 152,258 | 0.98 |
| Gas facilities work | 13,469 | 0.86 |
| Other work | 1,393,565 | 0.98 |
| Electronic work | 3,709,851 | 0.95 |
| Nj | Nej | Nfmj | |
|---|---|---|---|
| Interior architecture work | 13,252 | 12,897 | 13,412 |
| Earth work | 9153 | 9338 | 8440 |
| Plastering and waterproofing, masonry work | 13,157 | 13,018 | 13,207 |
| Stone work | 2019 | 2389 | 1962 |
| Painting work | 1608 | 1578 | 1622 |
| Scaffolding demolition work | 2185 | 2460 | 1950 |
| Metal structure window and doors work | 3655 | 2999 | 3789 |
| Roofing, sheet metal, prefabrication work | 273 | 201 | 262 |
| Reinforced concrete work | 54,210 | 55,308 | 53,333 |
| Facilities and mechanical work, firefighting system installation | 11,843 | 11,952 | 11,791 |
| Landscape gardening work | 2740 | 2249 | 3262 |
| Elevator and escalator installation work | 549 | 523 | 449 |
| Gas facilities work | 386 | 412 | 404 |
| Other work | 2569 | 2577 | 2453 |
| Electronic work | 8357 | 8493 | 8083 |
| Total Construction Cost(c) (100 Thousand USD $) | Fecj | Total Construction Cost(c) (100 Thousand USD $) | Fecj | ||
|---|---|---|---|---|---|
| Interior architecture work | Under 1 | 1.00 | Reinforced concrete work | Under 1 | 1.00 |
| 1 to 5 | 0.74 | 1 to 5 | 1.21 | ||
| 5 to 10 | 1.02 | 5 to 10 | 1.01 | ||
| 10 to 15 | 0.87 | 10 to 15 | 0.96 | ||
| Over 20 | 1.19 | Over 20 | 0.96 | ||
| Earth work | Under 1 | 0.90 | Facilities and mechanical work, firefighting | Under 1 | 1.00 |
| 1 to 5 | 0.66 | 1 to 5 | 1.00 | ||
| 5 to 10 | 1.06 | 5 to 10 | 1.11 | ||
| 10 to 15 | 1.01 | 10 to 15 | 0.94 | ||
| Over 20 | 0.59 | Over 20 | 1.22 | ||
| Plastering and waterproofing, masonry work | Under 1 | 1.00 | System installation | Under 1 | 1.00 |
| 1 to 5 | 1.00 | 1 to 5 | 1.00 | ||
| 5 to 10 | 1.00 | 5 to 10 | 0.57 | ||
| 10 to 15 | 1.07 | 10 to 15 | 1.30 | ||
| Over 20 | 0.94 | Over 20 | 1.00 | ||
| Stone work | Under 1 | 1.00 | Landscape gardening work | Under 1 | 1.00 |
| 1 to 5 | 1.00 | 1 to 5 | 1.00 | ||
| 5 to 10 | 1.00 | 5 to 10 | 1.00 | ||
| 10 to 15 | 1.12 | 10 to 15 | 0.98 | ||
| Over 20 | 0.80 | Over 20 | 1.06 | ||
| Painting work | Under 1 | 1.00 | Elevatorand escalator installation work | Under 1 | 1.00 |
| 1 to 5 | 1.00 | 1 to 5 | 1.00 | ||
| 5 to 10 | 1.00 | 5 to 10 | 1.00 | ||
| 10 to 15 | 1.00 | 10 to 15 | 1.00 | ||
| Over 20 | 0.90 | Over 20 | 0.94 | ||
| Scaffolding, demolition work | Under 1 | 1.09 | Gas facilities work | Under 1 | 1.00 |
| 1 to 5 | 1.00 | 1 to 5 | 1.00 | ||
| 5 to 10 | 1.00 | 5 to 10 | 1.00 | ||
| 10 to 15 | 1.00 | 10 to 15 | 1.00 | ||
| Over 20 | 1.00 | Over 20 | 1.00 | ||
| Metal structure, window and doors work | Under 1 | 1.39 | Other work | Under 1 | 0.26 |
| 1 to 5 | 0.78 | 1 to 5 | 1.01 | ||
| 5 to 10 | 1.00 | 5 to 10 | 0.94 | ||
| 10 to 15 | 1.00 | 10 to 15 | 1.00 | ||
| Over 20 | 1.00 | Over 20 | 1.00 | ||
| Roofing, sheet metal, rrefabrication work | Under 1 | 1.30 | Electronic work | Under 1 | 1.05 |
| 1 to 5 | 1.00 | 1 to 5 | 0.96 | ||
| 5 to 10 | 1.00 | 5 to 10 | 0.82 | ||
| 10 to 15 | 1.00 | 10 to 15 | 1.00 | ||
| Over 20 | 1.00 | Over 20 | 1.00 |
| Nj | Nej | Nfej | Standard Deviation | Average Error Rate | |
|---|---|---|---|---|---|
| Interior architecture work | 13,252 | 12,897 | 13,252 | 6476.62 | 15.42% |
| Earth work | 9153 | 9338 | 9158 | 4404.66 | 34.98% |
| Plastering and waterproofing, masonry work | 13,157 | 13,018 | 13,157 | 4668.15 | 18.88% |
| Stone work | 2019 | 2389 | 2019 | 1797.73 | 54.62% |
| Painting work | 1608 | 1578 | 1608 | 606.04 | 42.27% |
| Scaffolding, demolition work | 2185 | 2460 | 2185 | 717.66 | 120.02% |
| Metal structure, window and doors work | 3655 | 2999 | 3655 | 1789.73 | 25.84% |
| Roofing, sheet metal, prefabrication work | 273 | 201 | 273 | 125.56 | 58.38% |
| Reinforced concrete work | 54,210 | 55,308 | 54,210 | 18,010.86 | 14.50% |
| Facilities and mechanical work, firefighting system installation | 11,843 | 11,952 | 11,843 | 5019.15 | 17.73% |
| Landscape gardening work | 2740 | 2249 | 2740 | 1725.50 | 76.27% |
| Elevator and escalator installation Work | 549 | 523 | 549 | 251.80 | 104.04% |
| Gas facilities work | 386 | 412 | 386 | 163.82 | 20.98% |
| Other work | 2569 | 2577 | 2569 | 1081.56 | 62.08% |
| Work Package Type | Max | Min |
|---|---|---|
| Interior architecture work | 81.55% | 1.29% |
| Earth work | 205.94% | 0.31% |
| Plastering and waterproofing, masonry work | 46.81% | 2.01% |
| Stone work | 399.64% | 0.27% |
| Painting work | 333.13% | 2.27% |
| Scaffolding, demolition work | 865.54% | 1.89% |
| Metal structure, window and doors work | 129.14% | 16.48% |
| Roofing, sheet metal, prefabrication works | 165.43% | 3.89% |
| Reinforced concrete work | 48.90% | 0.32% |
| Facilities and mechanical work, firefighting system installation works | 48.64% | 38.17% |
| Landscape gardening work | 100.00% | 3.53% |
| Elevator and escalator installation work | 570.46% | 0.31% |
| Gas facilities work | 66.16% | 2.19% |
| Non-categorized work | 392.66% | 0.51% |
| Electronic work | 82.34% | 0.00% |
| Type of Work Package | Max | Min |
|---|---|---|
| Interior architecture work | 78.98% | 0.00% |
| Earth work | 259.16% | 0.00% |
| Plastering and waterproofing, masonry work | 54.30% | 0.30% |
| Stone work | 582.29% | 1.00% |
| Painting work | 278.60% | 0.69% |
| Scaffolding, demolition work | 847.92% | 0.40% |
| Metal structure, window and doors work | 79.13% | 0.14% |
| Roofing, sheet metal, prefabrication work | 159.50% | 18.34% |
| Reinforced concrete work | 48.51% | 0.00% |
| Facilities and mechanical works, firefighting system installation work | 52.69% | 0.00% |
| Landscape gardening work | 578.09% | 3.43% |
| Elevator and escalator installation work | 725.37% | 0.32% |
| Gas facilities work | 58.59% | 0.39% |
| Non-categorized work | 421.58% | 0.00% |
| Electronic work | 100.34% | 0.00% |
Disclaimer/Publisher’s Note: The statements, opinions and data contained in all publications are solely those of the individual author(s) and contributor(s) and not of MDPI and/or the editor(s). MDPI and/or the editor(s) disclaim responsibility for any injury to people or property resulting from any ideas, methods, instructions or products referred to in the content. |
© 2023 by the authors. Licensee MDPI, Basel, Switzerland. This article is an open access article distributed under the terms and conditions of the Creative Commons Attribution (CC BY) license (https://creativecommons.org/licenses/by/4.0/).
Share and Cite
Mun, H.; Jeong, J.; Jeong, J. Improving the Model for Estimating the Number of Construction Workers for Apartment Construction. Sustainability 2023, 15, 7150. https://doi.org/10.3390/su15097150
Mun H, Jeong J, Jeong J. Improving the Model for Estimating the Number of Construction Workers for Apartment Construction. Sustainability. 2023; 15(9):7150. https://doi.org/10.3390/su15097150
Chicago/Turabian StyleMun, Hyeongjun, Jaewook Jeong, and Jaemin Jeong. 2023. "Improving the Model for Estimating the Number of Construction Workers for Apartment Construction" Sustainability 15, no. 9: 7150. https://doi.org/10.3390/su15097150
APA StyleMun, H., Jeong, J., & Jeong, J. (2023). Improving the Model for Estimating the Number of Construction Workers for Apartment Construction. Sustainability, 15(9), 7150. https://doi.org/10.3390/su15097150