Abstract
The detection of cracks in concrete structures is crucial for the assessment of their structural integrity and safety. To this end, detection with deep neural convolutional networks has been extensively researched in recent years. Despite their success, these methods are limited in classifying concrete as cracked or non-cracked and disregard other characteristics, such as the severity of the cracks. Furthermore, the classification process can be affected by various sources of interference and noise in the images. In this paper, an integrated methodology for analysing concrete crack images is proposed using transfer and unsupervised learning. The method extracts image features using pre-trained networks and groups them based on similarity using hierarchical clustering. Three pre-trained networks are used for this purpose, with Inception v3 performing the best. The clustering results show the ability to divide images into different clusters based on image characteristics. In this way, various clusters are identified, such as clusters containing images of obstruction, background debris, edges, surface roughness, as well as cracked and uncracked concrete. In addition, dimensionality reduction is used to further separate and visualise the data, making it easier to analyse clustering results and identify misclassified images. This revealed several mislabelled images in the dataset used in this study. Additionally, a correlation was found between the principal components and the severity of cracks and surface imperfections. The results of this study demonstrate the potential of unsupervised learning for analysing concrete crack image data to distinguish between noisy images and the severity of cracks, which can provide valuable information for building more accurate predictive models.
1. Introduction
Image recognition is an important task in the field of computer vision and is extensively researched. One of the most widely used approaches to image recognition is the use of Deep Convolutional Neural Networks (CNNs or DCNNs). These models extract features from an image through a process called convolution, which applies filters to the image to detect edges, textures, and shapes [1]. These models have been widely adopted in the field of structural health monitoring, including for the detection of cracks in concrete structures. Early detection of cracks is essential for assessing the structural integrity and safety of concrete structures, and regular inspections are necessary to ensure their longevity. Traditional crack detection methods, such as visual inspections or non-destructive testing, are time and resource intensive. Therefore, the use of deep learning models for autonomous crack detection in concrete structures has become widely accepted due to their high accuracy and efficiency [2].
The use of convolutional neural network-based models for image recognition is driven by their ability to learn directly from image data. These models can be used for various tasks such as crack image classification, edge detection, and segmentation [3,4,5]. One of the main challenges in using these models is that large datasets are required for training, which in turn requires significant computational resources [6]. The construction of these models often follows the state-of-the-art networks in image recognition, such as AlexNet, VGG, Inception, and ResNets [7], which are typically trained on a vast dataset of everyday images, such as the ImageNet dataset [8]. Once trained, they are able to classify images that are specific to the domain of the training dataset. However, even though these models have been trained for a specific task, they still contain a wealth of knowledge about feature construction that can be transferred to other domains. In this process, known as transfer learning, models that have already been trained are used as a starting point for developing models in other domains. This can greatly reduce the amount of data and computational resources required to train a model for a new task, while still achieving high levels of accuracy [9]. The use of transfer learning has emerged as a recent approach for crack detection in concrete structures [10]. Studies have proposed various combinations of pre-trained networks with custom classifiers to improve the performance of the models [11,12,13,14]. These proposed methods have shown high accuracy and strong generalization capabilities, outperforming other models in both accuracy and number of parameters.
Despite the success of deep neural networks in detecting cracks, these methods still have some limitations. Often, classification is limited to only two categories: cracked and non-cracked, ignoring other characteristics such as the severity of the cracks [15]. Additionally, images of concrete surfaces often contain a considerable amount of noise, including obstructions, surface roughness, shadows, and blurred images, which can affect the predictions [16]. This raises the need for an alternative method that can distinguish between given images and order them based on their characteristics. Such information could be very valuable for extending existing methods. For example, noisy images could be identified and removed before prediction models are used, which could improve performance [17]. Furthermore, if the severity of cracks could be determined, additional labels could be added to the data, providing additional context to the classifiers and extending their functionality. This could lead to a better assessment of the integrity of the structure.
For this purpose, the use of unsupervised learning techniques is proposed. Such methods do not require any labels and analyse images based only on their feature data, which leads to the separation of images into various groups without predefining them in advance. They are particularly useful in situations where categories are poorly defined or do not exist [18]. In such cases, the use of unsupervised learning has been shown to be effective and can match the performance of conventional models [19]. Its use has been demonstrated in various fields such as remote sensing [20], signal processing [21], and crack image segmentation. In crack image segmentation, clustering has been used to distinguish cracked and uncracked concrete at the pixel level [22]. Moreover, unsupervised techniques can be used to improve the existing methods by making use of unlabelled images by extracting knowledge and applying it in the training process [23].
In this study, an integrated methodology for crack image analysis combining transfer and unsupervised learning is proposed. The presented method extracts features from images using transfer learning represented as image embeddings. Unsupervised learning is then applied to analyse these embeddings and identify characteristic clusters of similar images. For this purpose, we compare three pre-trained networks: VGG-16, VGG-19, and Inception v3. In addition, dimensionality reduction techniques are employed to further separate the data and visualise the results, which helps to find misclassified images and outliers. This presents an alternative approach to crack image analysis. The other works focus mainly on determining whether an image contains a crack or not, while our approach aims to find the additional context of the images.
2. Methodology
The methodology used in this study consists of two parts (Figure 1). The first part deals with the prediction of images of non-cracked versus cracked concrete using transfer learning. This technique leverages pre-trained neural networks where the last layers are removed and replaced with new layers that are specifically tailored to the task at hand. These new layers are trained on a specific dataset, in this case, images of cracked concrete. The result of this process is a classifier that can assign images into two classes: cracked or non-cracked concrete. This is an already established method and therefore will not be the focus of this study.
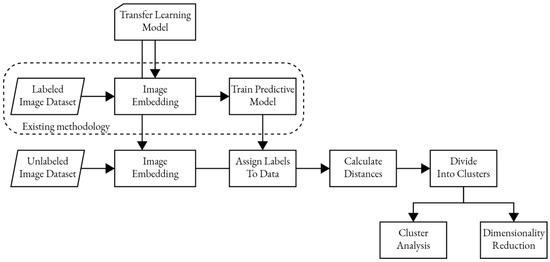
Figure 1.
Flowchart of the described methodology.
The second part of the methodology was developed specifically for this study. It deals with the data analysis of the given dataset containing images of cracked concrete. It involves the use of pre-trained networks to obtain image embeddings. These are vector representations of an image that contain only the most relevant information. These embeddings are then used to compute distances between data points to represent similarities between images. They are used to construct hierarchical clusters that group these similar images into individual clusters. Afterwards, the data within the clusters are examined to understand the representation of each cluster. By including image labels, the ratio between two classes of images within clusters can be calculated to automatically determine the content of the clusters. Further evaluation involves analysing each cluster individually by transforming the data to a lower dimensional representation through dimensionality reduction. This allows the visualisation of the data and identification of misclassified images, providing valuable information to improve the predictive model.
It should be noted that the second part of the methodology can be used independently, as it involves the use of unsupervised learning techniques that work with unlabelled data. In this case, the labelled data only provides additional context for the user and not for the unsupervised models. Therefore, the methodology can be used with either unlabelled or labelled datasets.
2.1. Transfer Learning
There are two main approaches to transfer learning in image recognition: fine-tuning and feature extraction. In fine-tuning, the weights of a pre-trained model are further trained on a new dataset of images. This allows the model to adapt to the specific features of the new dataset without having to learn from scratch. Feature extraction, on the other hand, uses the pre-trained model as a fixed feature extractor by removing a few final layers and training a new model on the extracted output. This approach is particularly useful for smaller datasets where there is limited data available for training. In addition, feature extraction allows for faster training times since the pre-trained model has already learned a significant amount of information from the original dataset [24,25].
In this study, a feature extraction technique is used to extract image embeddings from a new dataset. For this purpose, pre-trained models, mainly VGG-16, VGG-19, and Inception v3, are used and the last layer, which is typically used for classification, is removed. In this way, the high-dimensional image space is represented in a compact low-dimensional feature space where the most informative features of the image are captured. The output of the image embedding is usually a high-dimensional vector containing numerical feature values that can be used for various tasks [26,27]. Tasks such as image classification, where the embeddings are used as an input to a classifier that assigns a predefined category to an image, searching similar images in a dataset, or finding the nearest neighbours of a given image in the feature space.
2.1.1. VGG-16
VGG-16 is a very deep convolutional neural network architecture trained on the ImageNet dataset of 1.2 million training images with 1000 different classes, such as animals, vehicles, and everyday objects [28]. The network architecture consists of 16 weighted layers composed of 13 convolutional layers and 3 fully connected layers (Figure 2). It is characterized by the use of small convolutional filters of size 3 × 3 stacked on top of each other to extract features from the input image. In addition, the network uses a technique called max pooling, which reduces the spatial dimensions of the feature maps and allows the network to focus on the most important features [29].

Figure 2.
Modified VGG-16 architecture for image embedding.
For image embedding, a modified network with frozen pre-trained weights is used, where the last layer dedicated to classification is removed. This results in a network that takes an input image of size 256 × 256 × 3 and outputs a vector of 4096 numerical values between 0 and 1.
2.1.2. VGG-19
VGG-19 is an extension of VGG-16 and has a total of 19 weighted layers. This is accomplished by the inclusion of three additional convolutional layers (Figure 3). Both VGG-19 and VGG-16 use small convolutional filters of size 3 × 3, max pooling, and are pre-trained on the ImageNet dataset, but the additional layers in VGG-19 may lead to improved performance and more complex feature extraction, but also requires more computational resources [29].

Figure 3.
Modified VGG-19 architecture for image embedding.
2.1.3. Inception v3
Inception v3 is a 42-layer convolutional network architecture developed at Google and trained on ImageNet for image recognition tasks. One of its main features is the Inception modules (Figure 4), which are blocks of layers that use a combination of filters of different sizes. This allows the network to learn the features of the input images more efficiently while addressing the problem of overfitting which is common in very deep networks. It is based on the previous versions: GoogLeNet (Inception v1) and Inception v2. It has been shown to perform better at a slightly higher computational cost, despite having a deeper network [30].

Figure 4.
Modified Inception v3 architecture for image embedding.
A modified network with the last layer removed is considered, which in turn returns a vector of 2048 normalized feature values.
2.2. Unsupervised Learning
Unsupervised learning, a subfield of machine learning, is the process of training a model on unlabelled data to discover the underlying structure of the data. Unlike supervised learning, which uses labels to train the model for prediction, unsupervised learning only considers features to explore the data and discover patterns or relationships without explicit guidance. Given the scarcity or expense of labelled data, unsupervised learning techniques have been widely applied in various fields such as data mining, natural language processing, and computer vision. Popular methods include clustering, dimensionality reduction, anomaly detection, and generative models that can be applied to various data types, including images, text, and time series data [31].
2.2.1. Clustering
To search for similarities in embedded data, hierarchical clustering with Ward linkage is considered. This technique builds a hierarchy of clusters based on the calculated distances between them. Specifically, the Ward linkage method is used, which is an agglomerative hierarchical technique. It starts with single data points and iteratively joins them to construct the clusters, in contrast to divisive methods that start with one cluster and split it into many. The clusters are combined in a way that results in the minimum increase in variance after merging, calculated as the sum of the squared distances between the data points and the mean of the merged cluster. This produces clusters that are similar in size and shape, which are displayed in a dendrogram (Figure 5), a tree-like representation, where the user can select clusters based on the distances or the number of clusters [32].
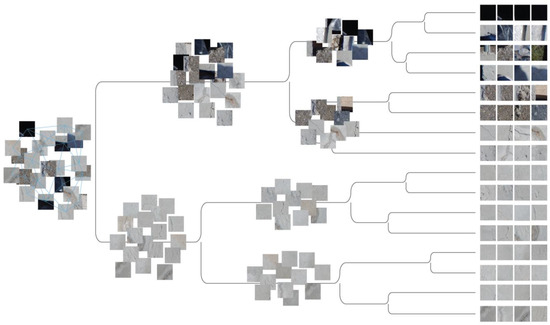
Figure 5.
Dendrogram showing hierarchical clustering of concrete crack images based on their similarity.
2.2.2. Dimensionality Reduction
The high-dimensional data may pose some challenges in terms of visualisation or computational costs. To this end, dimensionality reduction techniques can be used to address these issues. They aim to reduce the number of features by constructing new, uncorrelated variables known as principal components or latent variables that represent the most relevant information in the data [33]. These new variables can be used to represent the data in a lower dimensional space, making it easier to visualise the data and separate it further or to find any misclassified instances.
In this context, the application of principal component analysis (PCA) and t-distributed stochastic neighbour embedding (t-SNE) is applied to cluster-separated data. First, PCA is used to reduce the high-dimensional feature to a selected number of principal components, simplifying the data. Next, t-SNE is applied to the transformed data to convert it to a 2-dimensional representation, grouping similar data points together and separating others.
At this point, the image dataset is divided into smaller subsets of clusters and visualised in a scatter plot, making it easier for manual inspection. This way, one can examine whether correlations exist between the coordinates and the image properties, such as whether the number of imperfections in the images or the size of cracks increases or decreases relative to the coordinates.
3. Experiments and Results
To test the methodology, images of cracked and non-cracked concrete were obtained from a public dataset. The images were processed through pre-trained networks with the last layer removed to obtain the image embeddings in the form of a high-dimensional vector. Based on these embeddings, the distances between data points were calculated and the Ward linkage method was used to construct the hierarchical clusters.
The experiment focuses only on the first part of the methodology, i.e., image analysis by unsupervised learning techniques based on the transfer learning data. Training predictive models and assigning labels to the data are not part of the scope of this study, therefore the labels contained in the dataset were considered as those already assigned by the predictive model.
The experiment was divided into three parts, as follows:
- (i)
- Performance comparison of the pre-trained networks
- (ii)
- Assessment of the clustered data
- (iii)
- Analysis of the data from individual clusters using dimensionality reduction techniques
For our analysis needs, we used Orange [34], an open-source data mining toolbox in Python. It offers a collection of machine learning and data visualisation tools that allow users to perform various data analysis tasks. The toolbox supports workflow building by connecting various widgets for data preparation, data analysis, and visualisation. Specifically, in our analysis of concrete crack image data, the workflow was constructed by connecting widgets for image embedding, distance calculation, hierarchical clustering, and t-SNE dimensionality reduction.
Images for the experiment were obtained from the SDNET2018 dataset. SDNET2018 is a publicly available dataset that contains 56,000 labelled images of cracked and non-cracked concrete surfaces, including various artefacts such as shadows, imperfections, edges, holes, surface roughness, and background debris. The dataset provides a diverse selection of concrete surfaces from three different sources: bridge decks, walls, and pavements. The resolution of the images was 256 × 256 pixels and had three channels—red, green, and blue (RGB) [35].
3.1. Comparison of Pre-Trained Networks
In the first part of the experiment, we compared the performance of three pre-trained networks: VGG-16, VGG-19, and Inception v3. The goal of the comparison was to find out from which network the extracted features provided the highest separation of data with clustering. This was measured by how the classes of images were distributed among the clusters, specifically by the label ratio of the images within each cluster, assuming a cluster can only belong to one of the two classes.
The comparison was performed separately for each source of concrete images (bridge decks, pavements, and walls). From each subset, 4000 randomly sampled images were selected containing an equal number of images with and without cracks. This was performed to avoid bias due to a class imbalance [36]. In addition, two analyses were conducted, one with the 20 largest clusters (Table 1) and one with clusters below 5% of the total height of the dendrogram (Table 2). In this way, the separability with a smaller and a higher number of clusters was measured.

Table 1.
Comparison of pre-trained networks in cluster classification with the top 20 clusters.

Table 2.
Comparison of pre-trained networks in cluster classification with the clusters below 5% height ratio.
For a comparison of the pre-trained networks, binary classification metrics were considered. More specifically, accuracy, precision, recall, and F1-score were used. These metrics were calculated based on the ratio of True Positives (TP), False Positives (FP), True Negatives (TN), and False Negatives (FN) given by Equations (1)–(4). In addition, the area under the Receiver Operating Characteristic Curve (AUC) was calculated, which indicates how well the classifier can distinguish between the two classes.
Based on the results obtained, it can be concluded that Inception v3 had the highest performance across all categories among the three pre-trained networks considered. Therefore, Inception v3 was used in the subsequent experiments to obtain image embeddings.
3.2. Assessment of the Clustered Data
In this section, the clustered data is analysed to identify the content of each cluster. Focusing on the images within the clusters allows for efficient evaluation of the clustering results, since smaller groups of images, i.e., clusters, are examined rather than the entire dataset. When labelled data is considered, the ratio of the two classes of images can be helpful in the evaluation. The results presented here are from the subset of bridge decks only, which contains 13,620 images, of which 2025 are labelled as cracked and 11,595 are labelled as non-cracked.
The clustered data can be used to identify clusters that contain either class, as well as clusters that contain various anomalies present in the dataset. Anomalies such as obstructions, background debris, surface roughness, and similar artefacts. In most cases, the clusters have a strong separation of the data based on the given labels. An example is given in Figure 6, which contains non-cracked images of varying complexity, such as images with anomalies (Figure 6a), ground images (Figure 6b), or images of uncracked concrete (Figure 6c). Similarly, images of cracked concrete can also be found, divided into different clusters depending on their size, i.e., clusters with very wide cracks (Figure 7a) to clusters with narrow cracks (Figure 7c).
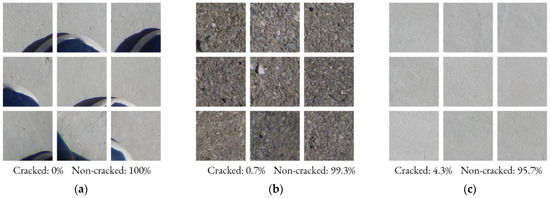
Figure 6.
Clusters of high separation containing non-cracked concrete images: (a) obstruction image cluster; (b) ground image cluster; (c) uncracked concrete image cluster.
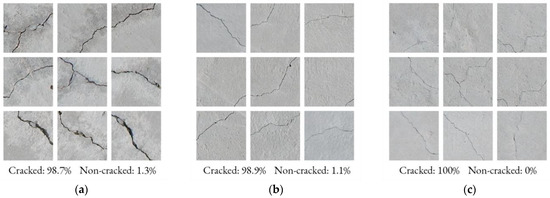
Figure 7.
Clusters of high separation containing cracked concrete images: (a) wide cracks image cluster; (b) medium cracks image cluster; (c) narrow cracks image cluster.
However, there are also clusters with low separation based on the two classes. This is the case for images that contain very small and narrow cracks (Figure 8c) or where artefacts dominate (Figure 8a). In the latter cases, clustering may not be able to distinguish between the two classes, as such images share a high similarity, regardless of if they contain cracks or not.
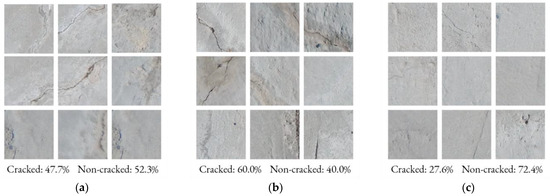
Figure 8.
Clusters of low separation containing both cracked and non-cracked concrete images: (a) noisy surface image cluster; (b) surface roughness image cluster; (c) very narrow cracks and surface imperfections image cluster.
Nevertheless, analysis of the clustered data provides valuable insight into the characteristics of the datasets and allows for a more in-depth understanding of the results. Through clustering, additional labels can be added to the images to distinguish various characteristics, such as what anomalies they contain or the sizes of the cracks. Additionally, the dataset can be cleaned of obvious non-cracked images before applying predictive models. This can provide valuable information for building more accurate predictive models and improving the overall performance of the image classification process.
3.3. Analysis of the Data from Individual Clusters
To further analyse the clustering results, dimensionality reduction techniques were applied to individual clusters. For this purpose, the high-dimensional vector of embedded data was transformed to two principal components using PCA. Next, t-SNE was applied with a perplexity of 100 and without exaggeration to visualise the structure of the data in a 2-D scatter plot. This can be used to find possible misclassified images or additional correlations between image features and their position in the plot.
In the scatter plot, any outliers or individual data points among points from the other class were inspected. Through this process, several possibly mislabelled images were found. As can be seen in Figure 9, some of these were images that were labelled as non-cracked but had visible cracks (a), and others that were labelled as cracked but had shadows or other distortions from small holes (b) or bumps (c) on the surface upon closer inspection. It is important to note that not all such apparent data points are mislabelled. Some still share a high similarity, cracks or no cracks, due to other prevailing markers. However, visualising data from smaller subsets (clusters) makes it easier to examine them and determine their characteristics.
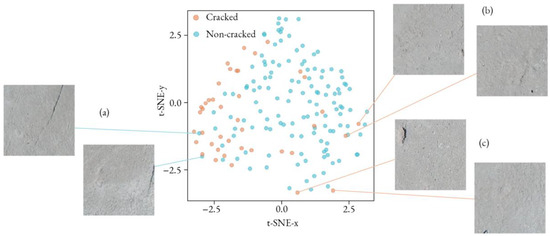
Figure 9.
t-SNE scatter plot visualising image data from a cluster and possibly mislabelled images.
Visualising the images on the scatter plot also allows correlations to be found between the coordinates and the image characteristics. Considering a larger cluster containing images of cracked concrete, certain relationships were noted. In particular, it was observed that the size of the cracks increases with the y-coordinate, while the x-direction indicates the extent of surface imperfection and roughness, as shown in Figure 10.
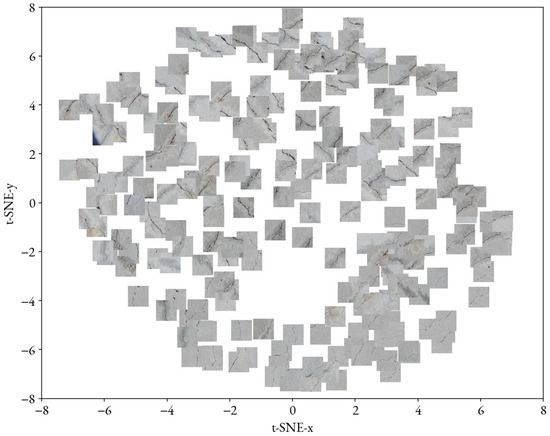
Figure 10.
t-SNE scatter plot visualising images from a cluster with possible correlations to the coordinates.
4. Discussion
Overall, the results of clustering show that it is possible to separate images into distinct clusters. This was achieved based only on their characteristics, without the need for labelled data. For this purpose, three pre-trained networks were used for feature extraction and clustering, with Inception v3 achieving the highest performance. The clustering was able to distinguish cracked and non-cracked concrete images as well as various anomalies present in the dataset. Anomalies such as obstruction, background debris, edges, and surface roughness. Additionally, through the use of dimensionality reduction techniques, it was shown that several potentially mislabelled images were identified in the dataset.
However, clustering did not achieve the same performance as the established neural network models in classifying the two classes. This is because clustering struggles to distinguish between the two classes when anomalies dominate the image. In such cases, the clusters group these images regardless of whether cracks are present or not. This could be addressed by segmenting the images into smaller regions, which would increase their dissimilarity and improve the clustering. Nevertheless, the clustering analysis provides valuable information that can be used to clean the dataset of noisy images and obvious images without cracks.
5. Conclusions
In this study, an integrated methodology for crack image analysis based on transfer and unsupervised learning was proposed. The method extracts image features using pre-trained networks and groups them based on their similarity through clustering. Furthermore, dimensionality reduction was used to further separate and visualise the data, facilitating an analysis of the clustering results and identification of mismatched images.
The results of this study demonstrate the potential of the proposed approach for analysing concrete crack image data by integrating transfer and unsupervised learning. Several use cases can be identified from this work:
- Clustering can be used to identify noisy images and clean them from large datasets.
- Clustering can also be used to divide images of cracked concrete into multiple groups according to their severity.
- Dimensionality reduction can be used to visualise the classification results and identify misclassified images.
- Dimensionality reduction can be used to extract the most important features from the clustered images and correlate them with their real-world properties.
In addition, this study provides an alternative method for concrete crack detection that does not require training or training data. However, there is an opportunity to combine this approach with supervised techniques to further extend existing methods. Based on the results of this study, several directions for future research can be recommended:
- By analysing the contents of the clusters, additional labels can be assigned to the data, which can be used to train and extend existing models.
- Using this approach, misclassified or mislabelled images can be identified. This enables the detection and correction of errors in the learning process, leading to improved image classification performance.
- Segmenting images into smaller sections to avoid the prevalence of artefacts can lead to better performance in detecting cracked and non-cracked concrete.
Author Contributions
Conceptualization, L.G. and M.D.; methodology, L.G.; investigation, L.G.; resources, M.D.; data curation, L.G.; writing—original draft preparation, L.G.; writing—review and editing, M.D.; supervision, M.D. All authors have read and agreed to the published version of the manuscript.
Funding
This research was supported by the Slovenian Research Agency under the Young Researcher funding program.
Institutional Review Board Statement
Not applicable.
Informed Consent Statement
Not applicable.
Data Availability Statement
The data presented in this study are openly available in SDNET2018 at https://doi.org/10.15142/T3TD19.
Conflicts of Interest
The authors declare no conflict of interest.
References
- Zhao, Z.; Zheng, P.; Xu, S.; Wu, X. Object Detection with Deep Learning: A Review. IEEE Trans. Neural Netw. Learn. Syst. 2019, 99, 1–21. [Google Scholar] [CrossRef]
- Zhou, S.; Canchilam, C.; Song, W. Deep learning-based crack segmentation for civil infrastructure: Data types, architectures, and benchmarked performance. Autom. Constr. 2023, 146, 104678. [Google Scholar] [CrossRef]
- Dorafshan, S.; Thomas, T.J.; Maguire, M. Comparison of deep convolutional neural networks and edge detectors for image-based crack detection in concrete. Constr. Build. Mater. 2018, 186, 1031–1045. [Google Scholar] [CrossRef]
- Debroy, S.; Sil, A. An apposite transfer-learned DCNN model for prediction of structural surface cracks under optimal threshold for class-imbalanced data. J. Build. Rehabil. 2022, 7, 18. [Google Scholar] [CrossRef]
- Ali, L.; Alnajjar, F.; Jassmi, H.A.; Gocho, M.; Khan, W.; Serhani, M.A. Performance Evaluation of Deep CNN-Based Crack Detection and Localization Techniques for Concrete Structures. Sensors 2021, 21, 1688. [Google Scholar] [CrossRef]
- Silva, W.R.L.d.; Lucena, D.S.d. Concrete Cracks Detection Based on Deep Learning Image Classification. Proceedings 2018, 2, 489. [Google Scholar] [CrossRef]
- Zaidi, S.S.; Ansari, M.S.; Aslam, A.; Kanwal, N.; Asghar, M.; Lee, B. A Survey of Modern Deep Learning Based Object Detection Models. Digit. Signal Process. 2022, 126, 103514. [Google Scholar] [CrossRef]
- Deng, J.; Dong, W.; Socher, R.; Li, L.-J.; Li, K.; Fei-Fei, L. ImageNet: A Large-Scale Hierarchical Image Database. In Proceedings of the IEEE Conference on Computer Vision and Pattern Recognition, Miami, FL, USA, 22–24 June 2009; pp. 248–255. [Google Scholar]
- Pan, S.J.; Yang, Q. A Survey on Transfer Learning. IEEE Trans. Knowl. Data Eng. 2010, 22, 1345–1359. [Google Scholar] [CrossRef]
- Golding, V.P.; Gharineiat, Z.; Munawar, H.S.; Ullah, F. Crack Detection in Concrete Structures Using Deep Learning. Sustainability 2022, 14, 8117. [Google Scholar] [CrossRef]
- Yu, Y.; Samali, B.; Rashidi, M.; Mohammadi, M.; Nguyen, T.N.; Zhang, G. Vision-Based Concrete Crack Detection Using a Hybrid Framework Considering Noise Effect. J. Build. Eng. 2022, 61, 105246. [Google Scholar] [CrossRef]
- Su, C.; Wang, W. Concrete Cracks Detection Using Convolutional Neural Network Based on Transfer Learning. Math. Probl. Eng. 2020, 2020, 7240129. [Google Scholar] [CrossRef]
- Yang, Q.; Shi, W.; Chen, J.; Lin, W. Deep Convolution Neural Network-Based Transfer Learning Method for Civil Infrastructure Crack Detection. Autom. Constr. 2020, 116, 103199. [Google Scholar] [CrossRef]
- Islam, M.M.; Hossain, M.B.; Akhtar, M.N.; Moni, M.A.; Hasan, K.F. CNN Based on Transfer Learning Models Using Data Augmentation and Transformation for Detection of Concrete Crack. Algorithms 2022, 15, 287. [Google Scholar] [CrossRef]
- Ali, R.; Chuah, J.H.; Talip, M.S.; Mokhtar, N.; Shoaib, M.A. Structural Crack Detection Using Deep Convolutional Neural Networks. Autom. Constr. 2022, 133, 103989. [Google Scholar] [CrossRef]
- Li, S.; Zhao, X. Image-Based Concrete Crack Detection Using Convolutional Neural Network and Exhaustive Search Technique. Adv. Civ. Eng. 2019, 2019, 12. [Google Scholar] [CrossRef]
- Cohn, R.; Holm, E. Unsupervised Machine Learning Via Transfer Learning and k-Means Clustering to Classify Materials Image Data. Integr. Mater. Manuf. Innov. 2021, 10, 231–244. [Google Scholar] [CrossRef]
- Gairola, S.; Shah, R.; Narayanan, P.J. Unsupervised Image Style Embeddings for Retrieval and Recognition Tasks. In Proceedings of the IEEE Winter Conference on Applications of Computer Vision, Snowmass, CO, USA, 1–5 March 2020; pp. 3270–3278. [Google Scholar]
- Ji, X.; Vedaldi, A.; Henriques, J. Invariant Information Clustering for Unsupervised Image Classification and Segmentation. In Proceedings of the IEEE/CVF International Conference on Computer Vision, Seoul, Republic of Korea, 27 October–2 November 2019; pp. 9864–9873. [Google Scholar]
- Tuia, D.; Camps-Valls, G. Semisupervised Remote Sensing Image Classification with Cluster Kernels. IEEE Geosci. Remote. Sens. Lett. 2009, 6, 224–228. [Google Scholar] [CrossRef]
- Clancy, T.C.; Khawar, A.; Newman, T.R. Robust Signal Classification Using Unsupervised Learning. IEEE Trans. Wirel. Commun. 2011, 10, 1289–1299. [Google Scholar] [CrossRef]
- Noh, Y.; Koo, D.; Kang, Y.-M.; Park, D.; Lee, D. Automatic Crack Detection on Concrete Images Using Segmentation via Fuzzy c-Means Clustering. In Proceedings of the 2017 International Conference on Applied System Innovation (ICASI), Sapporo, Japan, 13–17 May 2017; p. 877. [Google Scholar]
- Schmarje, L.; Santarossa, M.; Schroder, S.-M.; Koch, R. A Survey on Semi-, Self- and Unsupervised Learning for Image Classification. IEEE Access 2021, 9, 82146–82168. [Google Scholar] [CrossRef]
- Asif, S.; Zhao, M.; Tang, F.; Zhu, Y. A deep learning-based framework for detecting COVID-19 patients using chest X-rays. Multimed. Syst. 2022, 28, 1495–1513. [Google Scholar] [CrossRef]
- Shaha, M.; Pawar, M. Transfer Learning for Image Classification. In Proceedings of the Second International Conference on Electronics, Communication and Aerospace Technology, Coimbatore, India, 29–31 March 2018; pp. 656–660. [Google Scholar] [CrossRef]
- Akata, Z.; Perronnin, F.; Harchaoui, Z.; Schmid, C. Label-Embedding for Image Classification. IEEE Trans. Pattern Anal. Mach. Intell. 2016, 38, 1425–1438. [Google Scholar] [CrossRef] [PubMed]
- Wu, C.; Manmatha, R.; Smola, A.J.; Krähenbühl, P. Sampling Matters in Deep Embedding Learning. In Proceedings of the IEEE International Conference on Computer Vision, Venice, Italy, 22–29 October 2017; pp. 2859–2867. [Google Scholar] [CrossRef]
- Russakovsky, O.; Deng, J.; Su, H.; Krause, J.; Satheesh, S.; Ma, S.; Huang, Z.; Karpathy, A.; Khosla, A.; Bernstein, M.; et al. ImageNet Large Scale Visual Recognition Challenge. Int. J. Comput. Vis. 2015, 115, 211–252. [Google Scholar] [CrossRef]
- Liu, S.; Deng, W. Very deep convolutional neural network based image classification using small training sample size. In Proceedings of the 3rd IAPR Asian Conference on Pattern Recognition, Kuala Lumpur, Malaysia, 3–6 November 2015; pp. 730–734. [Google Scholar]
- Szegedy, C.; Vanhoucke, V.; Ioffe, S.; Shlens, J.; Wojna, Z. Rethinking the Inception Architecture for Computer Vision. In Proceedings of the IEEE Conference on Computer Vision and Pattern Recognition, Las Vegas, NV, USA, 27–30 June 2016; pp. 2818–2826. [Google Scholar]
- Witten, I.H.; Frank, E.; Hall, M.A. Data Mining: Practical Machine Learning Tools and Techniques, 2nd ed.; Morgan Kaufmann: San Francisco, CA, USA, 2005; p. 664. [Google Scholar]
- Murtagh, F.; Legendre, P. Ward’s Hierarchical Agglomerative Clustering Method: Which Algorithms Implement Ward’s Criterion? J. Classif. 2014, 31, 274–295. [Google Scholar] [CrossRef]
- Zhao, B.; Dong, X.; Guo, Y.; Jia, X.; Huang, Y. PCA Dimensionality Reduction Method for Image Classification. Neural Process Lett. 2022, 54, 347–368. [Google Scholar] [CrossRef]
- Demsar, J.; Curk, T.; Erjavec, A.; Gorup, C.; Hocevar, T.; Milutinovic, M.; Zupan, B. Orange: Data Mining Toolbox in Python. J. Mach. Learn. Res. 2013, 14, 2349–2353. [Google Scholar]
- Maguire, M.; Dorafshan, S.; Thomas, R.J. SDNET2018: A Concrete Crack Image Dataset for Machine Learning Applications; Utah State University: Logan, UT, USA, 2018. [Google Scholar] [CrossRef]
- Luque, A.; Carrasco, A.; Martín, A.; de las Heras, A. The impact of class imbalance in classification performance metrics based on the binary confusion matrix. Pattern Recognit. 2019, 91, 216–231. [Google Scholar] [CrossRef]
Disclaimer/Publisher’s Note: The statements, opinions and data contained in all publications are solely those of the individual author(s) and contributor(s) and not of MDPI and/or the editor(s). MDPI and/or the editor(s) disclaim responsibility for any injury to people or property resulting from any ideas, methods, instructions or products referred to in the content. |
© 2023 by the authors. Licensee MDPI, Basel, Switzerland. This article is an open access article distributed under the terms and conditions of the Creative Commons Attribution (CC BY) license (https://creativecommons.org/licenses/by/4.0/).