Article

Wave Energy Convertor for Bilateral Offshore Wave Flows: A Computational Fluid Dynamics (CFD) Study

by
A. H. Samitha Weerakoon
1,*,
Young-Ho Lee
2 and
Mohsen Assadi
1
1
Faculty of Science and Technology, University of Stavanger, 4021 Stavanger, Norway
2
Division of Mechanical Engineering, Korea Maritime and Ocean University, 727, Taejong-ro, Yeongdo-gu, Busan 49112, Republic of Korea
*
Author to whom correspondence should be addressed.
Sustainability 2023, 15(9), 7152; https://doi.org/10.3390/su15097152
Submission received: 22 February 2023 / Revised: 20 April 2023 / Accepted: 21 April 2023 / Published: 25 April 2023
(This article belongs to the Special Issue Sustainable Integration of Renewable Power Generation Systems)

Abstract

:
Human activities have adversely affected the Earth’s habitable environment. Carbon emissions and other greenhouse gas emissions are the primary cause of climate change and ozone layer depletion. In addition, the exponential decay of fossil fuel resources has resulted in the rising demand for renewable and environmentally-friendly energy sources. Wave energy is the most consistent of all intermittent renewable energy sources and offers a promising solution to our energy needs. This study focuses on harnessing offshore wave energy resources, specifically targeting offshore conditions with the highest energy density. A novel direct drive cross-flow turbine with an improved augmentation channel shape was designed and analyzed using commercial computational fluid dynamics software. The turbine’s base model reached a maximum efficiency of 54.3%, with 33.4 kW of power output at 35 rev/min and a 3.0 m head. Bidirectional flow simulations were carried out, and the peak cyclic efficiency was recorded at 56.8% with a 36.4 kW average power output. The nozzle entry arc angle of 150 degrees was found to be the most efficient, and the numerical simulation’s fully developed solution computed the flow behavior through the runner and nozzle under steady-state conditions.

1. Introduction

The energy consumption of the modern world is increasing at an exponential rate, creating a high demand for energy. As a result, and due to the rapid depletion of fossil fuel sources, there is a growing need for systems that generate power from green and renewable energy sources. According to OPEC (Organization of the Petroleum Exporting Countries), the demand for fossil fuels has grown rapidly in recent decades and is expected to continue increasing, reaching an estimated usage of 1.3 million barrels per day in 2016 [1]. While wind and solar energy have been harnessed to provide energy to national power grids, the potential of ocean energy, another green energy source, is yet to be fully explored. The oceans cover more than 71% of the Earth’s surface and contain 97% of the Earth’s water [2]. While many countries have attempted to harness energy from the ocean, most remain unsuccessful due to a lack of experimental data and research in the ocean energy sector [3]. However, successful projects producing green and renewable wave energy have been developed, mainly focusing on the oscillating moment of ocean waters. Ocean Renewable energy is the term used for all marine renewable energy fields available to harness from the ocean waters [2,4]. The fundamental energy forms include potential energy, kinetic energy, thermal energy, and chemical energy of ocean water [4,5]. Ocean waves, tidal streams and tidal systems, oceanic currents, ocean salinity gradients, and ocean thermal gradients require different technological approaches to harness energy. The available useful energy from ocean energy sources can be converted into a useful form of power, such as electricity for the grid or hydrogen production [6]. Similar to wind and solar power, offshore wave power has the potential to play a valuable part in the energy transition.
This research focuses on designing a higher-efficiency cross-flow turbine to be utilized as a Wave Energy Conversion (WEC) Turbine. The CFT was originally developed as a hydro-turbine by the Australian engineer A.G.M Mitchell in 1903. In the original theoretical design and experimental results, the efficiency reached 80%. The popularity of the turbine increased due to its ability to be efficient at the low head with a wide range of flow. The cross-flow turbine mostly operates in the hydro industry due to its simple design and ease of manufacturing. In a CFT, a water jet of rectangular cross-section passes twice through the rotor blades, which are arranged at the periphery of the cylindrical rotor, perpendicular to the rotor shaft. Water flows through the blades from the periphery towards the center, then crosses the open space inside the runner from the inside outwards. Energy conversion occurs twice: first upon impingement of water on the blades upon entry and then when water strikes the blades upon exiting the runner. Ref. [7] studied the use of two working stages and found that it provides no advantage, except that it is a highly effective and simple means of discharging the water from the runner. The main parts of a typical CFT in its parametric form are illustrated in Figure 1 [8].
The dual water passing illustrates the turbomachinery velocity triangle (Figure 2). The design of the turbine becomes complex if in a 3D plane. In the first stage, the maximum amount of energy is transferred to the blades, comprising about 75% of the transfer energy, while the second stage imparts approximately 25% of energy to the blades [10]. One-Dimensional (1-D) Fluid Machinery theory is the basis for the construction of CTF.
Most studies aiming to improve the performance of the CFT have concentrated on optimizing its geometric design parameters, such as the number of blades, as well as the runner diameter, width, nozzle, and nozzle entry arc, using laboratory-based experiments [11]. Other studies focused on performance improvement with regard to the turbine flow profile (Masuda et al., 1987) [12]. When the efficiency of the turbine was compared with the flow rate of other turbine types in Figure 3, the CFT had a flatter efficiency curve. Constant efficiency can be expected regardless of flow rate fluctuations. Due to unidirectional rotational capability, most wave power convertors use pneumatic turbines such as a well turbine. However, CFTs are also competitive candidates for wave energy applications, possessing the same capability to maintain unidirectional rotation regardless of the flow direction. CFT was utilized as a WEC; Y-H Lee et al. 2010 [11] and several other researchers conducted numerical and experimental studies to increase the turbine efficiency as a wave energy convertor in many cases [4,5,12,13,14,15,16,17,18,19]. A similar experimental and numerical study conducted by Korean researchers at KMOU increased the overall performance of CFT with a nozzle, improving the wave energy device efficiency by 5.49% [20]. The numerical study also proved that the augmentation channel shape is critical for operation, acting as a converging and diverging (vice versa) pathway for the fluid stream [14]. A more generalized method was adopted [15] for the turbine blade optimization process. An earlier study carried out by the same author proves “Banki–Michell Turbine” is a popular choice among researchers studying ocean renewable energy. The authors analyzed the above-mentioned studies and extended the literature survey further to meet the scope of the present study; a comprehensive, detailed list of previous research studies can be found in Appendix A. It is evident that most of the research work has been conducted for nearshore (regular) wave resources, which have lower wave heights and wave periods. The distinguishable disadvantage of regular nearshore waves is their significantly lower energy density compared to offshore waves. Appendix A contains the most recent global research (refer to Appendix A). Over 95% of the research provided in the table was biased toward regular wave conditions with significantly lower wave heights. The purpose was mainly to analyze the performance of a WEC device using numerical (CFD) or field-collected data (on-site wave data) under nearshore regions to analyze the behavior of a prescribed WEC system with key performance indicators (KPIs) such as structural, hydrodynamic or stability conditions. This is due to the short-term economic advantages of nearshore WEC projects. Nearshore wave energy analysis projects require a far smaller investment of time and monetary factors compared to offshore WEC projects. However, in terms of long-term energy profitability, the offshore WEC projects require an extended number of research studies to be carried out under different scenarios and compared to the nearshore WECs. This is a critical research gap, as fewer and fewer studies were conducted to explore offshore wave energy resource harnessing.
In addition to a suitable oceanographical location, the type of power take-off method used for WECs is important. It is difficult to assess the capability of CFT type as an offshore wave energy extracting device without a proper mathematical model based on numerical or experimental study results due to its technological novelty in offshore wave scenarios. By identifying this research gap between “CFT” and “offshore wave” resources, the present research focuses on developing a novel methodology for CFT to utilize as an offshore wave converter. It will be difficult to make accurate predictions, as the literature survey is limited to research findings for CFT working as an offshore wave energy converter. The authors present a comprehensive list summarizing previous studies’ merits, novelties and limitations, emphasizing the research questions the present research seeks to address. Moreover, none of the related listed research studies under different methodologies address methods of offshore wave resource harnessing. The present study is primarily based on the linear analysis and inviscid flow assumption method used to analyze the performance of the CFT behavior under offshore wave conditions.

Objectives of the Study

  • To analyze the modified CFT design’s ability to harness offshore wave energy resources effectively with a higher energy density environment.
  • To conduct research on the performance of an augmented channel cross-flow turbine with considerably higher significant wave heights and wave periods in offshore conditions.
  • To design and optimize a geographical location data-specific cross-flow-type turbine and enhance its performance using Commercial CFD code.
  • To evaluate the flow field: pressure and velocity variation of the turbine in a range of efficiency conditions.
  • To study the effect of nozzle shape and preliminary turbine design on the performance of the turbine efficiency when operating under bidirectional conditions.

2. Materials and Methods

2.1. Offshore Wave Site Specification and Selection

The methodology initiated by the annual average capture width and power absorption of a turbine at a specific site is located. It involves extrapolating data from the available results and using power matrices to estimate the power absorption at different sea states. JONSWAP (Scheme 1) spectral analysis is also used to synthesize power matrices for irregular wave data. The study is based on a higher wave energy-dense site, and the design of the turbine unit is assessed based on the existing wave data extracted specifically for this case study, Ref. Table 1 data. Figure 4a,b provides visual representations of the methodology and energy matrix for the specified model.
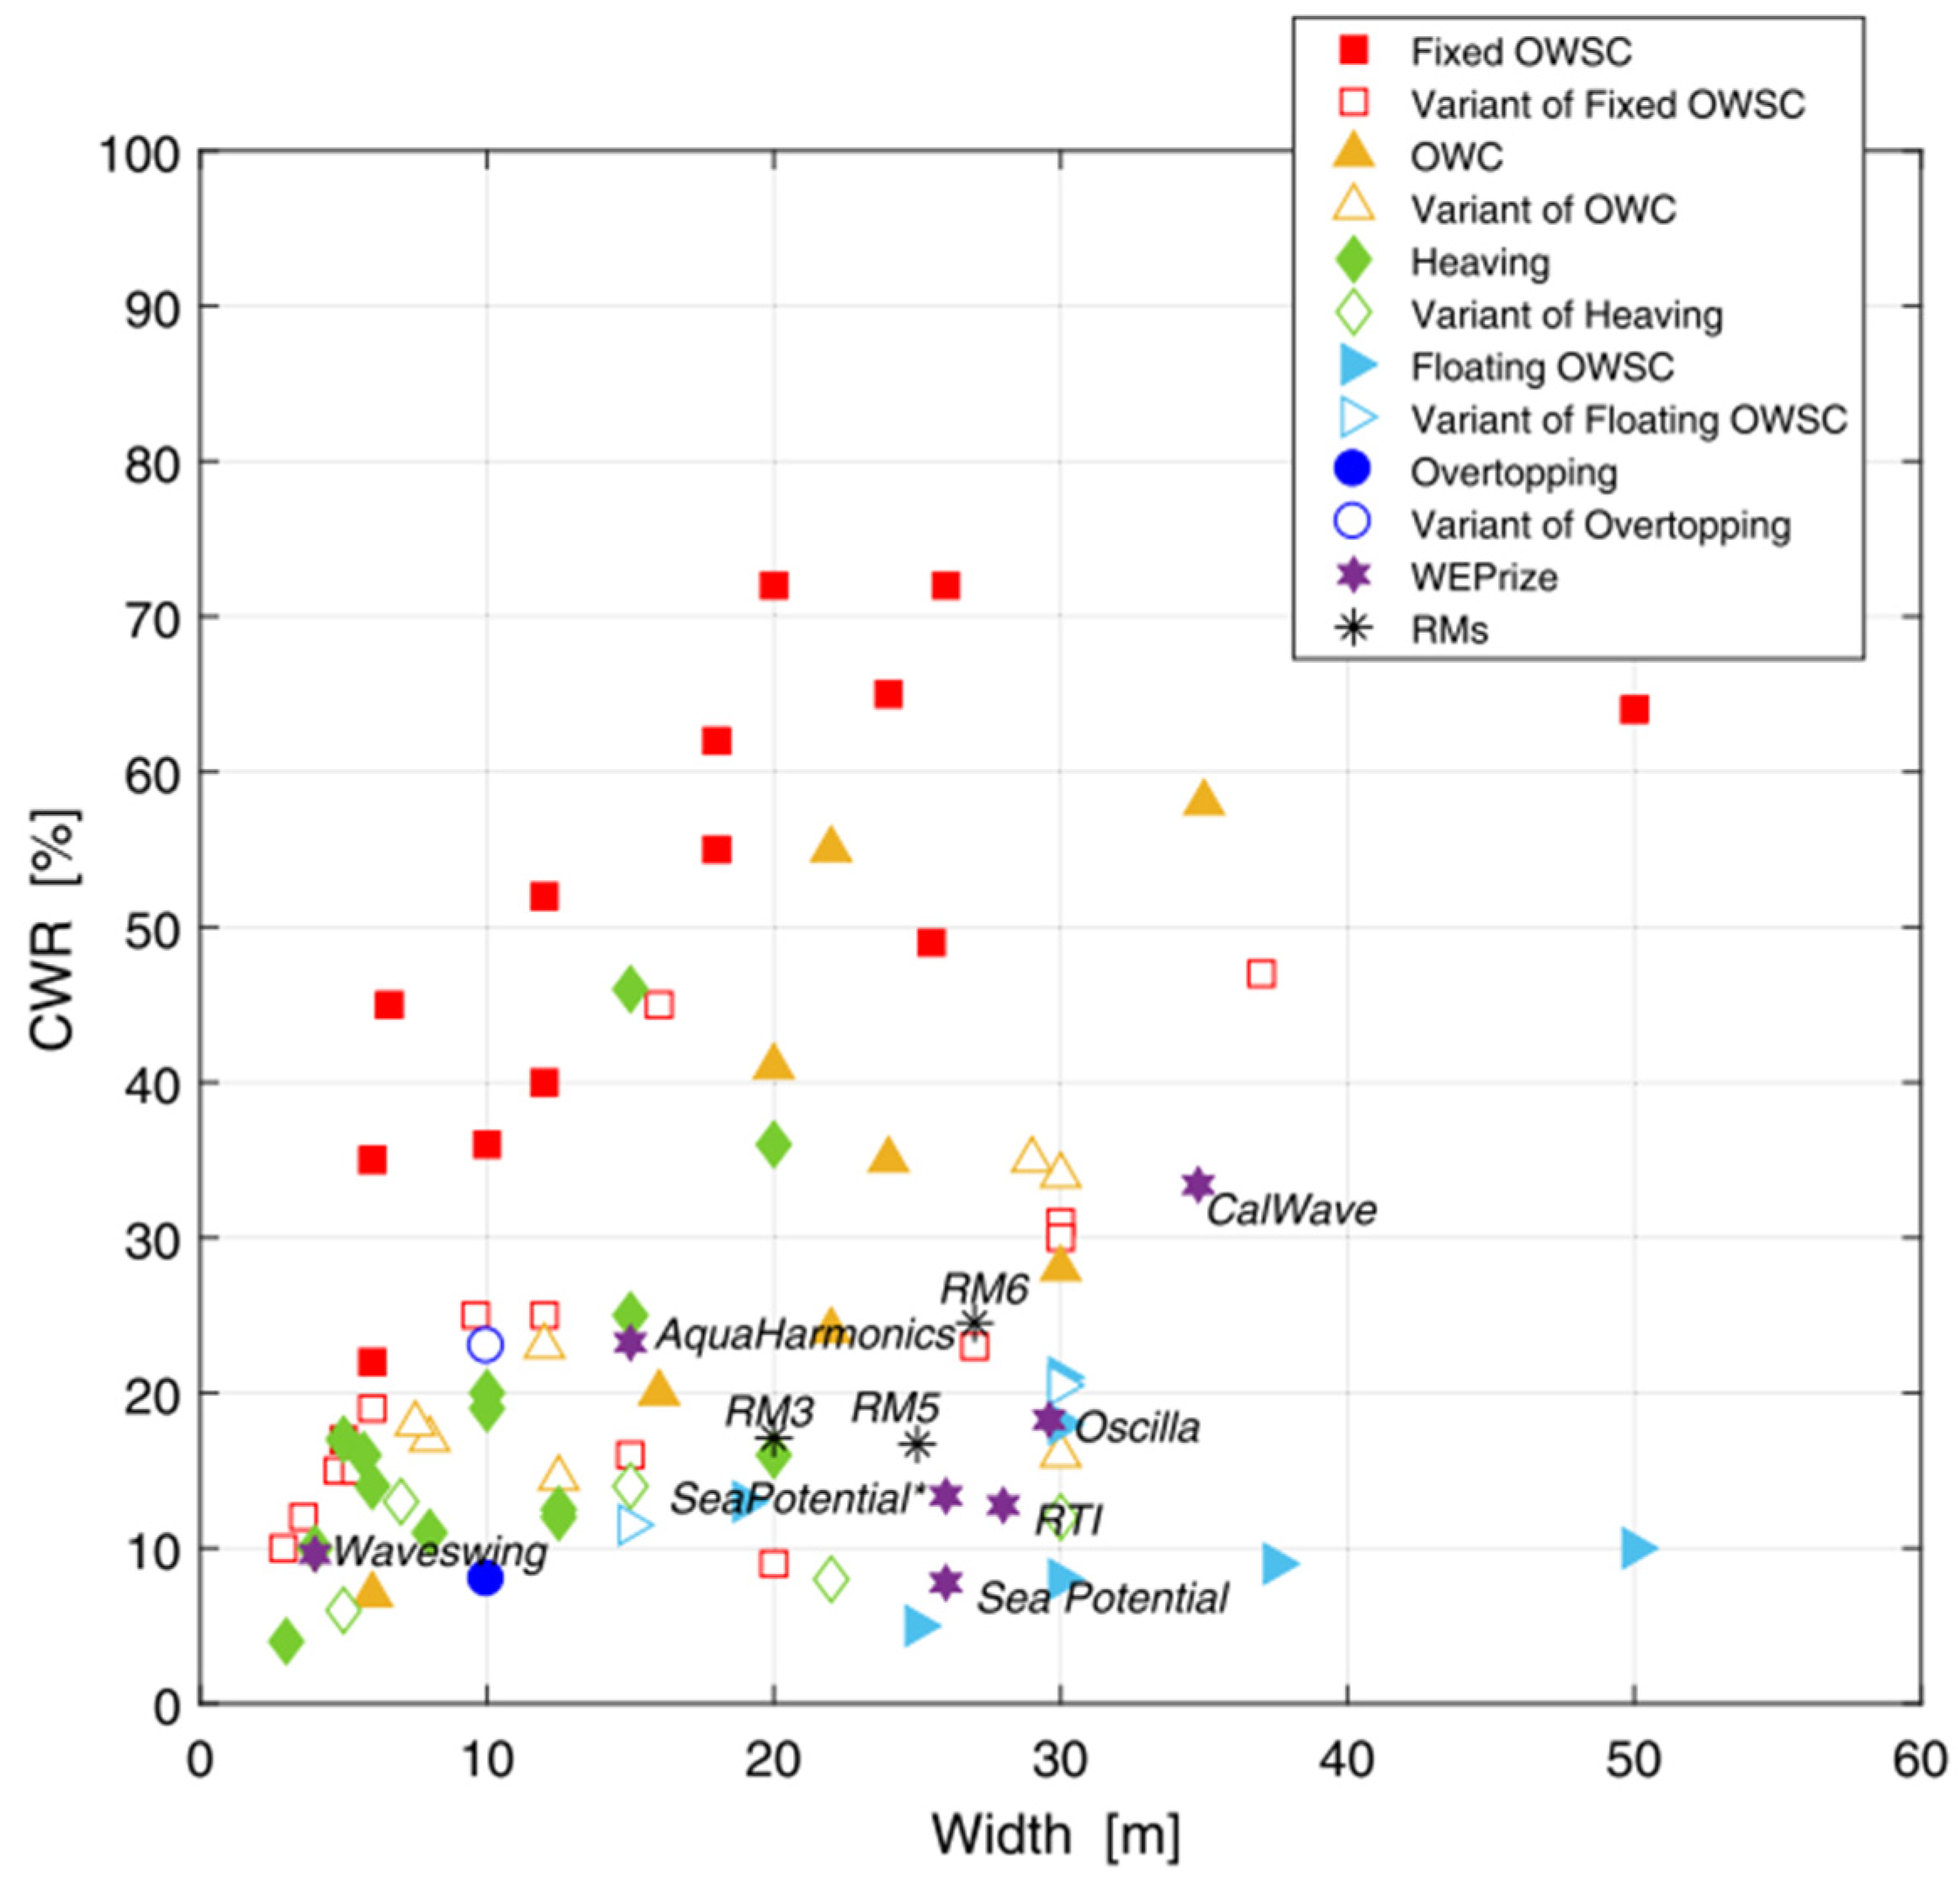
The initial estimation of the wave forces exerted on the turbine is generally measured as the capture width factor. Only a few data sources present the annual average capture width and wave resource. In some instances, it is necessary to extrapolate available results to estimate the Capture Width Ratio (CWR). The methodology is illustrated in Figure 4a. In some of the sources, power matrices are provided. In these cases, estimates of the annual average capture width at different locations are obtained. For this method, multiplying scatter diagram data with power matrices and summing the power contributions from each sea state generate the outcomes. In the work of Ref. A. Babarit et al. [22] site-specific data are extracted to maximize the capture factor for the estimated width/span of the turbine. The linear interpolation method was not used, as the bins of the power matrix chosen to match the given design criteria, the scatter diagram, were not required in this study.
In real-world applications, data pertaining to the capture width or power absorption shall be extracted, provided only a minimal number of sea conditions are assumed. In this study, an estimation of the power matrix was carried out according to Ref. [23]. Initially, we assumed that the wave power absorption was achieved by sea states with a peak wave period of fewer than 5 s or higher than 13 s. This allowed the study to use the linear interpolation method to extract power absorption as a function of the peak wave period. The power matrix combined with the JONSWAP (Scheme 1) spectral analyses for irregular wave data synthetized the power matrix. The design of the turbine unit for assessment was based on a specifically chosen higher wave energy denser site, using the existing data of G. Iglesias et al. [23]. In Figure 4a, a specified site is examined. The site detail energy matrix is illustrated in Figure 4b for the specification model.

Spectral Analysis

The wave Hs and the T(s) values were analyzed with the Joined North Sea Wave Analyzing Project or short-term “JONSWAP” spectrum. The author uses the site-specific data, utilizing the wave occurrence and the climate condition approximated study carried out by Erik Vanem, Norway [24]. This method involves a long-term series of sea states that are defined by the directional wave spectrum based on the calculation method adopted by Uk-Jae Lee et al. [25]. The spectrum data and analysis are described below. The results of the sea state data are illustrated in Table 1.
JONSWAP Spectrum: General not for fully developed sea states:
S ( ω ) = α g 2 ω 5 e x p [ 5 4 ( ω p ω ) 4 ] γ e x p [ ( ω ω p ) 2 2 σ 2 ω p 2 ]
with fully developed conditions, the spectrum can be analyzed as follows:
S J S ( f ) = 0.3125 H s 2 f p 4 f 5 e x p [ 1.25 ( f p f ) 4 ]   where   α = e x p [ ( f f p ) 2 2 σ 2 f p 2 ] S J S ( f ) = C ( γ ) S P M ( f ) γ α
Such that the calculation is performed using the following formation.
S J S ( f ) = 0.3125 H s 2 f p 4 f 5 e x p [ 1.25 ( f p f ) 4 ] ( 1 0.287 l n γ ) × γ e x p { 0.5 ( f f p 1 ) 2 σ }
The spectral density against the wave frequency had a narrow peak band, and the other dataset for that region, passing sea states five, six, seven, and eight, were analyzed. The results refer to Scheme 1.

2.2. Design Condition of Turbine

Figure 4b marks the highest energy bins with the highest occurrence of black circles. A significant wave height of 3.0 m and a corresponding wave period of 9.0 s were chosen for the simulation. Calculations were performed for a range of periods and adjacent wave heights of 2.0 m, 4.0 m, 5.0 m, and 6.0 m, with varying wave periods of 5.0 s, 7.0 s, 9.0 s, and 11.0 s. By adopting the preliminary design procedure, a summary of CFT design values was obtained. The relevant parameters are listed in the Table 2 and are considered for the base model of the analysis.
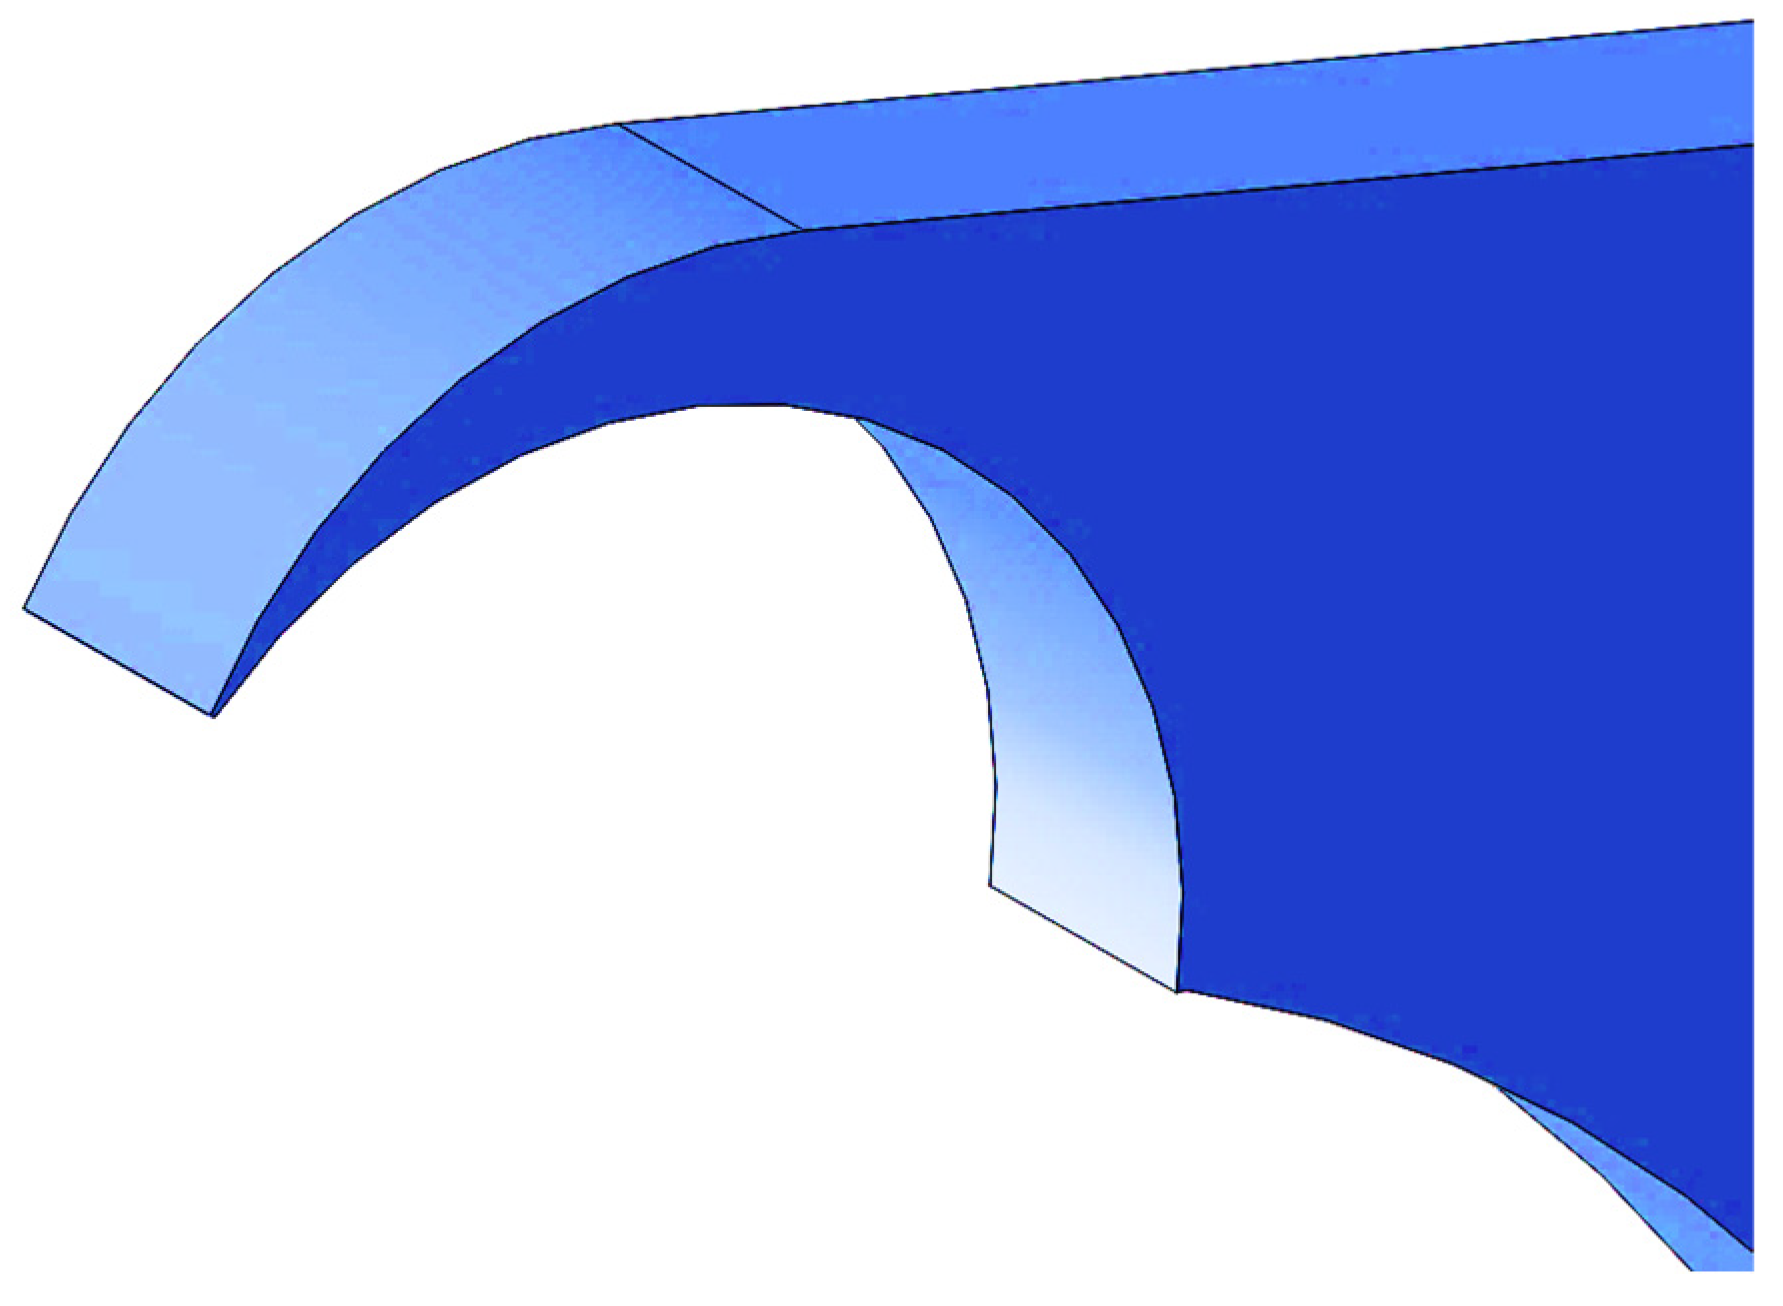
The CAD model for the turbine in the design dimensions was illustrated based on the derived parameters. Figure 5 illustrates the CAD model of the runner created for the test case. The nozzle shape was designed according to the shape optimization procedure involved. The relationship between the geometric functions allows for the smooth curve creation of the nozzle upper wall, as it becomes a convergence and divergence nozzle and vice versa. The nozzle is placed on the runner at the designed angle. The nozzle upper wall curvature is estimated to be tangent with the lower curve in Figure 6 [21] to satisfy the relationship between the ratios of λ/S0 in the optimal range, as shown in Figure 6. However, the bottom of the nozzle curvature shape was developed by the author based on the cross-flow turbine nozzle design experience obtained during the case study.
The turbine’s full span/width is 7.5 m, and the width or span is the primary factor in the energy capture factor for wave energy converters. The Capture Width Ratio (CWR) for a given wave energy device should be considered for a set width of the device. The CWR primarily measures the hydrodynamic efficiency for a given device in terms of energy but not in cost aspects, as demonstrated by the studies carried out by Ann Dallman et al. [22]. The device in this study aims to develop a novel CFT applicable to fixed-structure oscillating water column WECs. Referring to Figure 7, the turbine model examined in the present study reaches greater than 40% CWR.
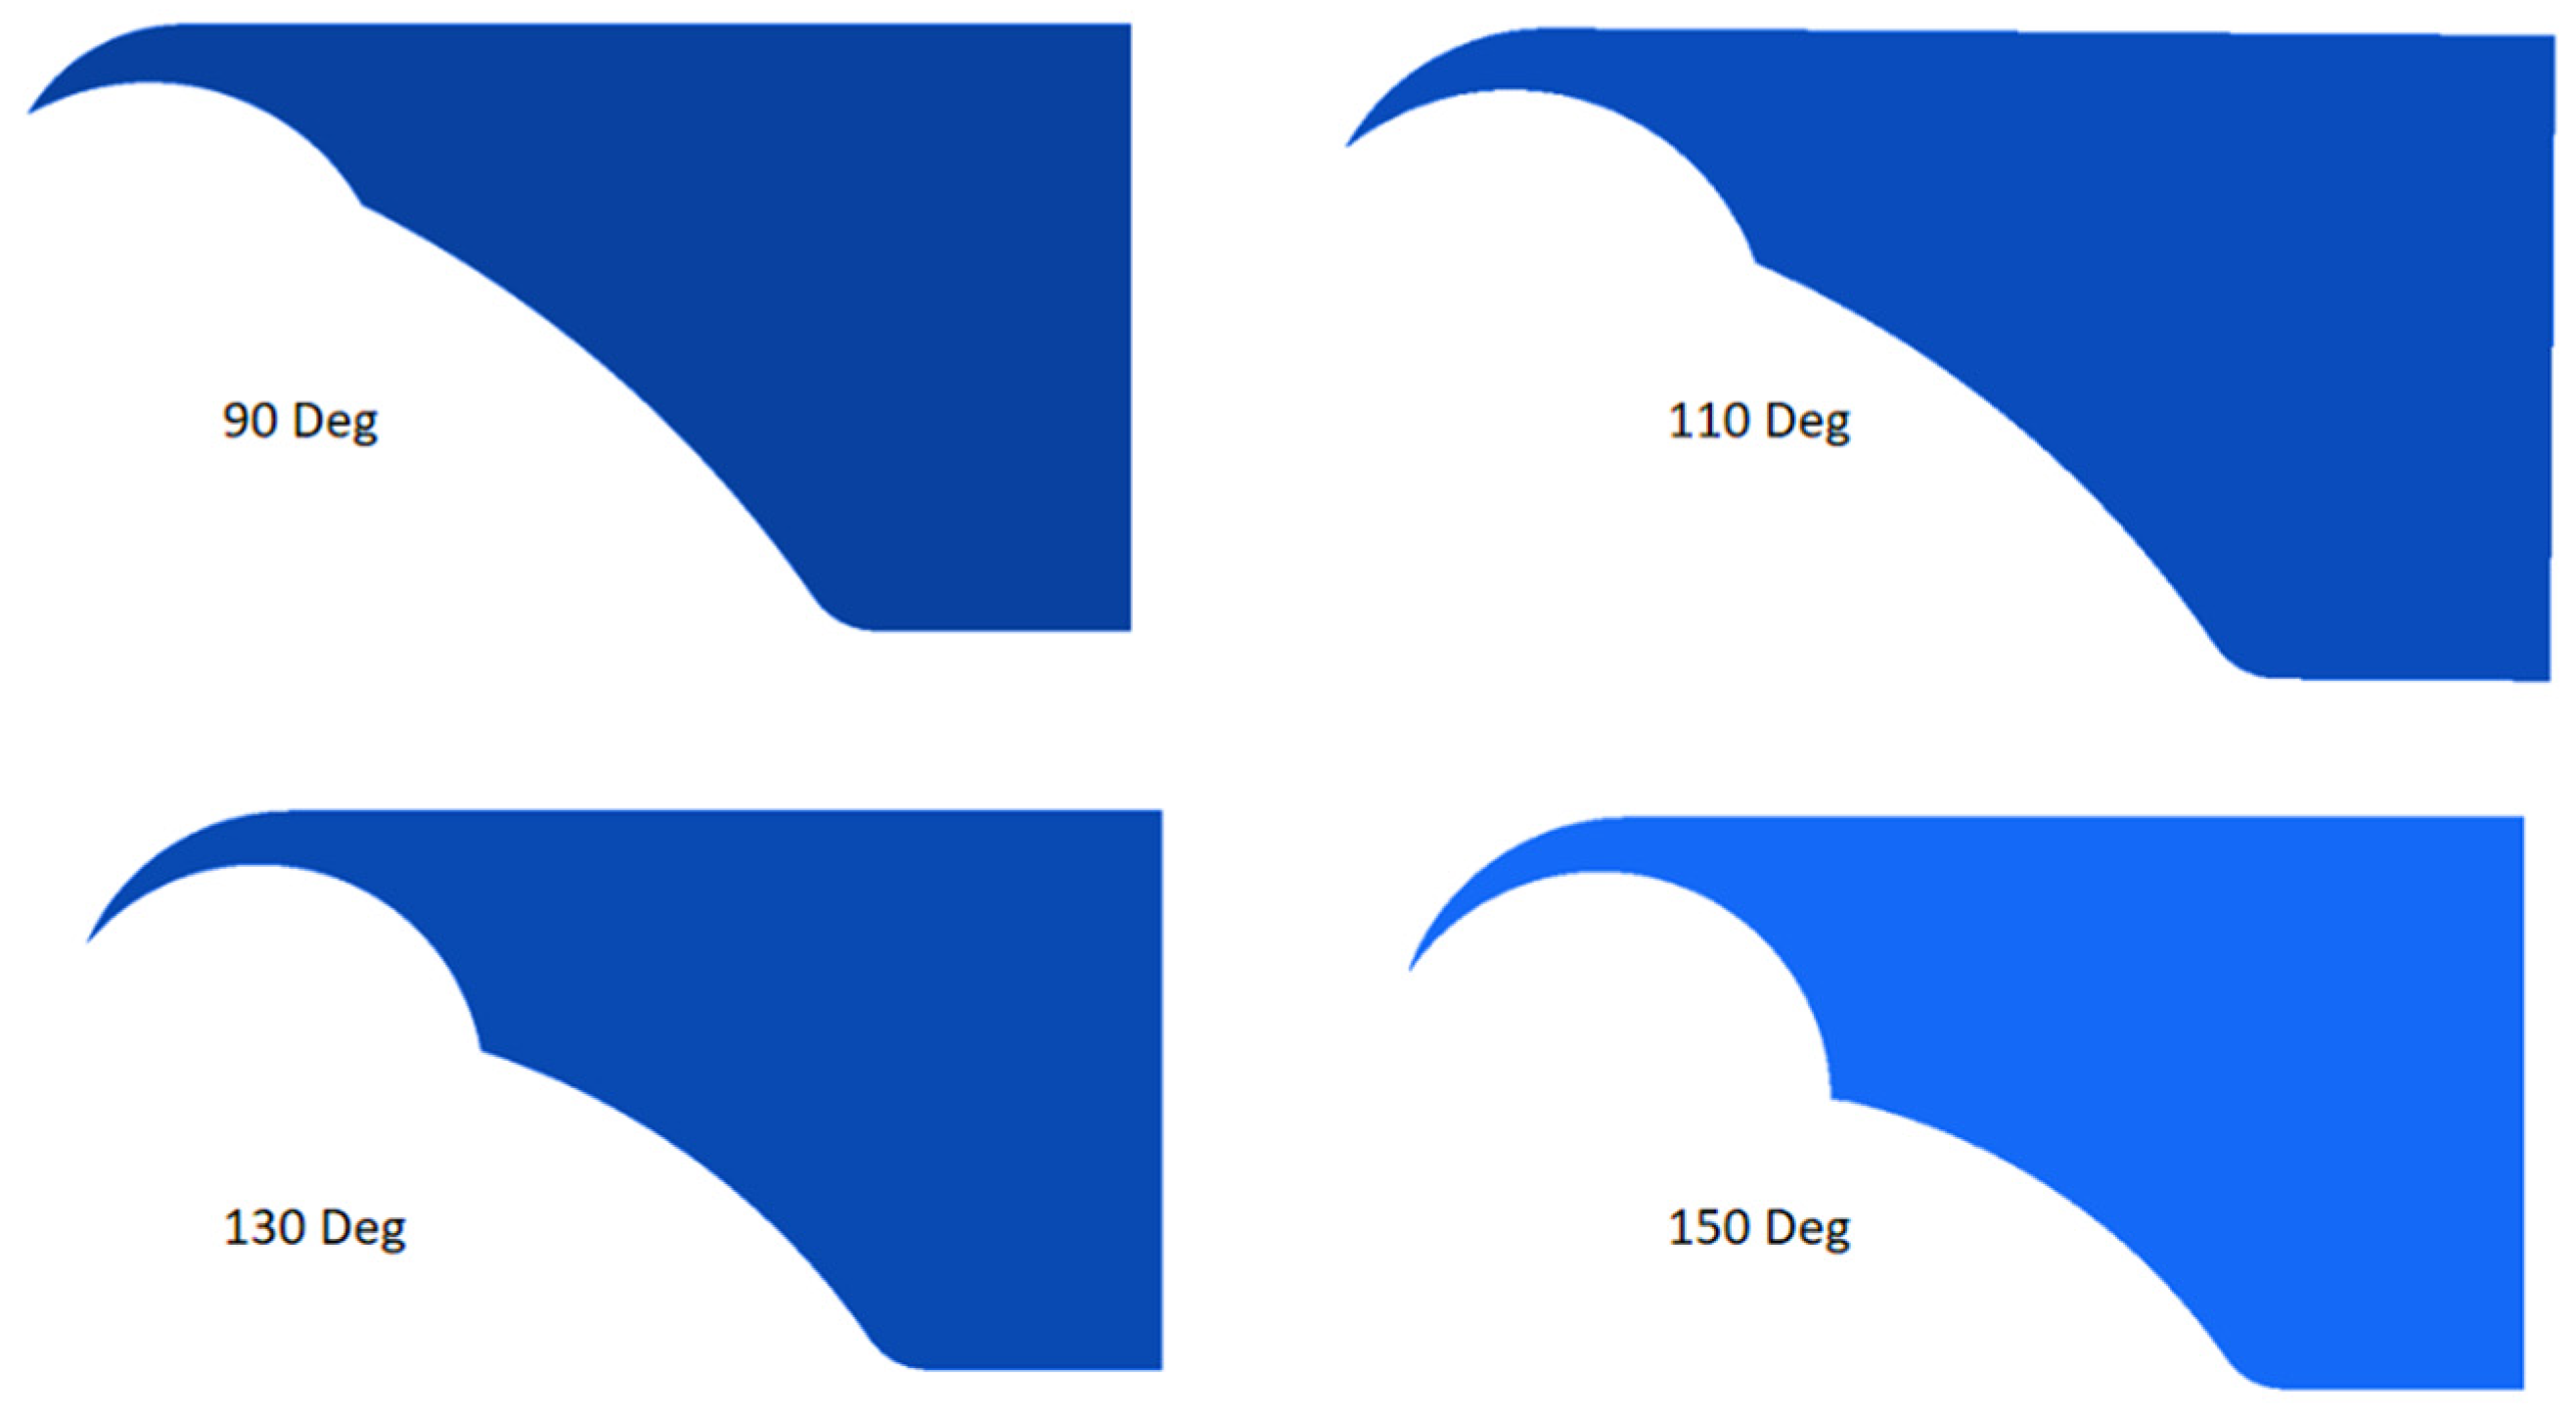
The base model was designed for the optimization process using the steady-state method of the commercial CFD code Ansys CFX® 17.2v. The numerical calculations were carried out for a turbine with a decreased length to reduce the computational cost and time. Transient (time-averaging) calculations were carried out with varying conditions to study the flow behavior inside the turbine runner and nozzle. Figure 8 illustrates the base model nozzle shape of the turbine, and Figure 9 illustrates the entire turbine with both nozzles fitted for bidirectional flow analysis. The upper nozzle entry arc angle will be altered in four cases, as 150 deg, 130 deg, 110 deg, and 90 deg nozzle entry arc angle variants. The most efficient nozzle shape will be considered for transient calculations as the geometrically optimized model.

Mesh Generation

The mesh for the full turbine setup was generated using Ansys ICEM CFD® 17.2v software, with a fully structured hexahedral mesh composed of 2.99 million elements. Our simulation focused on a 0.5 m strip along the length of the turbine, which required mesh refinement during optimization to ensure an appropriate mesh size.
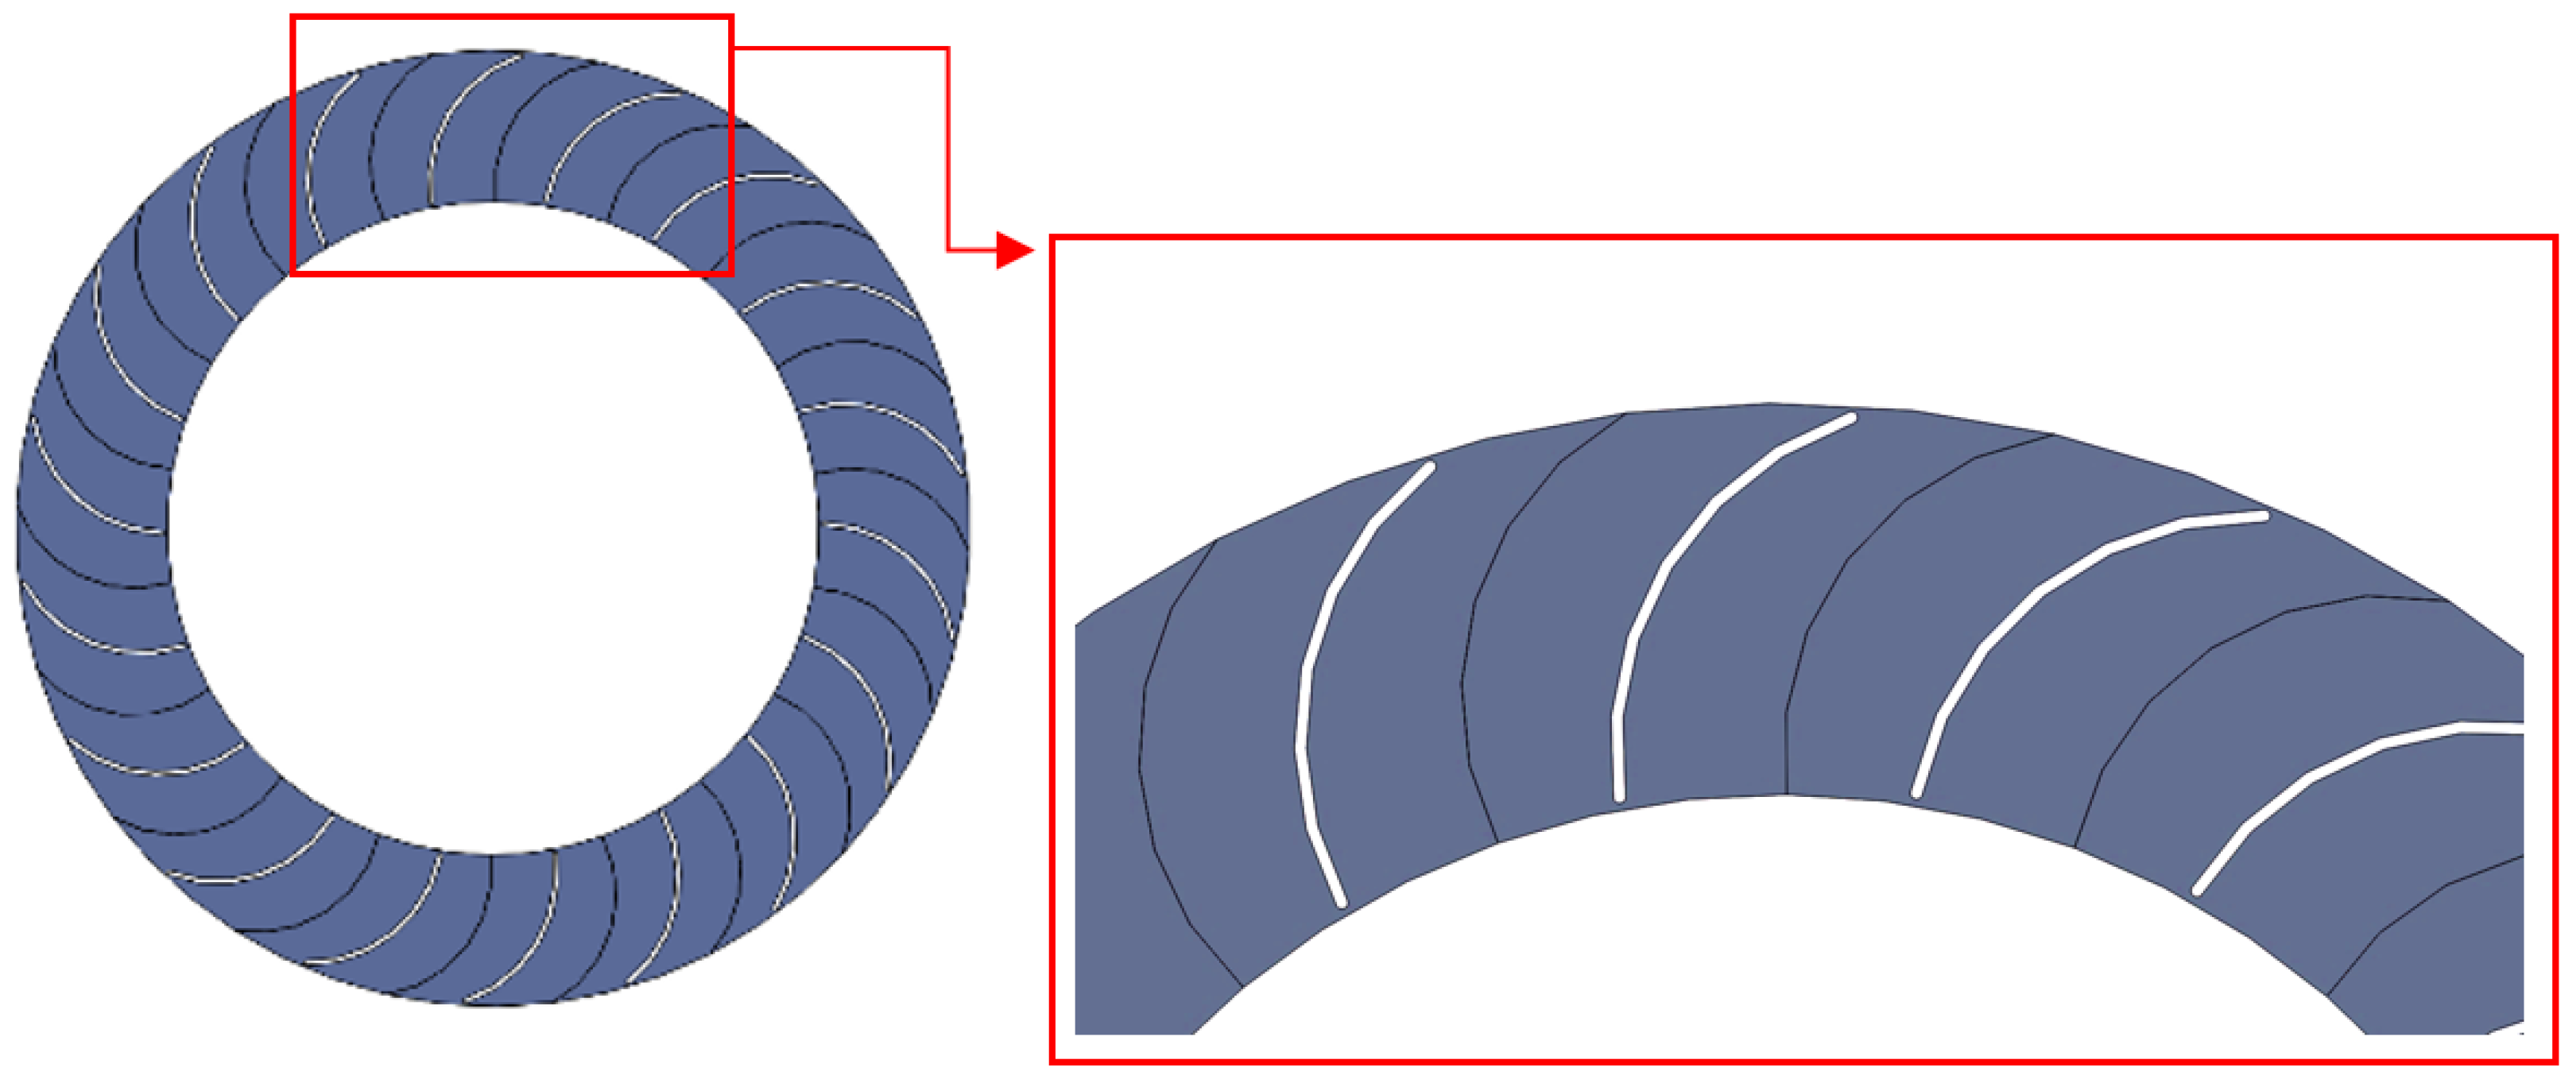
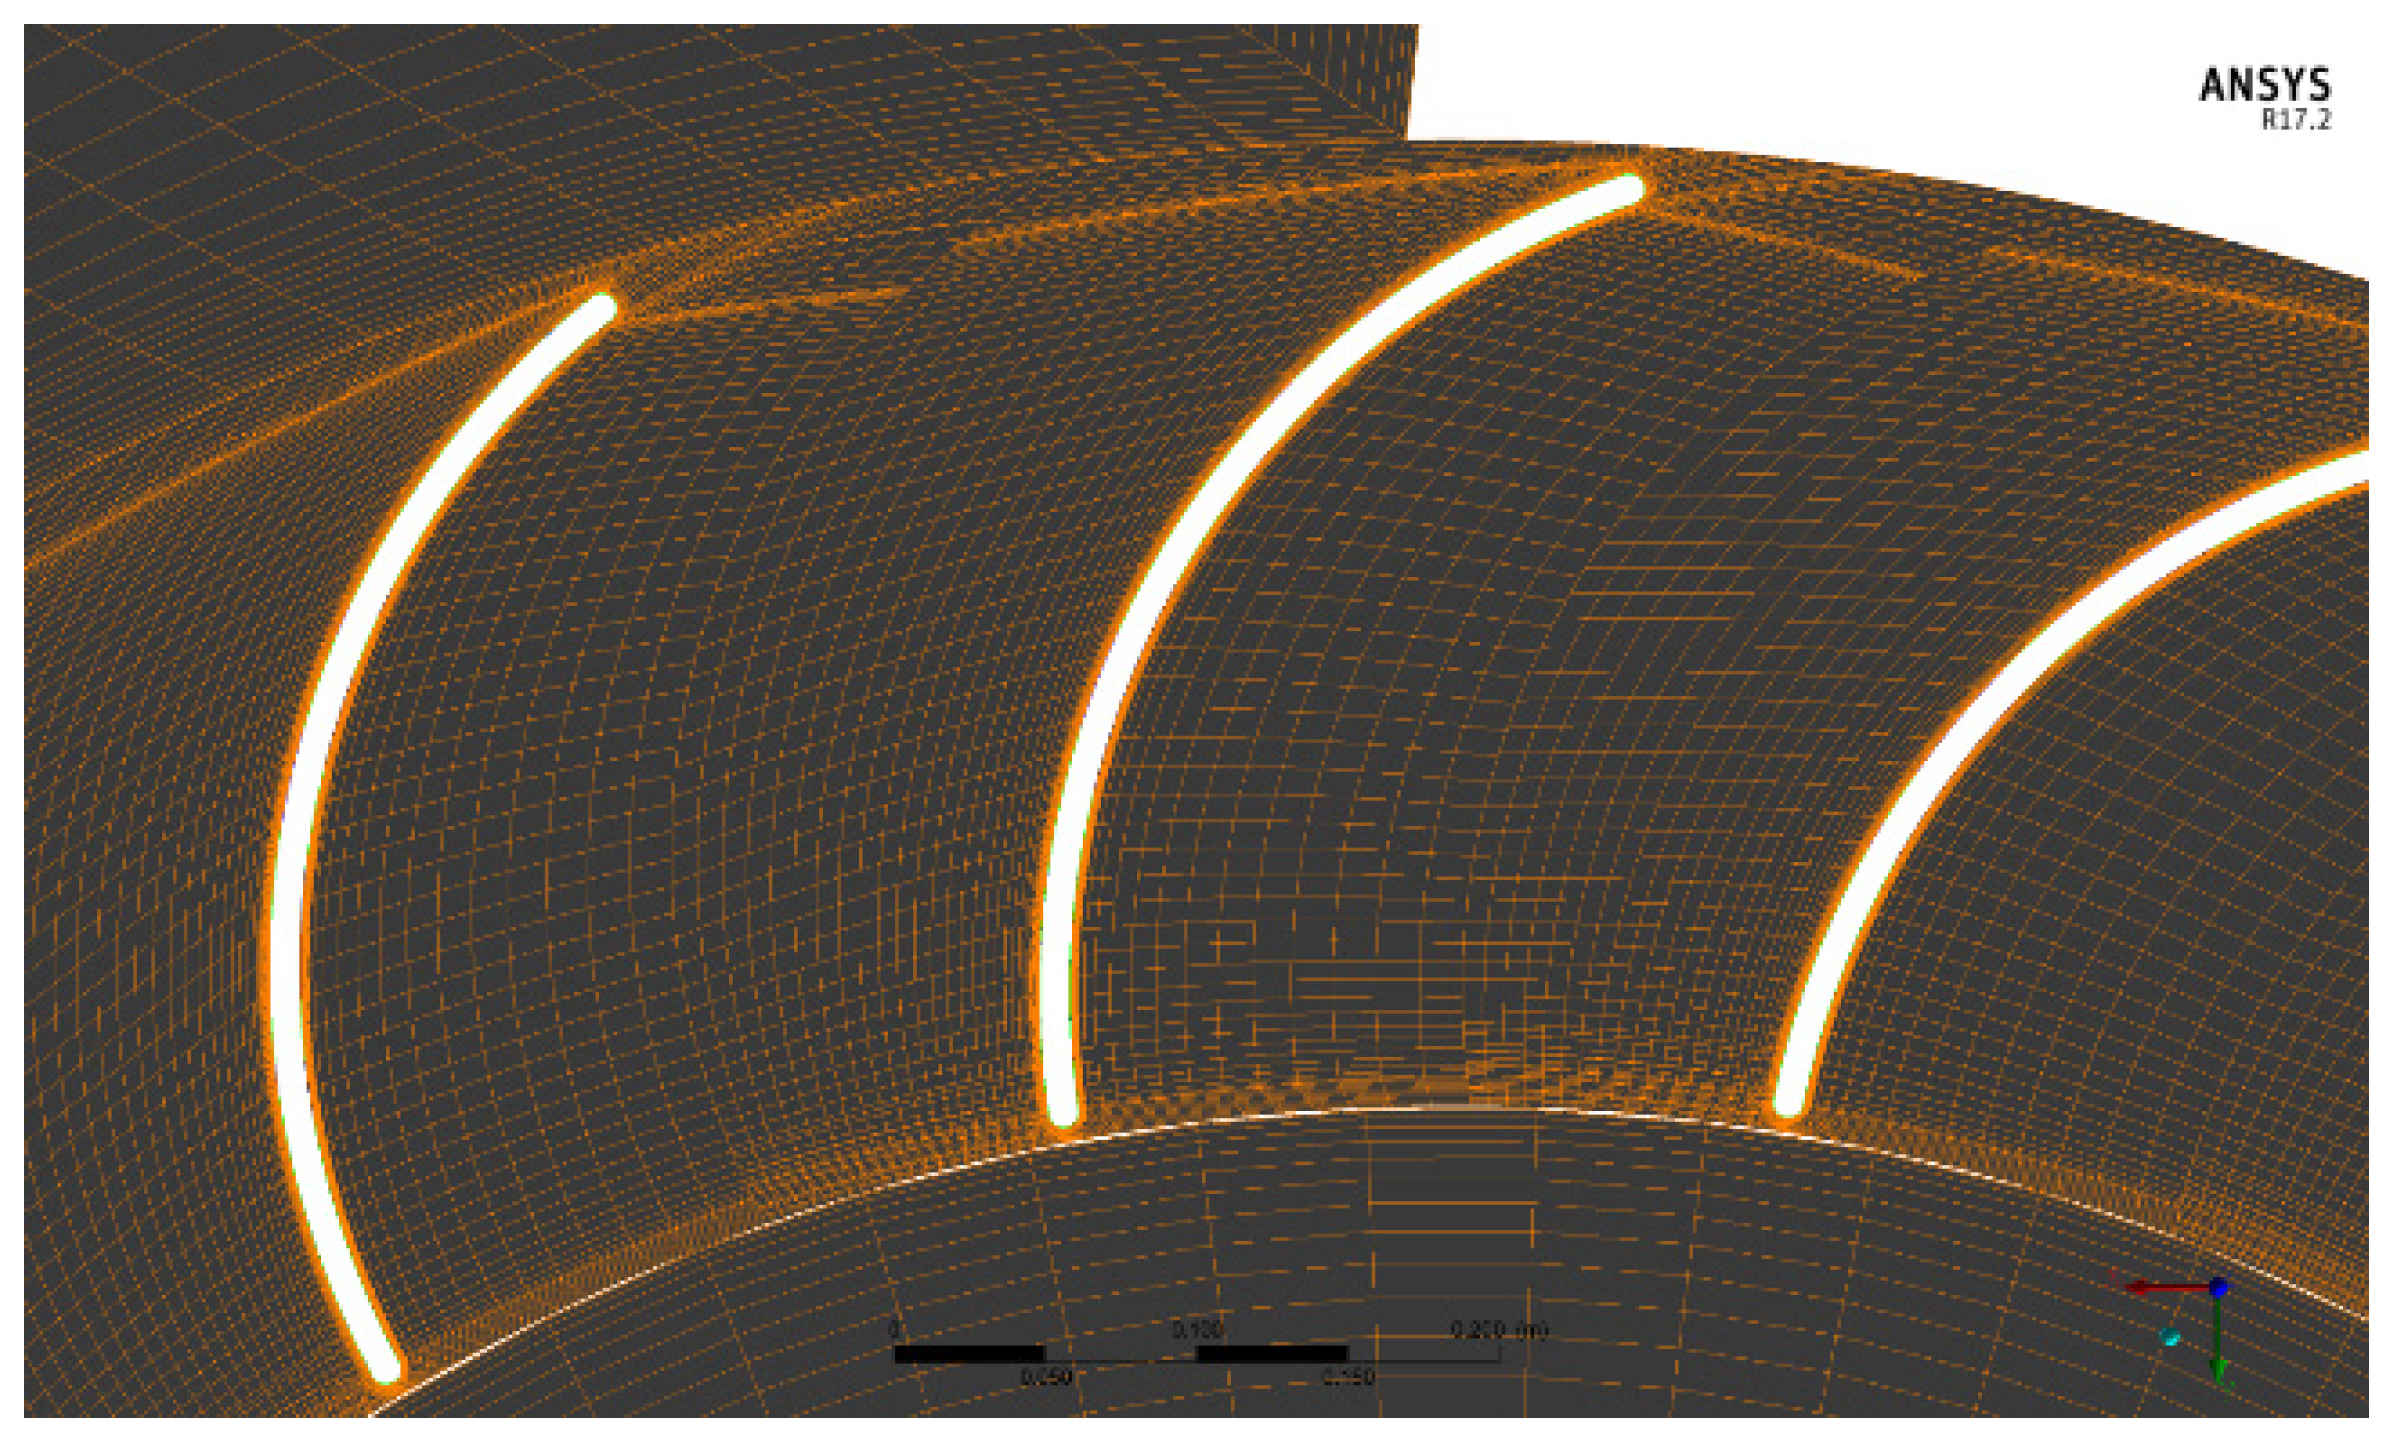
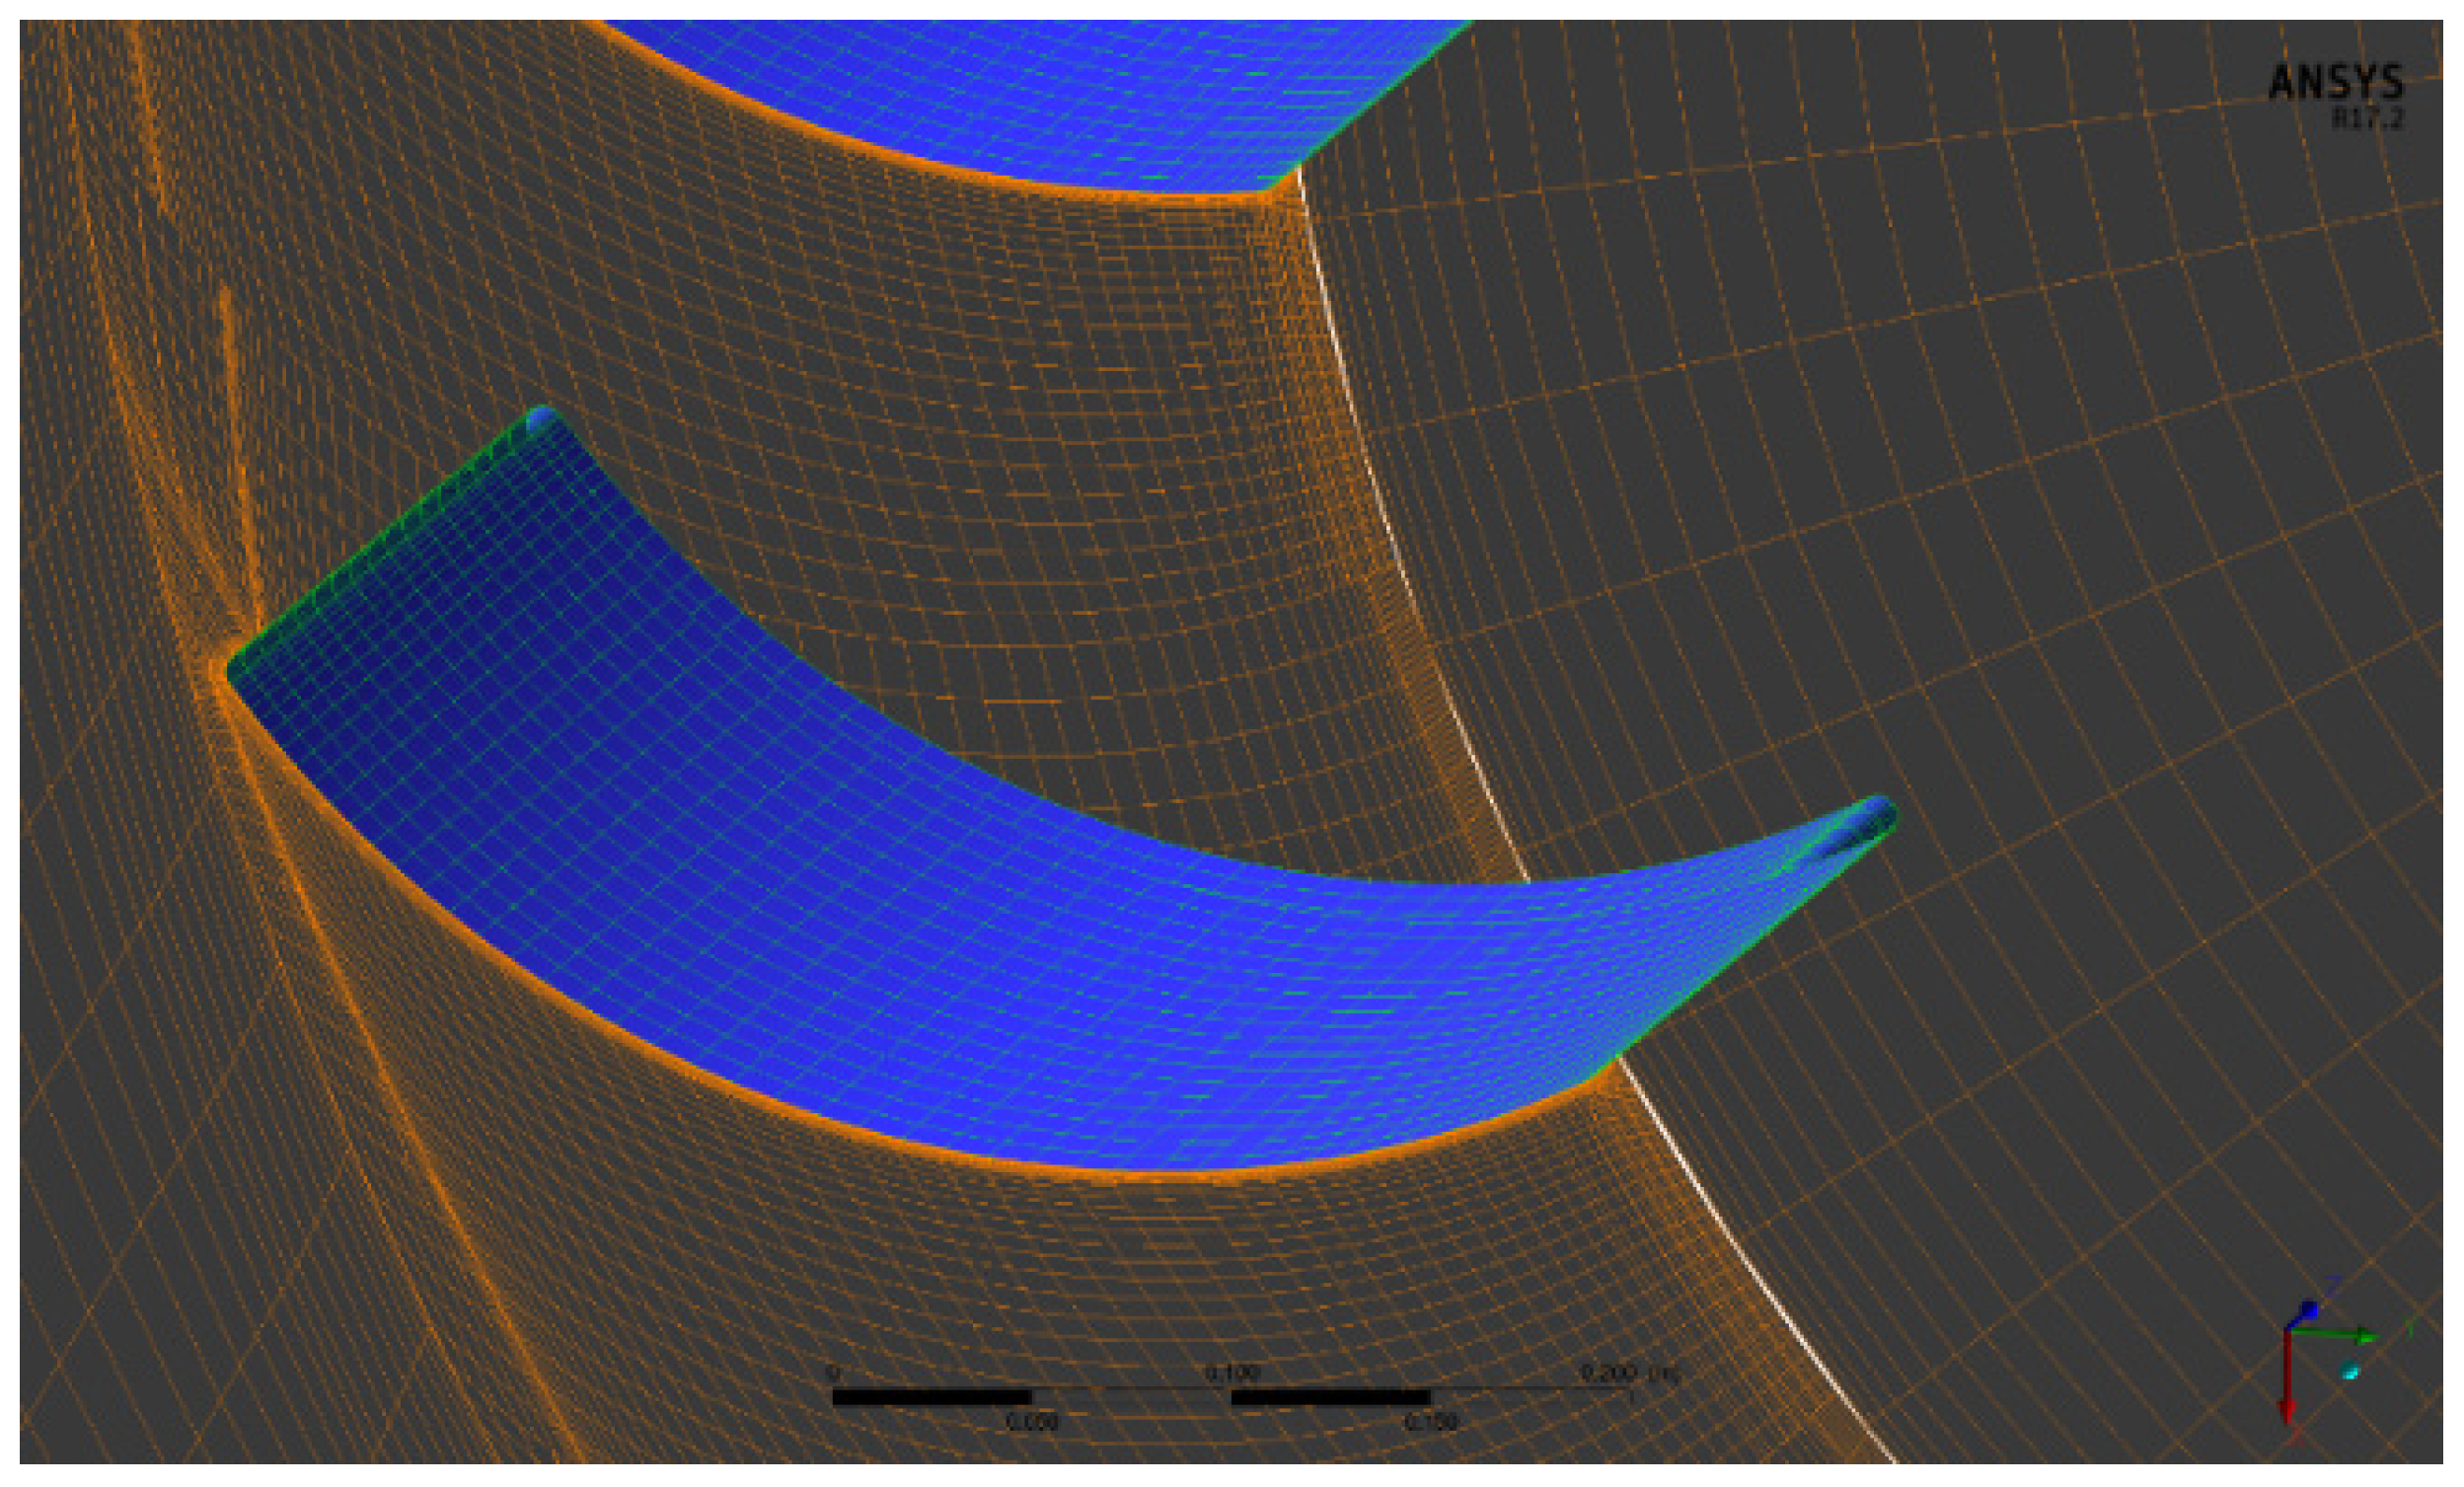
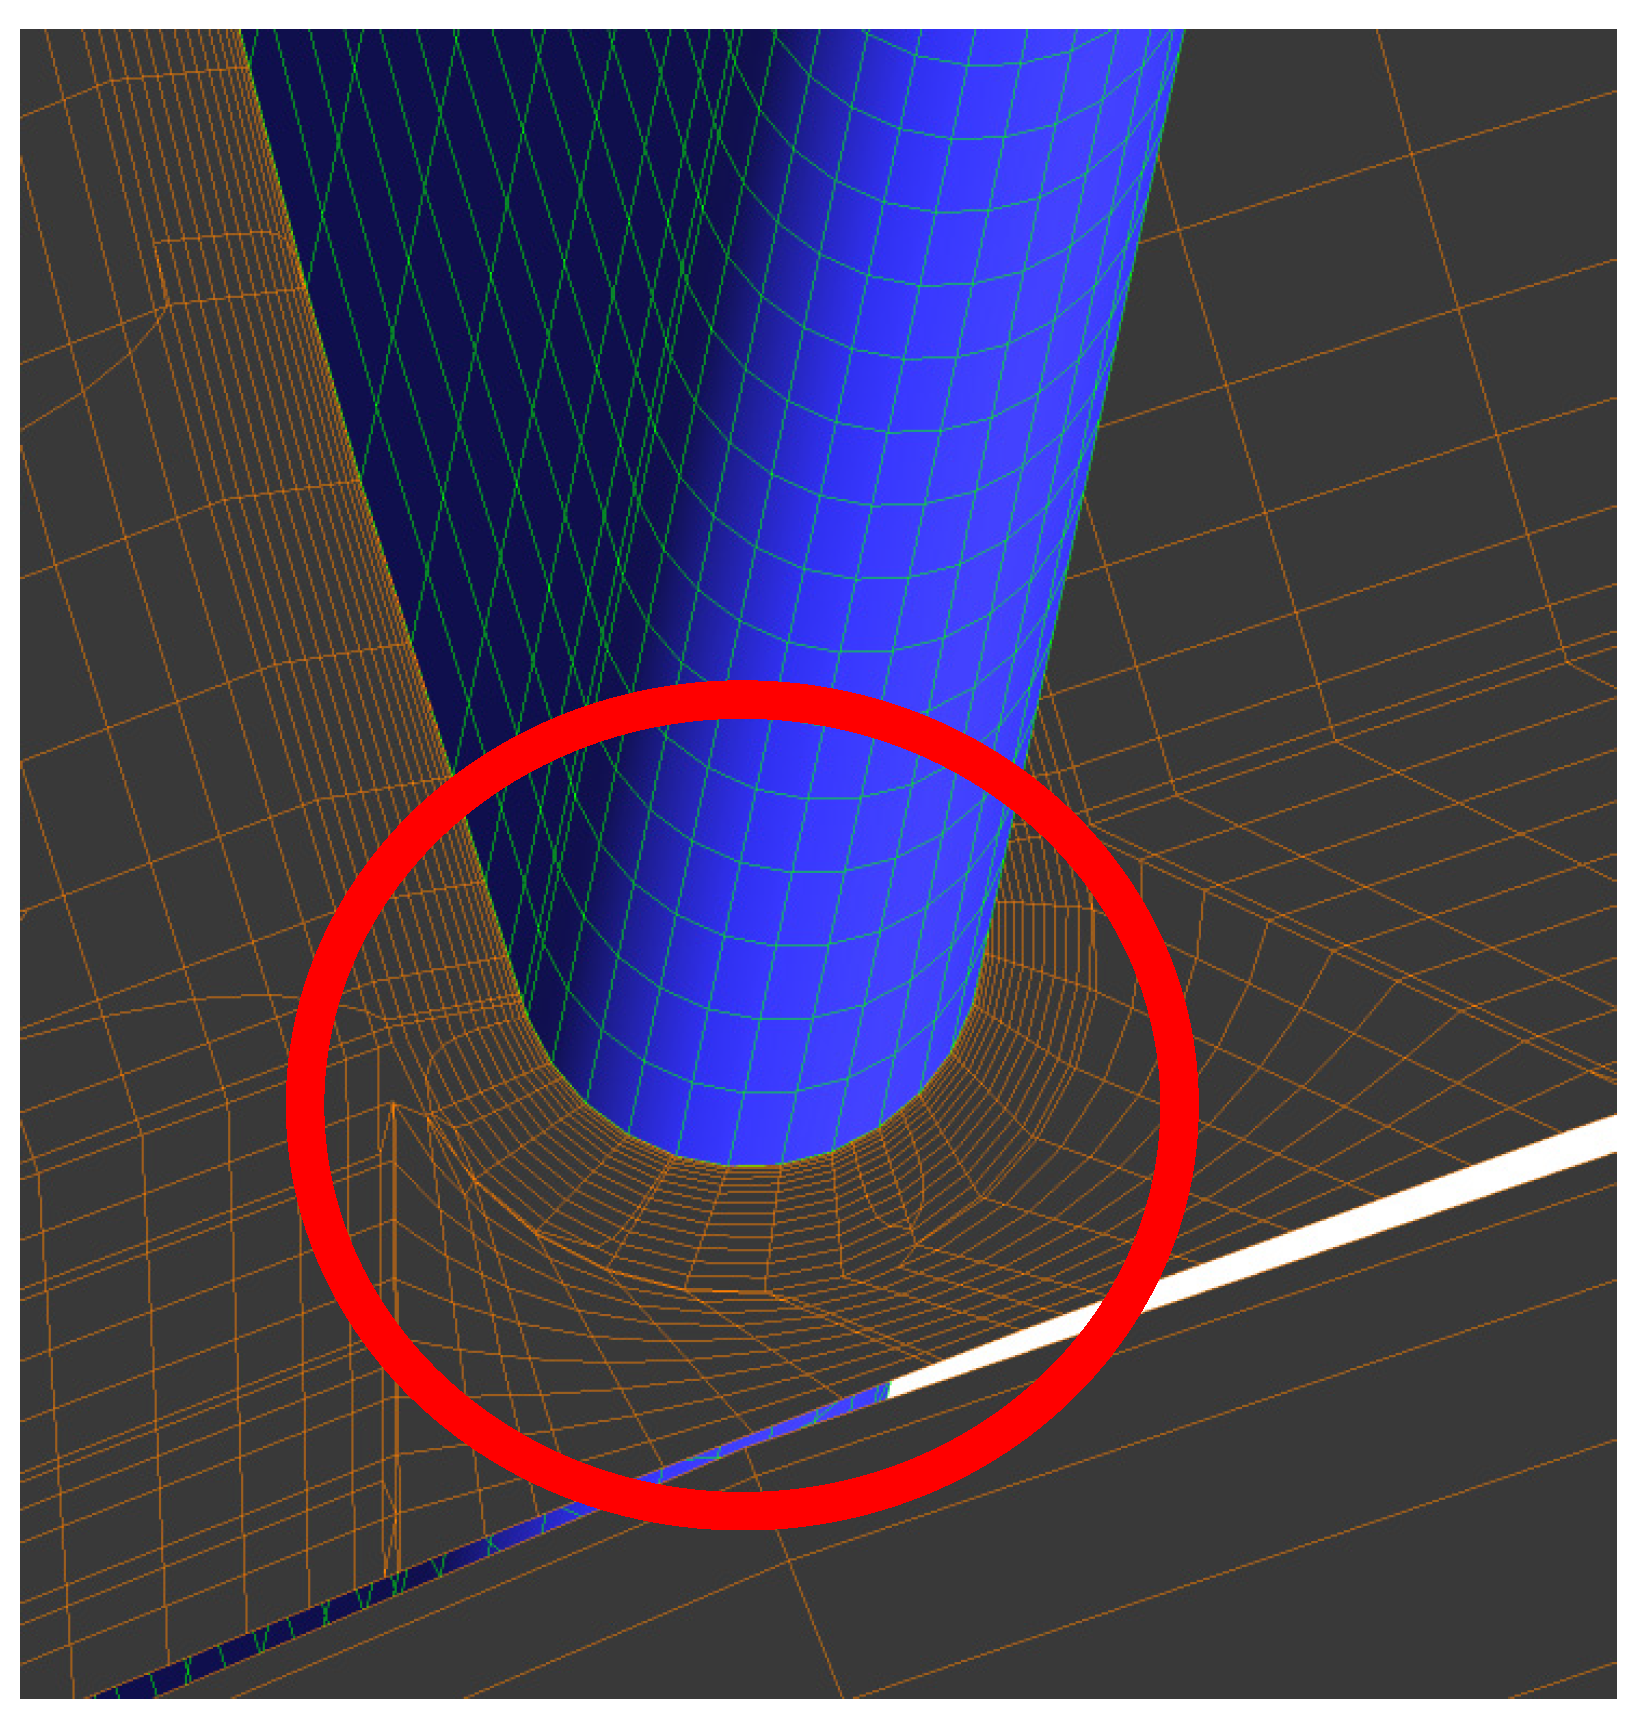
Figure 10 and Figure 11 illustrate the mesh generated around the turbine runner, which was modeled as a single runner section consisting of 18 symmetrical blades. Nodal point details were exaggerated to accurately capture the blade curvature shape. Figure 12 exaggerates the finer mesh elements and multiple prism layers to accurately capture boundary-layer effects around the runner blades and to enable the necessary fluid–blade surface interactions to produce accurate numerical solutions. In addition to blade meshing, extra-fine mesh regions with hexahedral elements were used around the nozzle arc that comes into contact with the runner; Ref to Figure 13 and Figure 14. The mesh nodal distribution was kept equal all around the volume mesh to ensure accuracy in this highly turbulent flow environment. Figure 15 and Figure 16 illustrate the resulting mesh around the nozzles.
The non-rotating sections of the turbine and nozzle parts contained a mesh element count of 0.514 million hexahedral elements. The meshing of the curved geometric locations of the nozzle was carried out with extra caution to ensure the accurate capture of boundary effects using prism layers. In Figure 17, the blade mesh is shown in green, while the rest of the regions are depicted in the default gray for clarity and contrast. Overall, the mesh was carefully generated to capture all necessary fluid dynamics phenomena and surface interactions. The final accuracy of the convergence will depend on the quality of the fluid domain, which will ensure accurate computational results.

2.3. Turbine Optimization Numerical Setup (ANSYS CFX v. 17.2)

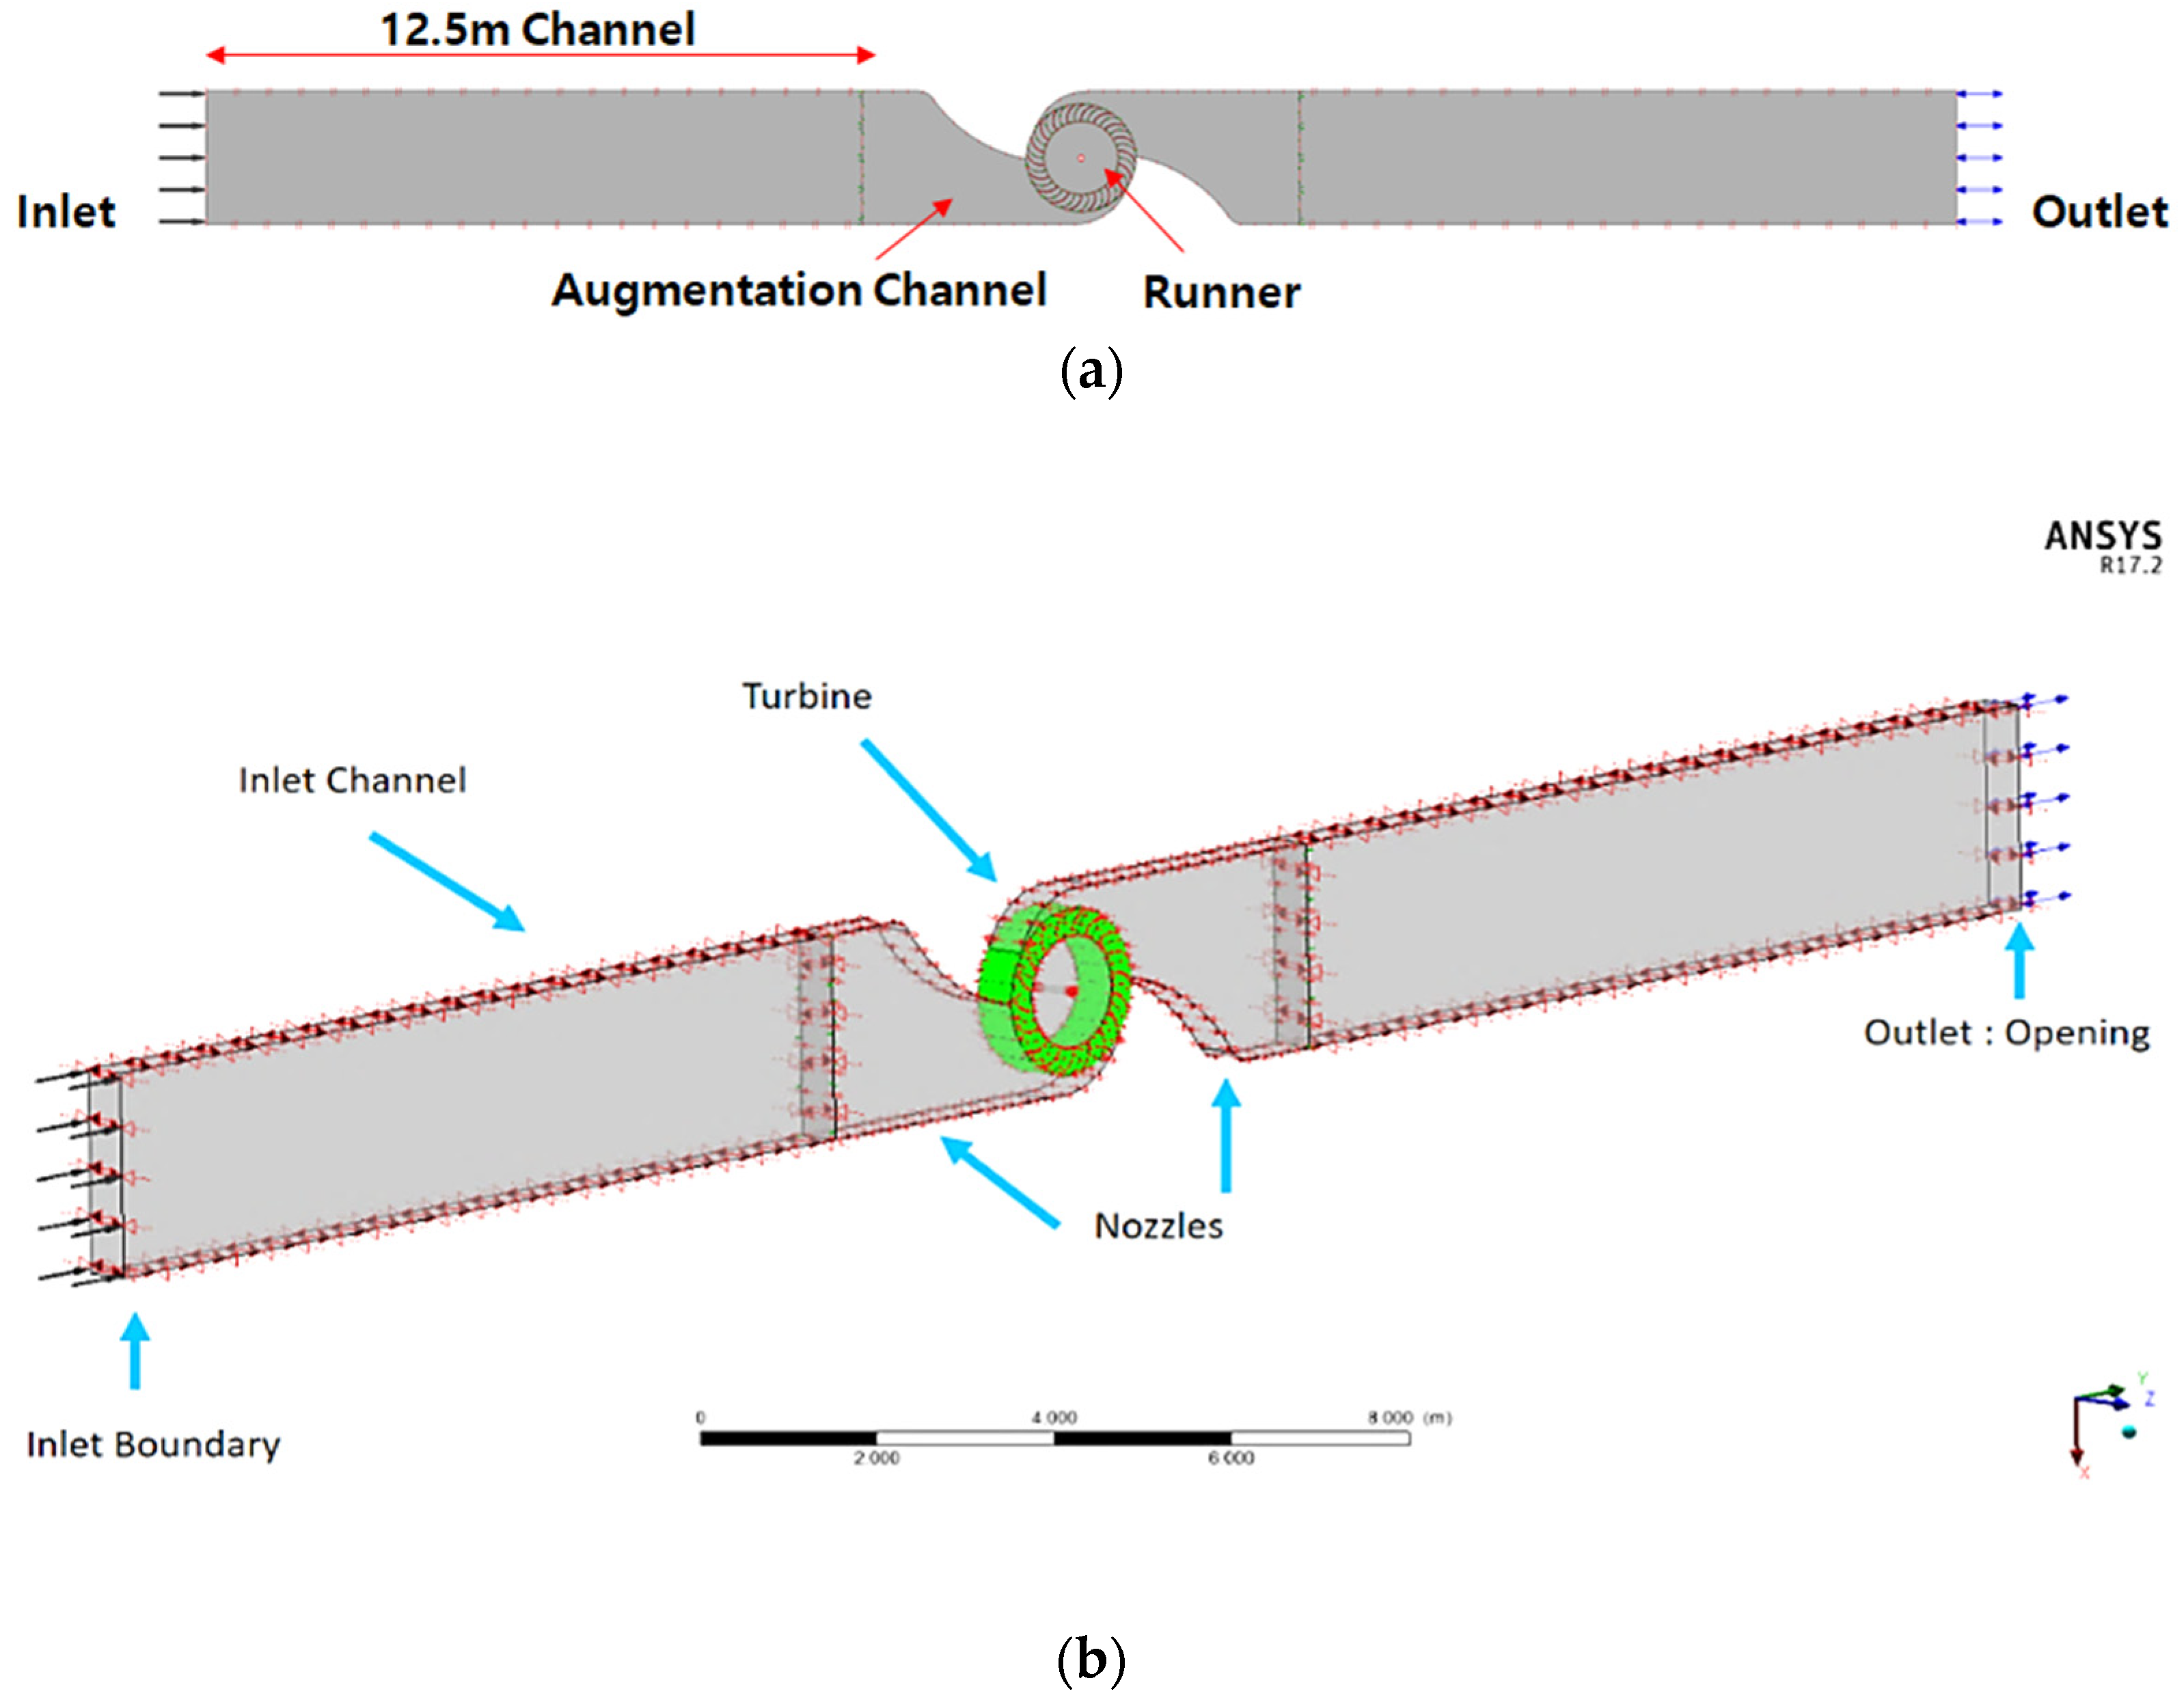
The turbine optimization setup contained augmentation channel entrance passages. An equal 12.5 m long passage (see Figure 15a) was used to receive a smooth fluid flow towards the inlet/outlet of the nozzle and the runner sections. This was mainly carried out to ensure smooth fluid flow without excess turbulence and eddies. The same mesh model would be utilized in the time-averaging simulation but with changes to the inlet boundary conditions with CFX command language code to generate a wave profile. Similar to steady-state analysis, the exterior walls and turbine blades were modeled as no-slip wall boundary conditions. The domain interfaces were connected with the automatic mesh connection (GGI) method. The total flow time for the transient simulation (time averaging) model was set to 30 s, with a time step of 0.01 s for extended accuracy. The numerical modeling was performed and was validated by the study “Survivability of wave energy converters using CFD” (E.J. Ransley et al. [27]) using the numerical wave tank (NWT) CFD modeling method. All domains for steady-state and transient analyses were stationary except for the turbine domain. The simulation was performed based on the Reynolds Averaged Navier–Stokes (RANS) equation model provided by the SST (Shear–Stress–Transport) turbulence modeling scheme. Time discretization of equations was achieved with the implicit second-order Backward Euler scheme (see Figure 15b).

2.4. Governing Equations of CFD Code

CFD Code

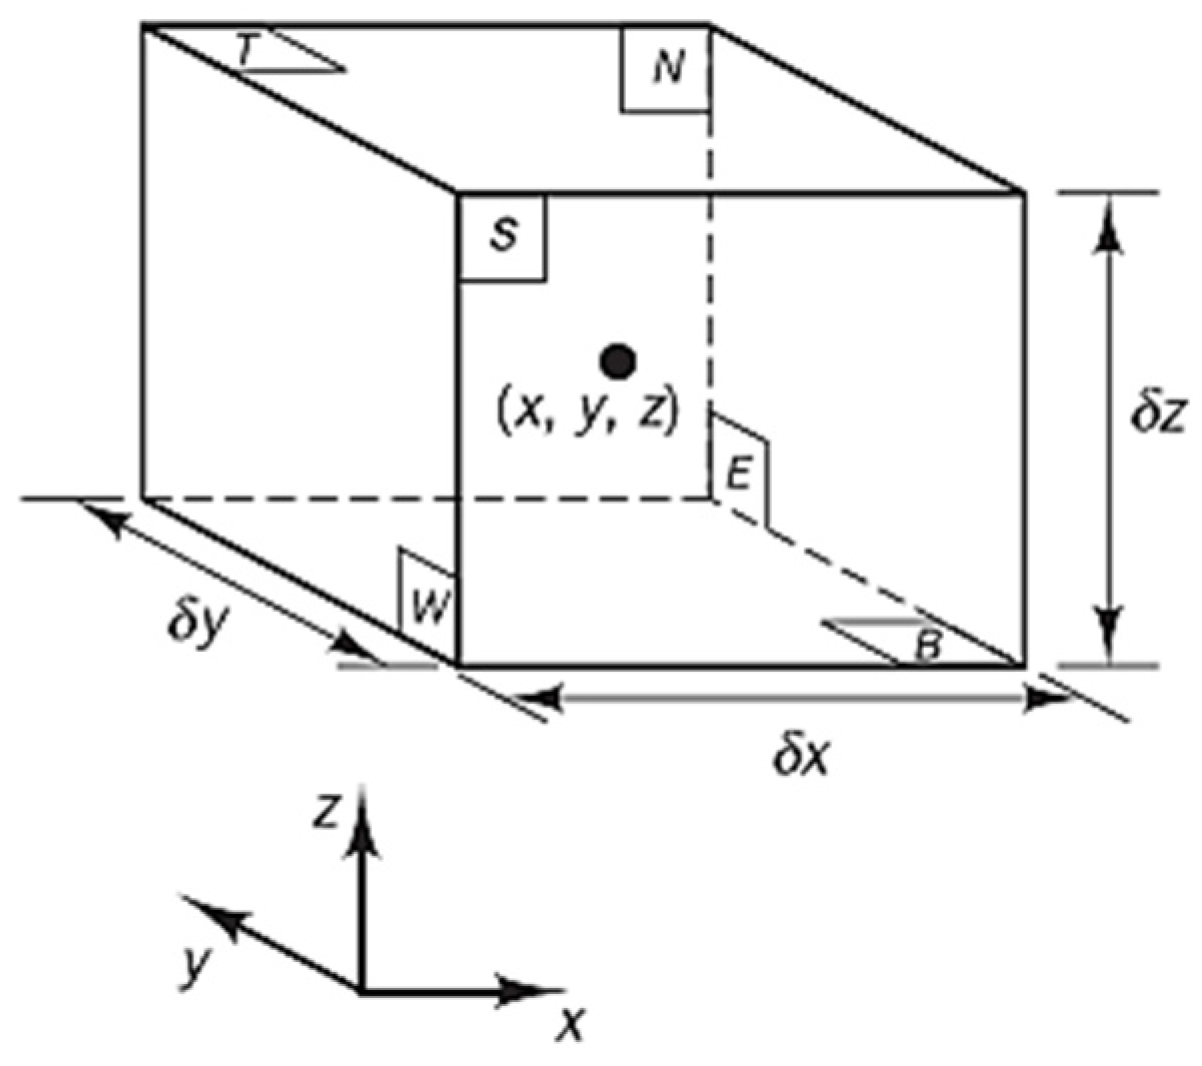
In computational fluid dynamics (CFD), highly complex concepts are translated into computational algorithms and solved using numerical methods. The focus of this paper was to illustrate and achieve research targets using CFD codes of commercial software packages, and a brief overview of the governing equations was presented [27,28,29]. CFD codes are structured around numerical algorithms that can handle fluid flow problems (Figure 16) [26], and all codes contain three main elements: a pre-processor, a solver, and a post-processor. The solution to a flow problem (velocity, pressure, temperature, etc.) is defined at nodes inside each cell. The accuracy of CFD results depends on how well the solution converges to the final non-varying pattern, which is governed by the quality of the mesh or grid generated (number of nodes or cells) and how refined or coarse the mesh structure is. The governing equations of fluid dynamics are derived from the laws of physics in a simpler manner. A defined fluid element with six basic sides with δx, δy and δz is required for the derivation of conservation laws with a fluid element.
The conservative or divergence form of the system of equations governs the time-dependent three-dimensional fluid flow and heat transfer of a compressible Newtonian fluid:
C o n t i n u i t y     ρ t + d i v ( ρ U ) = 0 x m o m e n t u m ;       ( ρ u ) t + d i v ( ρ u U ) = p x + d i v ( μ . g r a d . u ) + S M x y m o m e n t u m ;         ( ρ v ) t + d i v ( ρ v U ) = p x + d i v ( μ . g r a d . v ) + S M y z m o m e n t u m ;         ( ρ w ) t + d i v ( ρ w U ) = p x + d i v ( μ . g r a d . w ) + S M z E n e r g y ;       ( ρ i ) t + d i v ( ρ i U ) = p . d i v . U + d i v ( k . g r a d . T ) + + S i
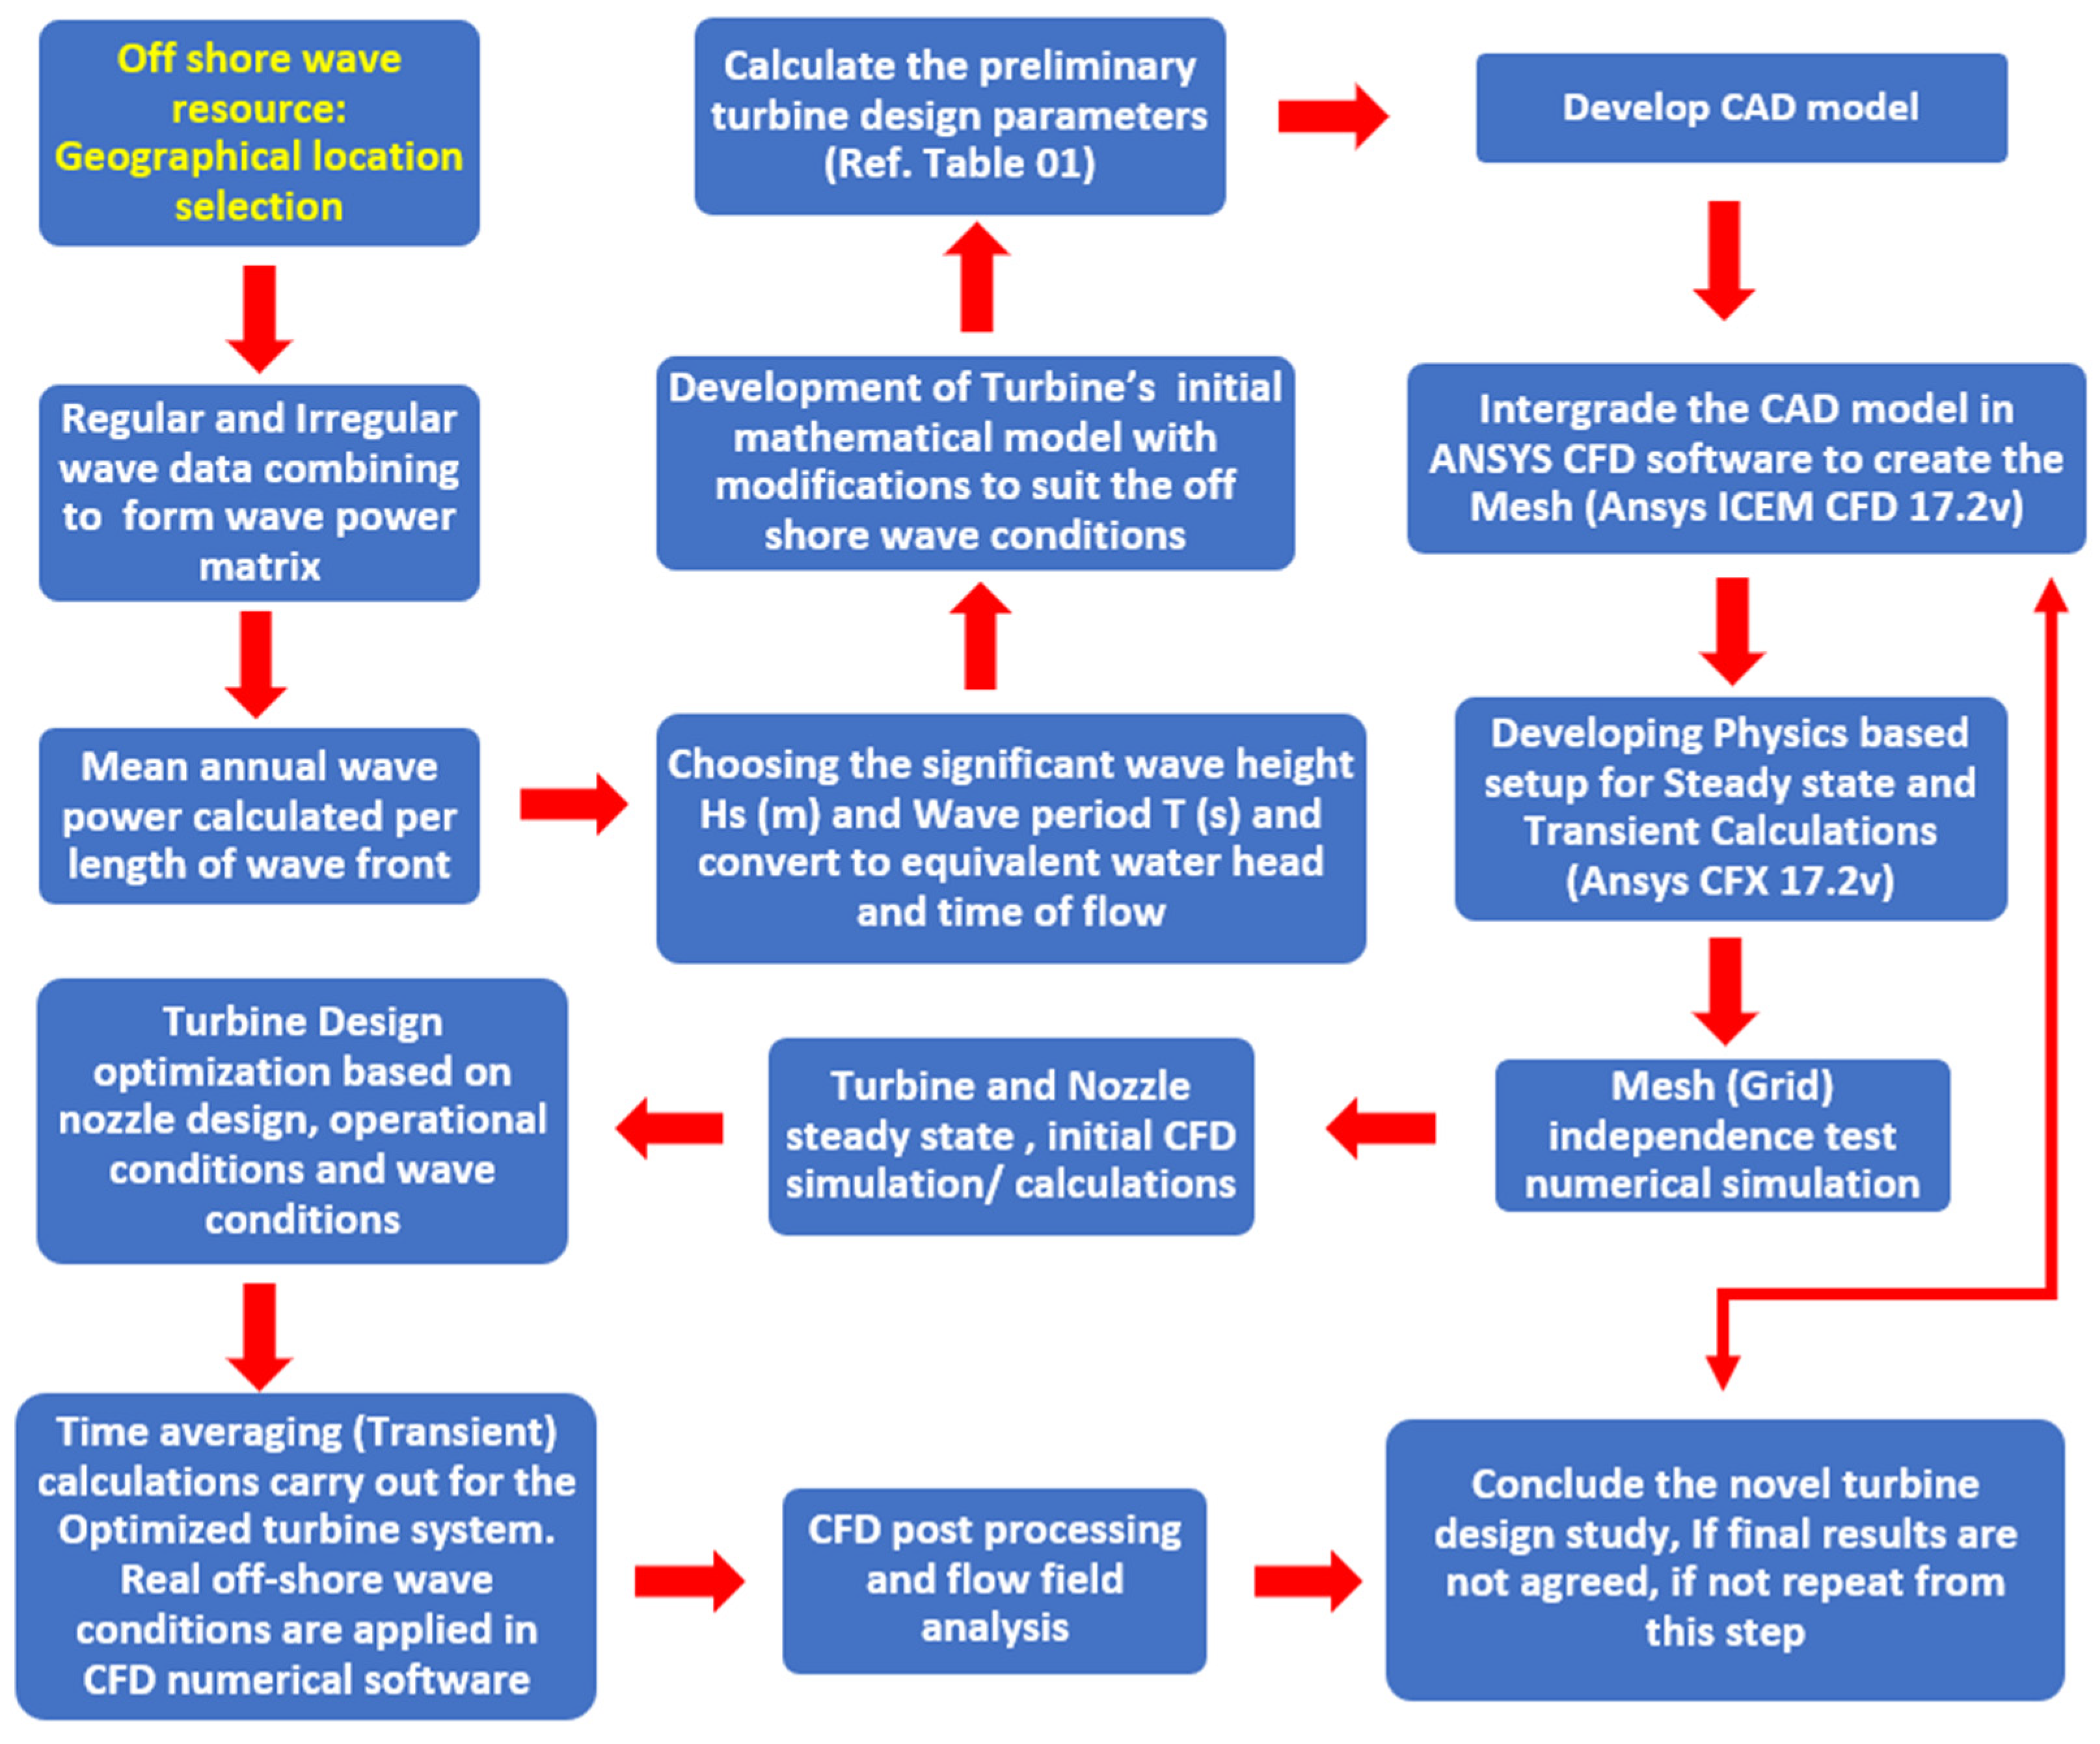
These Navier–Stokes (NS) equations are computationally coded using computer programming languages to create a comprehensive software code. In CFD codes adopted for the simulation of wave energy converters, the turbulence modeling solver algorithm remains unchanged, as shown in Refs. [26,27,28,29]. The overall flow process of the research presented in this study is depicted in Scheme 2: Research Methodology, which is the formal path followed in this study.

3. Results and Discussion

3.1. Mesh (Computational Grid) Independence Test

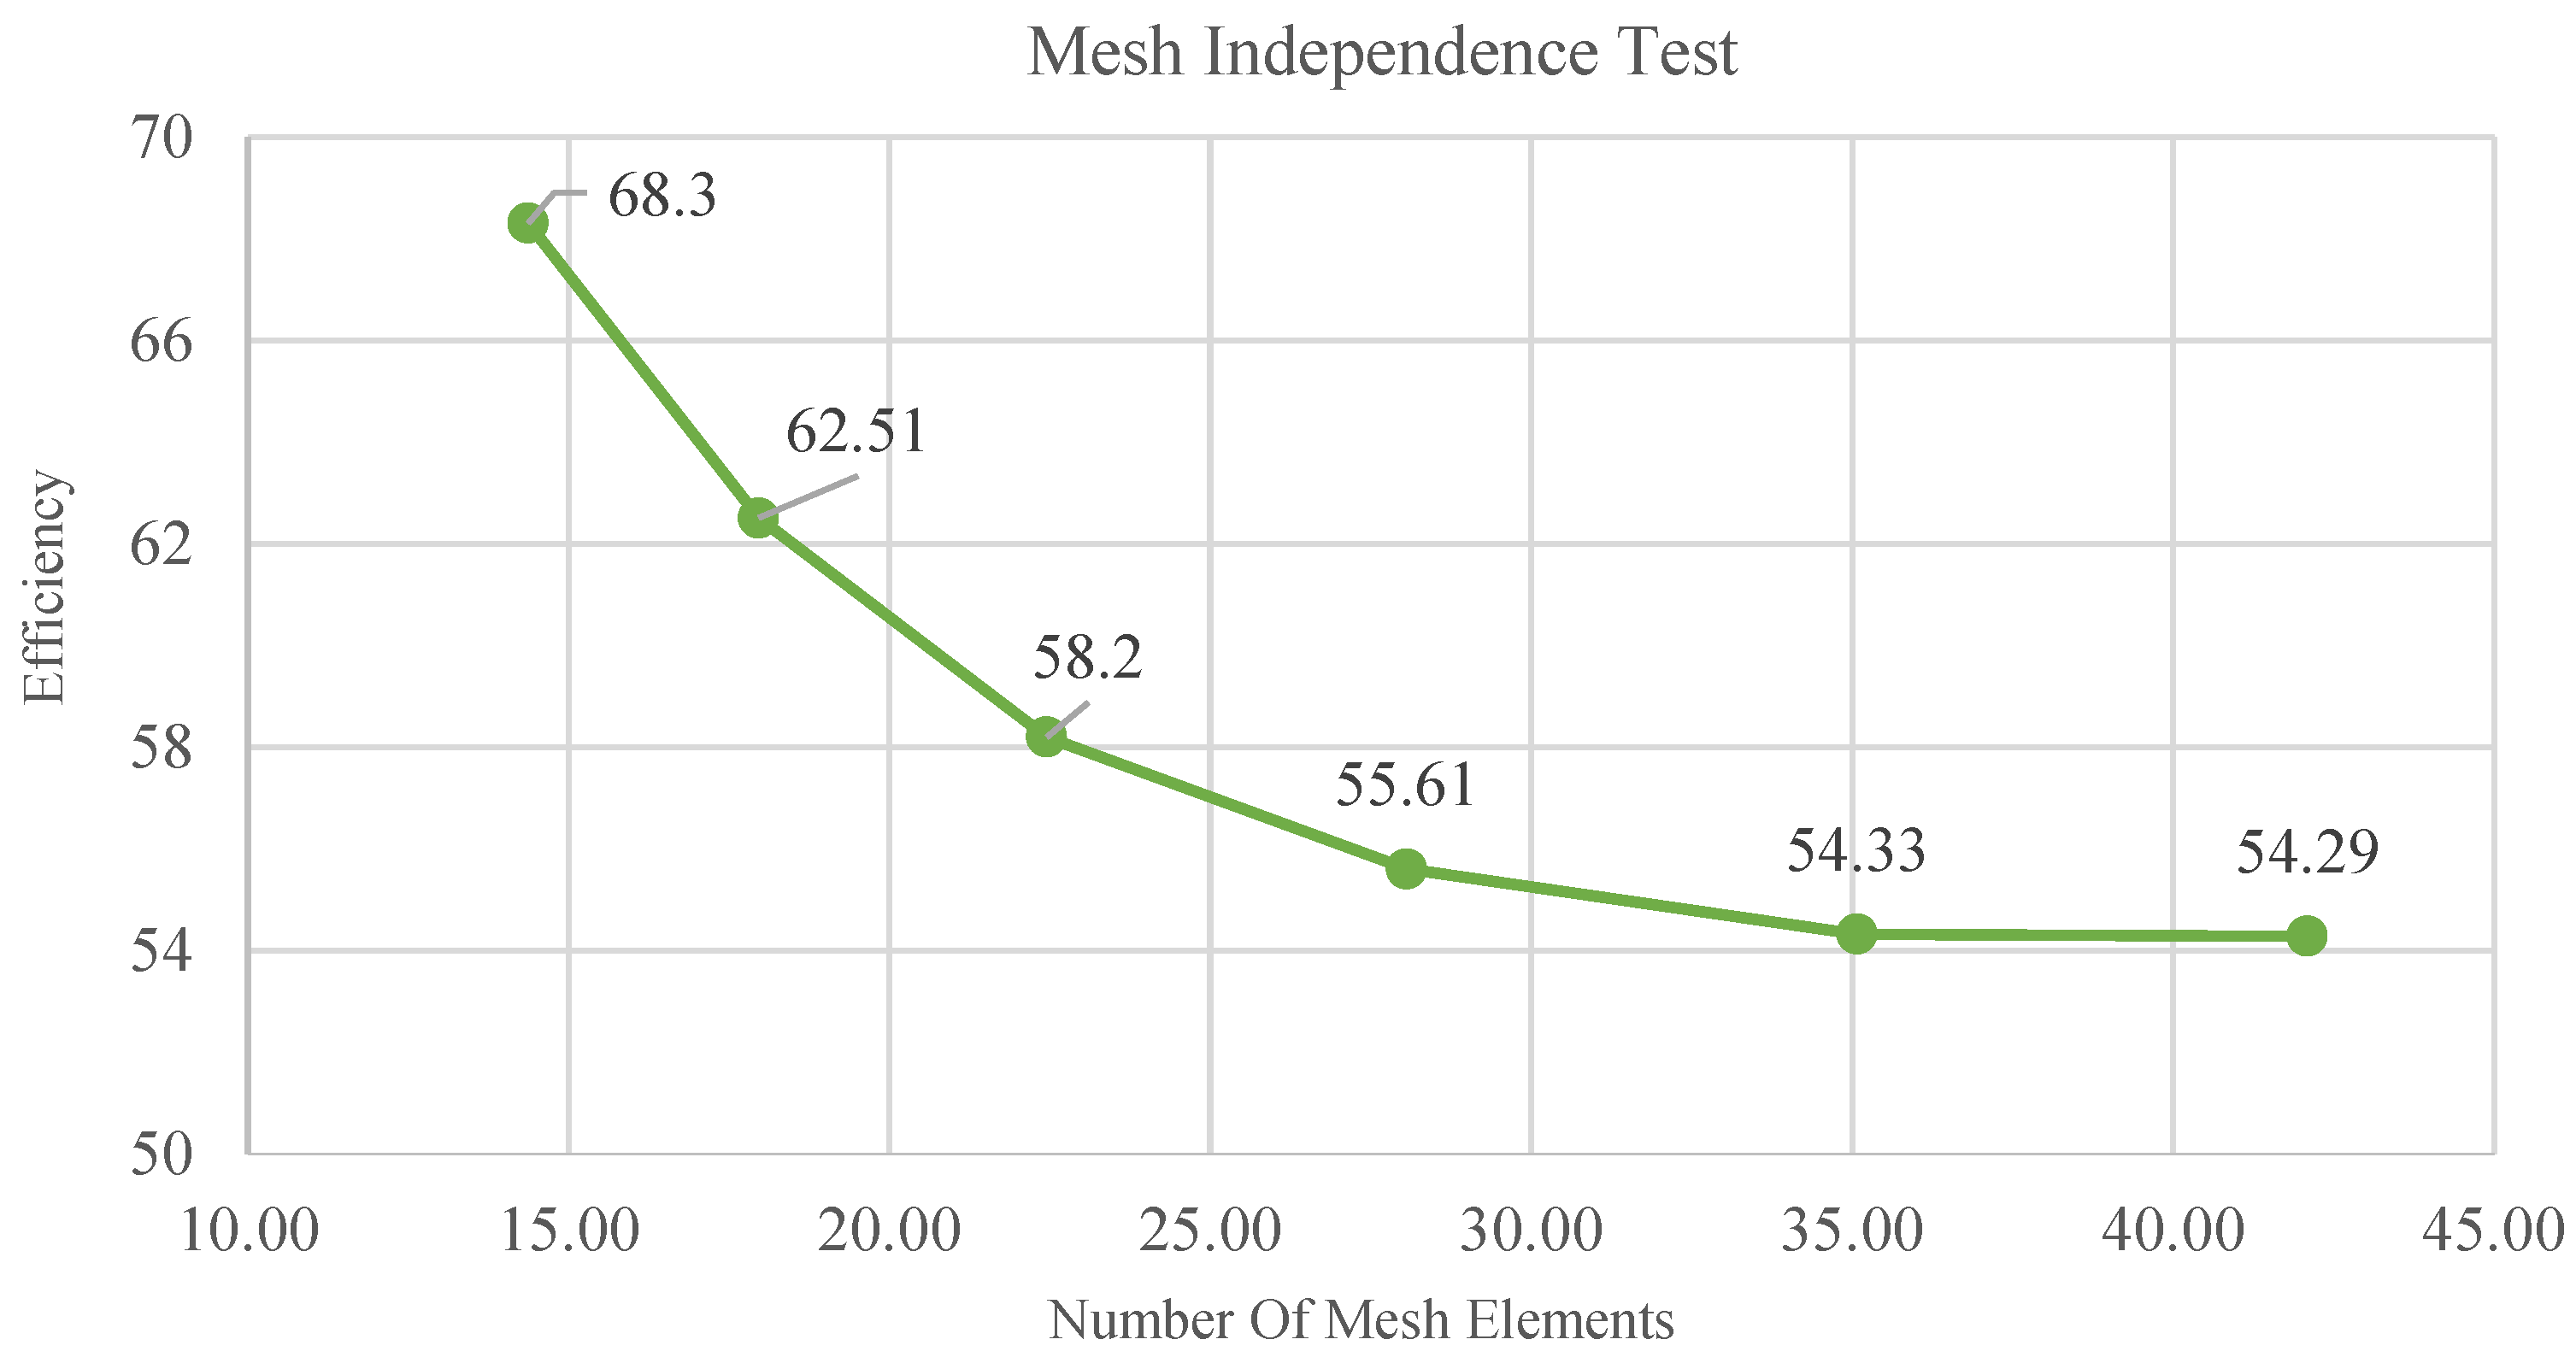
The suggested CFD model was validated using a similar study carried out by Ref. [20] and numerical wave tank (NWT) model calculations from Refs. [8,19,22,23,24,25,26,28,30,31]. The model validation results showed a difference of 0.2%, and the results agreed with the numerical model used in the present study. The grid independence test of a CFD model is vital, as the performance of the system often relies on the mesh element count. The same hexahedral grid was used during the testing, and the nodal count was increased at each stage by increments of 20% to rely on a reliable mesh convergence parametric test. The results are shown in Figure 17.
The results at the initial stage, with mesh elements in the range of 1.5 million, showed higher efficiency due to the coarse mesh. As the mesh became finer, the efficiency plot at the turbine tended to decrease at a certain point, and increasing the number of elements further did not affect the turbine efficiency. The final two stages, with 3.5 million to 4.2 million elements, did not affect the performance. The efficiency difference for the latter two mesh cases was negligible. The y+ value of 3.14 and the turbulence model of k-Omega SST proved reliable results in the y+ value of 3.14. Initially, in the coarse mesh, the y+ value ranged from 143 to 78 and provided an inaccurate y+ value for k-Omega modeling. The efficiency steadily rested at the margin of 54.33% for the base design. This is because in Finite Volume Analysis (FVA), as the mesh becomes finer, the accuracy of the solution of the governing equations tends to provide more reliable results. The rest of the analysis used a mesh element count of 3.56 million models selected from a much finer model with 4.2 million elements due to the negligible amount of performance variation, as the mesh with 4.2 million elements requires much higher computational power and longer duration.

3.2. Base Turbine Performance

The preliminary design of the turbine was tested at a constant head of 3 m and a designed speed of 35 RPM using the CFD technique. The present study caries on steady state method and Transient method. And both boundary conditions for each simulation stage is presented in Table 3. Base turbine performance refer to the steady state calculation results. The maximum performance of the turbine yielded an efficiency value of 54.33%. This efficiency was reached with a considerably lower head, as CFT designs tend to provide low efficiencies but at much lower head values. Some CFT designs operate at much lower efficiencies, ranging between 28% and 35%, with bidirectional flow operation. In the application of wave energy extraction, the efficiency of double-sided flow path designs achieves lower values. The base model was initially simulated with two different CFD codes: Ansys CFX and Star CCM+. The mesh was created by ICEM CFD, and Star CCM+ allowed the import of mesh types of similar platforms. The results from both platforms yielded very similar results (Table 4), with a difference of approximately 1% margin.

3.2.1. Turbine Performance Results and Analyses for Steady State

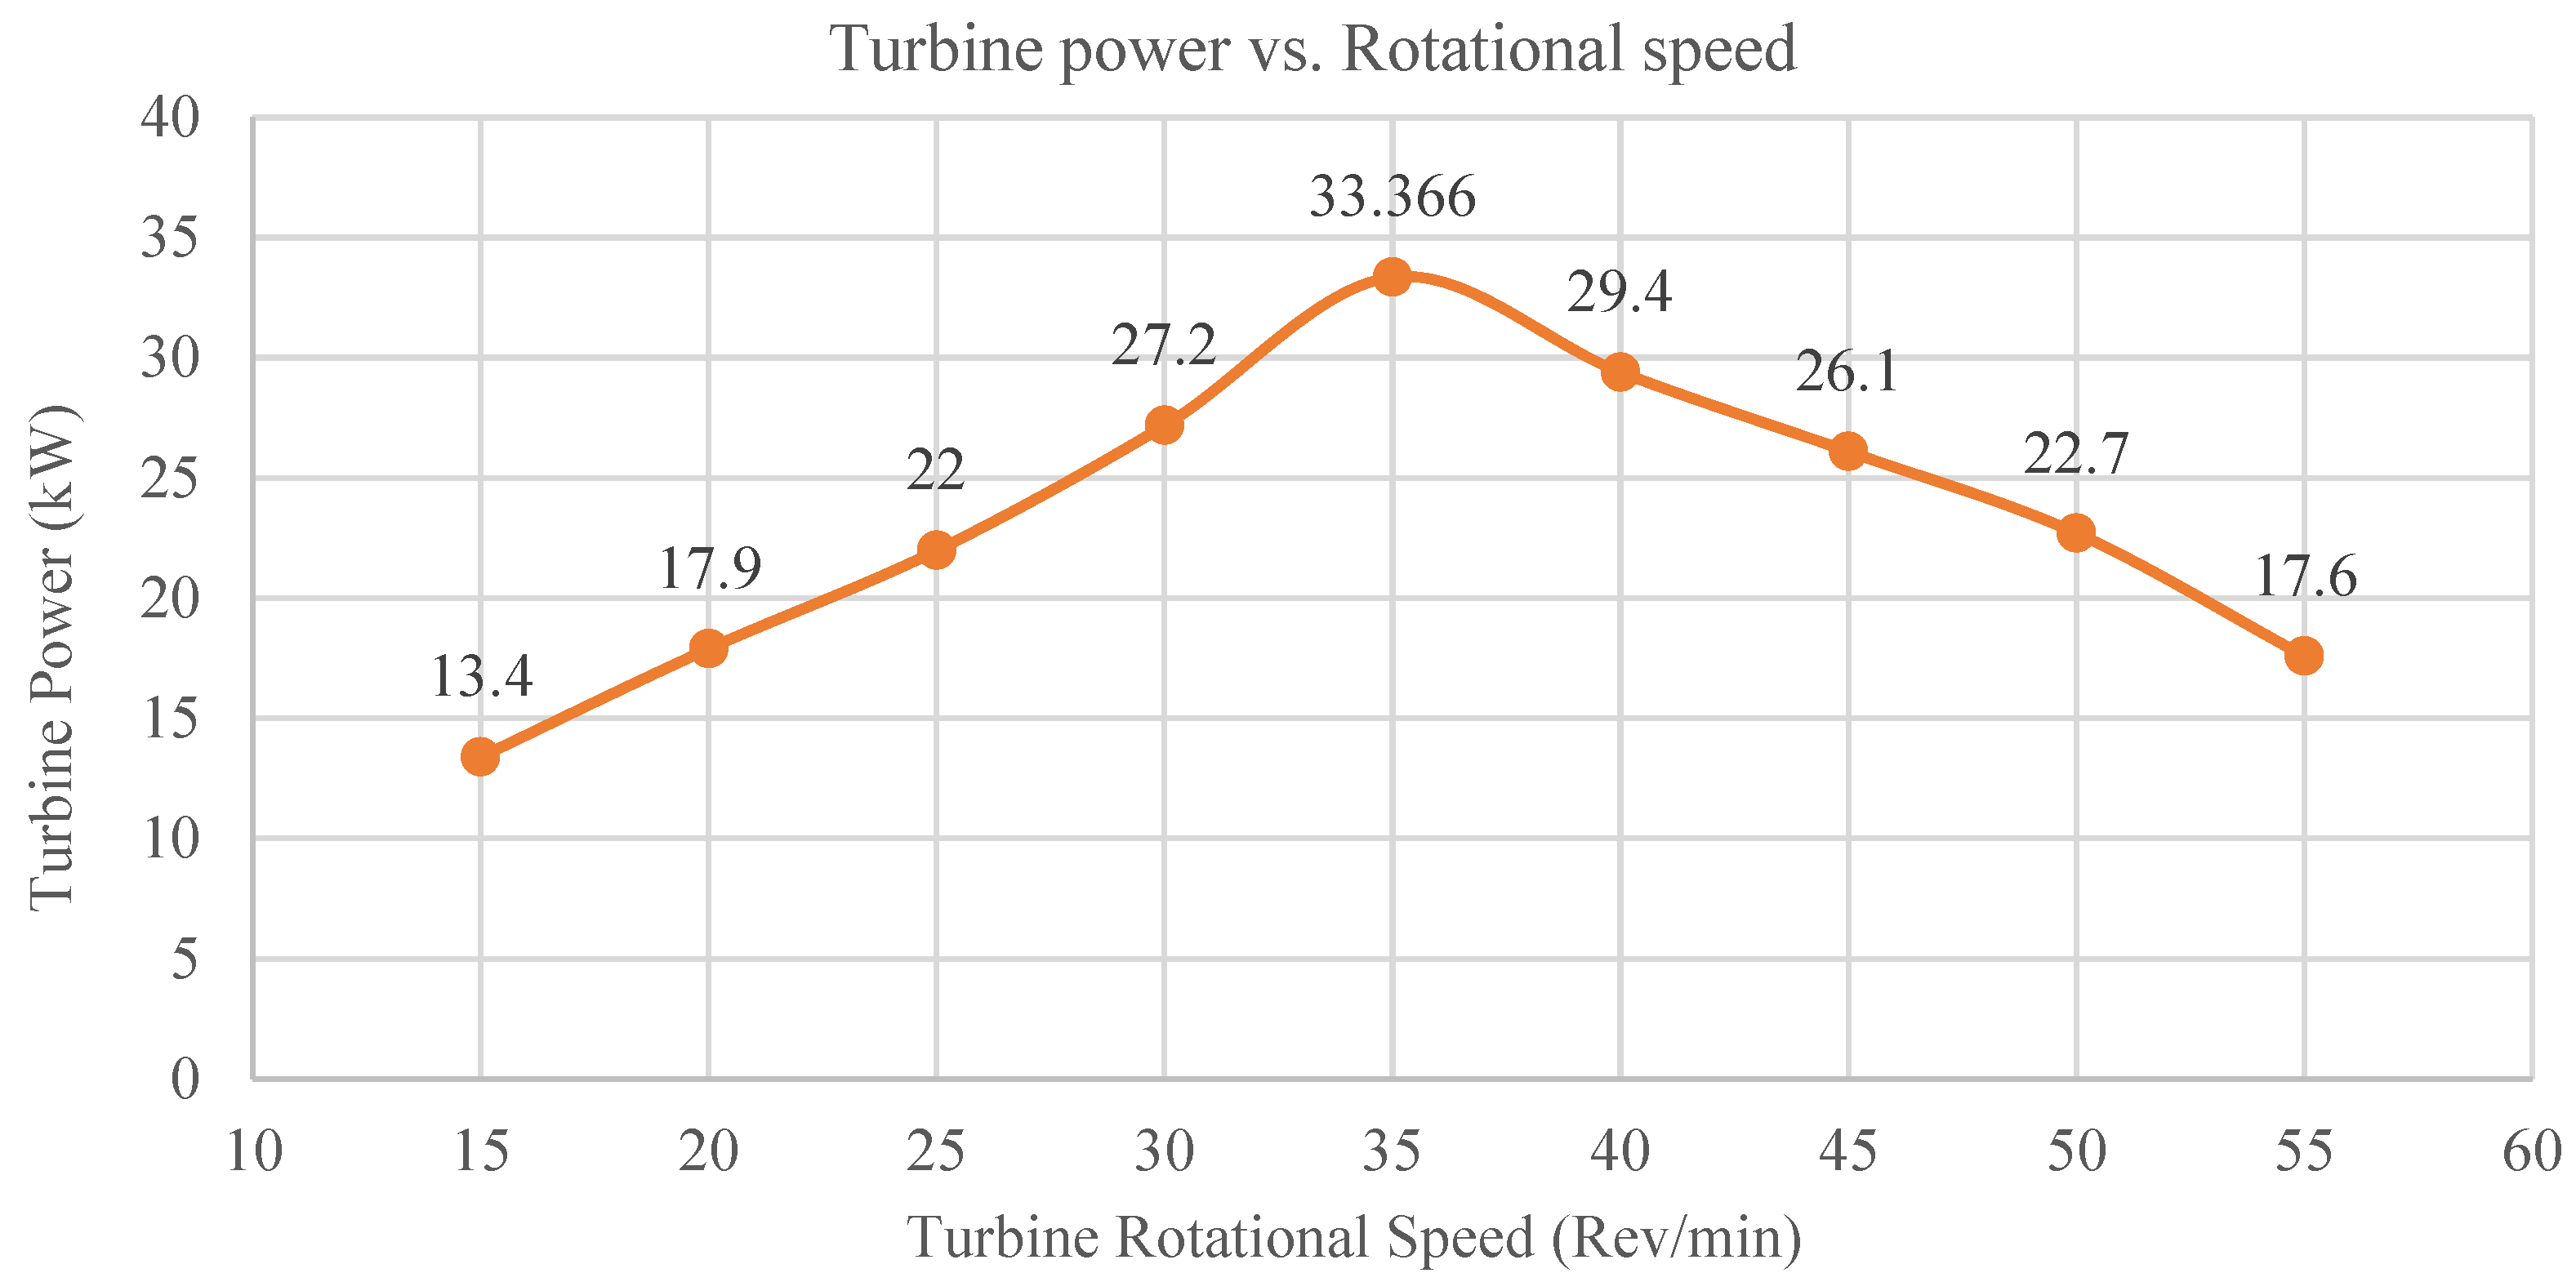
The numerical modeling was scaled down to a 1:15 scale of the length of the CFT front profile diameter, which did not change. Initial stage simulation carried out to extract the base turbine performance under steady state conditions This reduction in the length of the turbine allowed faster and more accurate numerical calculations with a finer grid. A 0.5 m wide strip of runner produced 33.366 kW, and the real scale model, which was 7.5 m wide, produced 500 kW of power, summery of the results are tabulated in Table 4. The steady-state results of the turbine were used to numerically evaluate its performance. The efficiency versus the turbine RPM was plotted in Figure 18, and the turbine power variation versus RPM was plotted in Figure 19.
In the single-directional flow analysis, the CFT behaved similarly to the rest of the CFTs. At both lower and higher RPM values which were the inverse of the turbine’s best operating point, the efficiency dropped considerably. The numerical calculations proved that the turbine operates at the BEP, as the turbine design point was correct and agreed with the preliminary design procedure. Once again, the turbine efficiency was plotted for a varying and vast range of rotational speeds ranging from 15 RPM to 55 RPM; the spread of efficiency values can be used to analyze the effective point of the operation. The lowest efficiency was recorded at 15 RPM, which was 18.3%. The turbine operated at off-operation points, resulting in considerably lower power production.
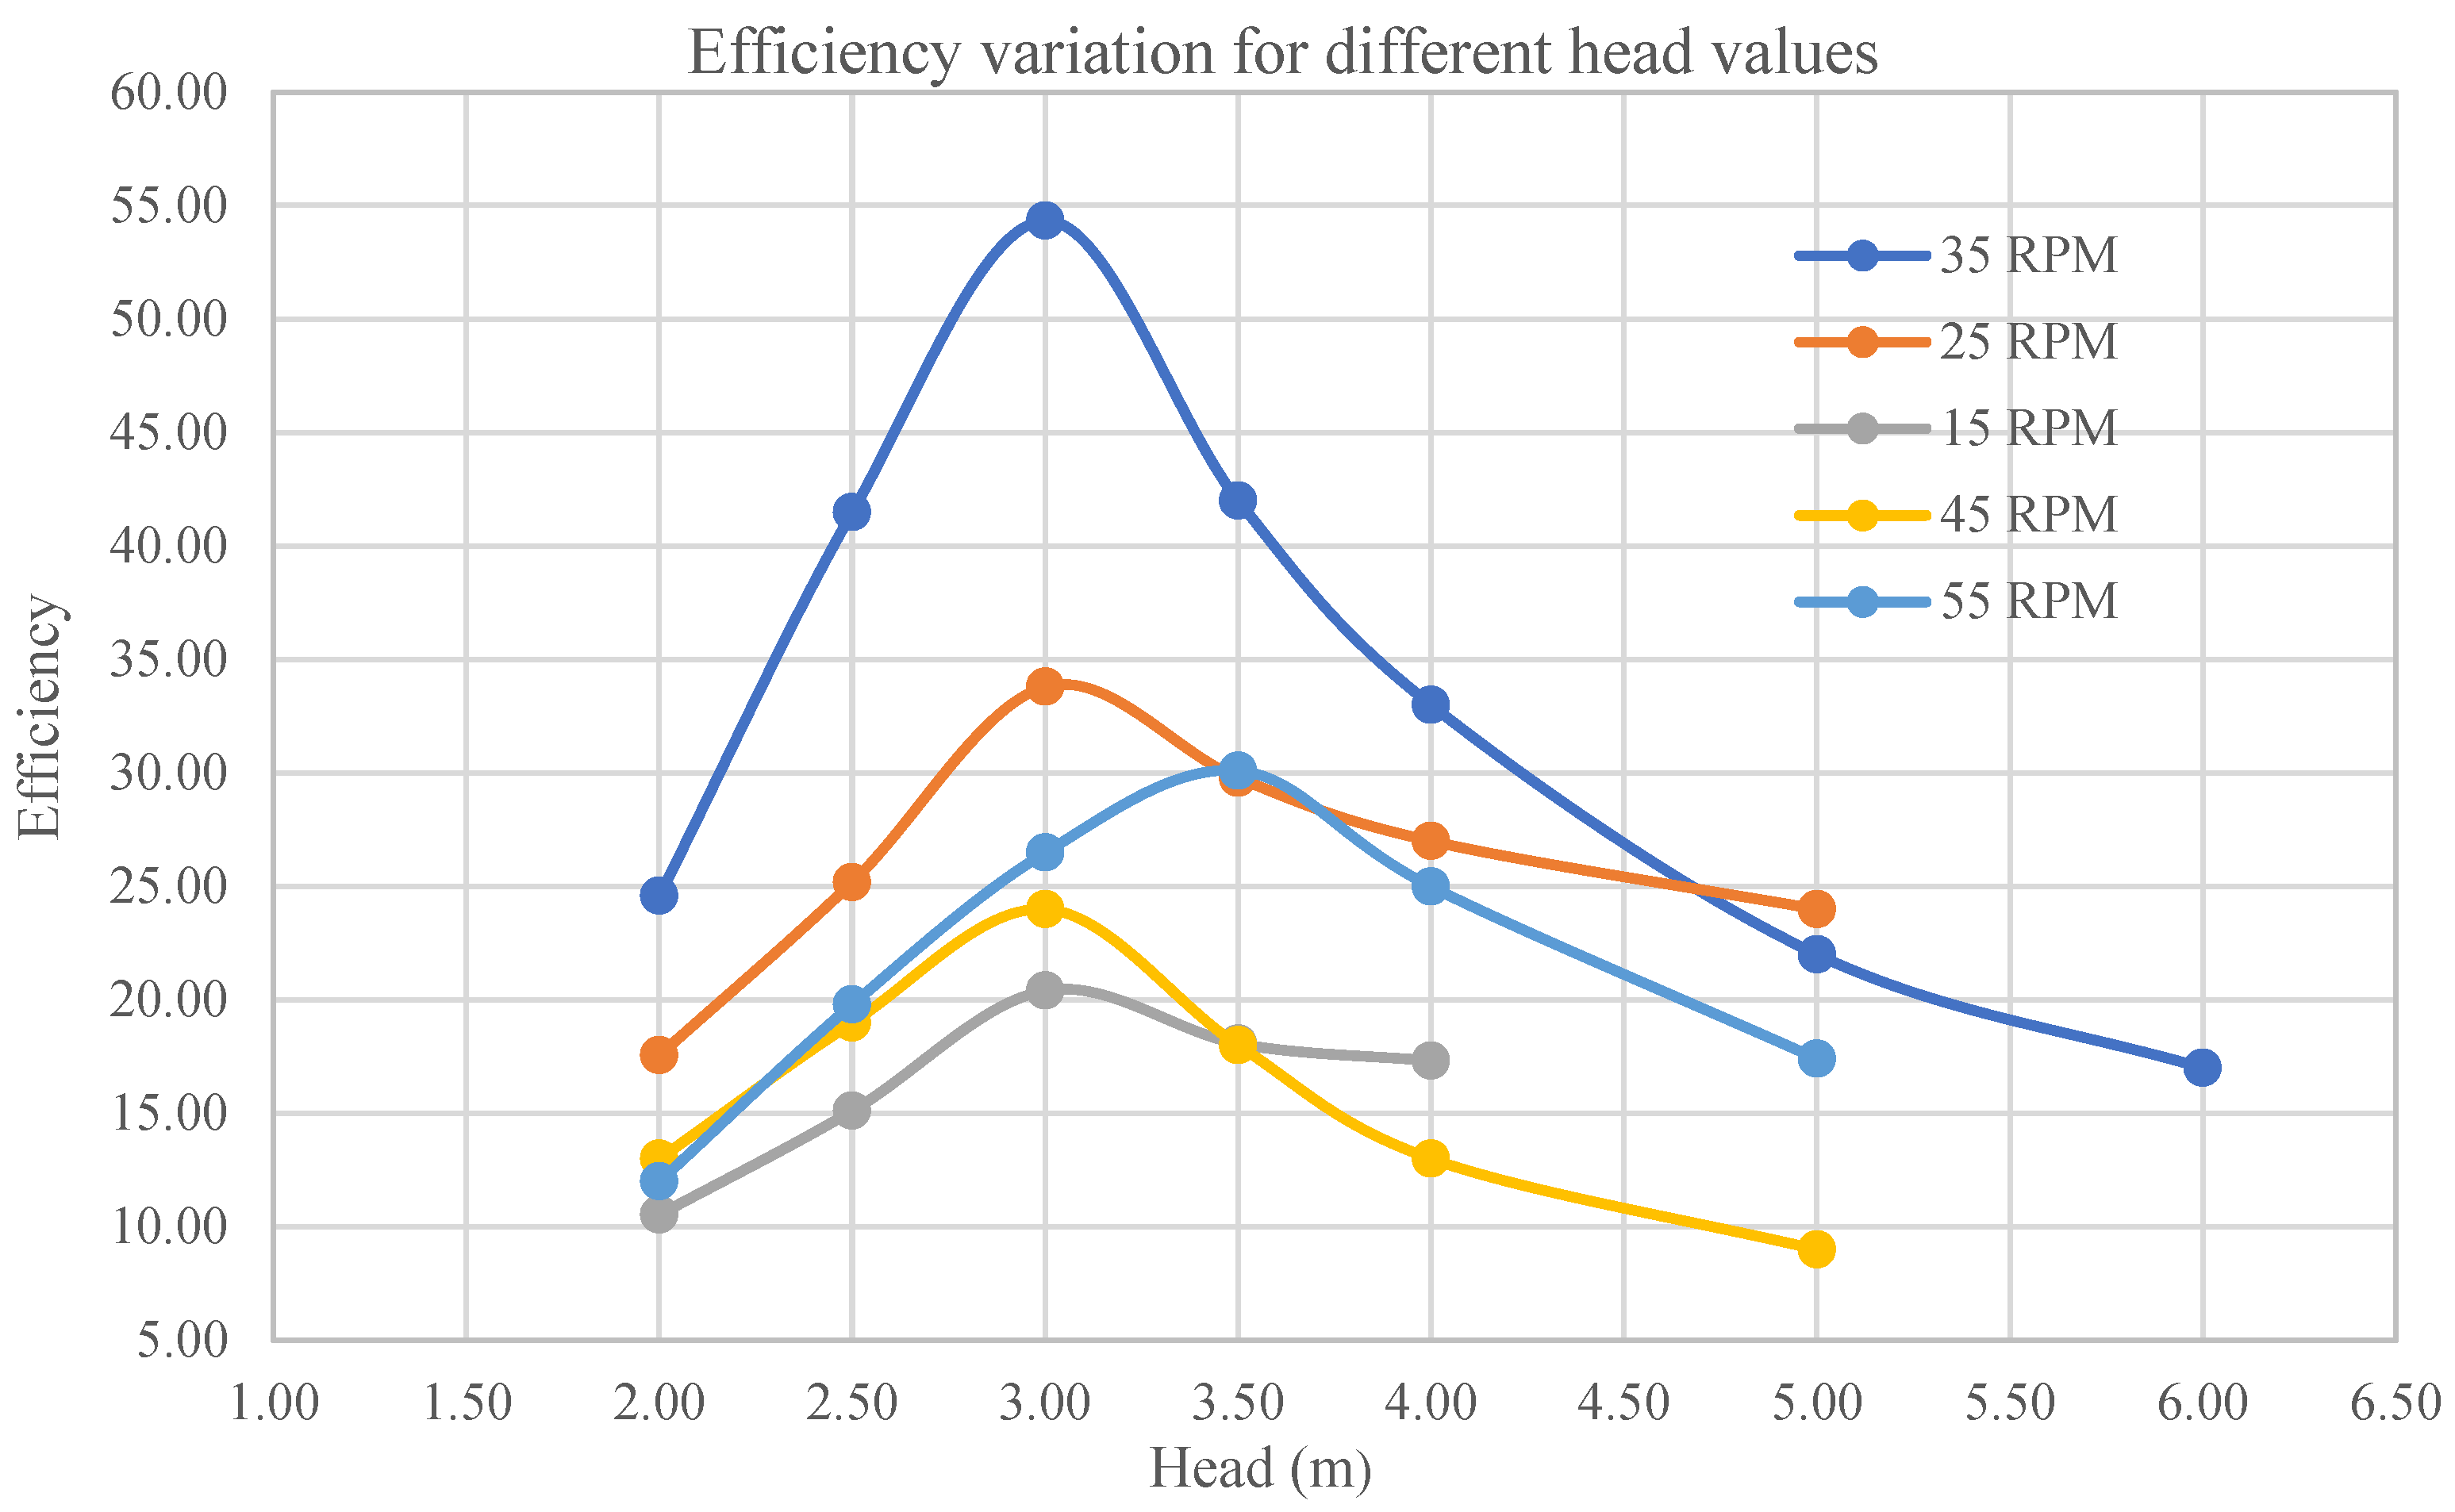
In Figure 19, the turbine produces 33.366 kW of peak power at 35 RPM, which is the maximum power extraction point for this turbine. The BEP lies in this point, demonstrating the accuracy of the results. Even though the CFT tends to operate with a flat efficiency line for a larger flow rate range, the bidirectional application-oriented turbines tend to deviate from this argument. The lowest power rating, 13.4 kW, was produced at 15 RPM due to the very low rotation rate and the turbine’s lack of ability to cope with the flow. The reverse of this case was observed at 55 RPM. These far points are considered the turbine’s off-operational points. The turbine was also tested by changing the head variant with different RPM values (Figure 20); the graph tends to agree with the cumulative results, as the turbine design condition was held constant with 3 m of head and a 35 RPM value. The turbine achieved optimal performance at the 35 RPM designed value. When the turbine RPM was at a constant fixed rate, as the head varied with time, the behavior of the turbine can be predicted by the graph in Figure 20. The accumulated results show that the efficacy increases in a head range from 4 m to 5 m at the full spectrum of the rotational speeds.

3.2.2. Geometric Modification Results: Nozzle Entry Arc Angle

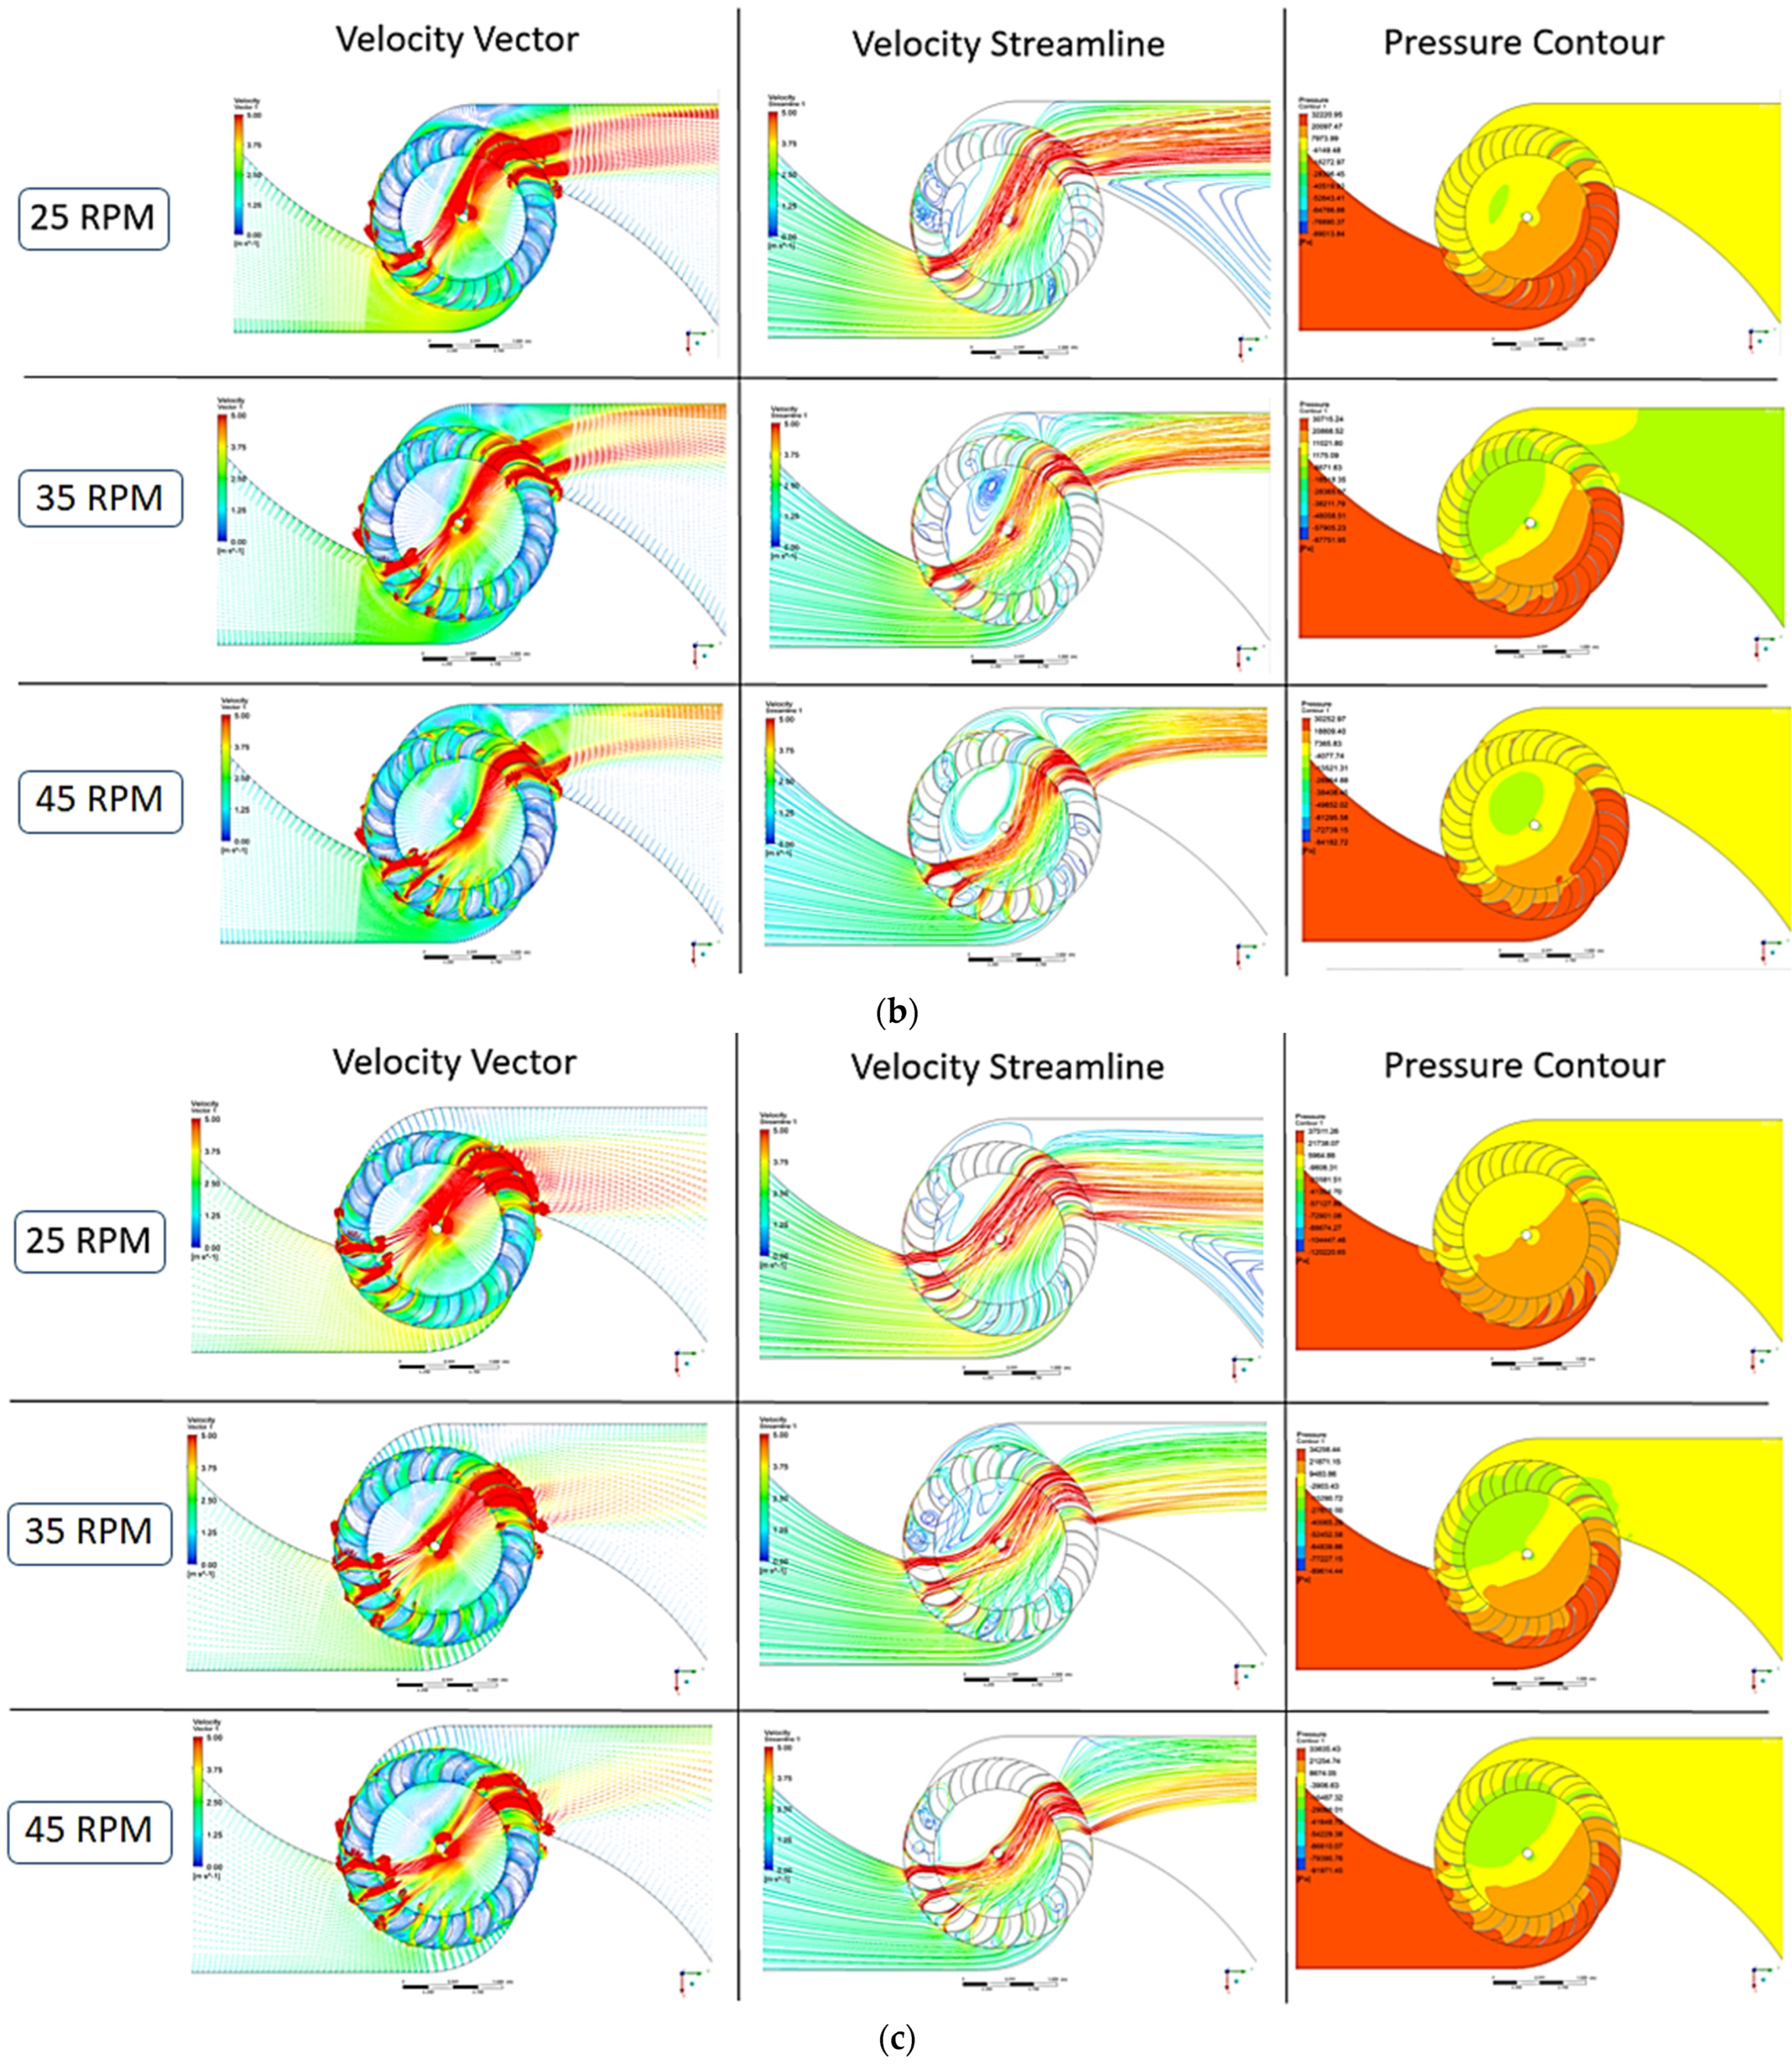
The nozzle entry arc angle (δ) was optimized to analyze its effect on turbine performance. The angle was varied from 90° to 150° in increments of 20°. The best performance was observed for the base case with a 150° entry arc angle, achieving a peak efficiency of 54.33% at 35 RPM. The lowest performance was obtained for the 90° nozzle shape model. A larger entry angle exposes more blades to incoming flow and imparts more energy onto the blades, as shown in Figure 21. This increases power production while keeping the inlet conditions constant. The 150° entry arc angle model, referred to as the base model, is used for time-averaging (oscillated) calculations to integrate with wave-energy applications. Figure 22a–c illustrate the flow fields of velocity vectors, velocity streamlines, and pressure contour variations for all the nozzle shapes analyzed. The optimized results were compared with the base model using the 150 Arc entry model, which had the highest efficiency and performance. The analysis is based on CFD post-processing.

3.3. Flow Field Analysis of the Turbine

The CFD post-processing results are analyzed with flow field variables. The flow path through the turbine runner and the blades affects the power extraction from the fluid to the blades. Low-head turbines behave more like impulse types. The momentum transfer from the fluid to the blades (see Figure 23) is shown in the velocity vector field of the turbine and through the nozzles.
As flow passes from the channel into the nozzle, it converges with higher efficiency and is smoothly streamlined through the nozzle arc interfacing runner. This optimized nozzle shape allows the flow to strike at the designed flow angle to the runner blades. Figure 23 and Figure 24 demonstrate that the nozzle converges the flow with a high impact on the runner blades. The velocity is decreased, and the flow pressure field is increased where the nozzle arc strikes the blades. These phenomena impart the maximum amount of pressure energy of the flow towards the blades as kinetic energy of striking.
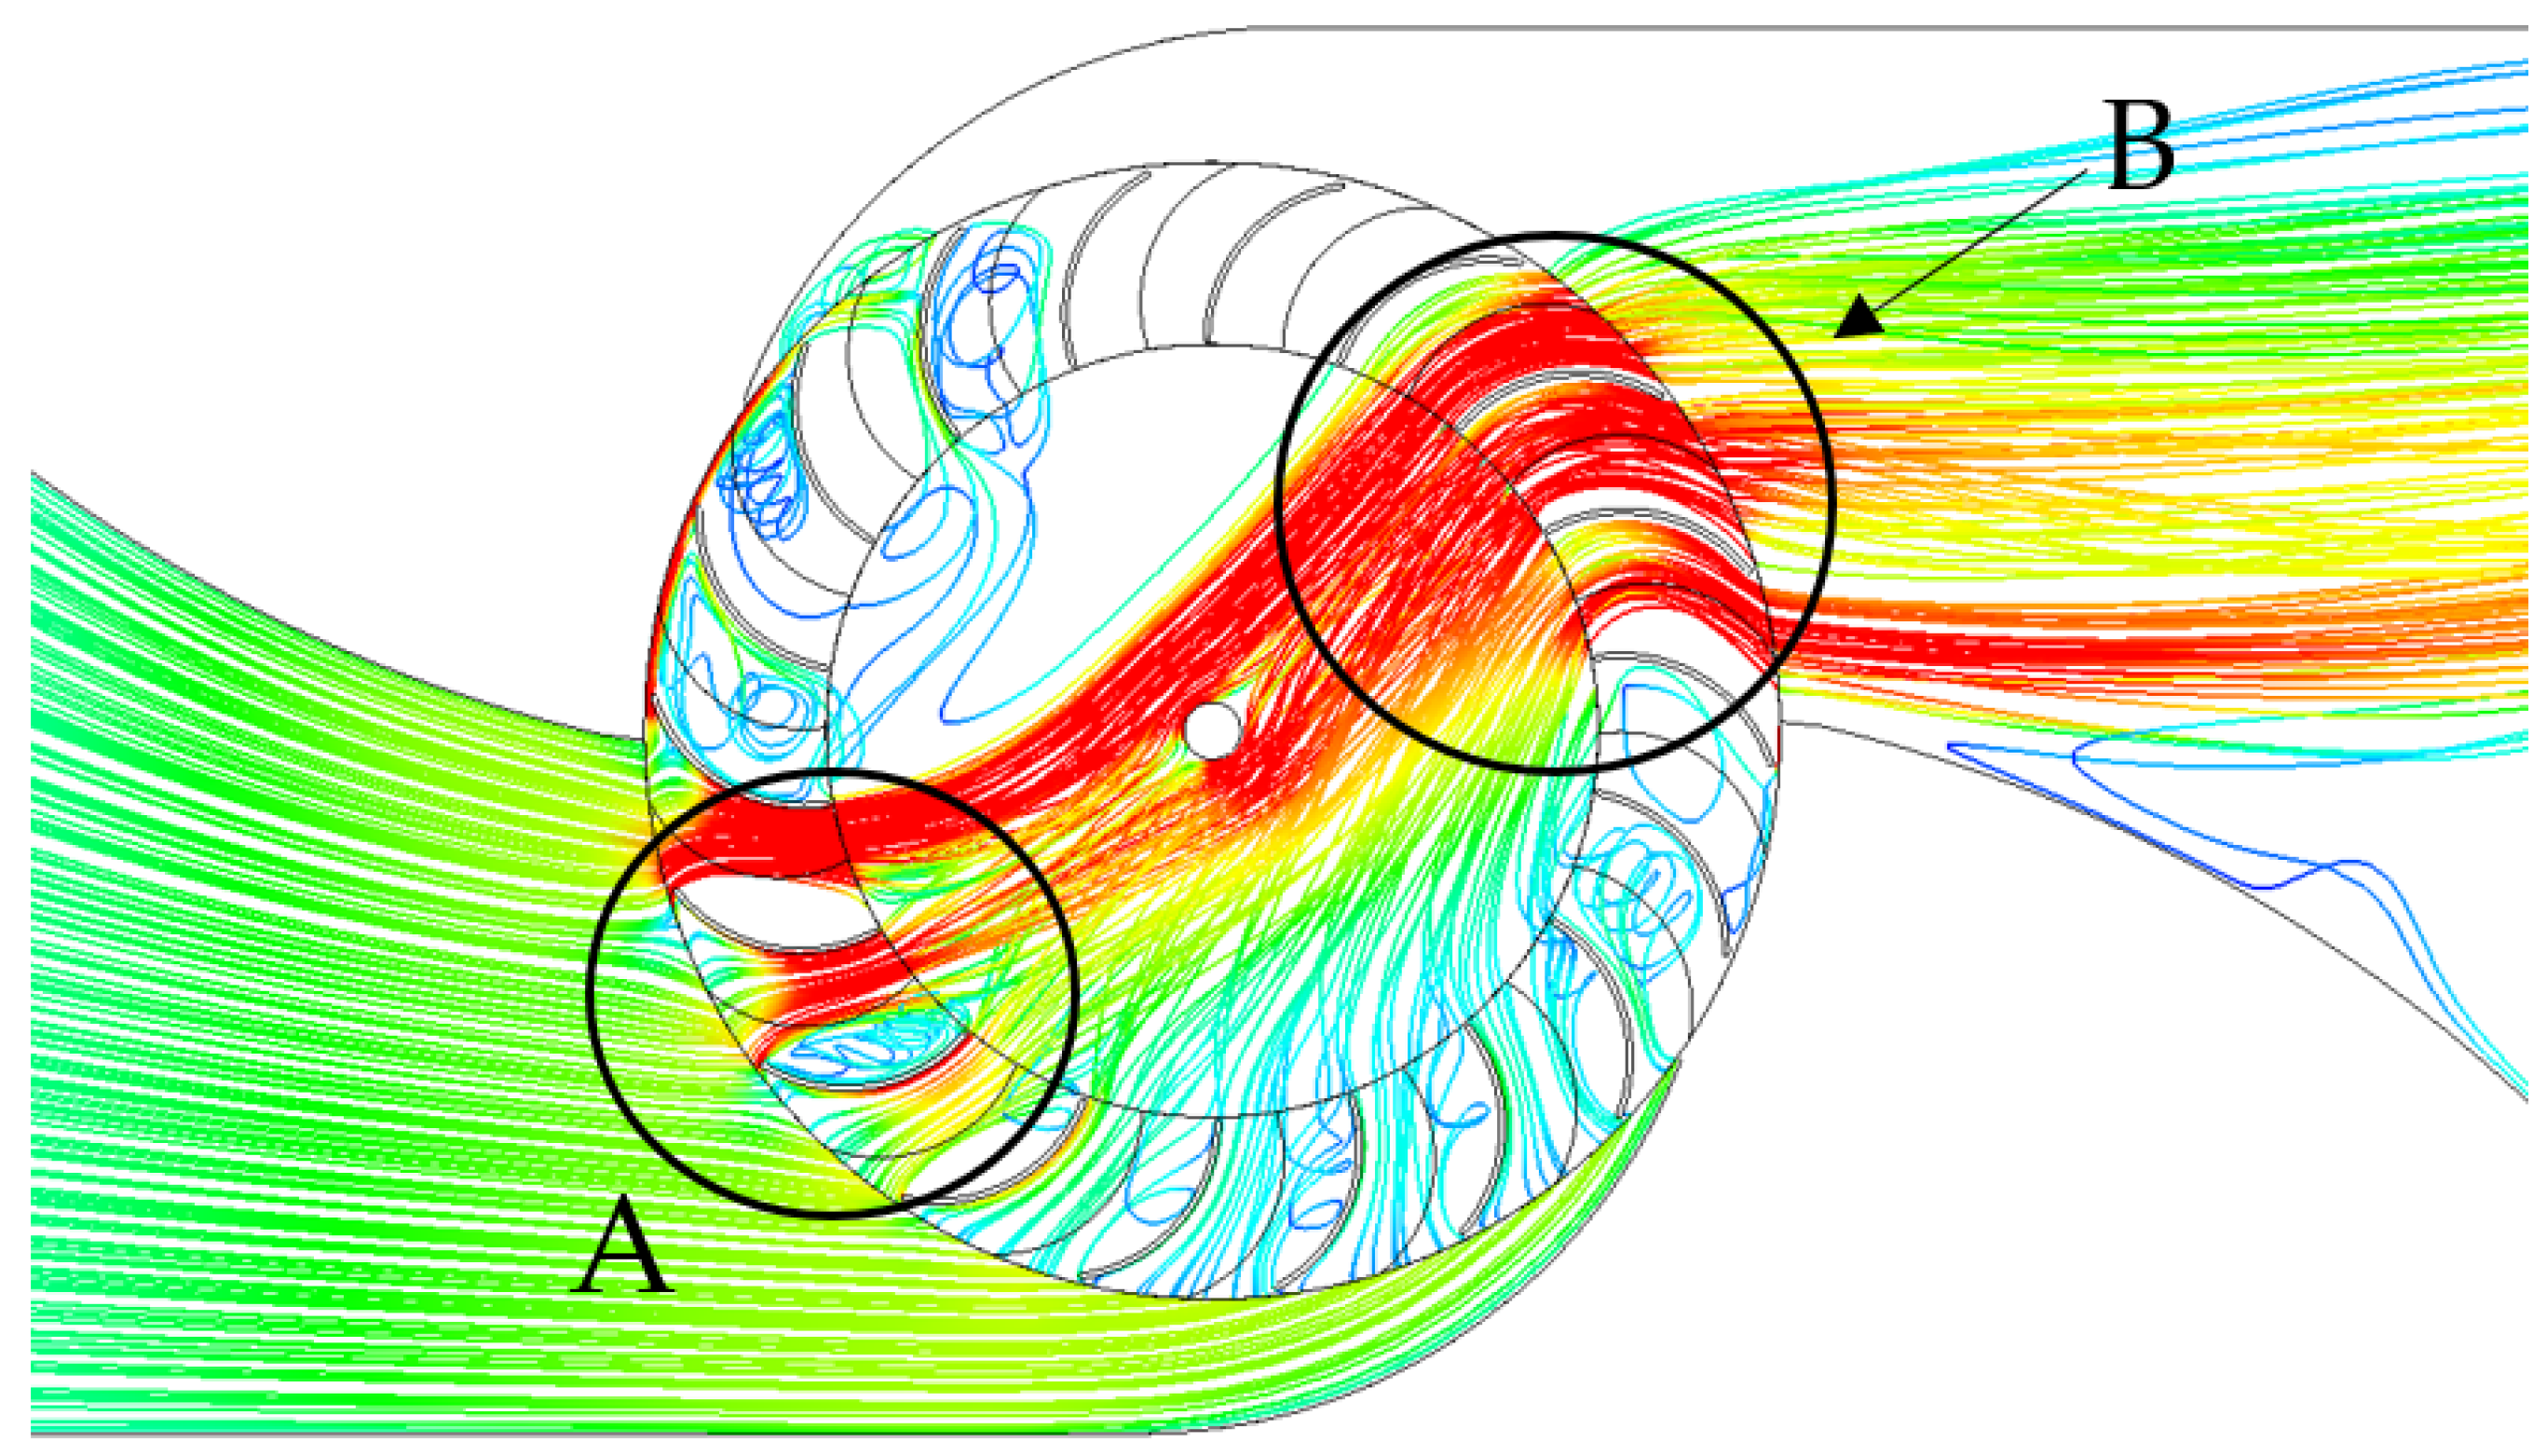
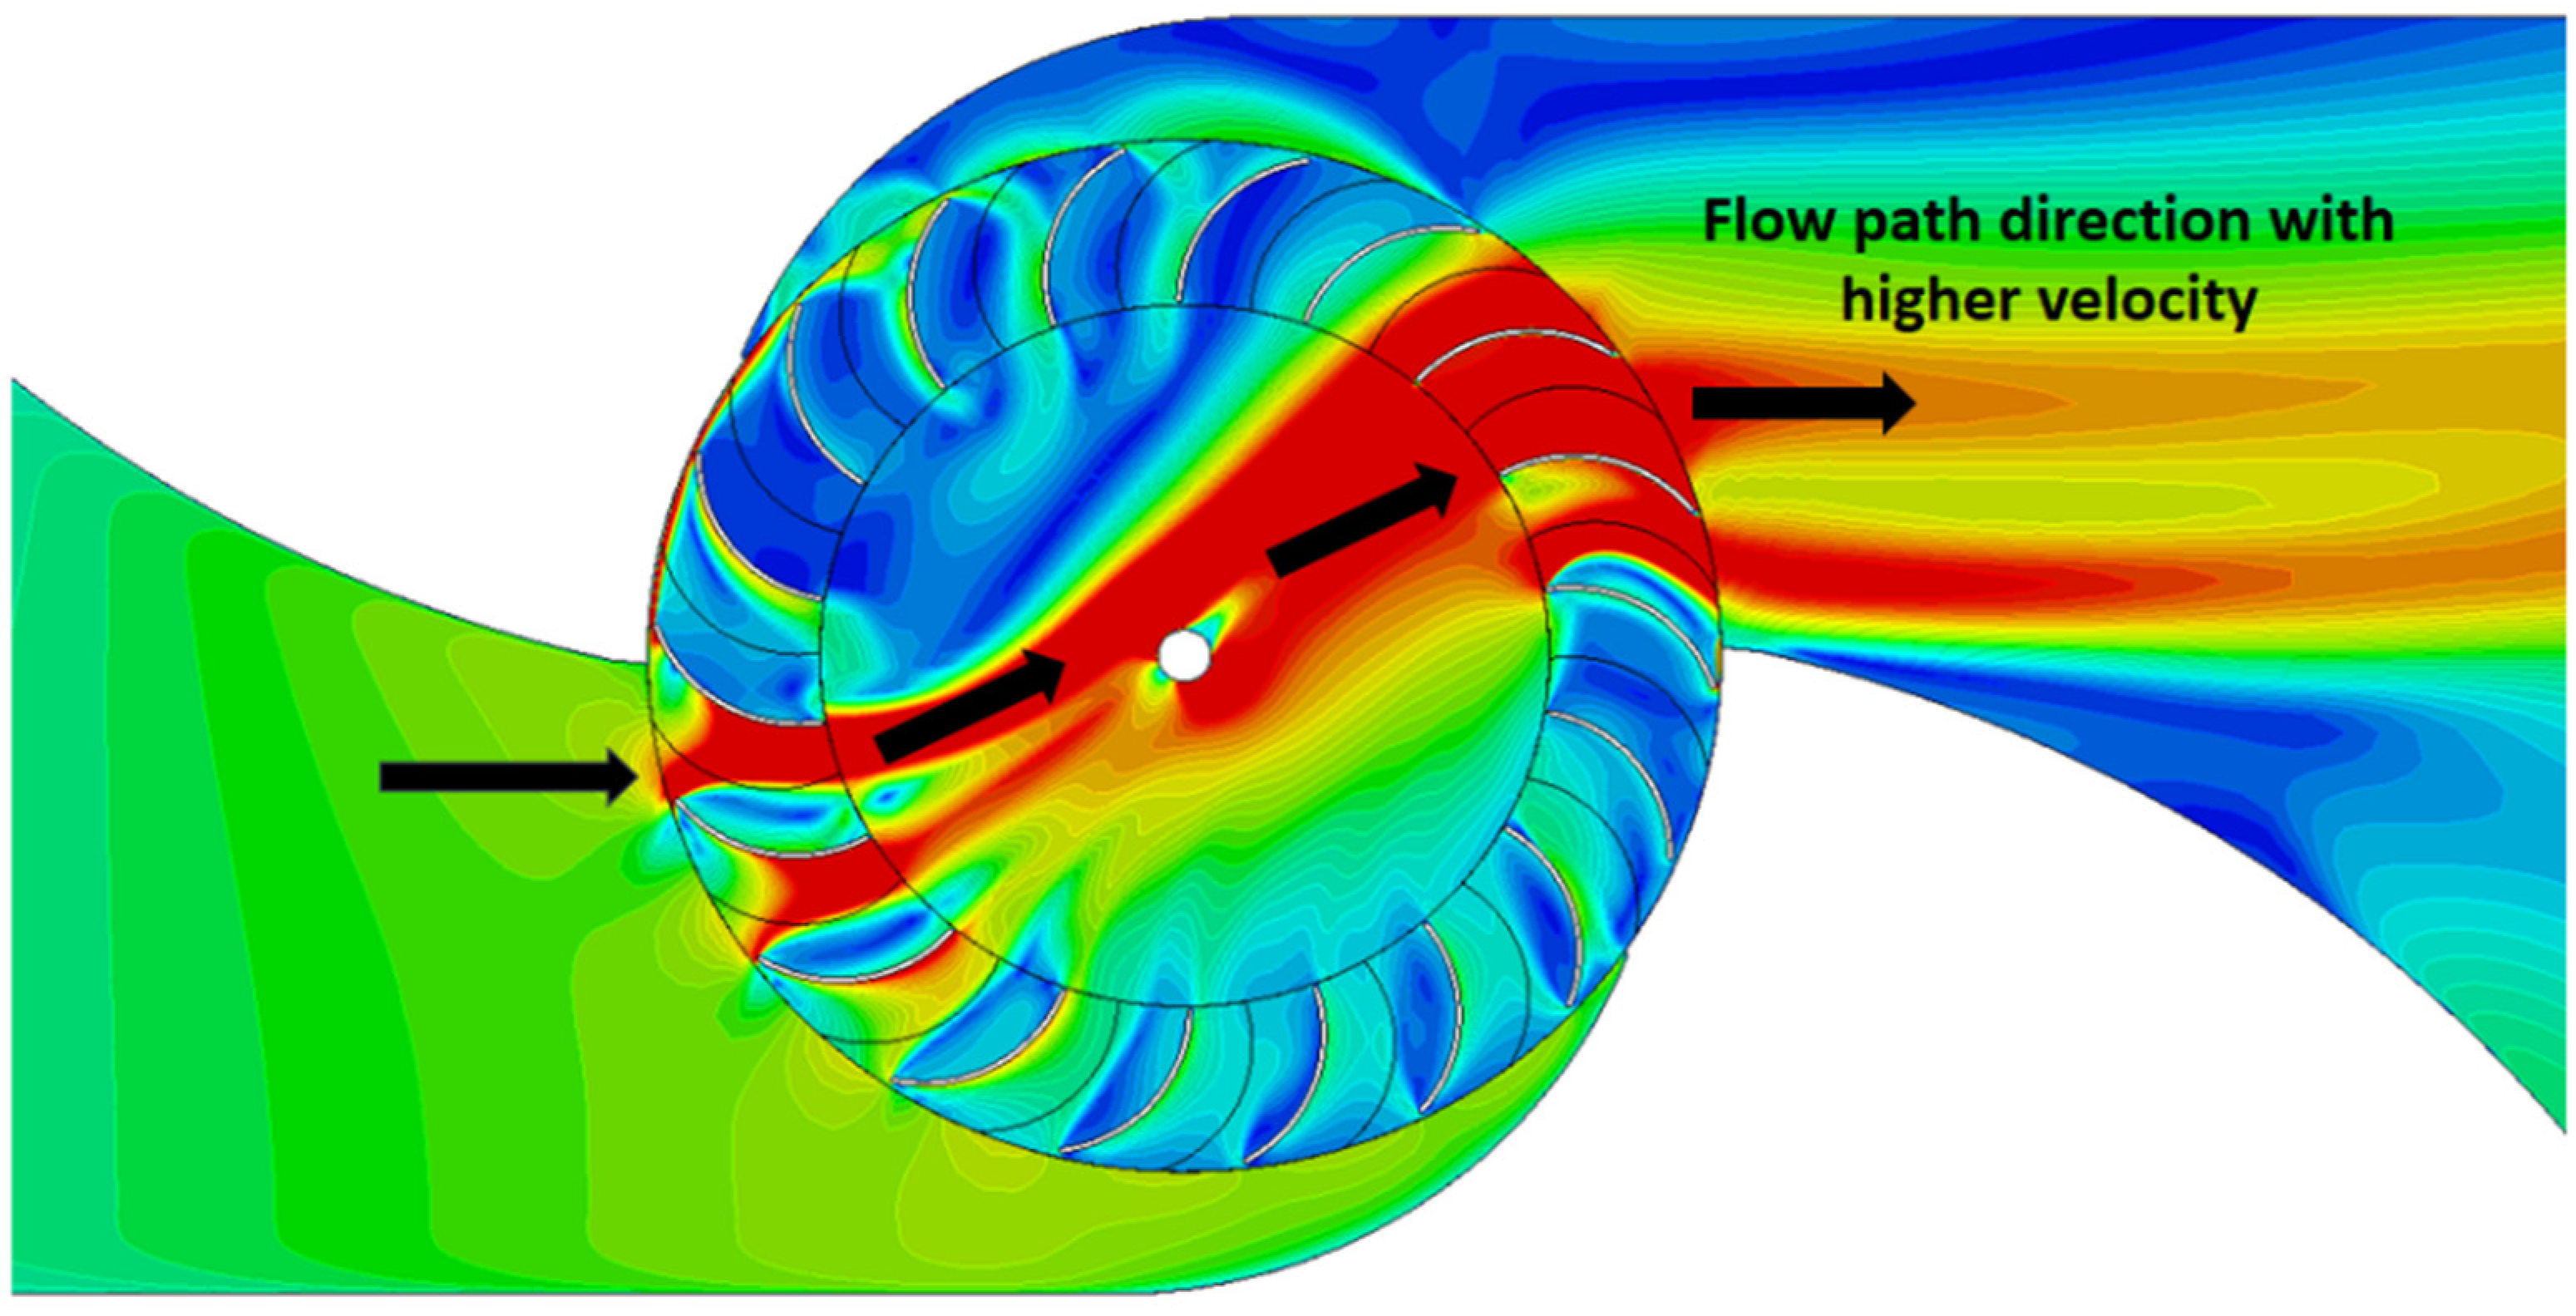
CFTs behave similarly to impulse turbines, and depending on the degree of reaction, they will start to exhibit reaction-type behavior in some regions of the runner. In the circular section A in Figure 25, the flow reaches the highest velocity at the striking blade point, and at point B, the flow achieves a higher velocity at the exit from the second stage of the runner. This phenomenon occurs because even at the second stage of the flow pass, the flow field transfers much of the available kinetic energy to the second row of blade sets in the runner. This occurs because of the complex flow behavior resulting from the nozzle shape, as explained in the illustration of the flow path direction in Figure 26.
With referring to Figure 26, this high-velocity flow path starts at the back end of the nozzle from the lower side, and it has little directional or angular movement when traveling from the first stage to the second stage. Flows have minimal energy waste when making a minor upper directional movement and leave the second blade stage by striking the blades, releasing kinetic energy. When a fluid flow path experiences abrupt flow path changes, more energy is wasted, and this clearly reduces the available energy of the flow path, affecting its ability to carry out useful work. This is another reason for the higher efficiency of the turbine compared to similar CFT model types. The flow field also has many regions of relative impotence. The complex flow behavior in rotodynamic machines is difficult to analyze due to the high turbulence field. The flow path in the non-rotating region in the middle of the shaft has many regions of flow separations and flow vortices. Figure 27 refers to the above flow separation regions that exhibit blade losses in real operation conditions more than in the CFD simulations.
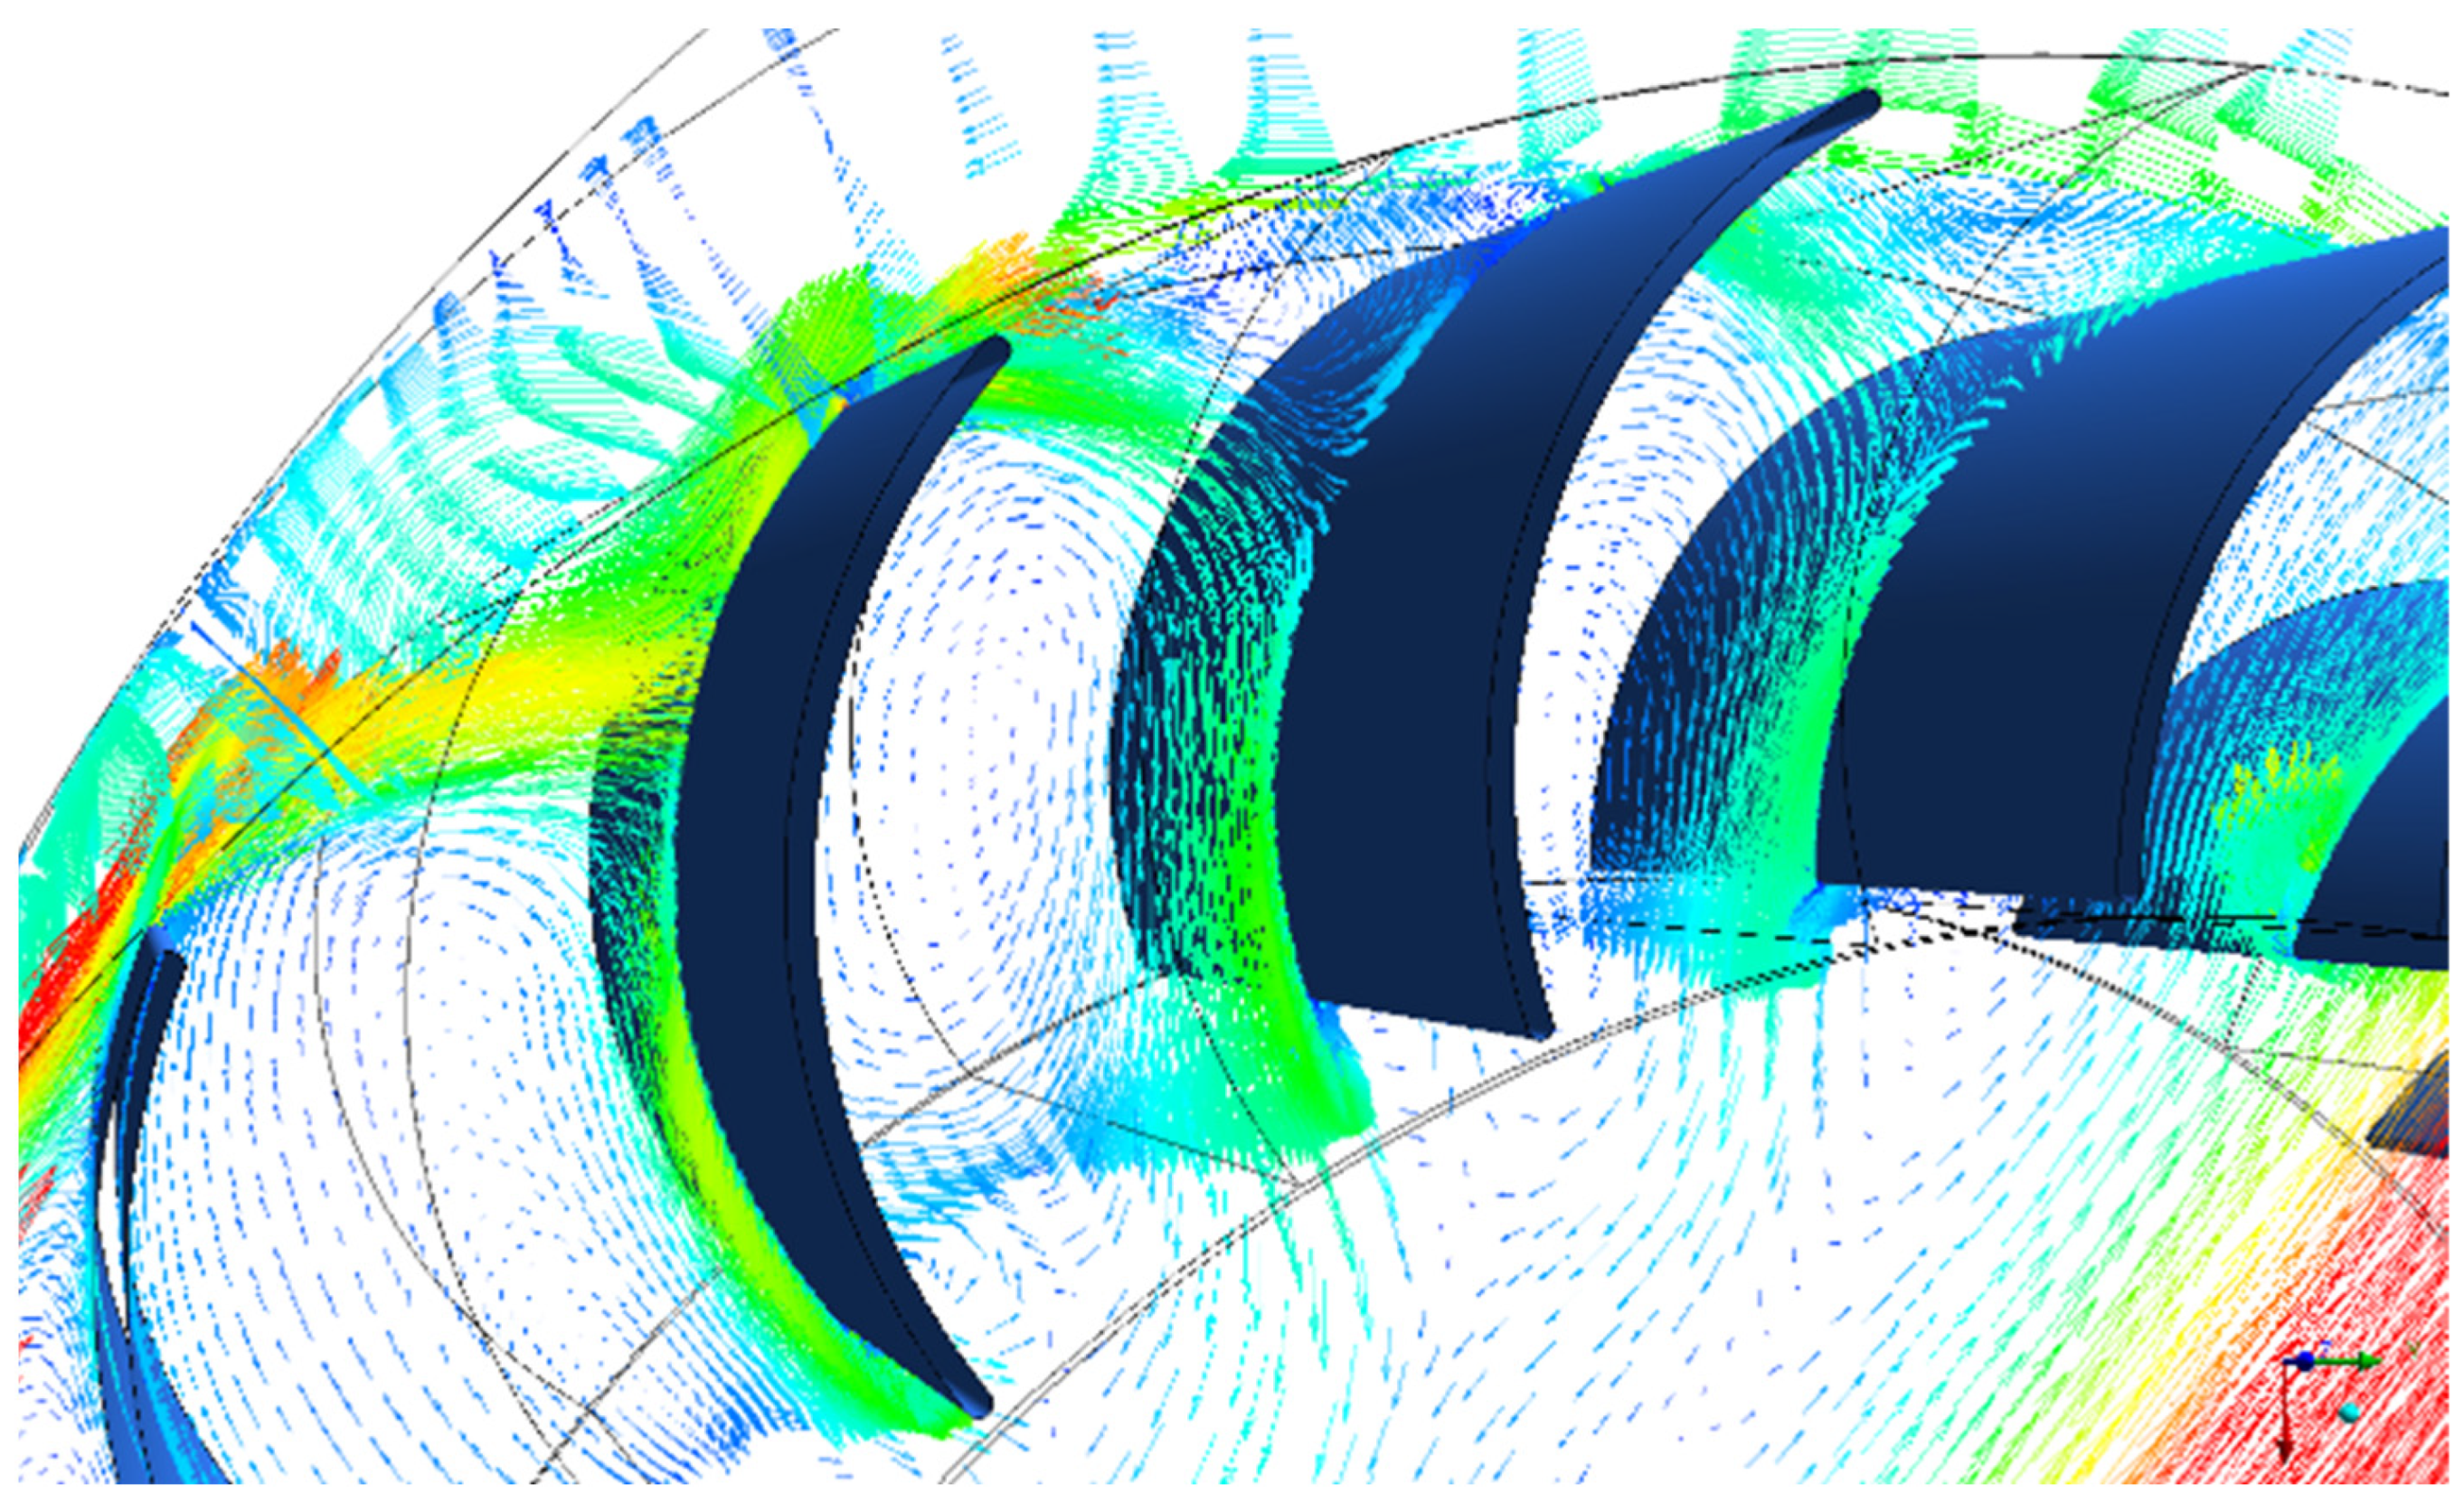
These flow separation regions are heavily influenced by the pressure variation inside the runner and in the non-rotating region in which a high-velocity jet of flow passes through. The adjacent regions counter-rotate with the rotational direction of the runner, causing low-velocity particles to separate from the mainstream. The flow separation is visible in Figure 27 highlighted at points C (black circle) and D (black box), and in real field conditions, the rate of change of flow separation leads to vortex formation. Point E represents the relative eddy phenomena in the blades, which is essentially the blade circulation. This phenomenon can be captured by the CFD method, primarily due to the clarity of the generated mesh and nodal distribution. Additionally, the implementation of the prism layer near the blade surfaces is crucial for capturing the fluid flow phenomena that affect performance. It is important to analyze the aforementioned effects to effectively optimize turbine design.
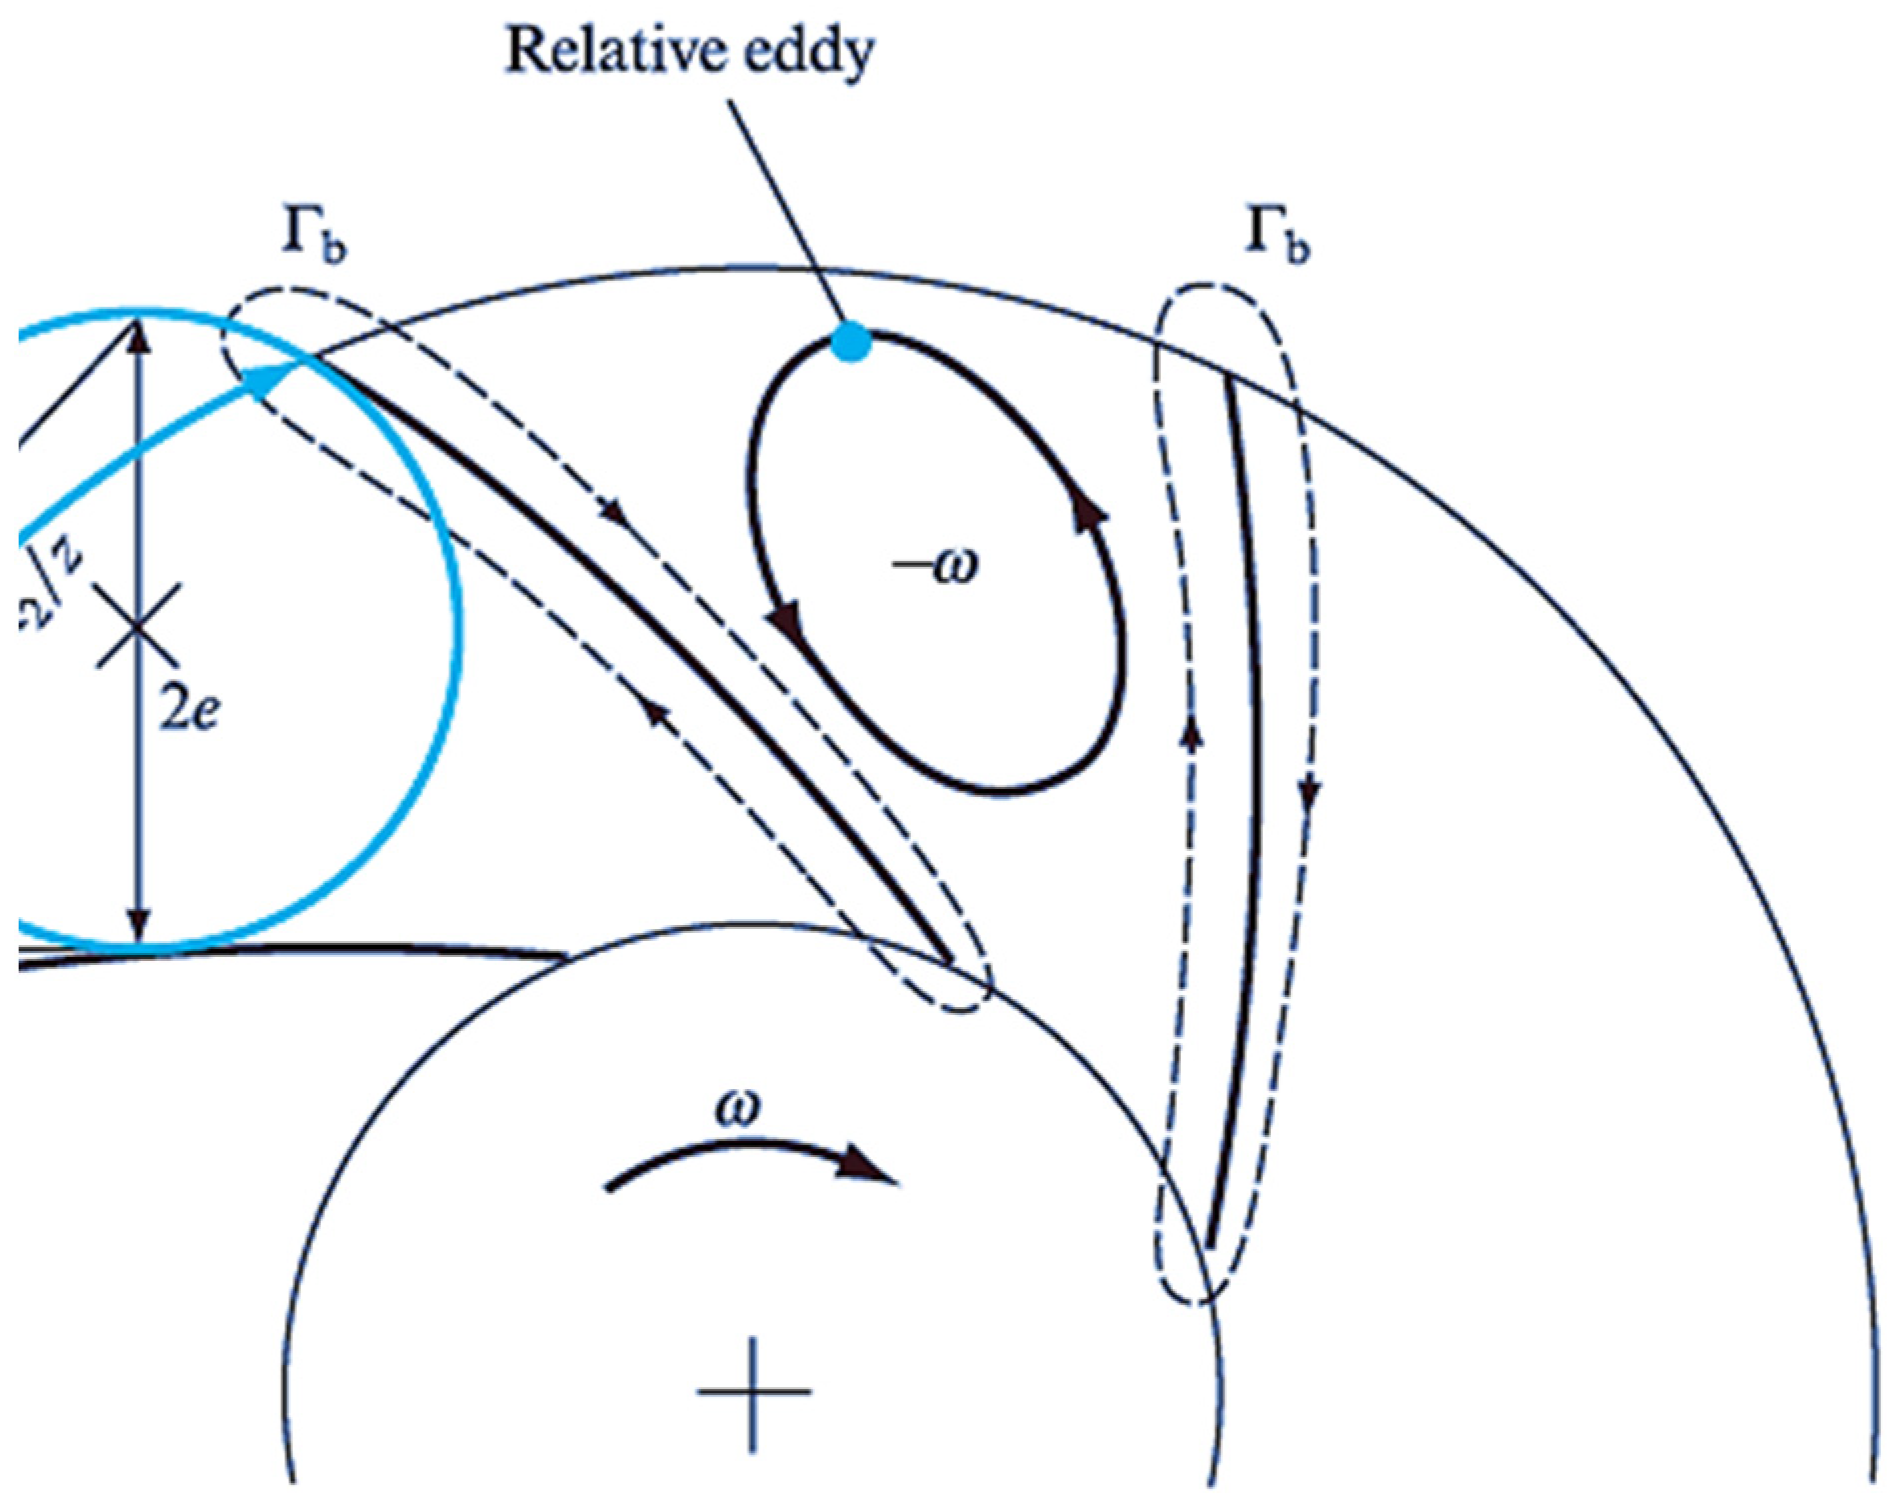
Eddy formations can be clearly observed near the blades and between two adjacent blades. Figure 28 illustrates the 2nd stage of blades where the eddy formation is greater, the circular section F; main eddies in between the two successive blade passages, and circular section G; the eddy structure very close to the trailing edge of a 2nd stage runner blade. Figure 29 presents the 3D illustration of the complex flow filed in between two successive blade passages and the relative eddy formation on the exit of the flow from the turbine. These formations occur due to the relative eddy phenomena caused by the frictionless fluid passing through the runner blades without rotation. Since the runner rotates at a positive angular velocity, the fluid must have a rotation relative to the impeller of the opposite direction, forming relative eddies (Figure 30). The size of these eddies may vary with an increase in the blade gap; thus, it is crucial to minimize blade losses in turbine design as they are considered a form of slip loss.
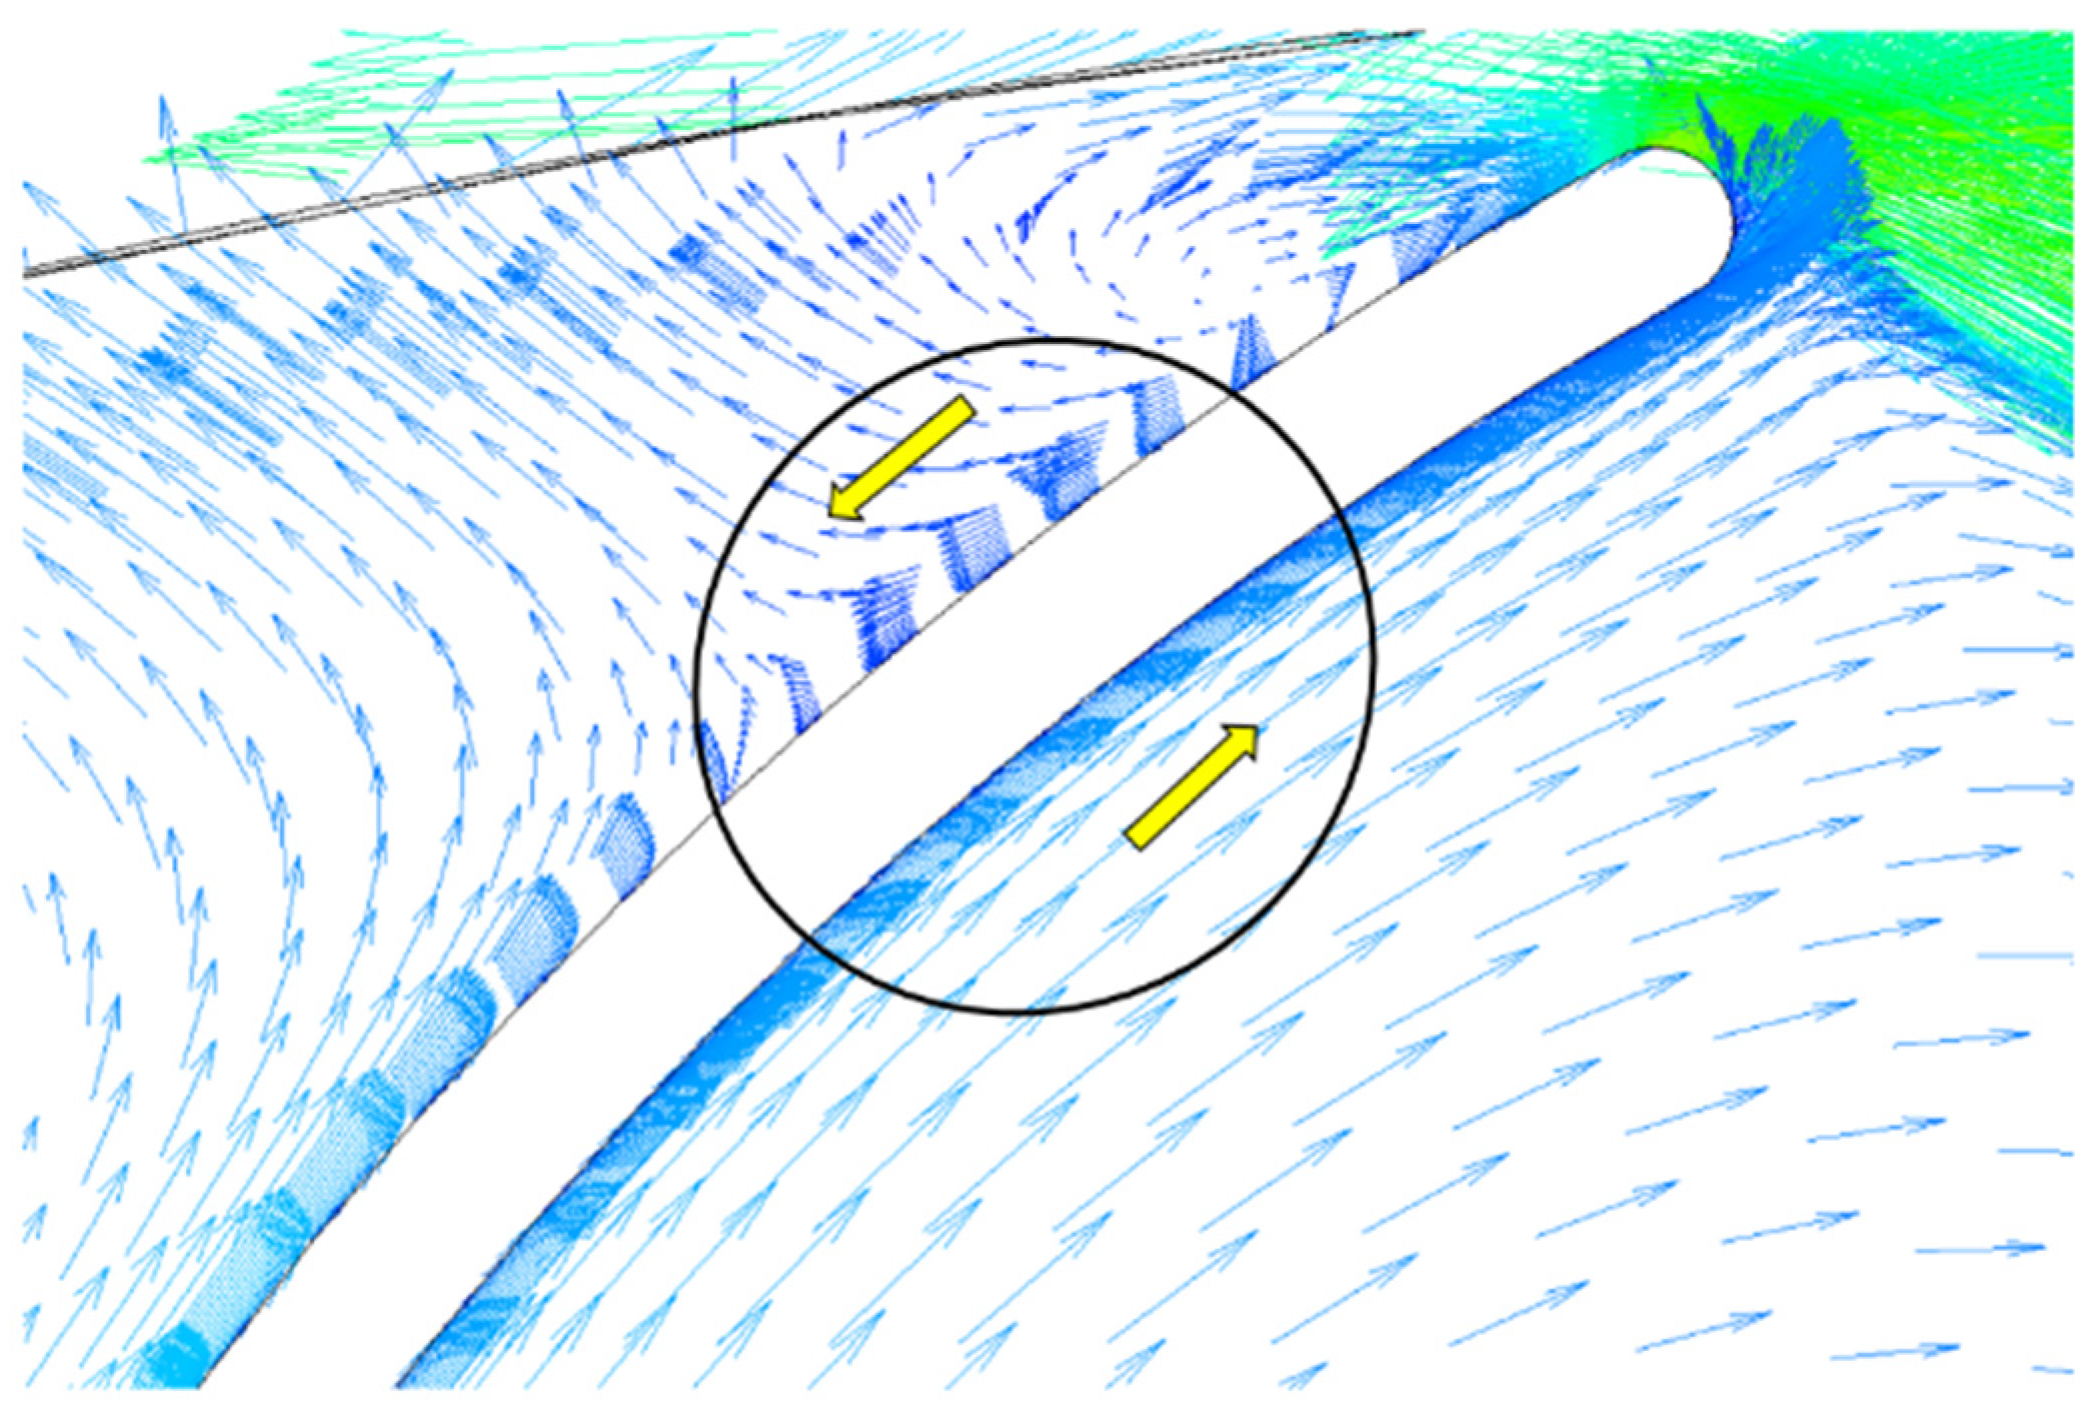
Another important flow field phenomenon is blade circulation, which is clearly visible and can be captured by the CFD code. The pressure difference on the two sides of the blades causes this slip formation. As shown in and Figure 31 (simulation) two yellow arrows on either side of the blade illustrates this phenomena, and Figure 32 (theoretical) the sides of the blades have nearly different pressure gradients, and hence circulation occurs at the blade. The pressure in the fluid on one side of the blade is greater than the other, causing the velocity near the backside of the blade to be greater than that near the forward side. This velocity difference on the two sides of the blade creates blade circulation associated with lift. However, the non-uniform velocity distribution is responsible for the mean direction of flow leaving the runner, which deviates from the ideal flow situation. This effect reduces the tangential velocity component (velocity of whirl), which is therefore known as slip. It is crucial to analyze this phenomenon using CFD in turbine optimization.
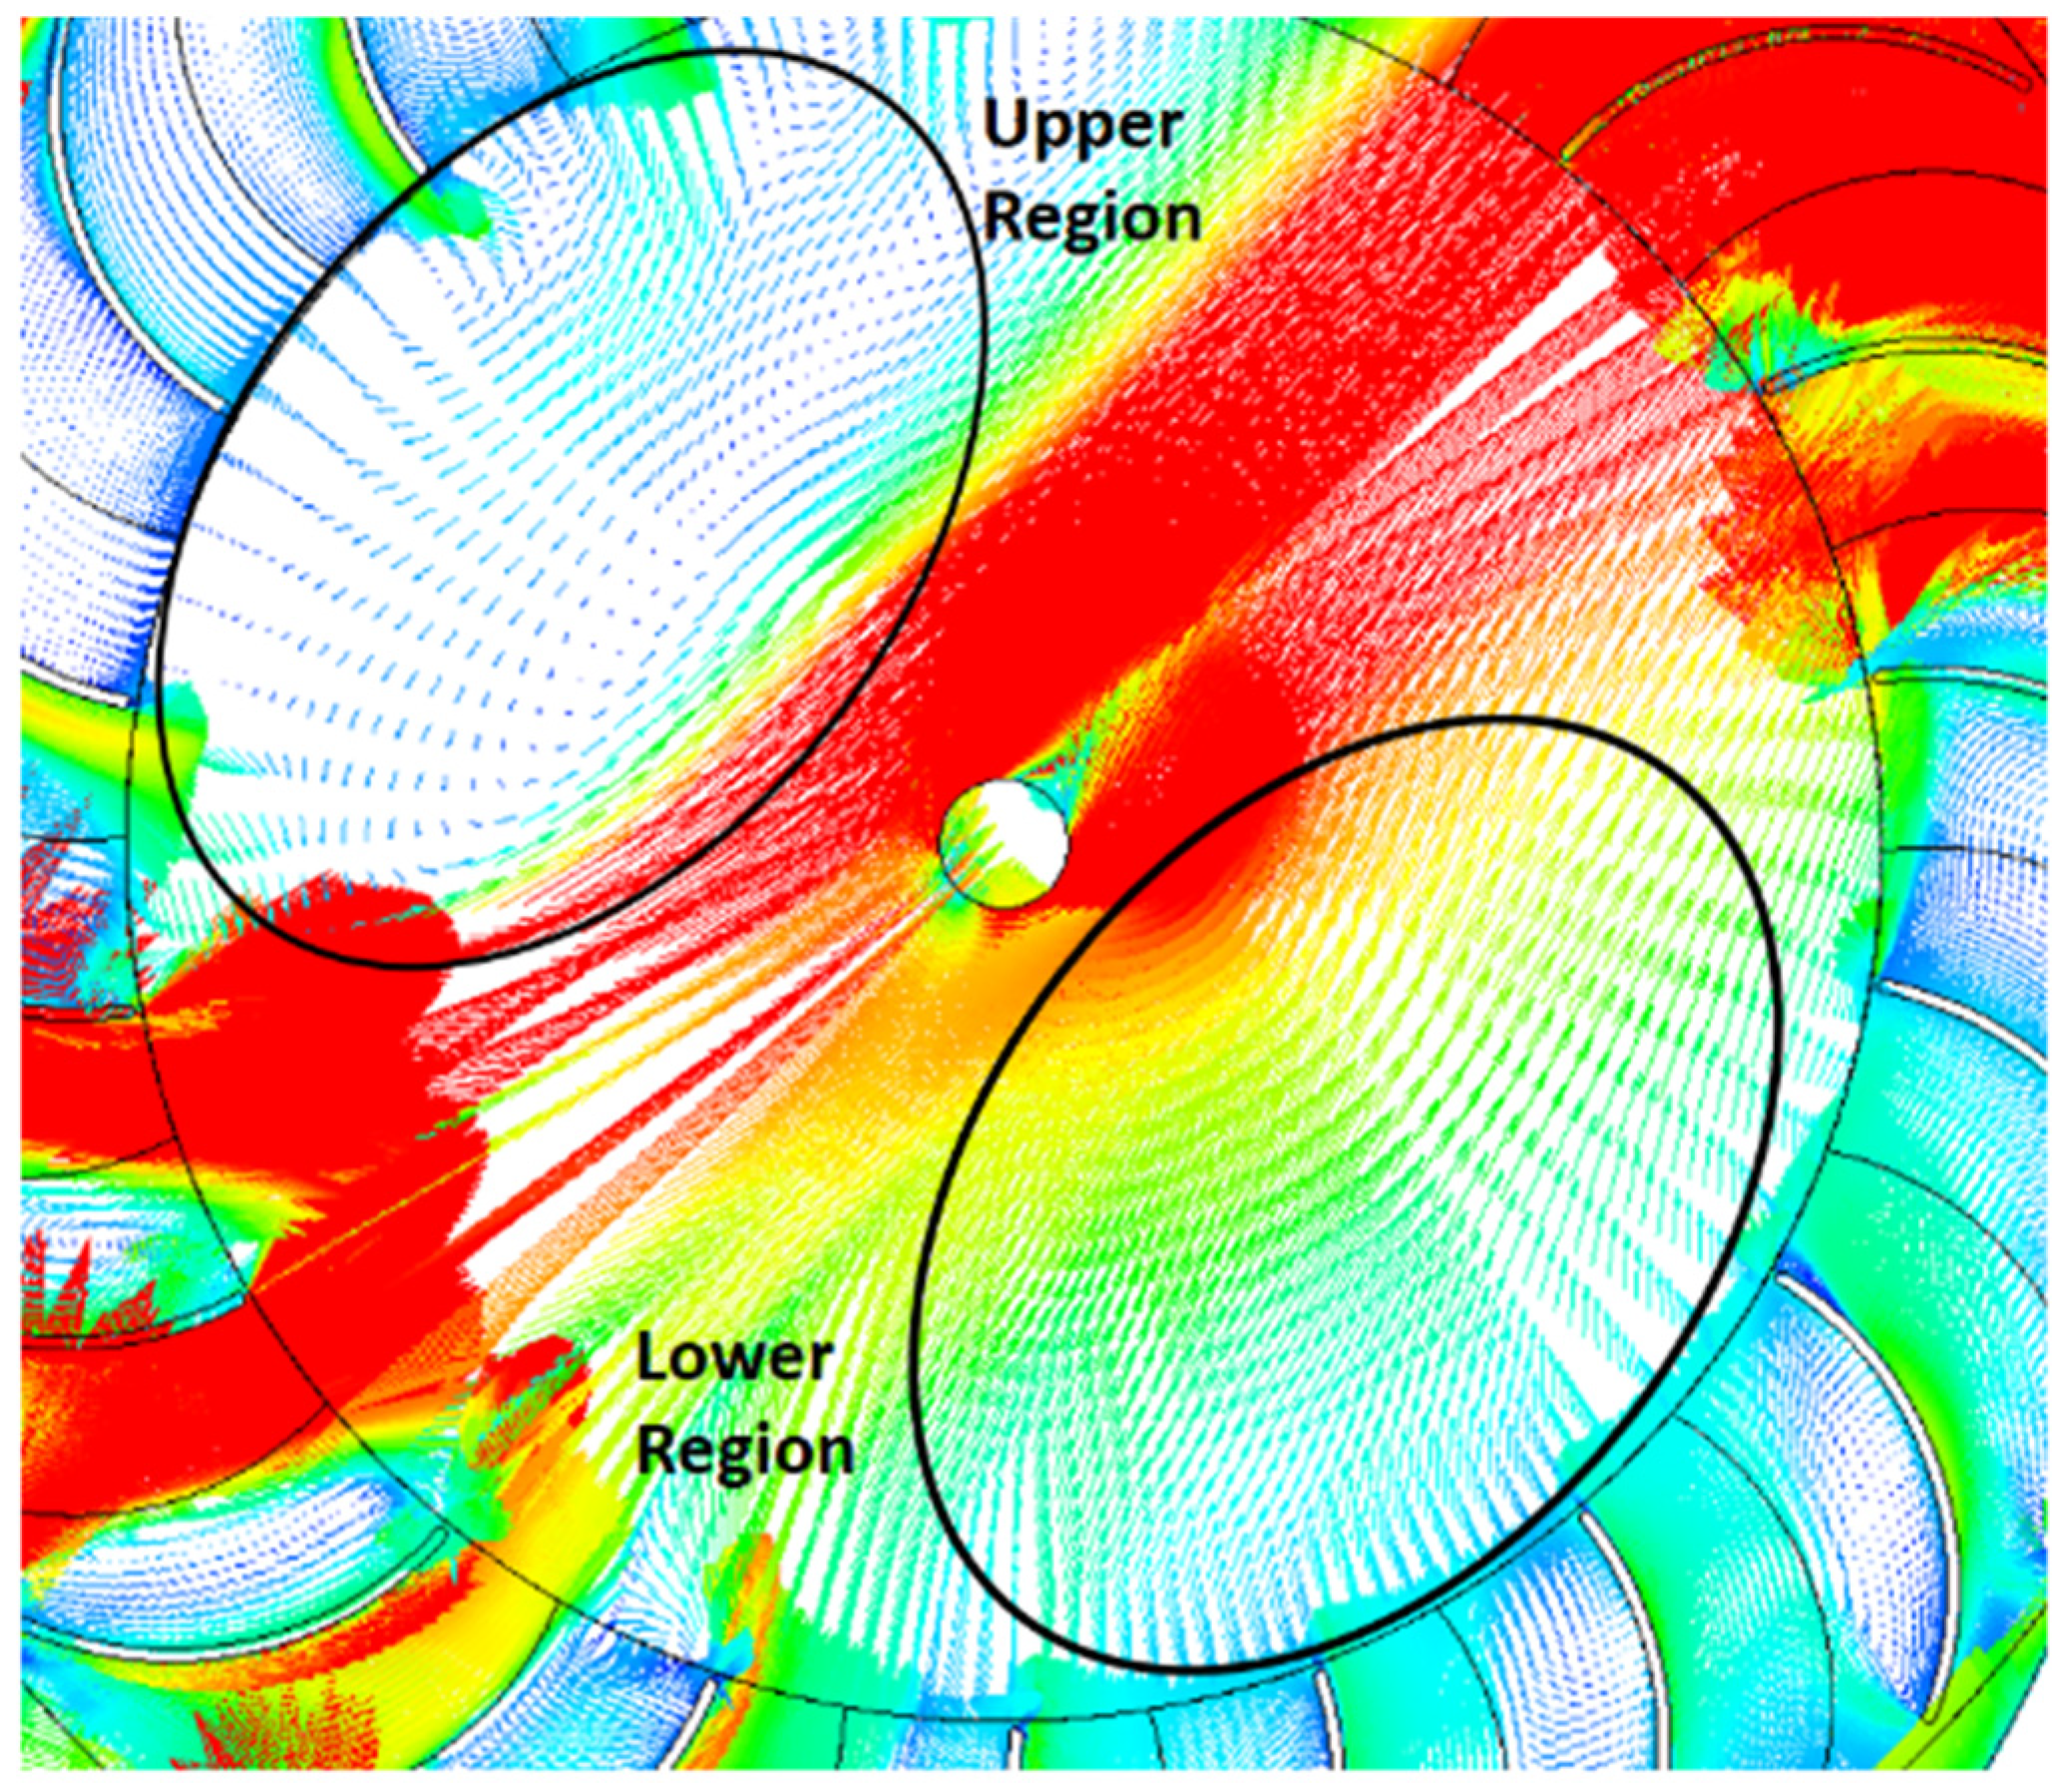
Two fundamental reasons explain the actual energy transfer achieved by a hydraulic machine, which is reduced compared to the prediction made using Euler’s Equation. Firstly, the velocities in the blade passages and at the impeller outlet are non-uniform due to the presence of the blades, and the real flow is three-dimensional (3D). This diminishes the velocity of the whirl component, theoretically reducing Euler’s head in the design. This effect is not due to friction and does not represent a loss but follows from the ideal flow analysis of pressure and velocity distributions. Secondly, in a real turbine runner, energy is lost due to friction, separation, and wakes associated with the development of boundary layers. The flow field also has little or no flow in the upper section of the turbine runner due to the middle water jet passing with very minimal flow directional change. The upper region shows recirculation flow due to vortex formation. This also affects the bottom half of the turbine runner and the blades. Additionally, the fluid stream is not significantly distorted in the bottom portion of the turbine, compared to the much more distorted flow in the upper part of the blades and nozzle. Figure 33 shows these two regions separately.
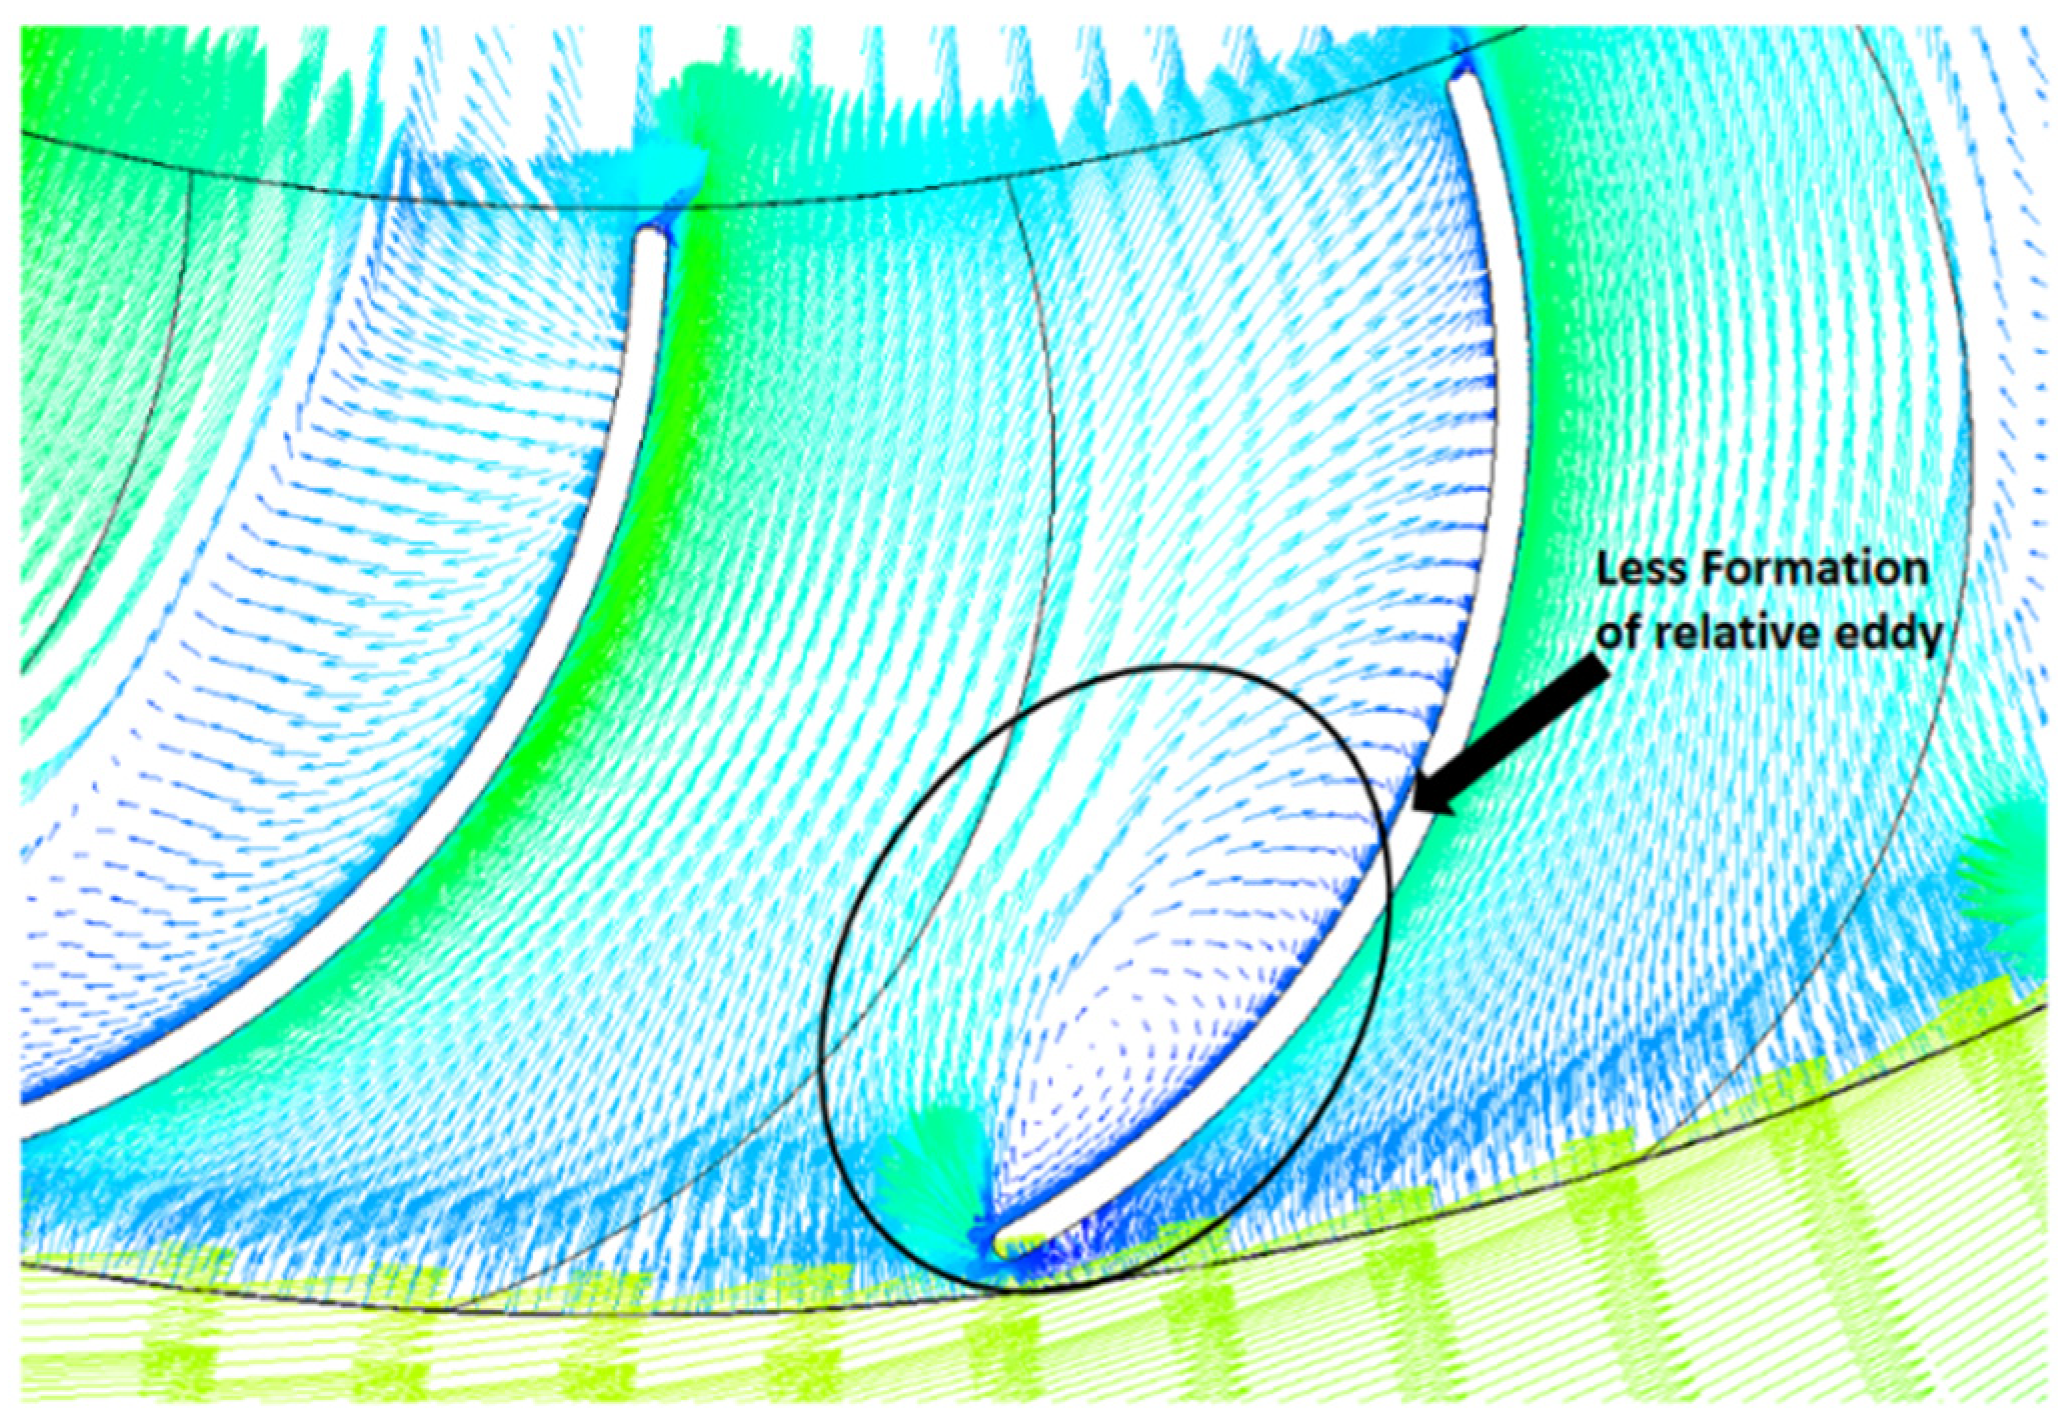
The flow in the bottom half of the runner section is organized and streamlined, with the water jet dividing the runner into two halves. This is greatly enhanced by the fact that (Figure 34) bottom of the blades entering the 1st stage runner blading region has less formation of relative eddies. This influences the fluid particles to adhere to each other, causing pressure distribution in two regions. As a result, there is less formation of eddies and more transformation of pressure energy to the blades, partially in the specified region.
The flow through the upper nozzle (outlet nozzle) has greater flow separation and backflow regions, as shown in Figure 35. CFD post-processing indicates that the upper nozzle with a black border marking signifies the reversal of the flow field. This phenomenon is due to the decrease in the speed of the fluid in a particular region, and the boundary layer thickness increases significantly. The adverse pressure gradient has increased such that the flow is forced back against the actual flow direction. This results in the backflow area detaching the laminar flow itself from the contour at this point.

3.4. Transient Calculations Results and Bidirectional Flow Analysis

Transient calculations are required to analyze the bidirectional performance of the turbine [27,28,29] when integrated as a WEC turbine. The bidirectional flow is created by an Ansys CFX CEL expression attached to the inlet boundary conditions. The wave period is 9.0 s, and the wave height is 3.0 m. Numerical simulations are conducted for a 45 RPM case to compare the results. The wave-energy calculation is based on the equations below. The available water power (PWP) is given by the following Equation (7), where Cp is the phase velocity, Cg is the group velocity, g is the acceleration due to gravity, ρ is the water density, and PWave is the wave energy flux or wave power.
c p = g λ 2 π tan h ( 2 π h λ ) ;   Wave   Celerity
c g = 1 2 C p { 1 + 4 π h λ ( 1 s i n h ( 4 π h λ ) ) } ;   Group   Velocity
P W a v e = 1 8 ρ g H 2 c g ;   Wave   Power
P t u r b i n e = τ × ω ;   Turbine   Power
η = P t u r b i n e P W a v e × W G ;   Efficiency
Q = V T = A c s × ( 2 Δ Y ) T   P W P   = ρ g Q Δ H
P A v a i l = P w a v e × W G
C f = P W P P A v a i l
For the given period T, there are two oscillations in the rear wave maker; that is, the water level rises to a maximum and falls to a minimum, displacing twice the volume. Thus, ΔY is multiplied by a factor of “two” in Equation (12). ACS is the rear chamber cross-sectional area, which was 1.15 m2. Primary energy conversion is then obtained.

The Bidirectional Flow Results (Transient Simulation)

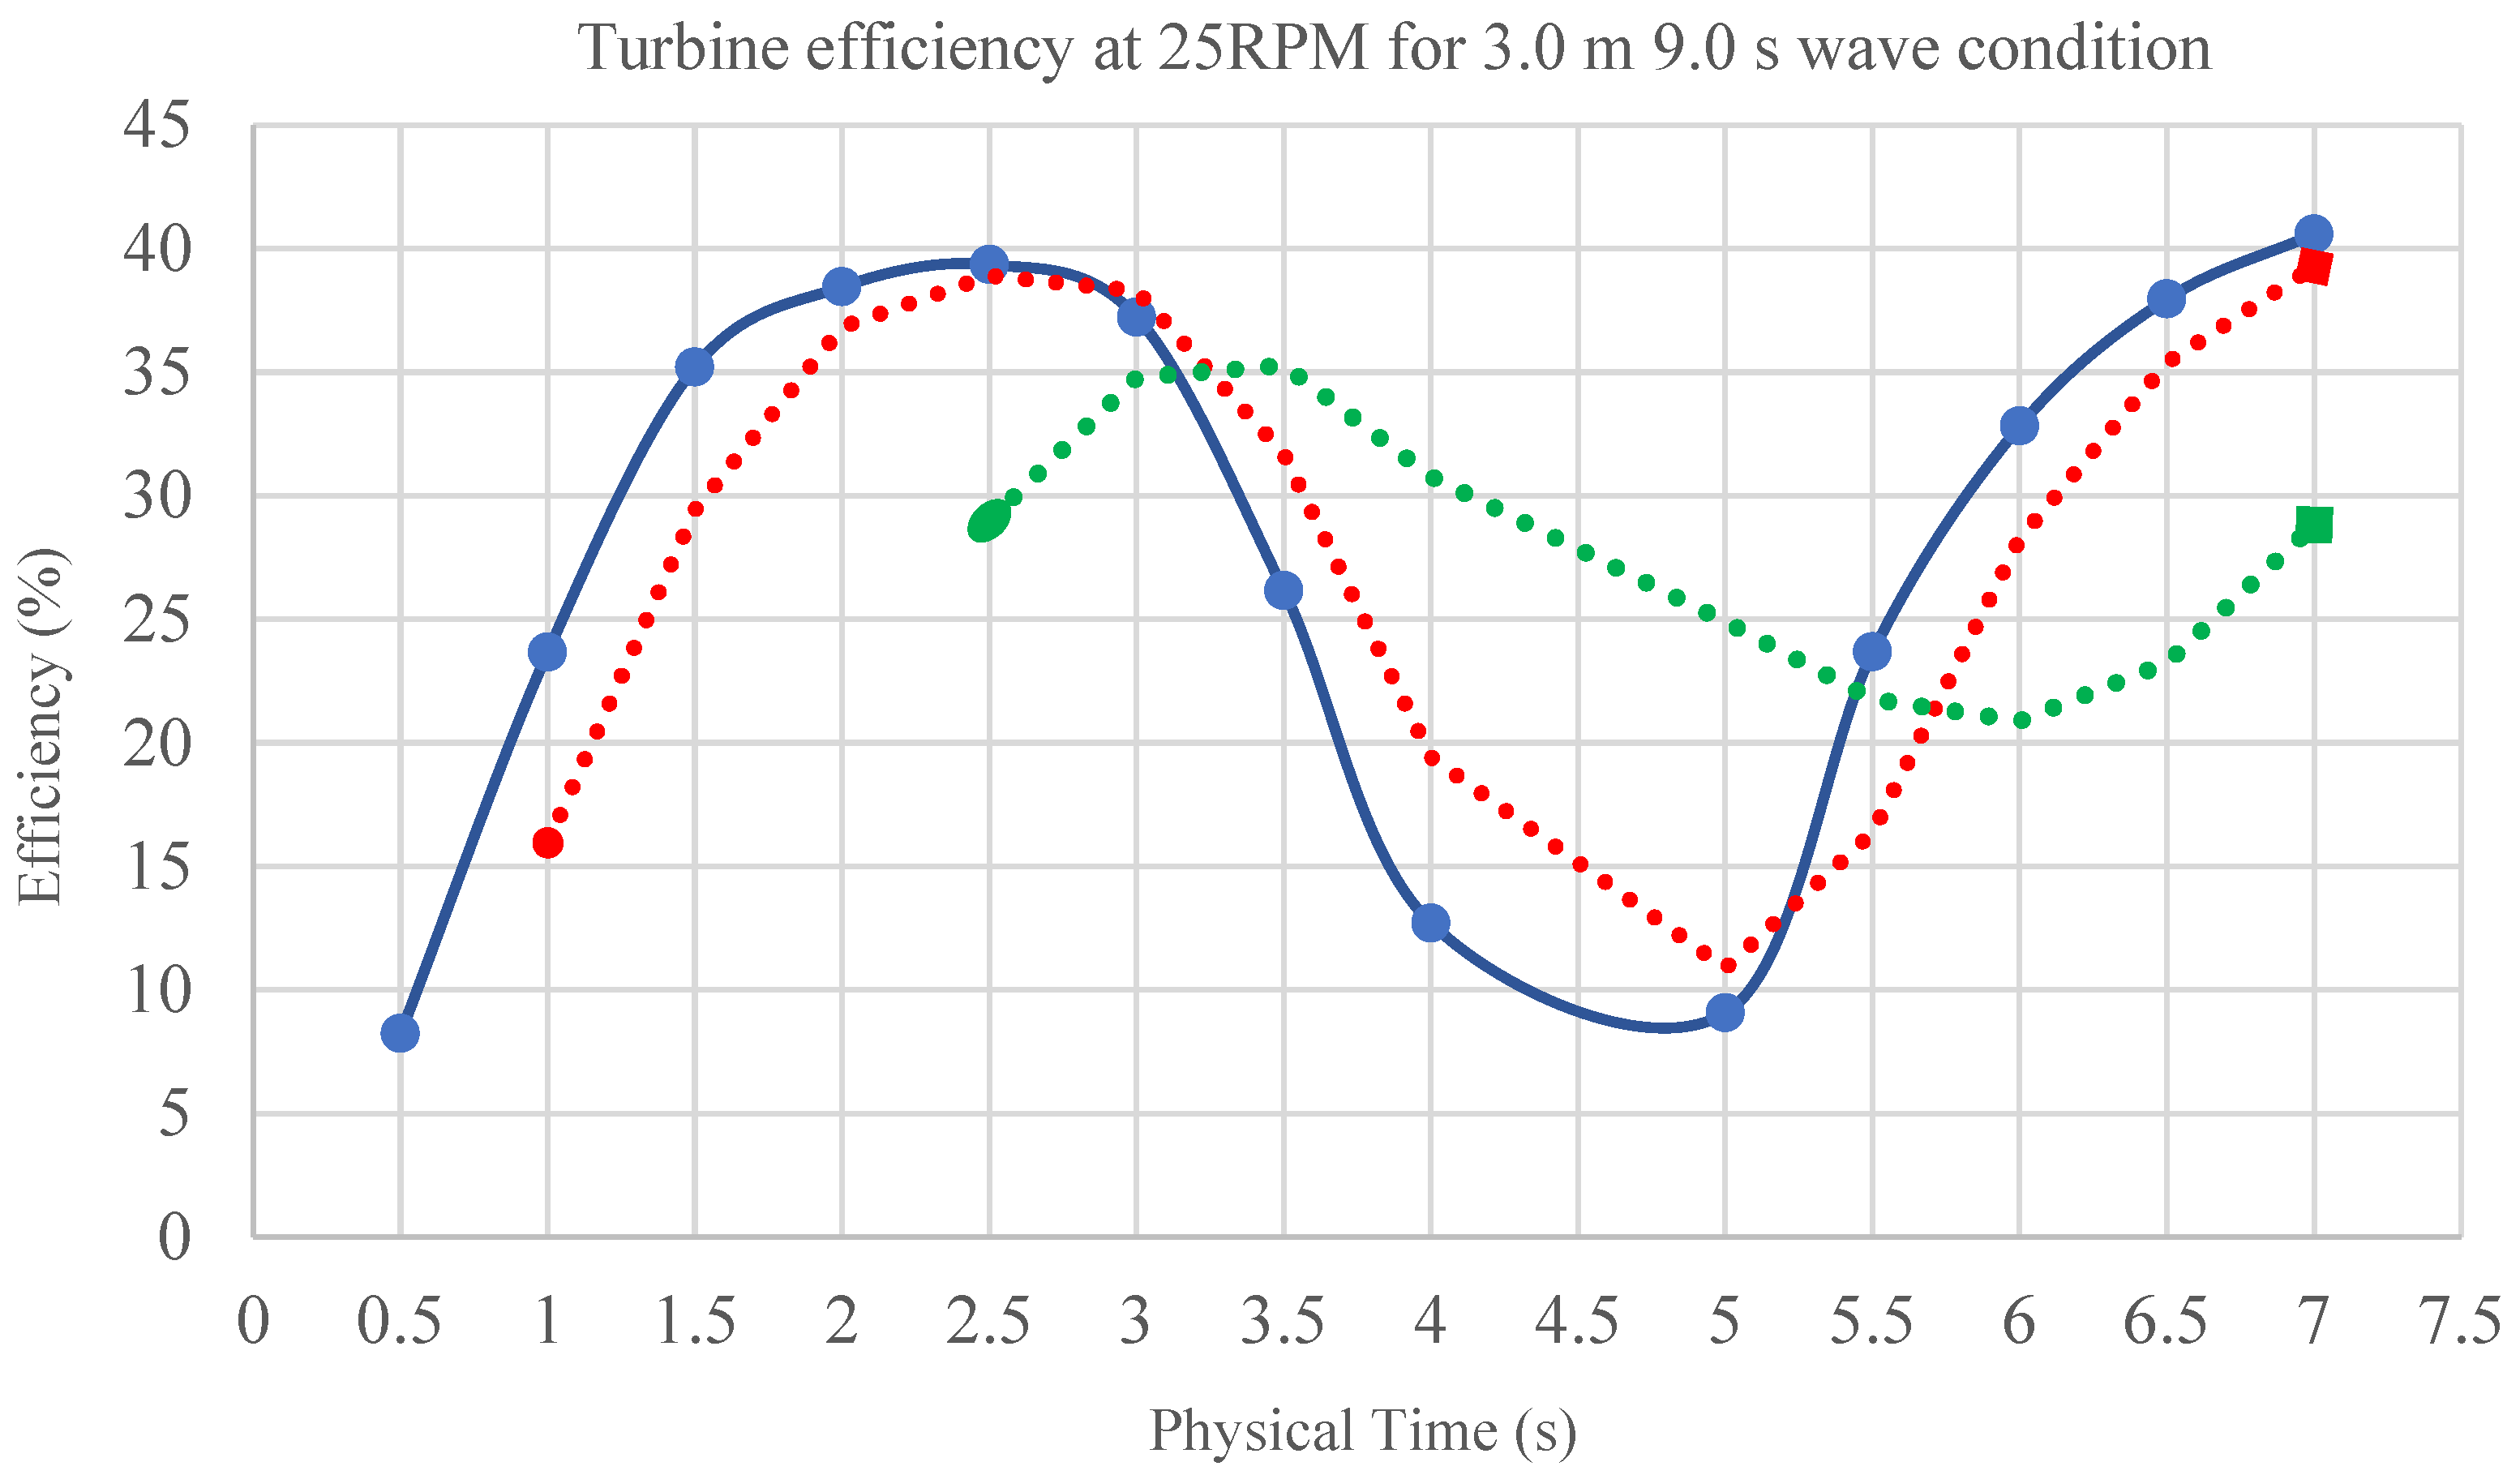
In the performance analysis, a simulation run time of 6 s was counted with 0.5 s periods. In each time period, the wave power and water power imparted by the wave motion were calculated, and the efficiency graph for the cyclic period was obtained (see Figure 36).
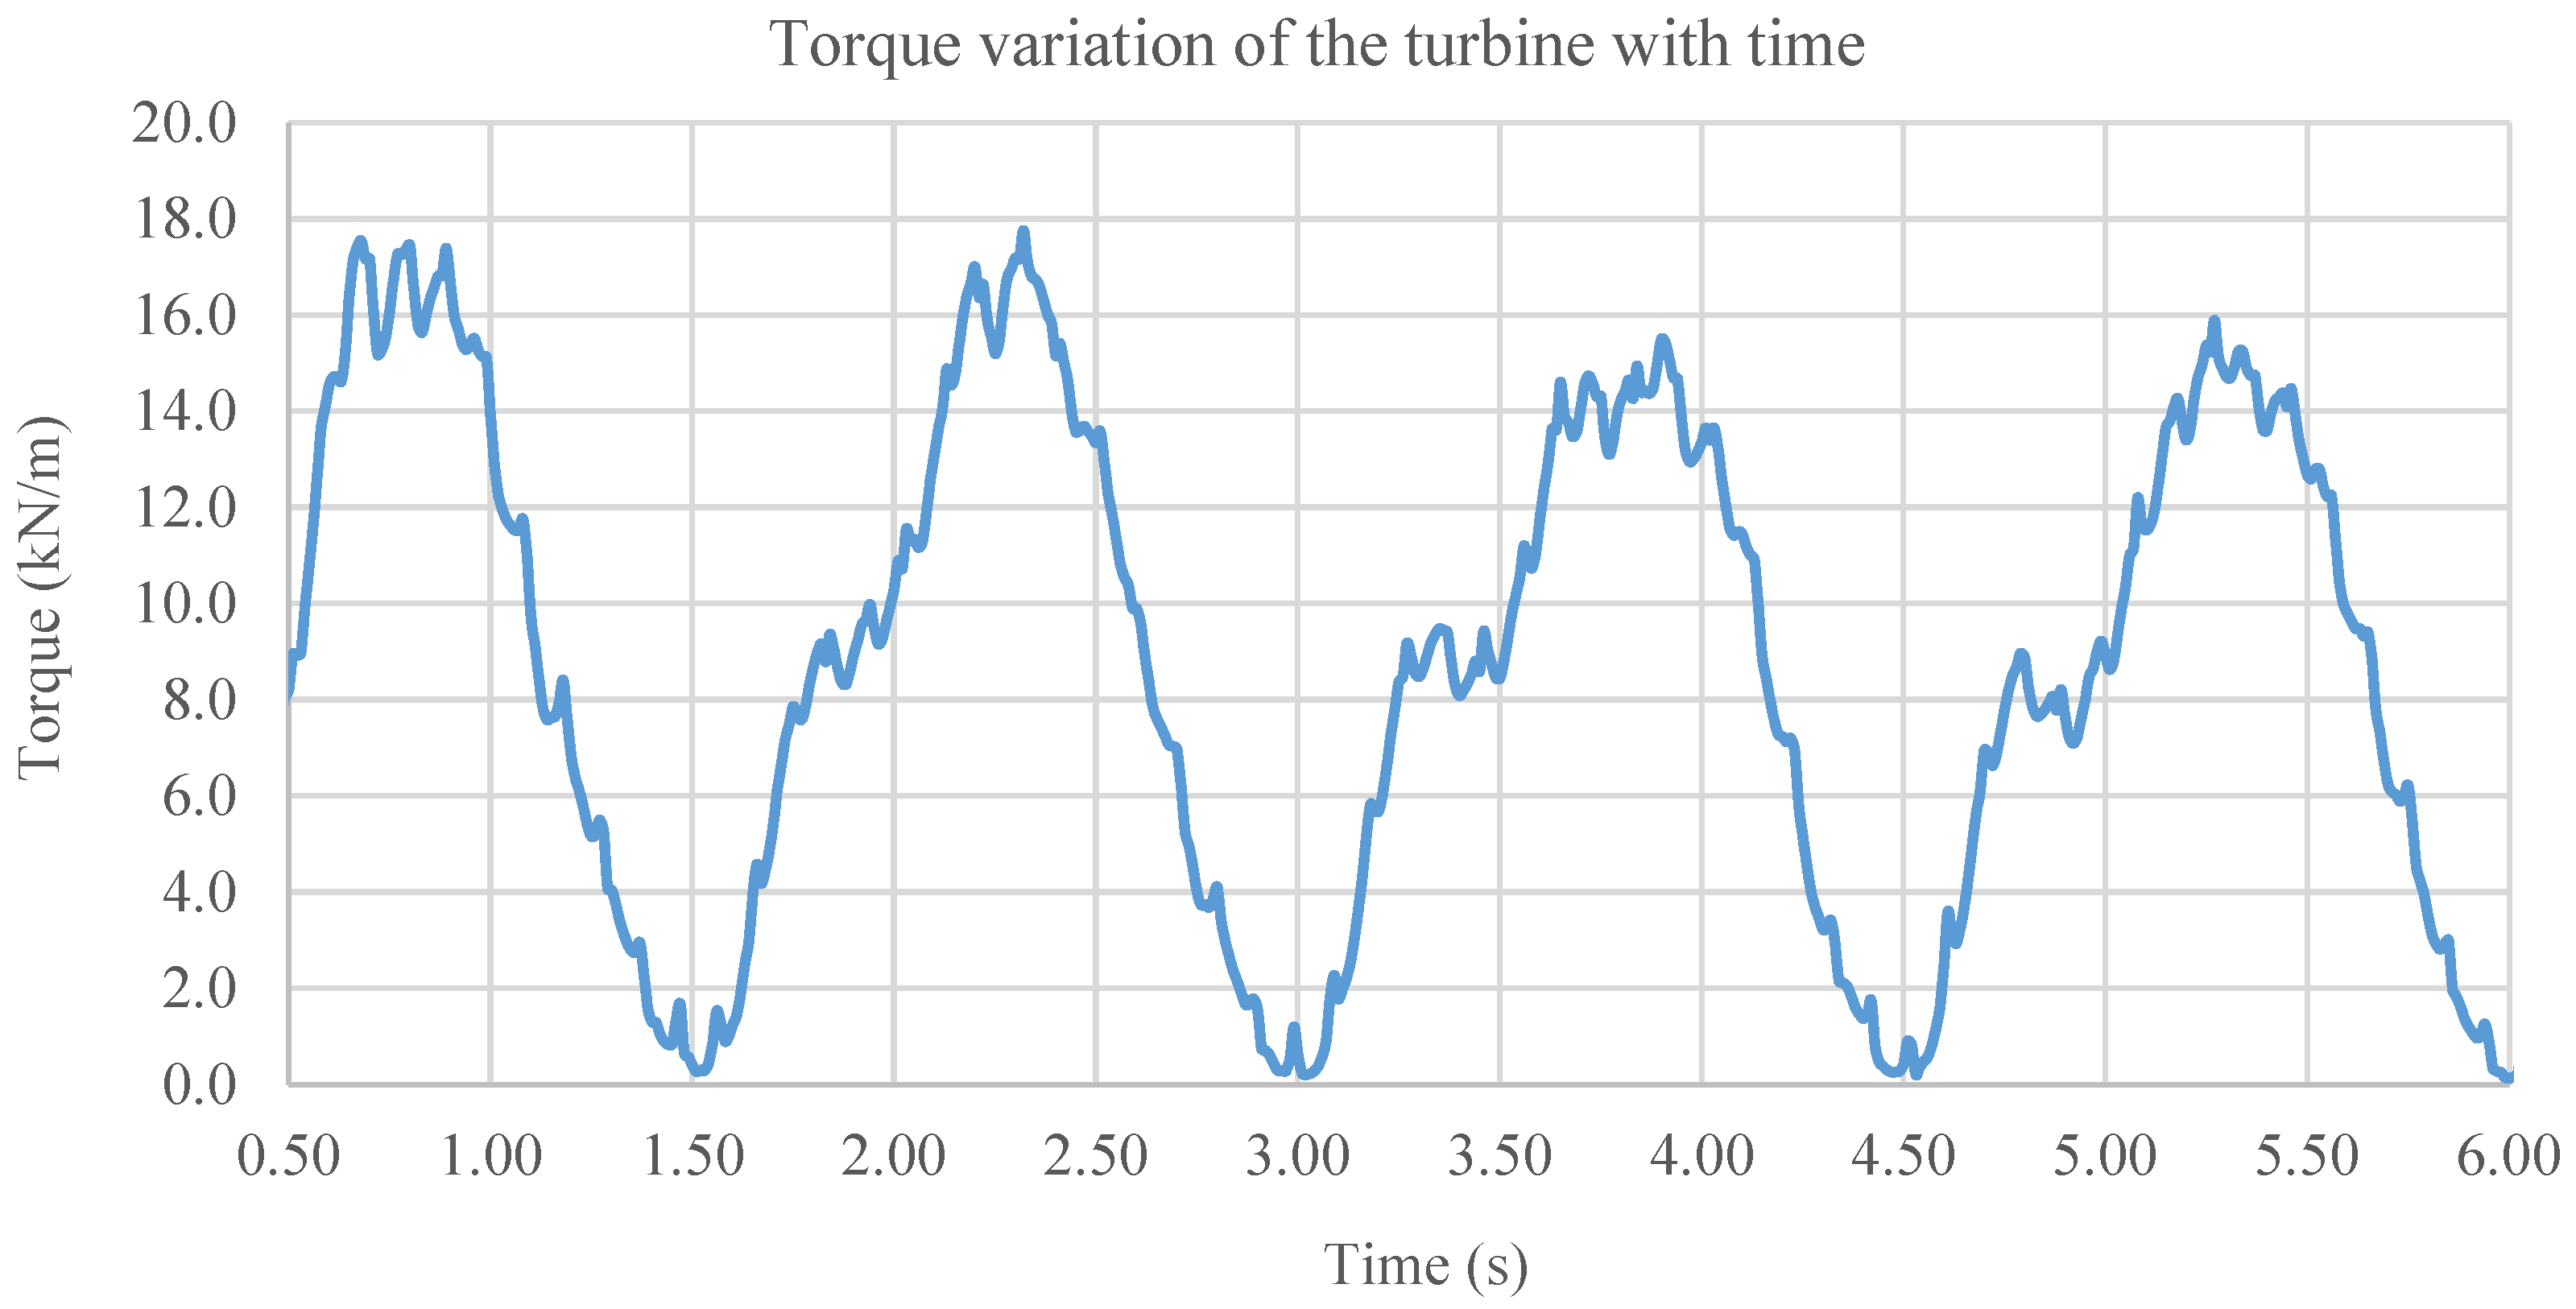
In these findings, the cyclic efficiency of turbine power for a fixed turbine speed increases as the wave period increases. The maximum cyclic efficiency for 25 RPM is 40.59%, and the minimum is 9.08%. Similarly, for 35 RPM (see Figure 37), the maximum efficiency is 56.83%, and the lowest is 11.55%. The fluctuation of the turbine torque (see Figure 38) with time shows similar behavior with the bilateral wave flows. The maximum average cycle efficiency was achieved with 35 RPM at 36.52%. The turbine extracts more energy from the incoming and outgoing flow through the augmentation channel effect. The results indicate that higher power is achievable from incoming waves with longer wavelengths. However, the efficiency increases with increasing rotational speed. It reaches a maximum and decreases from the best efficiency point onwards. In this study, there were 18 blades. The variables were wave period and turbine speed. Under the actual conditions, there is a point scale in which the turbine reaches the highest efficiency. The present study results were compared with Simonetti et al. (2017) [29], and a similar result pattern was obtained. The optimization method and results agreed with the results of [29] and [20].
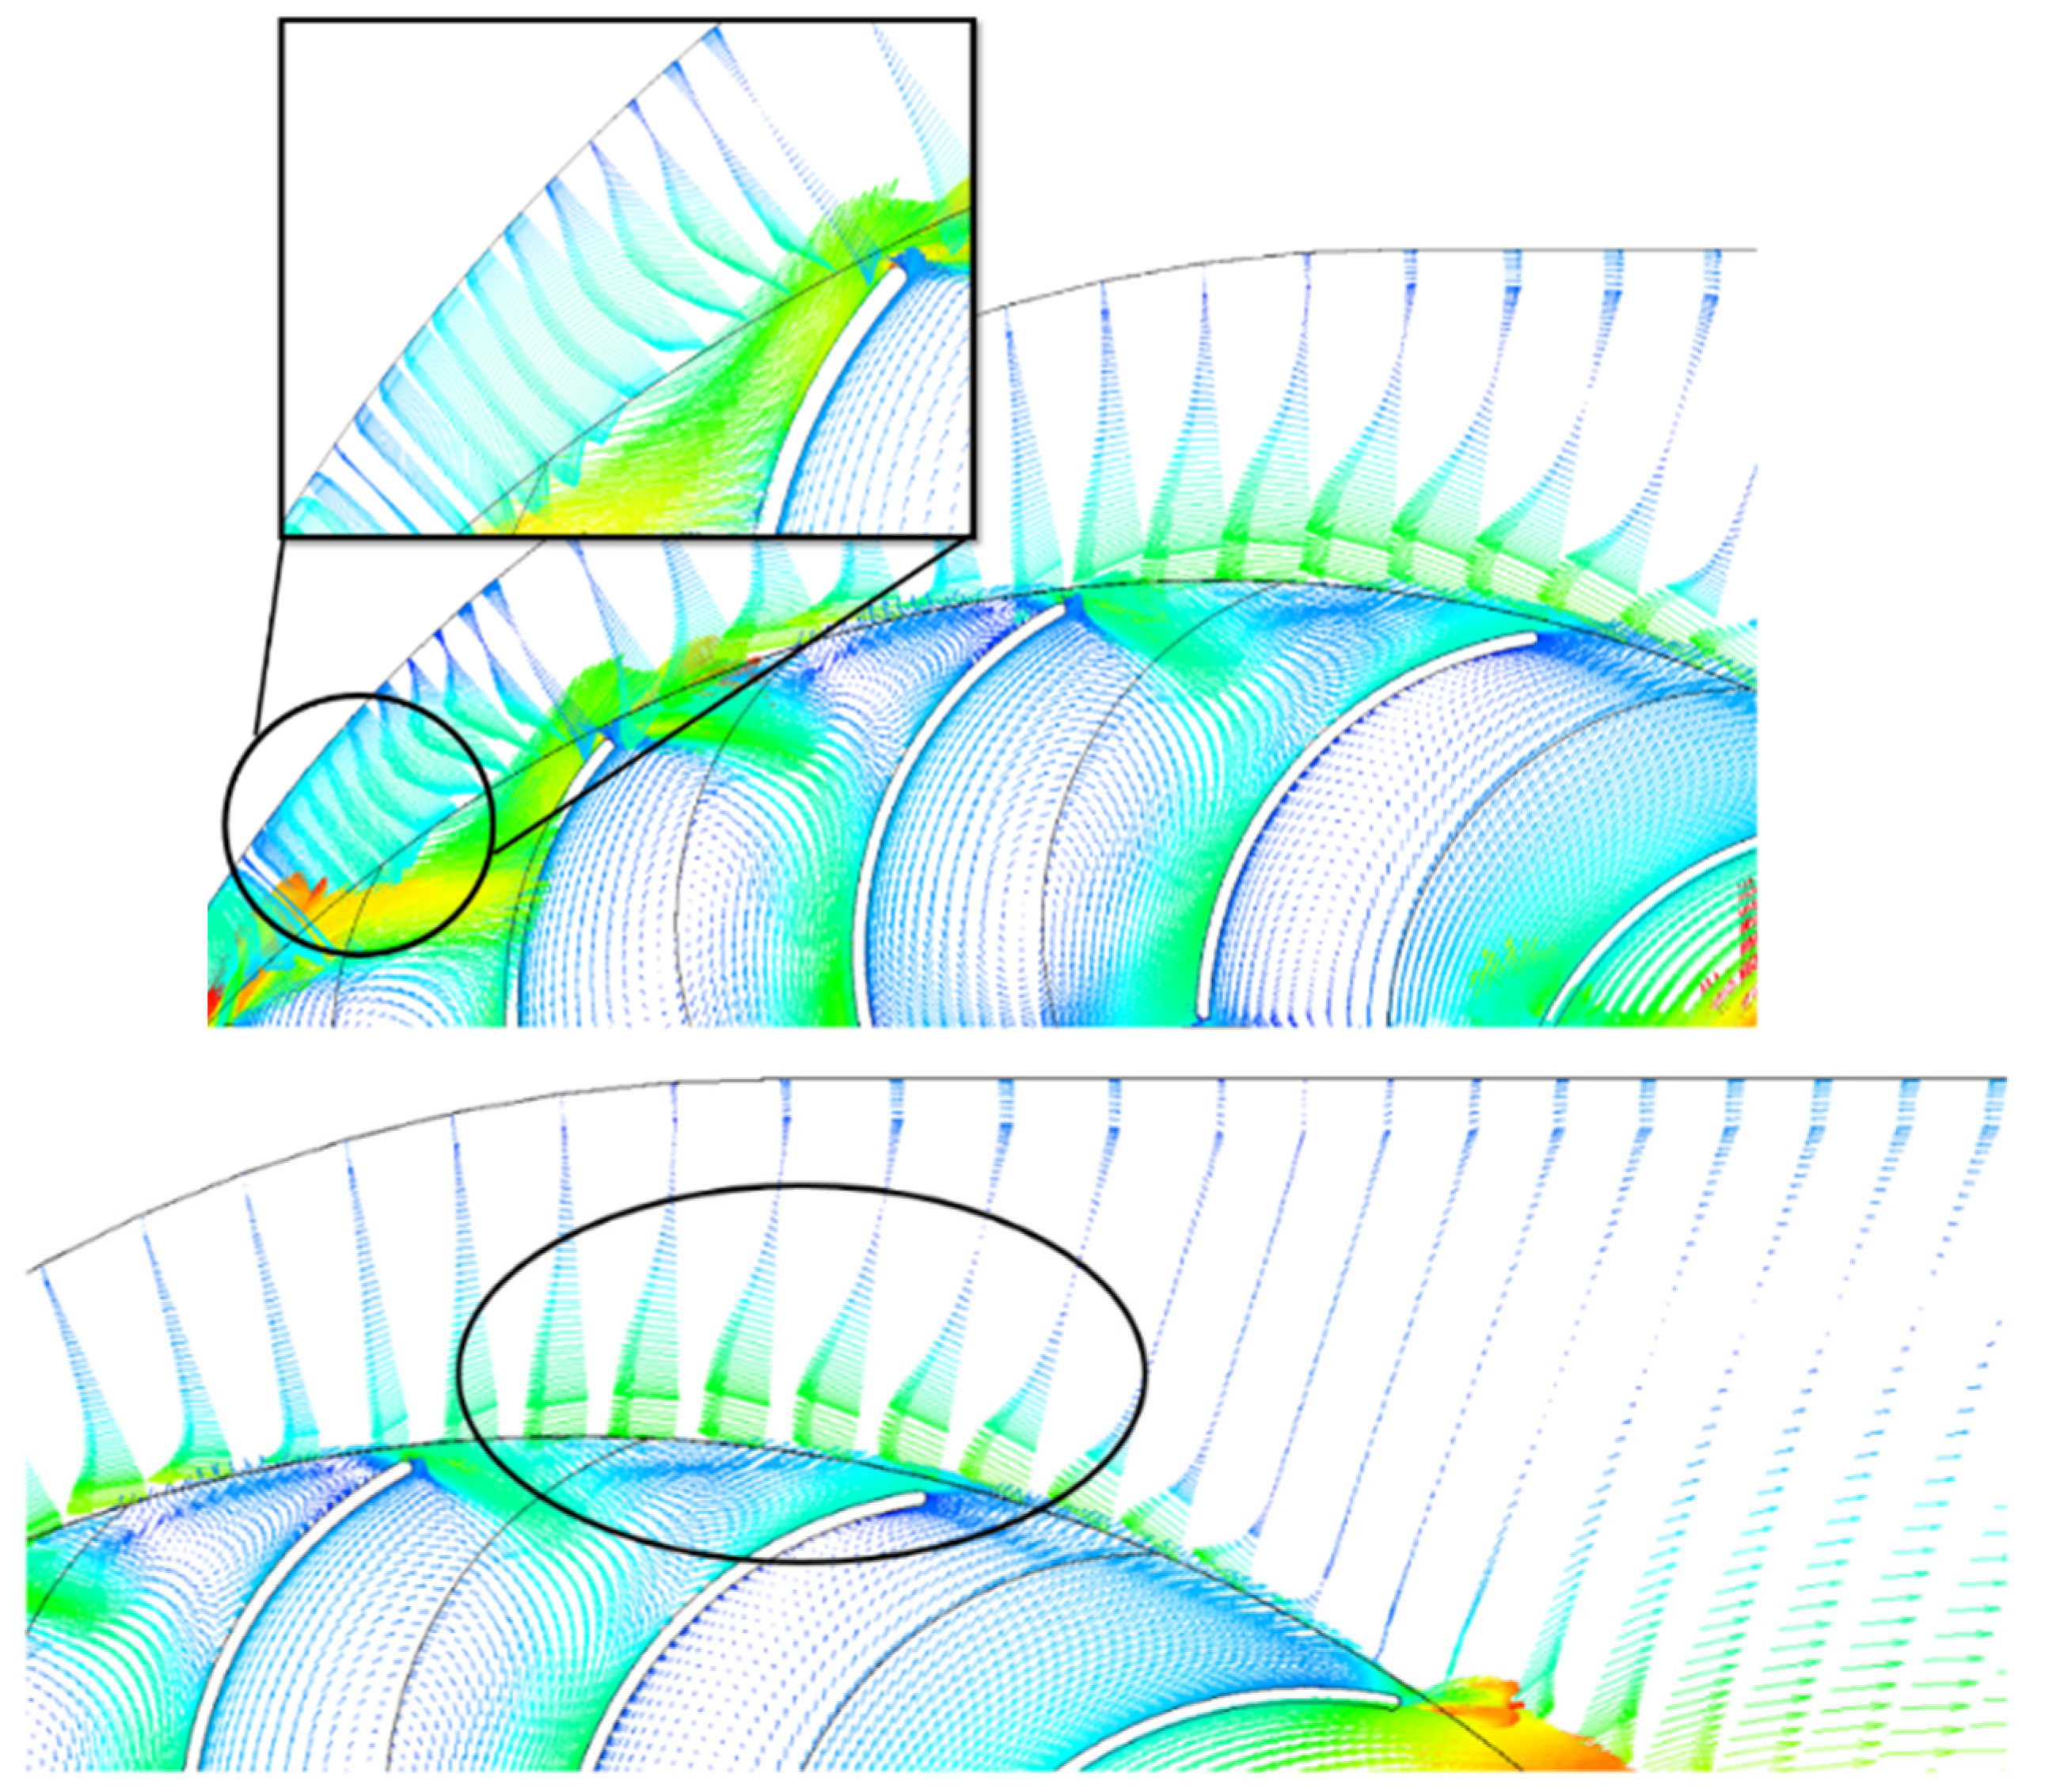
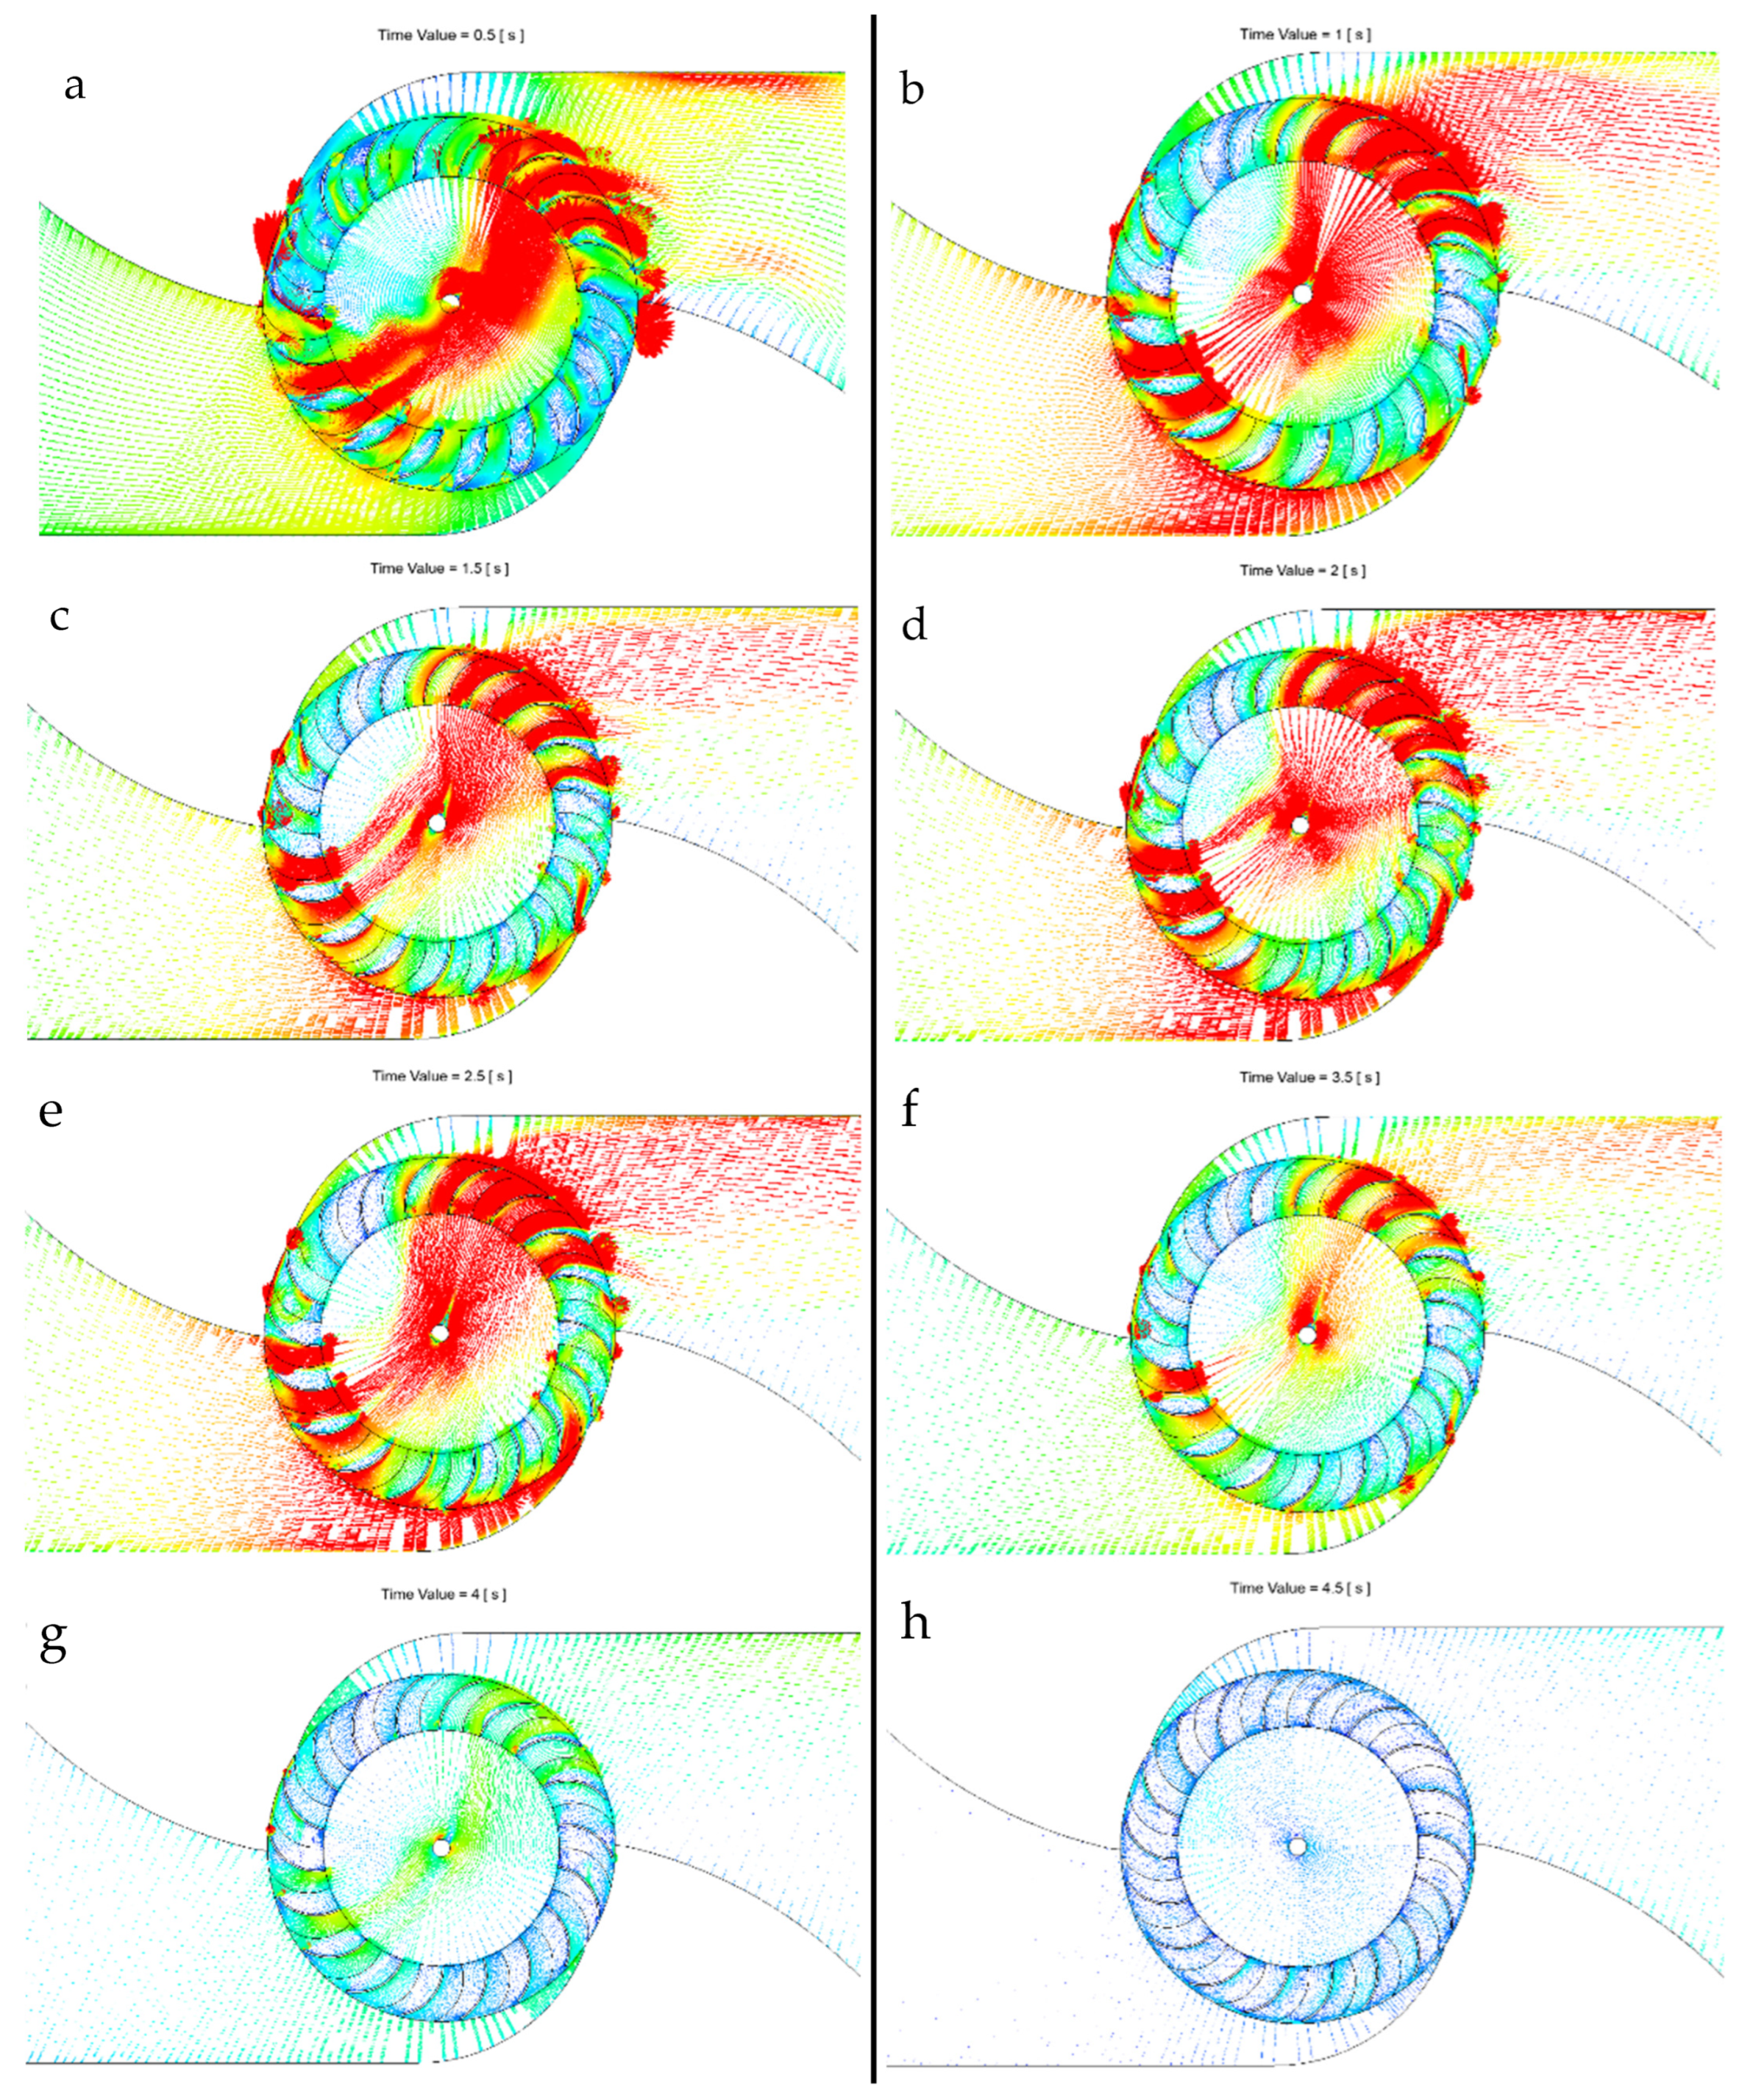
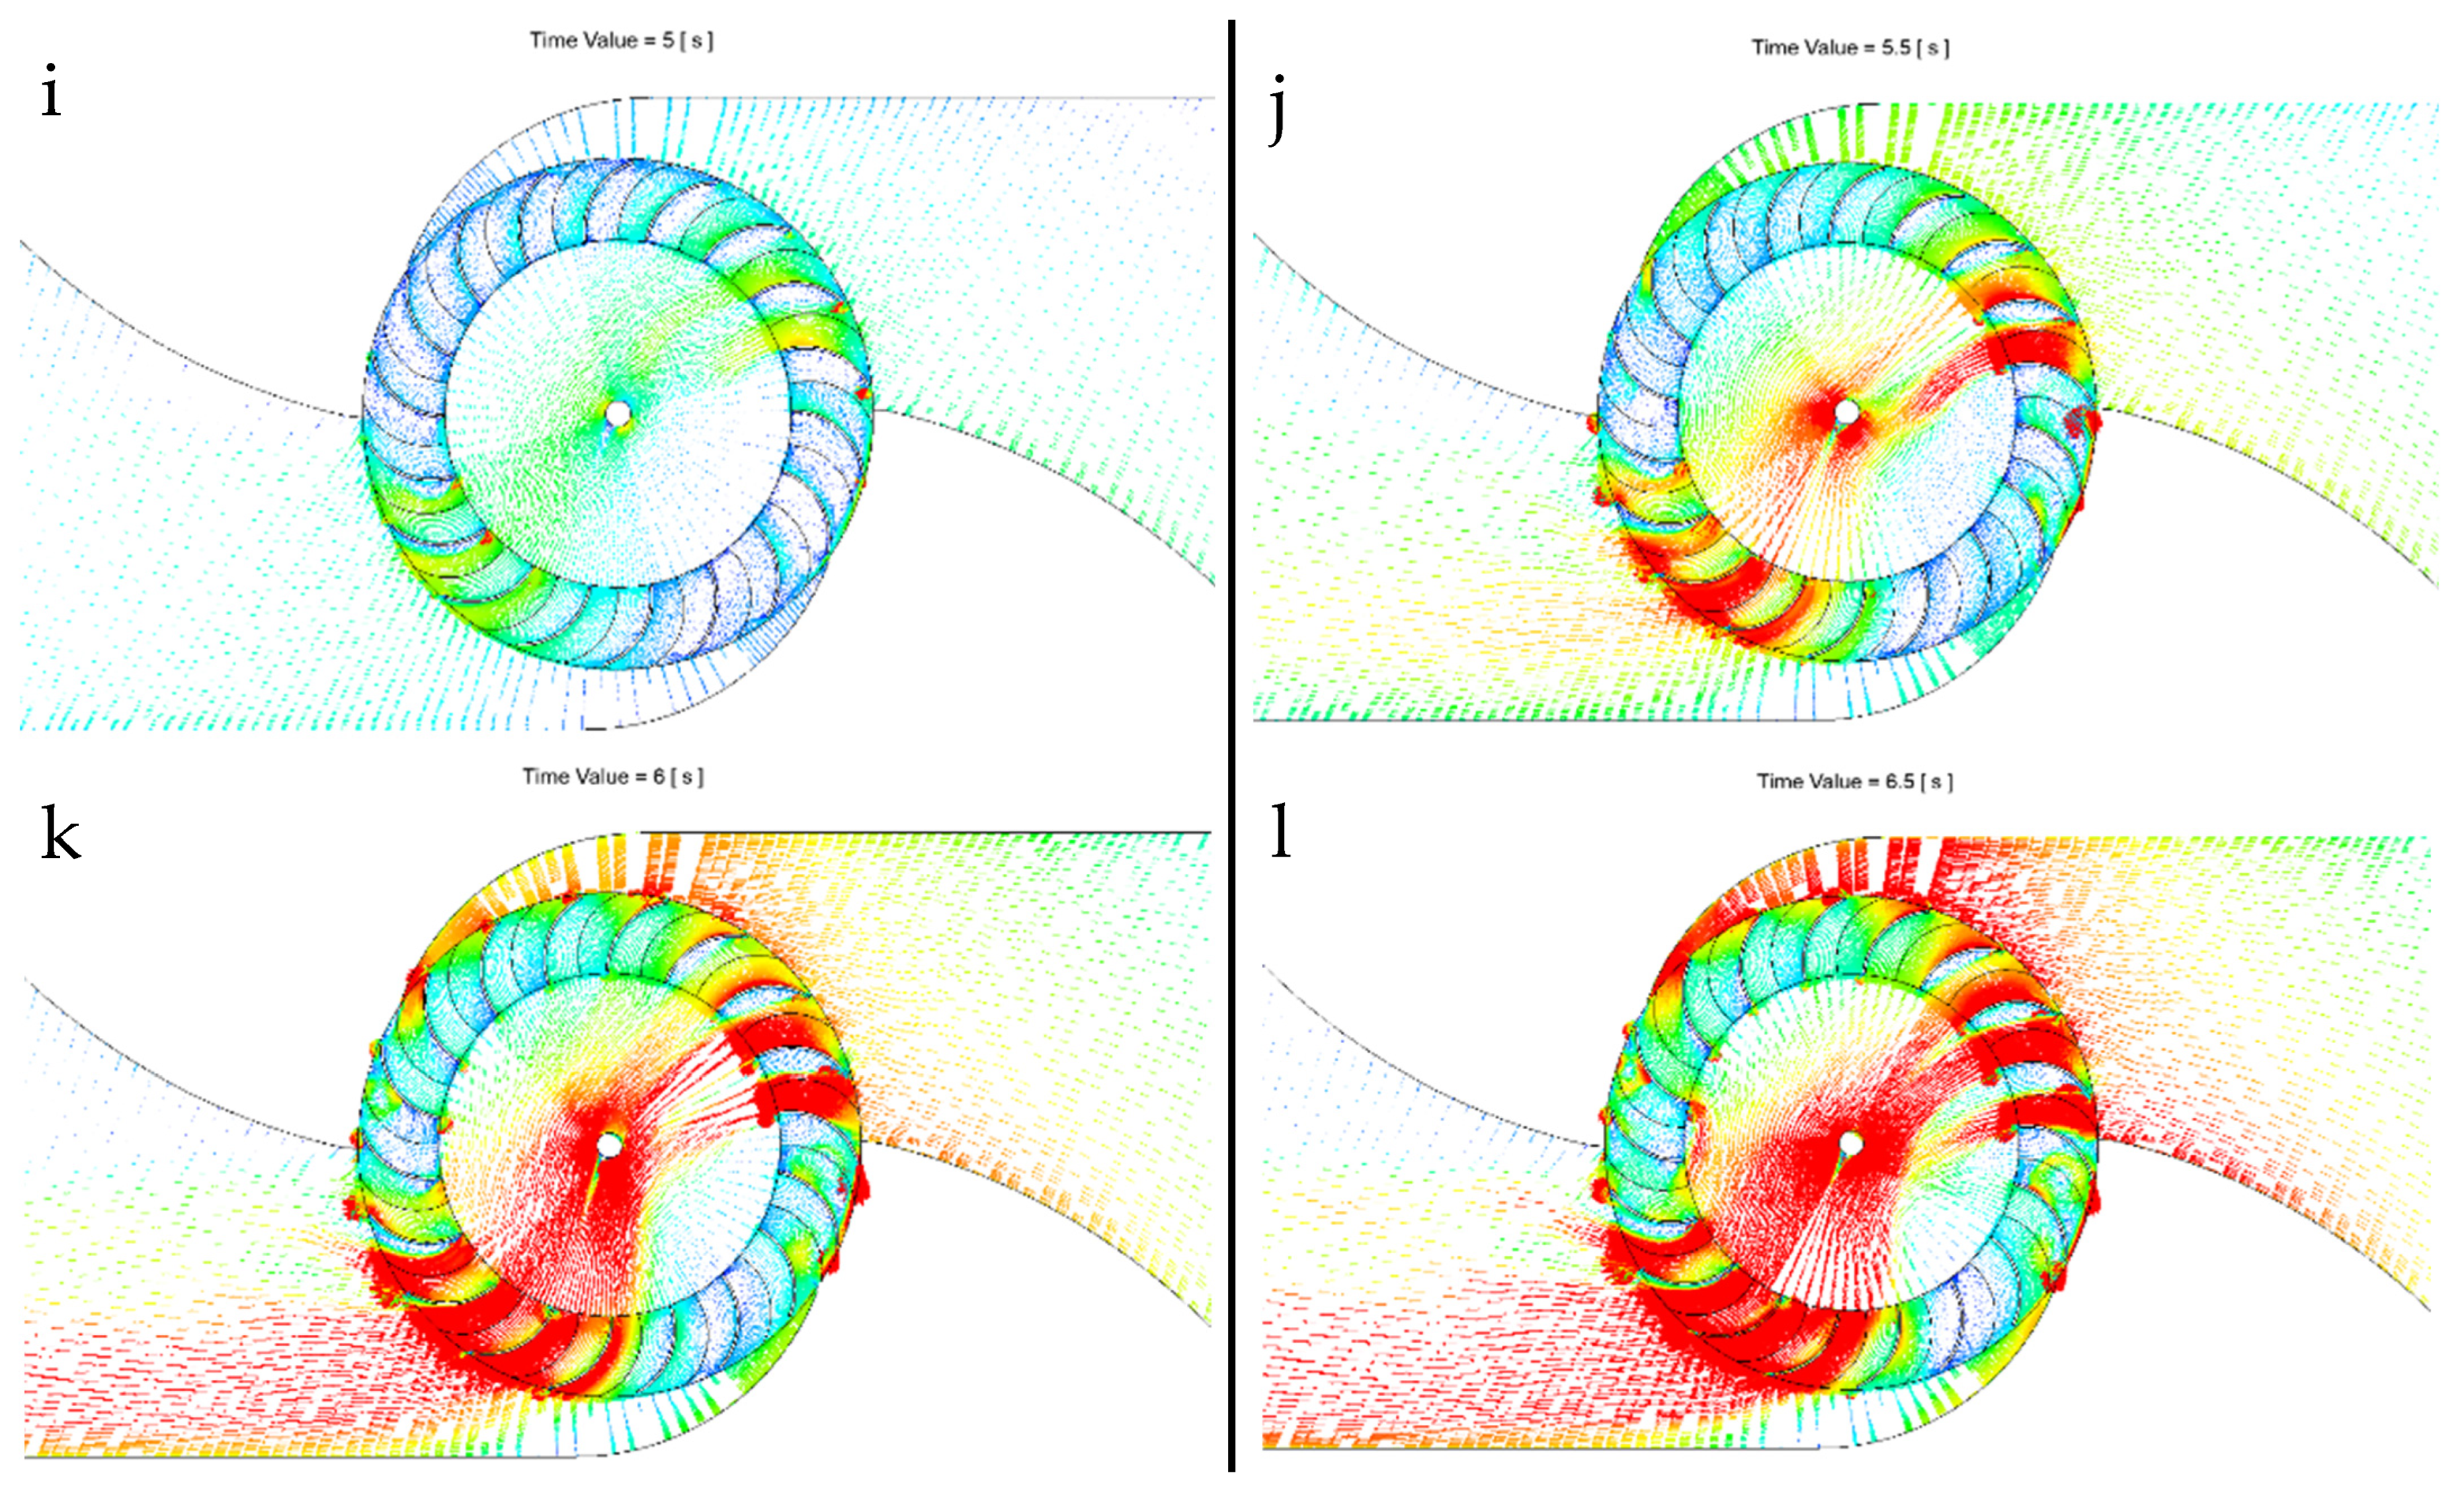
The flow is constant at a given wave period. When the turbine RPM is greater, water passage across the turbine blade is unable to impart kinetic energy effectively because the time frame in which two successive blades come in contact with the fluid is minute. When the turbine RPM reaches lower values, the water passage rushes through the blade stages and imparts less kinetic energy. It is critical to obtain the speed at which the turbine produces maximum power with peak efficiency under given wave conditions. The peak in efficiency indicates that the interaction between the turbine and flow is maximized at the optimum rotational speed. The turbine flow field was analyzed in 0.5 s intervals, and the velocity vector changes varied significantly for each frame. Figure 39 illustrates the turbine’s internal flow behavior under the bidirectional influence.
The flow in Figure 39a–g initially flows from the front passage to the downstream passage (from the bottom nozzle to the upheld nozzle via the runner). In the time point of 4 s and 4.5 s, Figure 39g,h the flow almost comes to a complete stop, and then the pressure field changes direction. From Figure 39i, with a time of 5.0 s, the flow completely stops and begins to reverse. And from the velocity vector in Figure 39j–l (time 5.5 s to 6.5 s) shows the flow is completely reversed its flow direction, it flows in the opposite direction. While the turbine runner does not change the direction of rotation regardless of the bilateral flow.

4. Conclusions

The present research study focused on the design and performance evaluation of a cross-flow turbine designed for a wave energy harnessing application. The study also examined the impact and benefits of wave energy on the global energy crisis and identified potential sites with higher wave energy. The study was aimed at a specific offshore location based on available wave data, with a chosen wave height and period selected as design input data for wave energy converters (WECs). The cross-flow turbine was designed based on a 3.0 m significant wave height and a 9.0 s wave period. The turbine design used a preliminary calculation procedure originally adopted by Banki–Mitchell as a hydro-turbine, but in this study, the turbine design was improved to suit offshore wave conditions. Flow-guiding augmentation channels were designed to improve turbine efficiency. The turbine had a 2.0 m outer diameter, a 1.36 m internal diameter, 18 blades and a rotational speed of 35 rev/min.
The operational performance of the cross-flow turbine was analyzed numerically using the ANSYS CFX 17.2v CFD code. Initially, the CAD model and mesh were generated, and a mesh sensitivity study was conducted in steady-state conditions to reduce the computational effort. The base turbine was analyzed with four different nozzle shapes and with varying nozzle entry angles of 90°, 110°, 130°, and 150°. The simulations were carried out for different RPM values from 15 RPM to 55 RPM, as offshore larger turbines’ rotational speeds are much lower compared to traditional turbines. The head was also changed from 2.0 m to 6.0 m. The 150° nozzle outperformed all other nozzle shapes. The highest efficiency for the simulated 0.5 m turbine strip was 54.3%, with a peak power output of 33.4 kW at the 3.0 m head. The simulation results proved that the correct preliminary design procedure was adopted. Computational flow analysis was carried out for the turbine runner and nozzle. The flow path had fewer directional changes when passing from the first stage to the second stage through the non-rotating passage, imparting maximum energy flow to the turbine runner blades. The flow separation, vortex formation, blade circulation and relative eddy formation were observed. However, the viscous flow phenomena visible during CFD post-processing were not considered during performance calculations. Slip and cavitation effects were also not considered in the present model but were identified during CFD post-processing. These factors are minor effects as far as offshore wave turbines are concerned, and they are more often considered in hydro-turbine design analysis.
With the modifications carried out in steady-state simulations, the real behavior of the system was analyzed using “transient simulations” to study the bidirectional performance of the turbine. CFD was used for the 3.0 m equivalent head and 9.0 s wave periods. The wave formation was carried out using ANSYS CFX 17.2v Command Expression Language (CEL). Transient simulations or calculations are much more similar to the actual behavior of the turbine under real wave flow conditions. In fact, two base cases were analyzed at 25 RPM and 35 RPM. The highest cyclic efficiency was achieved at 35 RPM with a performance of 36.5%.
The novel cross-flow turbine provides a comparative difference in performance with similar case studies, but none of the related case studies pertained to offshore wave conditions. This is a major drawback. The authors identified this as a major research gap since few numerical bidirectional turbines were researched for offshore wave conditions. The proposed design and CFD model can be improved. Limitations of the present study include the inability to quantify the performance of the turbine for various sea states with regular and irregular wave patterns. It is necessary to carry out simulations that consider different wave conditions. Another limitation is the lack of experimental results that validate the model’s performance with the CFD results.
In future research, it is strongly recommended and proposed to conduct a scaled-down experimental producer for this CFD model-based study to investigate real-world test cases. Further research is needed to fully understand the long-term performance and durability of CFTs in offshore wave power applications, as well as their potential impacts on marine ecosystems. It will be wise to identify the scale-down effects and performance differences based on the CFD results to conduct an accurate experimental setup. The authors propose a novel numerical (CFD-based) method to extract offshore wave energy resources utilizing a CFT, and the orifice geometry is improved to increase efficiency. The research can be expanded for different further studies.
The authors propose another future study to combine the scaled-down experimental work with oscillating water column (OWC) wave-energy devices. The present research study can be tailored using a power take-off (PTO) method for hydraulic PTO OWC research. OWC technology is used during bilateral wave generation. In the real operational condition of the OWC structure, the air compressing chamber and the section with the water column create a pressure drop across these planes, affecting the oscillating amplitude of the system. This repetitive cyclic process becomes the key parameter in the generation of power, which is the PTO (power take-off) device. However, in practical situations, it is difficult to construct, install and experiment with the turbine behavior in a scaled-down experimental setup because of the relatively complex blade shape and the limited number of resources at the lab scale. The “Orifice Plate” based pressure difference method is proposed as the ideal substitute sub-device in place of the actual turbine, investigating similar performance characteristics such as the pressure drop and mass flow rate under similar operational conditions. This ideology can be implemented to use for validation of the actual turbine setup. These values are useful during one-to-one experimental studies, helping to identify the level of pressure intensity to expect in real oceanic offshore conditions.

Author Contributions

Conceptualization, A.H.S.W. and Y.-H.L.; methodology, A.H.S.W.; software, A.H.S.W. and validation, A.H.S.W.; formal analysis, A.H.S.W.; investigation, A.H.S.W.; writing—original draft preparation, A.H.S.W.; writing—review and editing, A.H.S.W., Y.-H.L. and M.A.; supervision, Y.-H.L. and M.A.; project administration, M.A. and Y.-H.L.; funding acquisition, M.A and Y.-H.L. All authors have read and agreed to the published version of the manuscript.

Funding

This research was funded by two projects; (a) The KOICA project 2019–2021 grant funded by the Korean Government. (b) European Union’s Horizon 2020 Research and Innovation Program under the Marie Skłodowska-Curie Grant Agreement No. 861079, “NextMGT”—Next Generation of Micro Gas Turbines for High Efficiency, Low Emissions and Fuel Flexibility.

Institutional Review Board Statement

Not applicable.

Informed Consent Statement

Not applicable.

Data Availability Statement

Not applicable.

Conflicts of Interest

The authors declare that they have no conflict of interest.

Appendix A

Table A1. Previous research studies related to wave energy convertor turbines.
Title and AuthorDateTechnologyCollection MethodApplication
Performance investigations of hybrid hydrokinetic turbine rotor with different system and operating parametersKamal, M., Saini, R.23 March Current, Cross-Flow TurbineModelingHydrodynamics, Performance, Structural
Hybridized Vertical-Axis Underwater Current Power Turbine System Suitable for Low Underwater Current Velocities: A Report of Its Application and Potential in NigeriaAgbakwuru, J., Arome, S.23 February Current, Cross-Flow Turbine, RiverineField DataHybrid Devices, Performance
Numerical investigation on the performance of an innovative Airfoil-Bladed Savonius Hydrokinetic Turbine (ABSHKT) with deflectorChaudhari, V., Shah, S.23 February Current, Cross-Flow TurbineModelingPerformance
Performance parameters of lift-based vertical axis hydrokinetic turbines—A reviewReddy, K., Bhosale, A., Saini, R.22 December Current, Cross-Flow TurbineReviewPerformance, Structural
The influence of material on the power performance of Savonius turbines in wind and water applicationsShamsuddin, M., Kamaruddin, N., Mohamed-Kassim, Z.22 December Current, Cross-Flow Turbine, RiverineLab DataMaterials, Performance
Sea states influence on the behavior of a bottom mounted full-scale twin vertical axis tidal turbineMoreau, M., Germain, G., Maurice, G.22 December Current, Cross-Flow Turbine, TidalField Data, Full ScaleHydrodynamics, Performance
Performance analysis of novel V-shaped turbine blade profile by three-dimensional numerical investigations with varying overlap ratios for hydropower applicationShashikumar, C., Madav, V.22 December Current, Cross-Flow Turbine, RiverineModelingPerformance, Structural
Optimization of semicircular blade profile of Savonius hydrokinetic turbine using artificial neural networkRengma, T., Subbarao, P.22 November Current, Cross-Flow TurbineModelingPerformance, Structural
Optimization of Hydrokinetic Swept BladesGemaque, M., Vaz, J., Saavedra, O.22 November Current, Axial-Flow Turbine, Cross-Flow TurbineModelingPerformance, Structural
Power density capacity of tidal stream turbine arrays with horizontal and vertical axis turbinesOuro, P., Dené, P., Garcia-Novo, P.22 September Current, Axial-Flow Turbine, Cross-Flow Turbine, TidalModelingArray Effects, Performance
Performance enhancement of low speed current savonius tidal turbines through adding semi-cylindrical deflectorsSamadi, M., Hassanabad, M., Mozafari, A.22 September Current, Cross-Flow Turbine, TidalModelingHydrodynamics, Performance, Structural
Hydrodynamic performance of a mono-tangent backward-rotating impeller based on tidal current energy utilizationWu, Z., Xu, Q., Ling, C-M.22 August Current, Cross-Flow Turbine, TidalModelingHydrodynamics, Performance
Performance and near-wake analysis of a vertical-axis hydrokinetic turbine under a turbulent inflowDhalwala, M., Bayram, A., Oshkai, P.22 August Current, Cross-Flow Turbine, TidalModelingHydrodynamics, Performance
Development of a Hydrokinetic Turbine Backwater Prediction Model for Inland Flow through Validated CFD ModelsNiebuhr, C., Hill, C., Dijk, M.22 July Current, Axial-Flow Turbine, Cross-Flow Turbine, RiverineModelingArray Effects, Hydrodynamics, Performance
A review on modifications and performance assessment techniques in cross-flow hydrokinetic systemKamal, M., Saini, R.22 June Current, Cross-Flow TurbineReviewHydrodynamics, Performance, Structural
Field tests on model efficiency of twin vertical axis helical hydrokinetic turbinesZhang, A., Liu, S., Ma, Y.22 May Current, Cross-Flow Turbine, TidalField Data, ModelingHydrodynamics, Performance
Numerical and Experimental Investigation of the Effect of Design Parameters on Savonius-Type Hydrokinetic Turbine PerformanceWu, K., Lo, K., Kao, R.22 March Current, Cross-Flow TurbineLab Data, ModelingPerformance, Structural
Influence of blade numbers on start-up performance of vertical axis tidal current turbinesSun, K., Yi, Y., Zhang, J.22 January Current, Cross-Flow Turbine, TidalModelingPerformance
A New Methodology for Smoothing Power Peaks Produced by Electricity Demand and a Hydrokinetic Turbine for a Household Load on Grid Using SupercapacitorsArevalo, P., Tostado-Veliz, M., Jurado, F.21 December Current, Axial-Flow Turbine, Cross-Flow Turbine, RiverineModelingGrid Integration, Performance
Design optimization of a novel vertical augmentation channel housing a cross-flow turbine and performance evaluation as a wave energy converterA.H Samitha Weerakoon, A., Kim, B-H., Cho, Y-J.21 December Current, Cross-Flow Turbine, Wave, Oscillating Water ColumnLab Data, ModelingHydrodynamics, Performance
A comprehensive review on Crossflow turbine for hydropower applicationsAnand, R., Jawahar, C., Bellos, E.21 November Current, Cross-Flow TurbineReviewPerformance
Comparison of Sliding and Overset Mesh Techniques in the Simulation of a Vertical Axis Turbine for Hydrokinetic ApplicationsLopez Mejia, O., Mejia, O., Escorcia, K.21 November Current, Cross-Flow TurbineModelingHydrodynamics, Performance
Case study of a cross-flow hydrokinetic turbine in a narrow prismatic canalCacciali, L., Battisti, L., Dell’Anna, S.21 August Current, Cross-Flow TurbineField DataPerformance
Turbine design dependency to turbulence: An experimental study of three scaled tidal turbinesSlama, M., Pinon, G., Hadi, C.August 21Current, Cross-Flow Turbine, TidalLab DataHydrodynamics, Performance, Structural
Numerical Study of the Dynamic Stall Effect on a Pair of Cross-Flow Hydrokinetic Turbines and Associated Torque Enhancement Due to Flow BlockageDoan, M., Obi, S.21 August Current, Cross-Flow TurbineLab Data, Modeling, Scale DeviceArray Effects, Hydrodynamics, Performance
Lagrangian Vortex Computations of a Four Tidal Turbine Array: An Example Based on the NEPTHYD Layout in the Alderney RaceSlama, M., Bex, C., Pinon, G.21 June Current, Cross-Flow Turbine, TidalModelingArray Effects, Performance
Experimental investigation on the characterization of self-starting capability of a 3-bladed Savonius hydrokinetic turbine using deflector platesSalleh, M., Kamaruddin, N., Mohamed-Kassim, Z.21 May Current, Cross-Flow TurbineLab Data, ModelingPerformance
Wind–Water Experimental Analysis of Small SC-Darrieus Turbine: An Approach for Energy Production in Urban SystemsGharib-Yosry, A., Blanco-Marigorta, E., Fernández-Jiménez, A.21 May Current, Cross-Flow TurbineLab DataHybrid Devices, Performance
Comprehensive experimental and numerical assessment of a drag turbine for river hydrokinetic energy conversionRamadan, A., Hemida, M., Abdel-Fadeel, W.21 May Current, Cross-Flow Turbine, RiverineLab Data, ModelingPerformance, Structural
Cross-Flow Tidal Turbines with Highly Flexible Blades—Experimental Flow Field Investigations at Strong Fluid–Structure InteractionsHoerner, S., Kösters, I., Vignal, L.21 February Current, Cross-Flow Turbine, Oscillating Hydrofoil, TidalLab DataHydrodynamics, Performance, Structural
Twin Marine Hydrokinetic Cross-Flow Turbines in Counter Rotating Configurations: A Laboratory-Scaled Apparatus for Power MeasurementDoan, M., Kai, Y., Obi, S.20 November Current, Cross-Flow Turbine, TidalLab Data, Scale DeviceHydrodynamics, Performance, Structural
Prediction of the fouling penalty on the tidal turbine performance and development of its mitigation measuresSong, S., Demirel, Y., Atlar, M.October 20Current, Cross-Flow Turbine, TidalModelingPerformance
Computational parametric analysis of the design of cross-flow turbines under constraintsLeguizamón, S., Avellan, F.20 October Current, Cross-Flow Turbine, TidalLab Data, ModelingPerformance
Effect of aspect ratio on cross-flow turbine performanceHunt, A., Stringer, C., Polagye, B.20 September Current, Cross-Flow TurbineLab DataPerformance, Structural
An experimental evaluation of blockage effects on the wake of a cross-flow current turbineRoss, H., Polagye, B.20 August Current, Cross-Flow TurbineLab Data, Scale DeviceArray Effects, Performance
Experimental assessment of a 100 W prototype horizontal axis tidal turbine by towing tank testsAlamian, R., Shafaghat, R., Amiri, H.20 August Current, Cross-Flow Turbine, TidalLab DataPerformance
An experimental assessment of analytical blockage corrections for turbinesRoss, H., Polagye, B.20 June Current, Axial-Flow Turbine, Cross-Flow Turbine, TidalLab DataHydrodynamics, Performance
MaRINET2 Tidal Energy Round Robin Tests: Performance Comparison of a Horizontal Axis Turbine Subjected to Combined Wave and Current ConditionsGaurier, B., Ordonez-Sanchez, S., Facq, J.20 June Current, Cross-Flow Turbine, TidalLab DataPerformance
Torque coefficient analysis of a novel direct-drive parallel-stream counter-rotating darrieus turbine systemJanon, A.20 March Current, Cross-Flow TurbineModelingMaterials, Performance, Structural
Large Eddy Simulations on Vertical Axis Hydrokinetic Turbines—Power coefficient analysis for various soliditiesGuillaud, N., Balarac, G., Goncalvès, E.20 March Current, Cross-Flow TurbineModelingHydrodynamics, Performance
Implications of biofouling on cross-flow turbine performanceStringer, C., Polagye, B.20 February Cross-Flow Turbine, TidalLab DataPerformance
Numerical investigation of modal and fatigue performance of a horizontal axis tidal current turbine using fluid–structure interactionUllah, H., Hussain, M., Abbas, N.19 December Current, Cross-Flow Turbine, Tidal CFD ModelingPerformance
A review on technology, configurations, and performance of cross-flow hydrokinetic turbinesSaini, G., Saini, R.19 October Current, Cross-Flow Turbine FEAPerformance, Structural
Comparison of cross-flow turbine performance under torque-regulated and speed-regulated controlPolagye, B., Strom, B., Ross, H.19 July Current, Cross-Flow TurbineLab DataControl, Performance
Performance Optimization of a Kirsten–Boeing Turbine by A Metamodel Based on Neural Networks Coupled with CFDKüppers, J., Metzger, J., Jensen, J.19 May Current, Cross-Flow Turbine, RiverineLab Data, ModelingPerformance, Structural
Velocity and performance correction methodology for hydrokinetic turbines experimented with different geometry of the channelPatel, V., Eldho, T., Prabhu, S.19 February Current, Cross-Flow Turbine, RiverineLab Data, ModelingHydrodynamics, Performance
Research on the Hydrodynamic Performance of a Vertical Axis Current Turbine with Forced OscillationMa, Y., Hu, C., Li, Y.18 November Current, Cross-Flow TurbineModelingHydrodynamics, Performance
Novel Cyclic Blade Pitching Mechanism for Wind and Tidal Energy Turbine ApplicationsRao, J., Diez, F.18 November Cross-Flow TurbineModelingPerformance, Structural
Hydrodynamic Performance Analysis of the Vertical Axis Twin-Rotor Tidal Current TurbineMa, Y., Hu, C., Li, Y.18 November Current, Cross-Flow TurbineModelingHydrodynamics, Performance, Structural
Validation of a Coupled Electrical and Hydrodynamic Simulation Model for a Vertical Axis Marine Current Energy ConverterForslund, J., Goude, A., Thomas, K.18 November Current, Cross-Flow TurbineModelingControl, Performance
Field-testing of model helical-bladed hydrokinetic turbines for small-scale power generationTalukdar, P., Kulkarni, V., Saha, U.18 November Current, Cross-Flow TurbineField DataPerformance
Numerical Study of a Guide-Vane-Augmented Vertical Darrieus Tidal-Current-TurbineLiu, Z., Wang, Z., Shi, H.18 October Current, Cross-Flow TurbineModeling Hydrodynamics, Performance, Structural
The effects of oblique waves and currents on the loadings and performance of tidal turbinesMartinez, R., Payne, G., Bruce, T.18 September Current, Cross-Flow Turbine, TidalLab Data, Scale DevicePerformance
Experimental investigation of an innovative configuration for new marine current turbineHassanzadeh, R., Yaakob, O., Gholami, A.18 September Current, Cross-Flow Turbine, Ocean CurrentLab DataPerformance, Structural
Numerical investigation of channel effects on a vertical-axis tidal turbine rotating at variable speedChen, B., Cheng, S., Su, T.18 September Current, Cross-Flow Turbine, TidalModelingHydrodynamics, Performance
Numerical Investigation of Contra Rotating Vertical-Axis Tidal-Current TurbineSatrio, D., Utama, I., Mukhtasor18 June Current, Cross-Flow TurbineModelingHydrodynamics, Performance, Structural
Impact of blade mounting structures on cross-flow turbine performanceStrom, B., Johnson, N., Polagye, B.18 May Current, Cross-Flow TurbineLab DataPerformance, Structural
Performance of a horizontal axis marine current turbine– A comprehensive evaluation using experimental, numerical, and theoretical approachesRahimian, M., Walker, J., Penesis, I.18 April Current, Cross-Flow Turbine, TidalLab Data, Modeling, Scale DevicePerformance
Multi-mode evaluation of power-maximizing cross-flow turbine controllersForbush, D., Cavagnaro, R., Donegan, J.17 December Current, Cross-Flow TurbineField Data, Modeling, Full ScaleControl, Performance
Design and hydrodynamic analysis of horizontal axis tidal stream turbines with wingletsRen, Y., Liu, B., Zhang, T.17 November Current, Cross-Flow Turbine, TidalLab Data, ModelingPerformance
Modeling of flow-induced stress on helical Savonius hydrokinetic turbine with the effect of augmentation technique at different operating conditionsKumar, D., Sarkar, S.17 October Current, Cross-Flow TurbineModelingHydrodynamics, Performance
Performance analysis of a Savonius hydrokinetic turbine having twisted bladesKumar, A., Saini, R.17 August Current, Cross-Flow TurbineModeling Performance, Structural
A tuned actuator cylinder approach for predicting cross-flow turbine performance with wake interaction and channel blockage effectsShives, M., Crawford, C., Grovue, S.17 June Current, Cross-Flow TurbineModelingArray Effects, Hydrodynamics, Performance, Power Take-Off
Impact of channel blockage on the performance of axial and cross-flow hydrokinetic turbinesKinsey, T., Dumas, G.17 April Current, Axial-Flow Turbine, Cross-Flow TurbineModelingPerformance
The influence of blade roughness on the performance of a vertical axis tidal turbinePriegue, L., Stoesser, T.17 April Current, Cross-Flow TurbineLab Data, ModelingHydrodynamics, Materials, Performance, Structural
Experimental investigations on Darrieus straight blade turbine for tidal current application and parametric optimization for hydro farm arrangementPatel, V., Eldho, T., Prabhu, S.17 April Current, Cross-Flow TurbineLab Data, Modeling, Scale DeviceArray Effects, Hydrodynamics, Materials, Performance, Structural
Performance analysis of a vertical axis tidal turbine with flexible bladesBouzaher, M., Guerira, B., Hadid, M.17 March Current, Cross-Flow TurbineModelingPerformance, Structural
Performance characterization of a cross-flow hydrokinetic turbine in sheared inflowForbrush, D., Polagye, B., Thomson, J.16 December Current, Cross-Flow TurbineField Data, ModelingPerformance, Structural
Experimental study on hydrodynamic characteristics of vertical-axis floating tidal current energy power generation deviceMa, Y., Li, T., Zhang, L.16 October Current, Cross-Flow TurbineScale DeviceHydrodynamics, Mooring, Performance
Performance parameters of Savonius type hydrokinetic turbine—A ReviewKumar, A., Saini, R.16 October Current, Cross-Flow Turbine, RiverineCFD Modeling Hydrodynamics, Performance, Structural
Experimental Study of a Reference Model Vertical-Axis Cross-Flow TurbineBachant, P., Wosnik, M., Gunawan, B.16 September Current, Cross-Flow Turbine, RiverineLab Data, ModelingHydrodynamics, Performance
Design and test of 1/5th scale horizontal axis tidal current turbineLiu, H., Zhou, H., Lin, Y.16 June Current, Cross-Flow TurbineModeling, Scale DeviceHydrodynamics, Performance, Power Take Off
Physical testing of performance characteristics of a novel drag-driven vertical axis tidal stream turbine; with comparisons to a conventional SavoniusHarries, T., Kwan, A., Brammer, J.16 June Current, Cross-Flow TurbineLab Data, ModelingHydrodynamics, Materials, Performance, Structural
Field performance assessment of a hydrokinetic turbineCavagnaro, R., Polagye, B.16 June Current, Cross-Flow TurbineField Data, Lab DataHydrodynamics, Performance, Power Take-Off
Optimization of blade motion of vertical axis turbineMa, Y., Zhang, L., Zhang, Z.16 April Current, Cross-Flow TurbineModelingPerformance, Structural
Numerical and experimental study of the 3D effect on connecting arm of vertical axis tidal current turbineGuo, W., Kang, H., Chen, B.16 March Current, Cross-Flow TurbineLab Data, ModelingHydrodynamics, Performance, Structural
Performance analysis of a horizontal axis 3-bladed Savonius type wave turbine in an experimental wave flume (EWF)Tutar, M., Veci, I.16 February Current, Cross-Flow TurbineLab DataPerformance
Effect of blade vortex interaction on performance of Darrieus-type cross flow marine current turbineWang, Y., Sun, X., Zhu, B.16 February Current, Cross-Flow ModelingHydrodynamics, Performance
Numerical investigation of laboratory tested cross-flow tidal turbines and Reynolds number scalingStringer, R., Hillis, A., Zang, J.16 January Current, Cross-Flow TurbineModeling, Scale DevicePerformance
Evaluation of Electromechanical Systems Dynamically Emulating a Candidate Hydrokinetic TurbineCavagnaro, R., Neely, J., Fa, F.16 January Current, Cross-Flow TurbineModelingPerformance, Power Take-Off
Performance assessment of a vertical axis turbine in a marine current flume tank and CFD modellingRolland, S., Thatcher, M., Ellis, R.15 December Current, Cross-Flow TurbineModeling, Test CenterPerformance
Novel approach of bidirectional diffuser-augmented channels system for enhancing hydrokinetic power generation in channelsElbatran, A., Yaakob, O., Ahmed, Y.15 November Current, Cross-Flow TurbineModelingHydrodynamics, Performance
Numerical investigation of the influence of blade helicity on the performance characteristics of vertical axis tidal turbinesMarsh, P., Ranmuthugala, D., Penesis, I.15 September Current, Cross-Flow TurbineModelingPerformance, Structural
Hydrokinetic energy harvesting by an innovative vertical axis current turbineFernandes, A., Rostami, A.15 September Current, Cross-Flow TurbineLab Data, ModelingPerformance
Performance characterization and placement of a marine hydrokinetic turbine in a tidal channel under boundary proximity and blockage effectsKolekar, N., Banerjee, A.15 June Current, Axial-Flow Turbine, Cross-Flow Turbine CFD ModelingHydrodynamics, Performance
Evaluating current power availability for energy conversion along the Southern Brazilian ShelfKinnus, E., Marques, W., Jung, B.15 June Current, Cross-Flow TurbineField Data, ModelingPerformance
Performance measurements of cylindrical- and spherical-helical cross-flow marine hydrokinetic turbines, with estimates of exergy efficiencyBachant, P., Wosnik, M.15 February Current, Cross-Flow TurbineLab DataHydrodynamics, Performance
The effects of wave–current interaction on the performance of a model horizontal axis tidal turbineHenriques, T., Tedds, S., Najafian, G.14 December Current, Cross-Flow TurbineLab DataPerformance
Simulations of a vertical axis turbine in a channelGoude, A., Agren, O.14 March Current, Cross-Flow TurbineModelingPerformance
Research on the unsteady hydrodynamic characteristics of vertical axis tidal turbineZhang, X., Zhang, L., Wang, F.14 March Current, Cross-Flow TurbineModelingControl, Performance, Structural
Folding tidal turbine as an innovative concept toward the new era of turbinesLam, W., Bhatia, A.13 December Current, Cross-Flow Turbine ModelingMaterials, Performance, Structural
Power measurement of hydrokinetic turbines with free-surface and blockage effectBirjandi, A., Bibeau, E., Chatoorgoon, V.13 September Current, Cross-Flow Turbine, RiverineCFD ModelingHydrodynamics, Performance
Hydrodynamic performance of a vertical-axis tidal-current turbine with different preset angles of attackZhao, G., Yang, R., Liu, Y.13 April Cross-Flow TurbineModeling, Scale DeviceHydrodynamics, Performance, Structural
Modeling and validation of a cross flow turbine using free vortex model and a modified dynamic stall modelUrbina, R., Peterson, M., Kimball, R.13 February Current, Cross-Flow TurbineCFD ModelingPerformance
Modeling passive variable pitch cross flow hydrokinetic turbines to maximize performance and smooth operationLazauskas, L., Kirke, B.12 September Current, Cross-Flow TurbineModelingPerformance
The Tidal Stream Power Curve: A Case StudyHardisty, J.12 May Current, Cross-Flow Turbine, TidalLab Data, Full ScalePerformance
Tests on ducted and bare helical and straight blade Darrieus hydrokinetic turbinesKirke, B.11 November Current, Cross-Flow TurbineField Data, Scale DevicePerformance
Limitations of fixed pitch Darrieus hydrokinetic turbines and the challenge of variable pitchKirke, B., Lazauskas, L.11 March Current, Cross-Flow Turbine CFD ModelingPerformance
A design methodology for cross-flow water turbinesZanette, J., Imbault, D., Tourabi, A.10 May Current, Cross-Flow TurbineModelingPerformance, Structural
Recent TCP (Tidal Current Power) projects in KoreaJo, C., Lee, K., Rho, Y.10 January Current, Axial-Flow Turbine, Cross-Flow Turbine, Tidal CFD ModelingPerformance, Power Take-Off
Efficiency and dynamic performance of Digital Displacement™ hydraulic transmission in tidal current energy convertersPayne, G., Kiprakis, A., Ehsan, M.7 March Current, Cross-Flow Turbine, TidalCFD Modeling Performance
Wave-current interactions in marine current turbinesBarltrop, N., Varyani, K., Grant, A.6 December Current, Cross-Flow TurbineLab Data, ModelingPerformance
Dynamic Behaviour of the Patented Kobold Tidal Current Turbine: Numerical and Experimental AspectsCoiro, D., De Marco, A., Nicolosi, F.5 March Current, Cross-Flow TurbineLab Data, ModelingHydrodynamics, Performance

References

  1. OPEC Reports Record Compliance with Output Cuts, Raises 2017 Oil Demand Growth Forecast. Available online: https://www.cnbc.com/2017/02/13/oil-demand-set-to-outdo-10-year-average-in-2017-opec.html (accessed on 17 September 2017).
  2. Aqua Facts. Available online: https://www.oceanicinstitute.org/aboutoceans/aquafacts.html (accessed on 8 February 2017).
  3. Bedard, R. Economic and social benefits from wave energy conversion marine technology. Mar. Technol. Soc. J. 2007, 41, 44–50. [Google Scholar] [CrossRef]
  4. Setoguchi, T.; Takao, M. Current status of self-rectifying air turbines for wave energy conversion. Energy Convers. Manag. 2006, 47, 2382–2396. [Google Scholar] [CrossRef]
  5. Falcão, A.F.O.; Henriques, J.C.C. Oscillating-water-column wave energy converters and air turbines: A review. Renew. Energy 2016, 85, 1391–1424. [Google Scholar] [CrossRef]
  6. Linus Mofor (IRENA) Jarett Goldsmith and Fliss Jones (Garrad Hassan & Partners Ltd.). OCEAN ENERGY: Technology readiness, patents, Deployment status and outlook. Report: August 2020 (IRENA). Available online: www.irena.org (accessed on 14 August 2022).
  7. Adhikari, R.; Wood, D. The Design of High Efficiency Crossflow Hydro Turbines: A Review and Extension. Energies 2018, 11, 267. [Google Scholar] [CrossRef]
  8. Cui, Y.; Liu, Z.; Zhang, X.; Xu, C. Review of CFD studies on axial-flow self-rectifying turbines for OWC wave energy conversion. Ocean. Eng. 2019, 175, 80–102. [Google Scholar] [CrossRef]
  9. Kaunda, C.S.; Kimambo, C.Z.; Nielsen, T.K. A numerical investigation of flow profile and performance of a low-cost Crossflow turbine. Int. J. Environ. Sci. Technol. 2014, 5, 275–296. [Google Scholar]
  10. Sammartano, V.; Aricò, C.; Carravetta, A.; Fecarotta, O.; Tucciarelli, T. Banki-Michell Optimal Design by Computational Fluid Dynamics Testing and Hydrodynamic Analysis. Energies 2013, 6, 2362–2385. [Google Scholar] [CrossRef]
  11. Choi, Y.-D.; Lim, J.-I.; Kim, Y.-T.; Lee, Y.-H. Performance and Internal Flow Characteristics of a Cross-Flow Hydro Turbine by the Shapes of Nozzle and Runner Blade. J. Fluid Sci. Technol. 2008, 3, 398–409. [Google Scholar] [CrossRef]
  12. Masuda, Y.; McCormick, M.E. Experiences in pneumatic wave energy conversion in Japan. In Utilization of Ocean Waves e Wave to Energy Conversion; Cormick, M.E.M., Kim, Y.C., Eds.; American Society of Civil Engineers: New York, NY, USA, 1986. [Google Scholar]
  13. Falnes, J. A review of wave-energy extraction. Mar. Struct. 2007, 20, 185–201. [Google Scholar] [CrossRef]
  14. Weerakoon, A.H.S.; Young, H.-S.; Kim, W.-K.; Lee, Y.-H. Novel Tidal Energy Harnessing System Utilizing Quadruple Bi-directional Turbine Arrangement. In Proceedings of the 2020 IEEE Asia-Pacific Conference on Computer Science and Data Engineering (CSDE), Gold Coast, Australia, 8 December 2020; p. 1, ISBN 978-1-6654-1974-1. [Google Scholar] [CrossRef]
  15. Alkhabbaz, A.; Yang, H.-S.; Weerakoon, A.H.S.; Lee, Y.-H. A novel linearization approach of chord and twist angle distribution for 10 kW horizontal axis wind turbine. Renew. Energy 2021, 178, 1398–1420. [Google Scholar] [CrossRef]
  16. Akimoto, H.; Tanaka, K.; Kim, Y.Y. Drag-type cross-flow water turbine for capturing energy from the orbital fluid motion in ocean wave. Renew. Energy 2015, 76, 196–203. [Google Scholar] [CrossRef]
  17. Mehr, G.; Durali, M.; Khakrand, M.H.; Hoghooghi, H. A novel design and performance optimization methodology for hydraulic Cross-Flow turbines using successive numerical simulations. Renew. Energy 2021, 169, 1402–1421. [Google Scholar] [CrossRef]
  18. Kim, K.-P.; Ahmed, M.R.; Lee, Y.-H. Efficiency improvement of a tidal current turbine utilizing a larger area of channel. Renew. Energy 2012, 48, 557–564. [Google Scholar] [CrossRef]
  19. Cooke, S.C.; Willden, R.H.J.; Byrne, B.W. The potential of cross-stream aligned sub-arrays to increase tidal turbine efficiency. Renew. Energy 2016, 97, 284–292. [Google Scholar] [CrossRef]
  20. Weerakoon, A.H.S.; Kim, B.-H.; Cho, Y.-J.; Prasad, D.D.; Ahmed, M.R.; Lee, Y.-H. Design optimization of a novel vertical augmentation channel housing a cross-flow turbine and performance evaluation as a wave energy converter. Renew. Energy 2021, 180, 1300–1314. [Google Scholar] [CrossRef]
  21. Sinagra, M.; Sammartano, V.; Aricò, C.; Collura, A.; Tucciarelli, T. Cross-flow Turbine Design for Variable Operating Conditions. Procedia Eng. 2014, 70, 1539–1548. [Google Scholar] [CrossRef]
  22. Babarit, A. A database of capture width ratio of wave energy converters. Renew. Energy 2015, 80, 610–628. [Google Scholar] [CrossRef]
  23. Iglesias, G.; Carballo, R. Wave energy potential along the Death Coast (Spain). Energy 2009, 34, 1963–1975. [Google Scholar] [CrossRef]
  24. Vanem, E. Joint statistical models for significant wave height and wave period in a changing climate. Mar. Struct. 2016, 49, 180–205. [Google Scholar] [CrossRef]
  25. Lee, U.-J.; Jeong, W.-M.; Cho, H.-Y. Estimation and Analysis of JONSWAP Spectrum Parameter Using Observed Data Around Korean Coast. J. Mar. Sci. Eng. 2022, 10, 578. [Google Scholar] [CrossRef]
  26. Tey, W.-Y.; Asako, Y.; Sidik, N.A.C.; Goh, R.-Z. Governing Equations in Computational Fluid Dynamics: Derivations and A Recent Review. Prog. Energy Environ. 2017, 1, 1–19. [Google Scholar] [CrossRef]
  27. Ransley, E.J.; Greaves, D.; Raby, A.; Simmonds, D.; Hann, M. Survivability of wave energy converters using CFD. Renew. Energy 2017, 109, 235–247. [Google Scholar] [CrossRef]
  28. Windt, C.; Davidson, J.; Ringwood, J.V. High-fidelity numerical modelling of ocean wave energy systems: A review of computational fluid dynamics-based numerical wave tanks. Renew. Sustain. Energy Rev. 2018, 93, 610–630. [Google Scholar] [CrossRef]
  29. Simonetti, I.; Cappietti, L.; Elsafti, H.; Oumeraci, H. Optimization of the geometry and the turbine induced damping for fixed detached and asymmetric OWC devices: A numerical study. Energy 2017, 139, 1197–1209. [Google Scholar] [CrossRef]
  30. Leijon, M.; Danielsson, O.; Eriksson, M.; Thorburn, K.; Bernhoff, H.; Isberg, J.; Sundberg, J.; Ivanova, I.; Sjöstedt, E.; Ågren, O.; et al. An electrical approach to wave energy conversion. Renew. Energy 2006, 31, 1309–1319. [Google Scholar] [CrossRef]
  31. Salter, S.H. Wave power. Nature 1974, 249, 720–724. [Google Scholar] [CrossRef]
  32. Douglas, J.F. Fluid Mechanics; Pearson/Prentice Hall: Hoboken, NJ, USA, 2005. [Google Scholar]
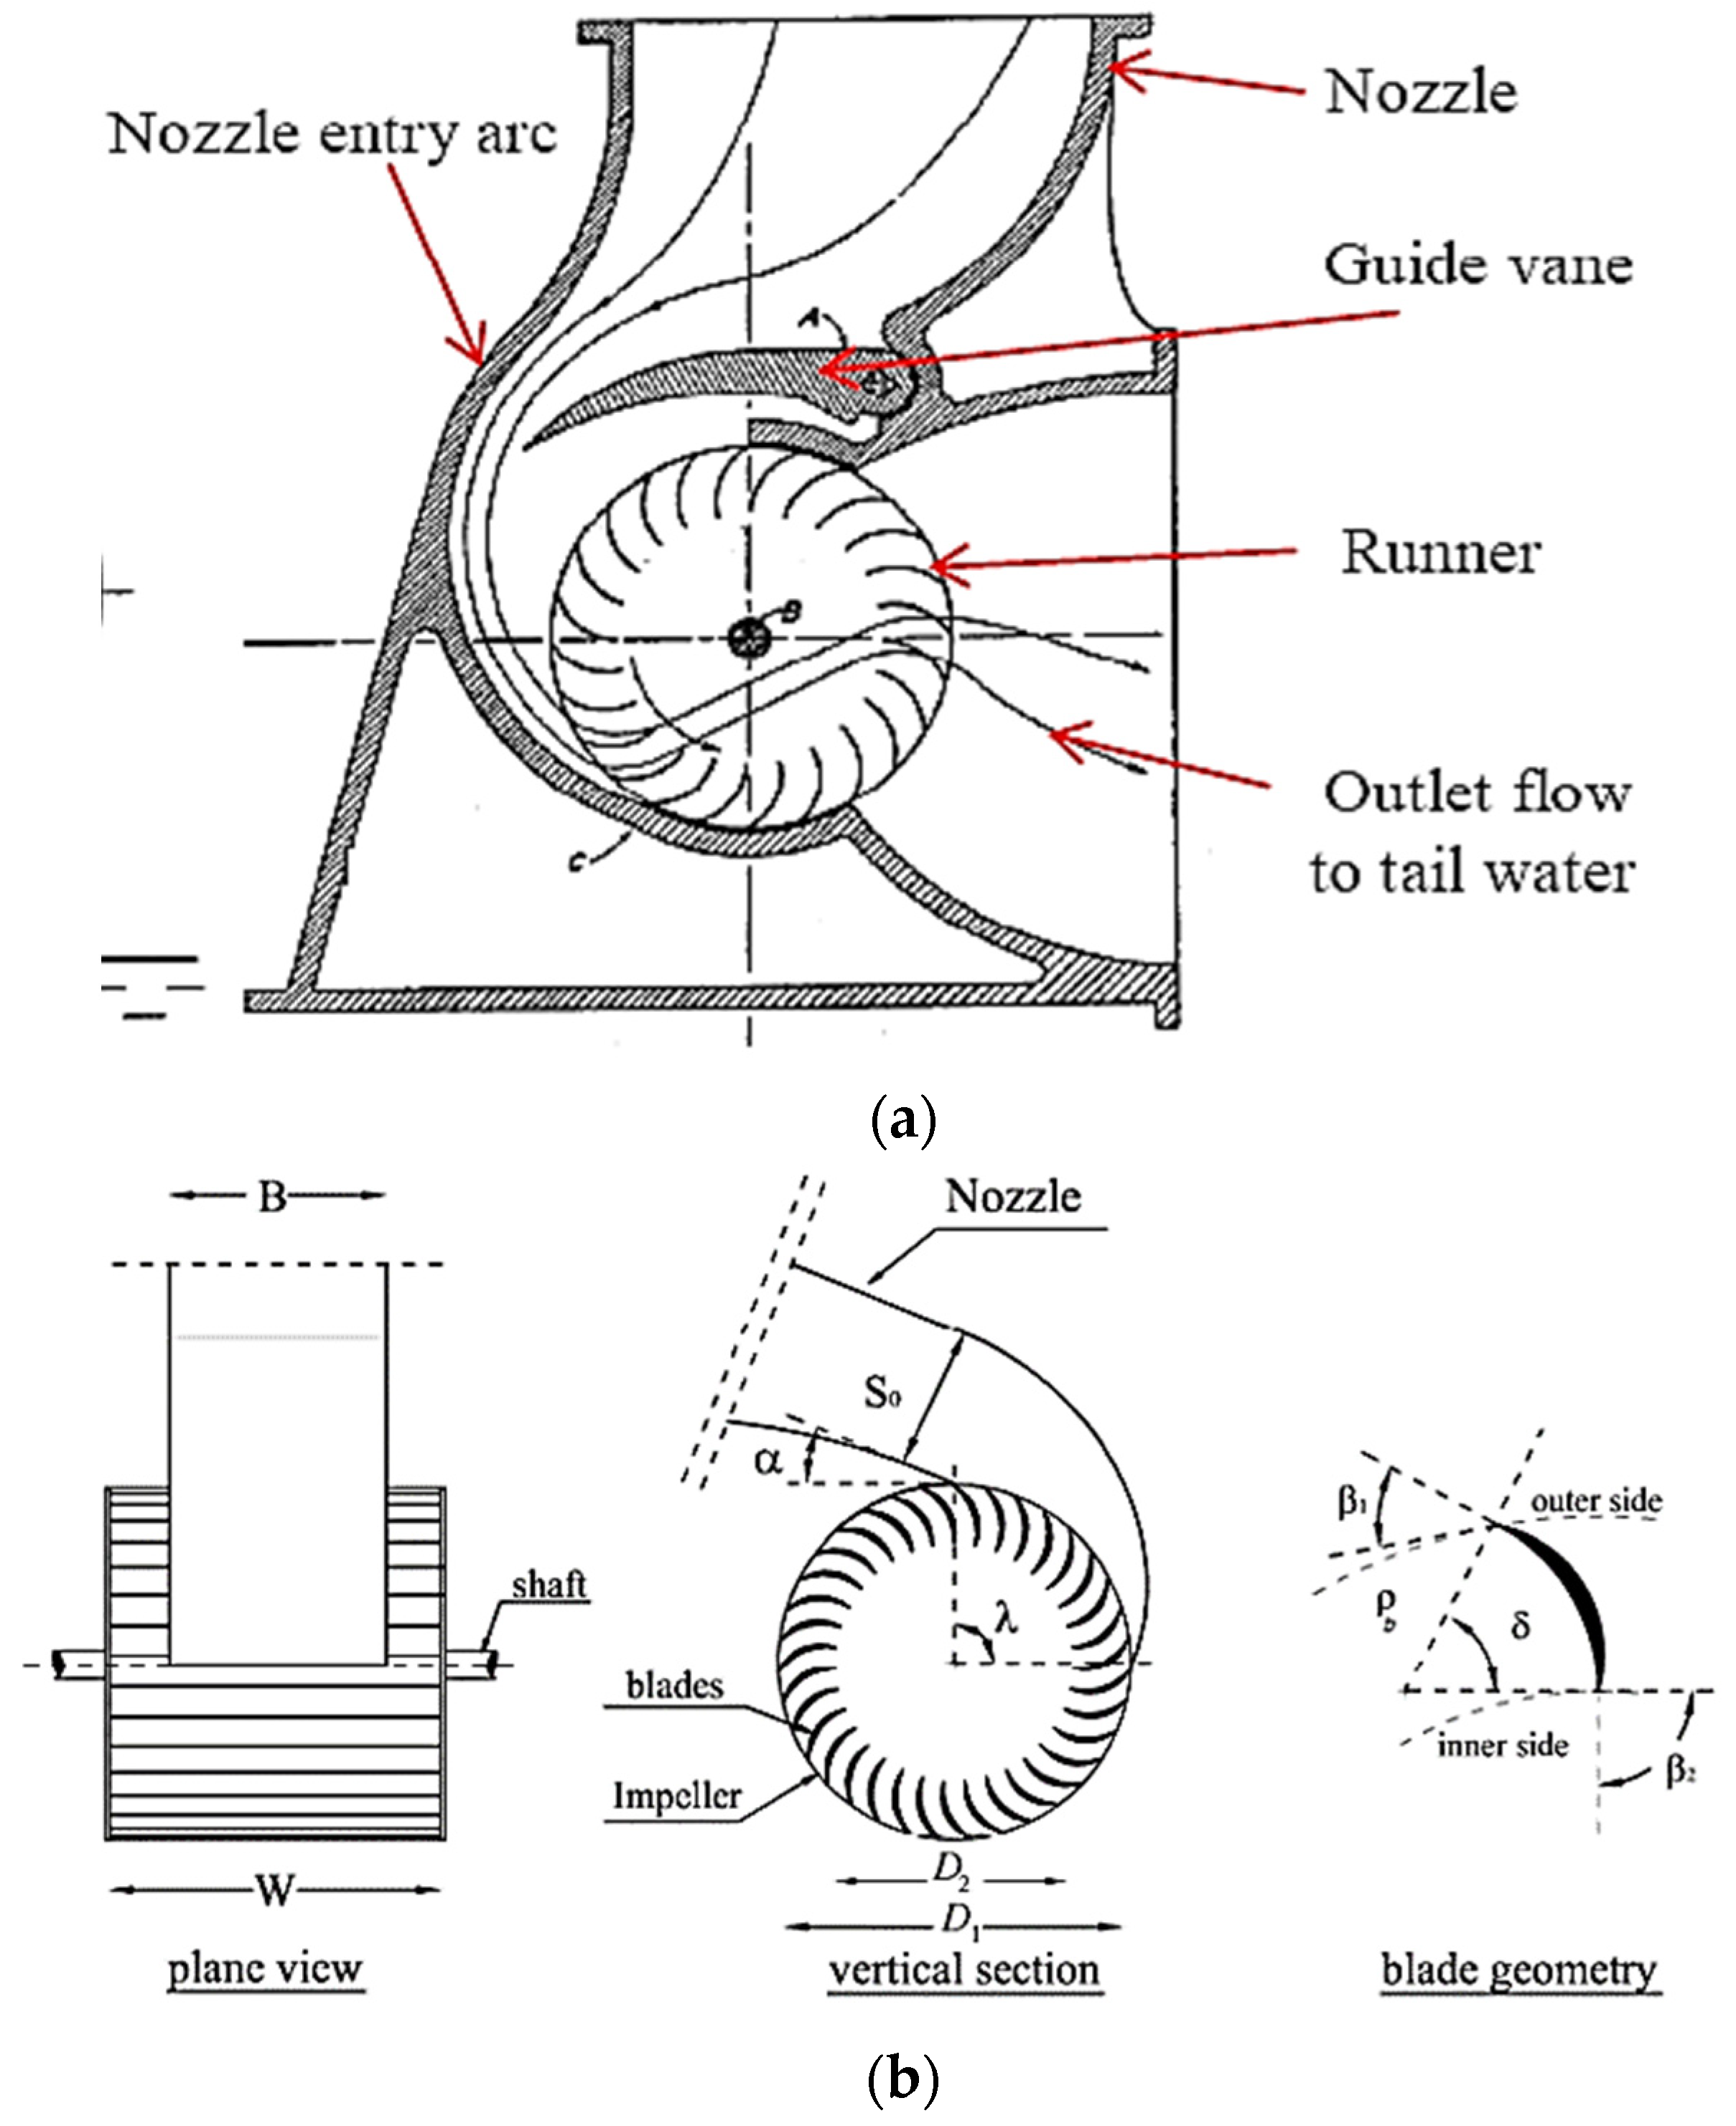
Figure 1. (a) The typical CFT main components and view [8]; (b) The shape of the runner and nozzle (bottom) of the orthogonal turbine [9].
Sustainability 15 07152 g001
Figure 2. Velocity triangle CFT.
Sustainability 15 07152 g002
Figure 3. Efficiency of different turbines (Sinagra et al., 2014) [21].
Sustainability 15 07152 g003
Scheme 1. JONSAPW Analysis.
Sustainability 15 07152 sch001
Figure 4. (a) Power matrix to synchronize the site-specific data with the power performance results, Ref. [22]; (b) Offshore recourse characterization Power Matrix including wave power isolines for the Death Coast (Costa da Morte), NW Spain [23].
Sustainability 15 07152 g004
Figure 5. CAD model of the turbine runner/runner blades.
Sustainability 15 07152 g005
Figure 6. Nozzle upper shape optimization [21] (Ref. Table 2).
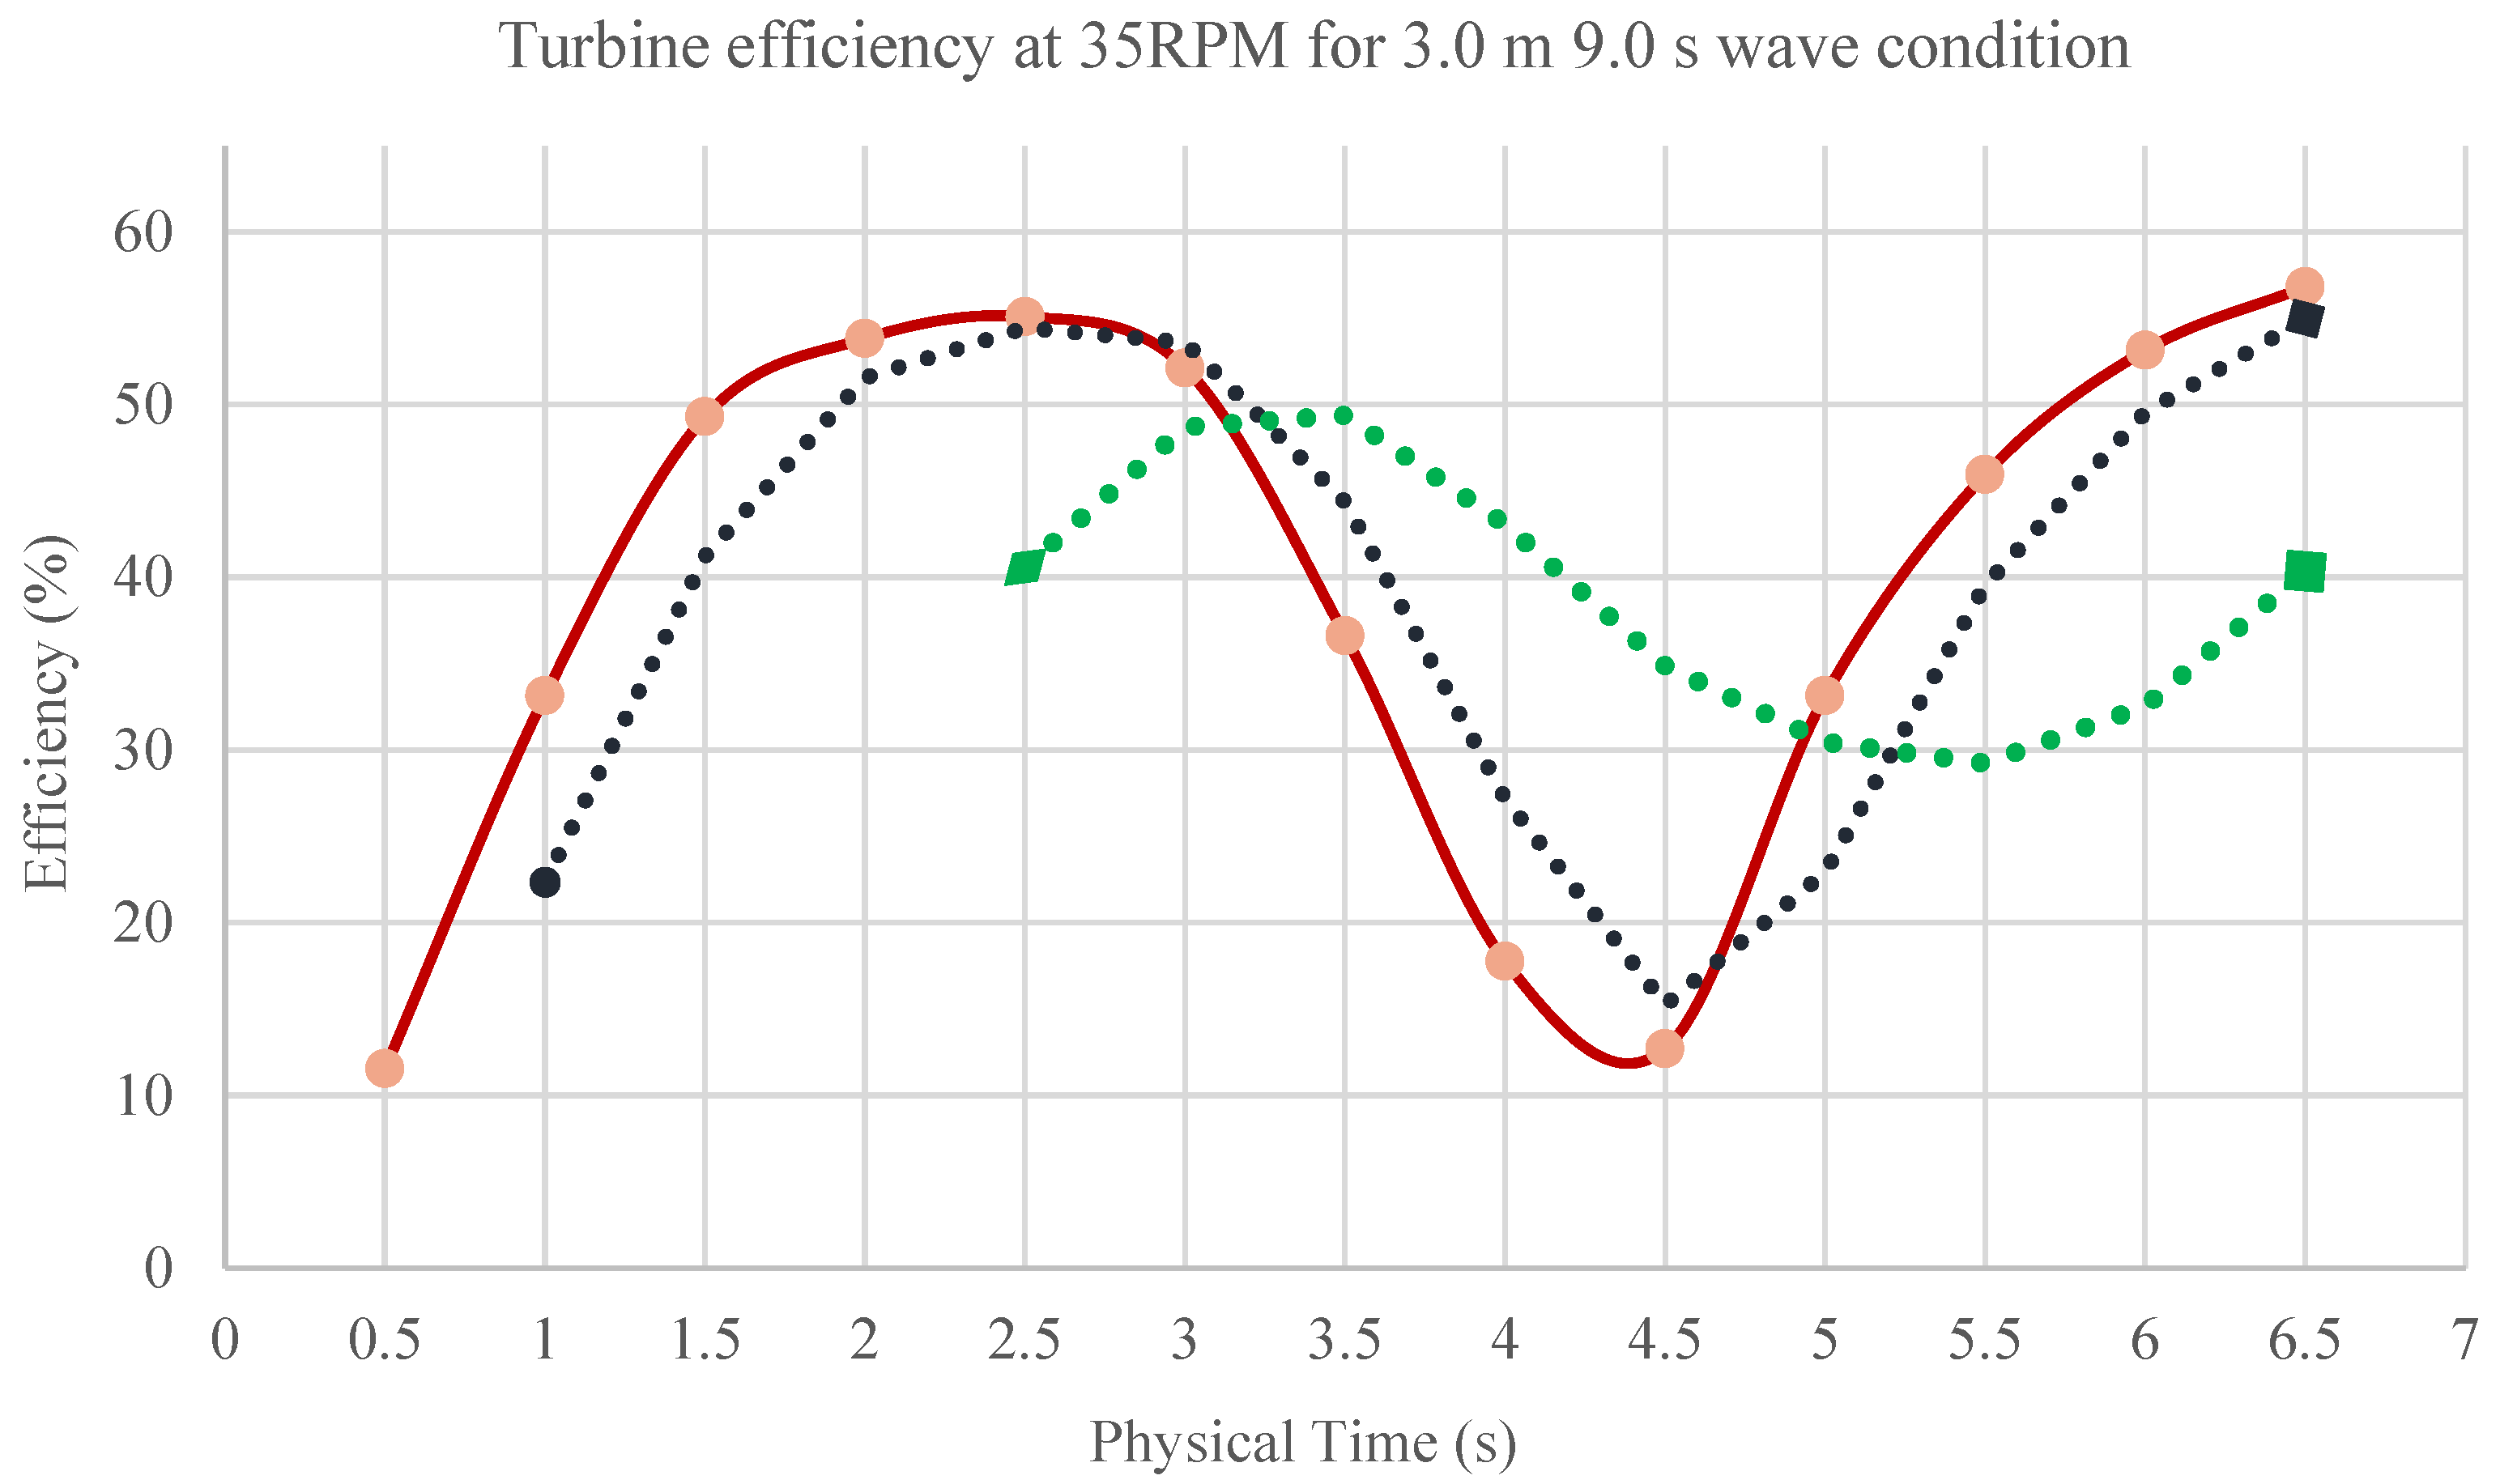
Sustainability 15 07152 g006
Figure 7. CWR as a function of the WEC characteristic dimension Ref. [22].
Sustainability 15 07152 g007
Figure 8. CAD designed 150 deg base nozzle shape of the turbine.
Sustainability 15 07152 g008
Figure 9. Nozzle shapes for geometric optimization of 90 deg, 110 deg, 130 deg, and the base 150 deg.
Sustainability 15 07152 g009
Figure 10. Turbine Blade Mesh.
Sustainability 15 07152 g010
Figure 11. Turbine runner 3D view of mesh.
Sustainability 15 07152 g011
Figure 12. Prism layers generated at the blade edge.
Sustainability 15 07152 g012
Figure 13. Mesh generated around the nozzles and the turbine flow path.
Sustainability 15 07152 g013
Figure 14. Single nozzle shape contacting the mesh.
Sustainability 15 07152 g014
Figure 15. (a) CFX Simulation Boundary conditions; (b) CFX Simulation Boundary conditions and setup properties.
Sustainability 15 07152 g015
Figure 16. The Finite Fluid Element of Interest in Space [26].
Sustainability 15 07152 g016
Figure 17. Mesh convergence test results of the CFT.
Sustainability 15 07152 g017
Scheme 2. Research Methodology.
Sustainability 15 07152 sch002
Figure 18. Turbine efficiency changes with RPM.
Sustainability 15 07152 g018
Figure 19. Turbine power change with RPM.
Sustainability 15 07152 g019
Figure 20. Efficiency variation with different head values for a range of rotational speeds.
Sustainability 15 07152 g020
Figure 21. Nozzle entry arc angle vs. turbine efficiency.
Sustainability 15 07152 g021
Figure 22. (a) CFD results for 90 deg. entry arc nozzle; (b) CFD results for 110 deg. entry arc nozzle; (c) CFD results for 130 deg. entry arc nozzle.
Sustainability 15 07152 g022aSustainability 15 07152 g022b
Figure 23. Base turbine velocity vector field.
Sustainability 15 07152 g023
Figure 24. Velocity contour of the flow through the turbine.
Sustainability 15 07152 g024
Figure 25. Velocity streamlines of the flow through the turbine. Circular section A and B illustrates the zones of highest flow velocities.
Sustainability 15 07152 g025
Figure 26. The high-velocity flow path.
Sustainability 15 07152 g026
Figure 27. Flow circulation and vortex formation, separation regions and blade circulation.
Sustainability 15 07152 g027
Figure 28. Relative eddies in the flow circulation between blades.
Sustainability 15 07152 g028
Figure 29. The relative eddy formation in 3D view on the exit of the flow from the turbine.
Sustainability 15 07152 g029
Figure 30. The relative eddy conceptual formation and rotation around blades [32].
Sustainability 15 07152 g030
Figure 31. The blade circulation around the blades (CFD).
Sustainability 15 07152 g031
Figure 32. Theoretical representation of the blade circulation phenomena [32].
Sustainability 15 07152 g032
Figure 33. The flow regions divided by the jet of water flow.
Sustainability 15 07152 g033
Figure 34. Bottom flow region blades with lesser relative eddy formation.
Sustainability 15 07152 g034
Figure 35. Flow separation and backflow.
Sustainability 15 07152 g035
Figure 36. Turbine cyclic efficiency variation at 25 RPM.
Sustainability 15 07152 g036
Figure 37. Turbine cyclic efficiency variation at 35 RPM.
Sustainability 15 07152 g037
Figure 38. Turbine torque variation with time.
Sustainability 15 07152 g038
Figure 39. Bidirectional flow velocity vector variation through the turbine runner and nozzle.
Sustainability 15 07152 g039aSustainability 15 07152 g039b
Table 1. Wave specification data.
Wave Specification Data
Significant Wave Height (Hs)3.0 m
Peak Wave Frequency0.0177 Hz
Peak Wave Period9.0 s
Peak Frequency0.11 rad/s
Gamma Value3.3
Table 2. Design parameters of the cross-flow turbine.
Turbine Design Parameters
Designed Head (m)3 m
Flow Rate Q (m3/s)10 m3/s
Outer Diameter (D2)2.0 m
Inner Diam. (D1)1.36 m
Length/Width (L)7.5 m
N (RPM)35 RPM
Number of Blades (n)18
Radial Rim Width (a)0.34 m
Blade Curvature (p)217.6 mm
Blade Span (t)0.348 m
Nozzle Entry Arc (λ)90~150 deg
Estimated Efficiency75%
Blade Angle16 deg
Entrance Angle30 deg
Exit Angle90 deg
Table 3. Numerical simulation setup parameters.
Simulation TypeSteady StateTransient (Time Averaging)
Mesh TypeHexahedralHexahedral
Number of Nodes3.56 million3.56 million
Time stepAutomatic30 s
Turbulence modelShea Stress Transport (SST) Shea Stress Transport (SST)
Fluid PhaseSingle Phase (Water)Single Phase (Water)
Mesh MotionStationeryMoving
Inlet boundaryWave inletWave inlet
Outlet boundaryOpeningOpening
Turbine Rotational Speed 20, 30, 35, 40, and 45 rpm25 and 35 rpm
Rotor–Stator InterfaceFrozen RotorTransient Rotor Stator
Table 4. Base Simulation Results (Steady State) for the CFT.
CriterionNumerical Value at BEP
Head3.00 m of Head
RPM35 RPM
Efficiency54.33%
Y+ Value3.14156
Mass Flow Rate2025.56 kg/s
Extracted Power33.366 kW (0.5 m Width)
Real Scale Model Power500.49 kW
CFD CodeEfficiency
Ansys CFX54.33%
Star CCM+52.38%
Disclaimer/Publisher’s Note: The statements, opinions and data contained in all publications are solely those of the individual author(s) and contributor(s) and not of MDPI and/or the editor(s). MDPI and/or the editor(s) disclaim responsibility for any injury to people or property resulting from any ideas, methods, instructions or products referred to in the content.