Abstract
Artificial floating islands (AFIs) have been documented as an efficient, environmentally friendly, and cost-effective solution to address nutrient pollution. However, most AFI studies to date have been conducted in controlled experiments, and AFI applications in natural settings, particularly in the U.S. Midwest, are limited. Here, we present the results of a combination of field and mesocosm experiments with two native aquatic plant species (Carex comosa and Eleocharis palustris) in a constructed wetland in north-central Ohio. Results showed that C. comosa outperformed E. palustris with respect to biomass accumulation and root system development. In natural conditions, C. comosa had a total dry biomass production of 58.5 ± 22.2 g/plug compared to 6.1 ± 3.2 g/plug in E. palustris. The maximum estimated mean nutrient storage for C. comosa was 20.24 g/m2 of N and 1.33 g/m2 of P, whereas it was 2.31 g/m2 of N and 0.17 g/m2 of P for E. palustris. In addition, the more developed root system of C. comosa suggests that AFIs containing this plant have better total nutrient removal capacity. The growth conditions of both species were significantly impacted by seasonal dynamics with respect to their biomass production and root elongation, as evidenced by reduced growth towards the end of the growing season.
1. Introduction
Eutrophication occurs when there is an excessive presence of plant nutrients, primarily nitrogen (N) and phosphorus (P), in bodies of water. This excess of nutrients caused by eutrophication has a broad range of effects on aquatic ecosystems. One of these effects is the proliferation of algae, some of which release toxic substances, such as cyanotoxins, that pose a threat to humans, fish, shellfish, marine mammals, and birds [1,2]. Additionally, the overgrowth of algae caused by eutrophication can lead to a depletion of oxygen in the water, leading to a reduction in biodiversity [3]. Eutrophication can also change the composition of species in an ecosystem, resulting in the loss of vital ecological services [4]. Moreover, the economic impacts of eutrophication are significant and can include increased water treatment costs and a loss of recreational opportunities [4,5].
To address the worldwide environmental issue of eutrophication, a wide range of technical and regulatory approaches have been tested [6,7,8]. Meanwhile, there is a growing body of research demonstrating that phytoremediation strategies involving plants and associated microbes can effectively reduce nutrient levels and other pollutants in aquatic environments, making it a cost-effective and environmentally friendly way to address nutrient pollution [9,10,11,12]. Artificial floating islands (AFIs) are one phytoremediation technology that have been utilized in a variety of water systems worldwide for nearly 40 years [13,14,15]. Over the past two decades, AFIs have gained popularity as a low-cost solution for large-scale remediation of eutrophic waters [16].
AFIs remove nutrients from water through three main mechanisms: (1) direct uptake of dissolved nutrients by macrophyte root systems, (2) sedimentation or entrapment of suspended solids containing sorbed or particulate forms of nutrients by root systems, and (3) assimilation or conversion of nutrients by microbial communities associated with root systems [1]. By using natural processes and mimicking natural conditions, AFIs are environmentally friendly (green infrastructure) and, compared to traditional gray infrastructure (e.g., water treatment plants), can achieve water quality improvements with significantly lower lifetime operational and maintenance costs [17]. Because of the hydroponic nature of root development, AFIs also present a significant advantage over traditional phytoremediation treatment systems (constructed wetlands), in that greater surface area for biofilm growth is available in the AFIs’ extensive floating rhizosphere [18].
Most AFI research to date has largely been conducted in controlled experimental settings (microcosms/mesocosms) [13,14]. The advantage of microcosm/mesocosm studies is that they can control or isolate specific parameters of interest (i.e., concentration of nutrients, AFI coverage, and hydraulic retention time) to separate and understand the underlying mechanism(s) affecting the growth and development of AFI plants, as well as the performance of AFIs. However, while these lab-scale experiments have provided an extensive database of AFI performance in controlled conditions, they only present crude simplifications of the greater physical, biological, and chemical complexity of natural systems, particularly when conducted on small spatial and temporal scales [19]. On the other hand, examining the implementation of AFIs on a large scale provides insight into the overall quantity of nutrients that can be extracted from a body of water and helps to evaluate the feasibility of deploying AFIs for water quality improvement purposes. For instance, Olguín et al. (2017) conducted studies which revealed that a 33 m2 AFI was capable of removing up to 0.11 g/m2 TP per day, while Afzal et al. (2019) reported that AFIs could process 60 million m3 of wastewater annually at a cost of USD 0.00026 per m3 [16,20]. To enhance our limited mechanistic understanding and the predictive ability of AFIs as a sustainable solution for nutrient pollution, more long-term, field-scale AFI experiments are necessary. In an effort to address this limitation, our study combined field and mesocosm experiments to evaluate the nutrient-removal efficiency of AFI systems using two species of native aquatic plants, Carex comosa and Eleocharis palustris, in a constructed wetland system in north-central Ohio. These species have a wide range of ecological tolerance and are suited to the environmental conditions observed in our study site. They are widely used in landscaping, wetland restoration, and wastewater treatment purposes.
Specific objectives of this study included: (1) comparing the biomass accumulation and plant elongation metrics of C. comosa and E. palustris over a complete growing season, (2) estimating and assessing the nutrient sequestration performance of the two tested species, and (3) investigating the seasonality effect on plant growth and nutrient sequestration performance. The hypotheses to be tested in this study are as follows: (1) C. comosa has greater biomass accumulation and plant elongation throughout the study period compared to E. palustris, (2) AFIs containing C. comosa have greater nutrient sequestration through direct uptake by plant tissues, and (3) both the biomass accumulation and plant elongation decrease in the later period of study for the two species.
2. Materials and Methods
2.1. Description of the Study Site
The study site, the Milliron Research Wetland, is a 2500 m2 constructed wetland located at the Mansfield Campus of the Ohio State University, in Mansfield, OH, USA (Figure 1). It was built in 2005 to remediate the loss of a small wetland during the construction of a campus building (Riedl Hall). The wetland has only one inlet, through a pipe collecting runoff from 0.2 km2 of impervious surface of the campus, and one outlet, a small stream that connects the wetland to the Rocky Fork of the Mohican River. The wetland has three main ponds that are hydrologically connected by shallow sections (Figure 1). Wetland plants growing in the shallow areas connecting the ponds slow down the flow and increase the retention time of water, resulting in relative lentic hydrologic features on the wetland. The flow rate between ponds during the experimental period was below the detection level of a Global Water® hand-held flowmeter (<0.1 m/s). The inlet pipe sits in a shallow section in the first pond that, by mid-spring, is completely covered by local wetland plants (Figure 1). The outlet pipe is located at the third pond. The second pond, with the largest open surface, was selected as the main study area for the deployment of the AFI units in the field experiment (Figure 1).
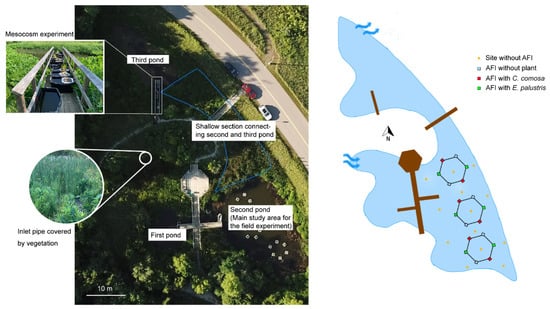
Figure 1.
Aerial view of the study site showing the location of the mesocosm and field experiments at the Ohio State University Mansfield Campus, OH, USA. AFI stands for artificial floating islands.
A Skalar San++ automated wet chemistry analyzer with segmented flow was used for the analysis of nutrient species in water samples collected at the study site. Biweekly monitoring of the site during the study period indicated relatively low nutrient concentrations—NH4+: 55.15 ± 17.00 μg/L; NO2− + NO3−: 81.32 ± 55.03 μg/L: PO43−: 10.38 ± 4.98 μg/L—which were likely due to extensive local vegetation developed on the wetland banks and water surface during the growing season (May–September). The automated procedure for the determination of NH4+ is based on the modified Berthelot reaction, where ammonia is buffered and chlorinated to monochloramine which reacts with salicylate to 5-aminosalicylate. After oxidation and oxidative coupling, a green-colored complex is formed. The absorption of the formed complex is measured at 660 nm. The automated procedure for the determination of NO2− + NO3− is based on the cadmium reduction method. The sample is buffered at pH 8.2 and passed through a column containing granulated copper–cadmium to reduce the nitrate to nitrite. The nitrite (originally present plus reduced nitrate) is determined by diazotizing with sulfanilamide and coupling with N-(1-naphthyl)ethylenediamine dihydrochloride to form a highly colored azo dye which is measured at 540 nm. The automated procedure for the determination of PO43− is based on the following reaction. Ammonium heptamolybdate catalyzed by potassium antimony(III) oxide tartrate reacts in an acidic medium with phosphate in the sample to form a phospho-molybdic acid complex. This complex is reduced in an intensely blue-colored complex by L(+)ascorbic acid and measured at 880 nm.
2.2. AFI Construction
The AFI was constructed using 5 cm PVC pipes and elbows to form a 60 cm × 60 cm outer frame. The floating platform was made from a 2.5 cm-thick ethylene–vinyl acetate (EVA) foam mat, measuring 60 cm × 60 cm. The EVA mats were attached to the PVC frame using nylon zip-ties, and two pieces of 2.5 cm PVC pipes were tied to the underside of the outer PVC frame to provide additional support (Figure A1). Nine holes were pre-cut in the EVA mats, and eight of these holes held 10 cm luffa sponges. The luffa sponges served three purposes: they held aquatic plant seedlings, provided moisture for the developing roots, and increased the surface area for bacterial biofilm growth. The sponges were attached to the EVA mat with nylon zip-ties and helped one plant seedling each (Figure A1). As the plants grew and established their root systems, the luffa sponges biodegraded, fulfilling their role as temporary support during and shortly after deployment.
2.3. Plant Species Selection
The study tested two species of native aquatic plants commonly found in Ohio’s wetlands, Carex comosa Boott (bristly sedge) and Eleocharis palustris (L.) Roem. and Schult (common spike-rush) (Figure A2). These species have a wide range of ecological tolerance, allowing them to thrive in various environmental conditions [21], and they are widely used for landscaping, wetland restoration [22], and wastewater treatment purposes [23,24,25,26]. The plant plugs were purchased from Cardno Native Plant Nursery (Walkerton, Indiana), each tray containing 50 individual plant plugs.
2.4. AFI Setup
Plant plugs were acclimatized in the first pond on AFI floating platforms before being transplanted to the AFI units in the main study area (the second pond). Some plant plugs remained in the first pond until they were harvested for biomass measurement (biweekly between June and September 2020) throughout the experiment. These plant plugs were grown in an environment mimicking the main study area, as they were exposed to similar physical–chemical conditions and nutrient concentrations. Keeping the plant plugs in the first pond allowed for capturing the same general growth conditions of the species being tested in the second pond.
Three hexagonal cells in the second pond were each equipped with six AFI units, for a total of 18 AFI units deployed (Figure A2). Within each cell, two AFI units held plugs of C. comosa, two held plugs of E. palustris, and the remaining two units were left without plants and served as experimental controls. Individual AFIs in each cell were connected to each other by pieces of 1.3 cm PVC pipes (Figure A2). The AFI units were anchored to the bottom of the wetland using weights tied with nylon ropes to keep them in place and preserve the hexagonal shape of the cells. The water depth in the AFI deployment zones ranged from 0.5 m to 2.3 m.
In addition to the natural field experiment described above, a mesocosm experiment was also established (located on the boardwalk over the third pond—Figure 1) using nine tanks, each holding 150 liters of water pumped directly from the wetland. Each of these tanks contained a single smaller AFI unit (30 cm × 30 cm), three of them containing C. comosa plugs, three containing E. palustris plugs, and the remaining three being experimental controls with no plants. The small AFIs used in the mesocosm experiment were constructed using the same materials as the large AFIs (60 cm × 60 cm) deployed in the second pond and contained four plant plugs each (compared to eight in the larger AFIs of the field experiment). The water in the tanks was exchanged biweekly using a peristaltic pump.
2.5. Sampling Procedure
Plant tissue samples were periodically collected from the first pond, as well as the AFI units in the field experiment (second pond) and the AFI units in the mesocosm experiment. Plant tissue sampling in the first pond was conducted biweekly from 24 June 2020, when established roots were first observed in the AFIs, to 24 September 2020. At each sampling time, three plugs of each plant species were randomly selected using a random number generator. Plant tissue sampling in the field experiment (natural conditions, second pond) occurred during two trial periods: Trial 1 (T1), occurring from 24 June to 29 July, and Trial 2 (T2) from 29 July to 6 October. On the last day of T1, all plants from the AFI units in cell 2 were harvested and replaced. On the last day of T2, all plants from all AFI units were harvested. After that point, the AFIs (now with no plants) were kept in their cells within the second pond for an additional 4 weeks, during which water samples for water quality monitoring continued to be collected. Plant tissue sampling in the mesocosm experiment occurred during three trial periods: Trial 1 (Tm1) from 24 June to 22 July, Trial 2 (Tm2) from 29 July to 2 September, and Trial 3 (Tm3) from 2 September to 29 September. On the last day of each trail, all plants were collected from all AFI units in the mesocosms and then replaced by new plugs.
Immediately after sampling, plants were thoroughly washed to remove attached sediments and microbial biofilms while preserving the integrity of plant tissues. The above-ground tissues (shoots) and below-ground tissues (roots) were then separated and subjected to biomass and length measurements. To prepare the plant tissues for analysis, the standard operating procedures for preparation and analysis of environmental samples containing unknown concentrations of hazardous/toxic materials [27] were followed. Plant tissues were wiped dry using paper towels before measuring their wet biomass. The roots and shoots were placed in separate paper bags and dried in a drying oven at 80 °C for 48 h, after which their dry biomass was weighted.
2.6. Data Analysis
The water content in the plant tissues was determined individually for shoots and roots, based on the wet and dry biomass using Equation (1). The root elongation rate (RER) for the plants was determined using Equation (2).
Here, RERi represents the root elongation rate for plant sample on the ith sampling time, and Root lengthi+1 and Root lengthi are the root lengths (in cm) for plant samples on the (i + 1)th and ith sampling times, respectively.
Normally distributed values are reported as mean ± standard error. The two-sample Student’s t test was used to compare the accumulation of biomass and plant lengths between the two tested species. The Fisher’s least significant difference t test was used for multiple comparisons, and differences were considered significant if the p-value was less than 0.05. All statistical analyses were performed using the R software.
3. Results and Discussion
3.1. General Trends in Plant Growth
Biweekly measurements of plant tissue samples from the first pond indicated a consistent increase in whole-plant dry biomass for C. comosa during the study period, whereas the growth of E. palustris was much slower over the same span (Figure 2A). C. comosa showed an average increase in total biomass of 10.5 g/plug, starting from an initial dry biomass of 2.88 ± 0.13 g/plug on 24 June and ending with a final dry biomass of 13.38 ± 1.44 g/plug on 24 September. Both the shoots and roots showed an increase in biomass, with above-water biomass (shoots) growing from 1.70 ± 0.11 g/plug in June to 7.25 ± 0.90 g/plug in September and below-water biomass (roots) increasing from 1.17 ± 0.07 g/plug in June to 6.13 ± 1.12 g/plug in September. In contrast, E. palustris had a limited average increase in total biomass of only 1.2 g/plug, growing from 1.22 ± 0.09 g/plug in June to 2.42 ± 0.66 g/plug in September. Much of E. palustris biomass gain was in the below-water section (roots), which increased from 0.61 ± 0.08 g/plug in June to 1.79 ± 0.59 g/plug in September. The dry biomass in shoots showed little change, going from 0.61 ± 0.04 g/plug in June to 0.63 ± 0.30 g/plug in September. Root biomass accounted for 47.2% of the total whole-plant biomass accumulation in C. comosa and 98.3% in E. palustris. This suggests that C. comosa had a relatively balanced growth in both shoots and roots, while the roots of E. palustris significantly exceeded the growth of its shoots. Another study comparing tissue biomass of different species also shown C. comosa to be a prolific biomass producer, reporting an average total biomass accumulation of 35.6 ± 12.8 g/plant in a suburban stormwater pond [28].
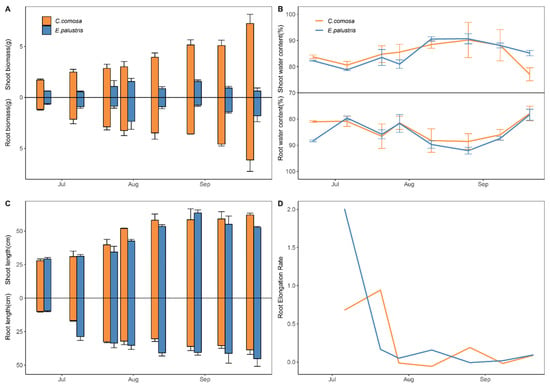
Figure 2.
(A) Shoot and root dry biomass, (B) shoot and root water content, (C) shoot and root length, and (D) root elongation rate (RER) for C. comosa and E. palustris.
Additionally, the final ratio of root length to shoot length was 0.62 for C. comosa and 0.86 for E. palustris, further indicating that E. palustris allocated more resources to the root tissues, most likely to adapt to the nutrient-deficient conditions in the wetland during the study period. Moreover, the contrasting root elongation rate (RER) of the two species showed their differing growth strategies. The fluctuation in RER indicated that E. palustris had a more substantial root growth at the outset of the experiment, rapidly developing lengthy roots in the initial two weeks (24 June–8 July), whereas the root growth of C. comosa was not as pronounced (Figure 2D). Many grass species tend to alter their root morphology, including increasing root length and reducing root diameter, to adapt to nutrient deficiency [29]. E. palustris displayed both adaptation behaviors (Figure 2C,D). The low levels of nitrogen and phosphorus in the study site throughout the year suggested that E. palustris was more sensitive to such conditions and was experiencing nutrient deficiency in comparison with C. comosa. Although we did not determine the specific role of nitrogen or phosphorus, previous studies suggested that low phosphorus availability is likely the driving factor behind this phenotypic plasticity [30].
The water content in the shoots of both species rose until mid-August but then began to decrease (Figure 2B). Conversely, the water content in the roots of both species gradually decreased until mid-August and then started to increase (Figure 2B). At the end of the study, both species showed visible signs of decay at their leaf tips and a reduction in leaf area (Figure 3). Despite this, C. comosa was still able to maintain its biomass accumulation (Figure 2A). According to the United States Department of Agriculture, E. palustris has its main growing period during spring, while C. comosa has a longer active growing season extending into the fall [31,32]. As obligate wetland plants capable of tolerating permanent flooding, both species are adapted to wet conditions. However, E. palustris typically grows and thrives in shallower water, less than 1 m deep, which is shallower than the depth observed throughout most of the AFI deployment sites in the study. This all suggests that C. comosa was well adapted to the conditions in the study area and is a more suitable candidate for phytoremediation in wetland areas.
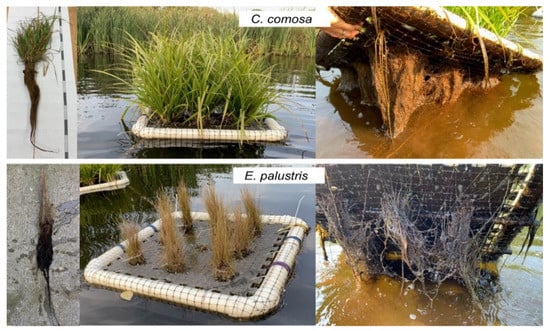
Figure 3.
Growth conditions of shoots and roots of C. comosa and E. palustris at the end of the study (6 October 2020).
3.2. Biomass Accumulation in Field Experiments
In the second pond, both species had a 100% survival rate at the end of the study (6 October), but C. comosa remained healthy despite some withered leaf tips, while E. palustris showed significant decay with completely withered shoots (Figure 3). Both species showed extensive root growth, but the roots of C. comosa were denser and thicker compared to the sparser and thinner roots of E. palustris (Figure 3).
As previously noted, nutrient concentrations in the wetland were low during the study period (NH4+: 55.15 ± 17.00 μg/L; NO2− + NO3−: 81.32 ± 55.03 μg/L; PO43−: 10.38 ± 4.98 μg/L—the minimum detection limits (MDL) for the evaluated parameters are as follows: NH4+: 0.009 µg/L; NO2− + NO3−: 0.005 µg/L; PO43−: 0.003 µg/L), in contrast with historical monitoring data for the wetland five years after construction (NH4+: 634.4 ± 272.8 μg/L; NO2− + NO3−: 731.1 ± 389.5 μg/L; PO43−: 155.6 ± 69.7 μg/L) [33]. This suggests that the wetland has matured since its construction in 2005 and now has a high self-regulating capacity, likely stemming from a well-developed wetland vegetation and soil microbial community [34,35]. Thus, for this particular experiment, the difference in biomass accumulation and nutrient storage in plant tissues, rather than the absolute nutrient changes in the water body, may better demonstrate the nutrient removal capacity of AFIs [36].
During the study, AFIs containing C. comosa accumulated significantly greater dry biomass (p < 0.05) in both above- (33.2 ± 18.8 g/plug) and below-water (25.3 ± 11.9 g/plug) tissues than E. palustris (shoots: 2.0 ± 1.8 g/plug; roots: 4.1 ± 2.6 g/plug). Variations were observed among AFI units with the same plant species at different locations in the field experiment (Figure 4A,C). The dry biomass in shoots of C. comosa (33.2 ± 18.8 g/plug) was similar to the value (35.6 ± 12.8 g/plug) reported in a different study using AFIs with the same species to treat a stormwater retention pond in Vermont, USA [28]. In contrast, E. palustris generated much less dry biomass in both shoots (2.0 ± 1.8 g/plug) and roots (4.1 ± 2.6 g/plug), with 67% of the total plant biomass being stored in root tissues.
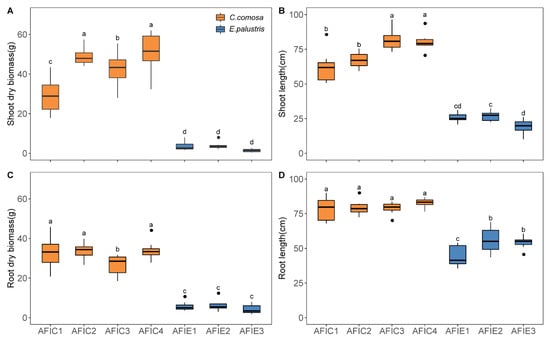
Figure 4.
Growth conditions of C. comosa and E. palustris throughout the study period: (A) shoot dry biomass accumulation, (B) shoot length elongation, (C) root dry biomass accumulation, and (D) root length elongation. Means denoted by different letters above the box plots (a–d) indicate significant difference between treatments (p < 0.05) (Fisher’s least significant difference). AFICs indicate AFI units containing C. comosa at different locations in the second pond; AFIEs indicate AFI units containing E. palustris at different locations in the second pond.
Under natural conditions (second pond), C. comosa developed significantly longer shoots (73.6 ± 12.6 cm) than E. palustris (24.0 ± 5.2 cm) (Figure 4B) by the end of the study. However, unlike observations in the general growth trends in the first pond, C. comosa also developed significantly longer roots (79.9 ± 5.8 cm) than E. palustris (51.5 ± 8.6 cm) (Figure 4D). This phenotypic plasticity suggests that C. comosa was also suffering from nutrient deficiency, thereby allocating more resources towards root growth. This growth pattern was also observed in a study treating urban effluents in a retention pond, where excessive nutrients were expected [28]. In that study, C. comosa developed much shorter roots (32.6 ± 15.8 cm) but produced shoot biomass similar to the present study.
Biomass accumulation was heavily influenced by seasonal variations, particularly in C. comosa. In T1 of the study (24 June–29 July), C. comosa gained a considerable amount of biomass in both above- and below-water tissues, significantly greater than E. palustris (p < 0.05)—Figure 5A. However, during T2, total biomass production by C. comosa was 85.8% lower than that in T1 (from 21.8 ± 2.6 g/plug in T1 to 3.1 ± 1.2 g/plug in T2), showing no difference (p > 0.05) with E. palustris during that period (Figure 5A). A similar pattern was observed in shoot elongation (Figure 5B). During T1, the shoot length of C. comosa was significantly higher than E. palustris. During T2, however, both plants had similar shoot elongation which, for C. comosa, represented a reduction of 65% from T1 (Figure 5B). The decline in C. comosa’s shoot elongation was likely a result of its poor root development during the latter part of summer (T2). Despite initial rapid root elongation in early summer—which was comparable to that of E. palustris—root growth in T2 slowed significantly after July (Figure 5D). Root elongation of C. comosa in T2 was 46.5% lower than in T1 (from 55.5 ± 4.4 cm to 29.7 ± 8.7 cm in T2). These results aligned with other studies. Wang et al. found that species Pontederia cordata and Schoenoplectus tabernaemontani also ceased root elongation after mid-summer [37]. Similarly, Ge et al. reported that the biomass of C. indica, L. salicaria, and T. dealbata increased rapidly in early summer to mid-summer and then started to decline in fall, which they attributed to a decrease in water temperature [38]. In our study, water temperature dropped from a 25.3 °C average in T1 to 20.2 °C in T2. Additionally, seasonal variation, particularly temperature change, has been shown to have a significant impact on the growth and metabolism of microorganisms in attached biofilms [39]. This was supported by the findings by Stewart et al. (2008) that microbial activities in attached biofilm have been identified as significant drivers of the removal of nitrate, ammonium, and phosphate from floating wetlands [40]. Therefore, to achieve optimal overall performance of AFIs, it is advised that C. comosa seedlings be planted into AFIs in mid-to-late spring. This will allow the plants to generate a larger amount of biomass during their most vigorous growing season and establish a robust root–biofilm system more rapidly. This will support both the biological and physical processes responsible for nutrient removal.
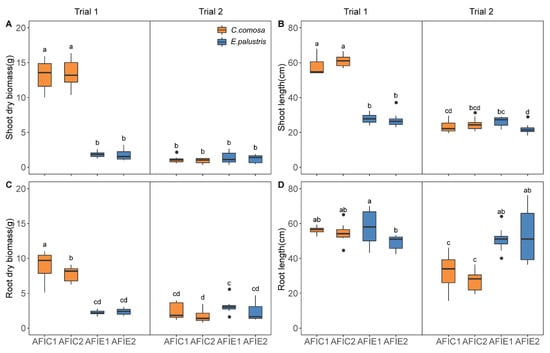
Figure 5.
Growth conditions of C. comosa and E. palustris during the two trials (time periods) in the field experiments: (A) shoot dry biomass accumulation, (B) shoot length elongation, (C) root dry biomass accumulation, and (D) root length elongation. Means denoted by different letters above the box plots (a–d) indicate significant difference between treatments (p < 0.05) (Fisher’s least significant difference). AFICs represent AFIs containing C. comosa at different locations in the second pond; AFIEs represent AFIs containing E. palustris at different locations in the second pond.
3.3. Nutrient Storage in Field Experiments
In this study, direct measurements of nutrient concentrations in plant tissues were not conducted due to limitations in time and budget. However, an estimation of nutrient storage in plant tissues was attempted based on correlations identified in previous AFI studies [36,41]. There is a strong positive correlation between nutrient storage and net dry biomass in free-floating aquatic plants [42]. This correlation has also been reported to hold for aquatic plants in AFI systems, where a linear relationship (R2 > 0.92) between nutrient storage in plant tissues and dry biomass accumulation has been established [30,41]. In addition, the distribution of nutrients between shoots and roots due to the translocation process by plants is affected by various factors such as seasonal dynamics [43] and water’s nutrient composition [44]. However, McAndrew et al. [45] found no difference in nutrient redistribution between shoot and root tissues in their study of five aquatic species in AFI systems. These results may not apply to other plant species, but the difference in nutrient concentrations is minor compared to the substantial variation in dry biomass accumulation between the two species tested [46]. Therefore, the direct uptake of nutrients by plants in our study was estimated from the linear relationships between nutrient storage in plant tissues and dry biomass accumulation established by Zhu et al. [41] and Chen et al. [36], using seven and five aquatic species in their AFI systems, respectively. The estimated mean N storage in our field experiments ranged from 12.84 g/m2 to 20.24 g/m2 for C. comosa and from 1.29 g/m2 to 2.31 g/m2 for E. palustris. The estimated mean P storage ranged from 0.77 g/m2 to 1.33 g/m2 for C. comosa and from 0.09 g/m2 to 0.16 g/m2 for E. palustris. These estimated values can serve as a rough guide in future applications where AFIs are used for nutrient sequestration in similar field scenarios.
The significance of direct uptake by plants in the nutrient removal performance of AFI systems is widely recognized [1,13], but the extent of its relative contribution to total nutrient removal by AFI is still a topic of debate [47]. In a mesocosm study using AFIs to treat synthetic effluents, plant uptake accounted for 49% of total TN removal and 74% of total TP removal in AFIs [46]. Wang et al. [47] constructed a nitrogen dynamic model for AFIs to explore the removal pathways of nutrients and reported that plant uptake contributed 58.5% to nitrogen removal at a hydraulic retention time of 11.2 days. These findings suggest that AFIs containing C. comosa not only have higher direct uptake but also achieve higher overall nutrient removal efficiency compared to AFIs with E. palustris. In addition to storing more nutrients in the plant tissues, AFIs containing C. comosa likely exceeded the performance of AFIs containing E. palustris in the other two major nutrient-removal pathways: (1) sedimentation and entrapment by root systems and (2) microbial assimilation or conversion by biofilms associated with the roots [1]. Our field observations revealed that C. comosa developed denser and thicker roots than E. palustris (Figure 3), as confirmed by the ratio of root dry biomass to root length (0.36 g/cm for C. comosa and 0.09 g/cm for E. palustris). The extensive root systems of C. comosa provided a larger surface area and greater opportunity for biofilm attachment, as well as enhancing physical processes such as filtering and entrapment [38,48,49].
3.4. Biomass Accumulation in Mesocosm Experiments
The temporal variations observed in the mesocosm experiments revealed that C. comosa’s biomass accumulation and elongation on both shoots and roots increased significantly in Tm1 but decreased considerably in Tm2 and Tm3 (Figure 6). These findings aligned in both the first and second ponds, emphasizing that C. comosa should be installed in AFIs early on to maximize root elongation before its peak growing period. In addition, in Tm2 and Tm3, C. comosa had mean shoot biomass accumulation around zero or slightly above zero (Figure 6A), meaning that it barely increased its biomass and had little nutrient uptake during these periods. Furthermore, the low or negative biomass accumulation in roots in Tm2 and Tm3 indicated that the plant may even have experienced root tissue loss, possibly due to a failure of root establishment (Figure 6C). The steady decrease in both shoot and root length in Tm2 and Tm3 further supported the early installation recommendations (Figure 6B,D).
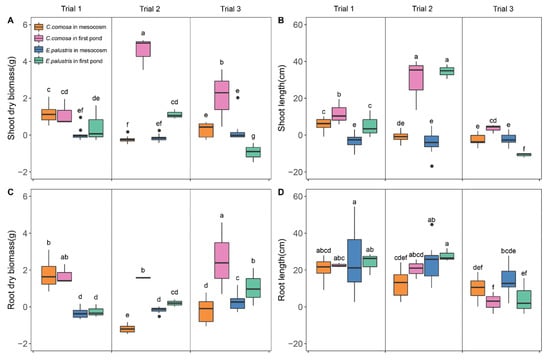
Figure 6.
Growth conditions of C. comosa and E. palustris during the three trials (time periods) in the mesocosm and the first pond. (A) Shoot dry biomass accumulation, (B) shoot length elongation, (C) root dry biomass accumulation, and (D) root length elongation. Means denoted by different letters above the box plots (a–f) indicate significant difference between treatments (p < 0.05) (Fisher’s least significant difference).
C. comosa showed limited growth on both shoots and roots in the mesocosm experiments (tanks) compared to its growth in the first pond of the wetland, with less biomass accumulation and elongation (p < 0.05) during Tm2 and Tm3 (Figure 6). Even in Tm1, when C. comosa was actively growing in the field experiments, it still showed significantly less shoot elongation (p < 0.05) in tanks compared to its growth in the first pond (Figure 6B). Although a direct comparison of the biomass from the second pond and the mesocosms was not possible, as plants from the two settings were harvested on different days, a visual difference in growth conditions was evident (Figure A3). This discrepancy is likely due to the absence of an external nutrient source during the two-week hydraulic retention time in the mesocosm experiments, while the wetland had a continuous low flow of bio-available nutrients to support plant growth. According to Jarvie et al. [50], the abundance of organic matter available for remineralization in wetlands is a crucial factor in supplying nutrients for plant growth.
E. palustris also showed different growth patterns between the mesocosm experiments and the field experiments. In the tanks, E. palustris had little change in biomass (shoot: 0.0 ± 0.3 g/plug; root: −0.3 ± 2.5 g/plug), even during Tm1 (Figure 6A,C), whereas in the field experiment, it generated biomass comparable to C. comosa during T1. However, E. palustris had a significant increase in root length in the tanks during Tm1 (24.7 ± 15.4 cm), indicating that it was allocating more resources to root growth rather than shoot growth to cope with the nutrient-deficient environment. This pattern was similar to what Hill et al. [29] observed. Later, possibly due to the limited growth period of E. palustris [31], its root elongation slowed down and its biomass barely increased in Tm2 and Tm3, which was consistent with observations from the field experiments (Figure 6C,D).
4. Conclusions
C. comosa in the field experiments showed strong adaptation to the permanently flooded growing conditions, resulting in biomass accumulation comparable to previous studies using the same species. It was observed that C. comosa outperformed E. palustris in biomass accumulation throughout the entire study period, demonstrating its greater sequestration capacity of nutrients through direct uptake by plants. In the field experiments, C. comosa had a total dry biomass accumulation of 58.5 ± 22.2 g/plug during the study, while E. palustris had significantly less, only reaching 6.1 ± 3.2 g/plug. C. comosa had a higher estimated mean nitrogen storage at 20.24 g/m2, compared to E. palustris at 2.31 g/m2. The maximum estimated mean phosphorus storage was also higher for C. comosa at 1.33 g/m2, compared to E. palustris at 0.16 g/m2. C. comosa showed balanced growth between above- and below-water plant tissues, with a ratio of 1.12 for shoots-to-roots dry biomass accumulation, while E. palustris allocated significantly more biomass to the roots, with a ratio of 0.02 for shoots-to-roots dry biomass accumulation. C. comosa developed thicker, larger, and stronger root systems compared to E. palustris, suggesting that AFIs containing C. comosa also exceed the performance of AFIs containing E. palustris in the other two major pathways of nutrient removal: (1) sedimentation and entrapment by root systems and (2) microbial assimilation or conversion by biofilms associated with the roots, resulting in a greater total nutrient removal capacity. The growth of both species, particularly for C. comosa, was strongly affected by the seasonal dynamics, in that they both largely reduced their biomass accumulation and plant elongation in late summer. For optimal nutrient removal performance of C. comosa, it is recommended that the plants be planted into the AFIs in mid-to-late spring. The overall impressive performance of C. comosa makes it a promising candidate for AFI applications aimed at nutrient remediation. Nevertheless, this study investigated only two species which are native to Ohio. As such, their applicability to other regions may be limited. Moreover, this particular study did not directly measure the nutrient concentrations in plant tissues, relying instead on estimates of nutrient storage derived from earlier studies. Future studies should focus on investigating AFIs in field experiments to better understand their performance under dynamic conditions. Additionally, conducting biomass nutrient analysis for large-scale AFIs will help gain a deeper understanding for optimizing the performance of AFIs.
Author Contributions
Conceptualization, Z.C. and O.S.C.J.; methodology, Z.C. and O.S.C.J.; software, Z.C.; formal analysis, Z.C.; investigation, Z.C. and O.S.C.J.; resources, Z.C. and O.S.C.J.; writing—original draft preparation, Z.C.; writing—review and editing, O.S.C.J.; visualization, Z.C.; supervision, O.S.C.J.; project administration, O.S.C.J.; funding acquisition, Z.C. and O.S.C.J. All authors have read and agreed to the published version of the manuscript.
Funding
This research was funded by the Ohio State Friends of Orton Hall Fund (awarded 2/18/2020), the Ohio State Sustainability Institute Student Grant (awarded 4/1/2020), and the Geological Society of America Student Research Grant (grant number 13133-21).
Institutional Review Board Statement
Not applicable.
Informed Consent Statement
Not applicable.
Data Availability Statement
Data are available in a publicly accessible repository that does not issue DOIs. These data can be found here: https://github.com/FrankCZZ/Artificial-Floating-Islands.git (accessed on 4 February 2023).
Acknowledgments
The authors thank J. Lee, A. Sawyer, and J. Bauer for their constructive comments on this work.
Conflicts of Interest
The authors declare no conflict of interest.
Appendix A
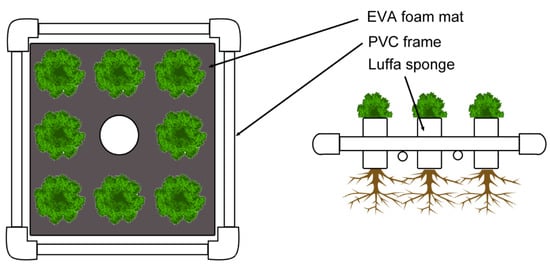
Figure A1.
AFI unit constructed with outer PVC frame (5 cm PVC pipes and elbows), EVA foam mat, and luffa sponges. Each AFI unit in the field experiment has eight plant plugs installed.
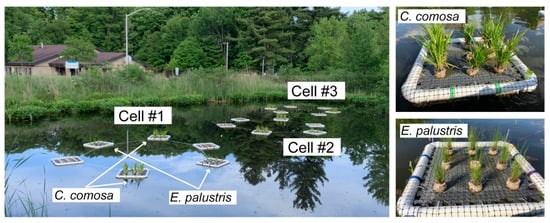
Figure A2.
AFIs were deployed in three hexagonal cells, each containing six AFI units: 2 units with Carex comosa plugs, 2 units with Eleocharis palustris plugs, and 2 with no plants (control).
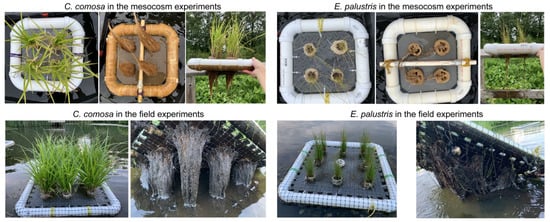
Figure A3.
Plant growth conditions in the field and mesocosm experiments on 22 July.
References
- Wang, H.; Bouwman, A.F.; Van Gils, J.; Vilmin, L.; Beusen, A.H.W.; Wang, J.; Liu, X.; Yu, Z.; Ran, X. Hindcasting Harmful Algal Bloom Risk Due to Land-Based Nutrient Pollution in the Eastern Chinese Coastal Seas. Water Res. 2023, 231, 119669. [Google Scholar] [CrossRef] [PubMed]
- Glibert, P.M.; Beusen, A.H.W.; Harrison, J.A.; Dürr, H.H.; Bouwman, A.F.; Laruelle, G.G. Changing Land-, Sea-, and Airscapes: Sources of Nutrient Pollution Affecting Habitat Suitability for Harmful Algae. In Global Ecology and Oceanography of Harmful Algal Blooms; Glibert, P.M., Berdalet, E., Burford, M.A., Pitcher, G.C., Zhou, M., Eds.; Ecological Studies; Springer International Publishing: Cha, Switzerland, 2018; pp. 53–76. [Google Scholar]
- Hautier, Y.; Seabloom, E.W.; Borer, E.T.; Adler, P.B.; Harpole, W.S.; Hillebrand, H.; Lind, E.M.; MacDougall, A.S.; Stevens, C.J.; Bakker, J.D.; et al. Eutrophication weakens stabilizing effects of diversity in natural grasslands. Nature 2014, 508, 7497. [Google Scholar] [CrossRef] [PubMed]
- Ansari, A.A.; Singh Gill, S.; Lanza, G.R.; Rast, W. (Eds.) Eutrophication: Causes, Consequences and Control; Springer: Berlin/Heidelberg, Germany, 2011. [Google Scholar] [CrossRef]
- de Jonge, V.N.; Elliott, M.; Orive, E. Causes, historical development, effects and future challenges of a common environmental problem: Eutrophication. In Nutrients and Eutrophication in Estuaries and Coastal Waters: Proceedings of the 31st Symposium of the Estuarine and Coastal Sciences Association (ECSA), held in Bilbao, Spain, 3–7 July 2000; Orive, E., Elliott, M., de Jonge, V.N., Eds.; Springer: Berlin/Heidelberg, Germany, 2002; pp. 1–19. [Google Scholar] [CrossRef]
- USEPA. National Nutrient Strategy. Available online: https://www.epa.gov/nutrient-policy-data/national-nutrient-strategy (accessed on 4 February 2023).
- USEPA. Algal Toxin Risk Assessment and Management Strategic Plan for Drinking Water. Available online: https://www.epa.gov/ground-water-and-drinking-water/algal-toxin-risk-assessment-and-management-strategic-plan-drinking (accessed on 4 February 2023).
- USEPA. The Harmful Algal Bloom and Hypoxia Research and Control Amendments Act (HABHRCA). Available online: https://www.epa.gov/cyanohabs/harmful-algal-bloom-and-hypoxia-research-and-control-amendments-act-habhrca (accessed on 4 February 2023).
- Yu, S.; Miao, C.; Song, H.; Huang, Y.; Chen, W.; He, X. Efficiency of Nitrogen and Phosphorus Removal by Six Macrophytes from Eutrophic Water. Int. J. Phytoremediation 2019, 21, 643–651. [Google Scholar] [CrossRef] [PubMed]
- Rezania, S.; Park, J.; Rupani, P.F.; Darajeh, N.; Xu, X.; Shahrokhishahraki, R. Phytoremediation potential and control of Phragmites australis as a green phytomass: An overview. Environ. Sci. Pollut. Res. 2019, 26, 7428–7441. [Google Scholar] [CrossRef]
- Rezania, S.; Ponraj, M.; Talaiekhozani, A.; Mohamad, S.E.; Din, M.F.M.; Taib, S.M.; Sabbagh, F.; Sairan, F.M. Perspectives of phytoremediation using water hyacinth for removal of heavy metals, organic and inorganic pollutants in wastewater. J. Environ. Manag. 2015, 163, 125–133. [Google Scholar] [CrossRef]
- Lu, Q.; He, Z.L.; Graetz, D.A.; Stoffella, P.J.; Yang, X. Phytoremediation to remove nutrients and improve eutrophic stormwaters using water lettuce (Pistia stratiotes L.). Environ. Sci. Pollut. Res. 2008, 17, 84–96. [Google Scholar] [CrossRef]
- Chang, Y.; Cui, H.; Huang, M.; He, Y. Artificial Floating Islands for Water Quality Improvement. Environ. Rev. 2017, 25, 350–357. [Google Scholar] [CrossRef]
- Samal, K.; Kar, S.; Trivedi, S. Ecological Floating Bed (EFB) for Decontamination of Polluted Water Bodies: Design, Mechanism and Performance. J. Environ. Manag. 2019, 251, 109550. [Google Scholar] [CrossRef]
- Pavlineri, N.; Skoulikidis, N.T.; Tsihrintzis, V.A. Constructed Floating Wetlands: A review of research, design, operation and management aspects, and data meta-analysis. Chem. Eng. J. 2017, 308, 1120–1132. [Google Scholar] [CrossRef]
- Afzal, M.; Arslan, M.; Müller, J.A.; Shabir, G.; Islam, E.; Tahseen, R.; Anwar-ul-Haq, M.; Hashmat, A.J.; Iqbal, S.; Khan, Q.M. Floating Treatment Wetlands as a Suitable Option for Large-Scale Wastewater Treatment. Nat. Sustain. 2019, 2, 863–871. [Google Scholar] [CrossRef]
- Wang, X.; Luo, B.; Wang, L.; Zhao, Y.; Wang, Q.; Li, D.; Gu, B.; Min, Y.; Chang, S.X.; Ge, Y.; et al. Plant Diversity Improves the Effluent Quality and Stability of Floating Constructed Wetlands under Increased Ammonium/Nitrate Ratio in Influent. J. Environ. Manag. 2020, 266, 110607. [Google Scholar] [CrossRef]
- Walker, C.; Tondera, K.; Lucke, T. Stormwater Treatment Evaluation of a Constructed Floating Wetland after Two Years Operation in an Urban Catchment. Sustainability 2017, 9, 1687. [Google Scholar] [CrossRef]
- Yeh, N.; Yeh, P.; Chang, Y.-H. Artificial floating islands for environmental improvement. Renew. Sustain. Energy Rev. 2015, 47, 616–622. [Google Scholar] [CrossRef]
- Olguín, E.J.; Sánchez-Galván, G.; Melo, F.J.; Hernández, V.J.; González-Portela, R.E. Long-term assessment at field scale of Floating Treatment Wetlands for improvement of water quality and provision of ecosystem services in a eutrophic urban pond. Sci. Total. Environ. 2017, 584–585, 561–571. [Google Scholar] [CrossRef] [PubMed]
- Mack, J.J. Characteristic Ohio Plant Species for Wetland Restoration Projects v. 1.0. Ohio EPA Technical Report WET/2007-1; Ohio Environmental Protection Agency, Wetland Ecology Group, Division of Surface Water: Columbus, Ohio, 2007.
- Hausman, C.E.; Eysenbach, S.R.; Reinier, J.E.; Breth, M.F. Landscaping for Biodiversity with Ohio Native Plants: A Species Guide for Plantings; Cleveland Metroparks Technical Report 2017/NR-02; Division of Natural Resources, Cleveland Metroparks: Parma, Ohio, 2017. [Google Scholar]
- DeBusk, T.A.; Peterson, J.E.; Ramesh Reddy, K. Use of Aquatic and Terrestrial Plants for Removing Phosphorus from Dairy Wastewaters. Ecol. Eng. 1995, 5, 371–390. [Google Scholar] [CrossRef]
- Fraser, L.H.; Carty, S.M.; Steer, D. A Test of Four Plant Species to Reduce Total Nitrogen and Total Phosphorus from Soil Leachate in Subsurface Wetland Microcosms. Bioresour. Technol. 2004, 94, 185–192. [Google Scholar] [CrossRef]
- Picard, C.R.; Fraser, L.H.; Steer, D. The Interacting Effects of Temperature and Plant Community Type on Nutrient Removal in Wetland Microcosms. Bioresour. Technol. 2005, 96, 1039–1047. [Google Scholar] [CrossRef]
- Kearney, M.A.; Zhu, W. Growth of Three Wetland Plant Species under Single and Multi-Pollutant Wastewater Conditions. Ecol. Eng. 2012, 47, 214–220. [Google Scholar] [CrossRef]
- SOP #1502; Standard Operating Procedures for Handling Potentially High Hazard Environmental Samples. U.S. EPA Contract EP-W-09-031. SERAS—Scientific Engineering Response and Analytical Services: Edison, NJ, USA, 1994.
- Tharp, R.; Westhelle, K.; Hurley, S. Macrophyte Performance in Floating Treatment Wetlands on a Suburban Stormwater Pond: Implications for Cold Climate Conditions. Ecol. Eng. 2019, 136, 152–159. [Google Scholar] [CrossRef]
- Hill, J.O.; Simpson, R.J.; Moore, A.D.; Chapman, D.F. Morphology and Response of Roots of Pasture Species to Phosphorus and Nitrogen Nutrition. Plant Soil 2006, 286, 7. [Google Scholar] [CrossRef]
- Ryser, P. The Mysterious Root Length. Plant Soil 2006, 286, 1–6. [Google Scholar] [CrossRef]
- Plants Profile for Eleocharis palustris (Common spikerush). Available online: https://plants.usda.gov/home/plantProfile?symbol=ELPA3 (accessed on 4 February 2023).
- Plants Profile for Carex comosa (Longhair sedge). Available online: https://plants.usda.gov/home/plantProfile?symbol=CACO8 (accessed on 4 February 2023).
- Boerner, G.; Costa, O.S., Jr. Environmental controls on the geochemistry of a constructed wetland. In Proceedings of the Joint Meeting of the Northeastern/North-Central Sections of the Geological Society of America, Pittsburgh, PA, USA, 20–22 March 2011. [Google Scholar]
- Vymazal, J. Removal of Nutrients in Various Types of Constructed Wetlands. Sci. Total Environ. 2007, 380, 48–65. [Google Scholar] [CrossRef] [PubMed]
- Sim, C.H.; Yusoff, M.K.; Shutes, B.; Ho, S.C.; Mansor, M. Nutrient Removal in a Pilot and Full Scale Constructed Wetland, Putrajaya City, Malaysia. J. Environ. Manag. 2008, 88, 307–317. [Google Scholar] [CrossRef] [PubMed]
- Chen, C.; Wang, F.; Hong, Y.; Liu, R.; Luo, L. The Biomass Accumulation and Nutrient Storage of Five Plant Species in an In-Situ Phytoremediation Experiment in the Ningxia Irrigation Area. Sci. Rep. 2019, 9, 11365. [Google Scholar] [CrossRef]
- Wang, C.-Y.; Sample, D.J.; Day, S.D.; Grizzard, T.J. Floating Treatment Wetland Nutrient Removal through Vegetation Harvest and Observations from a Field Study. Ecol. Eng. 2015, 78, 15–26. [Google Scholar] [CrossRef]
- Ge, Z.; Feng, C.; Wang, X.; Zhang, J. Seasonal Applicability of Three Vegetation Constructed Floating Treatment Wetlands for Nutrient Removal and Harvesting Strategy in Urban Stormwater Retention Ponds. Int. Biodeterior. Biodegrad. 2016, 112, 80–87. [Google Scholar] [CrossRef]
- Zhou, H.; Li, X.; Xu, G.; Yu, H. Overview of Strategies for Enhanced Treatment of Municipal/Domestic Wastewater at Low Temperature. Sci. Total Environ. 2018, 643, 225–237. [Google Scholar] [CrossRef] [PubMed]
- Stewart, F.M.; Mulholland, T.; Cunningham, A.B.; Kania, B.G.; Osterlund, M.T. Floating islands as an alternative to constructed wetlands for treatment of excess nutrients from agricultural and municipal wastes—Results of laboratory-scale tests. L. Contam. Reclam. 2008, 16, 25–33. [Google Scholar] [CrossRef]
- Zhu, L.; Li, Z.; Ketola, T. Biomass Accumulations and Nutrient Uptake of Plants Cultivated on Artificial Floating Beds in China’s Rural Area. Ecol. Eng. 2011, 37, 1460–1466. [Google Scholar] [CrossRef]
- Fox, L.J.; Struik, P.C.; Appleton, B.L.; Rule, J.H. Nitrogen Phytoremediation by Water Hyacinth (Eichhornia Crassipes (Mart.) Solms). Water Air Soil Pollut. 2008, 194, 199–207. [Google Scholar] [CrossRef]
- Wang, C.-Y.; Sample, D.J.; Bell, C. Vegetation effects on floating treatment wetland nutrient removal and harvesting strategies in urban stormwater ponds. Sci. Total. Environ. 2014, 499, 384–393. [Google Scholar] [CrossRef]
- Ruiz, M.; Velasco, J. Nutrient Bioaccumulation in Phragmites Australis: Management Tool for Reduction of Pollution in the Mar Menor. Water Air Soil Pollut. 2009, 205, 173. [Google Scholar] [CrossRef]
- McAndrew, B.; Ahn, C.; Spooner, J. Nitrogen and Sediment Capture of a Floating Treatment Wetland on an Urban Stormwater Retention Pond—The Case of the Rain Project. Sustainability 2016, 8, 972. [Google Scholar] [CrossRef]
- Keizer-Vlek, H.E.; Verdonschot, P.F.M.; Verdonschot, R.C.M.; Dekkers, D. The Contribution of Plant Uptake to Nutrient Removal by Floating Treatment Wetlands. Ecol. Eng. 2014, 73, 684–690. [Google Scholar] [CrossRef]
- Wang, Y.; Sun, B.; Gao, X.; Li, N. Development and Evaluation of a Process-Based Model to Assess Nutrient Removal in Floating Treatment Wetlands. Sci. Total Environ. 2019, 694, 133633. [Google Scholar] [CrossRef]
- Headley, T.R.; Tanner, C.C. Floating Treatment Wetlands: An Innovative Option for Stormwater Quality Applications. In Proceedings of the 11th International Conference on Wetland Systems for Water Pollution Control, Indore, India, 1–7 November 2008. [Google Scholar]
- Wang, C.-Y.; Sample, D.J. Assessment of the Nutrient Removal Effectiveness of Floating Treatment Wetlands Applied to Urban Retention Ponds. J. Environ. Manag. 2014, 137, 23–35. [Google Scholar] [CrossRef] [PubMed]
- Jarvie, H.P.; Pallett, D.W.; Schäfer, S.M.; Macrae, M.L.; Bowes, M.J.; Farrand, P.; Warwick, A.C.; King, S.M.; Williams, R.J.; Armstrong, L.; et al. Biogeochemical and Climate Drivers of Wetland Phosphorus and Nitrogen Release: Implications for Nutrient Legacies and Eutrophication Risk. J. Environ. Qual. 2020, 49, 1703–1716. [Google Scholar] [CrossRef] [PubMed]
Disclaimer/Publisher’s Note: The statements, opinions and data contained in all publications are solely those of the individual author(s) and contributor(s) and not of MDPI and/or the editor(s). MDPI and/or the editor(s) disclaim responsibility for any injury to people or property resulting from any ideas, methods, instructions or products referred to in the content. |
© 2023 by the authors. Licensee MDPI, Basel, Switzerland. This article is an open access article distributed under the terms and conditions of the Creative Commons Attribution (CC BY) license (https://creativecommons.org/licenses/by/4.0/).