Article

Status of Lighting Technology Application in Indonesia

1
School of Electrical Engineering and Informatics, Institut Teknologi Bandung, Kota Bandung 40132, Jawa Barat, Indonesia
2
LAPLACE UMR 5213, Université Toulouse III—Paul Sabatier, 31062 Toulouse, France
3
LAPLACE UMR 5213, CNRS, 31062 Toulouse, France
*
Authors to whom correspondence should be addressed.
Sustainability 2023, 15(7), 6283; https://doi.org/10.3390/su15076283
Submission received: 1 March 2023 / Revised: 23 March 2023 / Accepted: 30 March 2023 / Published: 6 April 2023
(This article belongs to the Special Issue Sustainable Outdoor Lighting)

Abstract

:
In 2019, Indonesia’s electricity consumption exceeded 278 TWH, or about 1.08 MWh/capita. This value shows a considerable increase in electricity consumption which has doubled in just a decade. Previous studies have shown that the proportion of electricity consumption used for lighting needs is correlated to the country’s GDP. This is generally around 20 to 50% of electricity production but can go up to 86% in the case of Tanzania. Indonesia is the 4th country in the world in terms of population and its lighting market as well as its lighting-related energy consumption has a strong impact on several levels: societal, environmental but also economic and energy. Having a knowledge of the lamps used by the Indonesian people is therefore particularly interesting and important, in particular in the context which presents a great societal diversity but also in a context of energy saving. Indonesia is an archipelagic country made up of 5 large islands and over 17,000 small islands with widely varying levels of population density. This island geography leads Indonesia to face challenges in the distribution and production of electrical energy, which affects the use of lamps in various types of regions. The overview of this study was done by collecting data from various sources, especially BPS (Biro Pusat Statistik/Statistic Center Bureau of Indonesia), CLASP (an NGO for clean energy), the Ministry of Energy and Mineral Resources of Indonesia (ESDM), PLN (Indonesian Electrical Company), etc. The data obtained from these sources provides several descriptions of general lighting conditions in Indonesia viewed from several angles, such as growth of lamp market, use of lamp types, percentage of use of lamps with energy saving (ESL), etc. Considering that Indonesia has various regional characteristics, in this study, the survey of a total of 394 respondents was conducted on the use of lamps by creating regional categories based on electrical conditions, power consumption, and electricity per capita, among others. The categories of areas observed fall into 5 types based on their population and geography: large cities, small towns, rural/village areas, islands and remote areas. The results of compiling data from these various sources show that the types of lamps used by Indonesians follow the lighting trend in the world. The use of LED lamps has a utilization percentage of around 52%, much higher than other types of lamps such as CFL, fluorescent or incandescent. Based on the survey conducted, it is known that the widely used LED power is between 1 and 10 watts with a usage time of 8 to 12 h per day. In the next few years, it is estimated that the use of LEDs in Indonesia will increase as the government has prepared various regulations and policies related to energy saving, one of which relates to lighting.

1. Introduction

The invention of artificial lighting allowed humanity to free itself from the solar cycle and the length of the day. After the mastery of fire, the invention of the torch, the oil lamp, discharge lamps, and gas or incandescent lamps in particular, the latest revolution in the world of lighting obviously concerns the LED lamp, which continues to steadily increase its energy efficiency to reach today around 160 lm/W with lifespans of over 50,000 h (as a reminder: the incandescent lamp, 14 lm/W and 1500 h) [1,2,3,4].
This makes the LED superior from every point of view: in terms of energy saving and lifespan but also in terms of the carbon impact since it is very low [5].
The source of artificial light is always the “domestic appliance” which is installed first in a dwelling. There is thus a very strong correlation between the percentage of energy consumed for lighting and the GDP of a country: the more economically rich a country is, the lower this share of lighting is in its consumption (from 9 to 12 % on average in Europe), and the more the country is economically poor, the greater this share of lighting (34% in Tunisia, 86% in Tanzania, etc.) [6].
This paper deals with the application of artificial lighting technology in Indonesia. Indonesia consists of 38 provinces with the population spread over 6000 islands and the level of population density in each province is very diverse. For example, DKI Jakarta province has a population density of more than 15,000 people/km2 while Papua province only has 13 people/km2 [6]. This condition causes Indonesia to deal with challenges in the distribution of electrical energy so that the electrification ratio in various province in Indonesia is very diverse. Electricity statistics of Indonesia for 2022 (Figure 1) show that some provinces still have a fairly low electrification ratio, including, for example NTT at 92.5%, Maluku at 93.00%, Southeast Sulawesi at 98.66%, and Papua at 96.01% [7,8].
Indonesia is the 4th largest population in the world with 276.4 million people. This huge number of people also makes the need for artificial lighting huge. To meet the need for lamps, Indonesia not only produces the lamp but also imports the lamps from other countries. In 2019, the total number of imported lamps is almost 120 million units while the total consumption is 160 million. So, around 75% of total consumption is fulfilled by importation.
This study will discuss the general description of the use of lamps in Indonesia. The discussion is made by first describing the condition of the lamp market, standards regarding lamps, and the condition of electrification in Indonesia. Furthermore, the analysis is carried out by categorizing the region on the basis of electricity consumption per capita and geographical conditions. Based on these factors, an overview is carried out on 5 regional categories including big electricity consumer cities, small electricity consumer cities, islands, villages, and remote areas.

2. Literature Review

Electric lamps consume almost 19% of the world’s electricity [2]. In 2020 the total electricity production in the world is 26.8 million GWh, so it can be estimated that the total electricity consumption for lighting need is around 5.09 million GWh. However, the electricity consumption percentage for lighting needs in each country is different, including, for example, in France at 12%, Germany at 9%, the United States at 21%, etc. [6]. In developing countries, the use of electricity for lighting needs is much greater such as in Tunisia at 34%, Tanzania at 86%, etc. The percentage of use of electrical energy for lighting needs in Indonesia is estimated to be in the range of 13–33% [9]. This value coincides with studies showing that in developing countries the electrical energy used for lighting needs is in the range of 20–50% [10].
The development and research on sources of artificial light have followed the evolution of humanity with the mastery of fire (the blowtorch, the oil lamp, the gas lamp, etc.), the development of discharge lamps in the 18th century by Sir Humphrey Davy until the application to public lighting with, for example, the invention of the incandescent lamp by Joseph Swann very often wrongly attributed to Thomas Edison, who had bought the patent and then developed and improved the principle before democratizing it [6]. The evolution of discharge lamps and incandescent lamps will last until the end of the 20th century, in particular with the development of electronic ballasts for fluorescent tubes. These types of discharge lamps, invented by Georges Claude at the beginning of the 20th century, reached the height of their development with the improvement of electrodes, electronics and integration with T5 tubes and fluorescent-compact lamps [11,12,13,14]. Thus, along with the development of power electronics and lighting technology, in the 80s HFFL lamps (high frequency fluorescent lamps) were developed [11,12,13,14].
The development of HFFL led to the existence of the lamp type CFL (compact fluorescent lamps). Meanwhile, LED (light emitting diode) lamps began to appear in the beginning of 2010s. Although the discovery of electroluminescence signed its birth certificate with an article by Joseph Round in 1907 [15], it is Oleg V. Losev who will produce the first prototypes and file patents until he predicts a future for LEDs towards optical telecommunications. The entry of LEDs as indicator lights on a commercial scale would come with the LED and Nick Holoniak’s patent in the early 60s. The last big step in LEDs (which will earn the 2014 Nobel Prize, awarded to Isamu Akasaki and Hiroshi Amano, and Shuji Nakamura, for the development of efficient blue light in the early 1990s) were the modern lighting we know today, which took off in the early 2010s [15].
The types of lamps used in Indonesia basically follow the development of lighting technology in the world. This can be seen from the existence of the first electricity network in Indonesia in early 1897 which in terms of time was quite close to the year of the development of the first electricity network by the company of Thomas Alva Edison.
With the development of information technology, currently technological advances in a country will be known and can be felt by other countries including electric lights. This causes the types of lamps used in Indonesia to be the same as those used by other countries in general. The types of lamps that are commonly used as light sources in houses or buildings in Indonesia include incandescent, fluorescent, CFL, and LED lamps. Actually, there are 3 qualitative parameters of lamps that are usually used as the basis for comparisons between lamps, including efficiency/efficacy, CRI (color rendering index), and lifetime [1]. Table 1 show a qualitative comparison of several types of lamps [1].

3. General Condition Related to Lamps in Indonesia

3.1. Market of Lamp in Indonesia

In Indonesia, there are many companies engaged in lighting, either as manufacturers or as importers. Each of these lighting companies is generally incorporated into one of the four light company associations. The four lighting company associations include [16]:
Association of Indonesia Lighting Company (Aperlindo: Asosiasi Perusahaan Perlampuan Indonesia), which has the largest membership base with 44 members and more than 90% of its members are importers of lighting products;
Association of Indonesia Lighting Manufacture (Gamatrindo: Gabungan Industri Manufaktur Lampu Terpadu Indonesia), which is a group of local lamp makers with eight active members;
Association of Indonesia Luminaire and Electricity Industry (AILKI: Asosiasi Industri Luminer dan Kelistrikan Indonesia) which is a smaller association of larger brands such as Panasonic, Osram, Philips, and GE;
Association of Luminaire of Indonesia (Alindo: Asosiasi Luminer Indonesia).
Indonesia has a relatively large lamp market where in 2019 the total lamp consumption is estimated to have reached 164 million units and the total number of lighting stock installed is around 691 million units. This number is relatively larger than the surrounding countries. One of the reasons for this large lamp market is that Indonesia is the country which has become one of the largest populations in the world. In addition, fairly stable economic growth has also contributed to the doubling of electricity consumption in 10 years, from 129 TWh in 2008 to 256 TWh in 2018 [16]. This is what causes the consumption of lamps in Indonesia to be large.
Basically, the types of lamps used by the Indonesian people for both the household, professional, and outdoor sectors are the same as those generally used in other countries in the world. These types of lamps include incandescent, fluorescent, CFL, LED, etc. The percentage of use for each type of lamp follows the development of lamp technology in general where the type of lamp with the latest technology (LED) has a fairly large increase in the number of consumptions. The following graph shows the total historical shipments of lamp based on technology in Indonesia [16].
Figure 2 shows total historical lamp shipments by technology in Indonesia during 2012–2019 [16]. It is known that until the end of 2019, the consumption of LED lamps in Indonesia increased, while other types of lamps such as CFLs and incandescent lamps decreased. By using extrapolation, the increasing/decreasing rate (million/year) of incandescent, CFL, HID, and LED are −2.24, −12.57, 0, and 5.73, respectively. Using those increasing/decreasing rates, it can be estimated that the actual shipment (in millions) for each type of lamps are 34, 23, 1, and 77, respectively.
Indonesia’s lighting stock data for 2019 shows the number of LED lamps installed is 343 million (50%), CFL and fluorescent at 273 million (40%), and other lamps at 69 million (10%). This data is in line with information from the Indonesian Ministry of Energy and Mineral Resources which state that the use of LED lamps is around 52%, and the remaining are CFL at 41% and incandescent lamps at 7% [16]. This relatively large percentage of LED lamp usage results in a decrease in annual lamp consumption because this type of LED lamp has a higher lifetime than CFL and incandescent lamps. However, in certain regions, especially in village areas, incandescent lamps are still the choice because of their cheaper price compared to other types of lamps.
Although the number of lighting industries in Indonesia is quite large, the percentage of consumption of locally made lamps is still much smaller than that of imports. Information from Aperlindo and Gamatrindo shows that in 2019 the number of lamp imports reached 128 million units (80% of the total market), and 96% of the total imported lamps originated from China [16]. This large number of imported lamps has made local lamp producers not able to compete in terms of production volume and low price, so local lamp producers can only focus on certain market segments. Basically, these imported lamps dominate from year to year. As an example, for LED lamps, which are the type of lamp with the highest market at this moment, up to June 2021 imports of this type of lamp have reached 70%. Figure 3 shows the number of lamp imports from 2012 until 2019 in Indonesia. The data is obtained from the Ministry of Trade of Indonesia which is collected and processed by CLASP.
In fact, several years ago, Indonesia did not only import, but could also export domestically made lamps. The export of these lamps is carried out mainly to Japan and Singapore. However, currently Indonesia’s lamp exports have decreased at a rate of 60% in the last 5 years. Figure 4 shows the downward trend in the number of lamp exports in Indonesia. The data is obtained from the Ministry of Trade of Indonesia which is collected and processed by CLASP. The decline in the number of lamp exports is due to the fact that Indonesia is not a manufacturing hub of LED lamps, so it is unable to compete with lamp production from other countries.
One of the things that can be made after interpreting historical data on lamp shipments is to estimate lamp shipments over the next few years. From Figure 3, it can be seen that since 2013 the shipments of CFL + Fluorescent had decreased while Incandescent + Halogen shows an unstable pattern but has a decreasing trend. From that trend, the estimation for lamp shipments in next few years can be made. Figure 5 shows total shipments forecast by technology estimated for 2019–2030. The estimation model was made by CLASP taking into account Indonesia’s population growth and GDP. From Figure 5, it can be known that for next few years LED will dominate the lamp shipments. The increasing of LED shipment will affect the increasing of LED lighting stock in Indonesia in next few years.

3.2. Standards Related to Lighting in Indonesia

Same as other equipment, there are standards relating to lights and lighting that apply in Indonesia. The standards made for the lamps not only relate to technical specifications but also to energy efficiency. Indeed, LED lamps are high-efficiency electronic equipment, and they are becoming more popular very quickly because they allow for significant energy savings and can have a significant impact on the country’s overall electricity consumption. The market for LED lamps, like that of all products concerning light sources in Indonesia, follows standards and regulations. Some examples of SNIs (Indonesian National Standards) related to the lamp include:
SNI 6197–2011: energy conservation in lighting systems;
SNI 7391–2008: specifications for in urban areas;
SNI 03–2396–2001: procedures for designing natural lighting systems in buildings;
SNI 03–6575–2001: procedures for designing artificial lighting systems in buildings;
SNI IEC 61347–2011: lamp control equipment;
SNI IEC 60400–2011: light fittings for fluorescent tube lamps and starter fittings;
SNI IEC 60598–2016: luminaire;
SNI IEC 60838–2017: various light fittings;
SNI IEC 60399–2017: barrel thread for lamp fittings with lampshade fitting rings;
SNI IEC 60360–2016: standard method of measuring the temperature rise of the lamp cap;
SNI IEC 60061–2016: Control of interchangeability and safety of lamp caps and lamp holders together with measuring instruments.
One of the regulations which relate to energy efficiency is implemented through the Minister of Energy and Mineral Resources Regulation No. 18 in 2014. The application of this regulation is the labeling of CFL lamps. The label referred to the minimum requirements for CFL lamps sold in Indonesia. Table 2 shows minimum requirement for CFL. However, the label does not cover efficacy. Regulations related to lamp efficacy are carried out in another form by providing a star rating marker from 1 to 4 where lamps with 4 stars indicate lamps with the highest efficacy. Table 3 shows the labeling for CFL lamps.
The existence of standards and requirements for the lamps in Indonesia shows the existence of special attention from the government. Standards and policies regarding LED lighting in Indonesia are currently still in the process of being developed. In addition, the existence of this policy can be compared with the lighting conditions in many other countries [17,18,19,20,21,22,23].

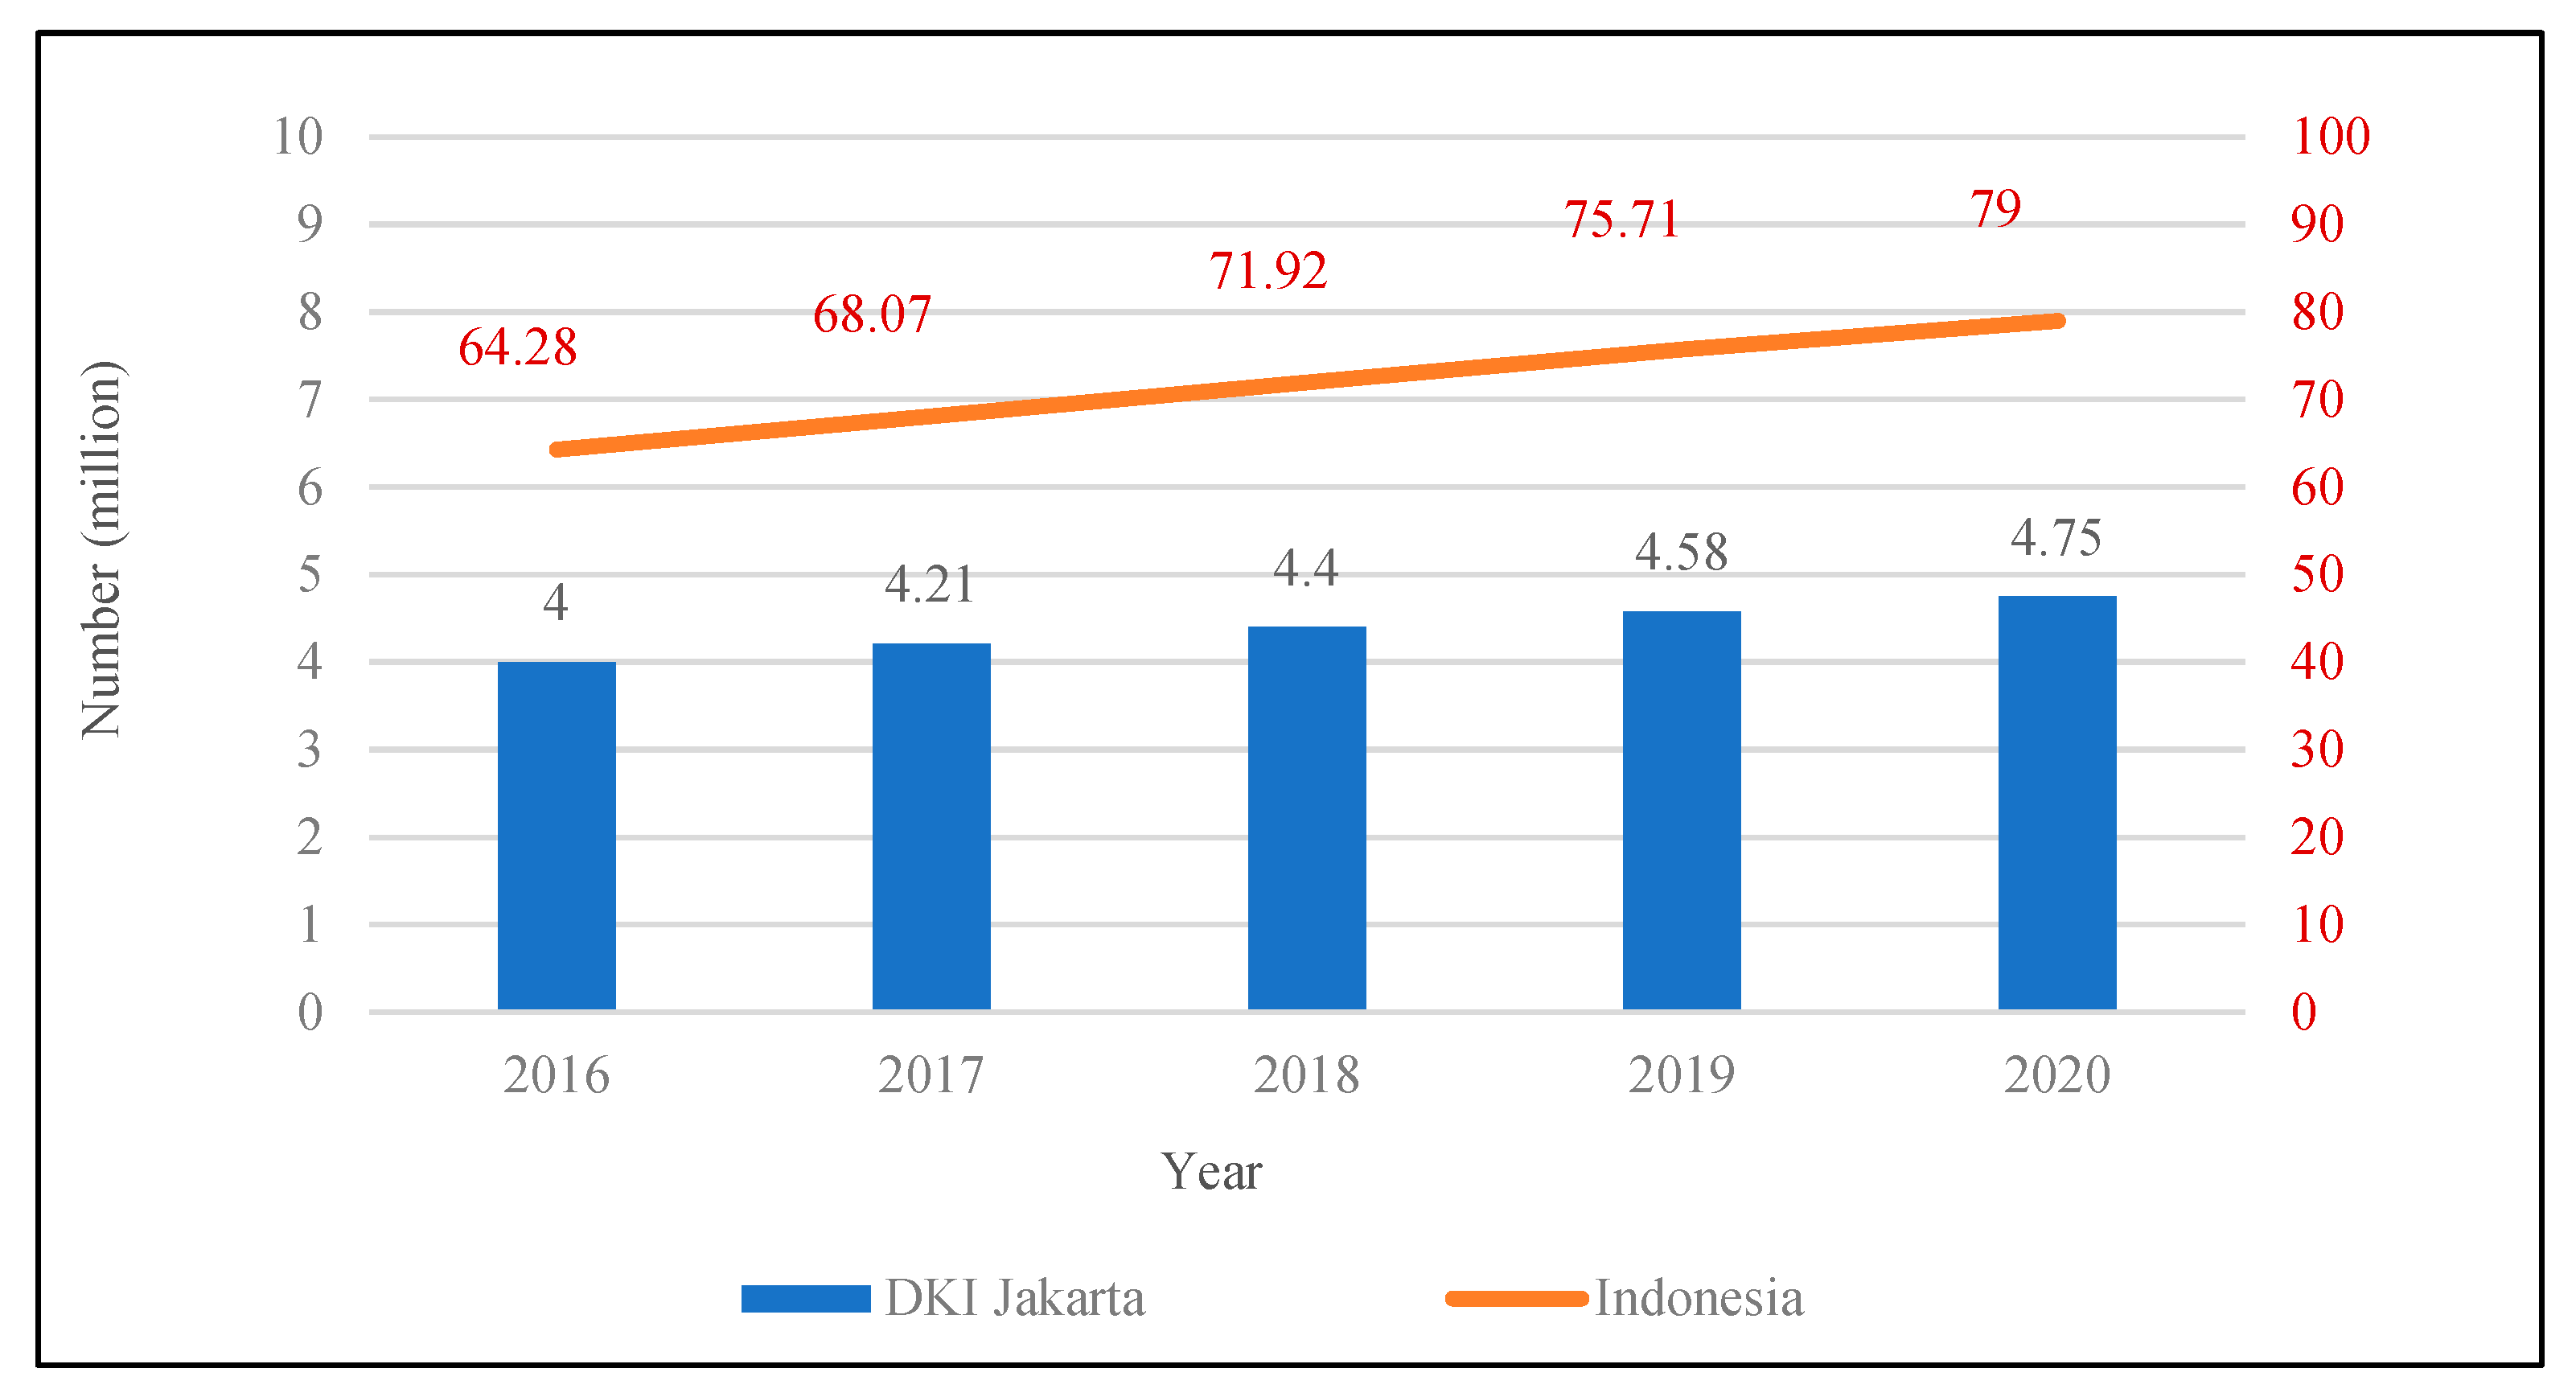
3.3. Electrification of Indonesia

Indonesia deals with serious problems related to electrification. This problem is caused because Indonesia is an archipelagic country with various population densities. BPS data for 2021 show that 56.1% (151,650,200 people) of Indonesia’s population are concentrated on the Java Island, which covers only 6.74% of the total area of Indonesia [7]. This condition makes the public facilities, including electricity networks in the Java Island area, relatively more complete and more comprehensive compared to other areas.
The Indonesian territory which is in the form of an archipelago creates challenges in the distribution of the electricity network due to the presence of a barrier in the form of an inter-island ocean. These challenges present because power plants with large capacities and low cost are located on certain islands especially big island such as Java, Sumatera, Kalimantan, and Sulawesi. An electricity supply to others cannot be connected through the regular electricity network but through other technologies such as marine power cable. However, the cost for marine power cable is so high that it cannot be implemented in a short time to all of the small inhabited islands.
Table 4 shows the Indonesia electrification ratio for the period of 2015–2022 [8]. The electrification ratio increased from 88.3% in 2015 to 99.63% in 2022. The province with the highest electrification ratio in 2022 was Bali and Jakarta which reached 100%, followed by several regions with an electrification ratio of 99.99% such as Banten, DIY, Bengkulu, Babel, South Sulawesi, North Sulawesi, North Maluku, West Papua, etc. The province with the lowest electrification ratio is NTT with a percentage of 92.5% [8].
To electrify areas that must pass through waters or for areas that run into a shortage of power supply, there are several methods used by the Indonesian government, including:
Use of Marine Cable
The first underwater power cable built by PLN was an electric cable connecting Java–Bali in 1985 with a capacity of 200 MW. However, the use of this submarine cable has several problems, as those are of small capacity and easily disturbed due to being hit by ship anchors, considering that the route used by the submarine cable for Java–Bali crosses an area with heavy ship traffic. Beside Java–Bali, there are also other submarine cable networks in Indonesia such as the one currently being built to connect Sumatra–Bangka. However, the use of this submarine cable usually has a very high initial investment.
Small Capacity Power Plant
Power plants built to electrify small islands are generally in the form of PLTS (Solar Power Plant) and PLTD (Diesel Power Plant). In addition, there are some programs launched by the government in order to increase the electrification ratio, especially for remote areas, such as LisDes (Rural Electricity Programs) and LTSHE (Energy Saving Solar Lamps). This program was successful in increasing the electrification ratio. The number of not yet electrified villages decreased from 2281 in 2018 to just only 433 in 2020.
TaLis and MESS
TaLis (Tabung Listrik) and MESS (Mobile Energy Storage System) are equipment concepts developed by researchers from the Faculty of Engineering at the University of Indonesia (FTUI). In the TaLis concept, electrical energy can be stored in an energy storage medium (battery) for further use to operate electronic equipment in remote areas, while MESS can be said to be TaLis in a larger dimension where the way this tool works is to distribute electricity from islands that have excess electricity power to islands or areas which have electricity shortages without using submarine cables but using containers containing batteries, AC-DC and DC-AC converters, and control and safety systems. The distribution of MESS in the form of containers is carried out using sea, river, and land transportation from the power plant center to the load center. TaLis has become one of the programs launched since 2020 by the Ministry of Energy and Mineral Resources through the Director General of Electricity Indonesia to electrify 306 villages located in areas with difficult geographical conditions to install electricity networks

3.4. Use of Lights in Indonesia

Based on information from BPS, artificial lighting sources used in Indonesia are classified into several categories including:
PLN electricity, which is a source of electric lighting managed by PLN;
Non-PLN electricity, which is a source of electric lighting managed by agencies/parties other than PLN, including those using lighting sources from batteries, generators, and solar power plants (which are not managed by PLN);
Petromak/Aladdin, which is a source of lighting from kerosene such as Petromak/press lamp and Aladdin (including gas lamp);
Lamps/flashlights/torches or other kerosene lamps (Teplok lamps, flashlights, lamps, etc.);
Others, such as carbide lamps, candles, castor bean and candlenut.
Until now, not all regions in Indonesia can get electric lights easily. A number of villages in several provinces in Indonesia still do not get electricity, which presents limitations on activities for the people, especially in the night, and hinders the progress of various aspects of their lives. As an overview of the condition of using lamps in Indonesia, this research is carried out by categorizing the area based on the electricity consumption per capita and electrification conditions.
Generally, Indonesia consists of two regional categories, which are cities (urban area) and villages (rural area). The definition of cities and villages based on Indonesian Law No. 22 of 1999 are as follows.
A city is an area that has non-agricultural main activities with the composition of the function of the area as a place for government services, social services and economic activities;
A village/rural areas are areas that have the main activities of agriculture, including natural resource management, with the structure of the function of the area as a place for rural settlements, government services, and social services.
However, the cities and villages in Indonesia have different characteristics in terms of regional conditions, economy, public facilities, etc. Therefore, in this research the regional categories are divided into some other categories. The following Figure 6 shows the methodology to obtain the data.
Based on the study related to the electricity condition of Indonesia, there are 5 categories of regions created. Table 5 shows the definition for each category.
To simplify data interpretation and comparison, the 5 regional categories will be divided into 2 major categories. Those are urban areas (big cities and small cities) and rural areas (village, remote, and islands).
Respondents in this study were selected based on the city where they lived so that the area category of the respondent can be known. The number of respondents surveyed meets the minimum number based on [24], so the minimum number of respondents is 100 people for each area category used in this study. However, respondents for areas that are in the ‘islands’ and ‘remote’ categories cannot be reached. Considering that the two categories of regions really exist in Indonesia, in order to provide a more comprehensive picture of conditions in Indonesia, it is still necessary to convey general conditions of those areas based on data and available information.

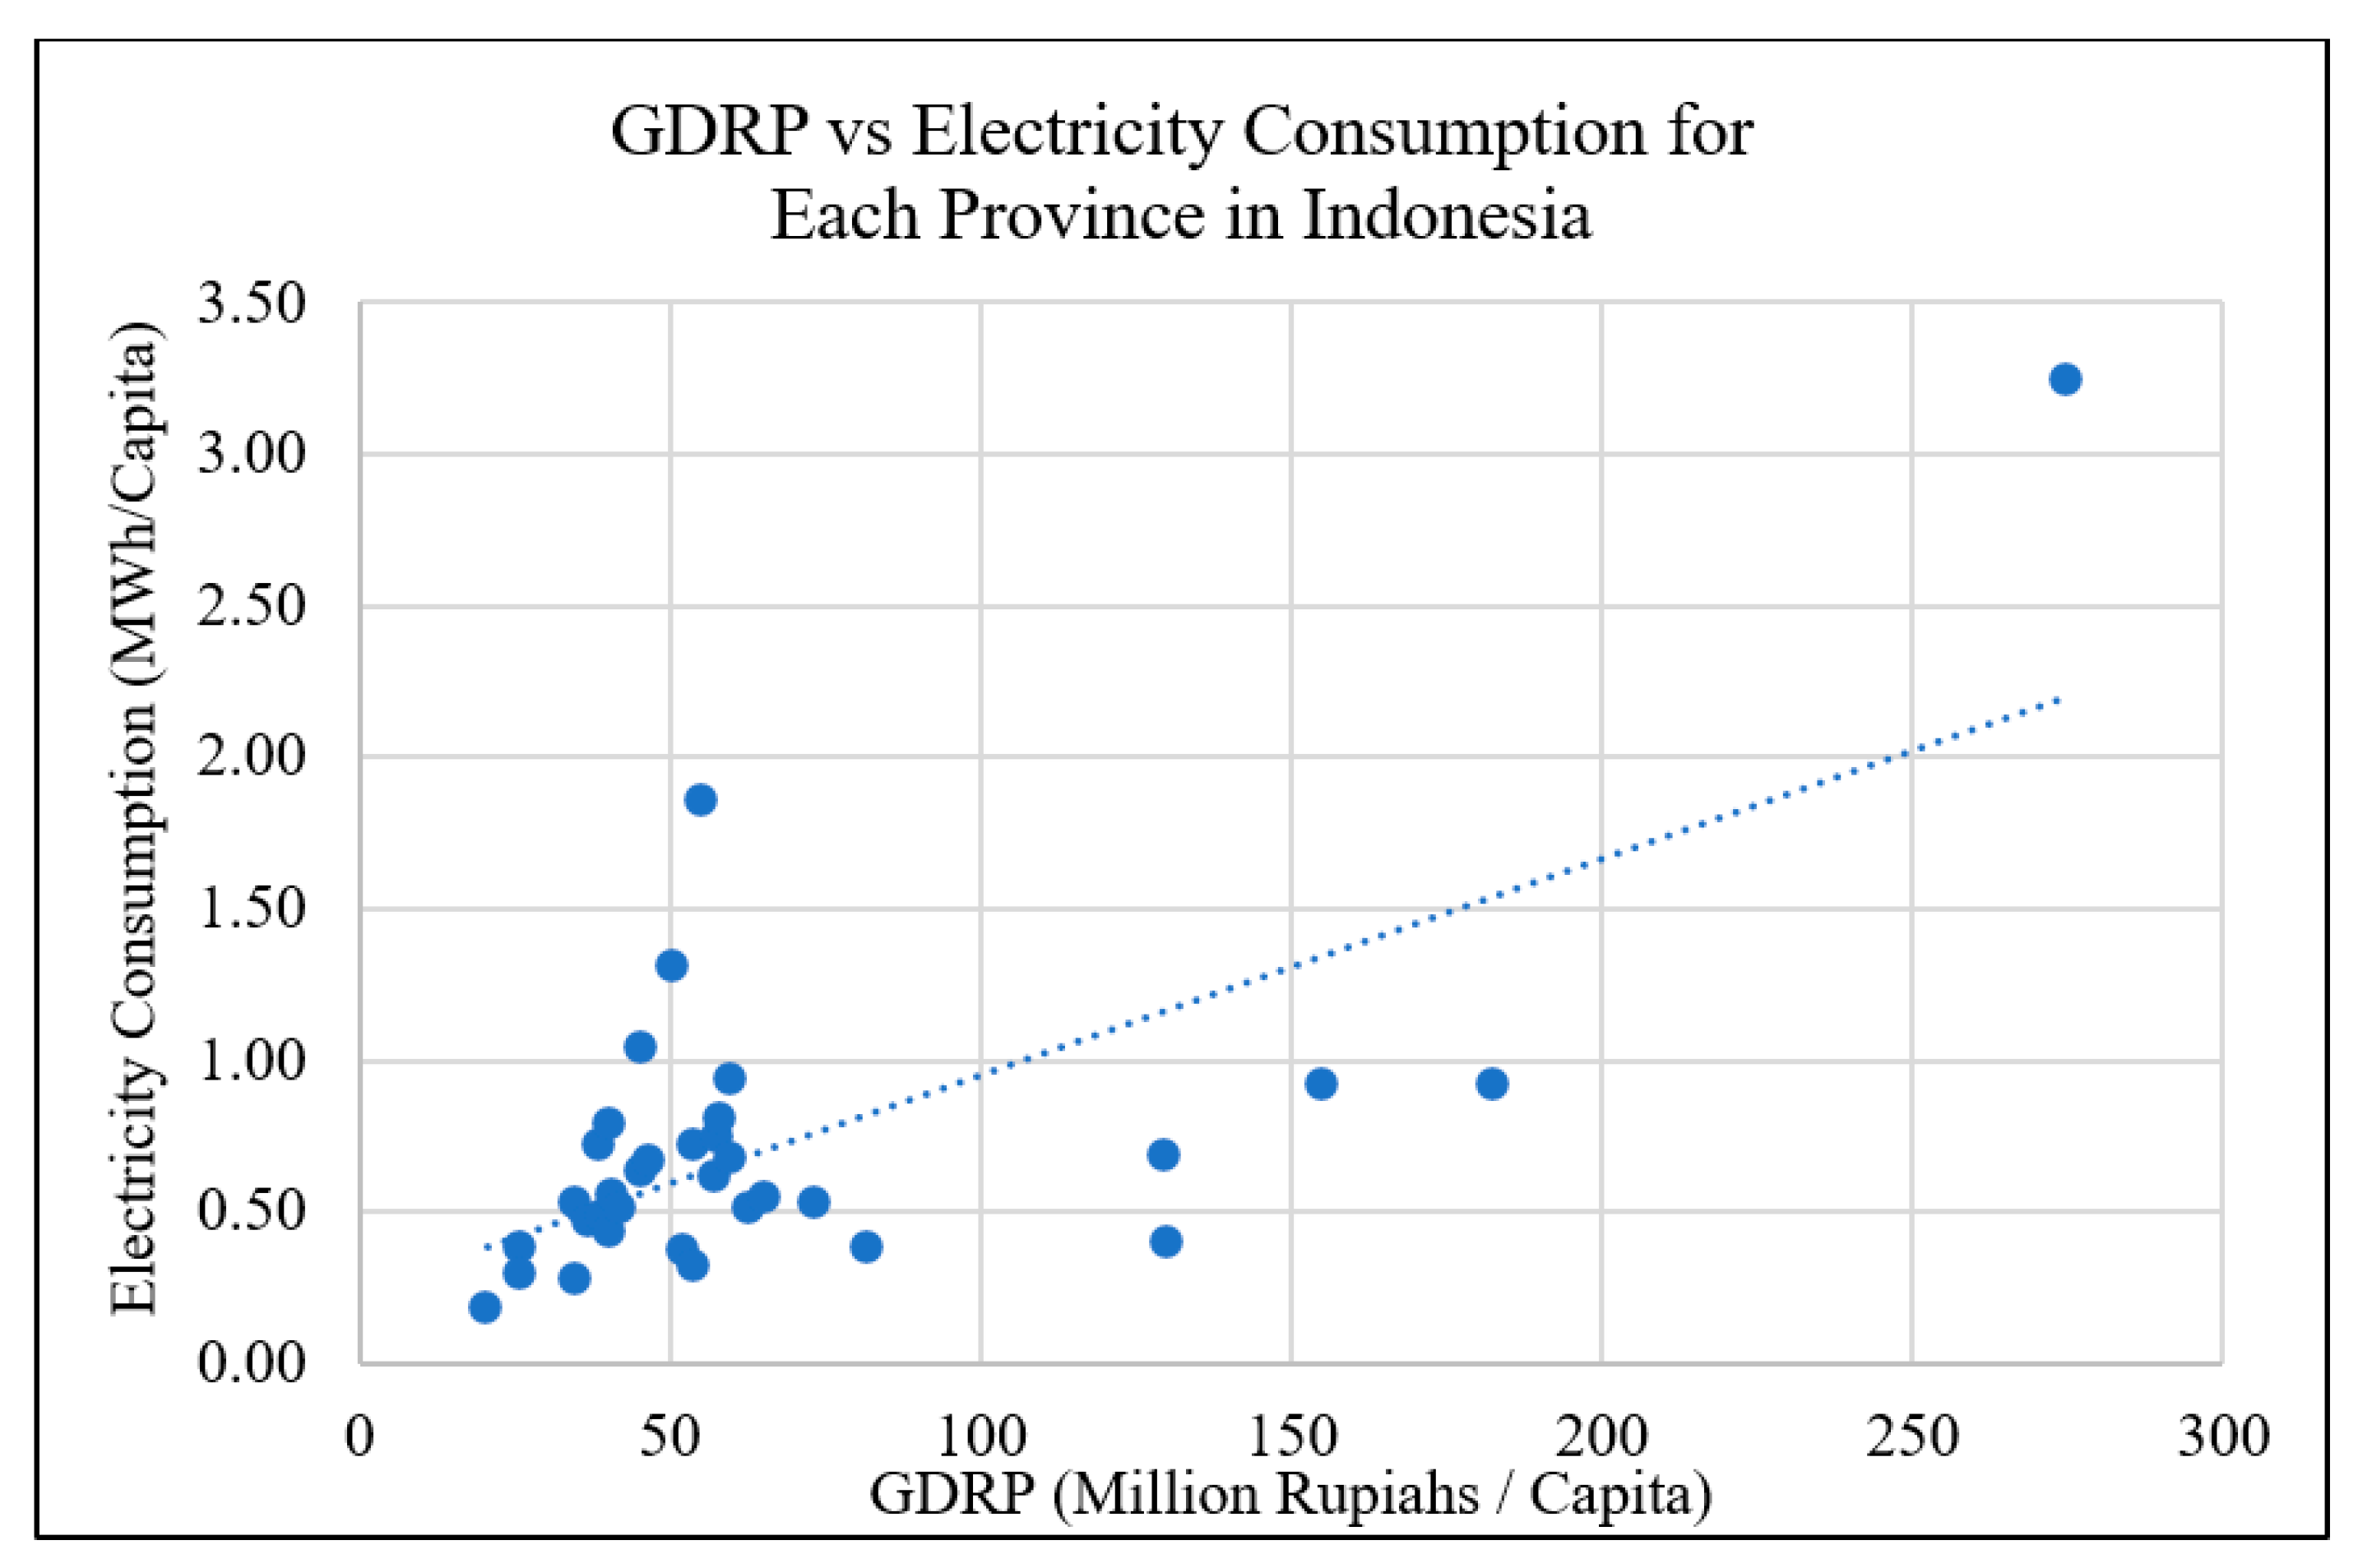
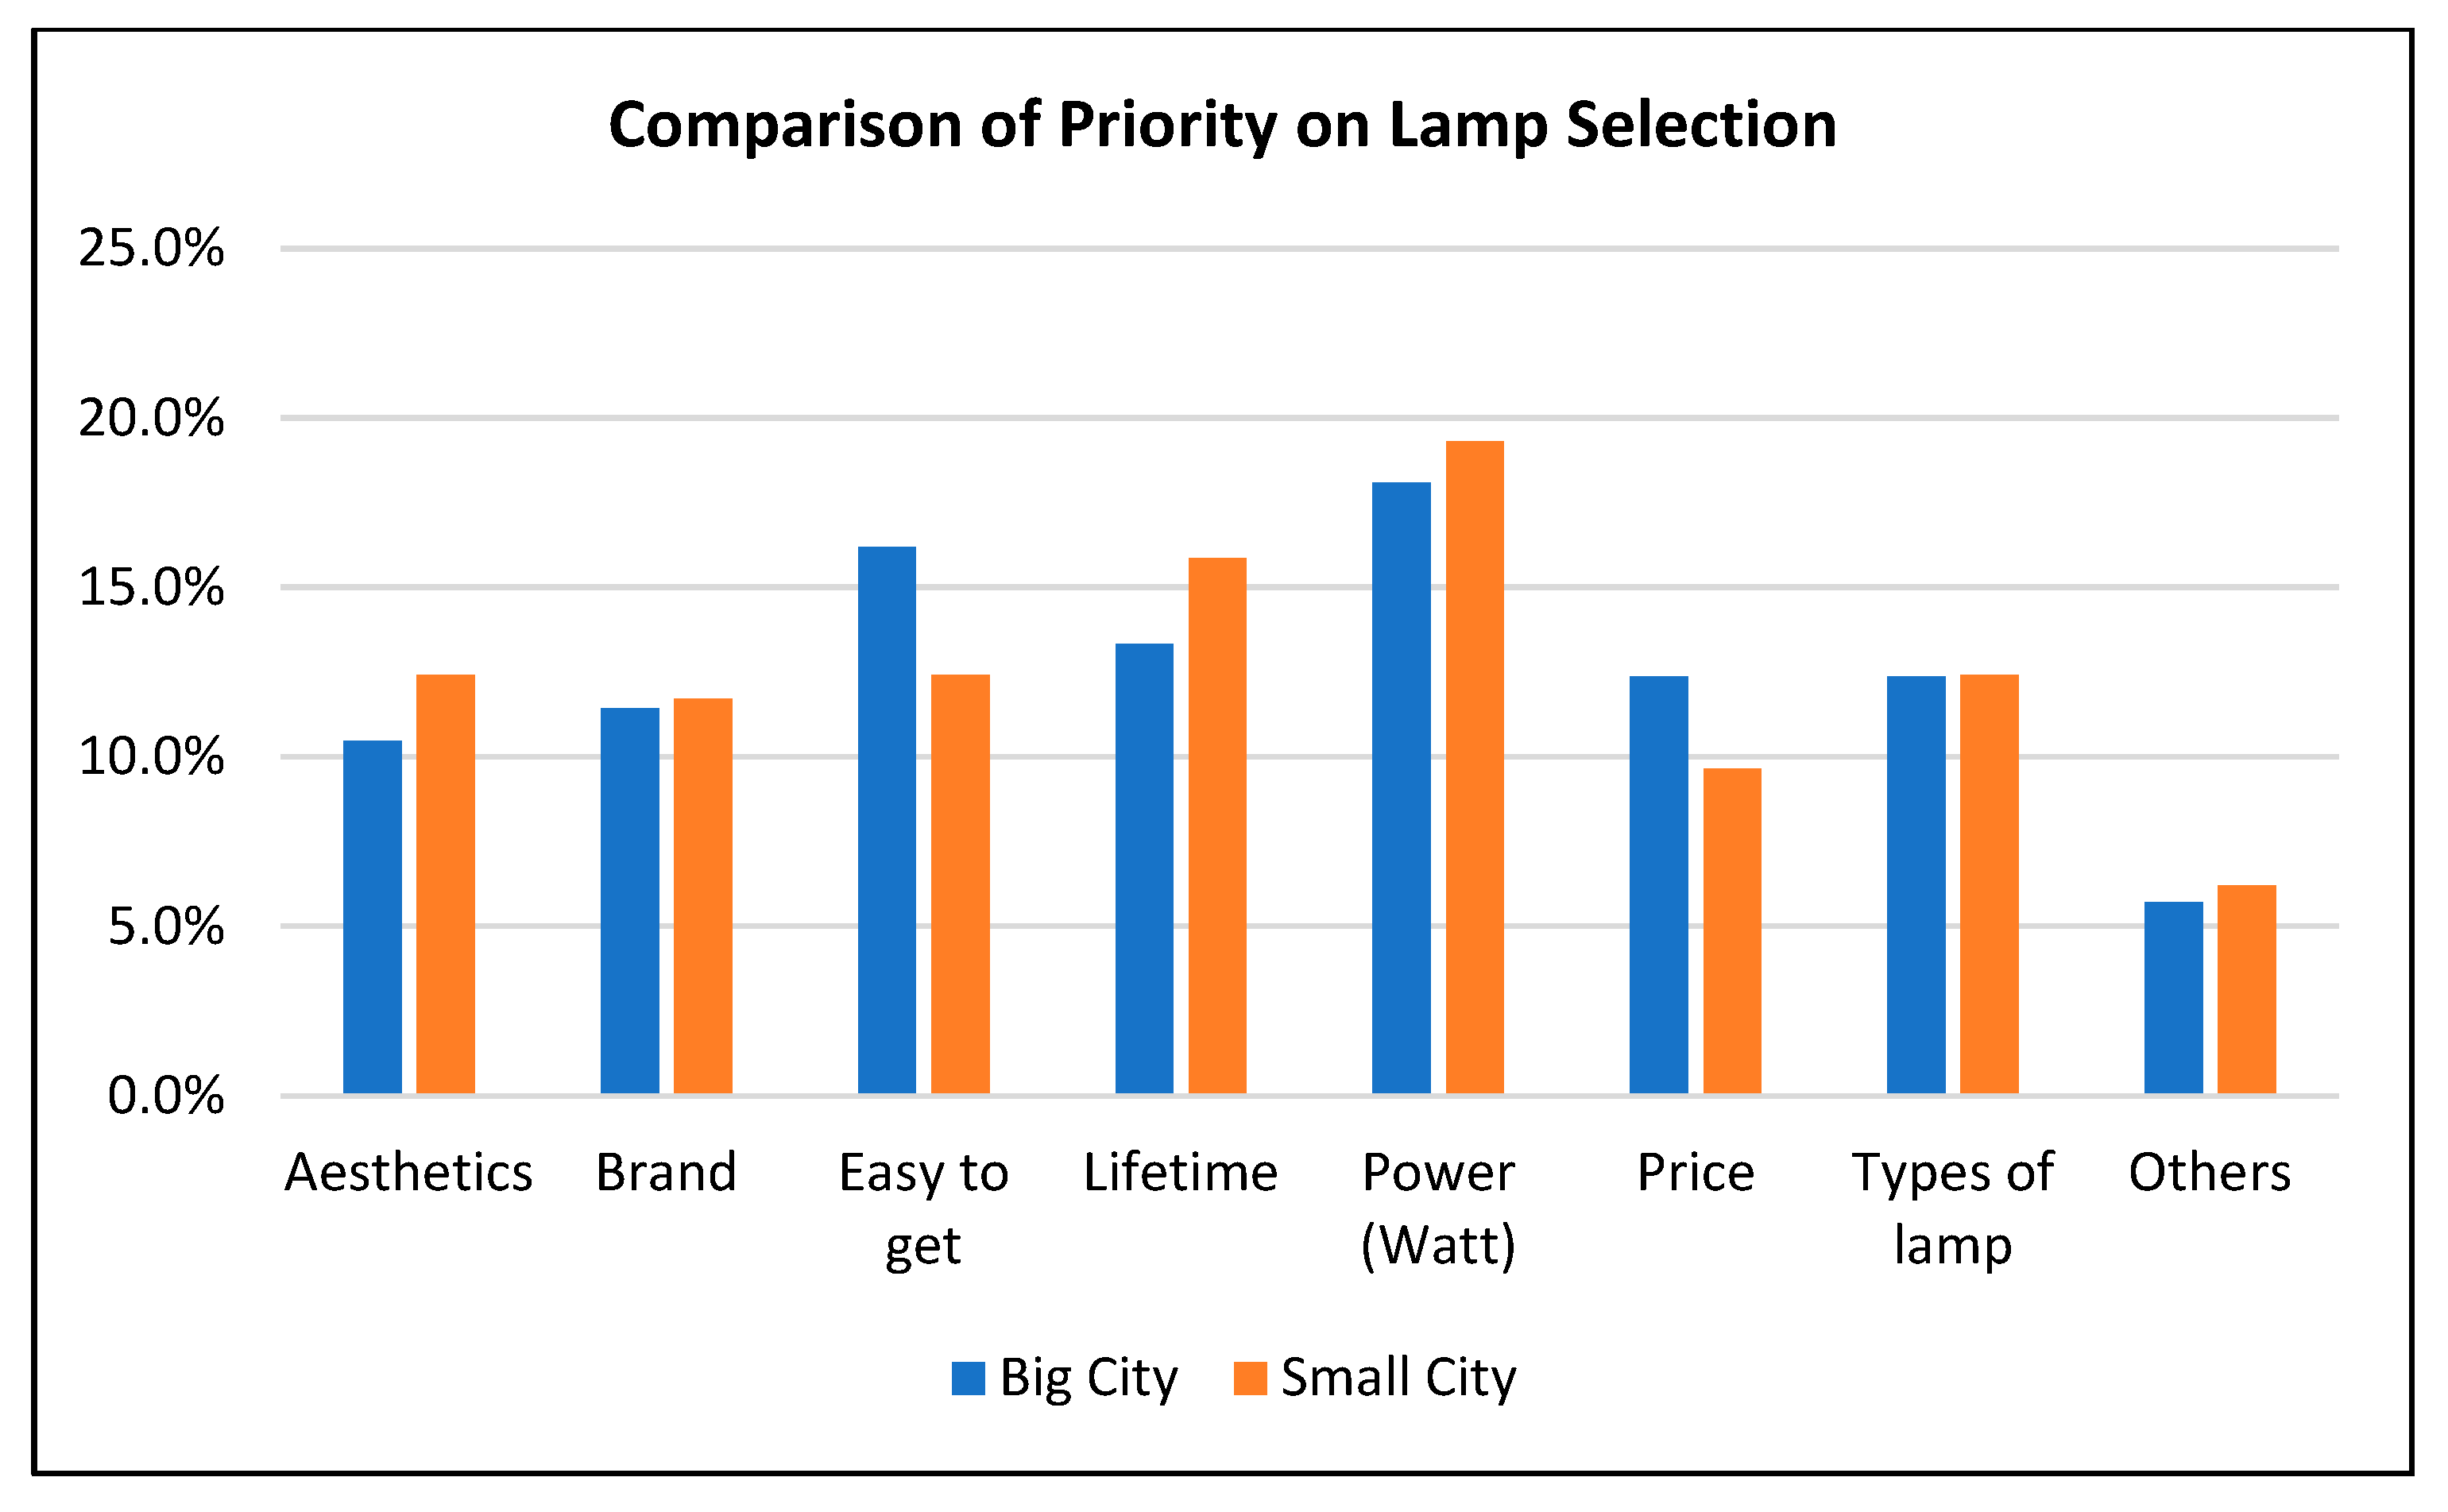
3.4.1. Lighting Use in Cities (Big Cities and Small Cities)

Indonesia is a unitary state consisting of 37 provinces. Actually, at the end of 2021 the total number of provinces is 34, but in 2022, 3 additional provinces were named, which are a fraction of the pre-existing provinces. Each province has a different level of progress that affects various things, one of which is the level of electrical energy consumption. Figure 7 shows electricity consumption per capita for each province in Indonesia. The data is processed by identifying the total electricity consumption for each province and then dividing by the population of that province.
Based on the graph, it is known that in general there are 2 types of provinces:
  • Provinces with electricity consumption per capita greater than the national electricity consumption per capita;
  • Provinces with electricity consumption per capita less than the national electricity consumption per capita.
In Indonesia, every province is divided into cities and districts (Kabupaten). The definition of cities is mentioned above, while the definition of district (Kabupaten) is a level II autonomous area headed by a regent (Bupati). The district is a direct part of the province which consists of several sub-districts. In general, both districts and cities have the same authority. The main difference between them lies in the general appearance of the area. Cities tend to have relatively small areas that are mostly occupied by buildings for housing, offices, public facilities, etc., with a relatively large population density and a developed economy supported by a lot of community work activities outside of agriculture. Meanwhile, districts/regencies tend to have the appearance of a region in the form of an area that is relatively wider than cities where some areas have the same activities and characteristics as the cities, but most other areas consist of agriculture areas. In general, in each district, there are several sub-districts that have an appearance of an urban area which can be categorized as small cities, but most of the district’s main features are rural areas. Although there are differences between the city and the district, the affairs and authorities of districts and cities in the government system basically remain the same.
The literature shows that the point of view of the definition of city can vary depending on how one approaches the concentration of their respective fields of knowledge, including in the field of electricity, as discussed in this paper, where the city and the district are considered as the same object but are distinguished based on electricity consumption and the use of lights. In order to be able to see the conditions of lamp use in Indonesia in more detail, this paper provides an overview of the electricity consumption per capita for each city/district.
Figure 7 shows the electricity consumption for some cities in East Java Province [7]. The data is processed by identifying the total electricity consumption for each city and then dividing by the population of that city. Each city/regency has a different per capita electricity consumption even though the city/regency is located in the same province. This is due to differences in progress in various fields, especially the economy in different cities/districts.
Based on Figure 8, it is known that the electricity consumption per capita in each city/district is different. When it is compared to the national electrification ratio, there are two categories of Cities/Regencies.
Cities/Regencies with electricity consumption per capita greater than the national electricity consumption per capita;
Cities/Regencies with electricity consumption per capita less than national electricity consumption per capita.
Therefore, in this paper, cities are classified into two categories: big electricity consumption cities (big city) and small electricity consumption cities (small city).
To know the general condition of big cities and small cities, some cities are chosen to be compared in some parameters, including electricity consumption, GDRP (Gross Domestic Regional Product), and people density, as shown in Table 6.
From Table 6 it can be seen that electricity consumption has a high correlation with other parameters, especially the economic development of the city. Big cities have relatively higher GDRP than small cities. This high economic development will attract people to come and find a better life so that the people density will increase. In fact, in Indonesia the number of cities that are classified as big cities is very little. For example, in East Java Province, the number of the cities that have electricity consumption bigger than national consumption is just 5 from a total of 38 cities.
To see the general correlation between GDRP and the electricity consumption, the data for each province in Indonesia are observed in Figure 9. There is a correlation between the economic condition of a region represented by GDRP and the electricity consumption in a region. Based on that figure, it can also be seen that there is a province in Indonesia which has the biggest GDRP and related to that it has biggest electricity consumption. That province is DKI Jakarta, the most developed province in Indonesia.

Usage of Lights in Big City Area

The big cities are cities with per capita electricity consumption higher than the national per capita electricity consumption and are relatively higher than the per capita electricity consumption of cities/districts in the same province. Examples of big cities in this study are Jakarta (3.23 MWh/Capita), Surabaya (2.93 MWh/Capita), Bandung (1.68 MWh/Capita), etc. Big cities in general have a good level of economic progress which can be seen from the value of their GDRP including, for example, Central Jakarta (608 million/capita), Surabaya (193 million/capita), and Bandung (113 million/capita). In these cities, the electrification ratio in general has reached 99.99% so that all residents in these cities have used artificial lighting sources in the form of electric lights.
As an illustration of the lighting conditions in big cities, reference data is taken from cities in the DKI Jakarta Province. DKI Jakarta is the center of government and business, so the construction of offices, apartments, shopping centers, housing, and other buildings has increased rapidly from time to time. Along with the increasing of these developments, the demand for electricity is certain to increase. Figure 10 shows the growth in the number of PLN customers in the DKI Jakarta area for the period of 2016–2020.
Based on data from PT PLN, the household group is the largest number of electricity customers in DKI Jakarta, which are 4,220,177 customers or 92% of the total number of electricity customers in DKI Jakarta, followed by business groups with 285,444 customers. The electricity consumption for the household group is 13,995.5 GWh, while the business group is 12,263.25 GWh. From this value, it is known that the business group’s electricity consumption reaches 87.62% of household consumption. Based on the total amount of electricity consumption data in 2019 (34,107.98 GWh) and the population of Jakarta in 2019 (10,557,810 people), the electricity consumption per capita for Jakarta is 3.23 MWh/Capita. This value is higher than the national per capita electricity consumption in 2019 which was 1.08 MWh/Capita.
In a big city like Jakarta, lights are not only needed as a source of lighting at night, but during the day they are still a necessity. The use of lights during the day is mainly for activities in office areas, shopping centers, public services, etc., which incidentally, are not sufficient or the sunlight cannot be used due to indoor activities in large and tall buildings. Lights in big cities are not only used as a source of artificial light but are also used as part of the decoration to add the aesthetics of buildings, housing, and public open spaces. The combination of these things results in the relatively large consumption of lights in big cities.
One thing that has become the focus of big cities is to build a smart city concept which is related to the efficiency of electricity use. This efficiency of electricity use is implemented in several ways, for example, by promoting maximum power rules for lighting, replacing standard street lighting with a LED smart street lighting (SSL) system equipped with IoT, etc.
Table 7 shows an example of regulations regarding lighting restrictions in Jakarta based on governor regulation number 38/2012, which is basically an elaboration of SNI 03-6197 2011 [25].
In addition to residential and office areas, lamps are also used for lighting in public areas, especially on the street. In big cities, generally the number of street lightings is in accordance with the standard. For example, in Central Jakarta, which has a road length of 694 km, the number of street lightings installed is 29,700 points (average distance between street lighting points is 24 m). Until April 2019, street lighting in Jakarta had implemented the LED Smart System up to 92%. The street lighting can be controlled from the control room operated by the operator. This smart street lighting system provides savings in the use of electrical energy, which has implications for reducing the value of street lighting bills that must be paid by the local government to PLN.
To find out the overview of electricity and lamp usage in big cities, a survey was conducted on 101 people in big cities. Figure 11, Figure 12, Figure 13, Figure 14, Figure 15 and Figure 16 show the results of lighting usage survey in big cities in Indonesia.
Based on these observations, some information is obtained related to the use of lights and electricity in big cities. At the electricity customer class level, the number of customers in the 1300 VA power class is much higher than that of customers in the power class below 1300 VA with a percentage difference of 32%. This shows that the population of large cities is dominated by inhabitants with large electricity needs. The need for this large power value shows the amount of electrical equipment used by each house. From the preference for the types of lamps, it is known that the types of lamps which are preferred and used in the big cities follow the trend of the development of the lighting technology where the lamps with the latest technology (LED) are preferred, while lamps with the oldest technology (incandescent) are the least used. The results of the processing of the lamp power and duration of use data make it possible to estimate the average percentage of electrical energy consumption for lighting needs between 22.3% and 37.4%.

Usage of Lights in Small City Area

Basically, every province in Indonesia has a certain city/regency which becomes the center of the economy. This condition has implications to the increasing electricity consumption per capita value for that city such as Bandung in West Java, Surabaya in East Java, Medan in North Sumatra, etc. In those cities, the implementation and policies related to the use of lights are almost equivalent to or close to Jakarta. However, several other cities/districts in the same province have progressed not as fast as these cities and in this paper are called small cities/districts. Small cities referred to in this paper are cities/districts with a value of electricity consumption per capita smaller than the national per capita consumption and relatively smaller than the electricity consumption per capita of big cities.
The number of cities categorized as small cities in Indonesia is more than big cities. This can be seen, for example, as shown in Figure 6. Examples of small cities include Garut (0.33 MWh/Capita), Pamekasan (0.26 MWh/Capita), Ponorogo (0.30 MWh/Capita), etc. In general, small cities have economic activity with a lower level of progress than that of big cities. This can be seen from the value of GRDP per capita with relatively small values such as Garut (22 million/capita), Pamekasan (20 million/capita), Ponorogo (23 million/capita), etc. The quantity of economic activity and the level of population density in small cities/districts are not as much as in big cities. In small cities/districts, the number of office buildings, apartments, and shopping centers is relatively little, with smaller building dimensions. This condition makes work activities during the day that require additional lighting sources relatively less when compared to big cities.
For example, the analysis for small cities/districts used data from Garut City, which is one of the cities in West Java with a population density of about 861 people/km2. Data from BPS for Garut City in 2016 showed that electricity consumption for the household group reached 587 GWh, while for the business group it only reached 101.3 GWh. From this value, it is known that the electricity consumption of the business group is only 17.26% of the consumption of the household group. In addition, if a comparison is made for electricity consumption to the total population, the value of electricity consumption per capita in 2016 is obtained at a value of 0.33 MWh/Capita. This value is smaller than the 2016 national average electricity consumption, which is 0.95 MWh/capita.
In a small city such as Garut, the lights used by the people are basically the same as those in developed cities. This can be seen from the percentage of users of energy-saving lamps for 2014 reaching 77.21%. The use of lights in small cities such as Garut also functioned as a decoration enhancer even though the number is not as much as in big cities.
The problem faced by small cities/regencies related to lights is the possibility of areas that are not yet electrified or that the quality of the electricity network is still not good. There are so many remote villages without infrastructure facilities or with improper infrastructure facilities. In addition to that, in small cities there are many roads that have not installed street lighting and the installed street lightings still do not use ESL.
For example, in Garut City, as of June 2021 the number of street lightings installed is only 8000 units to illuminate a total district route of 828 km. This number can be said to be much less because ideally, based on SNI, for the length of the line at least 20,000 street lightings are needed (distance between poles is 40 m). Even from the 8000 units of street lighting installed, only 1500 units can operate while the rest are in a state of disrepair. This condition shows that in small cities there are quite serious problems regarding street lighting.
To find out the general description of lighting conditions in small cities areas, 151 people were observed. Figure 17, Figure 18, Figure 19, Figure 20, Figure 21 and Figure 22 show the results of the lighting usage survey in small cities in Indonesia.
Based on the data processing result from these observations, some information is known related to electricity and lighting for small cities areas. In terms of electricity customer class, it is known that the number of customers with power class 1300 VA is slightly larger than customer class <1300 VA with a difference of about 8%. This shows that in small cities the number of residents with small electricity needs is almost comparable to the number of residents who have large electricity needs. From the preference for the type of lamp used, it is known that in small cities the type of lamp used by residents is basically in line with the development of the latest lighting technology. This can be seen from the trend of using types of lamps that are in line with those in big cities.
The results from processing the lamp power and duration of use data shows the estimation of the average percentage of electric power for lighting needs is about 28.5% to 39%.

Big Cities and Small Cities Comparison

Based on the overview of the electrical conditions and the use of lights in the big cities and small cities, the following comparisons can be made.
Based on Table 8, it is known that basically both in big city and in small city, the electric lights used are generally ESL. In addition, light consumption data also shows that residents in small cities can already access energy-saving lamps as an indicator that lighting technology used in big cities has arrived in small cities (well distributed). However, a contrasting problem that can be seen from Table 8 is related to street lighting wherein small cities the number of street lightings installed is not in accordance with the standard.
The following Figure 23, Figure 24 and Figure 25 show the comparison result from the survey conducted.
In addition, from the observations made, several comparisons from big cities and small cities can be seen. In terms of customer class, in large cities the percentage of electricity users with a capacity of 1300 VA or more is relatively higher than in small cities. This shows that the electricity demand of the people in big cities is relatively larger than in small cities. In terms of preference for the lamps used, they basically produce the same trend where LED and CFL are the first and second choices with a large percentage portion which is around 90% for both big cities and small cities. This result is quite in line with data related to the use of ESL lamps from BPS which show that big cities and small cities have a not too significant percentage difference. In terms of the presence of street lighting, the results of observations show that in big cities street lighting are almost present in all areas while in small cities there are several areas that do not have street lighting.

3.4.2. Lighting Use in Village, Remote, and Islands

Indonesia deals with serious challenges in electrification. This is caused because the territory of the Indonesian is an archipelago. In addition, the appearance of land areas in the form of forests and mountains makes many difficulties in building the electricity network. Based on these conditions, in this paper three regional classifications are made: are village, archipelago/islands, and remote areas.

Usage of Light in Village Area

The definition of village was mentioned before. Village areas in Indonesia are generally located in regencies and are located far from the city center, so the electricity consumption per capita of its people is much smaller than residents in the city center.
In village areas, generally residents use electricity with relatively small power, such as 450 VA and 900 VA. With this small power value, the types of lamps used are lamps with a small power value. However, even though it is located quite far from urban areas, even in rural areas the lamps widely used by residents are energy-saving lamps. This can be seen based on BPS data in 2014 which shows the number of users of energy-saving lamps in urban and rural areas in Indonesia has almost the same percentage, namely, at 86%, although for comparison the percentage values in several regions are quite different such as in Papua where the percentage of ESL users in urban areas reaches 78.3%, while in rural areas it is only 16.74%.
Generally, there are no street lightings/public lights installed in village areas. Lighting for the road area is usually sourced from outside lights from residents who live on the side of the road. This causes the roads in the village area to be pitch black at night. To find out the general overview of lighting in a village area, the survey was made by 142 people. Figure 26, Figure 27, Figure 28, Figure 29, Figure 30 and Figure 31 show the results of lighting usage survey in village areas in Indonesia.
Based on the data processing result from these observations, some information related to electricity and lighting for rural areas is known. In terms of electricity customers class, it is known that customers with a power class of 450 VA and 900 VA have a dominant number of more than 70%. This shows that in rural areas, in general, residents have little electricity demand due to the relatively small number of electronic equipment used compared to residents living in cities. However, from the preference for the type of lamp used, it is known that in rural areas the type of lamp used by residents is basically in line with the development of the latest lighting technology. This can be seen from the trend of using types of lamps that are in line with those in big cities. Even if viewed from the percentage of use, the total use of LEDs and CFLs reaches almost 90%, which means that the use of these two types of lamps in rural areas is equivalent to that in urban areas. This result is in line with data released by BPS regarding the comparison of ESL use in urban and rural areas, which shows that the percentage of ESL use in both is almost the same in each province except for the Maluku and Papua regions. The results of processing the lamp power and the duration of its use data produce an estimation of the average percentage of electric power consumption for lighting needs in rural areas, which is around 31.87% to 45%.

Usage of Light in Island Area

The islands region has its own challenges in the electrification process because there are barriers in the form of inter-island sea. Several islands located near developed areas such as Kepulauan Seribu have received sufficient electricity through the submarine cable network, PLTS (Solar Power Plant), and PLTD (Diesel Power Plant). Even though on Pulau Seribu where there is an island that received reliable electricity recently, namely, Sebira Island, after the construction of additional units of PLTD in 2019 and PLTS in 2020. Before there were additional power plants, residents of Sebira Island could only use electricity for a few hours due to limited generating capacity so that the amount of electrical energy that can be used by each family is limited.
Basically, small islands in other archipelagos also face a similar problem, which is the presence of electricity that cannot be available for 24 h, such as in the Riau Islands, Nusa Tenggara Islands, etc. Usually, these islands have a small capacity power source such as a generator which is only owned by people with a higher economic level than the surrounding residents. So, not all residents can enjoy electricity including, for example, on Papagarang Island and Messa Island in the East Nusa Tenggara archipelago. In those two islands, electricity was available around the 2000s through diesel generators owned but certain people, but in general the island area remained pitch black at night because only a few residents could enjoy electricity. However, since 2019 after the PLTS (solar power plant) was built in the area, all residents have been able to enjoy electricity, although not for a full 24 h, considering that the electricity network is still off the grid with limited resources.
Basically, the types of lamps used by residents living in island areas have also used a lot of energy-saving lamps. One implementation that can be found is in the manufacturing of street lighting that has used LEDs in several islands such as Kepulauan Seribu. Since 2015, Kepulauan Seribu has been aggressively replacing street lighting from non-energy efficient lamps to street lighting using LEDs. Even in 2017, LED types have been installed whose brightness can be adjusted remotely (armature LED). To find out the types of lights that are commonly used in the islands, it can be taken from the BPS data reference from the province which has area in the form of islands. BPS data shows that for provinces such as the Bangka Belitung Islands, Riau Islands, NTT, and NTB, more than 86% of the population in both urban and rural areas has used ESL. This shows that the inhabitants of the islands also have access to lamps with the latest technology

Usage of Light in Remote Area

Up to 2020, there were 433 villages (out of a total of 92,970) that still did not have electricity in Indonesia. These villages are located in remote areas which are difficult to reach by the PLN electricity network. For lighting needs at night, generally these remote areas use firewood, oil lamps, candles or other traditional lighting sources. The number of villages that have not been electrified has actually decreased significantly compared to previous years (2281 villages in 2018).
Since 2017 one of the efforts to electrify remote areas that the government has promoted is the LisDes (electricity for village) program and the installation of LTSHE (Energy Saving Solar Lamps) program. The LisDes is a program assigned by the government to PLN to accelerate the construction of electricity networks in remote areas, while LTSHE is a program to temporarily electrify remote areas with simple PLTS equipment while waiting for the LisDes program to reach the village. The LTSHE program package includes a solar panel with a capacity of 20 watts peak, 4 light emitting diode (LED) lamps with a power of 3 watts, batteries, installation costs, and after-sales service for three years.
Based on these conditions, it is known that in general for remote areas that already have electricity, the lamps used are energy-saving lamps in the form of LEDs with small power.

4. Overview of Lighting General Condition in Indonesia

4.1. Overview of Categorized Region

Stable economic growth in Indonesia has contributed to the doubling of electricity consumption from 129 TWh in 2008 to 256 TWh in 2018 [14]. The growth in the number of electricity consumption is related to the increase in the electrification ratio and the growth in the use of electricity for lighting needs. Indonesia’s electrification data shows that in 2020 Indonesia’s electrification ratio has reached 99.4% with the number of areas that have not been electrified at 433 villages. With that electrification ratio, in general, most Indonesians can enjoy electric lights. Based on the description of the condition of lights in various categories of regions in Indonesia as described in Section 3, the general overview of lighting condition in Indonesia can be known.
The survey and observation results of 5 regional categories show that each regional category has different conditions and problems related to electricity and the use of lights. This is caused by various factors, especially economic growth in the region which has a significant impact on electricity demand. The existence of electricity is the main key to the use of electrical lights. The general description of the conditions related to electricity and the use of lamps in 5 categories of the region can be seen in Table 9. Based on the summary result, it is known that each regional category in Indonesia has different problems for electricity and lighting, but in terms of the types of lamps used, they are almost the same. The main differences that can be seen are the electrification conditions, the quantity of lamps used, and the percentage of electric power used for lighting needs. In general, the types of lamps used in various regions in Indonesia are energy-saving lamps. This is confirmed both from the results of observations in this study and information from BPS data. This information is also in line with what was conveyed by the Ministry of Energy and Mineral Resources where until 2021 the use of lamps in Indonesia for LED was around 52%, the rest was CFL at 41% and incandescent lamps at 7%. In addition, the large number of LEDs used by the public is also confirmed from the estimated lighting stock data from the results of the CLASP study in 2019 where the total stock of LED lamps installed in Indonesia is 343 million (50%) out of a total of 685 million [14]. However, considering that LEDs have advantages in terms of efficacy, the use of LEDs for lighting needs is one of the things that is strongly encouraged by the government; one of the efforts is through the ADLIGHT (Advancing Indonesia’s Lighting Market to High Efficient Technologies) program so that the use of LEDs will increase and the percentage portion is estimated to reach almost 100% by 2030.
Based on Table 10, it can also be seen that there are several rural areas in several provinces in Indonesia that have a low percentage of using energy-saving lamps. One of the problems faced by the people in that region is the low rate of infrastructure development. The poor road access to rural areas in that province makes it difficult to distribute various commodities, including lamps. In addition, difficult access will cause commodity prices including lamps to increase. Moreover, in other areas, the purchase price of energy-saving lamps is relatively more expensive than incandescent lamps.

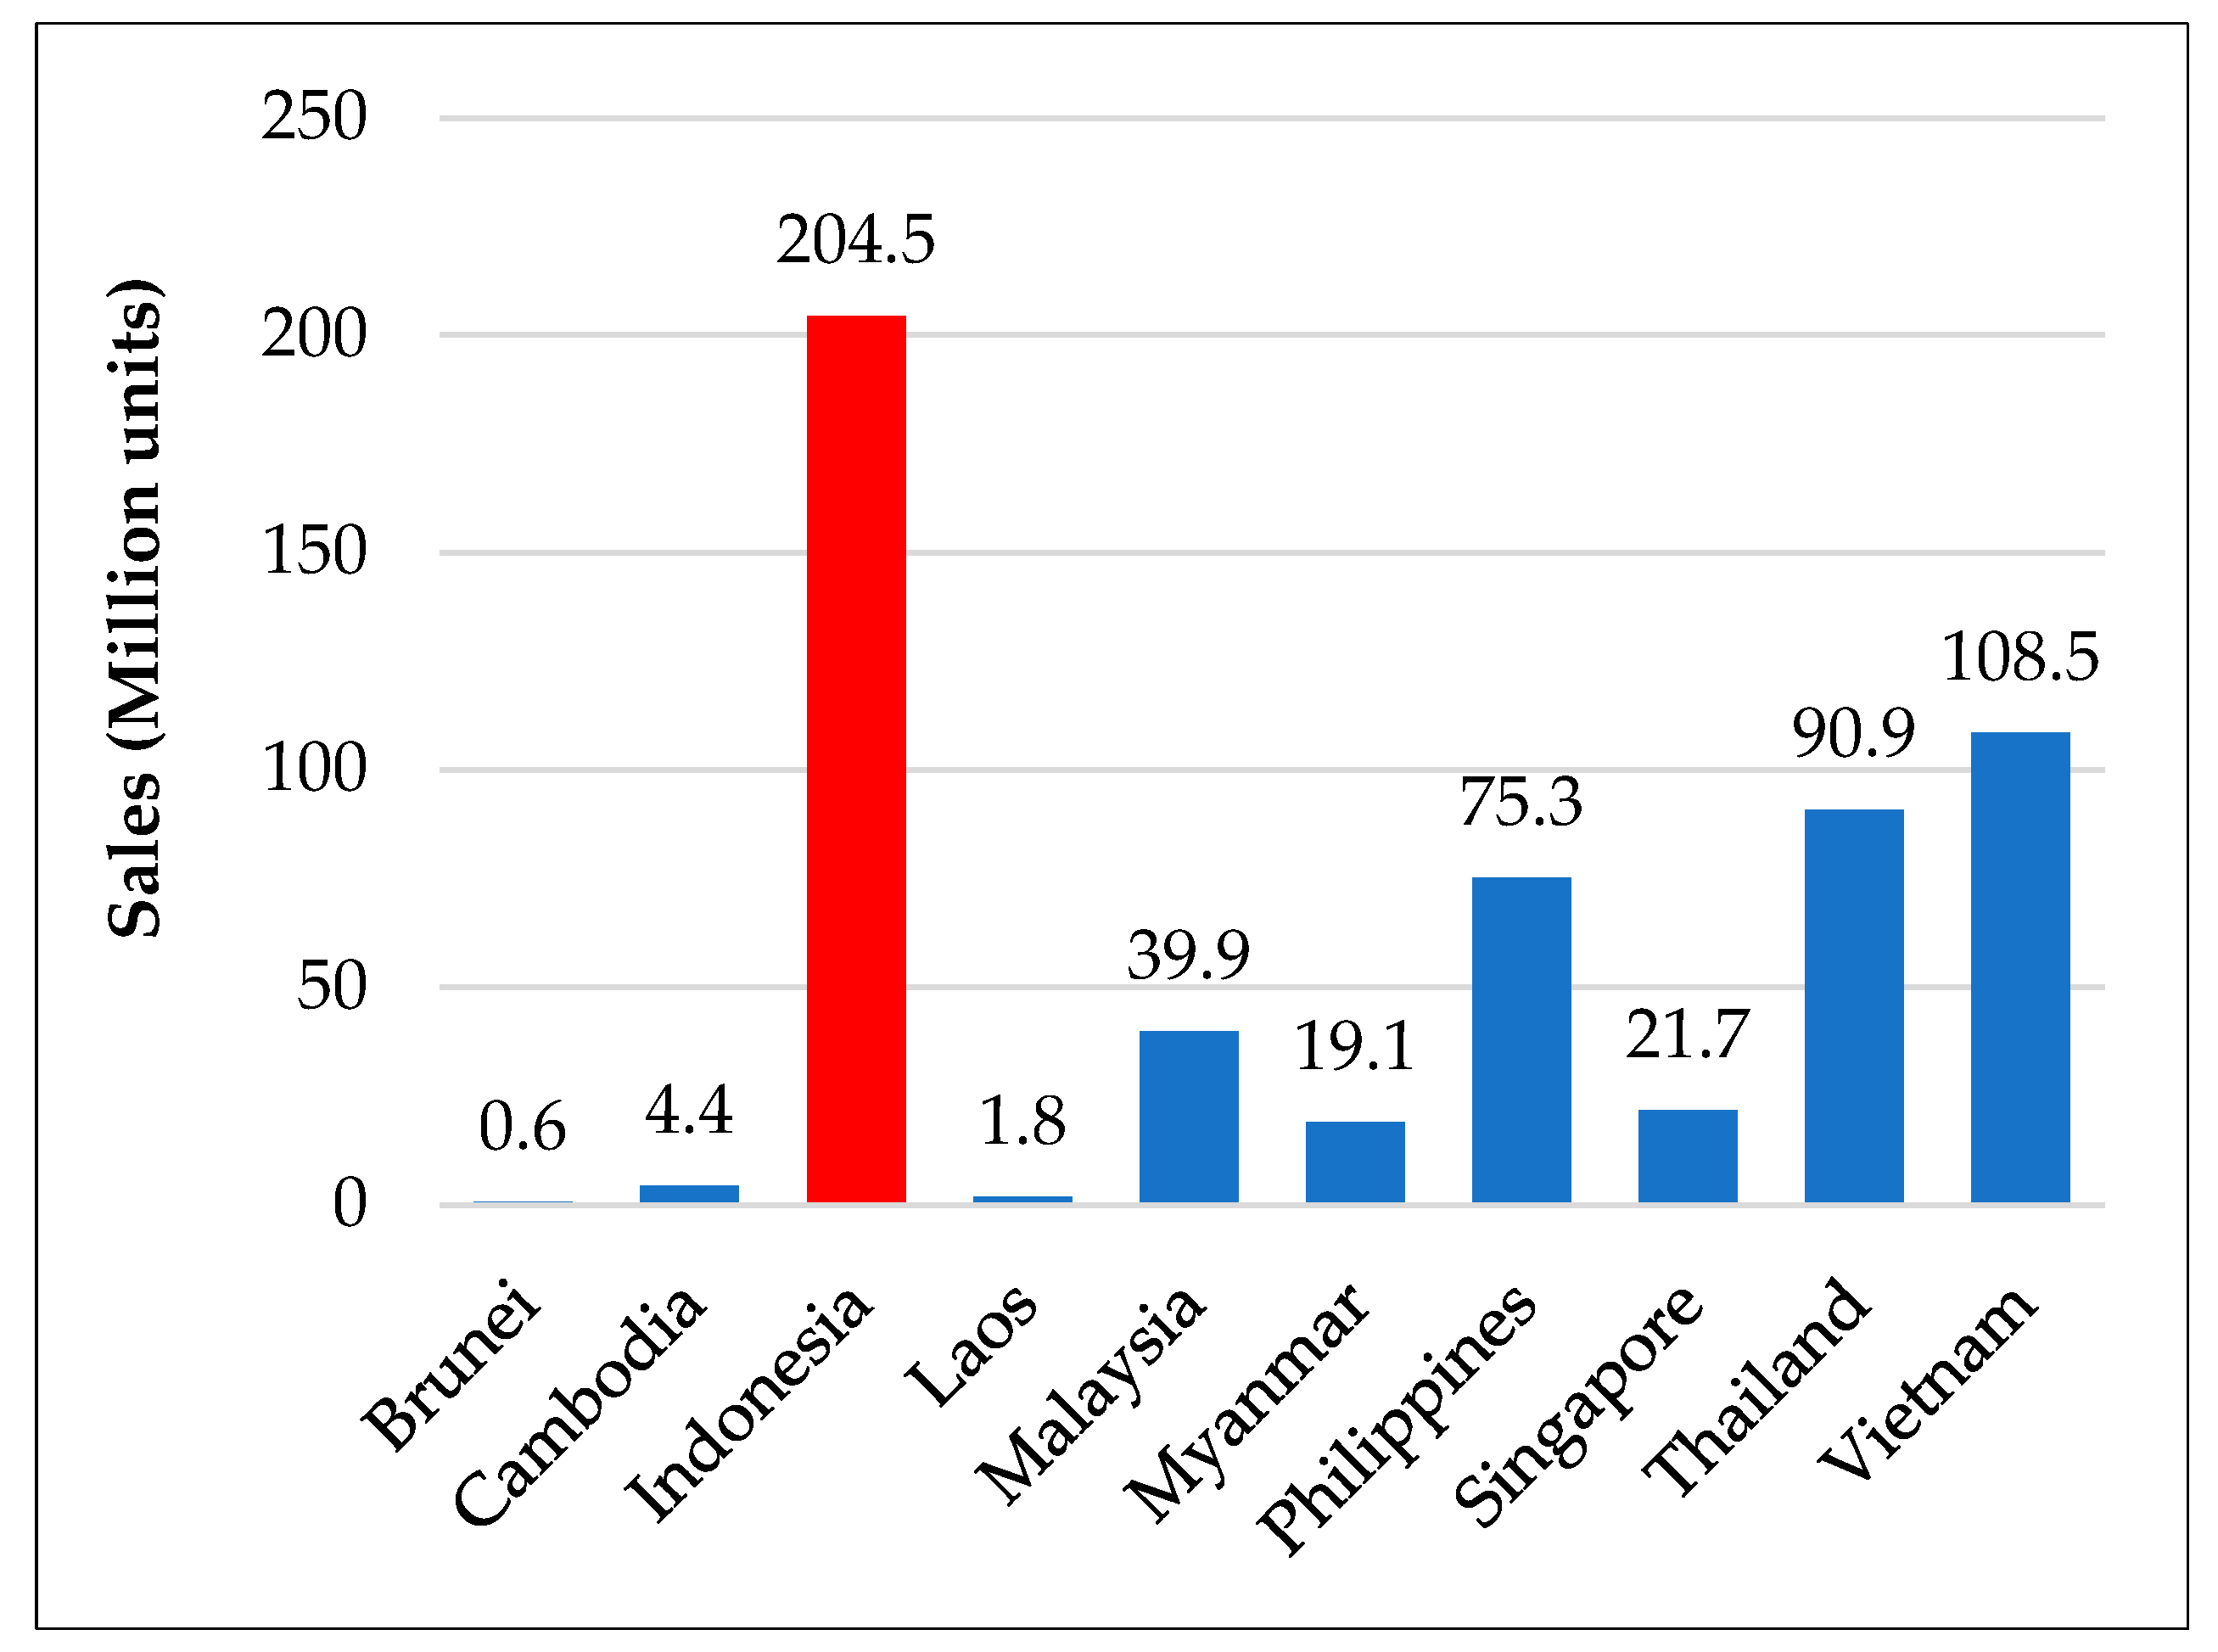
4.2. Comparison with Other Asean Countries

Indonesia is a country which has the largest population in Southeast Asia country (ASEAN). This makes Indonesia have a relatively large market quantity in various fields including electric lighting. Indonesia had the highest sales of lamps among ASEAN countries in 2014, as shown in the following Figure 32.
Figure 33 shows the lighting stock estimation in ASEAN in 2014. Figure 34 shows electricity consumption per capita of ASEAN countries in 2014. Based on the figures, it is known that Indonesia has a relatively smaller per capita electricity consumption compared to several other countries in ASEAN but has the largest market for lamps and lighting stock. This can happen because basically Indonesia has relatively lower economic progress and development compared to several other countries in ASEAN, but because it has the largest population, the need for various commodities including lamps is large. So, from the market side, Indonesia gets the first position as a country in ASEAN with the biggest lighting market.

5. Conclusions

Based on the results of the study, several conclusions can be obtained including:
  • The results of processing from secondary data and observations in this study indicate that electrification and lighting conditions in each region in Indonesia have differences caused by several factors, especially the level of economic progress and conditions of the region, so that based on these factors 5 regional categories can be made including big cities, small cities, villages, islands, and remote areas.
  • Data obtained from CLASP, the government, and associations of lighting companies in Indonesia show that until 2019 the number of lamps that are widely used and the amount of consumption increases from year to year in various regions in Indonesia are energy-saving lamps in the form of LEDs. This information is also confirmed from the results of observations that show the same trend.
  • In developed areas such as big cities, the problem of lighting has led to energy efficiency related to the smart city concept, while for other areas such as rural areas, islands, and remote areas, there are still problems related to electrification, so there are programs made by the Indonesian government, such as the LisDes program, the LTSHE program, the construction of PLTD (Diesel Power Plant) and PLTS (Solar Power Plant), etc., to electrify these areas.
  • Study results from information on the existence and condition of street lighting shows that in big cities the number of street lighting is in accordance with the standard and has even implemented smart lighting, while in other areas the number of street lighting does not satisfy the standard, even the results of observations show that there are areas where street lighting is not installed at all.
  • Study results on the comparison of conditions with other countries in ASEAN show that Indonesia has the largest lamp market compared to other countries in ASEAN due to its large population, even though the level of electricity consumption per capita is relatively low.
This paper can be used as a reference to know the status of lighting technology application in Indonesia. In addition, this paper can be used as the reference for reviewing the lighting application in special countries such as Indonesia.

Author Contributions

Conceptualization, U.K. and L.C. methodology, U.K., A.Z. and L.C.; validation, U.K. and L.C.; formal analysis, U.K., A.Z. and K.M.B.-N.; investigation, U.K., A.Z. and D.H.; writing—original draft preparation, U.K., A.Z., K.M.B.-N., D.H., N.I.S. and L.C.; writing—review and editing, U.K., A.Z., K.M.B.-N., D.H., N.I.S., P.D., G.Z. and L.C.; supervision, U.K. and L.C.; project administration, L.C. and U.K.; funding acquisition, L.C. and U.K. All authors have read and agreed to the published version of the manuscript.

Funding

This research was funded by the Ministry of Europe and Foreign Affairs (MEAE) and the Ministry of Higher Education, Research and Innovation (MESRI) in France (Campus France - Grant number 47145VL), and, in Indonesia by the Ministry of Education, Culture, Research and Technology (KEMDIKBUDRISTEK).

Institutional Review Board Statement

Not applicable.

Informed Consent Statement

Not applicable.

Data Availability Statement

Not applicable.

Acknowledgments

This work is part of PHC Nusantara (Program Hubert Curien) MELIndA (Mastering Efficient Lighting for Indonesian Areas) supported by Campus France (Grant number 47145VL) and funded by the Ministry of Europe and Foreign Affairs (MEAE) and the Ministry of Higher Education, Research and Innovation (MESRI) in France, and, in Indonesia by the Ministry of Education, Culture, Research and Technology (KEMDIKBUDRISTEK).

Conflicts of Interest

The authors declare no conflict of interest. The funders had no role in the design of the study; in the collection, analyses, or interpretation of data; in the writing of the manuscript, or in the decision to publish the results.

References

  1. Simanjuntak, R.; Dupuis, P.; Canale, L.; Sinisuka, N.I.; Zissis, G. Power Quality of Energy Saving Lamps under Wide Voltage Variations. In Proceedings of the International Lighting Association Society Annual Meeting, Vancouver, BC, Canada, 5–9 October 2014. [Google Scholar]
  2. Rahman, A.; Hafeez, A.R.; Faizan, A.; Kanwal, I. The Impact of Domestic Energy Efficiency: Retrofit Study of Lights & Fans Using Deemed Saving Method. In Proceedings of the 2019 3rd International Conference on Energy Conservation and Efficiency (ICECE), Lahore, Pakistan, 23–24 October 2019; pp. 1–7. [Google Scholar] [CrossRef]
  3. Huang, F.; Xu, Y.; Li, Y.; Lei, R.; Hua, Y.; Xu, S. A New High-Efficiency Color Converter Based on the Design of Phosphate Composite for Solid-State Laser Lighting. Available online: https://papers.ssrn.com/sol3/Delivery.cfm?abstractid=4402636 (accessed on 1 March 2023).
  4. Zhao, C.; Bao, S.; Wen, Q.; Xu, L.; Wang, L.; Wang, X.; Sun, X.; Liang, X.; Zhang, L.; Xiang, W. Performance optimization of Ce: YAG sapphire films for high power density white laser-driven lighting applications. Ceram. Int. 2023. [Google Scholar] [CrossRef]
  5. Bertin, K.; Canale, L.; Ben Abdellah, O.; Méquignon, M.-A.; Zissis, G. Life Cycle Assessment of Lighting Systems and Light Loss Factor: A Case Study for Indoor Workplaces in France. Electronics 2019, 8, 1278. [Google Scholar] [CrossRef] [Green Version]
  6. Zissis, G.; Kitsinelis, S. State of art on the science and technology of electrical light sources: From the past to the future. J. Phys. D Appl. Phys. 2009, 42, 173001. [Google Scholar] [CrossRef]
  7. Indonesia Statistical Bureau (BPS). Statistik Indonesia, Statistical Yearbook of Indonesia 2021; Indonesia Statistical Bureau (BPS): Central Jakarta, Indonesia, 2022; ISSN 0126-2912. [Google Scholar]
  8. Ministry of Energy and Mineral Resources. 2020 Indonesia Electricity Statistic, 34 ed.; Ministry of Energy and Mineral Resources: Central Jakarta, Indonesia, 2021.
  9. Yusrizal. Performance of Energy Saving Lamps on Power Quality and Luminous Properties Under Voltage Decreasing from 240 V to 100 V. In Proceedings of the 2015 IEEE Industry Applications Society Annual Meeting, Addison, TX, USA, 18–22 October 2015. [Google Scholar]
  10. Muhamad, W.N.W.; Zain, M.Y.M.; Wahab, N.; Aziz, N.H.A.; Kadir, R.A. Energy efficient lighting system design for building. In Proceedings of the International Conference on Intelligent System, Modelling and Simulation, 27–29 January 2010; pp. 282–286. [Google Scholar]
  11. Cathala, J. Georges Claude. Nature 1960, 187, 829–830. [Google Scholar] [CrossRef] [Green Version]
  12. Jack, A.G.; Et Vrehen, Q.H.F. Progress in fluorescent lamps. Philips Tech. Rev. 1986, 42, 342–351. [Google Scholar]
  13. Jewkes, J.; Sawers, D.; Stillerman, R.; Jewkes, J.; Sawers, D.; Stillerman, R. Fluorescent Lighting. In The Sources of Invention; Palgrave Macmillan: London, UK, 1969; pp. 252–254. [Google Scholar]
  14. Abbaspour, M.; Jahanikia, A.H. Power Quality Consideration in the Widespread Use of Compact Fluorescent Lamps. In Proceedings of the Electrical Power Quality and Utilisation (EPQU), Lodz, Poland, 15–17 September 2009; Volume 10, pp. 1–6. [Google Scholar]
  15. Canale, L. la LED, chemins croisés entre éclairage et radio télécommunications. La Rev. De L’électricité Et De L’électronique 2020, 1, 40–46. [Google Scholar]
  16. CLASP Report. Indonesia Lighting Market Study and Policy Analysis. 2020. Available online: https://www.clasp.ngo/research/all/indonesia-market-study-and-policy-analysis-for-lighting/ (accessed on 25 August 2022).
  17. Taguchi, T. Present Status of White LED Lighting Technologies in Japan. J. Light Vis. Environ. 2003, 27, 131–139. [Google Scholar] [CrossRef] [Green Version]
  18. Taguchi, T. Developing White LED Lighting Systems and Its Technological Roadmap in Japan. J. Light Vis. Environ. 2006, 30, 177–182. [Google Scholar] [CrossRef] [Green Version]
  19. Kasuga, T.; Agoh, T.; Enomoto, A.; Fukuda, S.; Furukawa, K.; Furuya, T.; Haga, K.; Harada, K.; Hiramatsu, S.; Honda, T.; et al. Status of R&D efforts toward the ERL-based future light source in Japan. In Proceedings of the 2007 IEEE Particle Accelerator Conference (PAC), Albuquerque, NM, USA, 25-29 June 2007; pp. 1016–1018. [Google Scholar] [CrossRef]
  20. De Almeida, A.; Santos, B.; Paolo, B.; Quicheron, M. Solid state lighting review–Potential and challenges in Europe. Renew. Sustain. Energy Rev. 2014, 34, 30–48. [Google Scholar] [CrossRef]
  21. Al Dakheel, J.; Tabet Aoul, K.; Hassan, A. Enhancing green building rating of a school under the hot climate of UAE; renewable energy application and system integration. Energies 2018, 11, 2465. [Google Scholar] [CrossRef] [Green Version]
  22. Montoya, F.G.; Peña-García, A.; Juaidi, A.; Manzano-Agugliaro, F. Indoor lighting techniques: An overview of evolution and new trends for energy saving. Energy Build. 2017, 140, 50–60. [Google Scholar] [CrossRef]
  23. Guanglei, W.; Ngarambe, J.; Kim, G. A Comparative Study on Current Outdoor Lighting Policies in China and Korea: A Step toward a Sustainable Nighttime Environment. Sustainability 2019, 11, 3989. [Google Scholar] [CrossRef] [Green Version]
  24. Collins, K.M.; Onwuegbuzie, A.J.; Jiao, Q.G. Prevalence of Mixed-methods Sampling Designs in Social Science Research. Evaluation Res. Educ. 2006, 19, 83–101. [Google Scholar] [CrossRef]
  25. The government of DKI Jakarta Province. Panduan Pengguna Bangunan Gedung Hijau Jakarta Berdasarkan Peraturan Gubernur No. 38/2012 Vol 3. Sistem Pencahayaan. 2012. Available online: https://peraturan.bpk.go.id/Home/Details/232359/pergub-prov-dki-jakarta-no-60-tahun-2022 (accessed on 17 November 2022).
  26. IIEC. Asean Regional Efficient Lighting Market Assessment. 2014. Available online: https://www.lites.asia/downloads/regional-market-assessment (accessed on 5 September 2022).
Figure 1. Electrification ratio of Indonesia in 2022 [7].
Sustainability 15 06283 g001
Figure 2. Total historical lamp shipments by technology in Indonesia 2012–2019 [16].
Sustainability 15 06283 g002
Figure 3. Number of lamps and expenditure incurred for import lamp in Indonesia 2012–2019 [16].
Sustainability 15 06283 g003
Figure 4. Number of lamp export in Indonesia 2012–2019 [16].
Sustainability 15 06283 g004
Figure 5. Total shipments forecast by technology [16].
Sustainability 15 06283 g005
Figure 6. Methodology of survey.
Sustainability 15 06283 g006
Figure 7. Electricity consumption per capita for each province in Indonesia [7].
Sustainability 15 06283 g007
Figure 8. Electricity consumption for some cities in East Java [7].
Sustainability 15 06283 g008
Figure 9. GDRP vs. electricity consumption for each province in Indonesia. Each dot represents a certain province in Indonesia.
Sustainability 15 06283 g009
Figure 10. Total number of PLN customers in DKI Jakarta 2016–2020.
Sustainability 15 06283 g010
Figure 11. Electricity power used by respondents in big cities.
Sustainability 15 06283 g011
Figure 12. Priority on choosing lamp from respondents in big cities.
Sustainability 15 06283 g012
Figure 13. Preference of lamp types of respondents in big cities.
Sustainability 15 06283 g013
Figure 14. Purpose of lighting use of respondents in big cities.
Sustainability 15 06283 g014
Figure 15. Challenges to use ESL of respondents in big cities.
Sustainability 15 06283 g015
Figure 16. Street lighting existence in big cities.
Sustainability 15 06283 g016
Figure 17. Electricity power used by respondents in small cities.
Sustainability 15 06283 g017
Figure 18. Purpose of lighting use of respondents in small cities.
Sustainability 15 06283 g018
Figure 19. Challenges to use ESL of respondents in small cities.
Sustainability 15 06283 g019
Figure 20. Priority on choosing lamp from respondents in small cities.
Sustainability 15 06283 g020
Figure 21. Preference of lamp types of respondents in small cities.
Sustainability 15 06283 g021
Figure 22. Street lighting existence in small cities.
Sustainability 15 06283 g022
Figure 23. Comparison of electricity power class.
Sustainability 15 06283 g023
Figure 24. Comparison of priority on choosing lamp.
Sustainability 15 06283 g024
Figure 25. Comparison of preference of lamp types.
Sustainability 15 06283 g025
Figure 26. Electricity power used by respondents in village areas.
Sustainability 15 06283 g026
Figure 27. Purpose of lighting use of respondents in village areas.
Sustainability 15 06283 g027
Figure 28. Challenges to use ESL of respondents in village areas.
Sustainability 15 06283 g028
Figure 29. Priority on choosing lamp from respondents in village areas.
Sustainability 15 06283 g029
Figure 30. Preference of lamp types of respondents in village areas.
Sustainability 15 06283 g030
Figure 31. Street lighting existence in village areas.
Sustainability 15 06283 g031
Figure 32. Lamp sales estimation in ASEAN 2014 [26].
Sustainability 15 06283 g032
Figure 33. Lighting stock estimation in ASEAN 2014 [26].
Sustainability 15 06283 g033
Figure 34. Electrical consumption in ASEAN [26].
Sustainability 15 06283 g034
Table 1. Lamp comparison.
Light SourceEfficacy (lm/W)CRILifetime (h)
Incandescent14.41001000
Compact fluorescent 518010,000
High-pressure mercury345024,000
High-pressure sodium
Sodium vapor lamp
108
100
22
−44
24,000
18,000
LED130–220 >8050,000
Table 2. Minimum requirements of CFL.
CriteriaMinimum Requirements
Measured powerRange to between +5% and −10%
Maximum total harmonic5%
Lumen (after 2000 h)≥80% Claimed value
Lifetime6000 h
Table 3. Minimum requirements of CFL efficacy.
Power (Watt)Efficacy (lm/W)
1 Star2 Stars3 Stars 4 Stars
≤8<3434–4344–53≥54
8–15<3838–4748–57≥58
16–25<4242–5152–61≥62
26–60<4646–5556–65≥66
Table 4. Electrification ratio of Indonesia 2015–2022 [8].
YearNumber of
Households
Number of
Customers
Electrification Ratio (%)
201565,669,19757,983,04888.3
201666,489,40960,612,00991.16
201767,228,57364,105,54995.35
201868,082,15366,921,70598.3
201972,713,60671,903,45898.89
202075,078,68174,481,75599.2
202177,859,91577,430,76799.45
2022Not available yetNot available yet99.63
Table 5. Definition of each regional category.
NoRegional
Categories
Definition
1Big CitiesCities with per capita electricity consumption more than per capita national electricity consumption.
2Small CitiesCities with per capita electricity consumption less than per capita national electricity consumption. In Indonesia, the number of cities that are categorized as small cities is more than big cities.
3VillagesAreas which have the natural appearance of agriculture or other natural resource and the residents have fully electrified. Usually, the residents of a village have small electricity consumption.
4Remote AreaAreas that are still not electrified or have received electricity but with limited capacity. Usually remote areas located in hard-to-reach areas such as forest areas, mountains, etc.
5IslandsAn area consisting of many small islands. Generally, Islands are in the form of a village whose residents work as fishermen, but there are some Islands that can be categorized as small cities.
Table 6. Example and comparison condition of big cities and small cities.
ComparisonExample of Big Electricity Consumption Cities (Big Cities)Example of Small Electricity Consumption Cities (Small Cities)
South JakartaSurabayaBandungGarutPamekasanPonorogo
Consumption (MWh/Capita)3.232.931.680.330.260.3
GDRP (Million Rupiahs)272190.91132218.923.5
Area ( km 2 )154.3326.8167.33065792.31372
Total Population (people)2,226,8002,904,7512,510,1032,636,637850,057949,320
Density (people/ km 2 )14,431888815,0038601072692
Table 7. Standard of maximum lighting power in dki Jakarta for residence and office [25].
Type of RoomMaximum Power (W/m2)
Residence
Terrace3
Guest Room7
Dining Room7
Workspace7
Bedroom7
Bathroom7
Kitchen7
Garage3
Office
Receptionist’s Room13
Director’s Room13
Workspace12
Computer Room12
Meeting Room12
Drawing Space20
Archive Warehouse6
Active Archive Space12
Emergency Stairs4
Parking Lot4
Table 8. Electrification ratio of Indonesia 2015–2020 [7].
ParameterIndonesiaBig City
(Jakarta)
Small City
(Garut)
Electrification ratio99.4%100%99.3%
MWh/Capita1.093.230.33
ESL use (%)86.26%82.65%77.21%
Area (km2)1.9 million664.013.065
Road Length (Km)544,4746,432828
Number of street lighting (Real)-246,3478000
(6500 broken)
Minimum number of street lighting (SNI)9,074,567107,20013,800
Table 9. General comparison for each categorized region.
ComparisonBig CitiesSmall CitiesRural AreasIsland/ArchipelagoRemote Area
Condition of lighting useThe lights used by residents are already dominant with LED. Street lighting completely installed on all roads with saving energy and monitoring system development.The lights used by residents are already dominant with LED. Street lighting only available on certain roads.In general, ESL has been widely used, even though there are some villages where the percentage of ESL use is still low.BPS data show that the province located in archipelago area already use ESL with high percentage.Remote areas which had got LTSHE program use 3 Watt LEDs. However, some remote areas still use traditional lights such as teplok lamp, torches, flashlights, etc.
ProblemImplementation of lighting limit standards is still not yet optimal.Number of street lighting that does not meet the standard.The absence of street lighting.The challenge in electrification because it is blocked by intercontinental sea.Difficulties in electrification due to limited access and infrastructure.
Proposed Alternative SolutionCreation of a special investigation team to do direct observation as a first step and then develop the smart home system to monitor the use of lamps and other electric equipment.Making solar street lighting with IoT for condition monitoring.A special budget should be provided by the government for making street lights in rural areas.Comparative study between the use of submarine cables and small-scale diesel/solar power plant.Improvement of infrastructure in general and acceleration of electrification program.
Table 10. Percentage of ESL use in Indonesia based on BPS data.
ProvincePercentage of Energy Saving Lamp Installed at HousePercentage of ESL Based on Region
Not PresentLess Than HalfMore Than HalfAll LampsUrbanRuralUrban + Rural
Aceh15.5416.068.4859.9288.0882.6584.46
Sumatera Utara11.178.117.2873.4489.7787.6688.83
Sumatera Barat9.008.9010.5171.5993.0689.0491.00
Riau16.1714.7512.4956.5990.8479.2583.83
Jambi8.1210.3812.0169.4885.1095.0591.88
Sumatera Selatan10.3710.8412.7566.0388.8690.0589.63
Bengkulu3.687.3811.0777.8692.9797.9596.32
Lampung7.9213.6513.1365.3090.4392.8092.08
Kep. Bangka Belitung8.012.886.0383.0993.9989.3191.99
Kepulauan Riau7.118.3010.9673.6393.4485.5992.89
DKI Jakarta7.2712.9319.7460.0692.730.0092.73
Jawa Barat13.0614.1318.5854.2387.3685.5386.94
Jawa Tengah11.0212.2515.0861.6590.0087.9488.98
DI Yogyakarta8.559.5817.2564.6392.3888.5791.45
JawaTimur13.2916.9319.3050.4888.1685.0286.71
Banten11.299.6223.2255.8690.6183.4688.71
Bali10.695.3413.9070.0688.8090.5889.31
Nusa Tenggara Barat9.036.018.0776.8992.0789.8690.97
NTT20.526.398.7064.3989.0176.0679.48
Kalimantan Barat7.376.5111.6774.4596.9090.2392.63
Kalimantan Tengah7.216.056.4980.2597.3189.5592.79
Kalimantan Selatan3.137.5012.6576.7297.6996.1296.87
Kalimantan Timur12.458.7115.5463.3084.5794.0187.55
Kalimantan Utara19.817.4413.3259.4380.8779.0380.19
Sulawesi Utara13.7614.489.5262.2491.1180.3786.24
Sulawesi Tengah18.278.8810.0862.7791.4777.2881.73
Sulawesi Selatan11.809.6611.7966.7486.9489.2088.20
Sulawesi Tenggara12.137.139.1471.6191.8585.6287.87
Gorontalo16.0712.8211.7759.3486.3981.9683.93
Sulawesi Barat15.379.4112.5862.6495.3682.0184.63
Maluku26.847.987.5657.6279.6967.4473.16
Maluku Utara19.8010.2411.5158.4574.0282.7680.20
Papua Barat15.309.196.4469.0787.7482.2984.70
Papua33.545.945.3655.1679.5759.5466.46
Indonesia11.9412.0415.1760.8689.3486.3688.06
Disclaimer/Publisher’s Note: The statements, opinions and data contained in all publications are solely those of the individual author(s) and contributor(s) and not of MDPI and/or the editor(s). MDPI and/or the editor(s) disclaim responsibility for any injury to people or property resulting from any ideas, methods, instructions or products referred to in the content.

