Article

Evaluation of the Thermal Environment of Xi’an Subway Stations in Summer and Determination of the Indoor Air Design Temperature for Air-Conditioning

1
School of Civil Engineering, Chang’an University, Xi’an 710061, China
2
China Railway First Bureau Group Electrical Engineering Co., Ltd., Xi’an 710038, China
*
Author to whom correspondence should be addressed.
Sustainability 2023, 15(7), 6111; https://doi.org/10.3390/su15076111
Submission received: 7 March 2023 / Revised: 23 March 2023 / Accepted: 24 March 2023 / Published: 1 April 2023
(This article belongs to the Section Energy Sustainability)

Abstract

:
Taking two typical subway stations in Xi’an as the research objects, the thermal environment and human thermal comfort of the station in summer were studied based on field measurements and a questionnaire survey. Based on the relative warmth index (RWI), the passengers’ thermal comfort during the process from entering to leaving the station under the operating temperature and the designed temperature was also analyzed. Moreover, the RWI method was modified based on the comparative analysis of the predicted results from the RWI and questionnaire methods. Then based on the revised RWI method, the suitable indoor air design temperature in Xi’an subway stations was discussed. The research results revealed that if the air-conditioning system was operated at the design temperature suggested by Code GB 50157-2013, it cannot meet the thermal comfort needs of most passengers. Only when the temperature of the platform was at least 1 °C lower than that in the station hall did the passengers obtain temporary relative thermal comfort. According to the control proportion that 25% of passengers need a cooler environment, the indoor air design temperature for air-conditioning in Xi’an subway stations should be 25.5 °C in the station hall and 24.5 °C on the platform.

1. Introduction

With the rapid development of urban rail transit, subways have been vigorously constructed by the government and widely used by people by the virtue of their safety, efficiency, environmental protection, and large passenger capacity. A subway station is an underground space for personnel turnover, and its thermal environment directly affects passengers’ thermal comfort. According to incomplete statistics in China, the subway runs for 15 to 20 h a day in different cities [1]. Most passengers take the subway two times a day or more [2]. Passengers’ dwell time in the station hall ranges from 1 to 10 min. Passengers’ dwell time on the station platform ranges from 2 to 6 min [3]. The thermal environment in subway stations is closely related to the quality of life.
In the design of subway engineering, the ventilation and air-conditioning system is an essential part of the whole subway engineering, not only providing a comfortable environment for passengers but also necessary environmental conditions for the operation of subway trains and equipment [4]. The development of rail transit alleviates the traffic pressure in the process of urbanization to a certain extent; however, the energy consumption during its operation is quite astonishing. The energy consumption of subway operations mainly involves electricity used for traction and ventilation and air-conditioning system electricity [5]. According to statistics, the energy consumption of ventilation and air-conditioning system accounts for about 30–50% of the total energy consumption of the entire subway station [6,7,8]. Approximately 50% of the energy consumption of subway operations in southern Chinese cities is the energy consumption of the ventilation and air-conditioning system, and the energy consumption of ventilation and air-conditioning systems in northern Chinese cities also reaches 1/3rd of the total energy consumption in subway operations [9,10,11]. Zhao [12] took Zhongjiekou Station of Wuhan Subway Line 2 in China as the research object and used EnergyPlus to establish a simplified physical model of the station and a model of ventilation and air-conditioning systems, simulating the annual energy consumption of subway stations. The results show that the energy consumption of ventilation and air-conditioning systems accounts for about 46% of the total energy consumption of subway stations. The standard of indoor air design temperature for air-conditioning directly affects the designed load of the air-conditioning system, which in turn affects the initial investment, energy consumption, and operational cost of the environmental control system of the subway station. Therefore, rationally setting the indoor air design temperature standard for air-conditioning in subway stations can provide passengers with a comfortable thermal environment and achieve the goal of saving investment and energy.
The determination of indoor air design parameters for comfort air-conditioning is usually based on the thermal comfort requirements of occupants. The most widely used thermal comfort evaluation indices are the predicted mean vote (PMV) and predicted percentage of dissatisfied (PPD) indices [13]. The PMV is an index that predicts the mean value of the votes of a large group of persons on the 7-point thermal sensation scale. The PPD is an index that establishes a quantitative prediction of the percentage of thermally dissatisfied people determined by PMV. The international thermal comfort standard ISO7730 proposes the level standards of thermal comfort in the comfort range with PMV as an index. It divides the desired thermal environment for any space into three categories, A (0.2 < PMV < +0.2), B (0.5 < PMV < +0.5), and C (0.7 < PMV < +0.7), where Category A has the highest level of thermal comfort [13]. Based on the thermal comfort level requirements of the space, the indoor air design parameters of the space can be determined. The thermal comfort level based on PMV is adopted by many thermal comfort standards and air-conditioning design standards to determine the acceptable thermal environment and indoor air design parameters. For example, the ASHRAE thermal comfort zone is determined by the PMV range of Category B comfort level [14].
However, the PMV index is suitable for the thermal comfort evaluation of occupants in steady-state thermal environments, but not for dynamic thermal environments. A subway station is a transitional space for passengers to stay for a short time while waiting. It connects two spaces with different thermal environment parameters such as temperature and humidity. The thermal sensations of passengers in this space when they stay there for a short time and change their activity states are different from those when they stay stationary for a long time in the same space. Therefore, passengers’ requirements for thermal comfort environment parameters of the subway station greatly differ from those of non-transitional space. The indoor air design parameters and the determination methods for a steady thermal environment of conventional buildings such as office buildings, residential buildings, and commercial buildings are not applicable to subway stations [15,16].
Therefore, it is necessary to propose the thermal comfort index of the human body to this type of transition space to guide the determination of the air-conditioning design parameters of this type of space. Subway construction in European and American countries started earlier, and research on thermal comfort standards for subway stations has also been investigated earlier. For the thermal environment of subway stations in summer, on the basis of the theory of the relative strain index derived by Lee and Henschel [17], and in combination with the experimental results on comfort tests sponsored by the American Society of Heating, Refrigerating, and Air-conditioning Engineers (ASHRAE), the US Department of Transportation proposed the relative warmth index (RWI) to evaluate passengers’ thermal comfort in subway environment and determine the indoor design conditions for air-conditioning in subway stations and trains [18]. In China, subway construction started in 1967, and in recent years, it has developed rapidly. Studies on the standards for thermal environments in subway stations were also carried out successively. In 2002, Fan et al. [19] used the RWI method to calculate the RWI values for the designed temperature in the existing subway stations in large cities in China (Beijing, Shanghai, Nanjing, Guangzhou, Shenzhen, and Chongqing). They also discussed the designed temperature and concluded that the design temperature in the station hall should be at least 1.7 °C lower than that of the outdoors. In the same year, Wang et al. [20] took the subway stations to be constructed in Chengdu as the research object and calculated the variation laws for the RWI values of passengers in the process of entering and leaving the station. They found that if the designed temperatures in the hall and platform of the Chengdu subway stations were designed according to the Code for Design of Subway (GB 50157-92) [21], most passengers would feel uncomfortable. Therefore, it is suggested that the temperature differences between the station hall and outdoors should be increased. In the same year, Liu et al. [22] used the RWI method to evaluate and analyze the thermal environment under the designed temperature in subway stations in Shenzhen in summer and also concluded that passengers would fail to obtain temporary thermal comfort most of the time if the indoor air design temperature is selected according to the Code for Design of Subway (GB 50157-92) [21]. In 2008, Yin et al. [23] used the RWI method to discuss the control temperature for air-conditioning operation in Tianjin subway stations and proposed that the control temperature of air-conditioning operation in Tianjin subway stations should vary with the change in outdoor temperature and should not be set at a fixed value. In 2009, based on measured data on air temperature and velocity in subway stations in Guangzhou, Xin et al. [24] analyzed the thermal environment in subway stations in Guangzhou by the RWI method and found that if the designed temperature was determined according to the Code for Design of Subway (GB 50157-2003) [25], passengers could not achieve “temporary comfort” for part of the time. Therefore, it was proposed that the method to control the operating temperature of air-conditioning in the subway station should be determined according to the hourly outdoor air temperature and the difference in the relative warmth index. Using the method of the difference value of the relative warmth index, the operation control temperature of Xi’an subway stations under typical meteorological conditions of Xi’an City was also calculated. However, the method proposed in Xin’s study [24] only satisfied the condition that the RWI values for different control units decreased in sequence, and it is believed that the temporary thermal comfort could be satisfied by decreasing the temperature. Nevertheless, according to the calculated data, the RWI value was >0.2 for a very long time, corresponding to a warm feeling. In formulating thermal comfort standards for subway stations, as to whether passengers can achieve better thermal comfort as long as the RWI values for different control units decrease progressively, or whether it is necessary to control the RWI value for the station hall and platform within a certain range, no unified conclusion has been obtained yet, and further research should be conducted in combination with a field test and questionnaire survey on thermal sensation. In 2016, Zhu et al. [26], taking a subway station in Nanjing as the measured object and in combination with the calculated values and subjective survey results on thermal comfort, found deviation in using the RWI index to evaluate the thermal environment of subway stations in hot and humid areas.
The current research mainly focuses on using the RWI index to determine the indoor air design temperature for the air-conditioning system in subway stations, thus suggesting the values of design parameters for subway stations. However, only a few practical measurement studies have been conducted on the practical application effect. Whether the RWI method proposed in the American Subway Design Manual [18] is applicable to the environment of the subway stations in China remains to be further investigated and demonstrated. At present, there are many theoretical studies on the designing stage, but fewer practical measurement studies after system operation. Therefore, in this study, taking two typical subway stations in Xi’an (34.26° N, 108.95° E), China as the research object, through a field test and questionnaire survey and in combination with the RWI computational method analysis, the thermal environment of the subway stations in Xi’an was evaluated and analyzed, and the appropriate indoor air design temperature for air-conditioning in the subway stations in Xi’an in summer was also discussed, which provide suggestions on determining the indoor air design temperature for air-conditioning in Xi’an subway stations.

2. Current Status of Indoor Air Design Temperature for Air-Conditioning in Chinese Subway Stations in Summer

At present, the determination of indoor air design temperature for air-conditioning in subway stations in summer by relevant Chinese subway engineering design is mainly based on the relevant provisions in the current Code for Design of Subway (GB 50157-2013) [27] in China. In determining the design parameters for air-conditioning in an underground subway station in summer, this design code considers its particularity as the underground transition zone for a short stay and determines the indoor air design temperature mainly from the perspective of “temporary comfort” according to the outdoor design dry-bulb temperature for air-conditioning. In this code, it is stipulated that the outdoor design dry/wet bulb temperature for summer air-conditioning of public areas in the underground subway stations should be set as the average annual dry/wet bulb temperature that is not guaranteed for 30 h per year during the evening peak load of the subway in summer of the last 20 years. For summer air-conditioning of subway stations, the indoor air design temperature in the public areas of the station hall should be 2–3 °C lower than the outdoor air design dry-bulb temperature and should not exceed 30 °C. The indoor air design temperature in the common area of the platform should be 1–2 °C lower than that in the station hall and the relative humidity should be in the 40–70% range. The subway environment is a densely populated public place for a short stay. When passengers complete a whole riding process, from entering the station, waiting for the train, to getting on the train, they stay at the station only for 3–5 min, get off the train, and leave the station within about 3 min, and spend the remaining 3/4th of the time in carriages. Therefore, the air-conditioning in subway stations is different from general comfortable air-conditioning. In the code, it is considered that since passengers spend a very short time in the station hall and on the platform, only by passing and staying there for a shorter time, in order to save energy, it is enough just to guarantee that passengers feel cooler when they enter the subway station from the outdoor and satisfy their needs for “temporary comfort”. In this specification, it is held that people have a distinct sense of temperature change only when the temperature difference is more than 2 °C; thus, when the indoor air design temperature in the station hall is 2 °C lower than that outdoors, it can satisfy the needs for “temporary comfort”.
Guo et al. [28] elaborated on the determination of the indoor air design temperature for air-conditioning in subway stations in summer in Xi’an. This study indicates that for the design of an environmental control system for Xi’an Metro Line 2, through the analysis of meteorological data in the last 20 years, during the evening peak load (17:00–18:00) of the Xi’an subway in summer in the last 20 years, the average annual dry-bulb temperature of 30 h was not guaranteed to be 33.4 °C. Thus, the outdoor design dry-bulb temperature for summer air-conditioning of Xi’an subway stations was determined to be 33.4 °C. Based on this, the designed air temperature for the public area in the station hall for Xi’an Metro Line 2 was determined to be 30 °C, and that for the public area on the platform was 2 °C lower than the station hall, i.e., 28 °C, with the relative humidity controlled within the range of 40–70%.

3. Materials and Methods

3.1. Tested Stations

In this study, two typical underground stations along Xi’an Metro Line 2, including Xiaozhai Station with a larger flow of passengers, and Weiqunan Station, with a smaller flow of passengers, were selected as the objects of field measurement. Xiaozhai Station is located in the Xiaozhai business circle in Xi’an and is the transfer station for Xi’an Metro Lines 2 and 3. It is a typical representative of Xi’an metro station with a larger flow of passengers, denoted as Station A in this study. Weiqunan Station is the terminal station of Xi’an Metro Line 2 and is a typical representative of Xi’an metro station with a lower flow of passengers, denoted as Station B in this study. Both stations are underground stations that are almost completely enclosed and are connected to the outside only through entrances and exits that open on the ground. Both subway stations are equipped with all-air systems to meet the cooling demand in summer. Air diffusers are used as air supply inlets. The air distribution employs the form of down-supply and up-return. Considering different temperatures, relative humidities, airspeeds, and personnel activities in different areas, the subway station was divided into three environment control elements: entry and exit, station hall, and platform.

3.2. Research Method and Procedures

In this study, a combination of a field test, questionnaire survey, theoretical calculation, and analysis was adopted.

3.2.1. Field Test

In this test, researchers, responsible for the field test and questionnaire survey at Stations A and B for one week (19 July 2016–25 July 2016), were divided into Groups A and B, respectively. According to the characteristics of passengers’ travel time in Xi’an, field tests and questionnaire surveys were carried out from 7:00 a.m. to 22:00 p.m. The test parameters were the thermal environment parameters, mainly including air dry-bulb temperature, humidity, and indoor air velocity, affecting human thermal comfort. The temperature and humidity testing instruments were placed at a height of 1.5 m on the load-bearing pillar in the center of the subway station hall and platform, and at the outdoor locations where the station entrance and exit were shaded and could realize effective natural ventilation. The instrument monitored and recorded data continuously and automatically. During this process, the testers held air velocity testers in their hands and measured the air velocity once an hour at each of the 10 test points selected in the station hall and platform, respectively. The values were averaged in the calculation. The instruments for testing and related technical parameters instrument are listed in Table 1.

3.2.2. Questionnaire Survey

Air-conditioning systems in subway stations mainly serve passengers, and the design of the optimal thermal environment should be based on the thermal comfort of the passengers. The comfort of the passengers is mainly evaluated by their subjective sensations. A questionnaire survey is a simple, direct, and reliable evaluation method. However, even in the same thermal environment, passengers can still make different judgments on the environment, i.e., there are subjective differences. In order to obtain statistical rules, 800 questionnaires, including 400 questionnaires for Station A and Station B each, were issued, and passengers entering the stations were randomly selected in the station hall and platform for the survey. It was a voluntary process. Those who were available and were also willing to fill out the questionnaire participated in the survey. Appendix A shows the questionnaire used in this study. The contents of the questionnaires are as follows: (1) the subjects’ background information; (2) the subjects’ clothing quantity; (3) the subjects’ thermal sensation: the ASHRAE 7-point scale of thermal sensation (hot, warm, slightly warm, neutral, slightly cool, cool, and cold) was used for subjective voting; (4) the subjects’ sensation of air velocity: the subjects’ sensation of indoor air velocity were described using stuffy, slightly stuffy, comfortable and breezeless, comfortable and windy, and uncomfortably windy; (5) the subjects’ thermal comfort: four indices including comfortable, slightly uncomfortable, uncomfortable, very uncomfortable, and unbearable were used to represent the subjects’ satisfaction degree for thermal comfort. After the questionnaire survey was completed, according to statistics, the number of valid questionnaires collected from Stations A and B was 369 and 399, respectively.

3.2.3. Theoretical Analysis

Based on the measured data on the thermal environment outdoors, in the station hall, on the platform, and the thermal comfort evaluation index RWI for transition space, the RWI values were calculated to evaluate the human thermal comfort for each environment control unit in the subway stations. The predicted results of the RWI method were compared to the results from the questionnaire survey to analyze the differences and revise the RWI method. Based on this, according to the revised RWI method, the appropriate indoor air design temperature for summer air-conditioning of Xi’an subway stations was investigated.

4. Results of Field Test and Questionnaire Survey

4.1. Temperature and Humidity Distribution of Outdoor and Subway Station

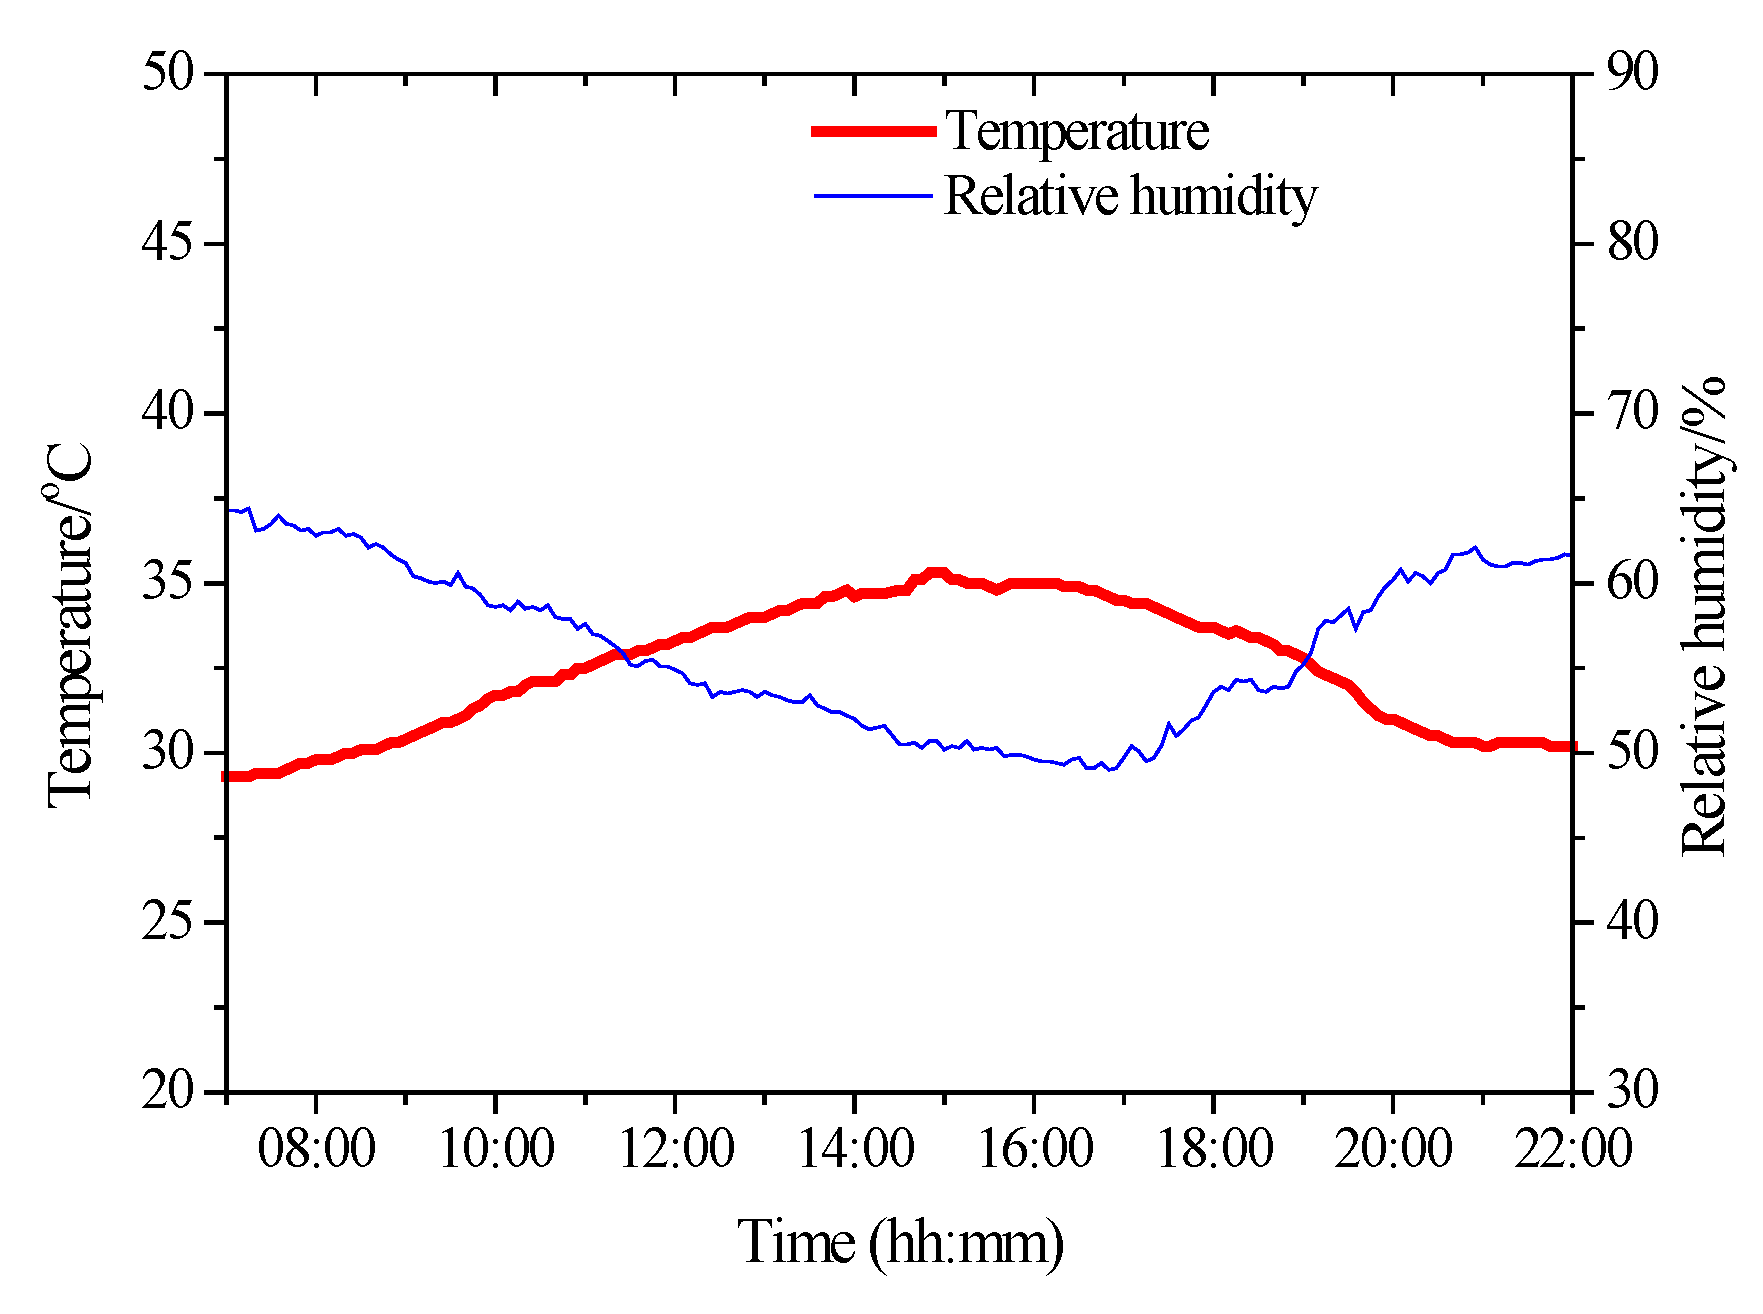
Figure 1 shows the hourly variation in the average temperature and humidity outdoors during the test period. During the testing period, the outdoor temperature ranged from 29.3 to 35.3 °C, and the average temperature was 32.5 °C. The outdoor high temperature was mainly concentrated in the time period of 14:00–16:00, with an outdoor humidity range of 49–65%. During the evening rush hours of the subway (17:00–18:00), the outdoor temperature was in the range of 32.5–34 °C, with an average temperature of 33.3 °C. The recommended outdoor dry-bulb temperature design value for the subway station on the design day in Xi’an is 34 °C [28], which is the dry-bulb temperature obtained by the method of not guaranteeing 30 h per year on average based on the climate data during the late peak load period of the subway in the past 20 years in summer. It can be seen that the outdoor weather conditions during the measurement period were basically close to the outdoor design values, indicating that the outdoor meteorological parameters in the test period were relatively representative.
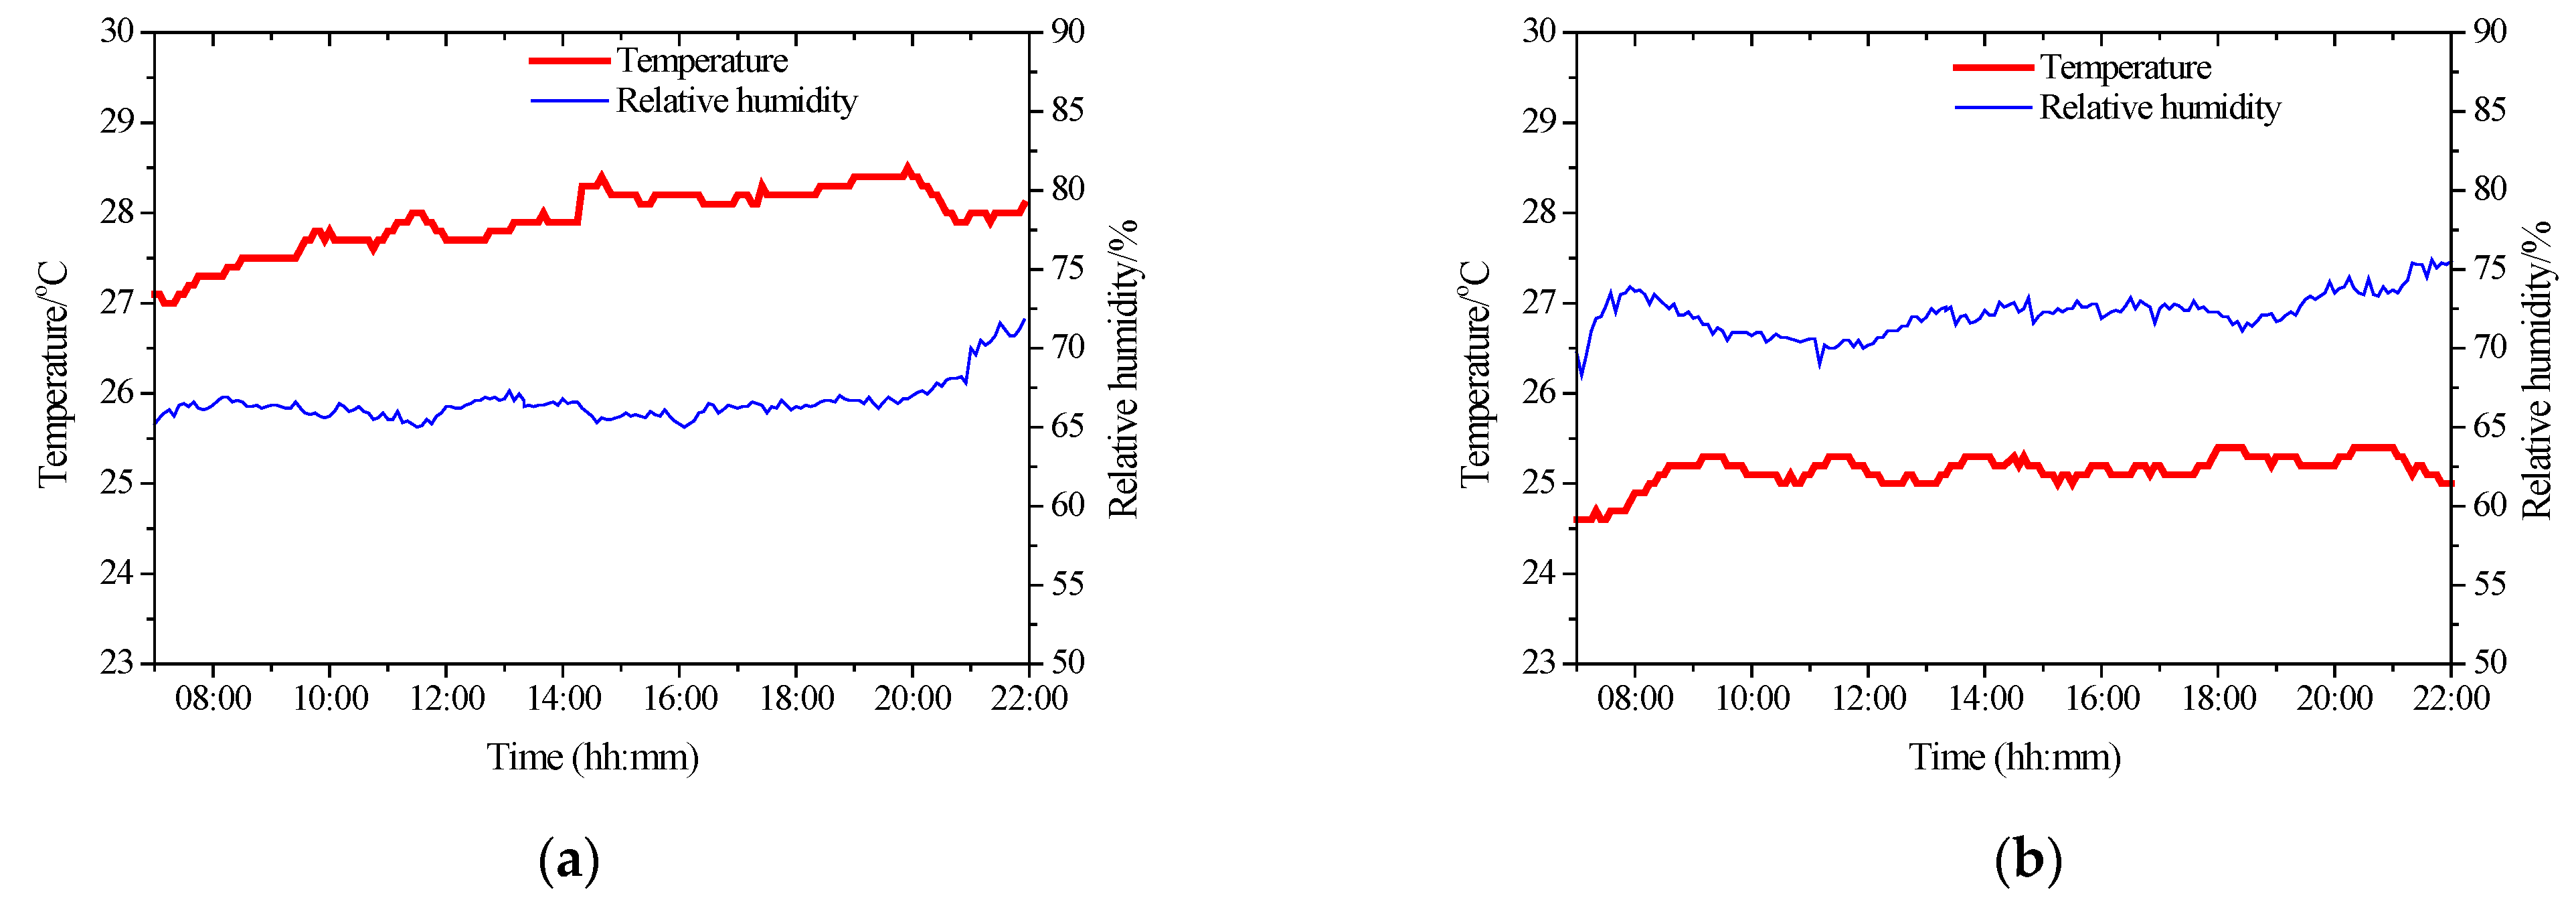
Figure 2 shows the hourly variation in the average temperature and humidity of station halls at the two subway stations. The measured temperature of the station hall at Station A was in the range of 25.5–26.4 °C, with an average temperature of 26 °C. The temperature was basically stable for the day. In the period of 17:00–21:00, the temperature in the station hall was higher. This period was the subway evening rush hour, and the large crowd caused the temperature to rise. During the test period, the humidity in the station hall at Station A was in the range of 60–75%, basically satisfying the humidity requirement stipulated in the code. The measured temperature of the station hall at Station B was in the range of 24.3–25.1 °C, with an average temperature of 24.7 °C. Station B reached the peak temperature at 9:00 am, which was the morning peak period of Station B, and the flow of people was relatively large. Station B generally had higher humidity, with the relative humidity in the range of 71–78% during the test period, which exceeded the specified value in the design code (40–70%), thus making passengers uncomfortable. A comparative analysis of the temperature in the station halls of the two stations indicates that the temperature of the station hall at Station A was approximately 1.3 °C higher than that at Station B and that the temperature in the station halls of the two stations was 4–5 °C lower than the designed temperature (30 °C) of the station hall in Xi’an subway stations. Figure 3 shows the hourly variation in the average temperature and humidity of the platforms at the two stations. The measured temperature of the platform at Station A was in the range of 27–28.5 °C, with an average temperature of 27.9 °C. The temperature peaked at about 20:00, and the humidity was controlled within the range of 65–72%, exceeding the upper limit of humidity specified in the design code. The measured temperature of the platform at Station B was in the range of 24.6–25.4 °C, with an average value of 25.1 °C. The humidity was in the range of 69–76%, which also exceeded the upper limit of humidity specified in the design code. A comparative analysis of the platform temperature of the two stations showed that the platform temperature of station A was basically consistent with the design temperature of 28 °C, while the temperature of station B was about 2.8 °C lower than that of Station A. A comparative temperature analysis of the station halls and platforms of the two stations shows that the measured temperature of the platforms was higher than that of the station halls, and this result is inconsistent with the design code that the temperature of the platforms should be 1–2 °C lower than those of the station halls at the subway stations.
Summarizing the above analysis, it can be seen that the current air-conditioning operating temperature in the Xi’an subway stations was not consistent with the designed temperature determined according to the design code for subways [27], and a large difference was observed. The temperatures of the station halls at the two stations were both 4–5 °C lower than the designed temperature for the station hall of the Xi’an subway stations, and the temperature of the platform at Station B was 2.9 °C lower than the designed temperature for the platform of the Xi’an subway stations. At the current operating temperature, could passengers achieve a better thermal comfort sensation? In this study, subjective assessment of the thermal environment in subway stations was further carried out by analyzing the results from the questionnaire survey on passengers’ thermal sensations.

4.2. Results of Subjective Evaluation on Thermal Environment

4.2.1. Basic Information of Passengers

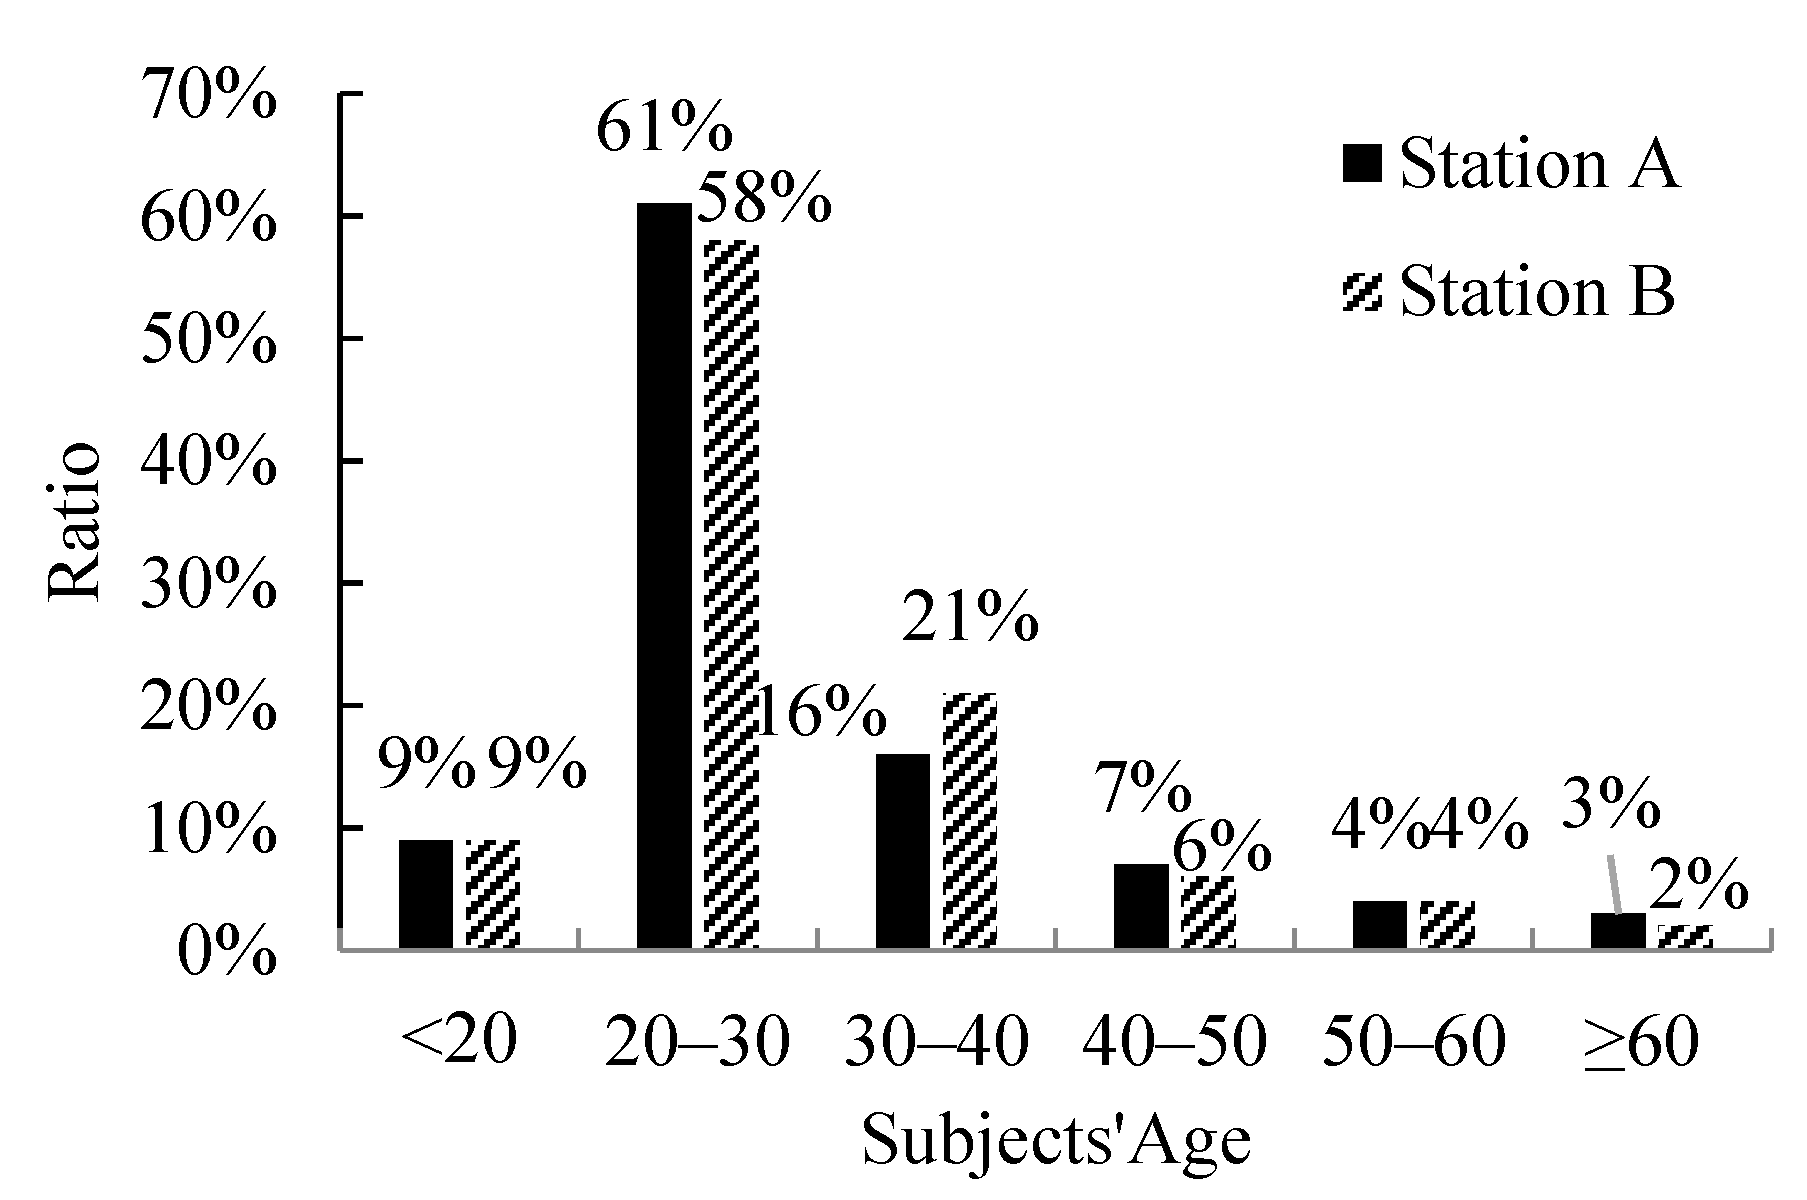
Since passengers of different ages and genders had different perceptions of the same thermal and humid environment, the uniformity of gender distribution and the comprehensiveness of age distribution of the subjects were taken into account in the questionnaire survey. The proportions of the subjects’ gender distribution and age distribution are shown in Figure 4 and Figure 5, respectively. Among the subjects at Stations A and B, the male subjects accounted for 53% and 55%, respectively, with the male-to-female ratios basically balanced. Among them, the majority were young people. The subjects’ activity status can affect their metabolic rate. The distribution ratios of the subjects’ activity status are shown in Figure 6. The majority of subjects sat still, stood, and walked normally. Other special activities such as jogging, sprinting, and light labor accounted for less than 4% of the total.

4.2.2. Thermal Sensation of Subjects

Figure 7 shows the distribution of subjects’ thermal sensation votes at the subway stations. As shown in the figure, 71% and 61% of the subjects in the hall and platform of Station A had the thermal sensation of “thermal neutral”, and the majority of the remaining subjects had the thermal sensation of “slightly warm”. A total of 67% and 75% of the subjects in the hall and platform of Station B had the thermal sensation of “moderate”, some of the remaining had the thermal sensation of “slightly warm”, and some had the thermal sensation of “slightly cold”, with little differences in their respective proportions. In combination with the data on the temperature of the two stations in Section 3.1, this was mainly because the temperature at Station A was higher than that at Station B. Therefore, subjects at station A felt warmer than those at Station B.

4.2.3. Thermal Comfort of Subjects

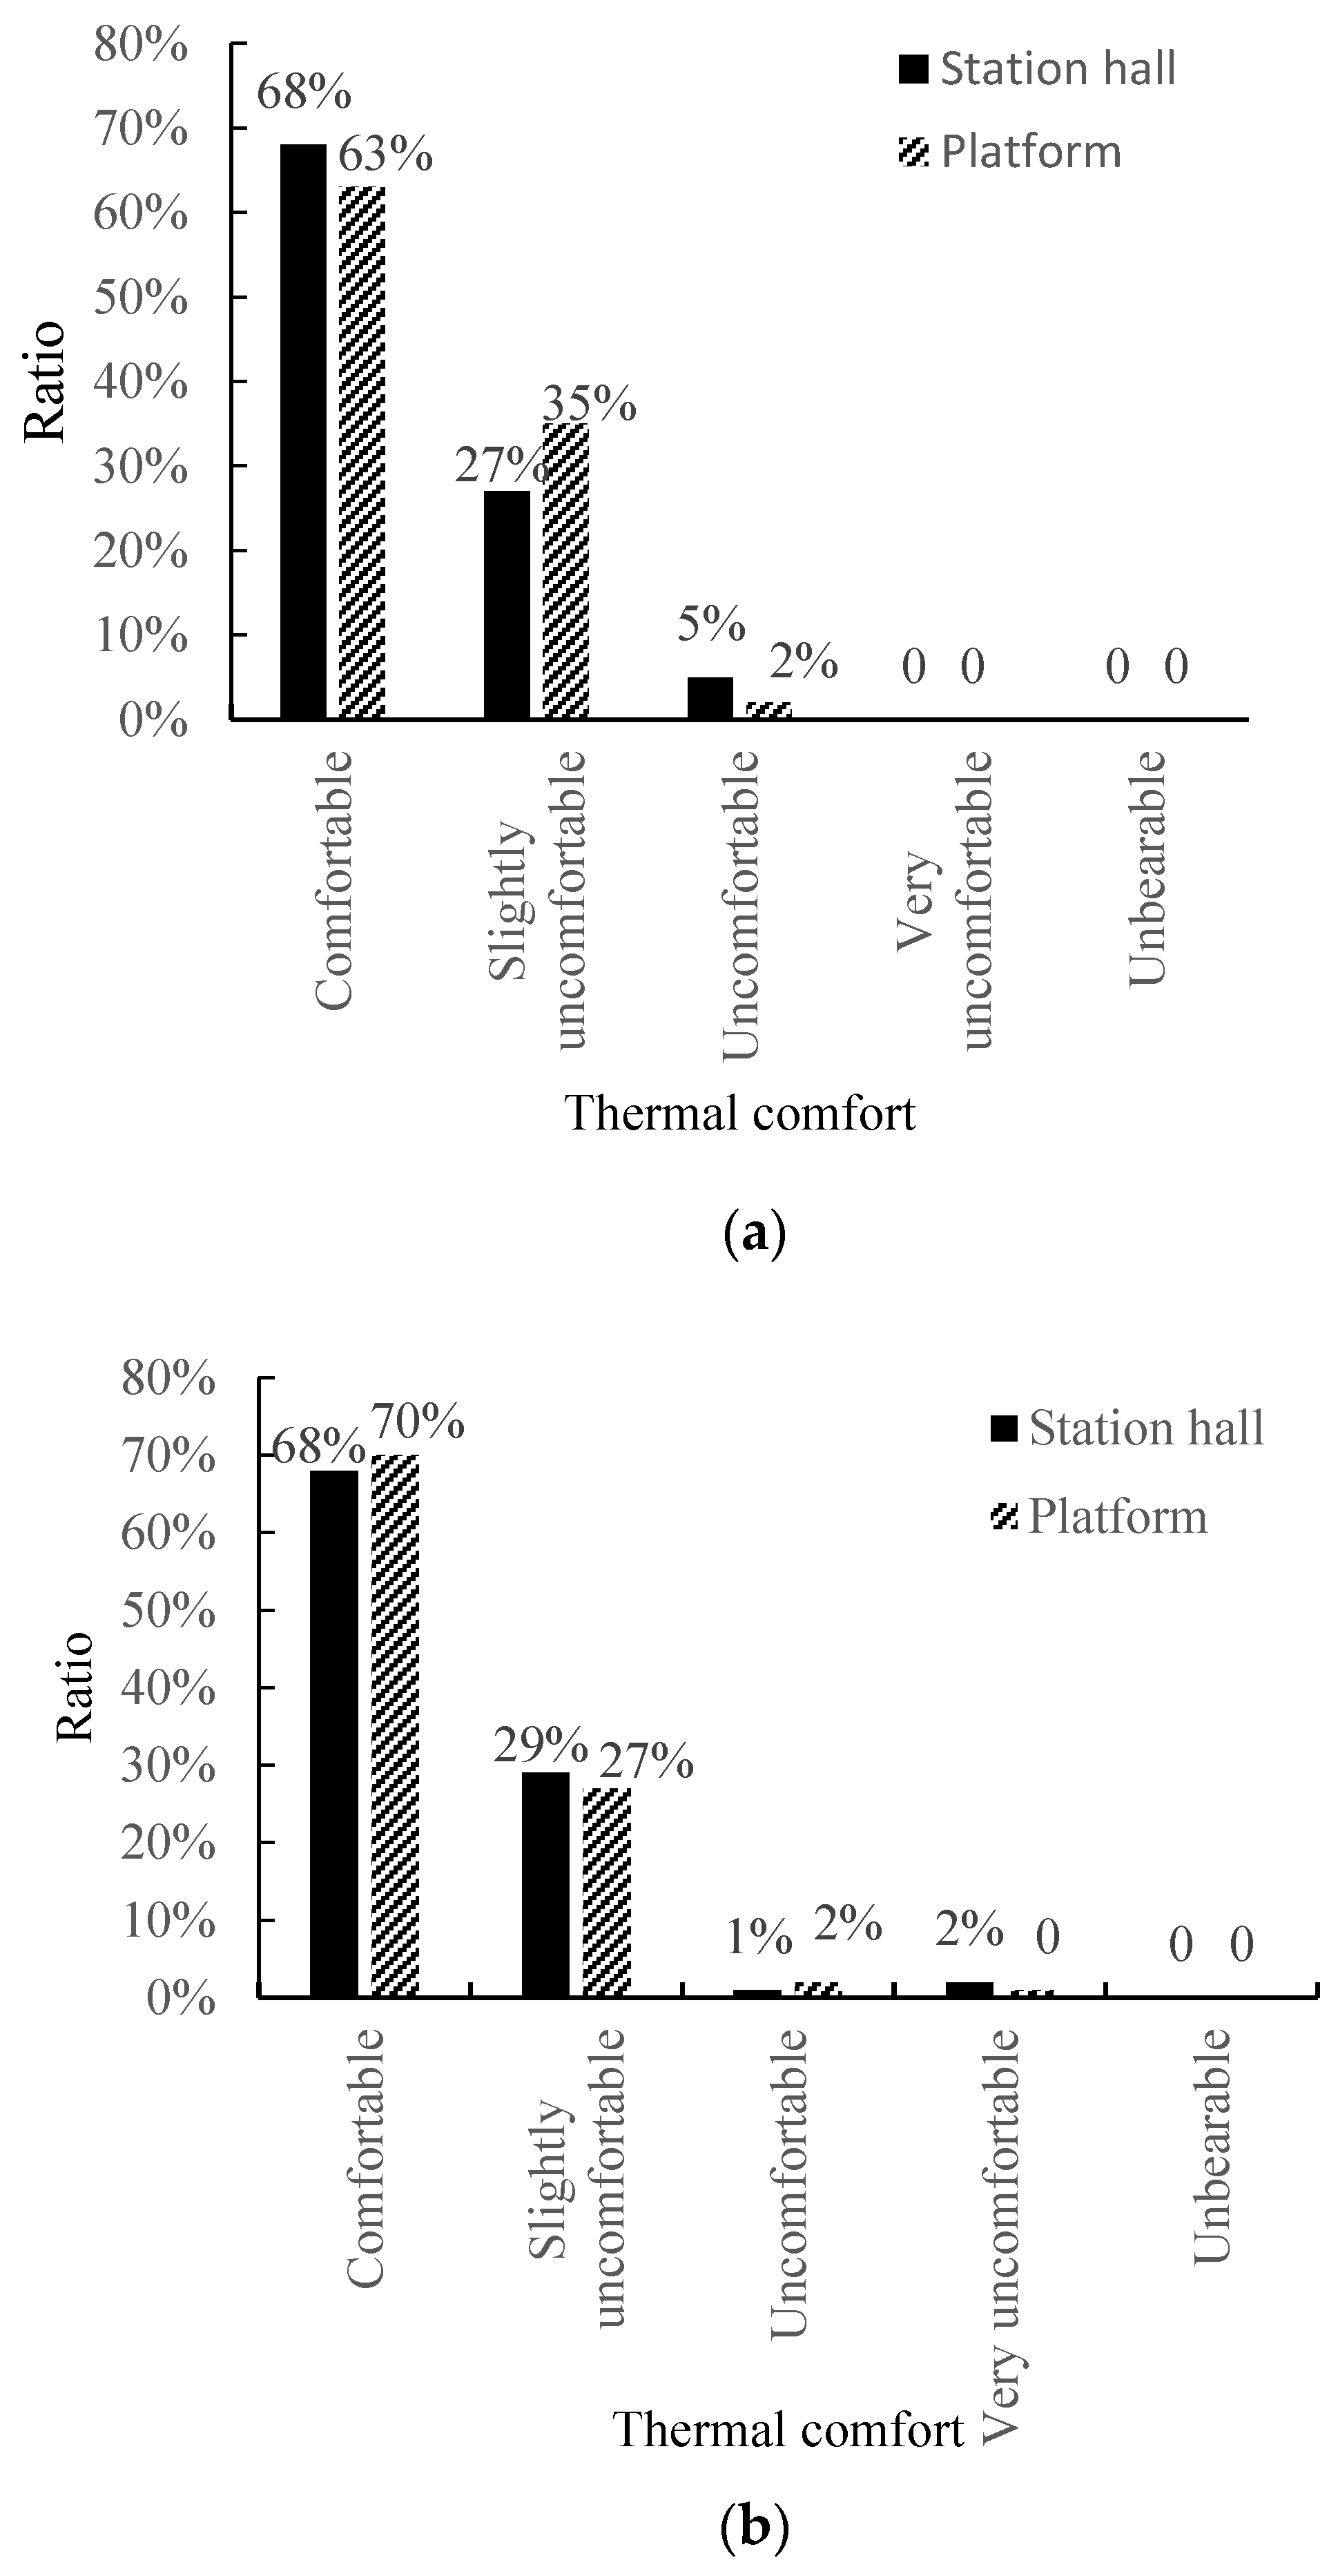
Figure 8 shows the distribution ratio of the subjects’ thermal comfort vote at the subway stations, indicating that 68% and 63% of the passengers felt comfortable in the station hall and platform of Station A, respectively, and all the remaining passengers felt a little uncomfortable. The number of subjects who felt comfortable in the station hall and platform of Station B was higher than that of Station A, accounting for 68% and 70%, respectively. Thus, the temperature of Station B, which was lower than that of Station A, made passengers feel more comfortable, indicating that passengers preferred a relatively low temperature in subway stations.
According to a comprehensive analysis in Section 4.1 and Section 4.2, the measured average temperatures of the station halls at Stations A were 4 °C and 5.3 °C lower than the originally designed temperatures of the station halls, respectively. The measured average temperature of the platform at Station A was basically consistent with the designed temperature, while that at Station B was 2.9 °C lower than the designed temperature. However, the questionnaire survey results showed that approximately 30% of passengers at Station A and 9% of passengers at Station B expected a cooler environment. Therefore, if the air-conditioning system of Xi’an subway stations operated at the originally designed temperature, more passengers would feel warmer and even hot, failing to meet the passengers’ thermal comfort needs.

5. Evaluation of Passengers’ Dynamic Thermal Comfort and Determination of Indoor Air Design Temperature Using the RWI Method

The contents in this section mainly include: (1) Use the dynamic thermal comfort evaluation index of RWI for the transition spaces to evaluate passengers’ thermal comfort in the actual measurement environment and compare the results with those from the questionnaire survey to judge the rationality of using RWI to evaluate the subway passengers’ thermal comfort in the cold zones of China with Xi’an City as a representative. Then, based on the comparison results, revise the RWI method. (2) Based on the revised RWI method, predict passengers’ thermal comfort at the designed temperature and further judge the rationality of the designed temperature from the perspective of thermal comfort. (3) Deduce an appropriately designed air-conditioning temperature at Xi’an subway stations based on the revised RWI method.

5.1. Theoretical Evaluation Index on Passengers’ Thermal Sensation

The relative warmth index, RWI, is an index considering the thermal comfort of the human body in the transitional space environment [18], proposed by the US Department of Transportation to determine the design parameters for air-conditioning systems in platforms and station halls at subway stations and in trains. It is applicable to warmer environments. This index not only considers the factors affecting the passengers’ thermal comfort, such as environment temperature, humidity, air velocity, and surface radiant temperature, but also the special factor of passengers’ stay time at the station. According to different humidity conditions, RWI is calculated by Equations (1) and (2) [18], represented as follows:
R W I = M τ I cw τ + I a + 6.42 t a 35 + R I a 234 P a     2269 Pa
R W I = M τ I cw + I a + 6.42 t a 35 + R I a 65.2 5858.44 P a / 1000 P a   >   2269 Pa
where M τ is the metabolic rate (W/m2), in which m2 is the unit of human skin area; τ is the time spent in the transition period (s); I cw is the thermal resistance of clothes soaked with sweat (clo); I a is the thermal resistance of the air boundary layer outside clothing (clo); t a is the dry-bulb temperature of ambient air (°C); R is the average radiation heat gain per unit area of human skin (W/m2).
Because the activities of subway passengers are constantly changing, the RWI index takes into account the thermal balance of the human body at the transition stage. It holds that when one transits from one activity state to another, it takes 6 min for the metabolic rate M to reach a stable metabolic rate in the final activity state. During this transition process, the metabolic rate shows a linear relationship with time. In addition, human activity can lead to sweating and wetting clothes, as well as disturb the surrounding airflow. These will cause the thermal resistance of clothing to change. When one transits from one activity state to another, it takes 6 min for the thermal resistance of clothing to reach a new stable value. During this process, the thermal resistance of clothing shows a linear relationship with time. The metabolic rate and thermal resistance of clothing during the changing process of activity states can be calculated by Equations (3)–(6) [18]:
When τ   <   360   s ,
I c w τ = I c w 1 + I c w 2 I c w 1 τ 360
M τ = M 1 + M 2 M 1 τ 360
When τ 360   s ,
I cw τ = I cw 2
M ( τ ) = M 2
where M 1 and M 2 are the metabolic rates at the initial and final states, respectively, (W/m2); I cw 1 and I cw 2 are the thermal resistance of clothing at the initial and final states (clo); τ is the time spent after changing the activity state (s). According to the corresponding activity states, M 1 , M 2 , I cw 1 , and I cw 2 can be determined according to Table 2.
The thermal resistance I a of the air boundary layer outside clothing changes with the change in passengers’ activity and air velocity. Figure 9 shows the change in the relationships between I a and the total air velocity V (ambient velocity Va + activity-induced velocity Vb). Vb was obtained from Table 2, and Va was obtained by actual measurement, as described in Section 3.2.1. After V is calculated, the value for I a can be obtained from Figure 9. As for the average radiation heat gain per unit area of human skin R, it is generally taken as 31.5 W/m2 for people walking or standing in the sun, and it is roughly taken as 0 in the environment of underground subway stations [9]. The relationships between the RWI values and the ASHRAE thermal sensation scales are listed in Table 3 [18].

5.2. Calculating Background Parameters

Table 4 lists the temperature and humidity parameters for each evaluation unit in Stations A and B obtained from the field tests. Table 5 lists the passengers’ basic parameters at each environment control unit such as activity and metabolic rate in the process of entering stations and getting on trains. Since the time for passengers to transition from each activity state to another state was less than 6 min, the clothing thermal resistance and metabolic rate of passengers during the change of activity state were calculated by Equations (3) and (4), respectively.
Table 6 shows the temperatures of station halls and platforms at Xi’an subway stations designed according to the Code for Design of Subway in China (GB 50157-2013) [27] in Section 1 of this study. The outdoor design mean daily temperature for summer air-conditioning in Xi’an was taken as the entrance–exit temperature, and the outdoor design mean daily relative humidity for summer air-conditioning in Xi’an was taken as the entrance–exit humidity. According to water vapor pressure, the RWI values for the entrance–exit and station hall were calculated by Equation (2), and that for the platform was calculated by Equation (1).

5.3. Analysis of Calculation Results

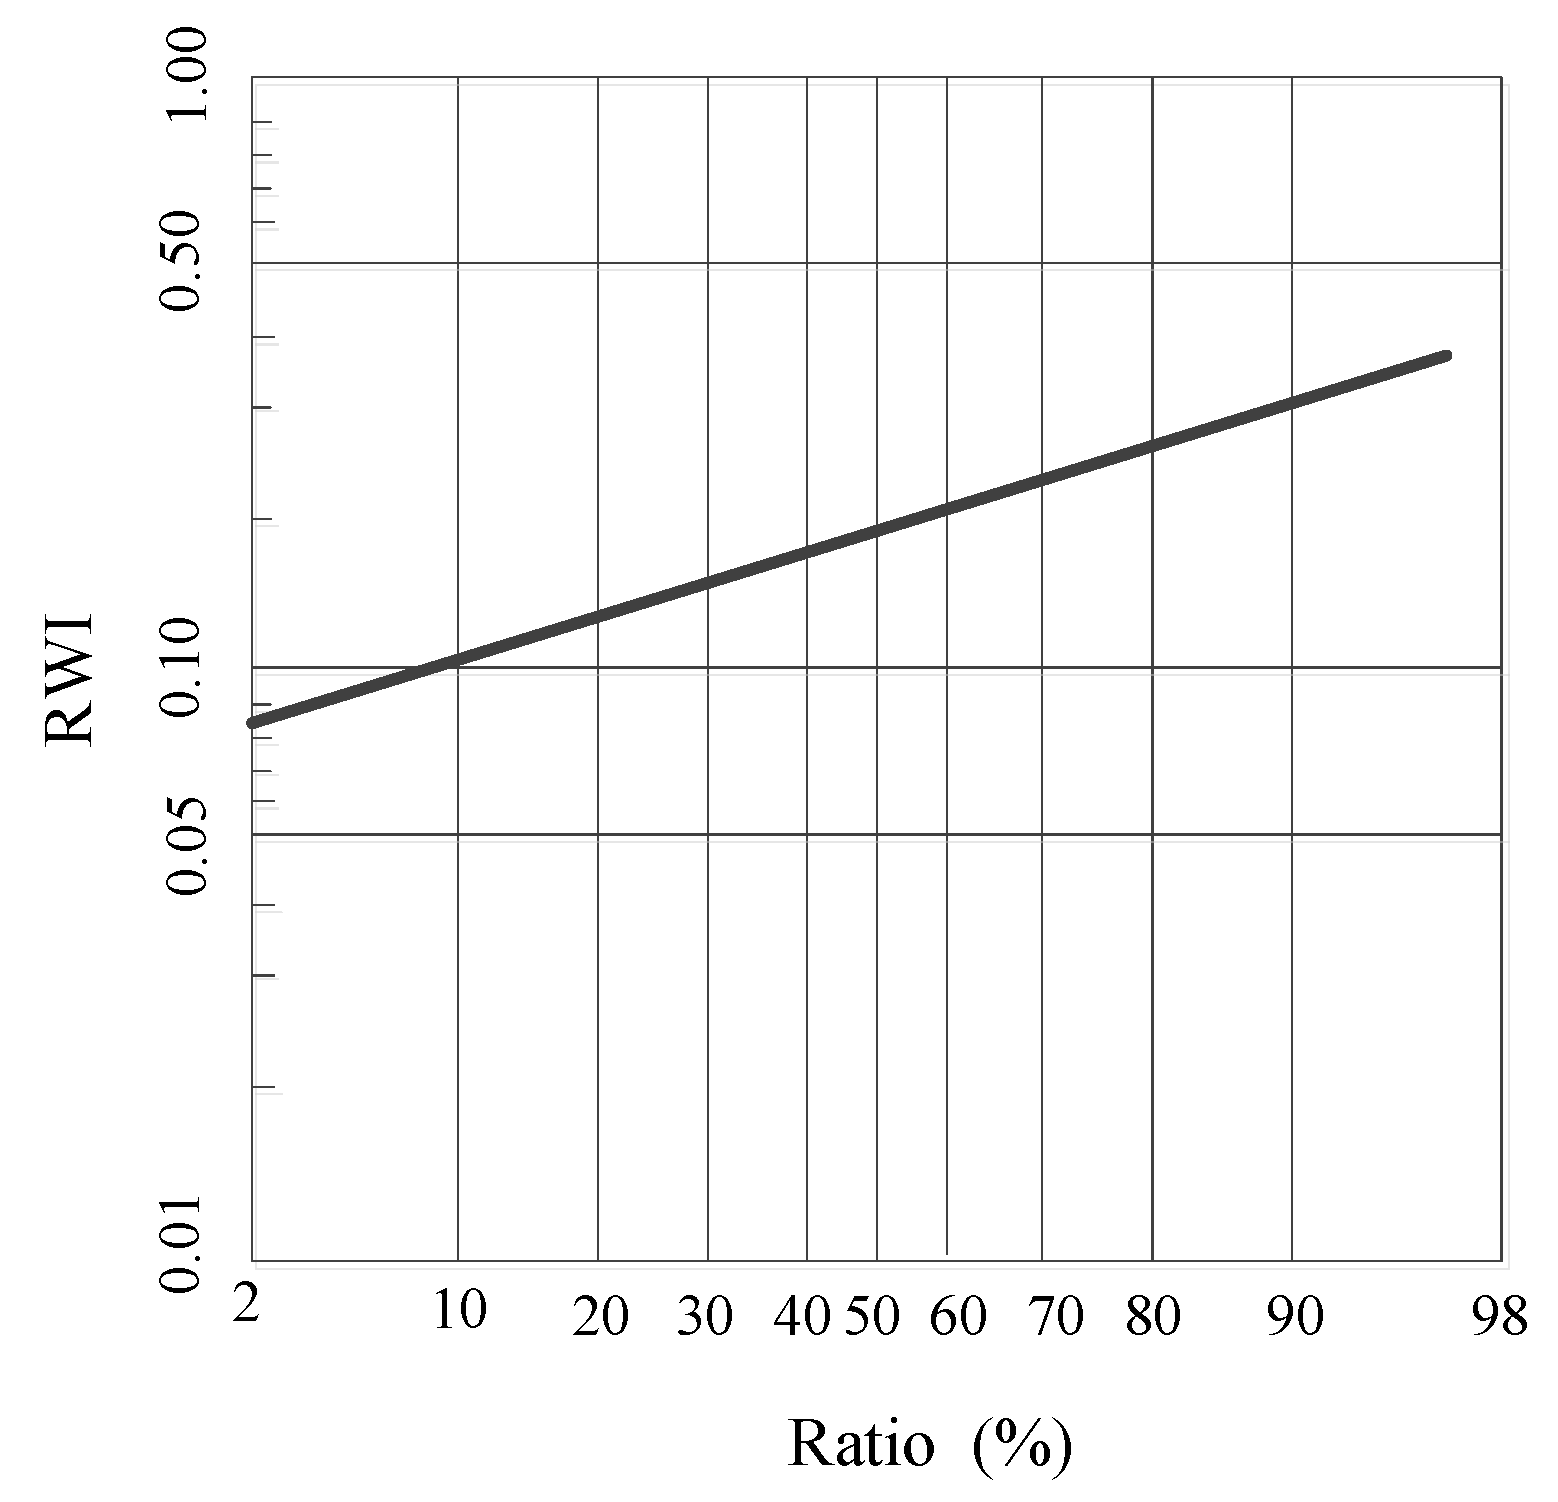
Based on the calculating background parameters in Section 5.2 and Equations (1) and (2), the passengers’ RWI values under different environment control units were calculated, and the calculation results are listed in Table 7. The working condition of the calculation took into account the measured temperature conditions and designed temperature conditions. The corresponding relationships between the RWI value and the proportion of passengers expecting to have a cooler environment in summer are shown in Figure 10.

5.3.1. Evaluation of Passengers’ Thermal Comfort at Measured Temperature

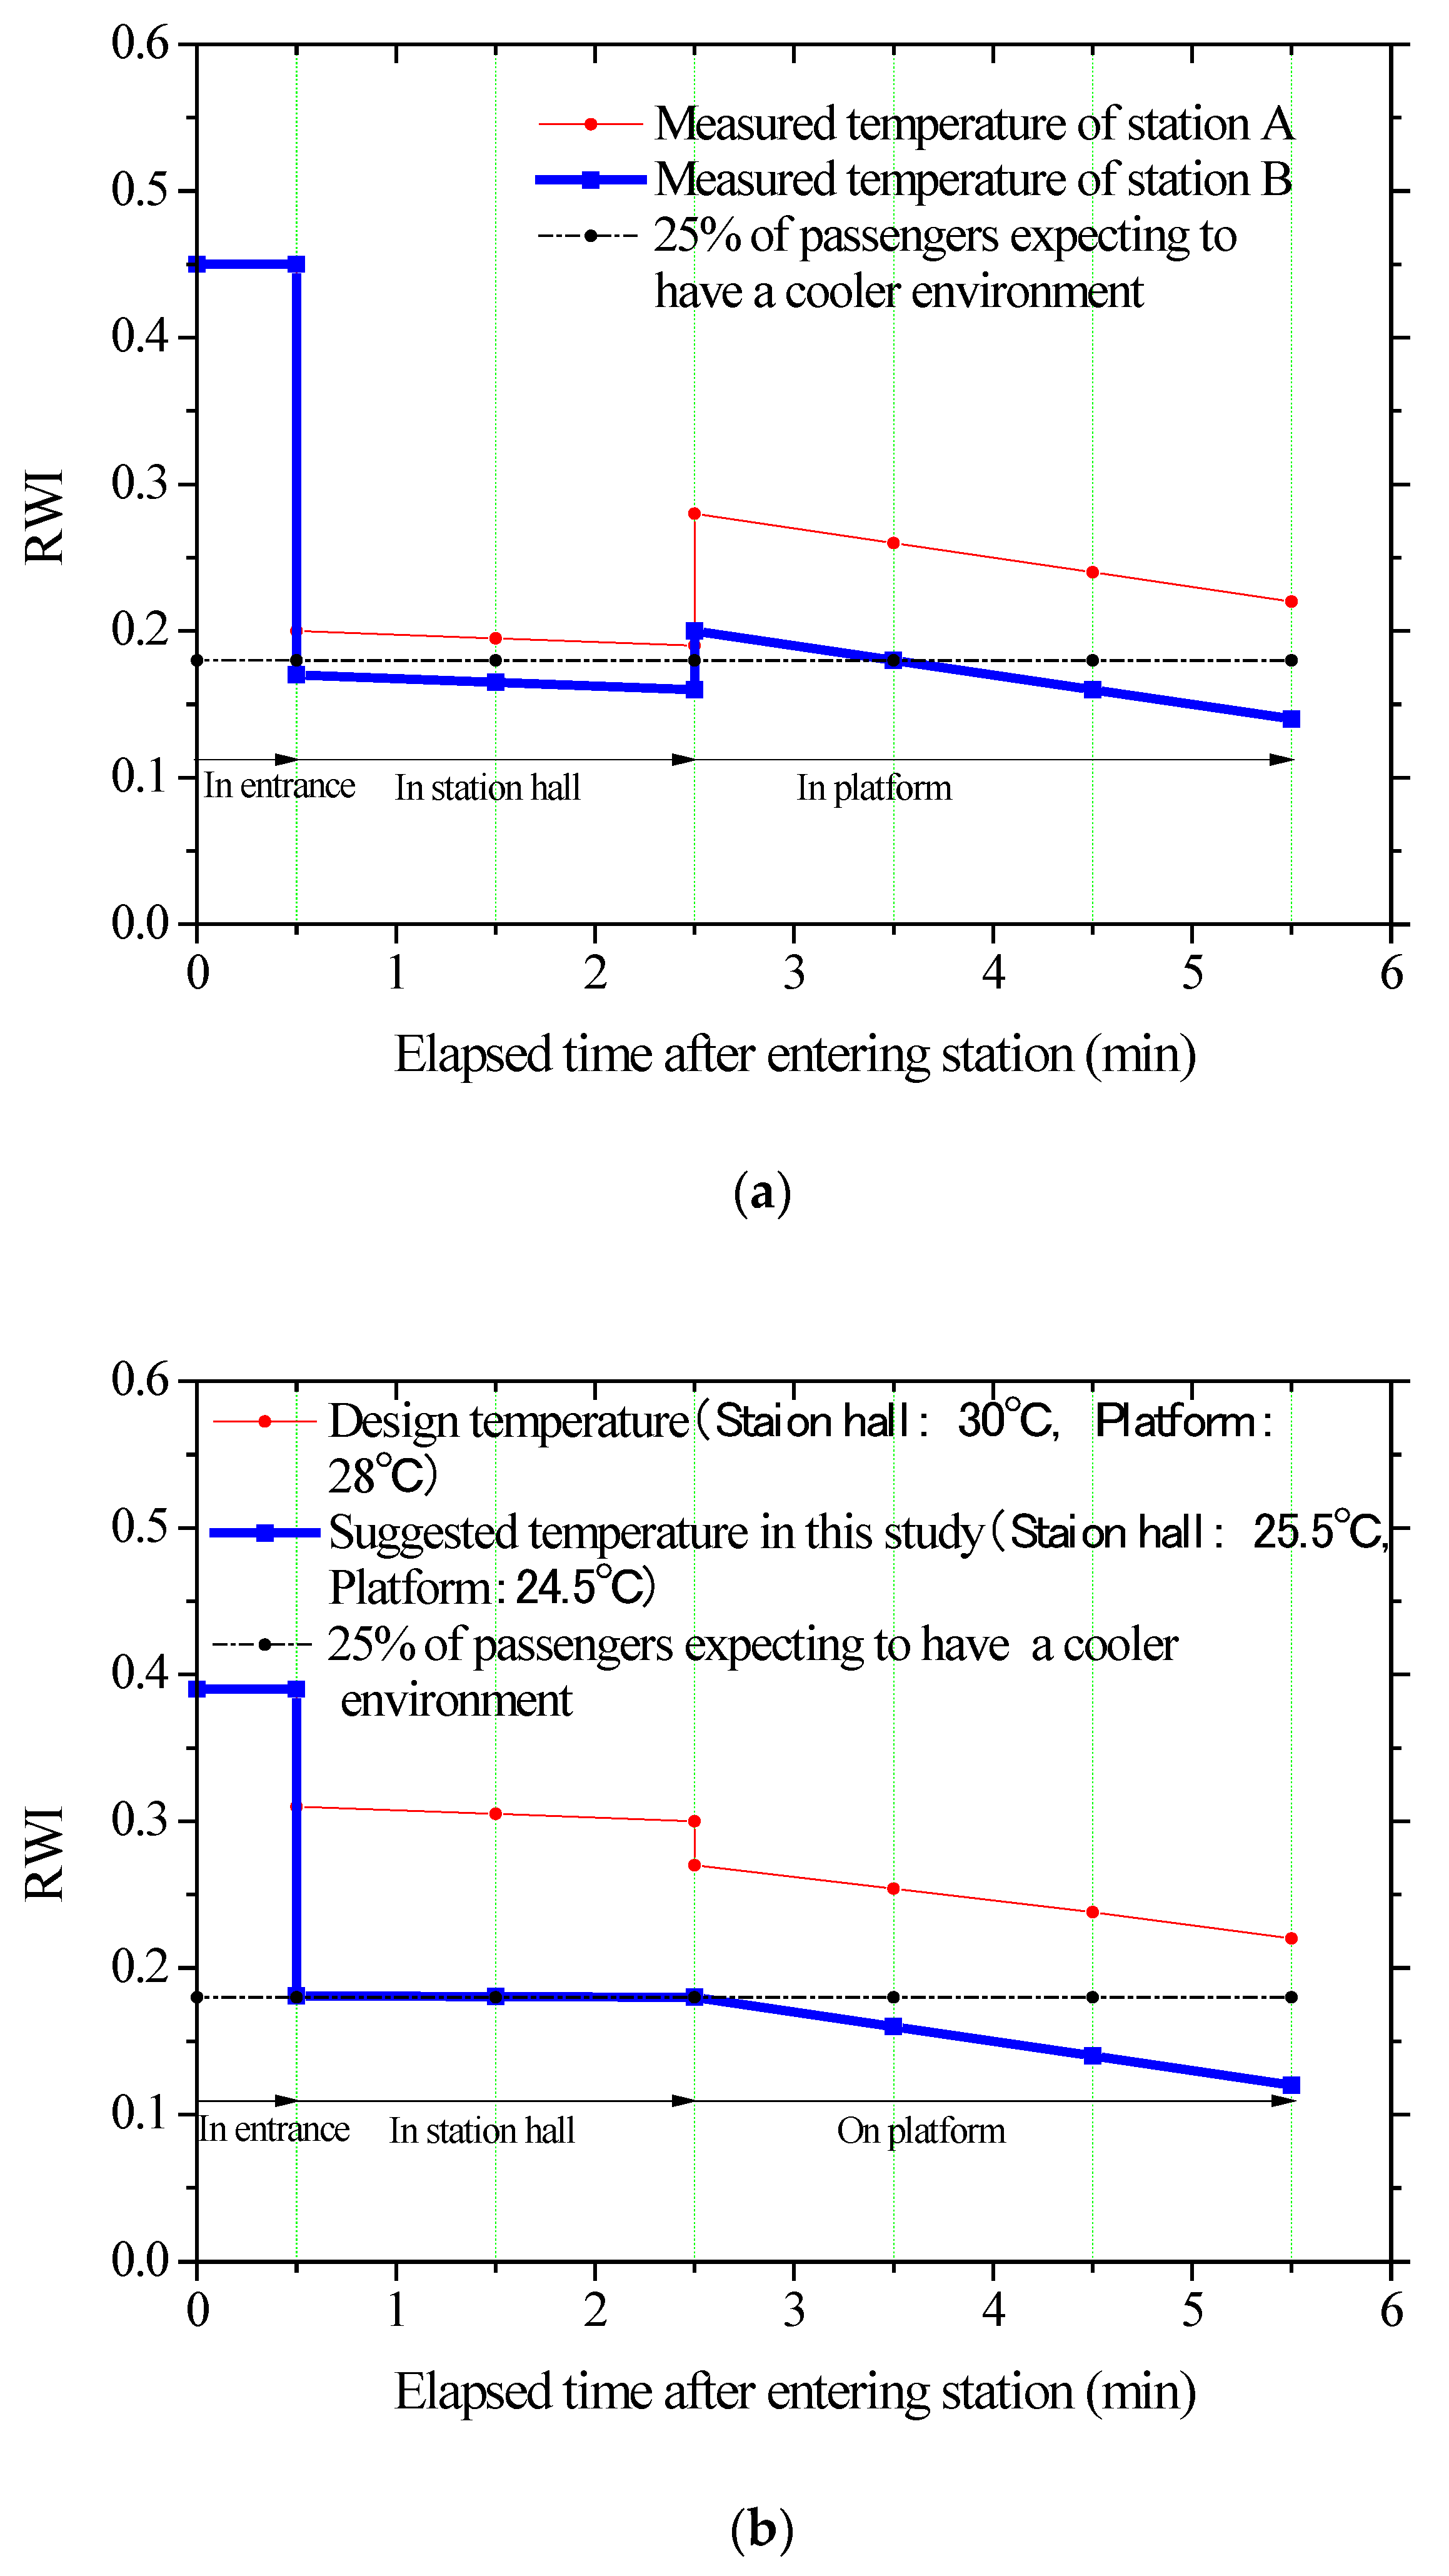
At the current measured temperature, the temperature of the station halls at stations A and B was slightly lower than that of the platforms. The passengers’ RWI values under different environmental control units during passengers’ entering stations are listed in Table 7. The RWI value for passengers entering the station hall from the outdoors at Station A changed from 0.45 to 0.19, and the RWI value suddenly rose to 0.28 at the moment when the passengers stopped suddenly after entering the platform from the station hall. After a stay time of 3 min at the platform, the RWI value decreased to 0.22 again. The RWI value for passengers at Station B suddenly rose to 0.2 from 0.16 at the moment when the passengers stopped suddenly after entering the platform from the station hall, decreasing to 0.14 again after a stay time of 3 min at the platform. According to the calculation results, during the process from passengers’ entering the station from outside to getting on the trains, the maximum RWI value was obtained at the moment when passengers just arrived at the platform and stopped. There were two reasons for this phenomenon: (i) the temperature of the platform was higher than that of the station hall under the measured condition; (ii) when the passengers just arrived at the platform and stopped, their metabolic rate remained at a level as high as that when they were at the station hall. This led to the sudden rise of the RWI values of the passengers, causing instantaneous thermal discomfort, which can be avoided by adjusting the temperature differences between the station hall and the platform. Through the calculation, it is found that when the temperature of the platform was at least 1 °C lower than that of the station hall, the RWI will not increase suddenly when the passengers enter the platform, thus ensuring the value is constant or decreasing.
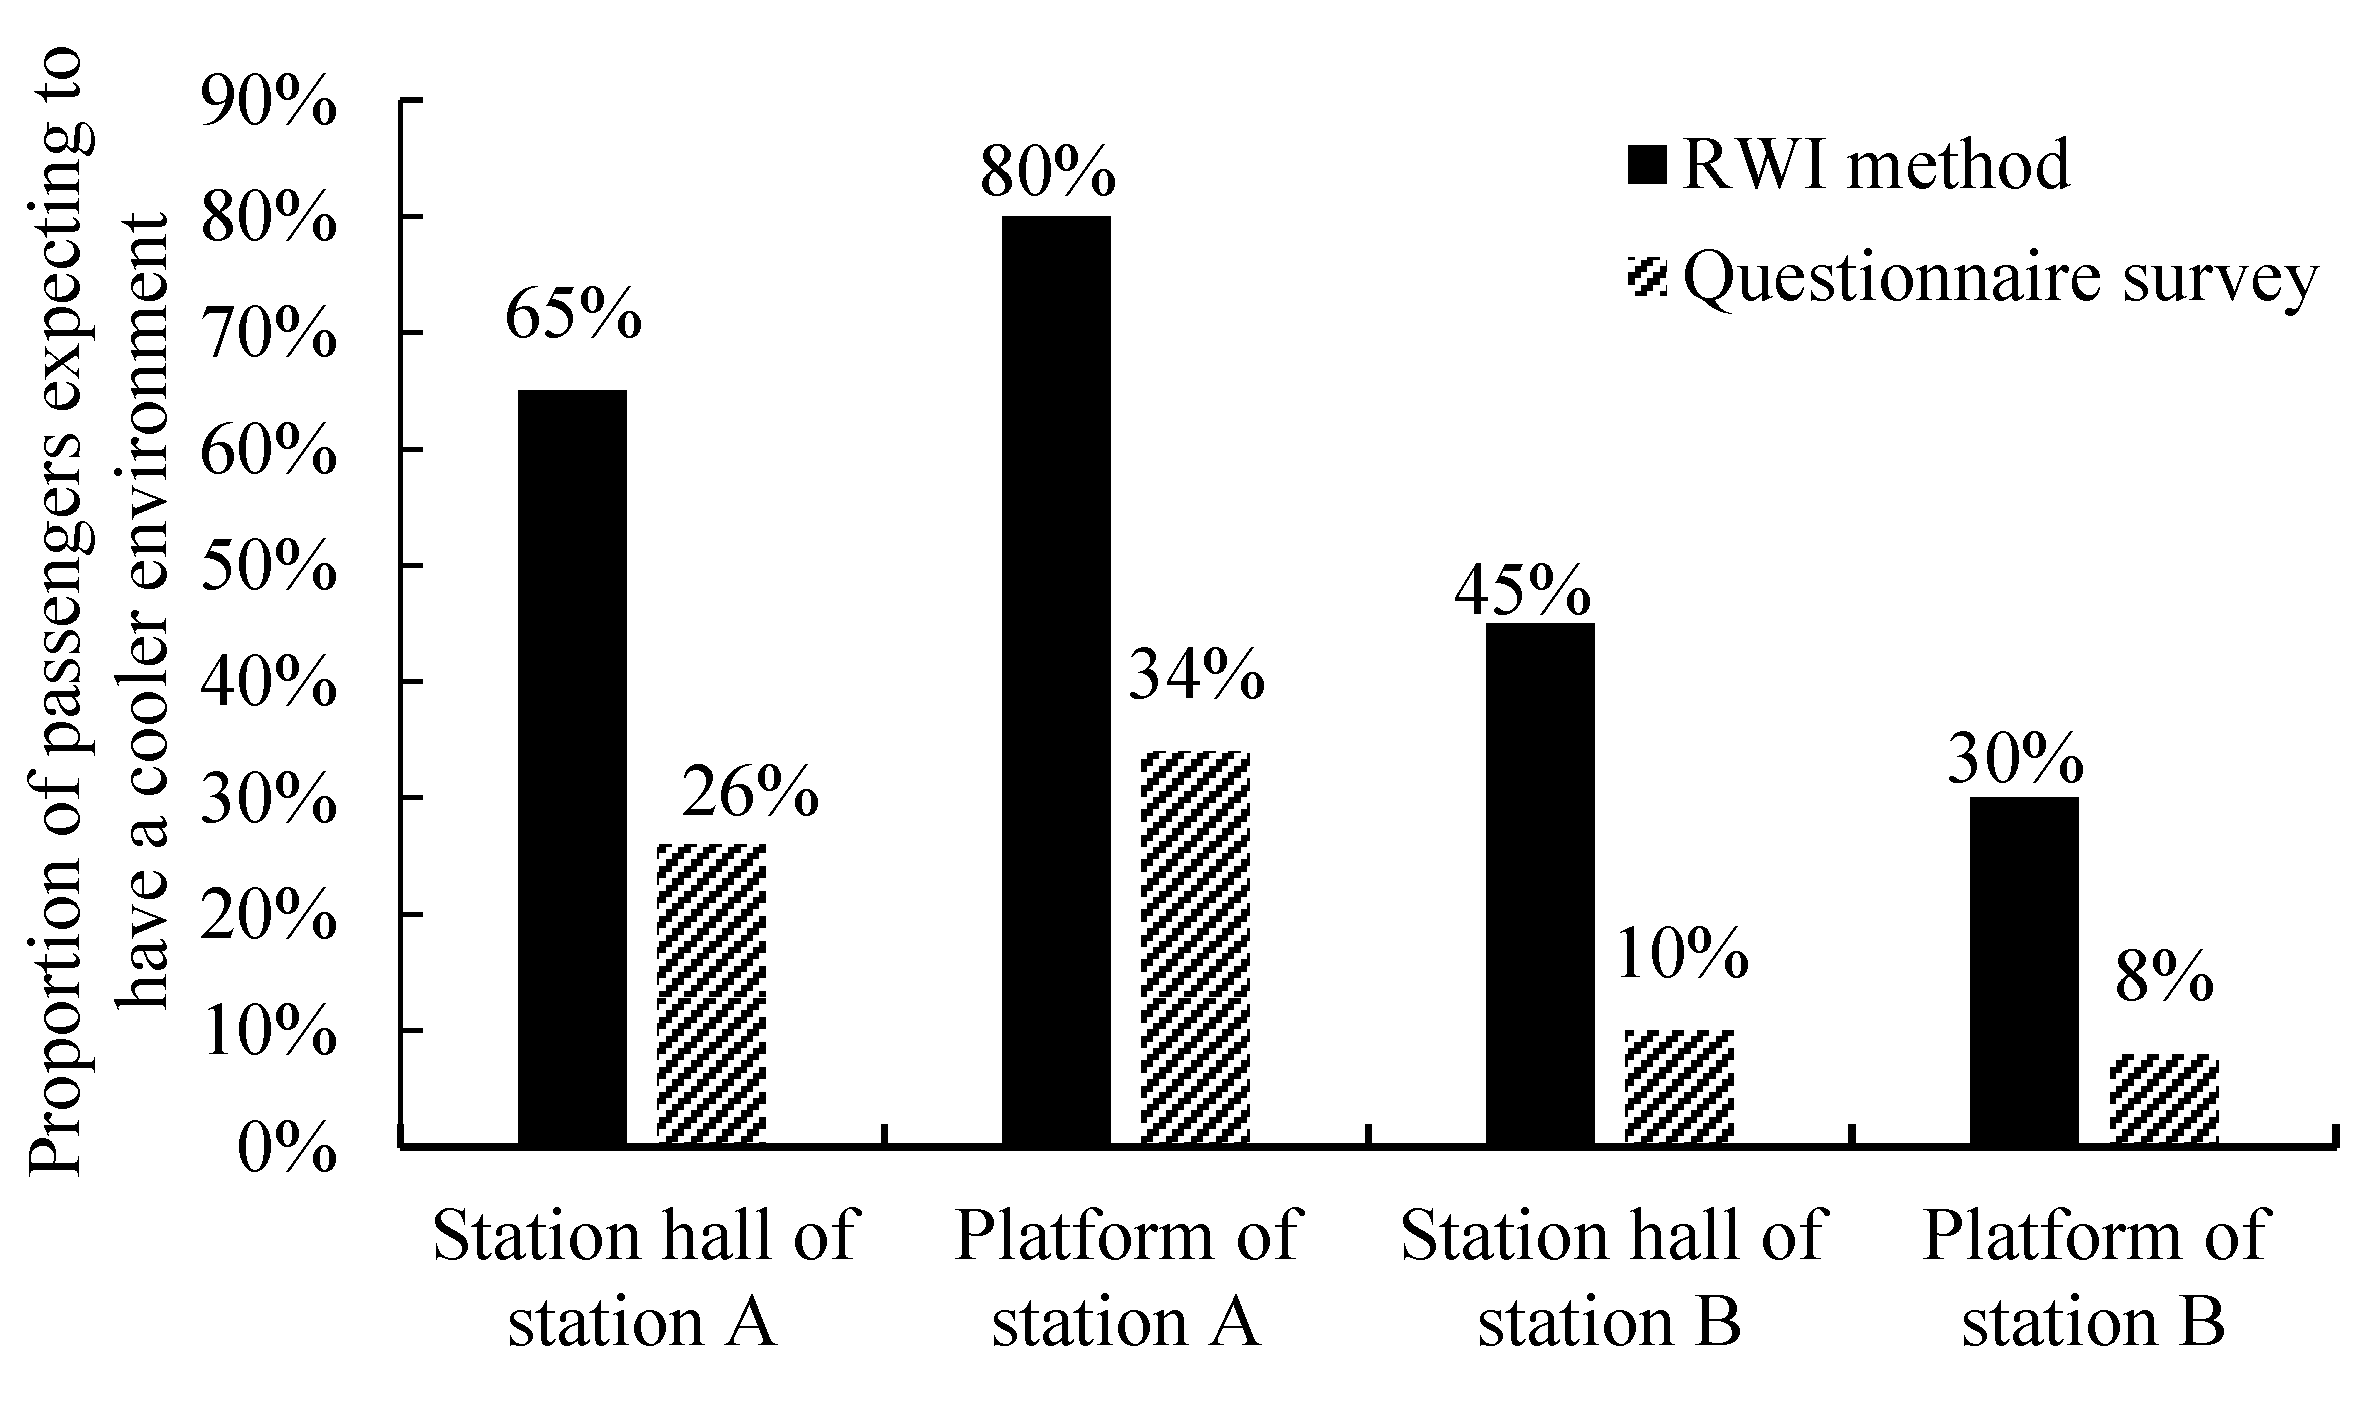
At the measured temperature, the RWI value for the station hall at Station A was 0.19, corresponding to approximately 65% of the passengers in Figure 10 expected to have a cooler thermal environment. However, according to the statistics of the questionnaire survey (as shown in Figure 7a), 26% of passengers felt slightly hot. According to the calculation data on the platform of Station A, when the RWI value was 0.22, Figure 10 shows that about 80% of passengers expected to have a cooler thermal environment, whereas the statistics of the questionnaire survey (as shown in Figure 7a) demonstrated that 34% of passengers felt slightly hot. The calculated RWI values for the station hall and platform at Station B corresponded to 45% and 30% of passengers expecting to have a cooler environment, respectively. However, according to the statistical results from the questionnaire survey (shown in Figure 7b), the proportion of passengers at the station hall and platform at Station B who felt slightly hot was 10% and 8%, respectively. An intuitive comparison of the results from the RWI method and the questionnaire survey is shown in Figure 11, indicating that the thermal sensation of the subway stations predicted from the RWI method had a deviation of approximately 35% from the actual questionnaire survey. The higher the background temperature is, the bigger the deviation is. At the same ambient temperature, the proportion of passengers feeling unsatisfied predicted from the RWI method was higher than from the questionnaire survey. This is because the research object in the environmental design manual of American subways is American, which is different from the physiological function and adaptability of the Chinese. Therefore, in evaluating the thermal environment of the subway stations in the cold zones with Xi’an City as a representative, the results predicted from the RWI method cannot be directly used for evaluation, and some revisions need to be made in combination with the questionnaire survey results.

5.3.2. Predictions of Passengers’ Thermal Comfort at the Designed Temperature

According to the Code for Design of Subway (GB 50157-2013) [27], the indoor air design temperature of the station hall and platform at Xi’an subway stations was determined to be maintained at 30 °C and 28 °C, respectively. When the design outdoor air temperature was the outdoor design mean daily temperature for summer air-conditioning in Xi’an (30.7 °C), the RWI value when passengers entered the platform from the station hall changed from 0.3 to 0.27, and then decreased to 0.22, as shown in Table 7. In this process, the RWI value decreased gradually, indicating that passengers can achieve temporary relative comfort. However, according to Figure 10, when the RWI value for the station hall was 0.3, approximately 95% of passengers expected to have a cooler environment. Section 5.3.1 shows that the RWI method had a deviation of 35% when predicting the proportion of passengers who expected a cooler environment. Therefore, at the designed temperature for Xi’an subway stations, approximately 60% of passengers are expected to have a cooler environment, clearly indicating that the designed temperature cannot satisfy most passengers’ needs for thermal comfort.

5.3.3. Appropriate Designed Temperature of Air-Conditioning at Subway Stations in Xi’an

The variations in the RWI value in the whole process from passengers’ entering the station hall and waiting for the trains on the platform under the background of different environmental temperatures are plotted according to Table 7, as shown in Figure 12. As to the limiting value for RWI and the limiting proportion of passengers expecting to have a cooler environment, there was no specific standard in the American Design Manual for Subway Environment [18]. The design manual states that because different groups of people had different thermal comfort requirements, there was no fixed standard for all the stations, and it was suggested that planners, operators, and designers should determine specific design standards according to specific systems and stations. According to the method of grading thermal comfort in the Design Code for Heating, Ventilation and Air-Conditioning of Civil Buildings in China (GB 50736-2012) [29], this study suggests that the thermal environment of Xi’an subway stations should be designed according to the following two levels of thermal comfort, and at least the thermal comfort of Level II should be satisfied.
Thermal comfort of Level I: It provides a thermal environment where 90% of passengers feel comfortable, i.e., 10% of passengers need a cooler environment. Because the results from the RWI method and questionnaire survey had a deviation of 35%, and after deviation corrections, 45% of passengers expected to have a cooler environment. Under this condition, RWI = 0.16, the corresponding calculated temperatures of the station hall and platform were 24.9 °C and 23.9 °C, respectively, which were approximately 25 °C and 24 °C. In this case, when passengers entered the stations from the poorer outdoor thermal environment (RWI = 0.39), the RWI value changed from 0.16 to 0.16, and then decreased to 0.1, showing a progressively decreasing trend and can satisfy passengers’ thermal comfort.
Thermal comfort of Level II: It provides a thermal environment where 75% of the passengers feel comfortable, i.e., 25% of the passengers expect to have a cooler environment. After the deviation corrections, the proportion of passengers expecting a cooler environment was adjusted to 60%. Under this condition, RWI = 0.18, and the corresponding calculated temperatures of the station hall and platform were 25.5 and 24.5 °C, respectively. When passengers entered the station in this condition, the RWI value changed from 0.18 to 0.18 and then decreased to 0.12, showing a decreasing trend when passengers entered the platform from the station hall, which can provide passengers with a comfortable thermal environment. Such results were basically consistent with the results from the questionnaire survey in Section 4.2.
According to the above analysis, considering energy conservation, it is suggested that the designed temperature for the subway stations should be determined according to the thermal comfort of Level II, i.e., the designed temperatures of the station hall and platform at the subway stations in Xi’an are suggested to be 25.5 and 24.5 °C, respectively. It can satisfy most passengers’ needs for thermal comfort.

6. Conclusions

(1) When the RWI index was used to evaluate the thermal environment at the subway stations in Xi’an, a deviation of 35% was observed from the field questionnaire survey result. It was concluded that reasonable results can only be obtained by combining the questionnaire survey result with the RWI index to comprehensively evaluate the thermal environment at subway stations.
(2) If the air-conditioning system operated strictly at the indoor air design temperature for the subway stations determined according to the current code GB 50157-2013, it cannot satisfy most passengers’ needs for thermal comfort. The standard and determination method for the designed temperature proposed in the current code requires further research and optimization.
(3) A uniform indoor air design temperature cannot be used for the station hall and platform. The calculations indicate that when the temperature of the station hall was 1 °C or much higher than that of the platform, the RWI value of passengers entering the platform from the station hall will remain unchanged or decrease progressively to obtain temporary relative thermal comfort.
(4) According to the control proportion of 25% dissatisfaction rate, it is suggested that the indoor air design temperatures of the station hall and platform at the subway stations in Xi’an should be 25.5 and 24.5 °C, respectively, which will satisfy most passengers’ needs for thermal comfort on the premise of saving energy.
The results of this study have guiding significance for the design and operation of air-conditioning systems in subway stations in Xi’an. The results are also applicable to other cities in cold regions of China with similar climatic conditions as Xi’an. However, it would not be suitable for other climatic regions because human thermal comfort has regional and climatic adaptability. The appropriate design temperatures for subway stations in other climatic regions need to be further studied.
In addition, the design temperature that can meet the thermal comfort of passengers concluded in this study is lower than the design value recommended by the Chinese Code for Design of Subway, so it will increase the energy consumption of air-conditioning. How much energy consumption will be increased and how to take energy-saving measures to reduce energy consumption while ensuring human thermal comfort will be the topic of future research.
Author Contributions

Conceptualization, X.S.; methodology, X.S. and S.C.; formal analysis, X.S. and S.C.; investigation, X.S. and S.C.; data curation, S.C.; writing—original draft, X.S., S.C., and B.H.; writing—review and editing, S.Y. All authors have read and agreed to the published version of the manuscript.

Funding

This research was funded by the Construction Technology Project of Department of Housing and Urban-Rural Development of Shaanxi Province (Grant No. 2015-K08), and the Key Research and Development Program of Shaanxi Province, China (Grant No. 2023-YBSF–382).

Institutional Review Board Statement

Not applicable.

Informed Consent Statement

Informed consent was obtained from all subjects involved in the study.

Data Availability Statement

The data presented in this study are available on request from the corresponding author.

Conflicts of Interest

The authors declare no conflict of interest.

Appendix A. Questionnaire on Thermal Environment of Metro Station

Questionnaire No:   Location of survey:   Time of survey:   
1. Essential information:
Age:   ,Biological sex (□Male □Female)Height:    cm
2. Type of figure:
□Thin□Slim□Normal□Strong□Fat
3. Current dress condition:
□ Shorts, Short-sleeved T-shirt□ Sports pants, Sweatshirt
□ Trousers, Short-sleeved T-shirt□ Skirt, Short sleeve
□ Trousers, Long-sleeved T-shirt□ Dress
4. Current physical condition:
□Level 1□Level 2□Level 3□Level 4□Level 5
ExcellentNormalRelatively poor (Be restricted exercise) Poor
(Be prohibited exercise)
Bad
(Be treating)
Healthy Sub-healthy Weak
5. Current activities:
□Walking□Jogging□Sprinting□Standing□Sitting□Light labouring□Heavy labouring
6. Social identity:
□Student□Office worker□ Metro station staff□Retired personnel□Other
7. Which time period do you take the subway more often?
Morning:□6:00—8:00□8:00—10:00□10:00—12:00
Afternoon:□12:00—14:00□14:00—16:00□16:00—18:00
Night:□18:00—20:00□20:00—22:00□22:00—23:00
8. How long do you usually stay at the station?
□1~2 min□2~3 min□3~5 min□5~ 8 min□More than 8 min
9. Current location:
□Entrance or exit□Station hall□Ticket office□Station platform□Office zone□Inside the train
10. Current sensation:
Thermal sensationObjective reflectionThermal sensationObjective reflection
□ColdBody shaking and getting goose bumps□Slightly warmFeel hot, sticky and moist
□CoolFeeling cold in part of body and uncomfortable□WarmThe body is slightly sweaty.
□Slightly coolFeeling cold in face but it could be tolerable□HotThe body is obviously sweaty.
□NeutralComfortable
11. Please evaluate the overall thermal comfort of metro station:
□Intolerable□Greatly uncomfortable□Uncomfortable□Slightly uncomfortable□Comfortable
12. Which season do you think the thermal environment of metro station is poor?
□Summer□Transitional season (Spring and Autumn)□Winter
13. Please evaluate the overall humidity comfort of metro station:
□Wet□Slightly wet□Neutral□Dry□Greatly dry
14. Do you have any discomfort?
□Nausea and dizziness□chest discomfort□Nothing□Other
15.Current mood:
□Happy□Anxiety□Very bad□Flat□Other
16. Please evaluate the current draft sensation:
□Strong□Relatively strong□Weak□Can’t feel it
17. Current thermal sensation of legs and knees:
□Cold□Cool□Slightly cool□Neutral□Slightly warm □Warm□Hot
18. Do you accept the overall thermal environment of the metro station?
□Yes□No
If you have any other questions or ideas about this questionnaire, please leave your valuable comments:
                                                  

References

  1. Xu, T.; Rao, Y.; Zhang, Z.; Chen, C. Statistical analysis and thinking on the first and last train times of China’s subway. China Metros 2020, 10, 48–51. [Google Scholar]
  2. Shang, P. Timetable Optimization in Urban Railway Transit Network under Dynamic Passenger Demand. Master’s Thesis, Tsinghua University, Beijing, China, 2016. [Google Scholar]
  3. Xu, G.; Zhao, L. Passenger flow characteristics and its impact on personnel air conditioning load in underground railway stations. HV&AC 2022, 52, 154–159. [Google Scholar]
  4. Chen, T.; Wu, X. Design of energy saving scheme for subway station ventilation and air conditioning system. Constr. Des. Eng. 2022, 20, 30–32. [Google Scholar]
  5. Yu, Y.; You, S.; Zhang, H.; Ye, T.; Wang, W.; Wei, S. A review on available energy saving strategies for heating, ventilation and air conditioning in underground metro stations. Renew. Sustain. Energy Rev. 2021, 141, 110788. [Google Scholar] [CrossRef]
  6. Li, G. Present Status and Development Trend of Ventilation and Air Conditioning System for Urban Rail Transportation. HV&AC 2011, 41, 1–6. [Google Scholar]
  7. Zhang, J.; Yuan, L.; Lu, J.; Shi, W.; Zhao, J.; Wang, F. Study on Energy-saving Operation Strategy of Ventilation and Air Conditioning System in Subway Station. Shanxi Sci. Tech. 2019, 34, 98–100. [Google Scholar]
  8. Guan, B.; Zhang, T.; Liu, X. Performance investigation of outdoor air supply and indoor environment related to energy consumption in two subway stations. Sustain. Cities Soc. 2018, 41, 513–524. [Google Scholar] [CrossRef]
  9. Su, Z.; Li, X. Sub-system energy model based on actual operation data for subway stations. Sustain. Cities Soc. 2020, 52, 101835. [Google Scholar] [CrossRef]
  10. Guan, B.; Liu, X.; Zhang, T.; Xia, J. Energy consumption of subway stations in China: Data and influencing factors. Sustain. Cities Soc. 2018, 43, 451–461. [Google Scholar] [CrossRef]
  11. Casals, M.; Gangolells, M.; Forcada, N.; Macarulla, M.; Giretti, A. A breakdown of energy consumption in an underground station. Energy Build. 2014, 78, 89–97. [Google Scholar] [CrossRef] [Green Version]
  12. Zhao, J. Study and Analysis of Subway Ventilation and Air Conditioning System Energy Consumption. Master’s Thesis, Wuhan University of Technology, Wuhan, China, 2014. [Google Scholar]
  13. International Organization for Standardization. ISO 7730: Moderate Thermal Environments: Determination of the PMV and PPD Indices and Specification of the Conditions for Thermal Comfort; International Standard Organization for Standardization: Geneva, Switzerland, 2005. [Google Scholar]
  14. ASHRAE. ASHRAE Standard 55-2010. Thermal Environment Conditions for Human Occupancy; ASHRAE: Atlanta, GA, USA, 2010. [Google Scholar]
  15. Han, J.; Kwon, S.; Chun, C. Indoor environment and passengers’ comfort in subway stations in Seoul. Build Environ. 2016, 104, 221–231. [Google Scholar] [CrossRef]
  16. Zhu, Y. Built Environment, 3rd ed.; China Architecture & Building Press: Beijing, China, 2010. [Google Scholar]
  17. Douglas, H.K.; Lee, A.H. Evaluation of Thermal Environment in Shelters; U.S. Department of Health, Education, and Welfare, Public Health Service, Division of Occupational Health: Washington, DC, USA, 1963.
  18. United States Department of Transportation. Subway Environment Design Hand Book (Volume1): Principles and Applications, , 2nd ed.; National Technical Information Service: Washington, DC, USA, 1975.
  19. Fan, L.; Feng, L. On design temperature of subway system by using relative warmth index. Urban Mass Transit 2002, 1, 50–52. [Google Scholar]
  20. Wang, C.; Feng, L.; Liu, Y. Design temperature criteria of environment control system of Chengdu subway set by RWI. China Railw. Sci. 2002, 23, 126–130. [Google Scholar]
  21. Ministry of Construction of the People’s Republic of China. Code for Design of Subway GB 50157-92; China Planning Press: Beijing, China, 1992.
  22. Liu, G.; Zhu, J. Preliminary discussion on design parameter inside of room for air conditioning in summer season at Shenzhen subway. J. Railw. Eng. Soc. 2002, 32, 34–38. [Google Scholar]
  23. Yin, K.; You, S. Study on the air-condition control temperature in Tianjin subway Station. J. Shandong Jianzhu Univ. 2008, 23, 466–470. [Google Scholar]
  24. Xin, W.; Zhao, L.; Zhu, C. Operational temperatures and modes of air conditioning system in Subway Stations. Urban Rapid Rail Transit 2009, 22, 57–60. [Google Scholar]
  25. Ministry of Construction of the People’s Republic of China. Code For Design Of Subway GB 50157-2003; China Planning Press: Beijing, China, 2003.
  26. Zhu, P.; Wang, C.; Tong, X.; Song, H.; Li, X. Research on dynamic thermal comfort evaluation of passengers in underground railway station. HV&AC 2016, 46, 101–104. [Google Scholar]
  27. Ministry of Housing and Urban-Rural Development of the People’s Republic of China. Code for Design of Subway GB 50157-2013; China Architecture & Building Press: Beijing, China, 2013.
  28. Guo, Y. Environmental control system design in Xi’an underground railway line 2. HV&AC 2014, 44, 43–49. [Google Scholar]
  29. Ministry of Housing and Urban-Rural Development of the People’s Republic of China. Design Code for Heating Ventilation and Air Conditioning of Civil Buildings GB 50736-2012; China Architecture & Building Press: Beijing, China, 2012.
Figure 1. Hourly variation in the temperature and humidity outdoors.
Sustainability 15 06111 g001
Figure 2. Hourly variation in the temperature and humidity of the station halls. (a) Station A. (b) Station B.
Sustainability 15 06111 g002
Figure 3. Hourly variation in the temperature and humidity of the platforms. (a) Station A. (b) Station B.
Sustainability 15 06111 g003
Figure 4. Distribution ratio of subjects’ gender.
Sustainability 15 06111 g004
Figure 5. Distribution ratio of subjects’ age.
Sustainability 15 06111 g005
Figure 6. Distribution ratio of subjects’ activity status.
Sustainability 15 06111 g006
Figure 7. Distribution ratio of subjects’ thermal sensation. (a) Station A. (b) Station B.
Sustainability 15 06111 g007
Figure 8. Distribution ratio of subjects’ thermal comfort. (a) Station A. (b) Station B.
Sustainability 15 06111 g008
Figure 9. Relationships between the thermal resistance of the air boundary layer outside clothing Ia, and the total air velocity [18].
Sustainability 15 06111 g009
Figure 10. Corresponding relationships between RWI value and the proportion of people expecting to have a cooler environment in summer [18].
Sustainability 15 06111 g010
Figure 11. Comparisons of the results predicted from the RWI method and questionnaire survey.
Sustainability 15 06111 g011
Figure 12. Change in the RWI value during the process of passengers’ entering the station to getting on trains under the background of different environment temperatures. (a) At the measured temperatures of Stations A and B. (b) At the originally designed temperature and the temperature recommended in this study.
Sustainability 15 06111 g012
Table 1. Testing instruments and related technical parameters.
InstrumentType (Specifications)Measured Parameter Measuring RangeMeasurement Accuracy
Temperature and humidity testerTESTO 174HTemperature
Humidity
−20–70 °C (temperature)
0–100% (humidity)
±0.5 °C (temperature)
±3% (humidity)
Air velocity testerTESTO 405-V1Air velocity0–5 m/s (−20–0 °C)
0–10 m/s (0–50 °C)
±0.1 m/s (<2 m/s)
±0.3 m/s (>2 m/s)
Table 2. Metabolic rate, thermal resistance of clothing, and activity-induced velocity under different activities [18].
ActivityMetabolic Rate M (W/m2)Thermal Resistance of Clothing Soaked with Sweat Icw (clo)Activity-Induced Velocity Vb (m/s)
Basic metabolism47.30.60
Sitting still for rest630.60.1
Buying tickets at a sitting posture78.80.40.25
Buying tickets at standing posture88.20.50.15
Standing or walking occasionally122.90.40.5
Walking, 3.2 km/h122.90.41
Walking, 4.8 km/h170.10.351.5
Walking, 6.4 km/h223.70.32
Table 3. Relationships between the RWI value and ASHRAE thermal sensation scale [18].
RWIASHRAE Thermal Sensation Scale
0.25Warm
0.15Slightly warm
0.08Thermal neutral
0.00Slightly cool
Table 4. Measured temperature and humidity parameters for each environment control unit at Stations A and B in summer.
Environment Control UnitTemperature (°C)Relative Humidity (%)Water Vapor Pressure (Pa)
Entrance–exit of Station A32.556.22700
Station hall floor of Station A2666.32180
Platform floor of Station A27.966.62330
Entrance–exit of Station B32.556.22700
Station hall floor of Station B24.774.12250
Platform floor of Station B25.172.22300
Table 5. Basic parameters of each environment control unit in the process of passengers’ entering stations and getting on trains.
Environment Control UnitEntrance–ExitStation Hall FloorPlatform Floor
ActivityWalking (4.8 km/h)Walking (3.2 km/h)Stopping immediately3 min after stopping
(Standing or walking occasionally)
Metabolic rate M (W/m2)170.1154.4154.4130.8
Ambient velocity Va (m/s)2111
Activity-induced velocity
Vb (m/s)
1.510.50.5
Thermal   resistance   of   air   boundary   layer   outside   clothing   I a (clo)0.240.30.340.34
Thermal   resistance   of   clothing   under   wet   conditions   I cw (clo)0.350.370.370.39
Average radiation heat gain per unit area of skin R (W/m2)31.5000
Stay time τ (s)301200180
Table 6. Temperature and humidity of subway stations under outdoor design parameters and design conditions in Xi’an in summer.
Environment Control UnitTemperature (°C)Relative Humidity (%)Water Vapor Pressure (Pa)
Entrance–exit30.772%3010
Station hall floor3040–70%2300
Platform floor2840–70%2075
Table 7. RWI value for different environment control units at Stations A and B under different working conditions of calculation.
Working Condition of CalculationEntrance–Exit of Stations A/BStation Hall of Stations A/BPlatform of Stations A/B
Stopping Immediately3 min after Stopping
Measured temperature0.450.19/0.160.28/0.20.22/0.14
Designed temperature0.390.30.270.22
Disclaimer/Publisher’s Note: The statements, opinions and data contained in all publications are solely those of the individual author(s) and contributor(s) and not of MDPI and/or the editor(s). MDPI and/or the editor(s) disclaim responsibility for any injury to people or property resulting from any ideas, methods, instructions or products referred to in the content.