Abstract
Air pollution represents one of the most complex problems of humanity. Traffic contributes significantly to this by emitting large amounts of harmful gases. This problem is particularly pronounced at urban intersections due to frequent changes in vehicle movement dynamics. This paper primarily presents the influence of intersection geometry on pollutant emissions levels. In addition, the influence of various traffic policies promoting greater use of public transport and zero-emission vehicles is also examined. The research combines the field part of recording existing intersections in Sarajevo, Bosnia and Herzegovina with traffic microsimulation. Detailed data on vehicles’ movements were obtained by advanced video processing using the DataFromSky tool, while the PTV Vissim 2022 and Bosch ESTM (2022) software were used to simulate traffic and estimate emissions at geometrically different intersections. The results showed that, in saturated traffic conditions, signalized intersections cause up to 50% lower emissions compared with two-lane and turbo roundabouts and that the impact of the geometric change is more significant than the impact of zero-emission vehicles. In unsaturated conditions, the differences in emissions at different intersections are negligible, with the highest reductions in pollution achieved by using zero-emission vehicles.
1. Introduction
Air pollution is one of the biggest problems facing modern humanity, causing many premature deaths and severe health problems, and negatively affecting the overall quality of life [1,2]. Although efforts to reduce air pollution in the last two decades have led to a global decrease in the concentration of certain pollutants in the air, especially in developed countries, the number of premature deaths has not significantly decreased [2]. At the same time, developing countries, one of which is Bosnia and Herzegovina, are recording an increased level of urbanization and economic development, which causes more significant air pollution and higher population mortality. While the European Union member states strive to reduce greenhouse gas emissions by 95% by 2050, road traffic contributes 71% of emissions [3,4]. Regarding the share of its contribution of individual pollutants, road traffic in the EU was responsible for 21% of carbon monoxide (CO), 39% of nitrogen oxide (NOx), and 10% of particulate matter (PM10 and PM2.5) emissions in 2019 [5]. Therefore, air pollution is a central topic for the future of the transport sector to achieve sustainable transport.
According to the annual Federal Hydro-Meteorological Institute report [6], the air quality in all parts of Bosnia and Herzegovina, especially in Sarajevo, the capital and largest city, has been seriously impaired for years, with a significant concentration of particulate matter, nitrogen oxide, and ozone. The most significant pollution causes are wood and coal burning used for heating, fossil fuel combustion, heavy industry, and energy production in thermal power plants. In addition, the lack of dispersion due to the specific location of Sarajevo in a valley contributes to the high concentration of pollutants. The presence of particulate matter has been the most characteristic form of air pollution for years. At all measuring points in Sarajevo, its concentration is higher than the legal limit (40 μg/m3 for PM10 and 25 μg/m3 for PM2.5, which aligns with the EU directive [7]). In 2021, the maximum hourly concentration of PM10 was 673 μg/m3, with the daily concentration exceeding the limit 86 days a year. At the same time, the highest hourly concentration of PM2.5 was 297 μg/m3, and the daily concentration was exceeded for 62 days [6]. Research conducted in Sarajevo [8] during the winter months of 2020 and 2021, when the concentration of pollutants is the highest, based on the examination of the chemical composition of particulate matter, indicates that road traffic is the cause of 23% of this type of pollution. The problem is even more critical because these particles have the most significant and direct negative impact on people’s health [9]. Despite this problem, in the winter months, citizens avoid alternative transport modes (walking, cycling, electric scooter use, etc.) and use personal cars even more, creating a never-ending negative cycle.
Measures to reduce air pollution in urban areas can be infrastructural at different levels (planning, designing, and management) and legal at the national level in terms of promoting the use of zero-emission vehicles and reducing the use of fossil fuel cars with low emission standards. These measures do not have the same efficiency, speed of action, or cost of implementation, and may or may not be justified by the level of pollutant emission reduction. Infrastructural changes often solve not only traffic jams but also the problem of traffic safety. However, they can also affect the reduction or increase in emissions of harmful gases from traffic [10,11].
The emissions from traffic and fuel consumption depend on: the vehicle type and age, fuel type, driver characteristics, and vehicle movement dynamics; the geometric characteristics of the road; and atmospheric conditions [12,13]. In addition, it also depends on road class (i.e., local road, urban road, or highway), which is also related to the dynamic characteristics of vehicle movement. Frequent speed changes with many accelerations, brakings, and stops contribute significantly to emissions [13,14,15,16,17,18,19]. Field measurements performed in Germany [20], using three different Euro 6 standard vehicles equipped with Portable Emission Measurement System (PEMS), showed that driving at a constant speed in the range of 40–140 km/h leads to a reduction in NOx emissions by 69% compared with driving at a constant speed in the range of 20–40 km/h. At the same time, driving at a constant speed of more than 140 km/h increases NOx emissions by 200%. In addition, regardless of size, vehicles emit 650% more NOx while accelerating compared to vehicles at a constant speed in the range of 0–20 km/h, and 400% more than vehicles at speeds of 25–100 km/h and greater than 100 km/h. Generally, it can be concluded that the acceleration state, regardless of driving speed, leads to 490% higher NOx emissions than driving at a constant speed [20].
Intersections are spots in a road network with the most significant number of stops and driving dynamics changes, making them places with the highest concentration of pollutants [12,14,21,22,23,24]. By correctly choosing the type of intersection and traffic control, it is possible to influence the nature of traffic flow and, thus, the level of emissions [14]. An optimal intersection should allow vehicles to move at a moderate constant speed, without significant oscillations—even though decelerations and accelerations are inevitable—and without unnecessary stops. Of course, this choice is not simple or unique and depends on traffic volume, vehicle type composition, and the movement distribution at the intersection. Saturated traffic conditions imply the movement of vehicles in stop-and-go mode with frequent speed changes, so that the basic efficiency measures (i.e., average delay, queue length) are in direct correlation with the level of pollutant emissions.
Environmental impact is often neglected when choosing the optimal type of intersection, and the focus is on delay calculation and safety [24]. Existing methodologies for intersection analysis (e.g., US Highway Capacity Manual) also do not provide recommendations regarding this impact. Although the scope of research on the influence of the intersection type on emissions levels has increased in the last ten years, there is still no single conclusion as to which typed of intersection can contribute to the reduction of total emissions from traffic. Considering the general increase in the construction of new roundabouts in the last two decades, primarily due to their advantage in terms of safety compared with signalized intersections [15,25,26], the advantage in terms of pollutant emissions is also often highlighted. This conclusion is primarily because roundabouts do not necessarily require vehicles to stop, and vehicles spend less time in the mode of movement with constant braking and acceleration [17,19,27,28,29]. In addition to the analysis of classic roundabouts, existing research also includes the analysis of their alternative type, i.e., a turbo roundabout. The turbo roundabout was invented in the Netherlands, primarily to reduce the number of conflict points compared with the two-lane roundabout [25,30,31,32]. Namely, when vehicles leave a two-lane roundabout from the inner lane, their visibility is reduced, which causes a conflict with vehicles in the outer lane. In a turbo roundabout, vehicles should choose the desired direction before entering the intersection so that there is no intertwining of traffic flows in the roundabout. The characteristic spiral shape of the turbo roundabout directs the vehicles to the desired exit, and divided curbs (delineators) mark the permitted paths [33,34]. Although the main focus of existing research has been on safety improvements, turbo roundabouts can also be analyzed from the aspect of impact on the emission level compared with other types of intersections.
Developing countries, such as Bosnia and Herzegovina, still do not have a significant number of registered zero-emission vehicles. However, there are frequent changes in the geometry of existing intersections, primarily due to safety and delay issues. The government finances such interventions as public investment, which costs less than the total amount of individual investments in terms of changing the composition of the traffic flow, which also requires a change in drivers’ habits. For this reason, it is necessary to investigate how geometric changes in intersections can reduce the emission of harmful gases. Bearing in mind that the areas around urban intersections are very densely populated, reducing pollution becomes even more critical. This paper presents research conducted at six intersections of different types in Sarajevo (two-lane roundabouts, signalized, and two-way yield-controlled intersections). At each of the analyzed locations, at least two alternative intersection types were proposed, and CO, CO2, NOx, and PM emissions and fuel consumption were determined by a combination of field research and microsimulations. Field research was done with advanced processing of video recordings, where the trajectory of each vehicle was analyzed in detail. Vehicle trajectories contain data on vehicles’ speed and acceleration at the second-by-second level, and they were used for the detailed calibration of microsimulation models. The obtained results can serve as guidelines for a complete analysis of different intersections and the choice of the optimal type, including environmental impact. The results also show to what extent a geometric change of intersection is a more efficient solution than traffic flow composition modification, such as introducing zero-emission vehicles or reducing the use of personal cars.
2. Literature Review
Previous research on the road infrastructure’s impact on pollution differs significantly in the approach and the methodologies used. In the following, we have described the most relevant existing research that treated the influence of intersection type on pollution.
Mądziel et al. [27] investigated the impact of replacing the existing two-lane roundabout with a turbo roundabout in terms of emissions from traffic, both for the case before and after the COVID-19 pandemic. The research combines field pollution measurement with a PEMS device installed on 14 vehicles and microsimulation models created in PTV Vissim (2022) software. Field data on vehicle speed and acceleration were used to calibrate microsimulation models, while the VERSIT+ pollutant dispersion model was used to estimate pollutant emissions. The results showed a reduction in CO2 and PM10 emissions by 23% and NOx by 16% at the turbo roundabout for the case of maximum hourly traffic load, before the pandemic. The improvements were less significant, but again on the side of the turbo roundabout, for the scenario with fewer vehicles during the pandemic.
Using the same methodology and research location, Mądziel et al. [35] found that replacing 25% of the existing fleet with electric cars results in a 30% reduction in PM10 emission.
Analyzing the operational differences between an existing one-lane and a planned two-lane roundabout, Tenekeci [36] concluded that the construction of a two-lane roundabout significantly reduces delays and the number of stops, but also the emission of pollutants: CO2 (up to 32%), NOx (up to 34%), and PM10 (up to 26%). The research was done with a combination of macroscopic modeling (for prediction of traffic distribution in the future), microscopic modeling (for modeling and calibration of the existing intersection), and the instantaneous emission model EnViver VERSIT+ to estimate the level of pollutant emission.
Using the PEMS system installed on nine passenger cars of different EURO standards, Jaworski et al. [9] collected data on pollutant emissions on different parts of the road network (five roundabouts, urban and rural roads, and a motorway). The highest CO2 emissions and fuel consumption were recorded on the highway, while, as expected, the lowest emissions were recorded for EURO 6 vehicles with diesel engines. Considering intersections only, higher fuel consumption and CO2 emissions were noticeable at roundabout entries, during circular driving, and at the exits. Based on all collected data and using regression analysis, they proposed a model for emission estimation at roundabouts called the RoundaboutEM application.
The same group of authors published research [15] comparing emission levels on an existing two-lane roundabout and a planned turbo roundabout using the microsimulation software PTV Vissim, EnViVer Versit+, and the mesoscopic model “Computer Program to Calculate Emissions from Road Transport” (COPERT 5). According to this study, turbo roundabouts reduce NOx emissions by 31% and PM10 emissions by 26%.
Meneguzzer et al. [14] compared pollutant emissions at a signalized intersection and a roundabout planned at the exact location. Emissions were determined by the PEMS system installed on one EURO 4 standard vehicle. The results showed lower CO and CO2 emission levels at the roundabout, while lower NOx emission was measured at the signalized intersection.
Mauro R. and Guerrieri M. [37] did a comparative life-cycle analysis for different roundabouts. Using the COPERT IV model, they concluded that, in a period of 30 years, turbo roundabouts generate 10% fewer emissions compared with two-lane roundabouts. At the same time, changing the vehicle volume did not result in significant differences in the emission of individual pollutants on two-lane and turbo roundabouts. A similar study, using the same theoretical models of different roundabout types and the COPERT IV model, was published by Tollazzi et al. [28], with the conclusion that there are no significant differences in terms of emissions between the classic one-lane and two-lane roundabouts and alternative types such as “target” or “flower” roundabouts. The COPERT IV model was also used in a study by Gokhale [38] to determine pollution at a roundabout and a signalized intersection.
By combining field measurements on three two-lane and turbo roundabouts, and the vehicle-specific power (VSP) methodology, Fernandes et al. [39] compared emission and capacity results. The speed and acceleration profiles were obtained by test-driving a EURO 5 standard vehicle with a GPS device, while the emission level was determined for different traffic load scenarios. They concluded that, in the case of a traffic demand of less than 800 veh/h, emissions of the most critical pollutants (NOx, PM, CO2, and CO) are higher on average by 12–20% on turbo roundabouts compared to two-lane roundabouts. For higher traffic volume (>1200 veh/h), the difference in emissions becomes even more significant, up to 29%.
In papers published by Fontes et al. [40], Song et al. [41] and Borrego et al. [42], the VSP methodology in combination with microsimulations (PTV Vissim) was also used to estimate emission levels from traffic on the urban road network, while Salamati et al. [43] used only the VSP methodology to determine pollutant emissions on existing two-lane roundabouts.
Based only on a microsimulation approach using PTV Vissim and EnViVer Versit+ 3.0 Pro software, Giuffrè and Canale [16] compared four types of intersections: unsignalized, signalized, one-lane roundabout, and turbo roundabout. Applying several scenarios with different traffic volumes, they concluded that the highest emission levels were at the signalized intersection, while the lowest were at the one-lane roundabout and unsignalized intersection. The difference in emission level is more evident for higher traffic volumes and with a dominant number of left turns. The same methodology, but on an existing signalized intersection, was applied by Chauhan et al. [44]. Their results showed that by choosing the optimal cycle length, the emission level could be reduced up to 7% (depending on pollutant type).
Using the COPERT IV model for emission estimation and theoretical scenarios of traffic volume, movement distribution, traffic flow composition, and characteristics of intersections, Guerrieri et al. [45] concluded that classic one-lane roundabouts are the optimal solution in terms of emissions for lower traffic volumes, up to 1300 veh/h, and the worst for volumes greater than 2500 veh/h. At the same time, classic two-lane roundabouts represent a better solution than turbo roundabouts in capacity and emissions for all higher traffic volumes.
Salamati et al. [26] applied the VSP methodology to almost 2000 trajectories at existing signalized intersections and roundabouts. Their findings suggest that emission rates are generally higher at signalized intersections under unsaturated flow conditions. However, with an increase of saturation level over 0.7, pollutant emissions are higher at roundabouts, especially in the case of favorable progression at signalized intersections. When demand reaches capacity, emission rates increase sharply at signalized intersections and moderately at roundabouts.
The opposite conclusion was reached by Gastaldi et al. [24], analyzing a one-lane roundabout and a signalized intersection. They used microsimulation software Paramics (2012) and AIRE (Analysis of Instantaneous Road Emissions) (2011) to determine the emissions. The obtained results showed that the travel time is significantly reduced by using a signalized intersection. However, the emission rates are reduced by only 2–5% depending on the specific pollutant type. Furthermore, roundabouts are a more favorable solution regarding emissions only for higher demand levels.
Vasconcelos et al. [46] researched an existing one-lane roundabout and planned two-lane and turbo roundabouts. Using Aimsun microsimulation software and the VSP methodology, they determined the emission level at each intersection for different traffic distribution scenarios. Compared with a one-lane roundabout, the emission on a two-lane roundabout was lower by 15–22%, depending on traffic volumes and the pollutant type. The turbo roundabout also showed a lower emission level than the one-lane roundabout, but slightly higher than the two-lane roundabout, for CO2 and NOx.
Roundabouts cause 7% higher CO and 9% NOx emissions in contrast to a signalized intersection, in a study published by Chamberlin et al. [47]. The results were obtained by combining the microsimulation software Paramics and two pollutant emission estimation tools, MOtor Vehicle Emission Simulator (MOVES) and Comprehensive Modal Emissions Model (CMEM), with a theoretical assumption about the vehicle volume and movement distribution, and geometric characteristics of intersections. They obtained similar results regardless of the traffic volume size.
Hallmark et al. [19] published one of the first studies in which the PEMS system was used to determine on-road emissions. The research was carried out on two corridors with a total of seven intersections of different types (roundabout, signalized, and four-way stop). Data on emissions were collected by two drivers driving the same vehicle. The limitations of the research are that it was conducted only in unsaturated traffic conditions and that only straight movement through intersections was considered. The results do not lead to a unique conclusion in terms of emission level and depend on the location of the intersection and driving style. However, it can be concluded that CO, CO2, and NOx emission is the lowest at the four-way stop intersection. Also, in most cases, the emission of these pollutants is lower at a signalized intersection than at a roundabout.
Ahn et al. [29] determined the differences in vehicle emissions using an existing two-way-stop-controlled intersection and models of a signalized intersection and a roundabout. They used microsimulation software INTEGRATION and PTV Vissim to model alternative intersection solutions, while emissions were estimated using the VT-Micro model and Comprehensive Modal Emissions Model (CMEM). Both methodologies gave consistent emission results. For all pollutants, the roundabout represented the worst solution and the stop-controlled intersection the best, although the roundabout application resulted in less delay and queue length.
Unlike previous research that primarily focused on individual locations, Sharifi et al. [10] analyzed the road network of 72 stop intersections in El Paso (TX, USA) and their conversion into multi-lane roundabouts. Using the mesoscopic dynamic traffic assignment model and the U.S. Environmental Protection Agency’s MOtor Vehicle Emission Simulator (MOVES), they determined that roundabouts reduce CO2 emissions by more than 50 tons.
Fernandes et al. [32] investigated pollutant emissions along turbo roundabout corridors. By applying microsimulations and the VSP methodology for emission calculation, they concluded that the highest emissions occur at the downstream segments of turbo roundabouts, not at the entrance or when passing through intersections. Compared to classic two-lane roundabouts, no statistically significant differences in emissions were obtained, although the travel time was longer in the case of turbo roundabouts. They also concluded that it could not be claimed that turbo roundabouts would have a positive impact on emissions in the case of a saturated traffic flow.
A review of existing research makes it clear that there is no single conclusion regarding the influence of intersection geometry on emission levels. Different approaches are used to determine the level of vehicle emission, which can generally be divided into three groups: field determination, traffic simulations, and a combination of the first two approaches. The PEMS system guarantees the most accurate emission results regarding on-road tests. The main disadvantage of this approach is that the results refer only to the vehicle on which this device is installed, so, for a reliable conclusion, which must include different vehicles and driving styles, a large number of samples is required. This is difficult to achieve in actual conditions because it is time-consuming and financially demanding. Traffic simulations are often used to overcome a problem like this. Emissions can be estimated at different levels using macroscopic or microscopic models. Macroscopic models like COPERT apply to regional or road-network-wide research. However, they cannot reliably estimate the emissions at intersections because they rely on average traffic flow speed instead of individual vehicles’ characteristics. On the other hand, microsimulation models can simulate the movement of individual vehicles, solving sample size and reliability problems. The critical step in creating reliable microsimulation models and obtaining accurate emission results is their proper calibration based on actual traffic data.
From the previous two chapters, it is clear that the problem of traffic pollution is a very current topic worldwide, especially concerning climate change and the seriousness of the consequences of long-term exposure to such pollution. On the other hand, different methods of traffic regulation can significantly affect the emission levels, but this assessment is often inadequate or insufficiently detailed.
The main goal of this research is to determine the impact of intersection geometry on air pollution in urban areas by applying advanced data collection and traffic simulation techniques. The research was carried out at six existing intersections in Sarajevo, covering all standard types of intersections. Previous studies were usually based on only one intersection type (signalized or roundabout) and only on one intersection. The data collection problem was solved using advanced video processing, where all vehicles moving through intersections were analyzed. At least two alternative types are proposed for all existing intersections to compare emission results. The emission assessment was performed using Environmental Sensitive Traffic Management (ESTM) by Bosch, which represents an instantaneous emission model calibrated based on actual traffic flow structure data. In addition to the influence of intersection geometry, the impact of different traffic policies promoting greater use of public transport and zero-emission vehicles on the emission level was also examined. The research results can be used twofold: primarily, to select the optimal intersection type, regarding emissions, which can be applied in the design and planning phase of the road network; and secondly, to determine the most appropriate long-term approach to solving traffic pollution more strategically.
3. Materials and Methods
The research methodology presented in this work is shown in Figure 1.
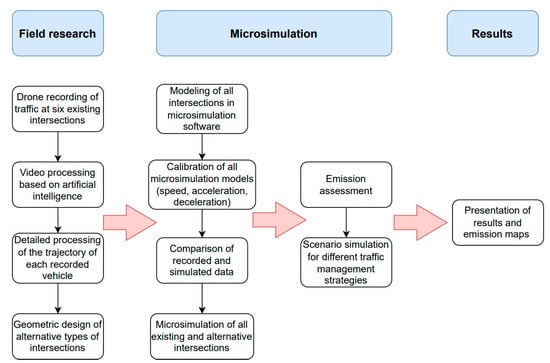
Figure 1.
Research steps.
Six existing intersections of different geometric layouts were selected for the field part of the research and data collection. In Table 1, the basic characteristics of these intersections are presented. Each intersection is assigned a unique ID number (1 to 6), making the rest of the analysis easier to follow. Figure 2 shows the geographical locations of the analyzed intersections, while Figure 3 shows their layout. All intersections are located in the urban part of the city. Intersection 1 is a classic two-lane roundabout with all two-lane entries and exits. The dominant movements on three out of four approaches are through and right. Intersection 2 is also a two-lane roundabout, with all one-lane entries and exits. Near this location (<120 m), there is a three-leg signalized intersection, which was also taken into account during the research because it significantly affects the operational characteristics of the roundabout due to the dominant movement of vehicles from the roundabout towards this intersection.

Table 1.
Basic information about the analyzed intersections.
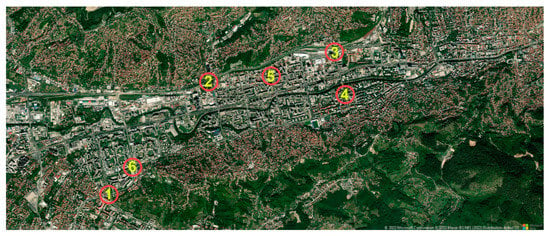
Figure 2.
Geographical location of the analyzed intersections in Sarajevo, Bosnia and Herzegovina. Note: 1 to 6—intersection ID (Table 1).
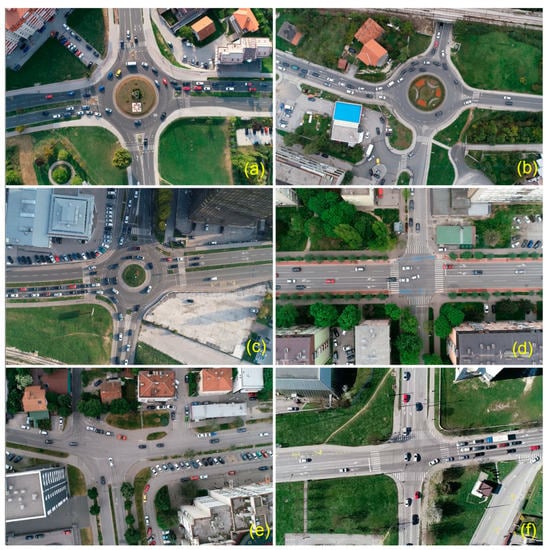
Figure 3.
The existing layout of the analyzed intersections. (a) Intersection 1; (b) Intersection 2; (c) Intersection 3; (d) Intersection 4; (e) Intersection 5; (f) Intersection 6.
A two-lane roundabout with four approaches—three two-lane and one single-lane—was analyzed at the third location. Dominant movements at the intersection are from all approaches towards the single-lane exit. Intersection 4 is a signalized intersection at the cross of a four-lane main road and a two-lane minor road with additional left-turn lanes. Through movements are dominant on all approaches. Intersection 5 is a yield-controlled intersection with an atypical shape because the streets do not cross at right angles, nor are they symmetrical concerning the axis of the intersection. Three streets are two-lane, while the fourth street is four-lane. Two-lane roads with dominant through movement represent the main traffic direction. The sixth intersection is signalized with three two-lane streets, two of which have additional left-turn lanes and represent the main direction, and the fourth approach is a four-lane street. There is also a fifth connection at the intersection, serving as a right-turn bypass. Dominant movements at the intersection are through and left from the main direction.
The intersections were chosen to cover most of the city’s urban part, with sufficient physical space at each location for their modification. It was also taken into account that such modification, as an alternative type of intersection, corresponded to the broader road network and that geometric changes are planned in the future or have already been made at these locations.
The traditional way of collecting traffic data involves two approaches: observing vehicles at just one moment, i.e., at the place of a stationary radar or pneumatic tubes, or a GPS device installed in a test vehicle that moves through the research area. Both approaches have severe limitations regarding the collected data, directly affecting the research quality. With the first approach, it is possible to observe many vehicles over a longer time period. However, in this way, data is obtained at only one point in time, and it is not possible to obtain vehicle trajectory, which contains both spatial and temporal changes in vehicle movement. The second approach provides a precise trajectory of the vehicle’s movement with all the necessary data, but the disadvantage is the sample size. In most cases, when this method is used, the sample is minimal and maintains only the characteristics of the test vehicle and one or two different drivers.
In this research, we used a drone to make traffic videos at all intersections. Data collection was conducted in the periods September–October 2021 and April–May 2022. The traffic recording at each intersection was carried out two days in the same week, for one hour each in the morning and afternoon, the busiest traffic periods. In this way, a total of 24 h of video recordings was obtained. Table 1 shows the maximum hourly traffic volume at each location, which was used in the rest of the research. It should be noted that the number of heavy goods vehicles and pedestrians at all intersections was negligible, and they are excluded from the analysis.
Traffic videos are the most valuable data source on vehicle movement, as they contain complete space-time trajectories of all vehicles in the area covered by the video and all movement data (speed, acceleration, deceleration, headway, etc.) of each vehicle. However, the problem is post-processing the videos and gathering all the necessary data from them. New innovative technologies based on artificial intelligence enable deep footage analysis and extraction of vehicle trajectory for each detected vehicle. In that sense, one of the currently most advanced tools, DataFromSky, was used in this research to process video recordings. This technique ensures 100% recognition of all vehicles in the video, their classification, and detailed movement analysis. The selected resolution of data extraction on speed, acceleration, travel time, and distance traveled of each vehicle was one second. These data were exported to a .csv file and additionally processed in a suitable form for the subsequent creation and calibration of microsimulation models. Figure 4 shows the steps of traffic video processing.
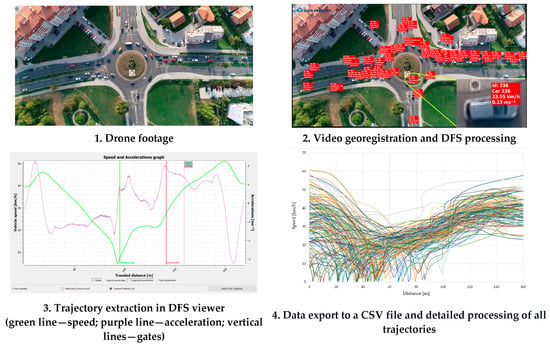
Figure 4.
The process of data collection and video processing.
In the second part of this research, at least two alternative types of intersections were designed at each analyzed location, respecting existing conditions and limitations. The total number of analyzed intersections, including the existing layouts, was 19. At Intersections 1, 2, and 3, a turbo roundabout and a signalized intersection were considered as an alternative, noting that Intersections 2 and 3 were previously signalized intersections and subsequently reconstructed into two-lane roundabouts. Turbo roundabouts represent the most common modification of the standard two-lane roundabout because of their advantages described in the introduction of this paper. The first standard turbo roundabout was recently built in Bosnia and Herzegovina, so their operational characteristics still need to be researched in actual traffic conditions. At Intersections 4, 5, and 6, the alternative geometric solutions were two-lane and turbo roundabouts. In addition, a signalized solution was also analyzed at Intersection 5, a two-way yield intersection. It is necessary to emphasize that all analyzed roundabouts are two-lane, with all two-lane entries and exits that correspond to the configuration of existing roads.
3.1. Microsimulation Models
Dynamic characteristics of vehicle movement significantly influence the level of emitted pollutants. Frequent speed changes with frequent accelerations, decelerations, and many stops increase emissions [13,41]. For this reason, the models used to simulate vehicles’ movements and estimate emissions must be sufficiently sensitive to these changes and reliably replicate them, which a proper model calibration can ensure.
When creating microsimulation models in practice, it is often attempted to simulate vehicle numbers and travel times that correspond to actual conditions. At the same time, little or no attention is paid to the calibration of achieved speeds and accelerations. Such calibration requires more time and detailed processing of a large amount of data. Moreover, required calibration goals can be achieved by changing different model parameters, which means that different vehicle trajectories can result in the same travel time and number of simulated vehicles [12]. In order to create a model that will reliably estimate the emissions level from traffic, it is necessary to calibrate vehicle trajectories and verify that their characteristics correspond to the actual vehicle movement [12,13,26,27,29,48].
The microsimulation software PTV Vissim 2022 was used to simulate the vehicles’ movements and estimate the emissions. The calibration of the existing intersection models was performed by adjusting four fundamental parameters that are crucial for describing the way the vehicle moves: (1) desired speed distribution, (2) desired acceleration function, (3) maximum deceleration function, and (4) desired deceleration function [27,49]. In PTV Vissim, all four parameters are defined as distributions or functions, not fixed values.
Desired speed distribution is determined by measuring the free-flow speed on approaches to the intersection. Given that we analyzed intersections within urban conditions, high speeds and their large oscillations cannot be expected, as on rural roads. The free-flow speed limit is set at 40 km/h, measured for vehicles moving with more than 5 s headways. Figure 5 shows the cumulative probability distribution of the desired speeds for all analyzed intersections.
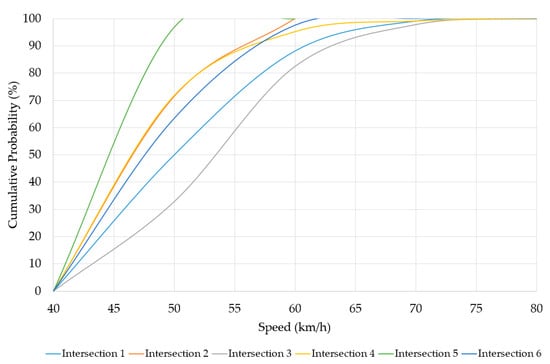
Figure 5.
Cumulative probability distribution of the desired speeds for analyzed intersections.
The functional dependencies of speed/acceleration/deceleration were the basis of the stochastic representation of the vehicle’s movement [13]. For each acceleration and deceleration function, it was necessary to define three curves for the maximum, mean, and minimum values. Based on the trajectories of all recorded vehicles, the model calibration of all six analyzed intersections was performed to obtain a unique set of desired speeds and acceleration functions for each location. Each vehicle’s speed, acceleration, and deceleration were recorded in time intervals of 1 s, corresponding to the resolution of the microsimulation. These speeds were divided into 5 km/h range classes, from 0 km/h to the maximum recorded speed. The maximum, minimum, and mean values were determined for each speed class and acceleration/deceleration within that class. The maximum deceleration function was determined using 5% of the highest deceleration values, while the remaining values were used to determine the desired deceleration: the 5th percentile for the maximum curve, the 52.5th percentile for the mean curve, and the 100th percentile for the minimum curve. In the desired acceleration function the maximum curve was determined as the 95th percentile of all values, while the mean and the minimum curves depended on the probability of reaching the desired acceleration, which increases linearly with increasing speed. The maximum probability of reaching the desired acceleration occurs when the desired speed is reached. The calibration method adopted in this research is also explained in detail elsewhere (e.g., [13,49]). Figure 6 shows the default and calibrated acceleration and deceleration functions used to create the microsimulation models. The displayed curves also maintain different movement patterns at three different types of intersections. It can be noticed that the curves for Intersections 1 and 3 significantly deviate from the others, which corresponds to the highest level of saturation and the most congested traffic conditions.
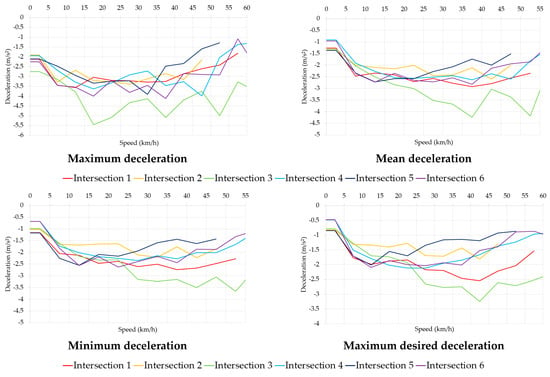
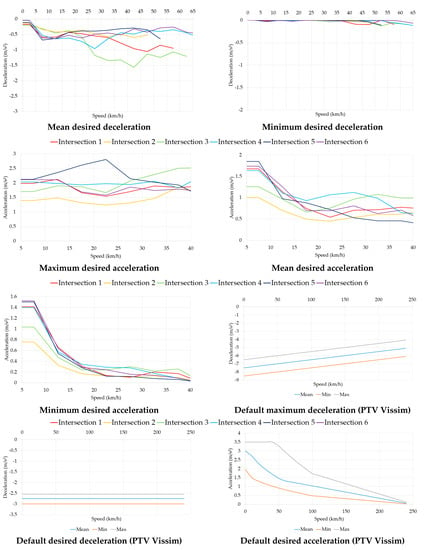
Figure 6.
Acceleration and deceleration functions for analyzed intersections.
After the calibration, the observed and simulated values of speed, acceleration, and deceleration were compared, and obtained deviations were quantified by chi-square error (X2) using the following equation:
Table 2 shows the X2 values for all analyzed locations, where it is evident that its values decrease drastically after calibration. Besides the fact that the default and observed acceleration and deceleration values differ significantly, during simulations with default values, a large number of unrealistically high acceleration (>4 m/s2) and deceleration values (>8 m/s2) appear. These values result from the default curves shown in Figure 6 and do not represent a realistic picture of vehicle movement.

Table 2.
Chi-square error (X2) for default and calibrated values.
Figure 7 shows the differences between the measured, calibrated, and default values of speeds and accelerations for all classes for only one intersection (Intersection 2). Differences for other intersections have similar trends. The stochastic nature of traffic was successfully replicated by analyzing the trajectories of all vehicles, including hundreds of drivers with different characteristics, their reactions in different traffic conditions, and at geometrically different intersections.

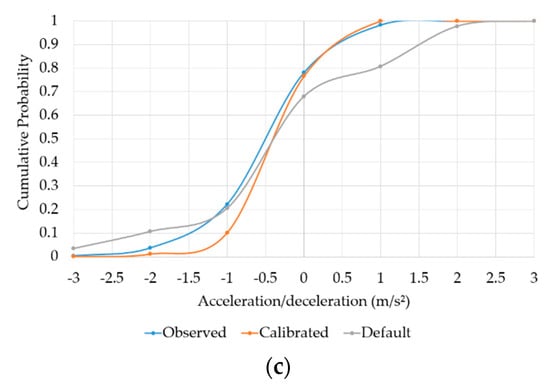
Figure 7.
Measured, calibrated, and default values of speeds and accelerations for Intersection 2: (a) speed; (b) acceleration/deceleration; (c) cumulative probability distribution of the acceleration/deceleration.
3.2. Emission Estimation
After the calibration of microsimulation models of the existing intersections, models of alternative solutions were created at each location according to the geometric shapes described in chapter 3. The following figures (Figure 8, Figure 9 and Figure 10) show all created models for the analyzed locations.
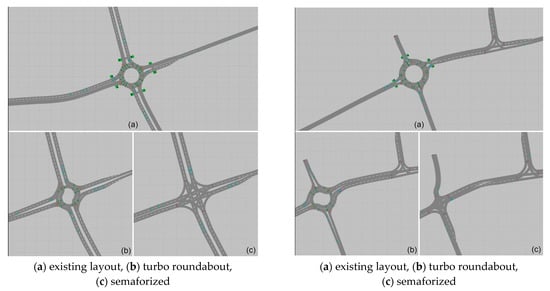
Figure 8.
Microsimulation models of Intersection 1 (left) and Intersection 2 (right).
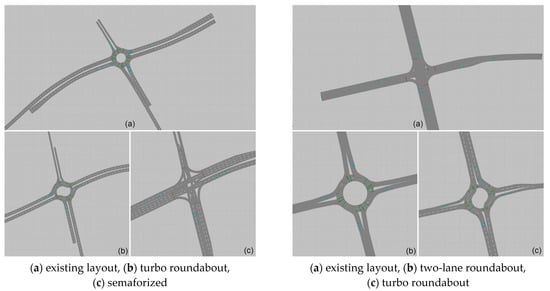
Figure 9.
Microsimulation models of Intersection 3 (left) and Intersection 4 (right).
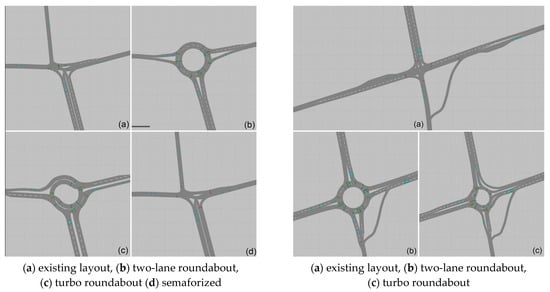
Figure 10.
Microsimulation models of Intersection 5 (left) and Intersection 6 (right).
As we previously stated, choosing an instantaneous emission model, which depends on the dynamics of each vehicle’s movement, is essential to estimate emissions at the local, i.e., micro, level. Environmental Sensitive Traffic Management (ESTM) by Bosch, directly incorporated into PTV Vissim, was used in this analysis for CO2, NOx, CO, and particulate matter (PM) emission assessment and fuel consumption. Tools like EnViVer VERSIT require a separate file from the microsimulation software with trajectory data and re-input of that file. The Bosch ESTM emission model is based on cloud technology, so the emission estimation continues directly in PTV Vissim after the end of the traffic simulation. This is a relatively new emission model integrated into the latest version of PTV Vissim. It was created based on field tests during which the PEMS system was installed on more than 100 vehicles of all fuel types and EURO classes. Measurements were made on vehicles with a mileage of approximately 50,000 km and under an ambient temperature of 20–25 °C, representing standardized conditions for this type of measurement. Part of the data collected in the field were used to calibrate the simulation model, while the rest were used for validation. Model validation confirmed its accuracy in over 85% of cases and successful detection of 95% of emission hotspots [50,51,52,53].
Besides vehicle movement dynamics, reliable pollutant emissions must include accurate data on traffic flow structure. Bosch ESTM requires an input of vehicle composition via emission class distribution for different types of fuel and EURO class standards. For this research, we analyzed official data on registered vehicles in Bosnia and Herzegovina in 2021 [54]. Only passenger cars registered in the Sarajevo area (administrative unit Sarajevo Canton) were considered. The total number of analyzed vehicles was 136,204. The average age of these vehicles was 13.5 years, while only 1.56% of vehicles were less than a year old. Diesel vehicles, with a 75% share, dominated regarding fuel type. At the same time, the number of registered electric vehicles was only 0.02%, while the total number of hybrid vehicles, regardless of age, was 0.36%. These numbers can hardly be compared with more developed countries because the average share of zero-emission vehicles (battery electric vehicles and hydrogen vehicles) in the total number of newly registered vehicles in EU countries in 2019 was 5.6%. In Norway, that share was even 54.3% [4]. The data on the high average age of vehicles, the significant ratio of lower EURO classes, and the negligible number of vehicles powered by alternative modes are the main reason for high pollution emissions from traffic in Bosnia and Herzegovina. Figure 11 shows the composition of analyzed vehicles according to fuel type and EURO emission standard directly applied in Bosch ESTM for emission assessment.
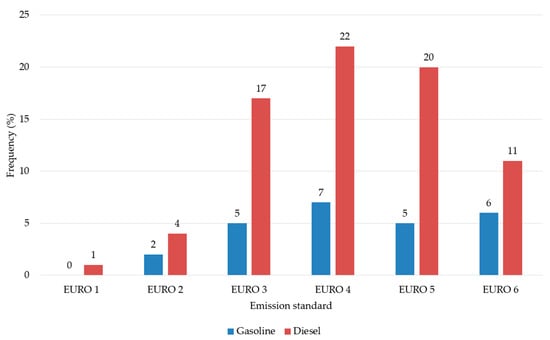
Figure 11.
Structure of registered vehicles in the Sarajevo region [54].
Each microsimulation model was simulated with different seed numbers ten times to obtain reliable average results. Simulation time was 4200 s, with the initial 600 s of the warm-up period.
In addition to the analysis of geometrical configuration impact on emission level, the traffic microsimulation allowed us to test different scenarios, changing traffic flow composition and observing the impact of that change on the emissions. For the models of existing intersections, two scenarios were created. In the first scenario, a different share of zero-emission vehicles (5–20%) replaced an identical percentage of vehicles with the lowest EURO standard. In the second scenario, the total traffic volume was reduced by 10 and 20%, maintaining the existing traffic flow composition. Results from all simulations were used to compare the impact of different traffic and geometric measures on emissions and to propose, in the end, an optimal solution.
4. Results and Discussion
The results of the total CO2, NOx, PM, and CO emissions and fuel consumption for the existing layout of intersections and all alternative solutions are shown in Figure 12. The highest emission level was recorded at intersections with the highest traffic demand (i.e., Intersections 1, 2, and 3). The existing two-lane roundabouts are generally a much less favorable solution in terms of emissions compared to signalized intersections and turbo roundabouts, except in the case of Intersection 3, where the turbo roundabout is the worst solution. The results for the first three intersections and highest traffic volumes show that signalized intersections generate 50–53% fewer emissions (depending on pollutant type) for Intersection 1, 12–15% for Intersection 2, and 30–39% for Intersection 3. At the same time, the turbo roundabout at the first and second location represents the best solution, reducing emission levels up to 55% (Intersection 1) and 31% (Intersection 2). At Intersection 3, the turbo roundabout causes 16–24% higher emissions and fuel consumption than the existing two-lane roundabout. Although the turbo roundabout, in most scenarios for the other intersections, proved to be a better, or at least equal, solution to the signalized intersection, at Intersection 3, its poor performance can be attributed to the distribution of traffic movements. As we emphasized earlier, at this intersection, vehicles from the three busiest entries take the same one-lane exit, causing vehicles to stop inside the roundabout and at the adjacent entrance. This is why a signalized intersection is a better solution than any type of roundabout at this location. The obtained results confirm the claims from previous studies that two-lane roundabouts generate higher emissions than other types of intersections in the case of saturated flow. Given that there is no control of vehicles entering the intersection, nor their equal distribution as in turbo roundabouts, vehicles in a two-lane roundabout remain trapped, with new vehicles entering very slowly and in a constant start and stop mode, contributing significantly to the high emission level. In the case of Intersection 2, despite the lower traffic demand compared to Intersections 1 and 3, vehicles also remain trapped in the roundabout due to the adjacent signalized intersection because the regulation method of one intersection directly impacts the operational characteristics of another intersection type.

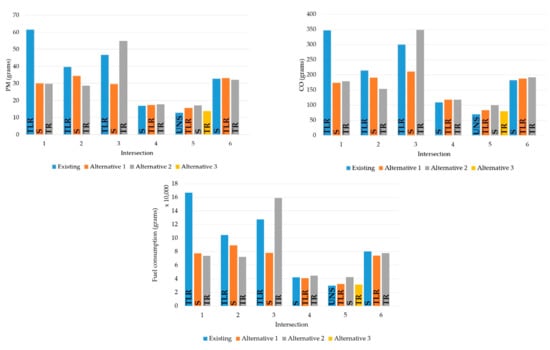
Figure 12.
Emission results for all analyzed intersections. Note: TLR—two-lane roundabout, S—signalized, TR—turbo roundabout, UNS—unsignalized (two-way yield-controlled).
In unsaturated traffic conditions, such as at Intersections 4 and 5, the results show an almost identical emission level for all intersection types. At signalized Intersection 4, the current emission level is slightly lower than at the two-lane roundabout (2–8%, except for CO2) and turbo roundabout (5–8%). A similar trend can also be observed at yield-controlled Intersection 5, where the existing layout is the best solution, while the signalized intersection is the worst. However, the differences between variants are much smaller than in the case of the first three intersections. At Intersection 6, the total emission level is higher than at Intersections 4 and 5, and lower than at Intersections 1 and 3, which is in line with the traffic demand. All three geometrical variants have an almost equal impact on the emissions, with mutual differences in the range of 1–3%.
The presented results correspond to the average delay and the total number of vehicle stops. Therefore, at all analyzed intersections, the highest emission level was recorded in the variants with the most stops and the highest average delay and saturation level. A similar conclusion can be found in some previous research indicating that, on multi-lane roundabouts with high demand, vehicles often move in a queue, with many stops and restarts [27,55,56,57]. For this reason, their construction is only recommended when the conditions of continuous flow are met, i.e., when the saturation level is less than 0.85 [27,58]. Furthermore, the application of turbo roundabouts, as a modification of the classic two-lane roundabout, is not recommended for a total traffic volume greater than 4500 veh/h [27,59] or more than 1000 veh/h per lane [34].
Figure 13 shows the CO2 emission map for the existing and alternative layouts at location 3. In the same way, all emission results, as well as fuel consumption and average speeds on all models, were displayed, but they are not presented in this paper. The difference in emissions is clearly visible between different layouts of the same intersection. The approach with the most vehicles, which remains blocked at the entrance due to the adjacent one-lane exit, is the most responsible for the high emissions in the case of two-lane and turbo roundabouts. This problem has been successfully overcome at a signalized intersection. The highest emissions occur in smaller zones in front of the intersection, where vehicles only occasionally stop due to a red traffic light.
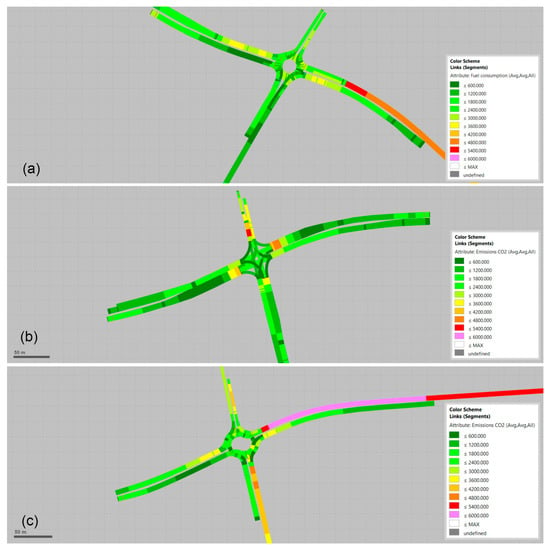
Figure 13.
CO2 emission map for Intersection 3; (a) existing layout; (b) signalized intersection; (c) turbo roundabout.
The simulation results showed that the influence of zero-emission vehicles is almost the same for all existing intersections. The emission level decreases from 20% for CO2 and fuel consumption to 29% for NOx and 45% for particulate matter. By increasing the share of these vehicles in the overall traffic flow structure, the emission level decreased almost linearly.
On the other hand, the impact of reducing the vehicle volume is different for all existing intersections. This scenario caused the most significant reduction of emission levels and fuel consumption at Intersections 1, 2, and 3, which also showed the highest emission levels in actual conditions. The emission at these intersections is lower by 40% on average for the case of 20% less traffic demand. However, the influence is less pronounced at Intersections 4, 5, and 6, where emissions are reduced by 22% on average.
Figure 12 and Table 3 indicate that for saturated traffic flow (Intersections 1, 2, and 3), geometric modification leads to fewer emissions of most pollutants (except PM for Intersections 2 and 3 and CO for Intersection 2) to a greater extent than the traffic flow with 20% zero-emission vehicles. At intersections where unsaturated conditions prevail (Intersections 4, 5, and 6), only 5% of zero-emission vehicles outweigh the effect of any geometrical change of existing intersections.

Table 3.
Reduction (%) of emission levels in the case of alternative traffic policy scenarios.
At Intersections 1, 2, and 3, the effect of vehicle volume reduction by 20% on CO2, NOx and CO emission, and fuel consumption is higher than the effect of a zero-emission vehicle. For the same pollutants, the emission reduction is almost the same in both scenarios at Intersections 4, 5, and 6. PM reduction for all intersections is the largest with a high share of zero-emission vehicles.
5. Conclusions
Air pollution represents one of the most complex problems of humanity. Traffic contributes significantly to this by emitting a large number of harmful gases. The impact of traffic on pollution can be analyzed at different levels, and accordingly, different measures for its reduction can be proposed. This paper’s primary objective was to present the impact of intersection type on the emission level through the analysis of existing intersections and microsimulation models of their alternative solutions. The research focuses on intersections, which, in urban environments, due to changes in driving dynamics, usually represent emission hotspots.
The results show that by an appropriate geometrical change of the intersection, in conditions of saturated traffic flow or of several intersections at a short distance, the total emission level of various pollutants can be reduced by more than 50%. Such conditions were at three analyzed two-lane roundabouts, the replacement of which with a signalized intersection or a turbo roundabout achieves a significantly more favorable situation in terms of emissions. While our results indicate that the application of a signalized intersection for saturated traffic conditions is always a better solution than a two-lane roundabout, the positive effect of a turbo roundabout largely depends on its type and the distribution of traffic movements.
In unsaturated traffic conditions, the research results showed minimal differences between different types of intersections regarding emissions. However, even in these situations, a signalized intersection was a better solution at two of the three remaining analyzed locations.
Besides the influence of the intersection geometry, the impact of two alternative traffic policies on emission reduction was also assessed. In the first scenario, traffic flow was partially replaced with the same percentage of zero-emission vehicles, while total vehicle volume was reduced in the second. In saturated traffic conditions, the impacts of both scenarios were smaller than the impact of the geometry change. Comparing these two scenarios, the benefit of a reduced volume was generally more significant than the share of zero-emission vehicles. For unsaturated conditions, the situation was the opposite, so these two scenarios result in a significantly greater emission reduction than geometry’s influence. Their impact is almost the same for all pollutants except particulate matter emissions, which are the lowest in a scenario with zero-emission vehicles.
In future research on intersection type, it is necessary to analyze the influence of pedestrians and cyclists on emissions. Given that no built turbo roundabouts were available for this analysis, it is necessary to investigate them in detail under actual conditions and for different traffic volumes. This paper determines pollutant emissions based on the maximum traffic demand, while future research may also include an analysis of a longer period, because the total daily emission at different intersections may differ from the results in the peak period.
Author Contributions
Conceptualization, A.Š.; methodology, A.Š.; software, A.Š. and S.S.; validation, A.Š., S.A., Ž.L. and M.P.; formal analysis, A.Š.; investigation, A.Š., S.A. and Ž.L.; resources, A.Š., S.S. and S.A.; data curation, M.P.; writing—original draft preparation, A.Š.; writing—review and editing, A.Š., S.S. and Ž.L.; visualization, A.Š. and S.S.; supervision, M.P. and S.A.; project administration, A.Š.; funding acquisition, A.Š. All authors have read and agreed to the published version of the manuscript.
Funding
This research was funded by the Ministry of Science, Higher Education and Youth of Sarajevo Canton, Bosnia and Herzegovina, grant number 27-02-11-41251-12/21 (19 November 2021).
Institutional Review Board Statement
Not applicable.
Informed Consent Statement
Not applicable.
Data Availability Statement
Not applicable.
Conflicts of Interest
The authors declare no conflict of interest.
References
- European Environment Agency. Air Quality in Europe: 2020 Report; Publications Office: Luxembourg, 2020. [Google Scholar]
- World Health Organization. WHO Global Air Quality Guidelines: Particulate Matter (PM2.5 and PM10), Ozone, Nitrogen Dioxide, Sulfur Dioxide and Carbon Monoxide; World Health Organization: Geneve, Switzerland, 2021. [Google Scholar]
- European Commission. Communication from the Commission to the European Parliament, the Council, the European Economic and Social Committee and the Committee of the Regions: A European Strategy for Low-Emission Mobility 2016; European Commission: Brussels, Belgium, 2016. [Google Scholar]
- European Commission. EU Transport in Figures: Statistical Pocketbook 2021; Publications Office of the European Union: Luxembourg, 2021; ISBN 978-92-76-40099-8. [Google Scholar]
- European Environment Agency. Air Quality in Europe 2021; Publications Office: Luxembourg, 2021. [Google Scholar]
- Federalni Hidrometeorološki Zavod. Godišnji Izvještaj o Kvalitetu Zraka u Federaciji Bosne i Hercegovine za 2020. Godinu; Annual Report on Air Quality in the Federation of Bosnia and Herzegovina for 2020; Federalni Hidrometeorološki Zavod: Sarajevo, Bosnia and Herzegovina, 2021; p. 48. [Google Scholar]
- EU. Directive 2008/50/EC of the European Parliament and of the Council of 21 May 2008 on Ambient Air Quality and Cleaner Air for Europe; EU: Brussels, Belgium, 2008; pp. 1–44. [Google Scholar]
- Tasse, O.; Sievert, U.; Gidhagen, L. IMPAQ Project, Component 3, Interim Results from PMF 5.0 Receptor Modelling Using the PM2.5 Chemical Analysis of the Samples Collected in 6 Cities of BiH in Winter 2020–2021; SMHI: Norrköping, Sweden, 2021; p. 45. [Google Scholar]
- Jaworski, A.; Mądziel, M.; Lejda, K. Creating an emission model based on portable emission measurement system for the purpose of a roundabout. Environ. Sci. Pollut. Res. 2019, 26, 21641–21654. [Google Scholar] [CrossRef] [PubMed]
- Sharifi, F.; Birt, A.G.; Gu, C.; Shelton, J.; Farzaneh, R.; Zietsman, J.; Fraser, A.; Chester, M. Regional CO2 impact assessment of road infrastructure improvements. Transp. Res. Part Transp. Environ. 2020, 90, 102638. [Google Scholar] [CrossRef]
- Tang, J. An Evaluation of the Potential Impacts of Traffic Management Strategies on Air Pollution, Emissions, and Public Health in Dublin; Trinity College Dublin, School of Engineering: Dublin, Ireland, 2019. [Google Scholar]
- Madziel, M.; Jaworski, A.; Savostin-Kosiak, D.; Lejda, K. The Impact of Exhaust Emission from Combustion Engines on the Environment: Modelling of Vehicle Movement at Roundabouts. Int. J. Automot. Mech. Eng. 2020, 17, 8360–8371. [Google Scholar] [CrossRef]
- Jie, L.; Van Zuylen, H.; Chen, Y.; Viti, F.; Wilmink, I. Calibration of a microscopic simulation model for emission calculation. Transp. Res. Part C Emerg. Technol. 2012, 31, 172–184. [Google Scholar] [CrossRef]
- Meneguzzer, C.; Gastaldi, M.; Arboretti Giancristofaro, R. Before-and-After Field Investigation of the Effects on Pollutant Emissions of Replacing a Signal-Controlled Road Intersection with a Roundabout. J. Adv. Transp. 2018, 2018, e3940362. [Google Scholar] [CrossRef]
- Jaworski, A.; Lejda, K.; Mądziel, M. Emission of pollution from motor vehicles with respect to selected solutions of roundabout intersections. Combust. Engines 2017, 168, 140–144. [Google Scholar] [CrossRef]
- Giuffrè, T.; Canale, A. Road Intersections Design And Environmental Performances. J. Multidiscip. Eng. Sci. Technol. 2016, 3, 10. [Google Scholar]
- Guerrieri, M.; Corriere, F.; Rizzo, G.; Casto, B.L.; Scaccianoce, G. Improving the Sustainability of Transportation: Environmental and Functional Benefits of Right Turn By-Pass Lanes at Roundabouts. Sustainability 2015, 7, 5838–5856. [Google Scholar] [CrossRef]
- Xue, H.; Jiang, S.; Liang, B. A Study on the Model of Traffic Flow and Vehicle Exhaust Emission. Math. Probl. Eng. 2013, 2013, e736285. [Google Scholar] [CrossRef]
- Hallmark, S.L.; Wang, B.; Mudgal, A.; Isebrands, H. On-Road Evaluation of Emission Impacts of Roundabouts. Transp. Res. Rec. J. Transp. Res. Board 2011, 2265, 226–233. [Google Scholar] [CrossRef]
- Landesanstalt für Umwelt, Messungen und Naturschutz Baden-Württemberg. PEMS-Messungen an drei Euro 6-Diesel-Pkw auf Streckenführungen in Stuttgart und München sowie auf Außerortsstrecken; LUBW Landesanstalt für Umwelt, Messungen und Naturschutz Baden-Württemberg: Karlsruhe, Germany, 2015; p. 97. [Google Scholar]
- Pandian, S.; Gokhale, S.; Ghoshal, A.K. Evaluating effects of traffic and vehicle characteristics on vehicular emissions near traffic intersections. Transp. Res. Part D Transp. Environ. 2009, 14, 180–196. [Google Scholar] [CrossRef]
- Gastaldi, M.; Meneguzzer, C.; Giancristofaro, R.A.; Gecchele, G.; Della Lucia, L.; Prati, M.V. On-road measurement of CO2 vehicle emissions under alternative forms of intersection control. Transp. Res. Procedia 2017, 27, 476–483. [Google Scholar] [CrossRef]
- Giuffrè, T.; Campisi, T.; Canale, A.; Severino, A.; Trubia, S. Traffic Simulator Tool as Reliable Effort for Environmental Es-timation at Road Intersection. In Proceedings of the 27th CARSP Conference, Toronto, ON, USA, 18 June 2017. [Google Scholar]
- Gastaldi, M.; Meneguzzer, C.; Rossi, R.; Della Lucia, L.; Gecchele, G. Evaluation of Air Pollution Impacts of a Signal Control to Roundabout Conversion Using Microsimulation. Transp. Res. Procedia 2014, 3, 1031–1040. [Google Scholar] [CrossRef]
- Tollazzi, T.; Guerrieri, M.; Jovanović, G.; Renčelj, M. Functions, Capacities, and Traffic Safety Characteristics of Some Types of Two-Level Roundabouts. Sustainability 2020, 12, 6914. [Google Scholar] [CrossRef]
- Salamati, K.; Rouphail, N.M.; Frey, H.C.; Liu, B.; Schroeder, B.J. Simplified Method for Comparing Emissions in Roundabouts and at Signalized Intersections. Transp. Res. Rec. J. Transp. Res. Board 2015, 2517, 48–60. [Google Scholar] [CrossRef]
- Mądziel, M.; Campisi, T.; Jaworski, A.; Kuszewski, H.; Woś, P. Assessing Vehicle Emissions from a Multi-Lane to Turbo Roundabout Conversion Using a Microsimulation Tool. Energies 2021, 14, 4399. [Google Scholar] [CrossRef]
- Tollazzi, T.; Tesoriere, G.; Guerrieri, M.; Campisi, T. Environmental, functional and economic criteria for comparing “target roundabouts” with one- or two-level roundabout intersections. Transp. Res. Part D Transp. Environ. 2015, 34, 330–344. [Google Scholar] [CrossRef]
- Ahn, K.; Kronprasert, N.; Rakha, H. Energy and Environmental Assessment of High-Speed Roundabouts. Transp. Res. Rec. J. Transp. Res. Board 2009, 2123, 54–65. [Google Scholar] [CrossRef]
- Fortuijn, L.G.H. Turbo Roundabouts: Design Principles and Safety Performance. Transp. Res. Rec. 2009, 2096, 16–24. [Google Scholar] [CrossRef]
- Fortuijn, L.G.H.; Harte, V.F. Multi-Lane Roundabouts: Exploring New Models. In Proceedings of the Traffic Engineering Working Days; CROW: Ede, The Netherlands, 1997. [Google Scholar]
- Fernandes, P.; Rouphail, N.M.; Coelho, M. Turboroundabouts along Corridors: Analysis of Operational and Environmental Impacts. Transp. Res. Rec. 2017, 2627, 46–56. [Google Scholar] [CrossRef]
- Tollazzi, T. Alternative Types of Roundabouts; Springer Tracts on Transportation and Traffic; Springer International Publishing: Cham, Switzerland, 2015; Volume 6, ISBN 978-3-319-09083-2. [Google Scholar]
- Liu, Q.; Deng, J.; Shen, Y.; Wang, W.; Zhang, Z.; Lu, L. Safety and Efficiency Analysis of Turbo Roundabout with Simulations Based on the Lujiazui Roundabout in Shanghai. Sustainability 2020, 12, 7479. [Google Scholar] [CrossRef]
- Mądziel, M.; Campisi, T.; Jaworski, A.; Tesoriere, G. The Development of Strategies to Reduce Exhaust Emissions from Passenger Cars in Rzeszow City—Poland. A Preliminary Assessment of the Results Produced by the Increase of E-Fleet. Energies 2021, 14, 1046. [Google Scholar] [CrossRef]
- Tenekeci, G. Computation and Assessment of Environmental Emissions Resulting from Traffic Operations at Roundabouts. Avrupa Bilim Ve Teknol. Derg. 2019, 130–145. [Google Scholar] [CrossRef]
- Mauro, R.; Guerrieri, M. Comparative life-cycle assessment of conventional (double lane) and non-conventional (turbo and flower) roundabout intersections. Transp. Res. Part D Transp. Environ. 2016, 48, 96–111. [Google Scholar] [CrossRef]
- Gokhale, S. Impacts of traffic-flows on vehicular-exhaust emissions at traffic junctions. Transp. Res. Part D Transp. Environ. 2012, 17, 21–27. [Google Scholar] [CrossRef]
- Fernandes, P.; Pereira, S.R.; Bandeira, J.; Vasconcelos, A.; Silva, A.B.; Coelho, M. Driving around turbo-roundabouts vs. conventional roundabouts: Are there advantages regarding pollutant emissions? Int. J. Sustain. Transp. 2016, 10, 847–860. [Google Scholar] [CrossRef]
- Fontes, T.; Pereira, S.; Fernandes, P.; Bandeira, J.; Coelho, M. How to combine different microsimulation tools to assess the environmental impacts of road traffic? Lessons and directions. Transp. Res. Part D Transp. Environ. 2015, 34, 293–306. [Google Scholar] [CrossRef]
- Song, G.; Yu, L.; Zhang, Y. Applicability of Traffic Microsimulation Models in Vehicle Emissions Estimates: Case Study of VISSIM. Transp. Res. Rec. J. Transp. Res. Board 2012, 2270, 132–141. [Google Scholar] [CrossRef]
- Borrego, C.; Amorim, J.; Tchepel, O.; Dias, D.; Rafael, S.; Sá, E.; Pimentel, C.; Fontes, T.; Fernandes, P.; Pereira, S.; et al. Urban scale air quality modelling using detailed traffic emissions estimates. Atmos. Environ. 2016, 131, 341–351. [Google Scholar] [CrossRef]
- Salamati, K.; Coelho, M.; Fernandes, P.J.; Rouphail, N.; Frey, H.C.; Bandeira, J. Emissions Estimation at Multilane Roundabouts: Effects of Movement and Approach Lane. Transp. Res. Rec. J. Transp. Res. Board 2013, 2389, 12–21. [Google Scholar] [CrossRef]
- Chauhan, B.P.; Joshi, G.; Parida, P. Car following model for urban signalised intersection to estimate speed based vehicle exhaust emissions. Urban Clim. 2019, 29, 100480. [Google Scholar] [CrossRef]
- Guerrieri, M.; Corriere, F.; Casto, B.L.; Rizzo, G. A model for evaluating the environmental and functional benefits of “innovative” roundabouts. Transp. Res. Part D Transp. Environ. 2015, 39, 1–16. [Google Scholar] [CrossRef]
- Vasconcelos, L.; Silva, A.B.; Seco, Á.M.; Fernandes, P.; Coelho, M.C. Turboroundabouts: Multicriterion assessment of intersection capacity, safety, and emissions. Transp. Res. Rec. J. Transp. Res. Board 2014, 2402, 28–37. [Google Scholar] [CrossRef]
- Chamberlin, R.; Swanson, B.; Talbot, E.; Dumont, J.; Pesci, S. Analysis of MOVES and CMEM for Evaluating the Emissions Impact of an Intersection Control Change; Transportation Research Board: Washington, DC, USA, 2011. [Google Scholar]
- Amirjamshidi, G.; Mostafa, T.S.; Misra, A.; Roorda, M.J. Integrated model for microsimulating vehicle emissions, pollutant dispersion and population exposure. Transp. Res. Part D Transp. Environ. 2013, 18, 16–24. [Google Scholar] [CrossRef]
- Li, J.; van Zuylen, H.; Xu, X. Driving Type Categorizing and Microscopic Simulation Model Calibration. Transp. Res. Rec. 2015, 2491, 53–60. [Google Scholar] [CrossRef]
- PTV (Planung Transport Verkehr). Vissim 2022 User Manual; PTV: Karlsruhe, Germany, 2022. [Google Scholar]
- Lohmiller, J.; Lindzus, E. Emission Calculation with PTV Vissim and Bosch ESTM. Presented at the PTV Talks. 14 April 2022. Available online: https://www.youtube.com/watch?v=PDtAwS8R8kw&ab_channel=PTVAmericaKnowledgeBase (accessed on 19 January 2023).
- PTV Group. PTV Vissim: Improve Air Quality with Emissions Calculations from Bosch. Available online: https://company.ptvgroup.com/en/ptv-vissim-emissions-calculation-from-bosch (accessed on 2 December 2022).
- Environmentally Sensitive Traffic Management. Available online: https://www.bosch-mobility-solutions.com/en/solutions/air-quality-solutions/environmentally-sensitive-traffic-management/ (accessed on 2 December 2022).
- Evidencija Motornih Vozila 2021. Available online: https://www.iddeea.gov.ba/index.php?option=com_content&view=article&id=834%3Amotor-vehicle-records-2021&catid=80%3Abulletin&Itemid=107&lang=bs (accessed on 19 December 2022).
- Mądziel, M.; Jaworski, A.; Kuszewski, H.; Woś, P.; Campisi, T.; Lew, K. The Development of CO2 Instantaneous Emission Model of Full Hybrid Vehicle with the Use of Machine Learning Techniques. Energies 2021, 15, 142. [Google Scholar] [CrossRef]
- Campisi, T.; Canale, A.; Tesoriere, G.; Renčelj, M. The newest public transport system applied to turbo roundabouts. Proc. Inst. Civ. Eng. Eng. Sustain. 2020, 173, 315–322. [Google Scholar] [CrossRef]
- Coelho, M.; Farias, T.; Rouphail, N. Effect of roundabout operations on pollutant emissions. Transp. Res. Part Transp. Environ. 2006, 11, 333–343. [Google Scholar] [CrossRef]
- National Academies of Sciences. Roundabouts: An Informational Guide, 2nd ed.; U.S. Department of Transportation: Washington, DC, USA, 2010.
- Elhassy, Z.; Abou-Senna, H.; Shaaban, K.; Radwan, E. The Implications of Converting a High-Volume Multilane Roundabout into a Turbo Roundabout. J. Adv. Transp. 2020, 2020, 5472806. [Google Scholar] [CrossRef]
Disclaimer/Publisher’s Note: The statements, opinions and data contained in all publications are solely those of the individual author(s) and contributor(s) and not of MDPI and/or the editor(s). MDPI and/or the editor(s) disclaim responsibility for any injury to people or property resulting from any ideas, methods, instructions or products referred to in the content. |
© 2023 by the authors. Licensee MDPI, Basel, Switzerland. This article is an open access article distributed under the terms and conditions of the Creative Commons Attribution (CC BY) license (https://creativecommons.org/licenses/by/4.0/).