1. Introduction
After gaining independence in 1991, Kazakhstan started the process of restructuring its economy and assumed a leading position in Central Asia. Due to high economic growth in 2006, the country entered the group of countries with upper-middle income. However, the unstable situation in the energy market is pushing the country’s leadership to develop a strategy for transforming the economy and reducing its dependence on oil and gas [
1]. Large-scale agriculture is recognized as a competitive direction for further economic development and diversification. This can be explained by the growing demand for agricultural products from high-income countries and the country’s huge total agricultural area of 222 million hectares of which about 13% (29 million hectares) is classified as arable land. However, the supply chains of agricultural products in Kazakhstan are characterized by long distances, and transport costs go up to 40% of the market price of agricultural products [
2].
An analysis of the technical efficiency of the production of certain types of agricultural products [
1] shows that small agricultural enterprises are more efficient than large agricultural holdings—which is why nowadays, the agricultural policy is increasingly recognizing the potential of small enterprises. However, such enterprises using progressive forms of organizing agricultural production face the problem of adapting the structure of their fleet to operating conditions (transport, road, climatic, organizational, and technical) and some external conditions, such as the need to transport various types and range of agricultural products, special requirements for the material and technical equipment, the rising cost of fuels and lubricants, energy carriers and vehicles. The mentioned conditions necessitate the use of an appropriate type of vehicle fleet, which can, under given transport demand parameters, carry out the transportation of the required amount of cargo at a minimal cost. Therefore, a properly formed structure of the vehicle fleet can significantly reduce the logistics costs associated with the transportation of agricultural goods carried out for small farms and enterprises.
In practice, the choice of a vehicle model to deliver goods for the specific client is carried out based on the efficiency indicators, such as transportation costs, the transport company’s profit, the planned profitability under conditions of stable tariffs at the market of transport services, etc. However, the values of the efficiency indicators depend on the specific parameters of demand for transport services; these parameters may vary for different clients and their values may change over time. That means that the use of deterministic approaches to estimate the efficiency of the vehicle fleet does not provide robust results. Computer simulations of transport demand may be useful to obtain statistically significant results regarding the rational fleet structure, but such simulation models need reliable statistical data on the numeric parameters of demand, which is oftentimes not possible to obtain in practice, especially when new clients are planned to be serviced. Under these circumstances, there appears a need for alternative approaches to consider the demand uncertainty while solving the problem of the rationalization of the vehicle fleet, and fuzzy logic proposes the corresponding mathematical basis to achieve this goal.
This paper aims to demonstrate the approach of estimating the structure of a vehicle fleet based on the developed fuzzy-logic methodology to measure the efficiency of vehicles. The proposed method allows consideration of the uncertainty that appears due to a nondeterministic set of clients serviced by a transportation company. As the numeric example of using the developed approach, we consider the delivery of agricultural products for a transportation company located in Almaty that serves the producers in the northern region of Kazakhstan.
The structure of the paper is the following: in the next section we present a concise review of recent scientific literature in the field of choosing a vehicle model and fleet structure; the third section contains the description of the proposed fuzzy-logic approach to measure the efficiency of delivery vehicles; the fourth part provides a case study with the corresponding short discussion of the obtained results; and the last section offers conclusions and directions for future research.
2. Literature Review
The justification of the vehicle models to deliver goods is a crucial part of the freight demand modeling procedure. The task of shaping a rational structure of the vehicle fleet is relevant not only for road transport but also for rail [
3,
4], water [
1,
5,
6,
7], and industrial modes of transport [
8,
9,
10]. The problem of the rationalization of the fleet structure is also quite relevant when mixed supply chains or delivery schemes with cross-docking terminals are planned [
1,
7,
11,
12,
13,
14]. The problem of justifying the rational structure of the fleet (in terms of vehicle models) is not new, it arose in the 1950s, and considered the dependence of the carrying capacity on various indicators representing operating conditions. The existing classical methods can be conditionally divided into two groups: those that consider or do not consider the stochastic characteristics of the vehicles used for deliveries of goods. A detailed analysis of the advantages and disadvantages of classical methods is presented in the dissertation [
15].
In recent scientific publications, the following directions of research in the field of choosing vehicle models are the most relevant:
Considering the stochastic parameters of the delivery process [
9,
11,
13,
16,
17,
18,
19,
20,
21];
Considering the complex impact of the parameters characterizing the delivery process [
8,
9,
13,
22,
23,
24,
25,
26,
27,
28];
Estimating parameters of stochastic demand for cargo deliveries [
3];
Optimizing environmental [
10,
29,
30], economic [
8,
12,
19,
20,
23,
31], and social impacts as well as a combination of these parameters [
14,
32,
33,
34,
35];
Shaping and improving the loading schedules for trucks [
5,
9,
11,
17,
36,
37];
Considering the energy efficiency of the delivery process [
22,
25,
38];
Minimizing the number of vehicles within the transport company’s fleet [
18,
21];
Ensuring the tractive effort reserves [
33];
Considering the trajectory of trucks according to the global positioning system [
39];
Considering variations in the characteristics of the route and the vehicle [
19];
Using specific performance indicators (e.g., fuel efficiency [
40]);
Using complex performance indicators to evaluate the efficiency of delivery processes [
35,
41,
42];
Considering the risks associated with the operational activities [
14,
35,
43];
Considering the level of satisfaction of decision makers [
44] as the performance indicator within the model of a delivery process.
As can be seen, the most common groups of criteria for choosing the structure of the vehicle fleet (in terms of available vehicle models) are technical, operational, and economic indicators. There is no contradiction in this observation because the total carrying capacity of the fleet mainly depends on the technical and operational parameters of the vehicles: capacity, speed, and the laboriousness of maintenance and repair operations. On the other hand, vehicle productivity can change under the influence of factors that do not depend on the model of the vehicle, such as operating conditions, methods of organizing the transportation process, qualifications of the driver and repair personnel, supply of spare parts and materials, etc. However, in most research, special cases of choosing the structure of the vehicle fleet in specific conditions are considered, for example:
A regular change in the volume of goods needed for transportation in addition to the fact that trucks have various carrying capacities, differing in the cost of hiring, mileage, and speed [
16];
Minimizing the costs of the life cycle of trucks [
11,
45];
Uncertainties in the vehicle performances [
13];
Accounting for the collection of fees depending on the delivery time [
39];
The use of human-controlled and automated vehicles [
20];
The accumulation of dump trucks under the conditions of open-pit mining [
10] and the automated formation of alternative fleet configurations [
28].
In addition to the classic vehicles used in road transportation that are analyzed by most of the mentioned research, the following vehicle types were considered under study:
Mining dump trucks [
8,
10,
46];
Trucks for the transportation of heavy loads [
38];
Hybrid, battery, and electric trucks [
33];
Trucks for concrete deliveries [
41];
Trucks with a capacity of up to 3.5 tons [
26];
Vehicles equipped with a hybrid diesel or high-pressure gas engine [
34].
At the same time, some supply chains work with perishable products [
12], soft drinks [
36], products deteriorating over time [
18], products of the agro-industrial complex [
27], and the construction industry [
41].
The presence in the considered works of many variable parameters and the given formalization of the conditions for conducting research do not allow the qualitative analysis of the results obtained and the development of recommendations that allow using any of the proposed methods as a universal method for choosing the optimal (rational) qualitative and quantitative vehicle models for the transportation of agro-industrial products under Kazakhstani market conditions. That statement is also supported by the fact that genetic algorithms and their modifications [
1,
5,
11,
12,
16,
17,
18,
30] are characterized by poor scalability to the complexity of the problem being solved. Except for genetic algorithms, the following approaches are used to optimize the servicing system’s parameters in the field of transport: hybrid Pareto optimal approaches [
32], binary integer programming under uncertainty [
9], fuzzy programming [
13], generalized disjunctive programming [
36], fuzzy-tuned models [
44], multiperiod multiplicative analysis [
38], recursive logic modeling [
39], binary probit and logit models [
3], discrete continuum econometric models [
19], agent-based modeling [
33], and discrete event simulations [
7,
10].
After COVID-19 started, a significant amount of research in the field of transportation planning was devoted to considering the pandemic impact on the efficiency of transport processes. Among recent publications, the papers [
47,
48,
49] must be mentioned, where the changes in transport policy related to the consequences of the COVID-19 pandemic are discussed.
Based on the literature analysis carried out, we may conclude that it is not possible to develop specific recommendations for using some chosen vehicle model as the basis for shaping a rational structure of the vehicle fleet, the use of which would guarantee the maximum outcome for the transport company involved in the delivery of agricultural products in Kazakhstani market conditions.
As we can see, the existing methods allow for solving the optimization problem (as an option—propose an approach or a routine to solve the problem) or additionally consider specific parameters or conditions within the problem of raising the vehicle fleet efficiency. These methods use the deterministic or stochastic representation of the efficiency criteria that measure the result of the servicing process provided by transport companies. In the case of the deterministic representation, the adequacy of the corresponding models is relatively low (if compared with the nondeterministic models), and in the case of stochastic representation, additional studies must be performed to describe the type of stochasticity and the dynamics of parameters for corresponding distribution functions (which is not always implementable under the real-world conditions). Contrary to existing methods, we propose an alternative way of dealing with the uncertainty of the mathematical model parameters—to represent the vehicle models with the membership functions defined based on the uncertain parameters of transport demand.
3. Proposed Approach
The key concept that we use to provide a tool to measure the efficiency of vehicles under given demand and market conditions is the idea of the areas of the efficient use of vehicles depicted in the paper [
50]. Such areas are defined as ranges of values for a selected indicator (e.g., some transport demand parameter—delivery distances, consignment weights, the number of pallets in a consignment, etc., or some technical parameter—vehicle speed, loading duration, etc.), where the values of the used efficiency indicator are satisfactory (can be accepted by a transport company).
By the area of efficient use of a truck, here we mean the range of values of the studied demand parameter for which the use of a vehicle returns an acceptable value for the transport company’s profit. Since the use of a vehicle can be considered effective if the profit from the transportation has a positive value, then the area
of the effective use of a vehicle for the indicator
can be represented as follows:
where
is the profit per 1 ton of cargo in the delivered consignment, [KZT/ton].
For the parameter
, any technical or operational indicator of the vehicle operation can be used (e.g., delivery distance, time for loading and unloading operations, vehicle speed, etc.). The most significant indicator characterizing the transport process and its cost indicators are the delivery distance and the consignment weight [
51].
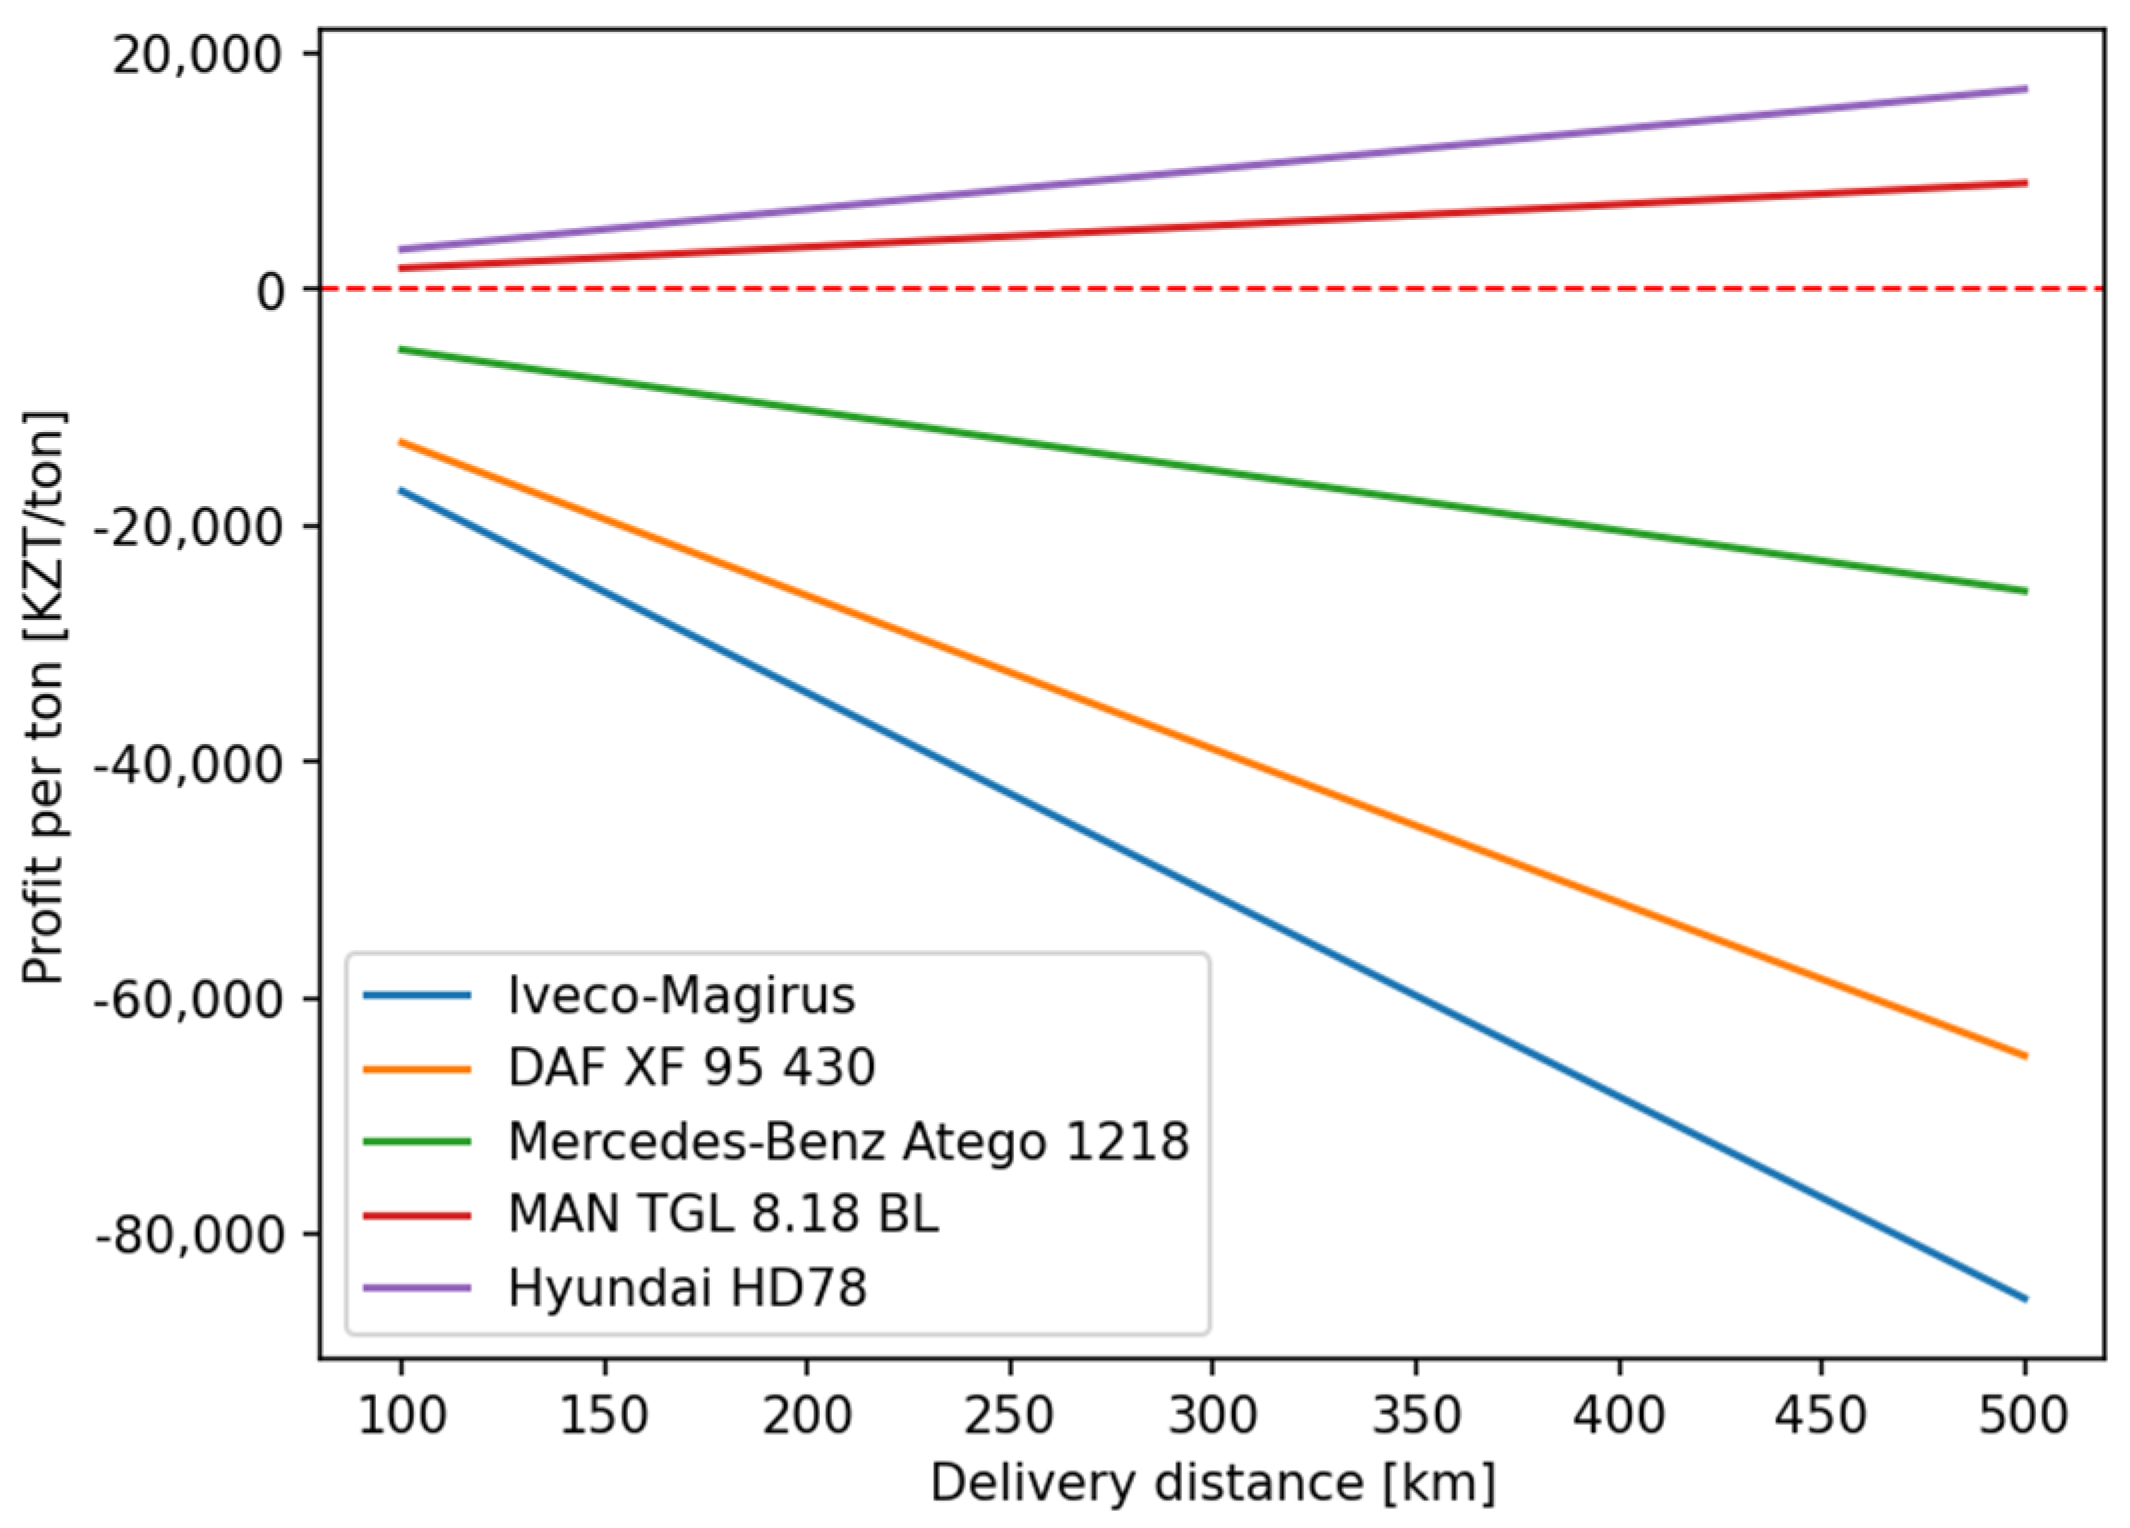
Let us consider the areas of effective use for some models of freight vehicles for the distance of cargo delivery, taking into account the batch nature of transportation (the cargo is delivered as divided batches—consignments that usually correspond to the vehicle capacity). A consignment of cargo can have values from the minimum allowable size of the consignment (or such a minimum amount of cargo, the transportation of which by trucks is rational) to the value of the vehicle’s carrying capacity.
Let’s take the following models of delivery trucks: the Iveco Magirus, DAF XF 95430, Mercedes Benz Atego 1218, MAN TGL 8.18 BL, and Hyundai HD78. Consider consignments of 4 tons, 7 tons, and 24 tons (the maximum value of a consignment can be determined by the minimum from available carrying capacities). Let us now calculate the profit for the delivery distance in the range
km under the assumption that the services of a transport company are paid at a per-kilometer rate. The results of such calculations for agricultural product deliveries under Kazakhstani market conditions show the dependence of profit on the distance of delivery (
Figure 1,
Figure 2 and
Figure 3). The numeric data used for the calculations of a transport company’s profit (delivery rates, fuel prices, maintenance prices, etc.) refer to the market prices in the Kazakhstani market in October 2022.
The horizontal dotted line in
Figure 1,
Figure 2 and
Figure 3 shows the bounds of effective use of vehicles: if the graph representing the dependence of profit on the distance is located above the dotted line, the use of the corresponding model of a vehicle is considered effective (as the profit per 1 ton of a delivered cargo in such a case is positive).
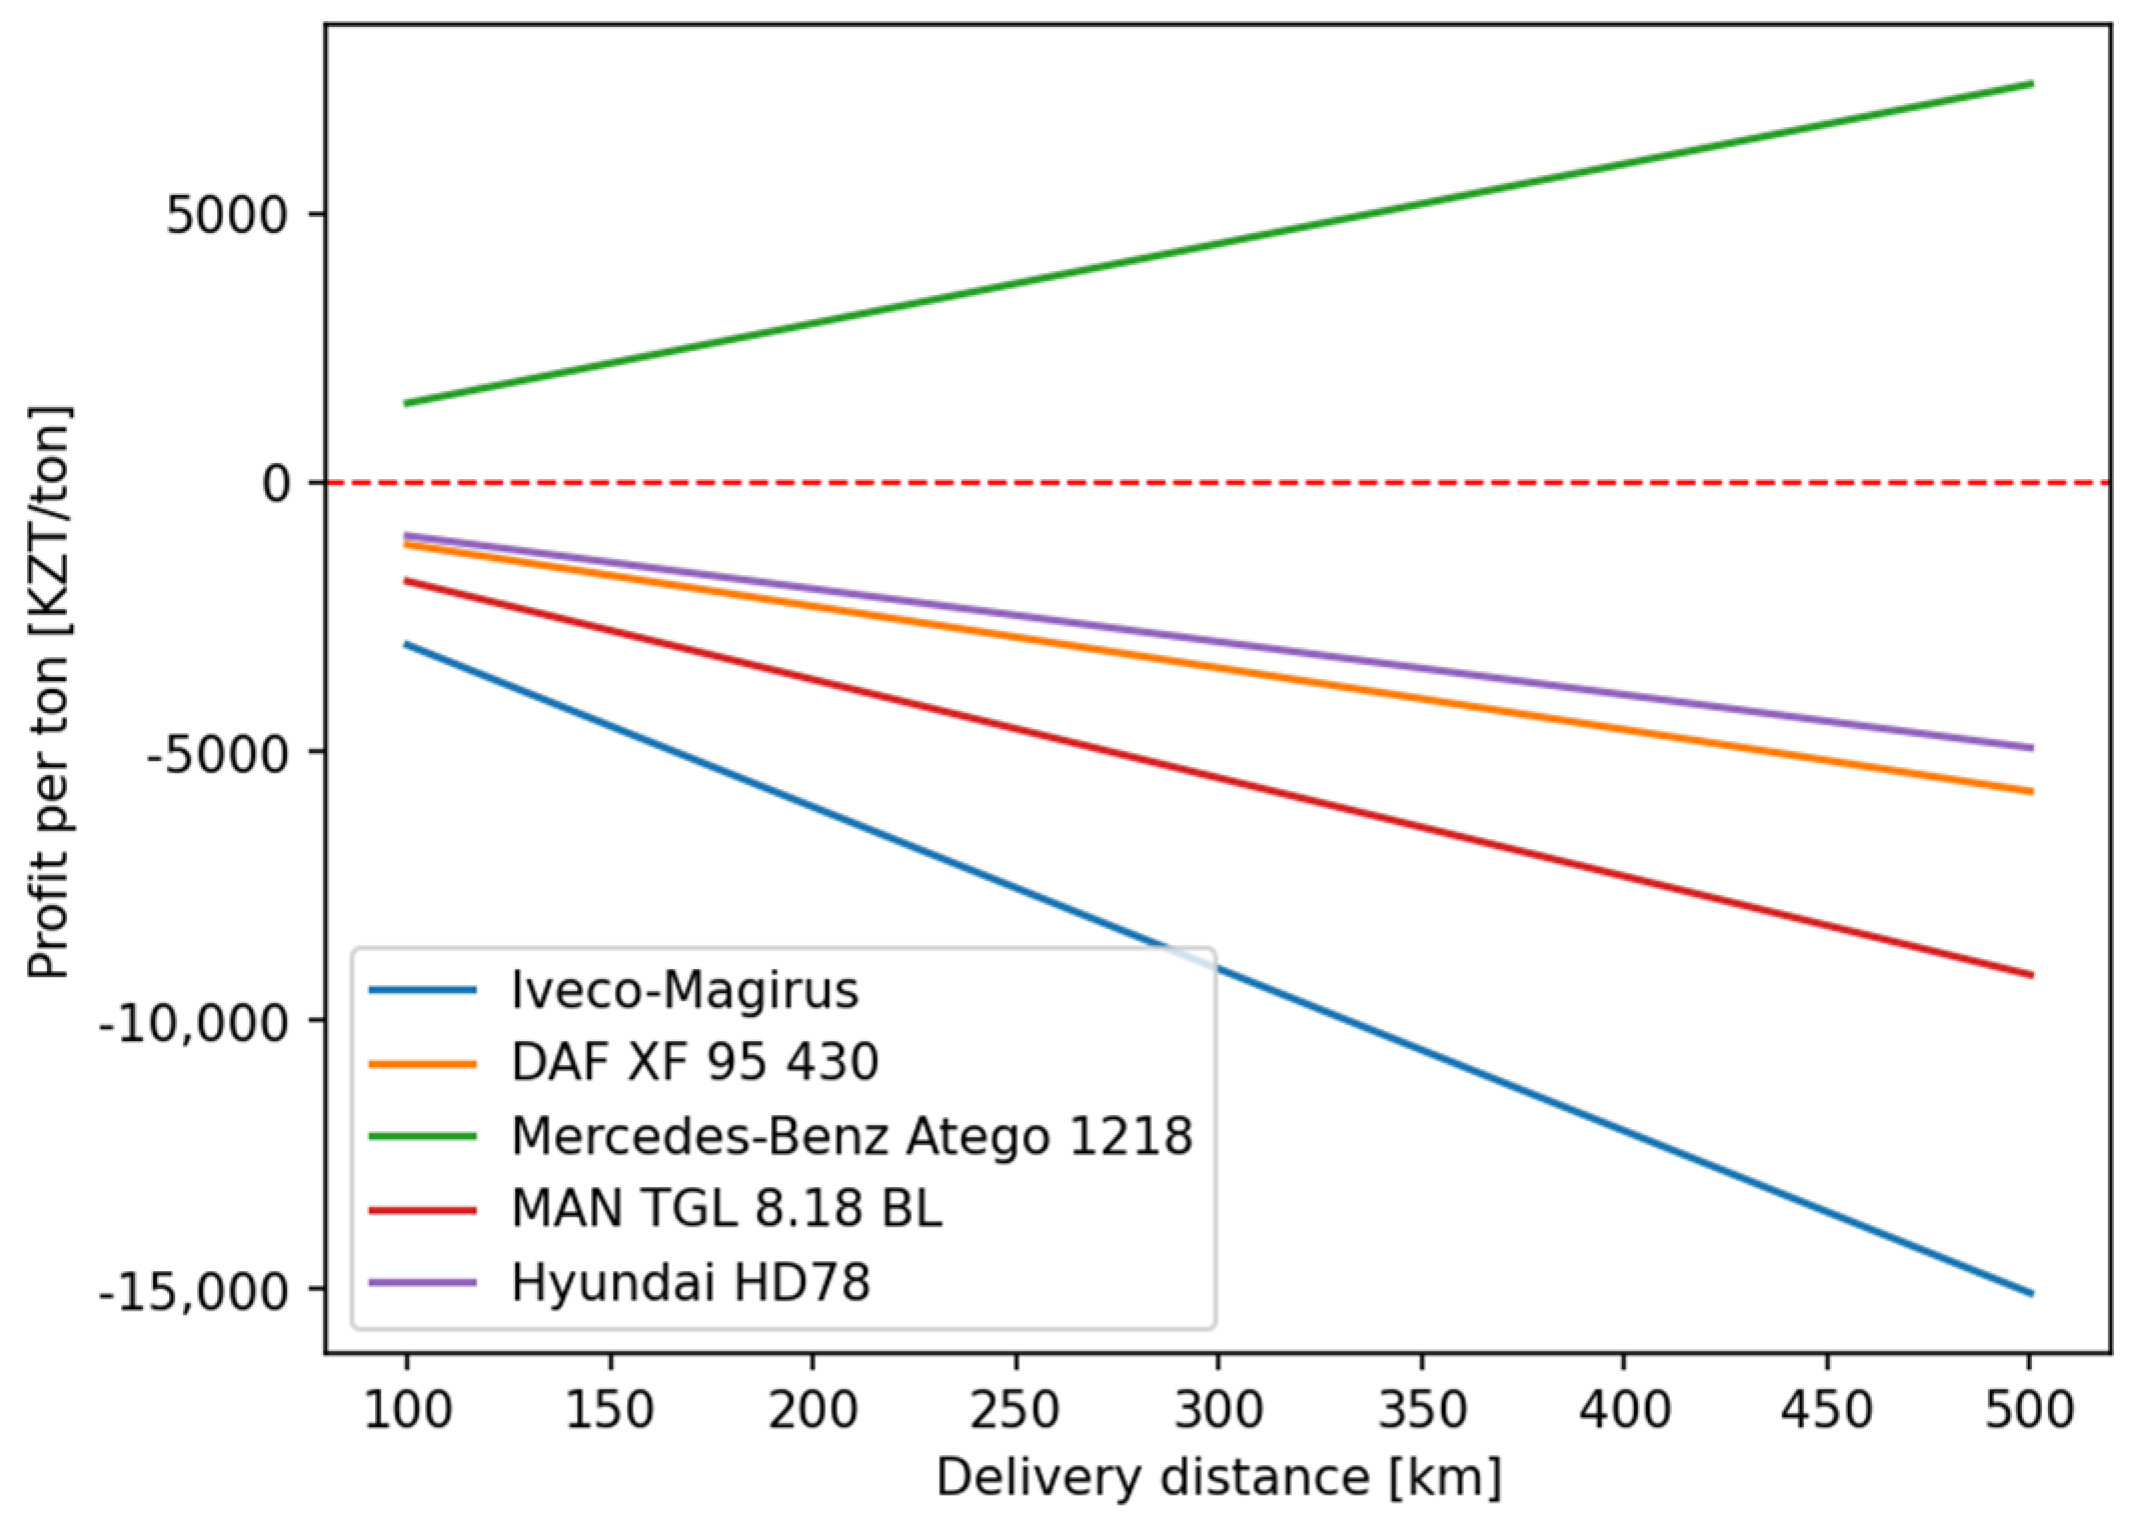
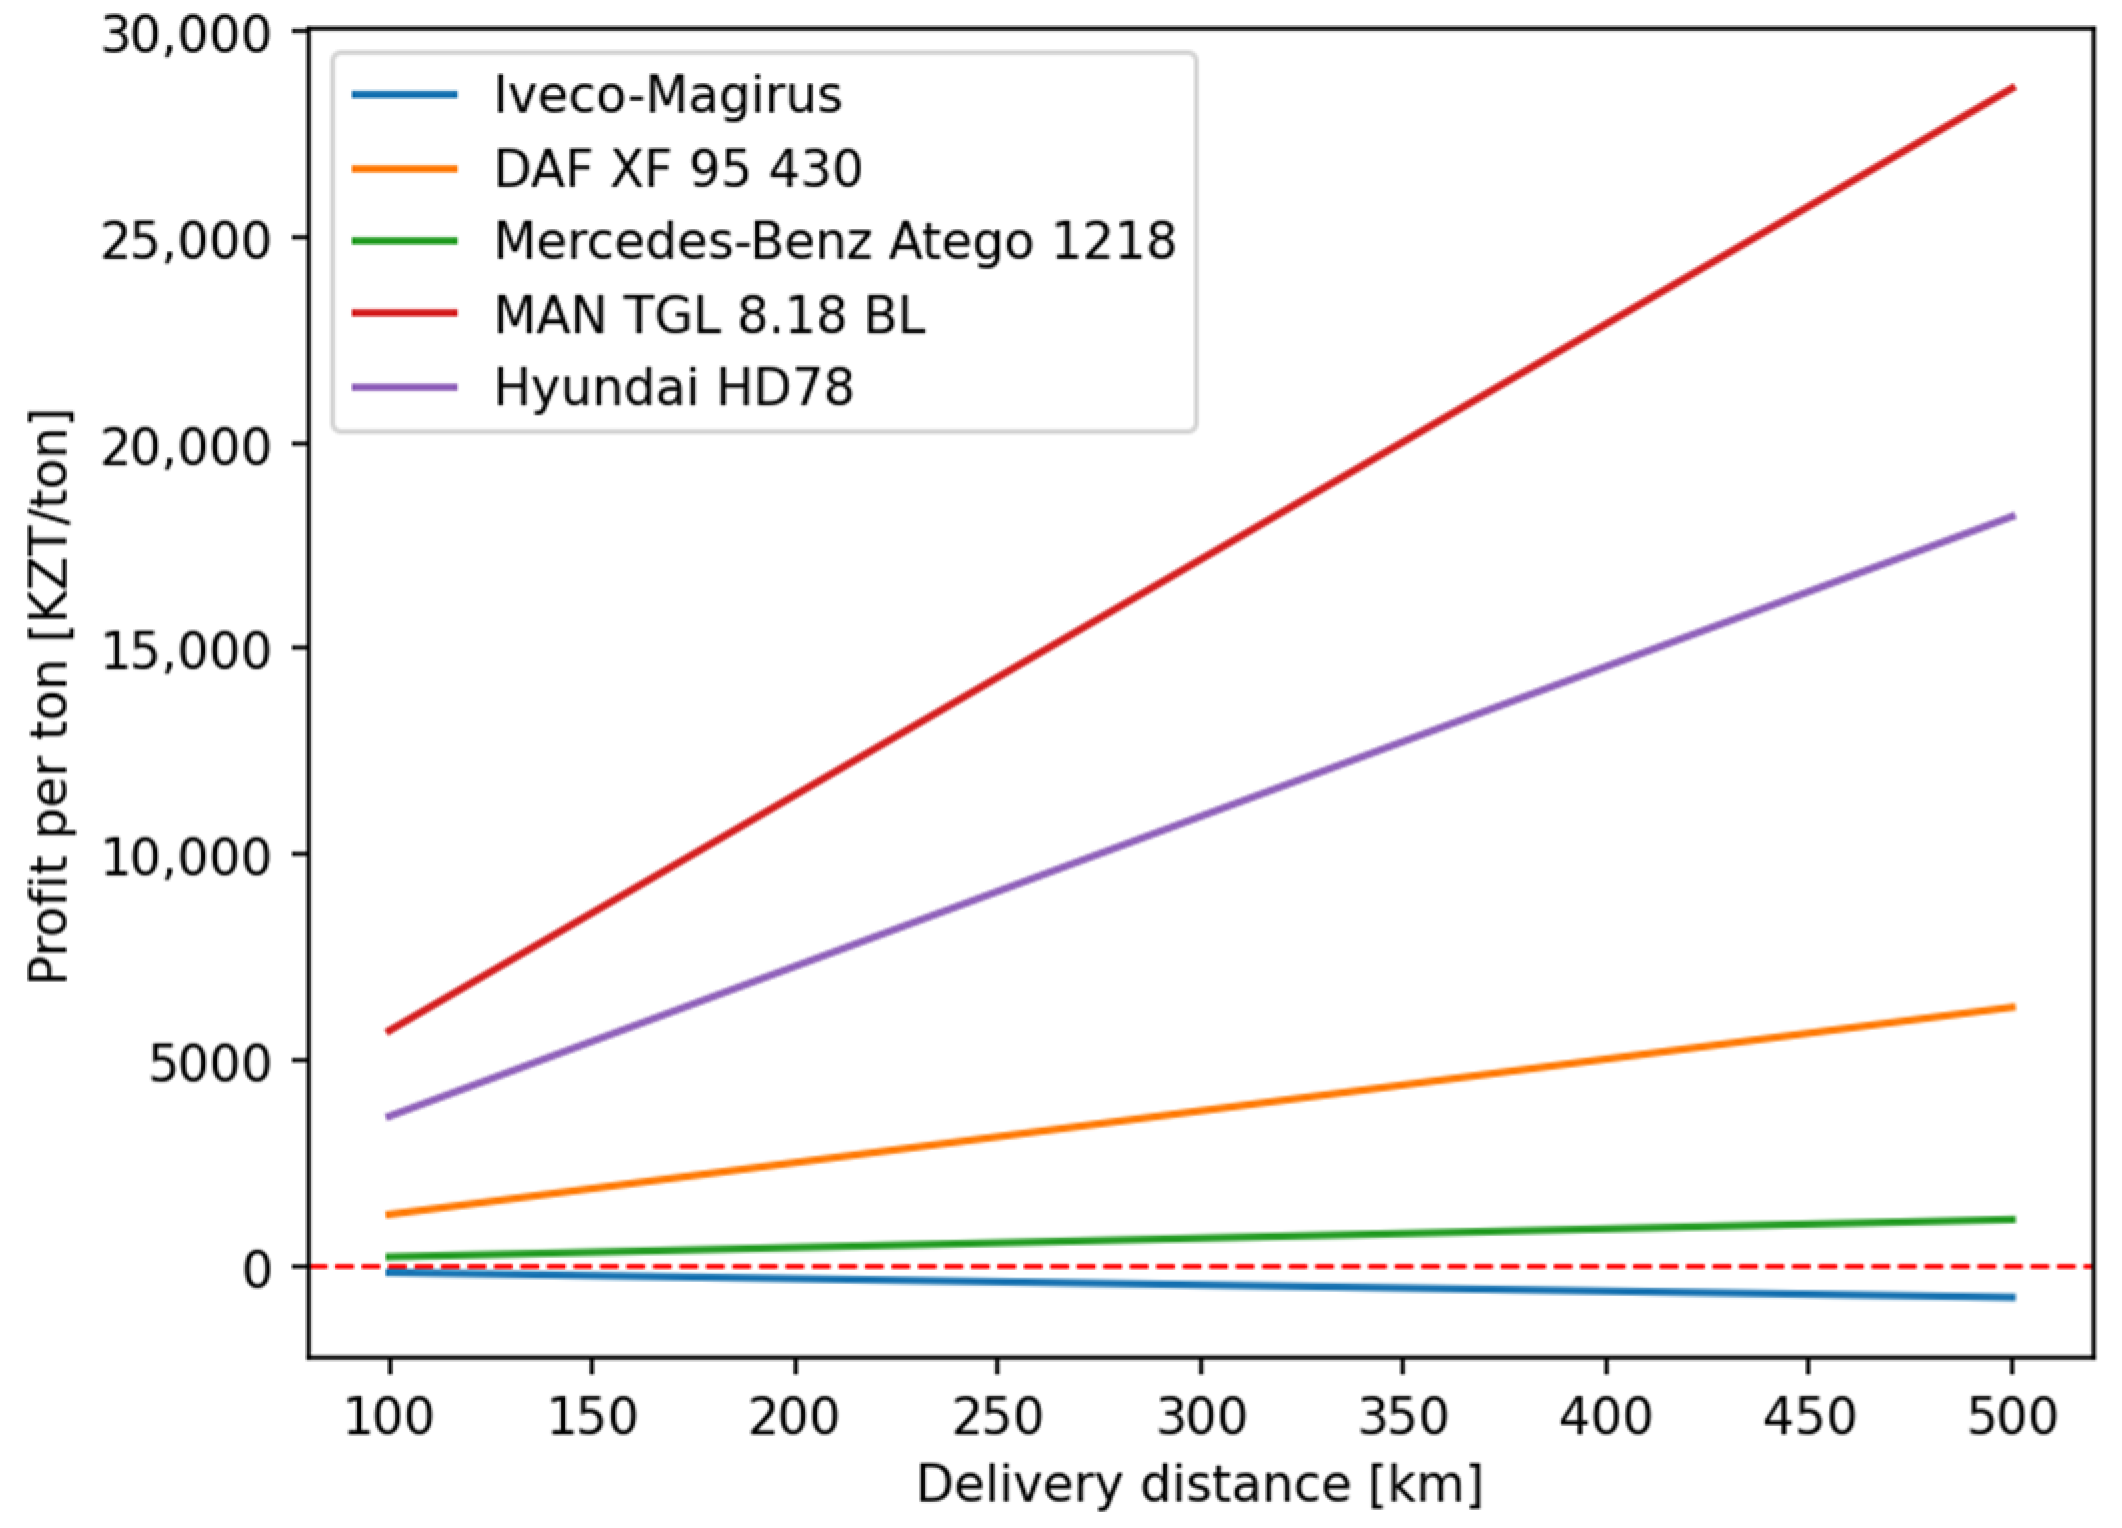
As can be observed from the graphs presented in
Figure 1,
Figure 2 and
Figure 3, the weight of a consignment significantly influences the profitability of the considered vehicle models: for the consignment weight of 4 tons, the MAN TGL 8.18 BL and Hyundai HD78 can be used to deliver a consignment without financial losses to a transport company; if the consignment weight equals 7 tons, only the Mercedes Benz Atego 1218 will guarantee service without losses; and for consignments of 24 tons, only the use of the Iveco Magirus will be a nonprofitable solution for a transport company. As the lines representing the dependencies of profit on the delivery distance for different truck models do not intersect in the considered range of the distance values, the most efficient solution is unambiguous—the vehicle model characterized by a graph located above all the other dependencies is the most efficient option: the Hyundai HD78 for consignments weighing 4 tons (
Figure 1), the Mercedes Benz Atego 1218 for loads weighing 7 tons (
Figure 2), and the MAN TGL 8.18 BL for consignments with a weight of 24 tons (
Figure 3).
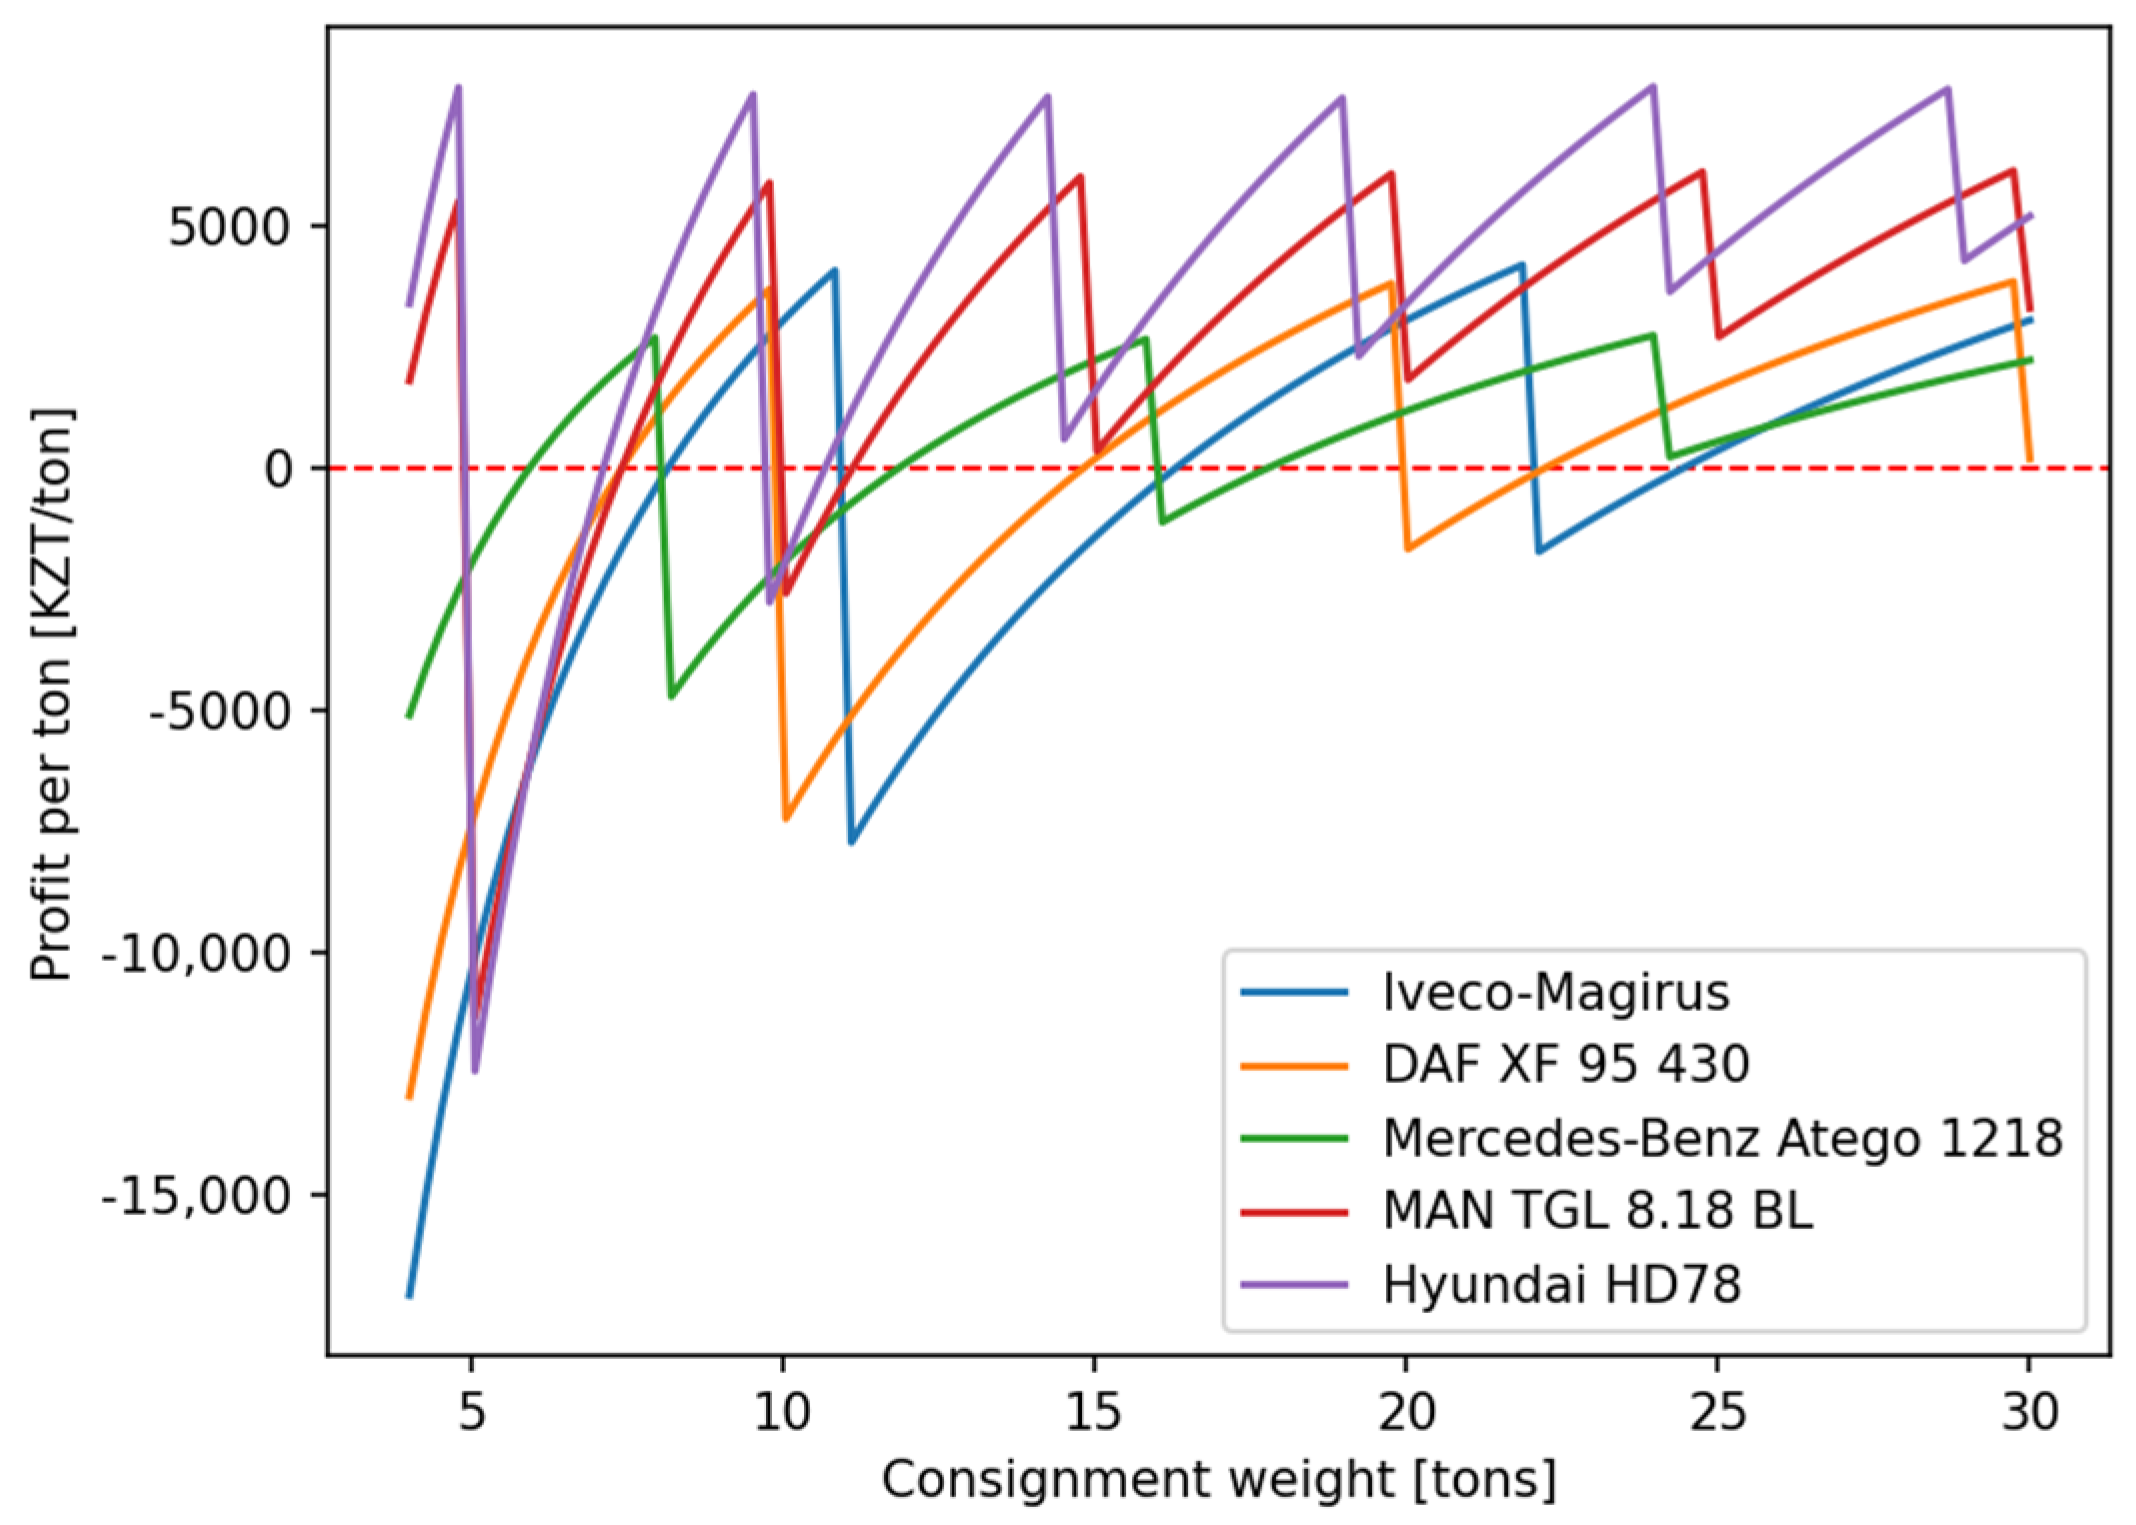
However, the choice of the most effective vehicle model is controversial when we consider the dependence of the transport company’s profit on the consignment weight for a given delivery distance:
Figure 4 shows the dependencies for the set of truck models in the case of a delivery distance of 100 km.
As can be seen from the graph in
Figure 4, the profit of a transport company does not depend on the consignment weight linearly. Furthermore, the dependencies have a stair shape which is explained by the fact that the vehicle capacity is not enough for the considered truck models to deliver the consignment in a single trip. Another important observation from the presented dependencies is that the efficient use of the vehicle models is possible for several ranges of the consignment weight: e.g., the profit from deliveries by the Hyundai HD78 is non-negative when the consignments weigh less than 4.9 tons, between 7.1 and 9.7 tons, and more than 10.7 tons. It should also be mentioned that for the weight of a consignment between 4.9 tons and 5.9 tons, none of the considered truck models yield a positive profit for a transport company (i.e., the use of these vehicle models is ineffective for a consignment weight in that range of weight values).
The described method for choosing the most efficient models of delivery trucks can be used by contemporary transportation enterprises at the operational level—when vehicles are assigned to clients to deliver a consignment over a given distance. A truck model can be defined as the optimal model according to the criterion of maximum profit per 1 ton of a consignment; however, its effective use is still possible with a positive value of this criterion (not only in cases when profit is maximum).
To determine the degree of vehicle efficiency, the linguistic variable “efficiency” can be used with the values “least efficient” + “efficient” + “most efficient” + …; however, the value of such a variable is subjective and requires additional analysis for its values in each specific case. In addition, when a linguistic variable is used to describe the efficiency of trucks, a semantic rule cannot be precisely defined for assigning values to a variable representing specific vehicle models.
More specifically, the feasibility of using the truck models can be determined by a membership function of a given vehicle model in a fuzzy set of models that are optimal for use in specific operating conditions. The argument of the membership function should characterize the operation parameters of trucks. As noted earlier, the determining factors that characterize the operating conditions of vehicles during the transportation of goods for a particular client include the distance of delivery and the weight of a consignment. In this regard, each vehicle model can be characterized by a pair of corresponding membership functions. The membership function shows if the object described by this function belongs to some set, depending on the values of some numeric parameter that serves as the explanatory variable in the membership function. Depending on the accepted shape of the membership function, the corresponding object may be classified (rather classified) or not classified (rather not classified) as such that belongs to some set of objects.
We do not define the shape of a membership function by standard functions (such as trapezoidal function, triangular function, singleton, sigmoid function, etc.). Instead, we propose to define the shape of the membership function for the given demand parameter, where the vehicle model is considered efficient or non-efficient depending on the profit it generates when used for servicing the client’s request.
The membership function
of the vehicle model belonging to the fuzzy set of models that are optimal for use considering the given consignment weight
, has the following form:
where
is the specific profit received as the result of the transportation of a consignment weighing
tons, [KZT/ton].
The membership function
of the specific vehicle model
belonging to the fuzzy set of models that are optimal for use considering the delivery distance
, is defined as follows:
where
is the specific profit received as the result of transporting goods over a distance
km, [KZT/ton].
If
is the set of values for the distance of goods delivery, and
is the set of values for the consignment weight, then each truck model can be characterized by a binary fuzzy relationship based on the sets
and
, defined as follows:
where
is the membership function of a binary fuzzy relationship, which is defined as a mapping
;
is a tuple of elements and , where and .
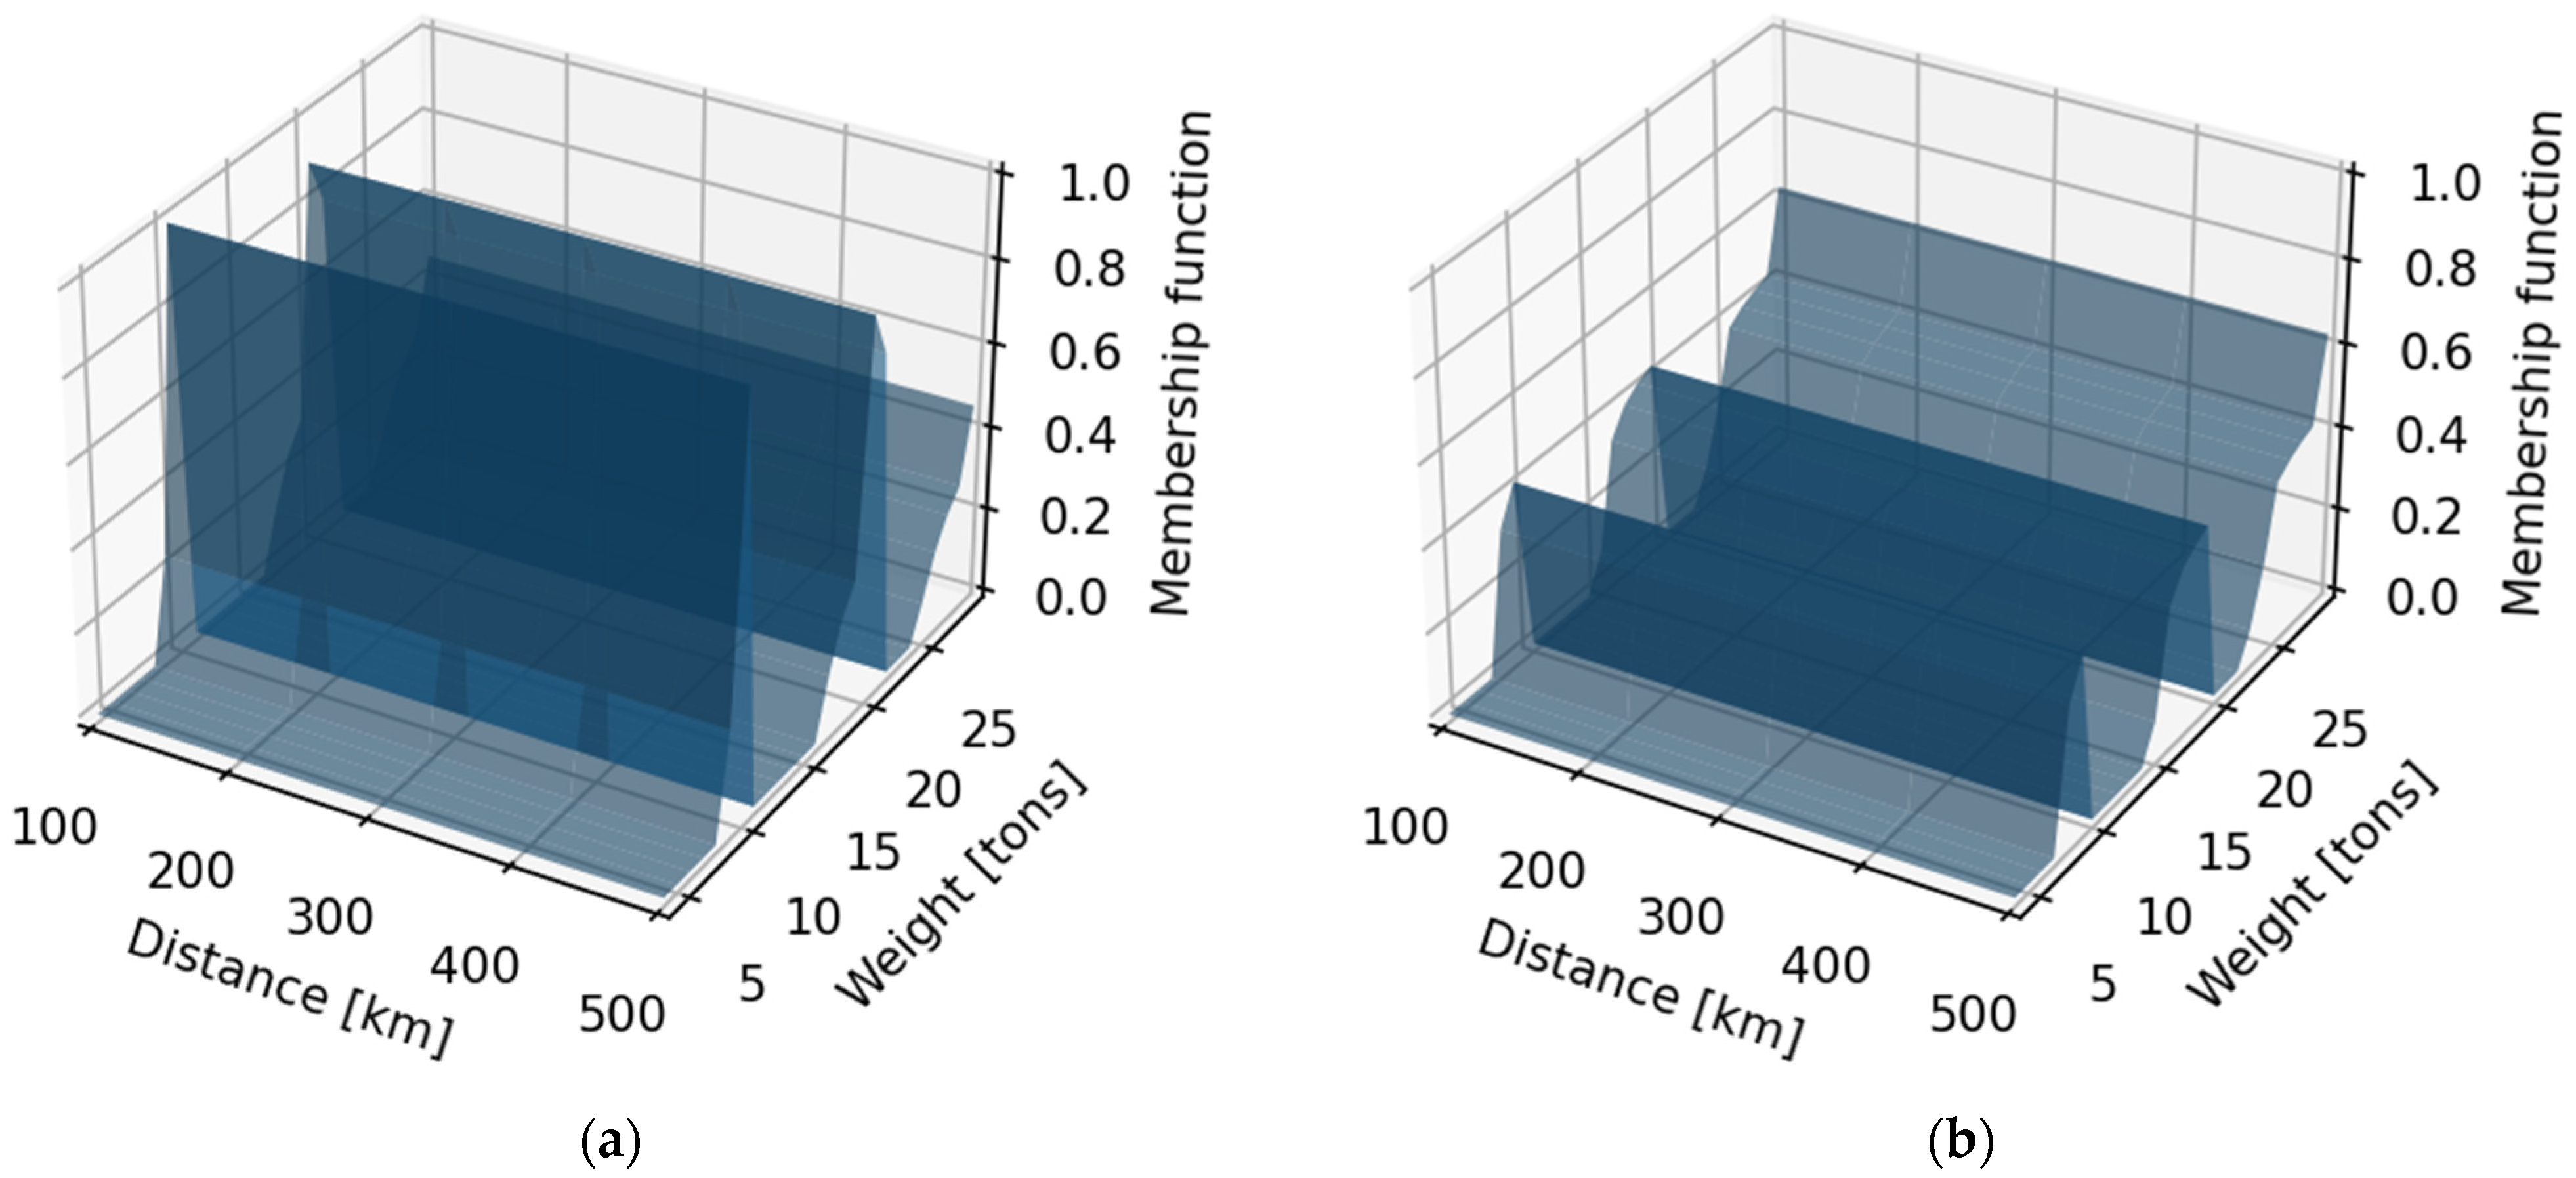
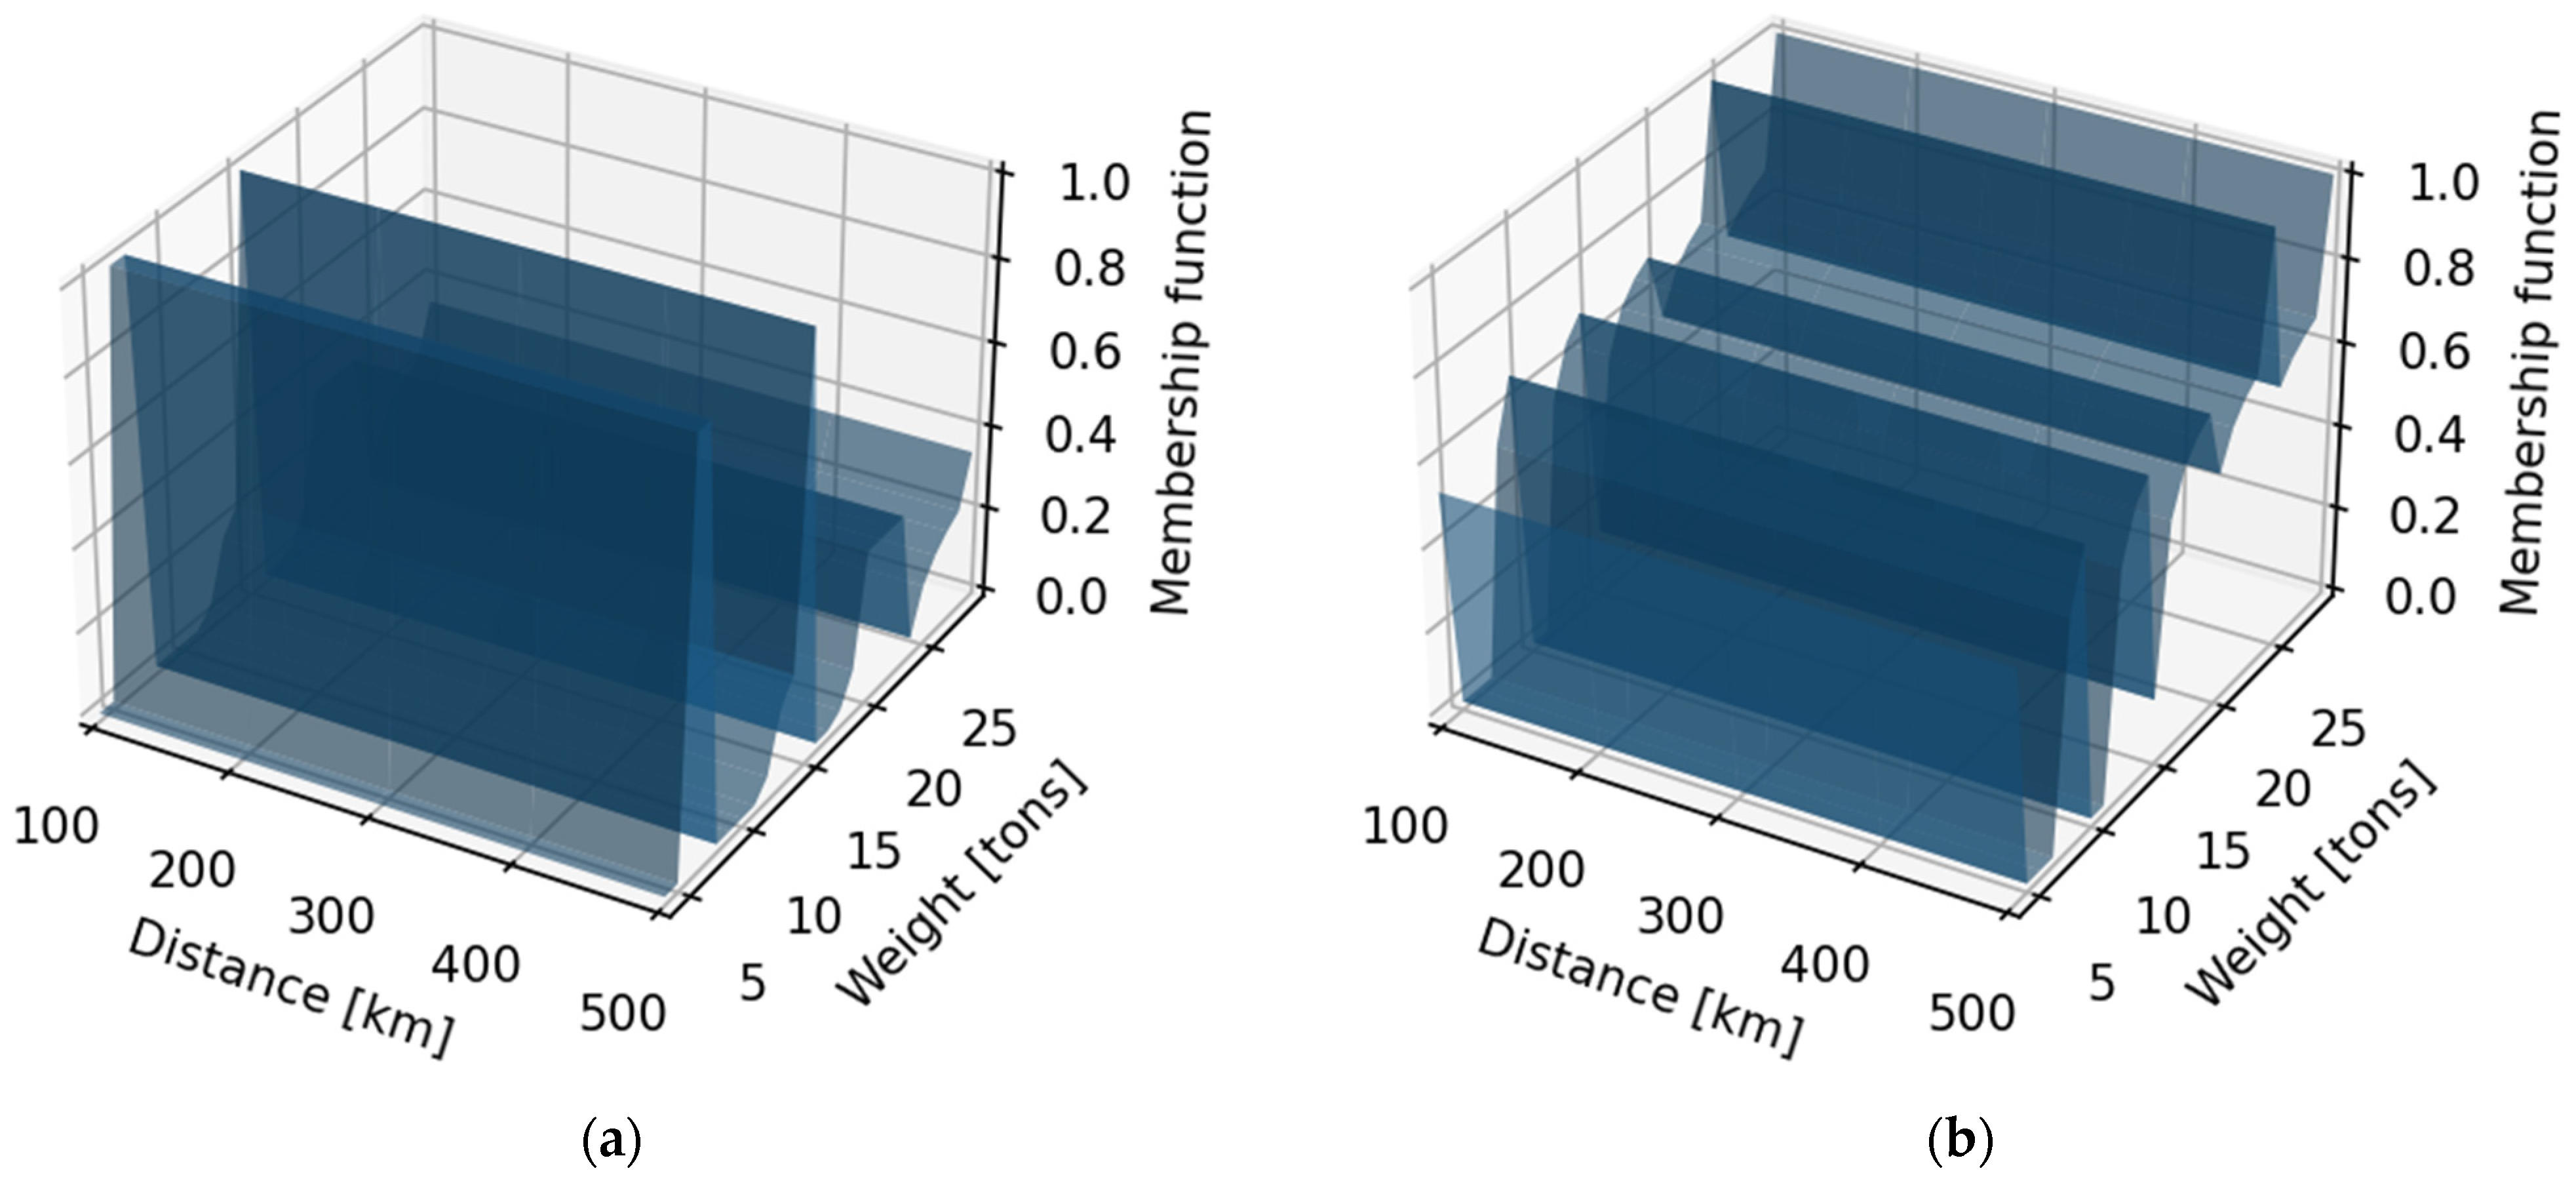
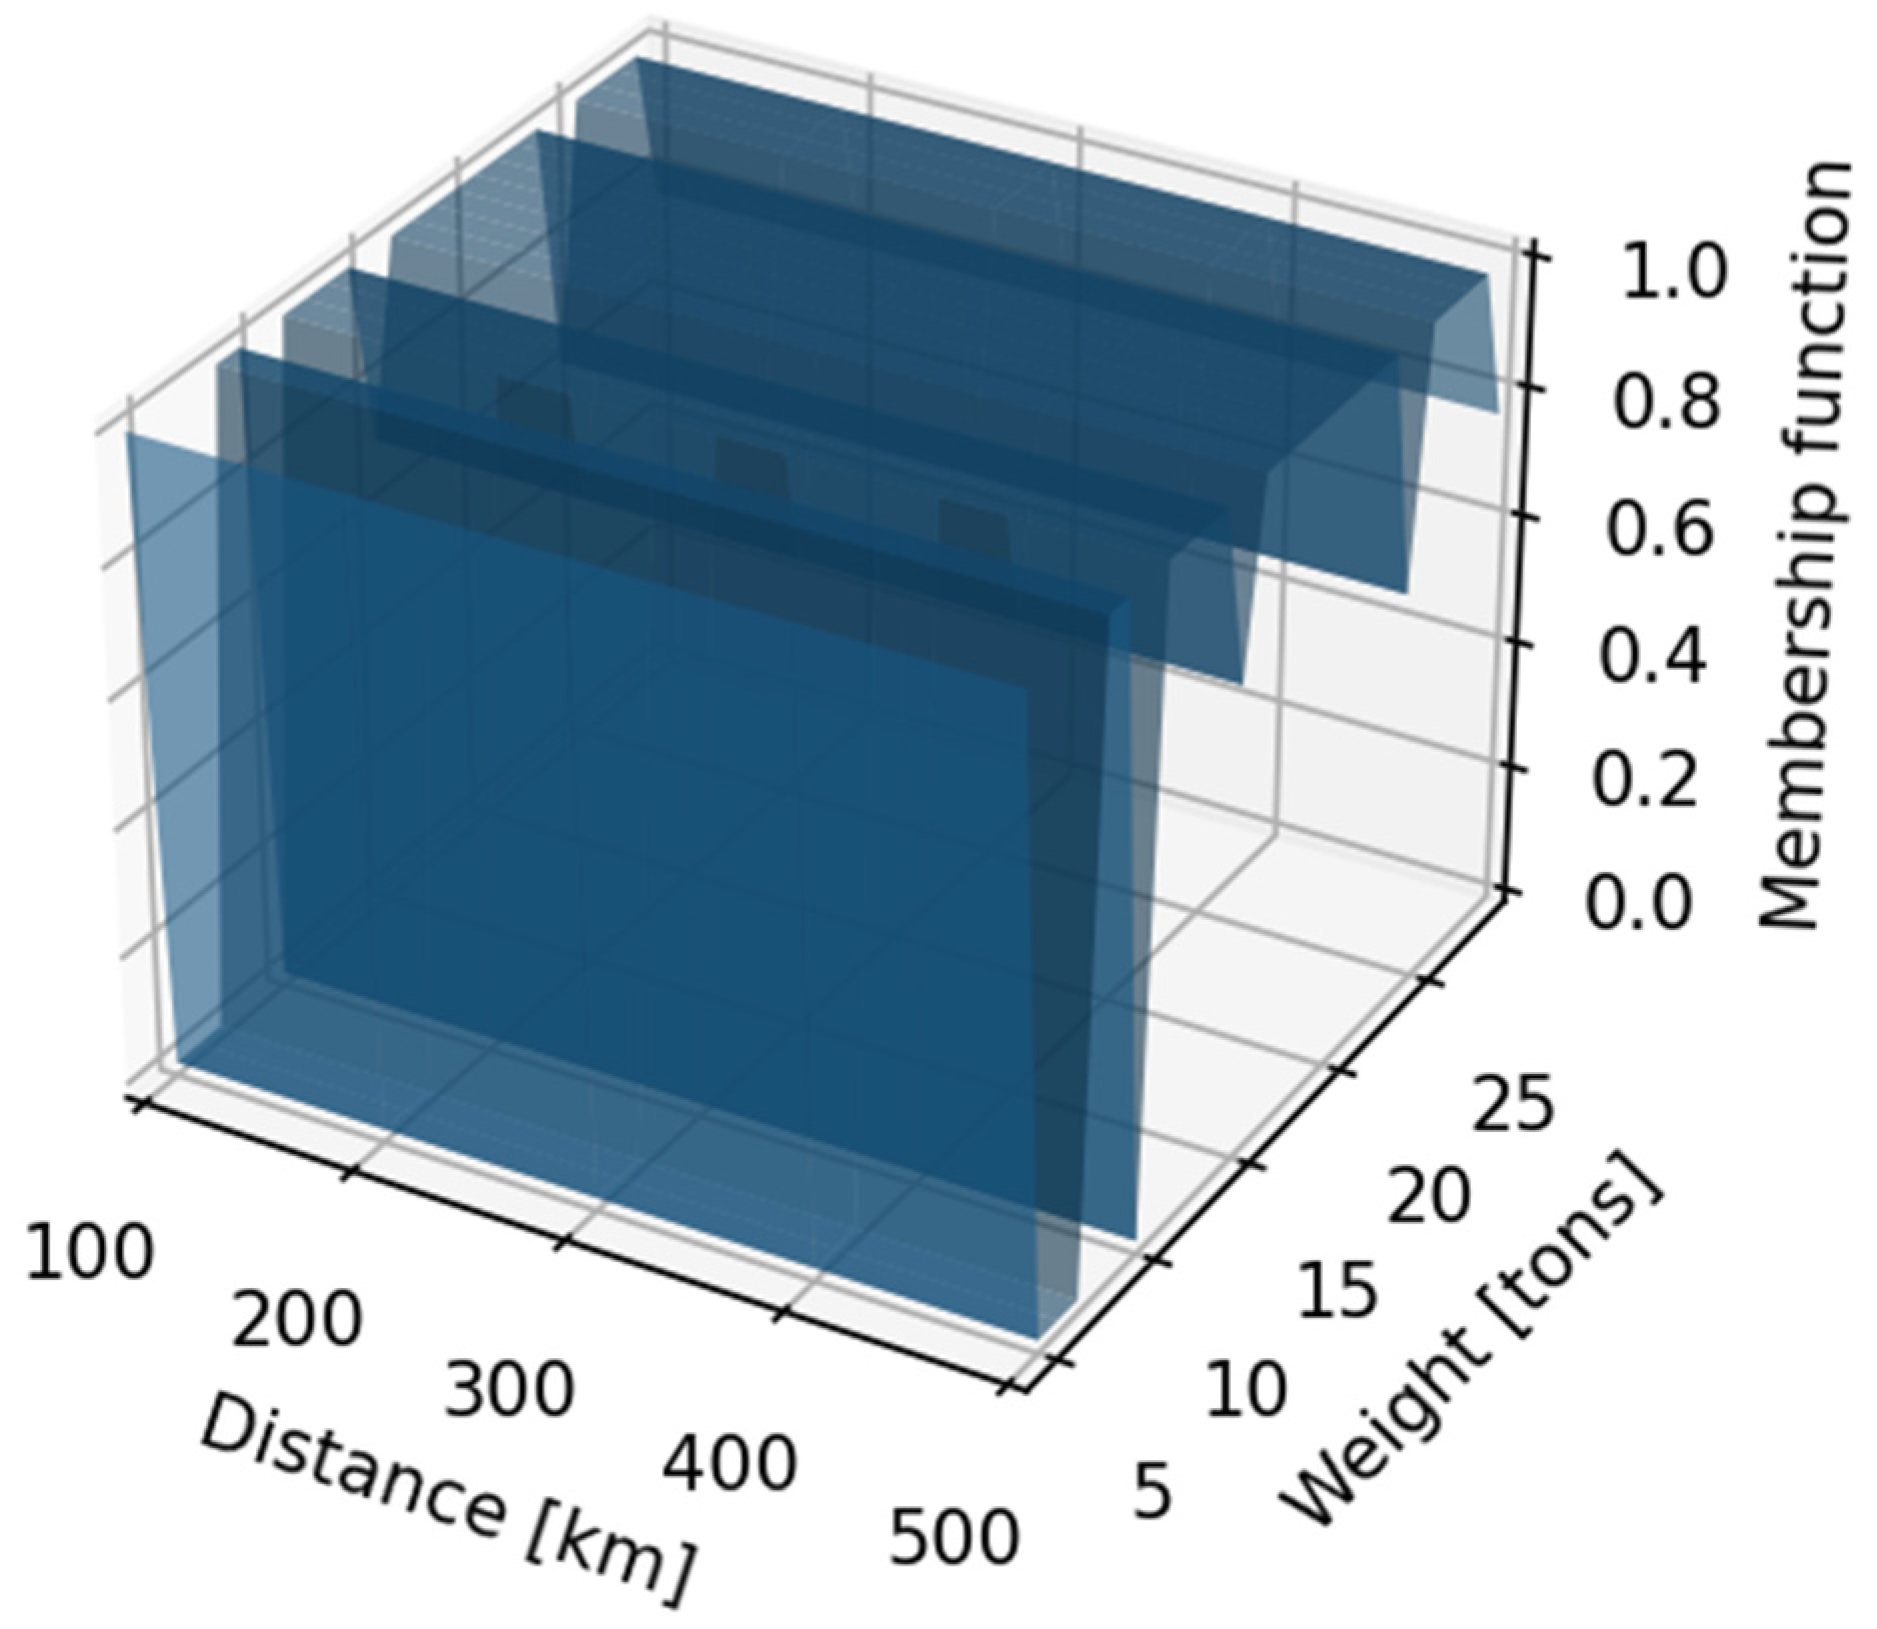
The feasibility of using a truck model can be determined by the obtained values of the binary fuzzy ratio using the surface plot (
Figure 5,
Figure 6 and
Figure 7), where the membership function is assigned for each tuple representing the demand parameters per single request.
As can be seen from the presented figures, compared to the influence of the consignment weight, the influence of the delivery distance on the values of membership functions is not so significant.
For the given request for transportation (that is characterized by known delivery distance and weight), by applying the defined membership functions, we can conclude if the given truck model belongs to the set of vehicles that must be used to service the client. As can be seen from the graphs of binary relationships, in the range of distances from 100 km to 500 km and the range of the consignment weight from 4 tons to 30 tons, the efficiency of the vehicle models is dissimilar for the considered truck models and significantly vary in consignment size. The Hyundai HD78 truck has the biggest chance of being chosen as the optimal choice because the membership function for this vehicle model equals 1 in a wide range of the considered consignment weight values.
If the operating conditions for each of
customers and the preference functions
and
for each of
truck models are known, then the fleet of vehicles for the transportation of goods to the
-th customer can be represented as a fuzzy set
:
where
,
, …,
are available vehicle models that could be used (are available) to service the clients, and
is the preference level of the
-th vehicle model when servicing the
-th client.
The set defined according to (5) is an S-fuzzy set, since it is linearly ordered (vehicle models are most obviously ordered by their carrying capacity), but there is no way to determine the distance between the elements of such a set.
Since the operating conditions for a particular client are determined by the tuple
, then the level of preference for the
-th vehicle model for the
-th client corresponds to the value of the membership function of the fuzzy binary relationship
:
where
and
are the size of the consignment in tons and the delivery distance in kilometers, respectively, for the
-th client.
Having a group of fuzzy sets
,
, it is possible to determine the qualitative structure of the truck fleet for a transport company in the form of a fuzzy set
in the following way:
It should be noted that the value of the level of preference makes it possible to determine not only the feasibility but also the priority of using different models of trucks: the bigger the level of preference, the higher the priority of the corresponding vehicle model when a request with the given demand parameters should be serviced.
The described method for determining the qualitative structure of the vehicle fleet allows us to consider, in addition to the delivery distance, the batch nature of transportation, and, therefore, allows us to assess the feasibility of using specific models of trucks more accurately. In addition, the representation of the fleet structure of a transport company in the form of a fuzzy set makes it possible to assess the risk of using a fleet with a given structure by constructing the corresponding risk functions.
4. Case Study and Discussion
The qualitative structure of the vehicle fleet is determined by the range of goods transported and the corresponding operating conditions. The range of goods, and, to a certain extent, operating conditions (considered as in the above, the delivery distance and batch size of transportation) are determined by the clientele of the trucking companies. Thus, the rational structure of the transport company’s fleet should be estimated based on the demand parameters that characterize the set of the company’s clients.
As the example that demonstrates the proposed approach, let us consider a transport company located in Almaty that operates in the transportation market for deliveries of agricultural products in Northern Kazakhstan. The main company’s clients are listed in the first column of
Table 1. For the clients presented in
Table 1, the delivery distance differs in the range of 146 to 957 km, and the consignment weight varies from 8 to 20 tons. As the alternative models of trucks to be used for servicing the company’s clients, we consider the list of vehicle models used as a demonstration set in the previous section: the Iveco Magirus, DAF XF 95430, Mercedes Benz Atego 1218, MAN TGL 8.18 BL, and Hyundai HD78.
The membership functions for the vehicle models taken under consideration are determined according to dependencies (2) and (3). Therefore, for the MAN TGL 8.18 BL truck, the value of the function
of the vehicle belonging to the fuzzy set of models that are optimal for use for a consignment weight of 4 tons and a delivery distance of 100 km is calculated as follows:
Similarly, the values of the membership functions are calculated for each of the considered (or available under the given operation conditions) vehicle models.
Based on the results of the membership function evaluation, the fleet of trucks required for the transportation of goods to the Atameken-Agro client (with an average delivery distance of 656 km and mean consignment weight of 15 tons) in the form of a fuzzy set according to (5) and the obtained values of the membership function, are as the following fuzzy set:
wherein
—the Iveco Magirus model,
—the DAF XF 95430 model,
—the Mercedes Benz Atego 1218 model,
—the MAN TGL 8.18 BL model, and
—the Hyundai HD78 model.
Each vehicle model corresponds to the value of the membership function for the mean weight of the shipment and the average distance of delivery that characterize the considered transport company’s client. Similarly, we represent the fleet of trucks for other customers and summarize the results in
Table 1.
As can be noticed from the results presented in
Table 1, the truck models
and
have assigned 0 values of the membership function for the majority of the transport company’s clients. Such results indicate that in most cases, the use of the Iveco Magirus and the DAF XF 95430 will generate losses. On the other hand, the value of the membership function assigned for the
vehicle model, in almost all cases, is 1, which means that the Hyundai HD78 will be the best alternative out of the considered truck models to transport agricultural products for the company’s clients.
According to expression (7), the qualitative structure of the transport company’s vehicle fleet has the following form:
or else it can be written in a transformed way as
As the result of calculations based on the data presented in
Table 1, we obtain the following rational qualitative composition of the transport company’s truck fleet in the form of a fuzzy set:
Analyzing the composition of the obtained fuzzy set, we conclude that each of the considered truck models can be used for delivering agricultural loads for the company’s clients. The vehicle models for the Mercedes Benz Atego 1218 and the Hyundai HD78 are the most efficient (as the maximum value of the membership function is assigned to these models), whereas the use of the MAN TGL 8.18 BL truck model to service the transport company’s clients is possible (as it does not generate losses) when other vehicles are not available.
The obtained result in the form of the fuzzy set may be compared with the corresponding conventional approach when the vehicle models are justified based on the efficiency indicators. The conventional (non-fuzzy) set of truck models that generate the highest profit consists of the vehicle models that have the highest possible value of the corresponding membership function (the function values for such models equal 1). If the decision for the presented case is made based on the traditional justification, only the Mercedes Benz Atego 1218 and the Hyundai HD78 should be chosen for servicing the considered set of clients. However, in practice, the use of vehicles from the traditional non-fuzzy set for servicing all the company’s clients may be not feasible due to the restricted number of available trucks. That restriction is easily avoided when the proposed approach is used to define the vehicle fleet structure: if the vehicle characterized by the highest value of the membership function is not available, the vehicle with the next highest function value should be chosen from the fuzzy set to service a client.


 ,
, 


