Article

Changes in Extremes Rainfall Events in Present and Future Climate Scenarios over the Teesta River Basin, India

by
Pawan Kumar Chaubey
,
Rajesh Kumar Mall
* and
Prashant K. Srivastava
DST-Mahamana Centre of Excellence in Climate Change Research, Institute of Environment and Sustainable Development, Banaras Hindu University, Varanasi 221005, India
*
Author to whom correspondence should be addressed.
Sustainability 2023, 15(5), 4668; https://doi.org/10.3390/su15054668
Submission received: 4 February 2023 / Revised: 1 March 2023 / Accepted: 3 March 2023 / Published: 6 March 2023

Abstract

:
Globally, changes in hydroclimate extremes such as extreme precipitation events influence water resources, natural environments, and human health and safety. During recent decades, India has observed an enormous increase in rainfall extremes during the summer monsoon (June to September) seasons. However, future extreme rainfall events have significant uncertainty at the regional scale. Consequently, a comprehensive study is needed to evaluate the extreme rainfall events at a regional river basin level in order to understand the geomorphological characteristics and pattern of rainfall events. In the above purview, the current research focuses on changes in extreme rainfall events obtained through observed gridded datasets and future scenarios of climate models derived through the Coupled Model Intercomparison Project (CMIP). The results highlight a significant rise in the extremes of precipitation events during the first half of the 21st century. In addition, our study concludes that accumulated precipitation will increase by five days in the future, while the precipitation maxima will increase from 200 to 300 mm/day at the 2-year, 50-year, and 100-year return periods. Finally, it is found that during the middle of the 21st century the 23.37% number of events will increase over the TRB at the 90th percentile.

1. Introduction

The Himalayan Mountains are the main driver of extreme rainfall events during the Indian Southwest Monsoon that ranges over the Sikkim region in south-central asia [1,2,3]. An increase in the frequency of extreme weather events and significant changes in rainfall patterns due to climate change adversely impact the river basin geomorphology and subsequently lead to fluvial floods [4,5,6,7,8]. During recent years, the number of cloudburst events over the high-altitude river basins has increased, which has caused extensive and widespread loss to both property and life [9,10,11,12,13,14].
Changes in rainfall extremes and the frequency of severe floods in different Indian river basins have been observed from the beginning of the 20th century [6,15,16,17,18,19,20]. Of such river basins, the Teesta River Basin (TRB), based in the mountainous region of northeast India, has been increasingly affected by extreme rainfall every year [21,22]. These extreme rainfall events over the W–E direction of Sikkim, representing the combined river discharge of the Rangeet, Teesta, and Lachend, have resulted in a rise in water levels and caused flooding downstream of the TRB.
Previous researchers have used morphometric analysis to manage extreme events and design control management for floods [22,23,24,25,26,27,28]. Youssef et al. [29] state that morphometric parameters such as the form factor, drainage density, etc., are widely used to define the flash flood potentials in a river basin. The morphometric analysis of a river basin explains the hydrological processes (flood, sediment load, erosion, etc.) as well as the watershed geomorphology [30,31]. Several studies have been conducted on morphometric characteristics to understand hydrological system and flash flooding events during the last two decades [21].
Of these different studies, General Circulation Models (GCMs) and Regional Circulation Model (RCMs) have been used to project extreme precipitation in the 21st century [15,32,33,34] GCMs are projected models derived by different Representative Concentration Pathway (RCP) scenarios, which resemble low to high greenhouse gas (GHG) emissions pathways [35,36]. RCPs describe different climate futures, all of which are considered possible depending on the volume of GHG emitted in the years to come. Research performed by [37] used RCP 8.5 (high emission pathway) to estimate the projected change in the frequency of extreme rainfall over the different river basins in India. It was estimated that the frequency of extreme rainfall will increase prominently in India during the middle and end of the 21st century [11]. To evaluate extreme precipitation events, the annual maximum daily precipitation is a significant hydrological variable [38], and several methods have been developed to analyse the extreme precipitation index using those methods. Of these methods, the Generalized Extreme Value Distribution (GEV) based on Extreme Value Theory (EVT) has proven reliable for evaluating extreme precipitation, and could be an ideal method for analysis of hydrological hazards such as floods [39,40]. Another efficient method, the Standardized Precipitation Index (SPI), provides significant hydrological results by monitoring the average rainfall percentage for a region [41,42,43]. The Extreme Precipitation Index (EPI) is another useful index used to determine the frequency of extreme rainfall events, and can be used to estimate the magnitude, intensity, and persistence of flooding [34,41]. Studies have implemented the SPI for flood analysis using precipitation as an input on monsoon time scales of four months, while the twelve-month SPI indicates the long-term wet period over the study area [26,43,44,45].
The TRB faces a flash flood situation which creates havoc in local areas almost every year. In 2012, flash flooding induced a series of landslides that killed 22 people and damaged a 30 km stretch of highway in North Sikkim [46]. Recently, on 28 June 2020, the TRB experienced heavy rainfall that led to flash floods, leaving a trail of destruction in upper Dzongu, Sikkim [47]. Several studies have been conducted based on flash flooding in the TRB [21,22]. However, only a few studies have focused on the topic of changes in rainfall extremes, and no studies were found in our literature survey that dealt with climate change and its impact on rainfall extremes in the TRB. Therefore, it is important to know how possible future climatic changes will affect the intensity and spatiotemporal variability of rainfall in the TRB. To this end, the present study focuses on evaluating extreme rainfall events in present and future scenarios using simulated outputs from the Coupled Model Intercomparison Project (CMIP5) for the TRB. In order to understand the basin’s behaviour and hydrological response, morphometric analysis is used to link extreme events with basin functions. A detailed analysis of extreme rainfall events from 1970–2005 and projected scenarios from 2006–2070 are provided, along with indices such as EPI, SPI, GEV, and their spatial distributions.

2. Materials and Methods

2.1. Study Region

The Teesta river originates in the Teesta–Khangtse glacier in the Himalayas, flows through the Indian states of Sikkim and West Bengal, and eventually reaches a confluence with the Brahmaputra River in Bangladesh, flowing in a north–south direction, as shown in Figure 1. The TRB, which covers an area of 12,540 km 2 , is influenced by the Indian summer monsoon (ISM). Its topographical variation causes steep runoff, frequently resulting in flooding over the river catchment area [22]. During the monsoon season from June to September, variation in precipitation of around 4000–6000 mm has been recorded at the hilly region, while 1000–2000 mm has been recorded near the Rangit valley [22].
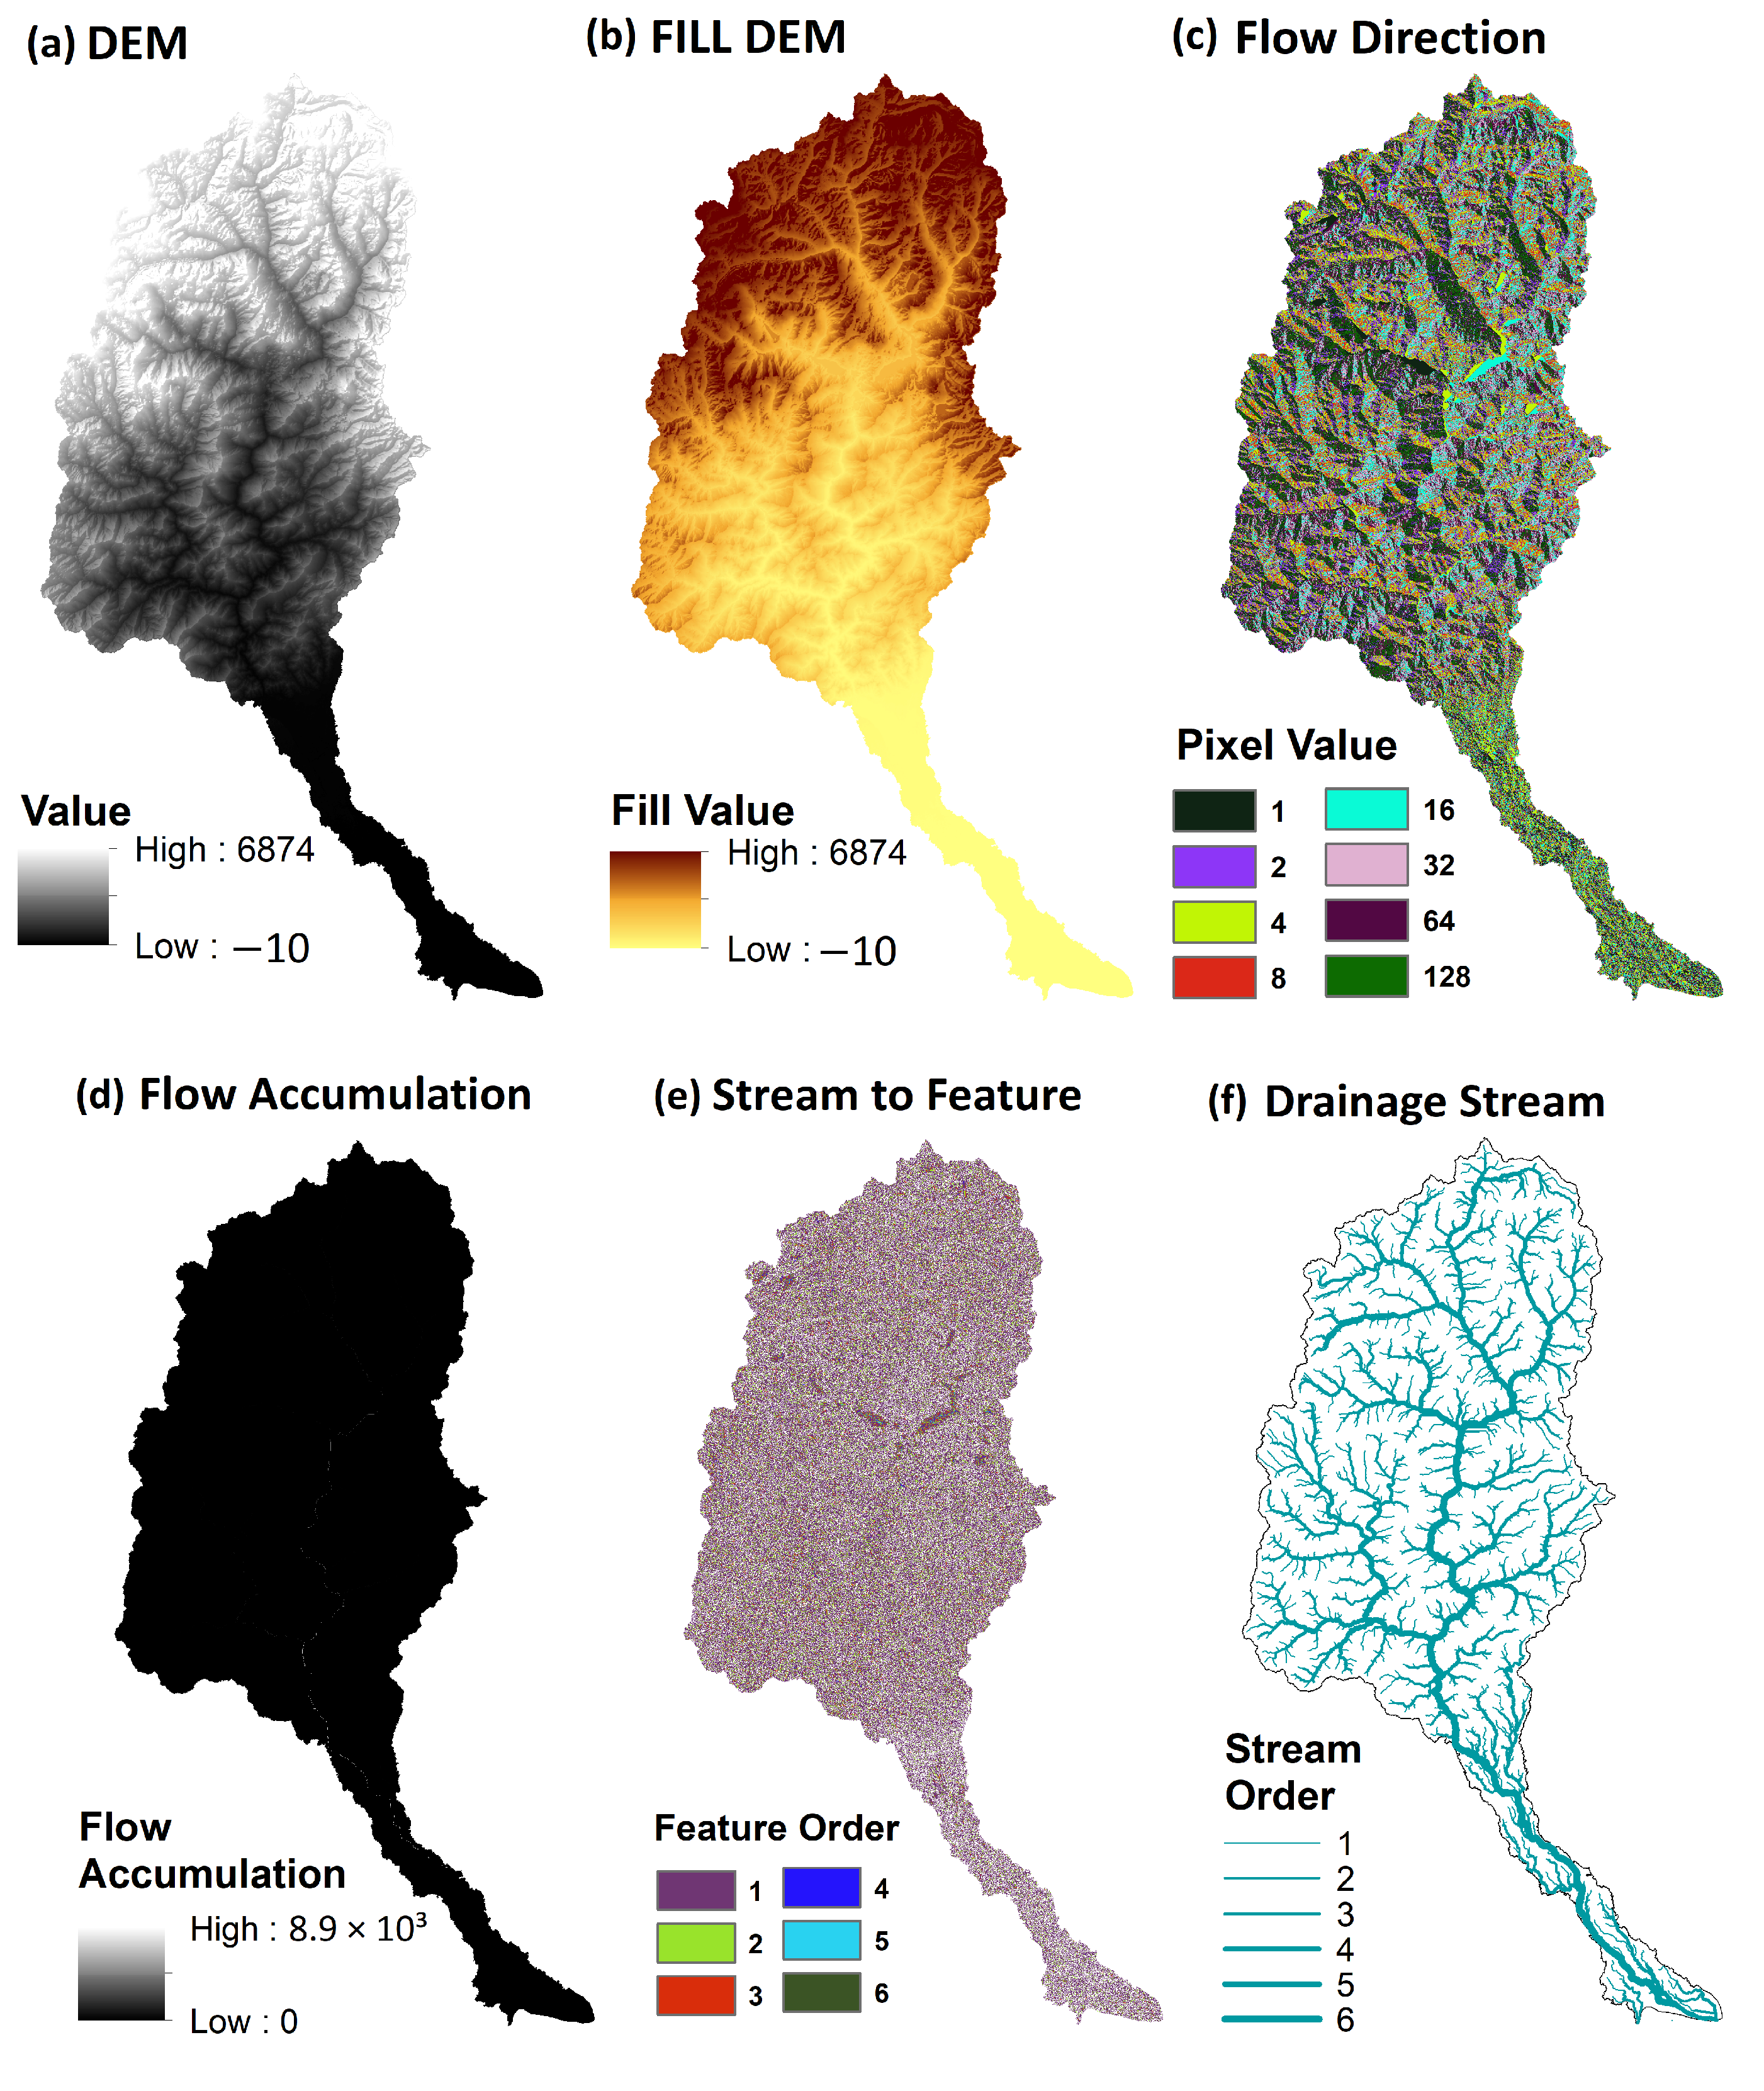
To understand the hydrological responses of the river basin, the hydro-geomorphological characteristics of the TRB are shown in Table 1. The Teesta river basin has a high discharge ability due to its high relief ratio (88.16–14.78) [26,48], i.e., the basin has a steep structural ridge sloping south-westward. Figure A1 shows the drainage stream delineated using spatial analysis tools in ArcGIS 10.4.

2.2. Data Sources

To delineate the watershed and subsequently examine the morphometric analysis of the complete drainage network of the TRB, the Shuttle Radar Topography Mission (SRTM) Digital Elevation Model (DEM) with 30 m spatial resolution was used. The gridded daily rainfall data at 0 . 25 × 0 . 25 spatial resolution for 49 years (1970–2018) was provided by the Indian Metrological Department (IMD), and was used to analyse the current extreme precipitation (baseline) situation in this study. The climate model datasets for the South Asia region were downloaded from the Climate Data Portal (http://cccr.tropmet.res.in/home/cordexsa_datasets.jsp, accessed on 10 January 2023) of the Centre for Climate Change Research—Indian Institute of Tropical Meteorology (CCCR-IITM). These datasets comprised the Coordinated Regional Climate Downscaling Experiment (CORDEX) South Asia Regional Climate Model (RCM), with selected outputs of three ensemble members of the Conformal Cubic Atmospheric Model (CCAM) driven by the Coupled Model Intercomparison Project (CMIP5) of the Atmosphere–Ocean Coupled General Circulation Model (AOGCM) (CCSM4, CNRM-CM5, and GFDL-CM3).
Extreme rainfall events were calculated for historical (1970–2005) and projected (2006–2070) time periods using the high emission climate scenario of RCP 8.5. The IMD rainfall data (1970–2018) were reconstructed in grid format at 0.5° × 0.5° spatial resolution using the Inverse Distance Weighting (IDW) method to match with the resolution of simulated model outputs [49]. In addition, all the meteorological variables were resampled on the same spatial resolution of 0.5° × 0.5° to use in the study. The complete details of the data are provided in Table 2.

2.3. Generalized Extreme Value (GEV)

The GEV distribution is established under the Extreme Value Theory (EVT) and is related to the continuous probability [50,51]. Extreme rainfall is estimated following the block maxima theory, that is, extremes are computed as the annual maxima of daily rainfall. EVT is the statistical approach to the analysis of the probability of hydroclimate extreme events. Based on the EVT theorem, this study fitted the GEV distribution for the annual maximum rainfall to find the outcomes that best describe the probability distribution of the hydroclimate extremes [39,51]. According to Coles et al. [52], the cumulative distribution function (CDF) for non-stationary GEV is summarized in Equation (1):
GEV ( x , t ) = exp [ ( 1 + ζ ( t ) ) x μ σ ( t ) ) ] 1 ζ ( t )
where x represents the rainfall to be modeled and μ (t), σ ( t ) , and ζ ( t ) signify the time-dependent location, scale, and shape parameter, respectively. This study model was fitted using the ‘‘extRemes’’ package available in the R computing environment [50,53].

2.4. Precipitation Anomaly Indices

The Standardized Precipitation Index (SPI) is estimated using precipitation as the input by fitting the gamma distribution to 12-month running climatological precipitation time series through maximum likelihood methods [42] (Table 3). The estimated SPI values are based on only rainfall, while the outcomes as organized by negative to positive values represent the dryness and wetness over the study area (Table 3).
According to [54], the Rainfall Anomaly Index (RAI) assign the rank of the rainfall values as per Equation (2) below:
RAI = ± S F × [ ( p i p ¯ ) m ¯ p ¯ ]
where p i = the monthly rainfall, i = the month, p ¯ = the long-term rainfall average, m ¯ = the mean of the ten highest or lowest rainfall values, and ± SF = arbitrary threshold values of +3 and −3.

2.5. Extreme Precipitation Indices (EPI)

Easterling et al. [41] state that extreme rainfall is explained as a topography region experiencing catastrophic rain for a short-term or long-time duration.
We examined the trend of intense rainfall over the time scale by using it to improve indices with numerous estimation factors. In this study, four EPI indices were evaluated to address extreme events based on three categories, i.e., magnitude, intensity, and persistence, as shown in Table 4 [34,55]. All indices are related to very wet and extreme events: Pn10mm (number of days with precipitation ≥10 mm), PRwn90, PRwn95, and PRwn99 (computing the 90th, 95th, and 99th percentiles of precipitation on wet days), Rx5max (computing the 5-day total accumulated precipitation), Pnl90 (Number of events > long-term 90th percentile), and Pint (rainfall per day ≥ 1 mm). According to [34], these indices can maximize the correlation in different climate analyses.
Moreover, we computed the daily rainfall at different percentiles levels as a fraction of the total rainfall from extreme rainfall events.

3. Results

3.1. Evaluation of Rainfall Variability in the TRB

The variation of mean, maximum, minimum, and inter-annual observed IMD rainfall as well as the simulated precipitation outputs of CMIP5 at the daily, monthly, and annual frequencies were analysed over the periods from 1970 to 2018 and 1970 to 2070.
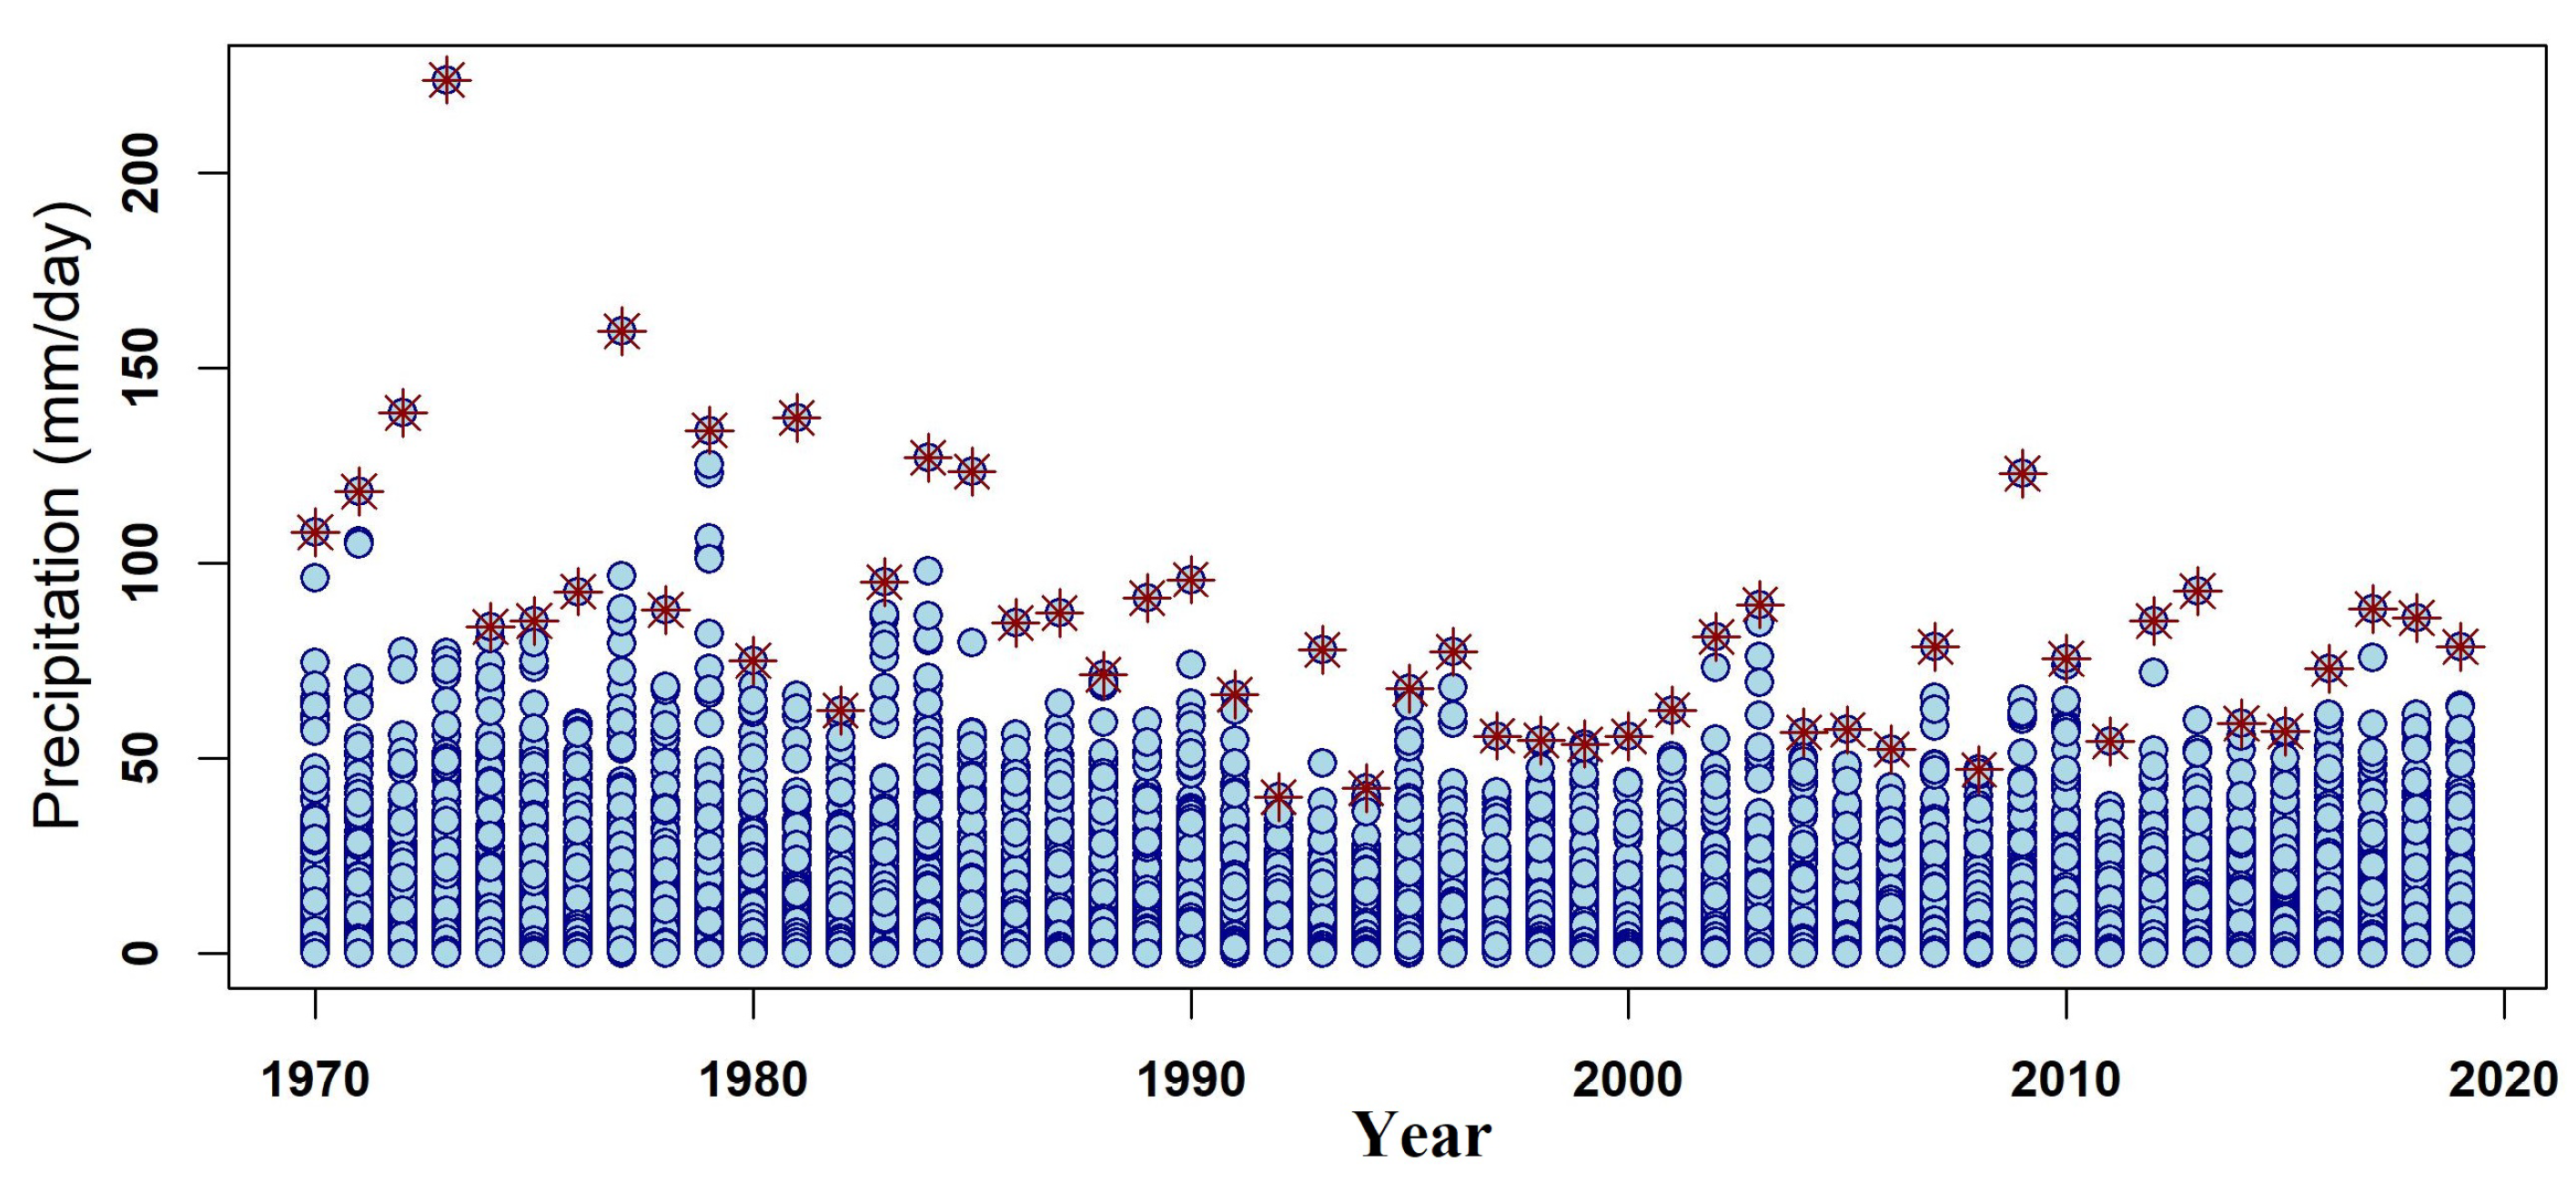
Figure 2 shows the temporal variation in the daily rainfall intensity in the TRB. During the 1970s and 1980s, the TRB is found to be highly intensified, with rainfall over 200 mm/day in 1973. Moreover, during the 2000s and 2010s the TRB has experienced heavy rainfall intensity (≥64.5 mm/day).
The maximum rainfall in a single day has been observed in relation to flood events during the years 1970–2018, with the years 1973, 1977, 1981, 1984, 1985, and 2009 showing heavy to extreme recorded rainfall per IMD criteria, i.e., 124.5–244.4 mm/day. In Figure 2, the red stars represent the maximum daily rainfall events for each year, and range from 40 mm/day to 244 mm/day. The heavy rainfall frequency has increased over the last decade following the year 2009 (recorded 124 mm/day). The matrix plot in Figure 3 shows the monthly variation in the rainfall, with notably heavy rainfall per month occurring during 1970–2018.
During the 1970s and 1980s, the monthly rainfall was found to have the highest peak (1200 mm/month) in July. However, during the 2000s and later, the monthly rainfall was found to vary from 0 to 900 mm/month.
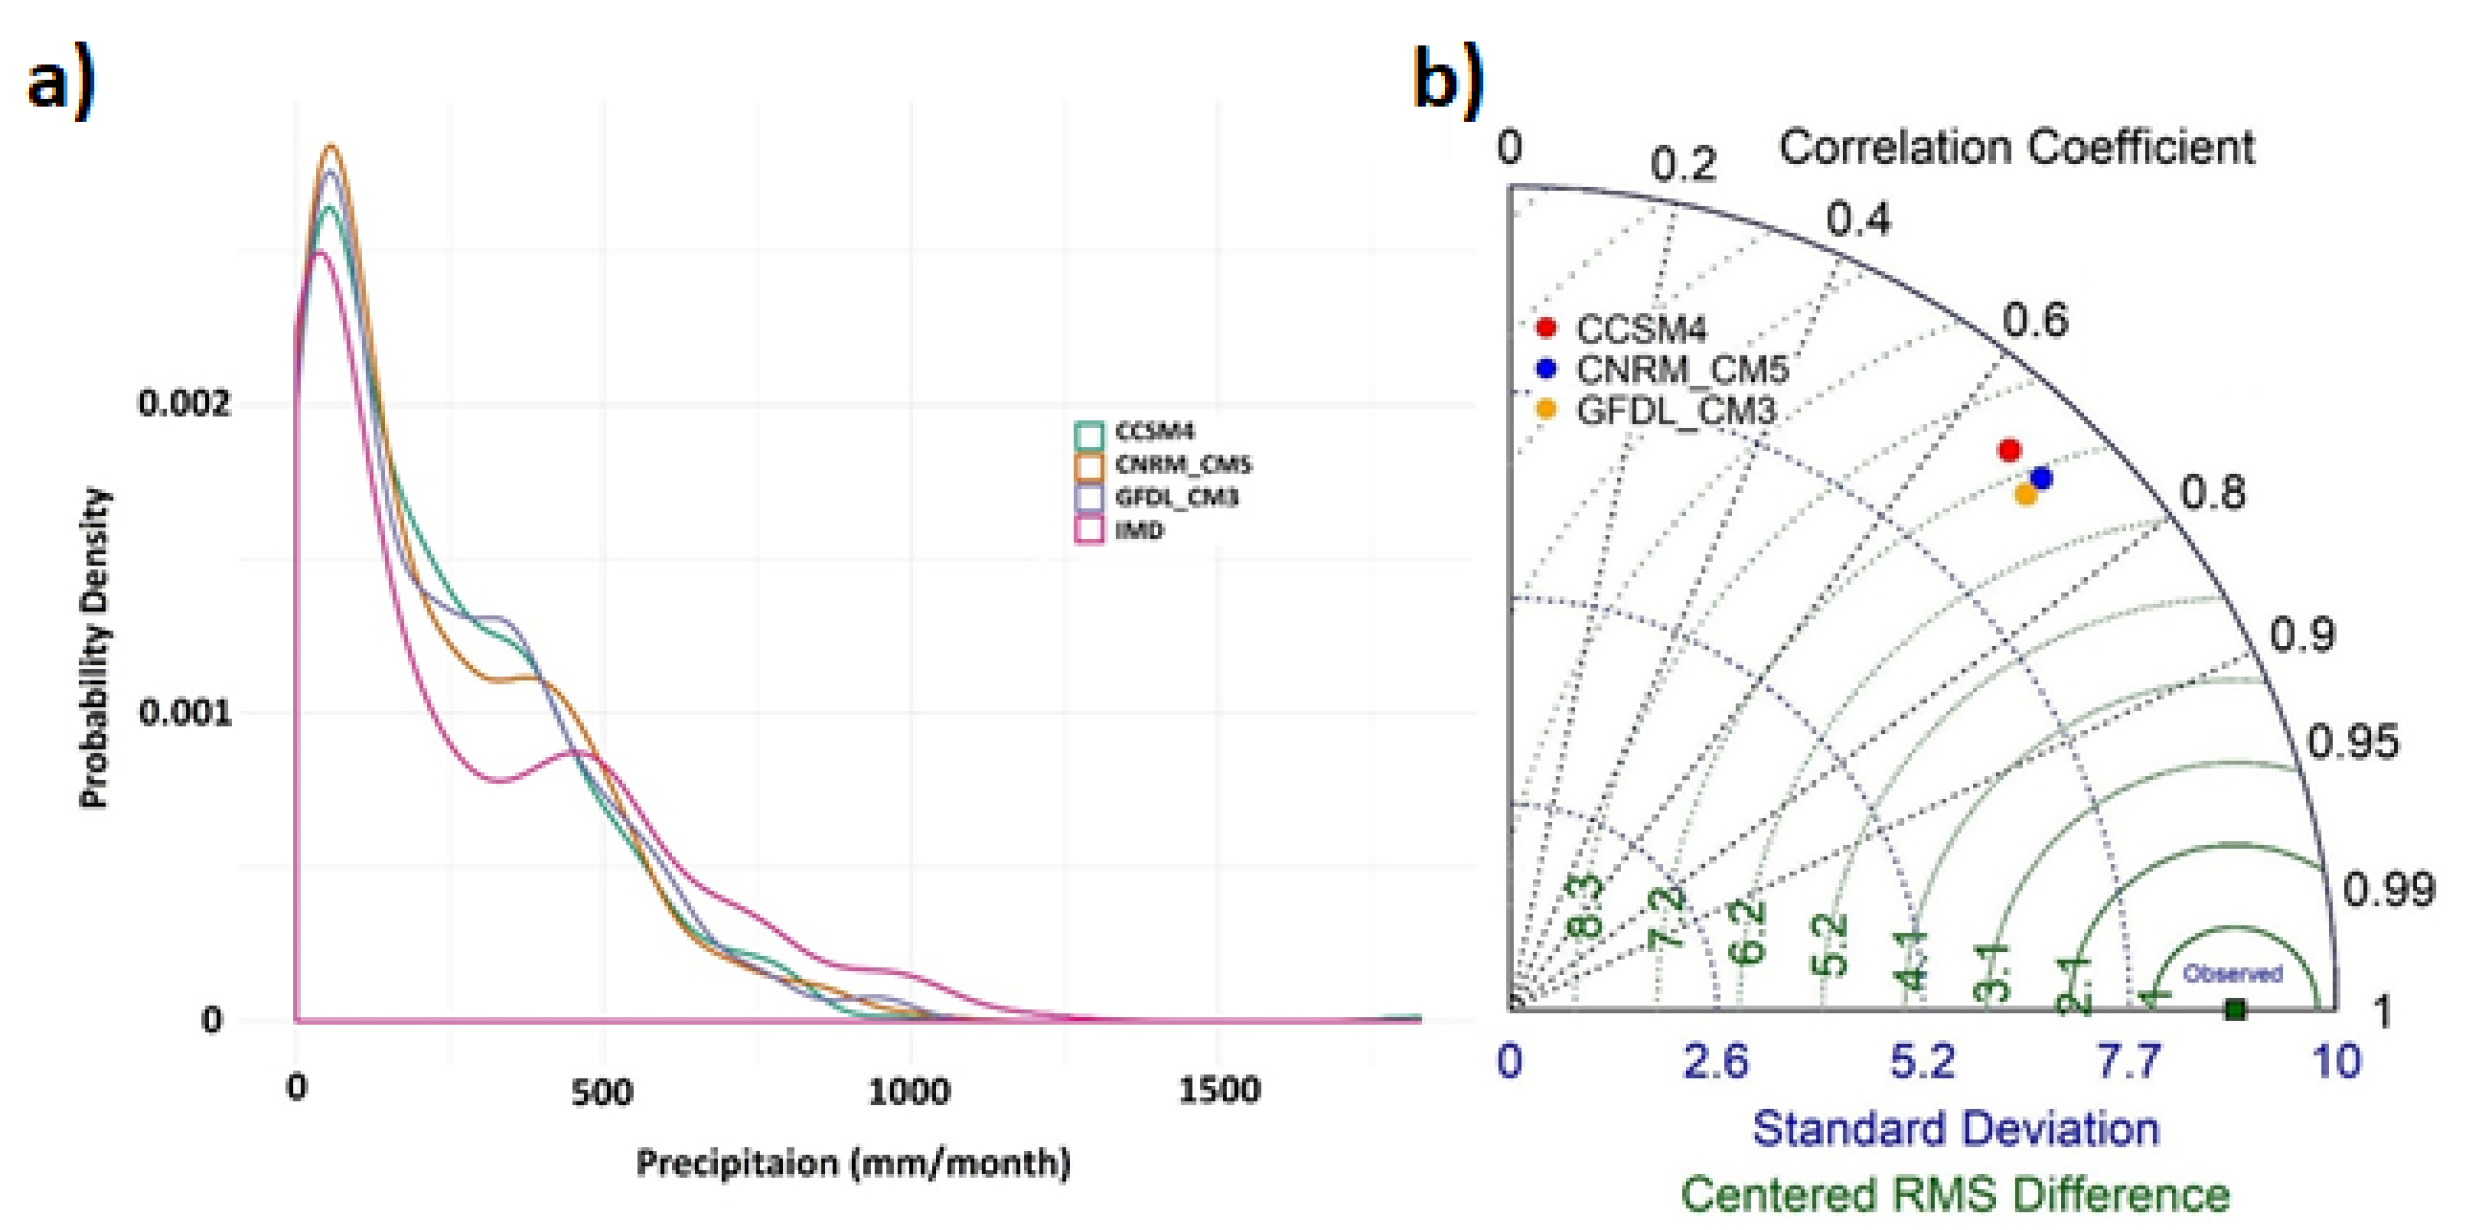
Figure 4a,b shows the probability density of the precipitation between all three ensemble simulated outputs of the CMIP5 model and the observed IMD data from 1970 to 2005 at 0.5° × 0.5° spatial resolution. Figure 4a shows the interquartile model spread (between the 25th and 75th quantiles). The probability density of the precipitation for the observed historical period of CMIP5 has been shifted positively from 0.0011 to 0.0028 below the 500 mm/month rainfall, whereas above the 500 mm/month the CMIP5 results are shifted negatively with respect to the observed IMD (Figure 4a). The correlation between model (CMIP5) and observed (IMD) monthly mean rainfall was evaluated using a Taylor diagram for the observed historical period from 1970 to 2005. In Figure 4b, the dotted blue lines correspond to standard deviations, the green line denotes the centered root mean square (RMS) difference, and the black dotted lines represent the correlations between model outputs (CCSM4, CNRM-CM5, and GFDL-CM3) and ground observations (IMD).
All three simulated climate model outputs show a good fit with observations. However, GFDL-CM3 was found to be highly correlated, with a correlation coefficient of up to 0.7 and a Root Mean Square (RMS) difference close to 7.1.
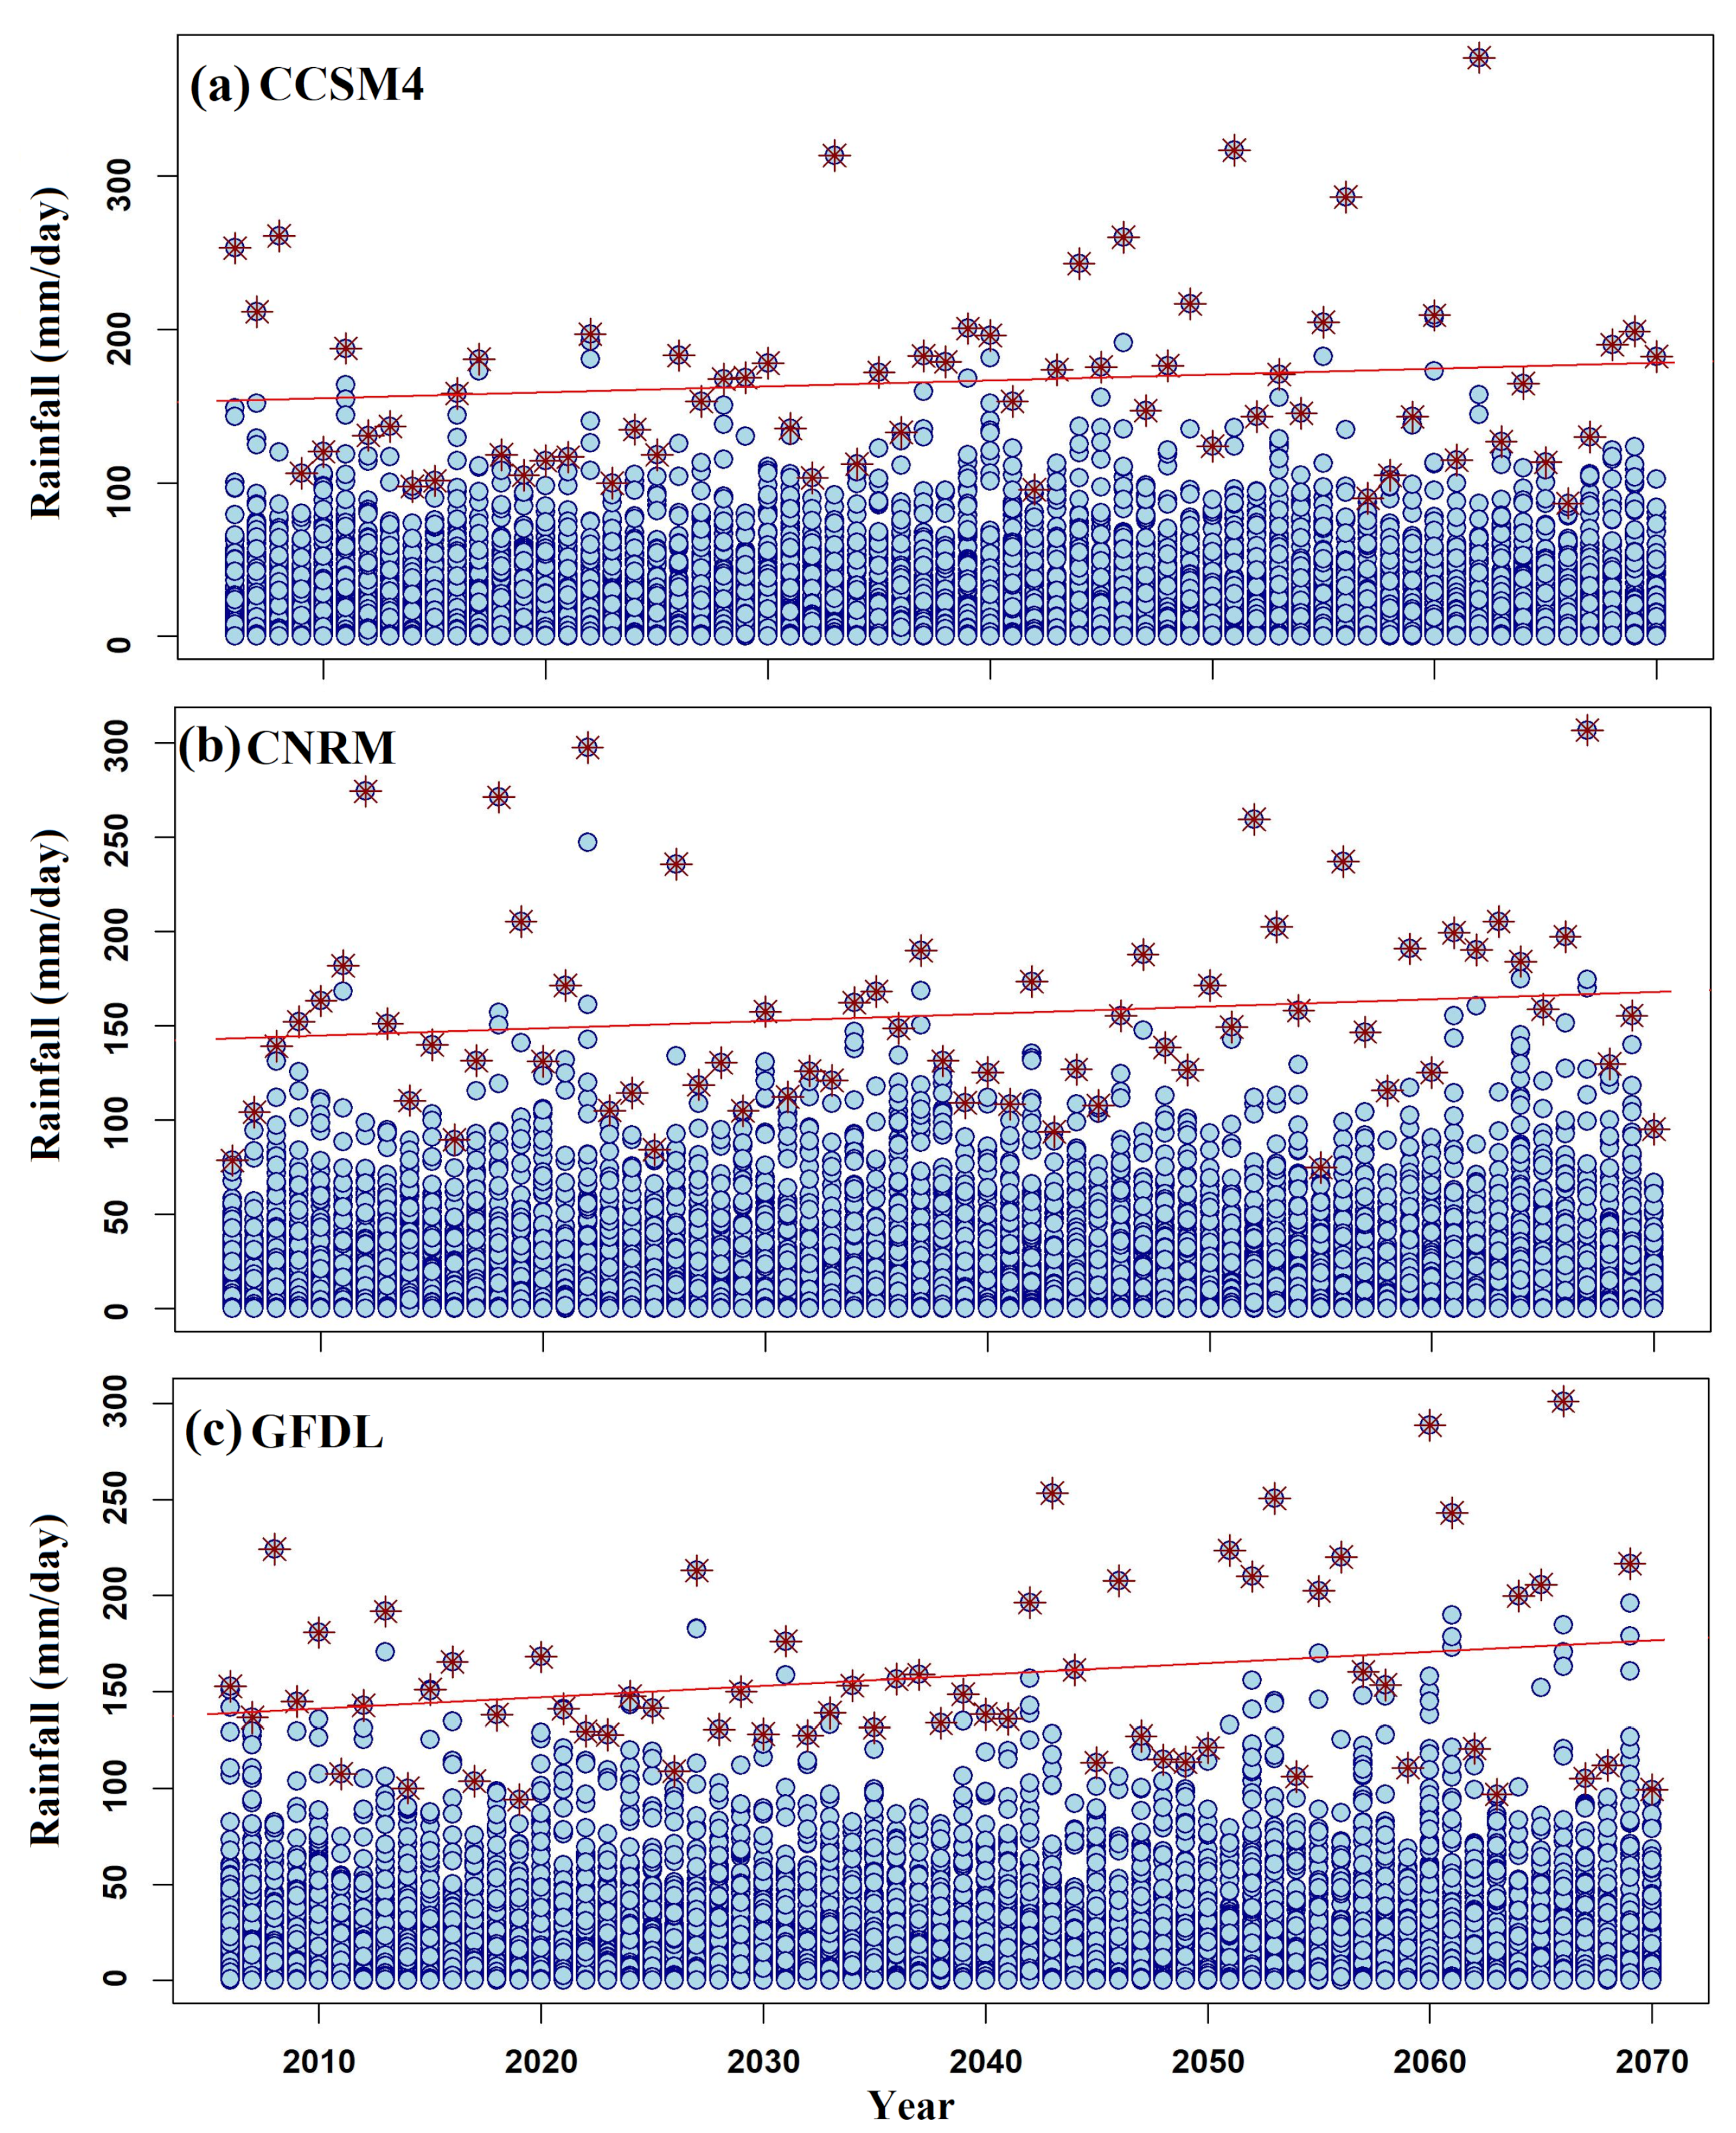
The projected (2006–2070) frequency of maximum daily precipitation over the TRB was evaluated, with the results shown in Figure 5. The intensity of the maximum daily precipitation over the TRB increased in the mid-21st century.
The projected CCSM4 outputs show the maximum daily rainfall as more significant than 340 mm/day, while CNRM-CM5 and GFDL-CM3 show approximately similar variations in maximum daily rainfall over the TRB. The future trend of extreme precipitation (maximum values) in all the climate models shows an increasing (positive) trend. The extreme precipitation trend in CCSM4 and CNRM is mostly similar, at 32% and 30%, respectively. Moreover, the GFDL shows the maximum increasing trend in the future, at close to 54%.

3.2. Hydrological Extremes from GEV Distribution

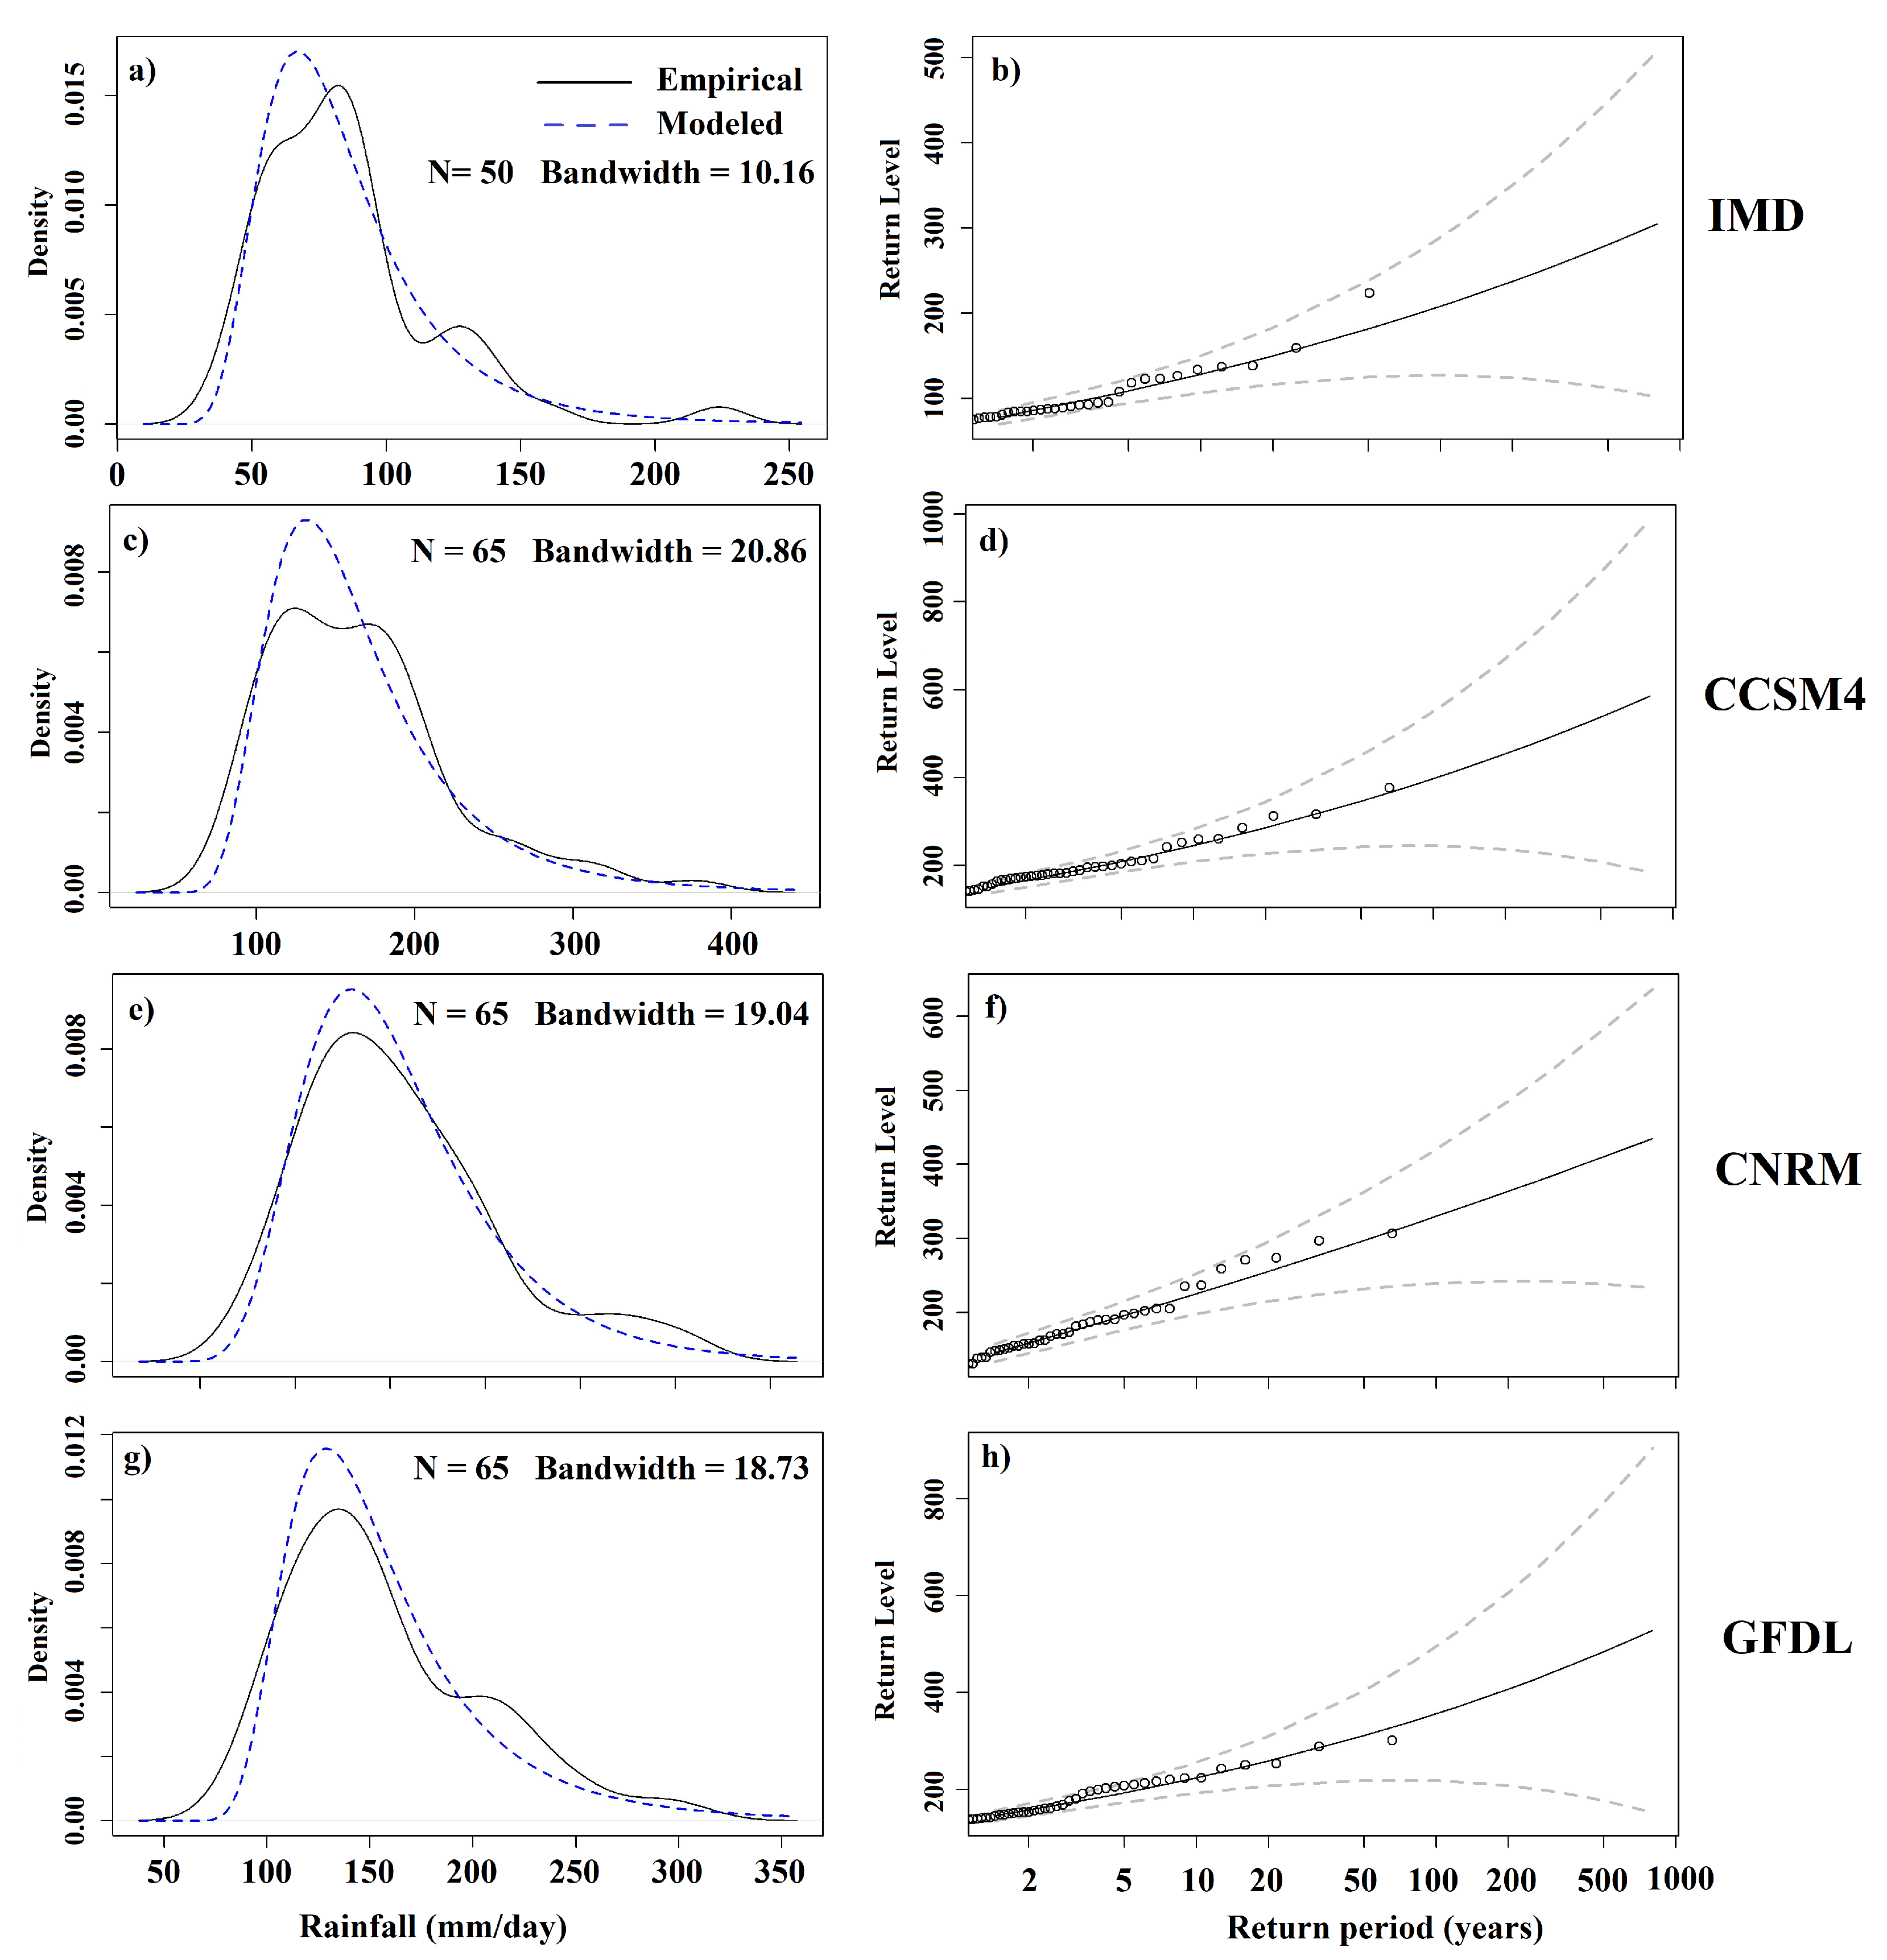
The fitted GEV was applied based on the block maxima theory for annual maximum rainfall for the observed and climate model outputs. The fitted GEV distribution trend for the annual maxima rainfall datasets reflects the significant results. Moreover, additional study was executed on the extended prolonged time scale with climatic models. The likelihood ratio test is an analytical approach for concluding the best fit among stationary and non-stationary approaches. The observed return level was performed over the IMD rainfall (1970–2018) for 49 years, and the 65 years projected return level was estimated using CMIP5 simulated outputs (2006–2070). The representation of the fitted GEV for density and return level are plotted in Figure 6a–h. The GFDL-CM3 was calculated as a 0.011% probability of rainfall maxima as fitted with the GEV model, having 100 to 200 mm/day rainfall over the TRB (Figure 6g,h). The IMD showed the highest probability of extreme rainfall at a 50-year return period, at about 210 mm/day (Figure 6b). However, for a 10-year return period CNRM shows a maximum rate probability of extreme rainfall of about 250 mm/day (Figure 6f). In contrast, at a 50-year return period CCSM4 shows the highest value of extreme rainfall conditions, with a return level of 300 mm/day (Figure 6d).
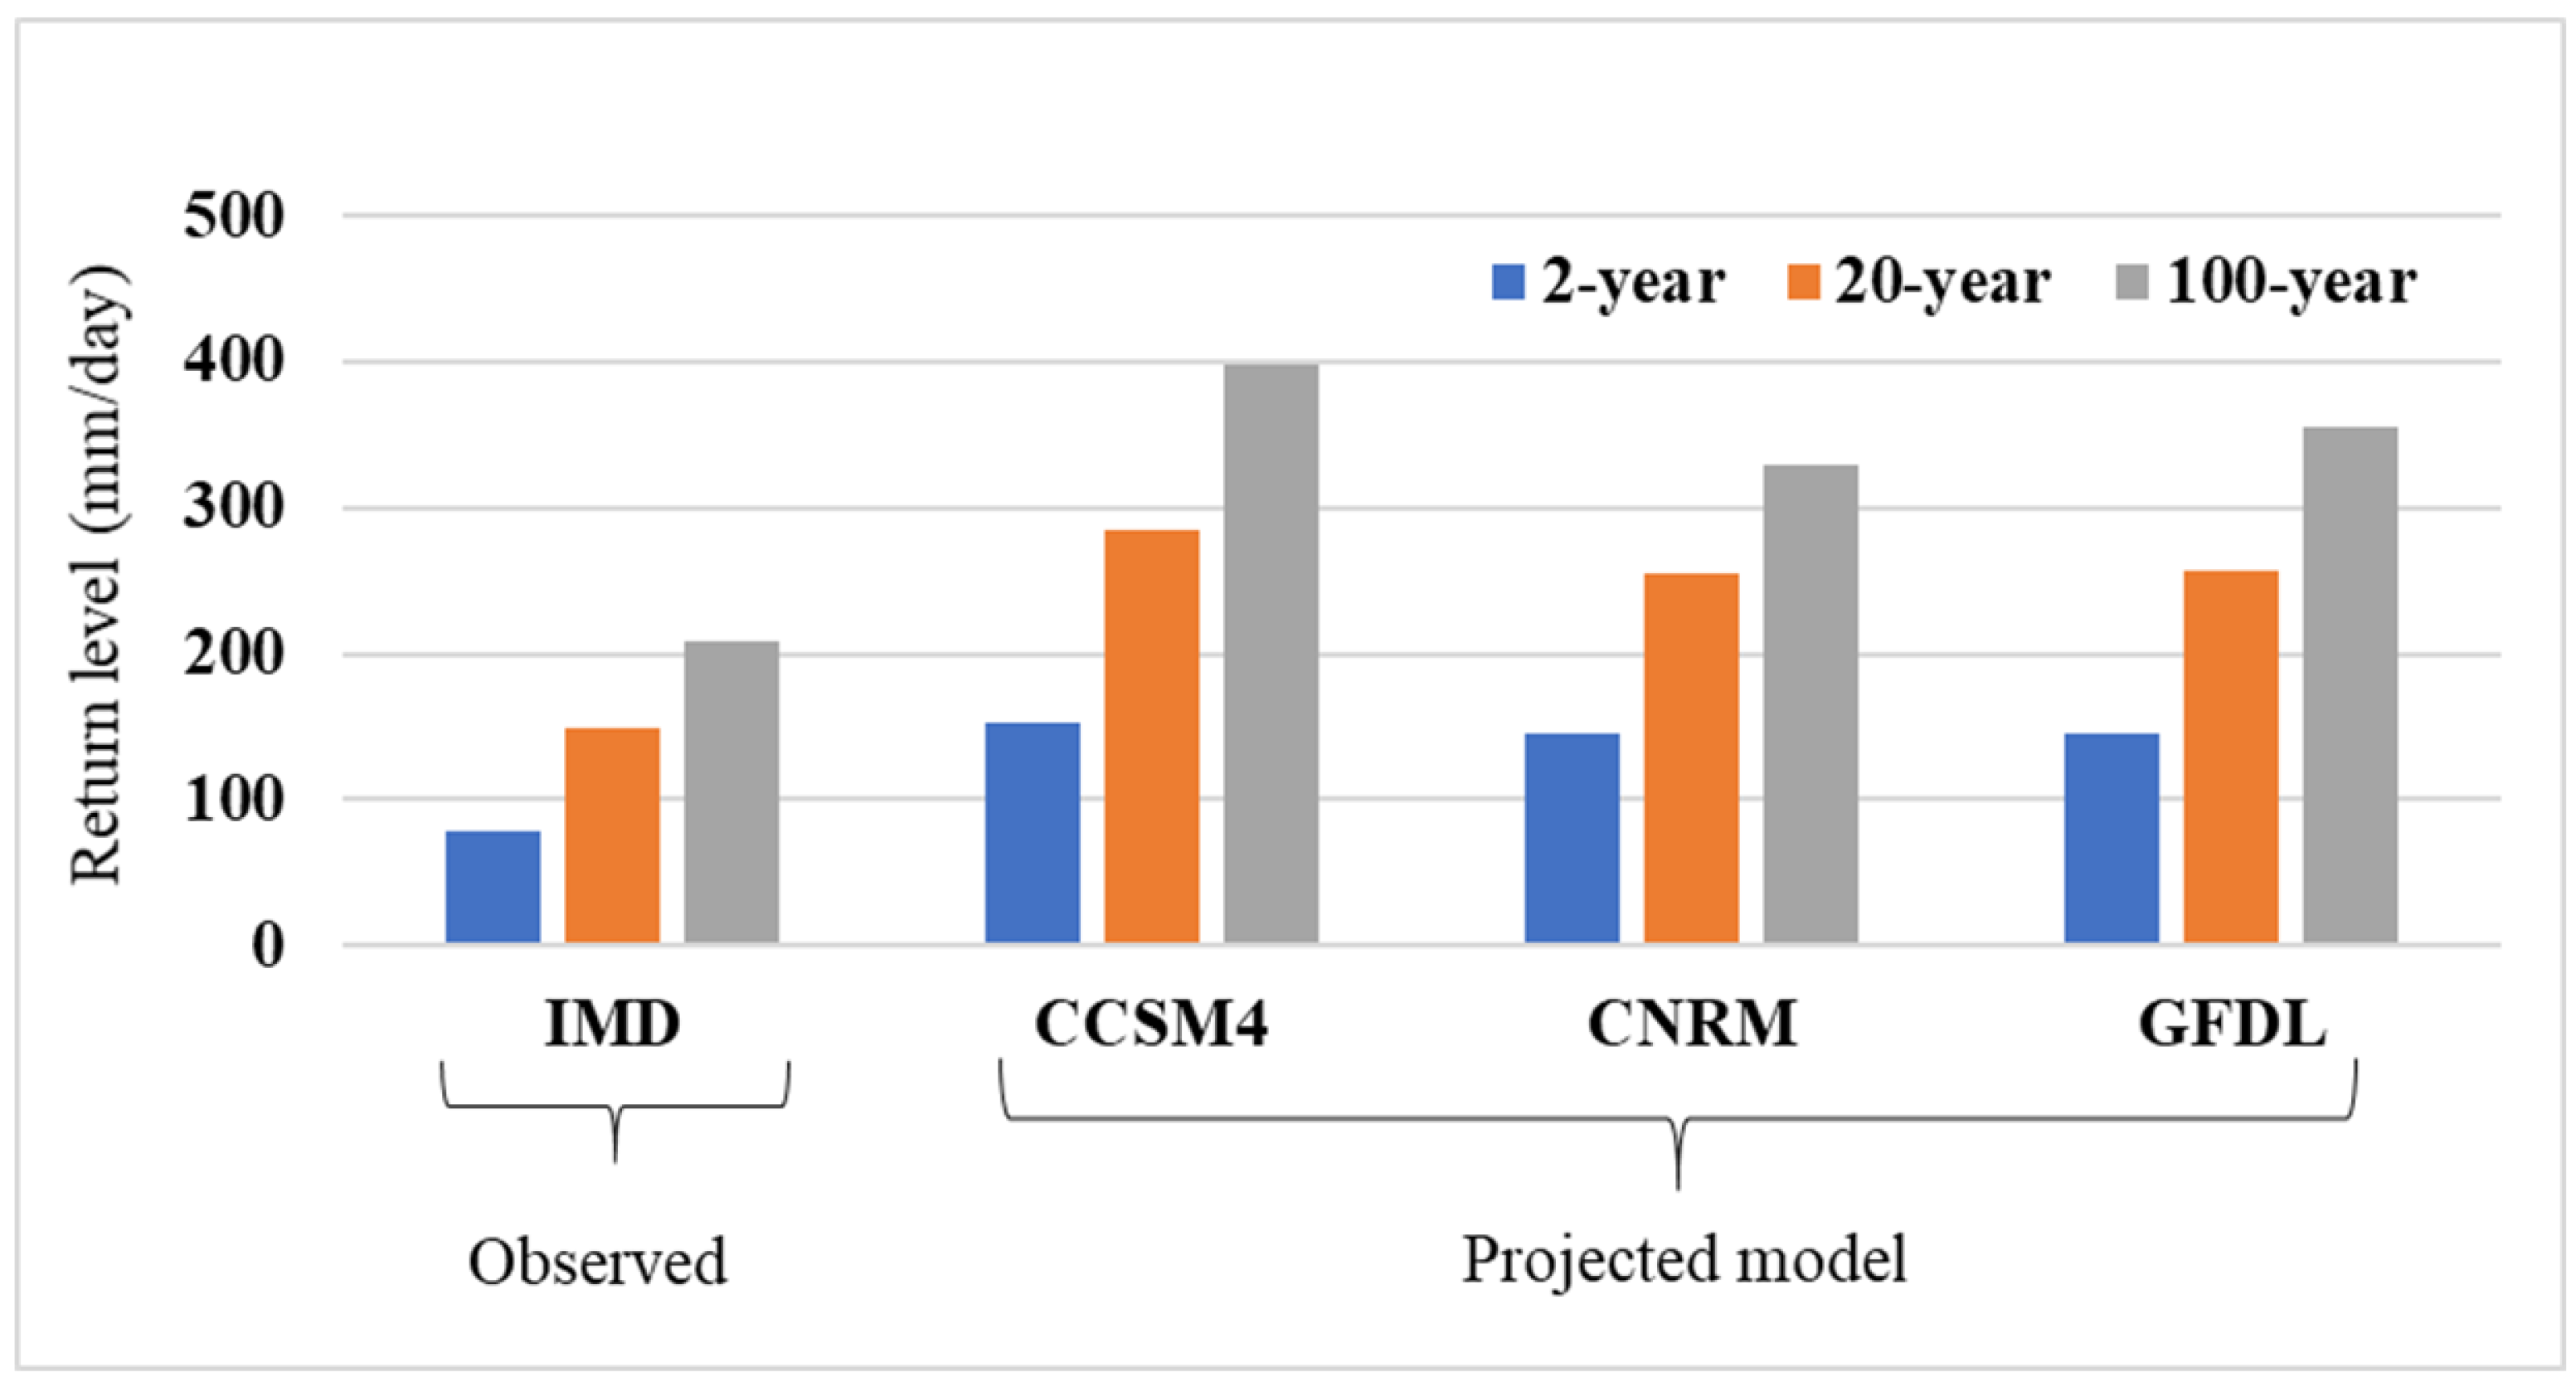
Figure 7 represents the return-level plots after fitted annual maxima rainfall at the 2-year, 20-year, and 100-year return periods.
The observed IMD rainfall was found to be 210 mm/day at a 100-year return period. Moreover, the CCSM4 model projected the highest probability occurrence of extreme rainfall greater than 300 mm/day for the 20-year return period and approximately 400 mm/day for the 100-year return period. However, the 2-year return period had the heaviest projected rainfall, at greater than 124.5 mm/day. The CNRM and GFDL models both projected nearly similar results for the 2-year and 20-year return periods, while for the 100-year return period GFDL showed an approximately 350 mm/day probability of extreme rainfall.

3.3. Temporal Distribution and Future Variation of EPI

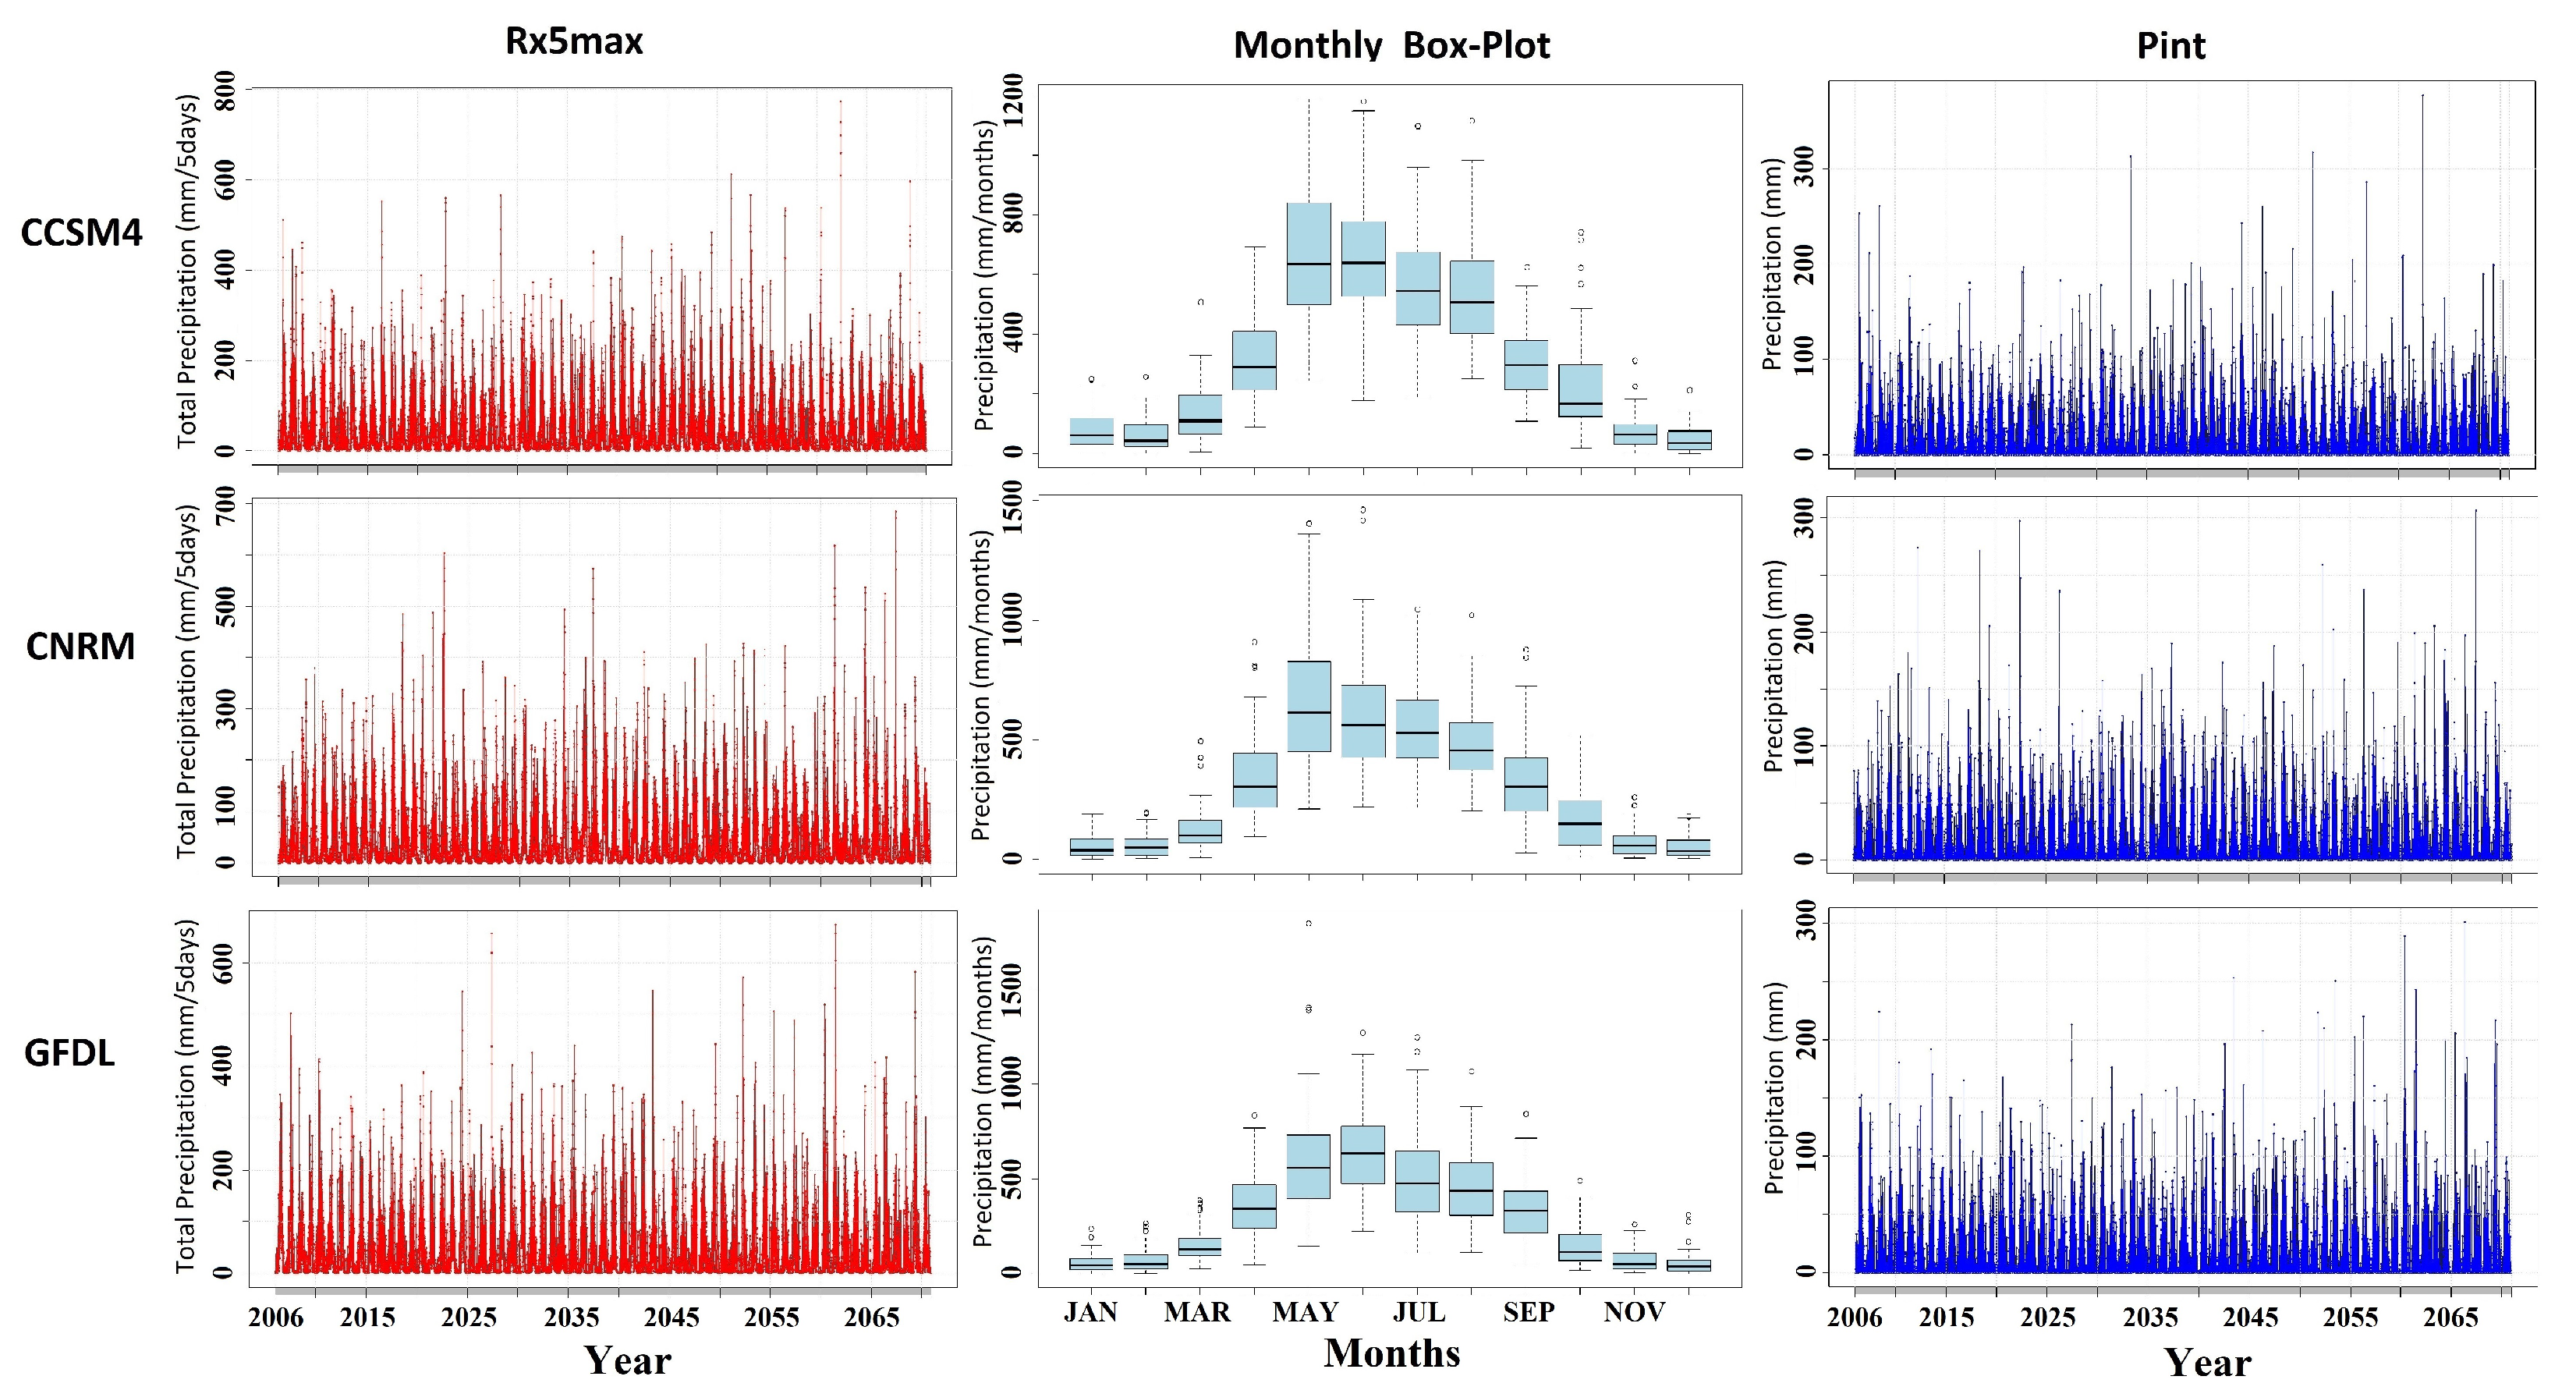
To understand extreme precipitation events in the study area, long-term EPI evaluation in present and future scenarios with specifically defined thresholds was described by CMIP5 model outputs. The projected linear trend analysis was performed on the three ensemble outputs of CMIP5 models (2006–2070) for different EPIs of magnitude, intensity, and persistence as Rx5max, Pint, and Pn10mm, respectively. Figure 8 shows the temporal variation of EPI for magnitude, intensity, and persistence of the rainfall over the TRB. Figure 8 shows the temporal changes in the magnitude of the precipitation indices and the computed values of PRwn90, PRwn95, PRwn99, Pnl90, and Pn10mm, as shown in Table 5.
For the estimated the precipitation magnitude at the 90th, 95th, and 99th percentile, we found that GFDL has the highest precipitation value at the 99th percentile; however, CCSM4 shows the highest precipitation intensity (i.e., the number of events > long-term 90th percentile). PRwn95 shows an 8% increase trend from historical to projected scenarios. Moreover, in terms of precipitation persistence (i.e., number of day’s precipitation ≥ 10 mm), we found the highest value in the CCSM4 climate model. In terms of uncertainties, none of the three climate models appear to be particularly relevant in this case.
Figure 8 shows the projected temporal changes in the TRB in terms of the five-day maximum rainfall (Rx5max), simple daily intensity (rain per rain day ≥1 mm), and monthly rainfall variation. Here, we found the maximum peaks of the five-day accumulated rainfall (0 to 800 mm/5 days) over the TRB in the CCSM4 model, while GFDL and CNRM showed less extreme peaks. The highest peaks (≥400 mm/5 days) for the five-day accumulated rainfall were found during the early 21st century from 2015 to 2025 and middle of the 21st century (from 2045 to 2065) in all three models. The boxplot shows that climate CCSM4 was estimated as the highest monthly rainfall (upper quantile cross 500 mm/month) in the future during monsoon months (June to August). Moreover, the highest projected rainfall intensity (≥300 mm/day) was estimated from 2015 to 2025 in CNRM and from 2055 to 2065 in the CCSM4 climate model.
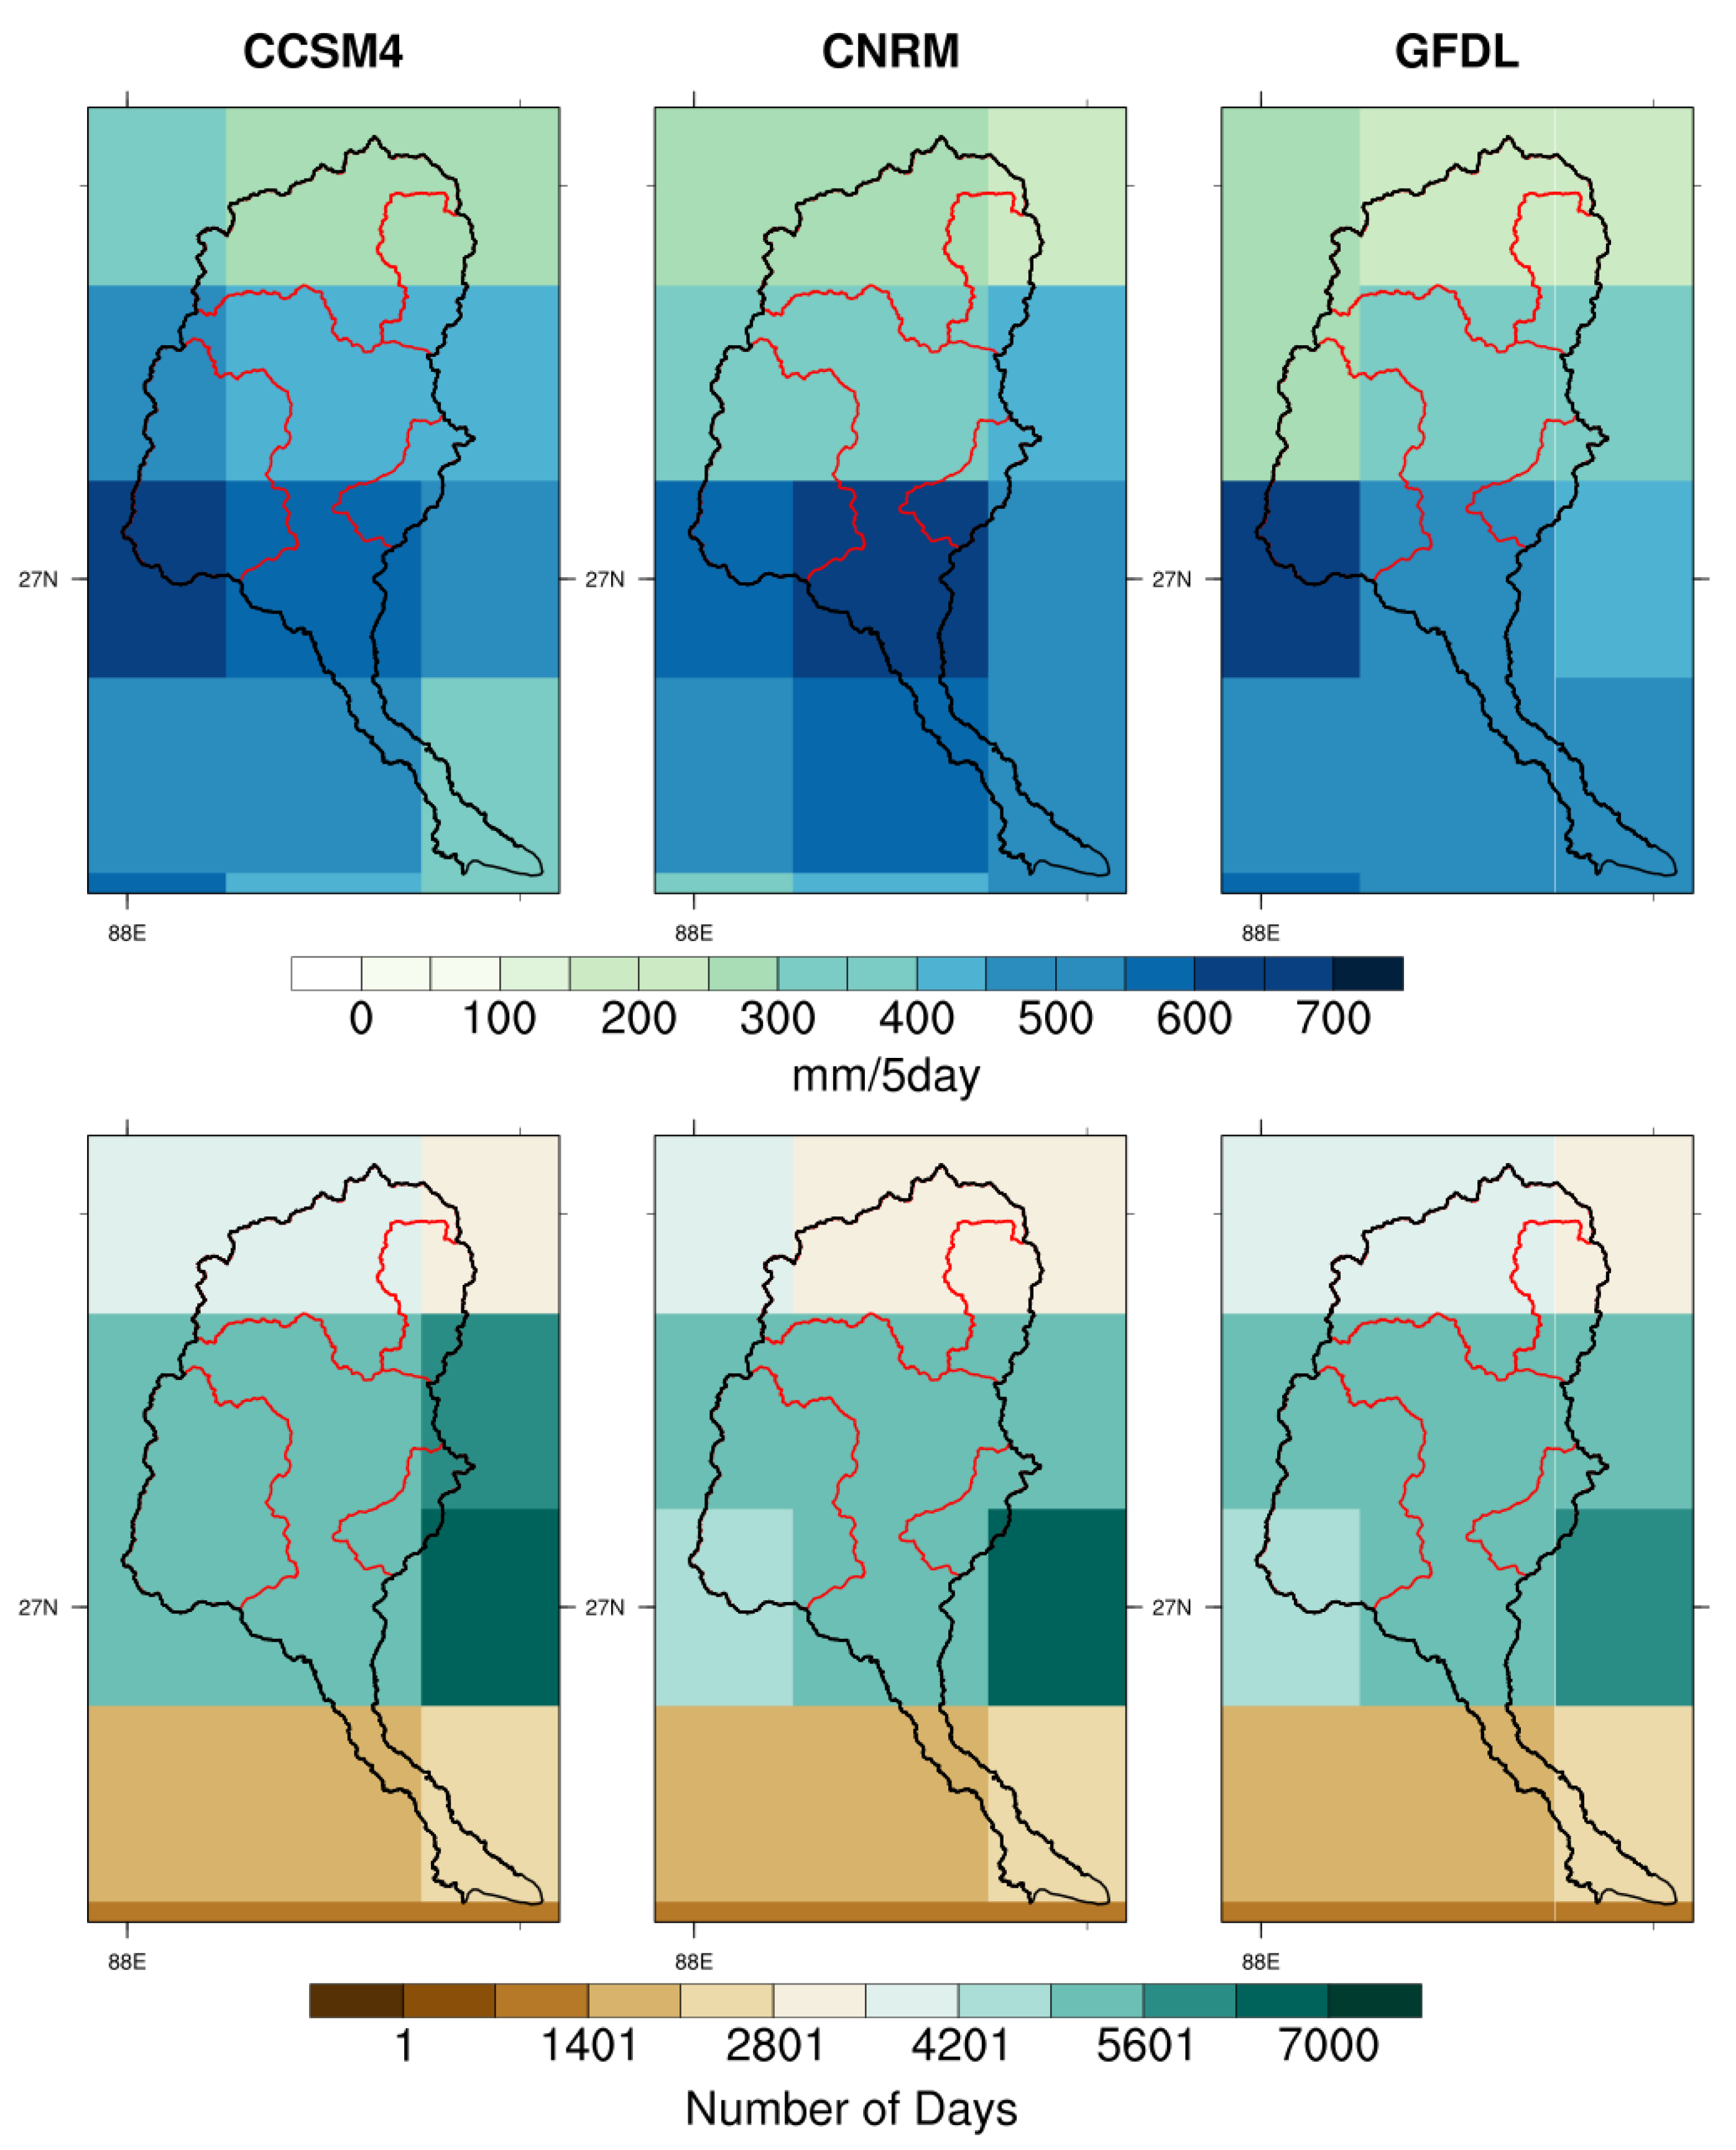
Figure 8 represents the intensity of precipitation (Pint) calculated according to EPI as daily rainfall intensity (rain per day ≥ 1 mm). Pint signifies the wet-day intensity over the study area. The CMIP5 model projected the increasing trend of Pint over the study area, except during the 2020s under the GFDL-CM3. As shown in Table 5, Pnl90 signifies the 759 number of events greater than the long-term 90th percentile over the TRB as IMD rainfall from 1970–2018, while the CCSM4 and CNRM-CM5 models projected 1243 and 1231 events, respectively, and GFDL-CM3 estimated 1222 events. This indicates that events will increase by approximately 23.37% in the future at 90th percentile. The projected evaluation of the EPI of persistence consists of the number of heavy rainy days (precipitation ≥ 10 mm) (Pn10mm) shown in Table 5. However, the climate model’s simulated output from 2006 to 2040 shows the variation in heavy rainy days, from 5513 to 5927. These changes in precipitation intensity (Pint) signify the higher projected frequency of flood events in the study area. CCSM4 projects a higher number of days with rainfall above 10 mm, and has a higher estimation of extreme rainfall versus the other two GCMs analyzed here. The spatial variation in projected EPI for the five-day total rainfall and precipitation intensity (Pint) at (rain per rain day ≥ 10 mm) over the TRB is shown in Figure 9. The spatial changes in the projected number of precipitation days (rain per rain day ≥ 10 mm) (Pint) over the TRB varies from 1401 to 7000 days. The Rangpo and Rangeet sub-watersheds were found to experience the highest amount of precipitation in the future. Moreover, the Lachen sub-watershed was found to have a lower number of precipitation days (2801 to 3501) in the CNRM climate model compared to the other two models, CCSM4 and GFDL, which show approximately 3501 to 4201.

3.4. Evaluation of SPI and RAI

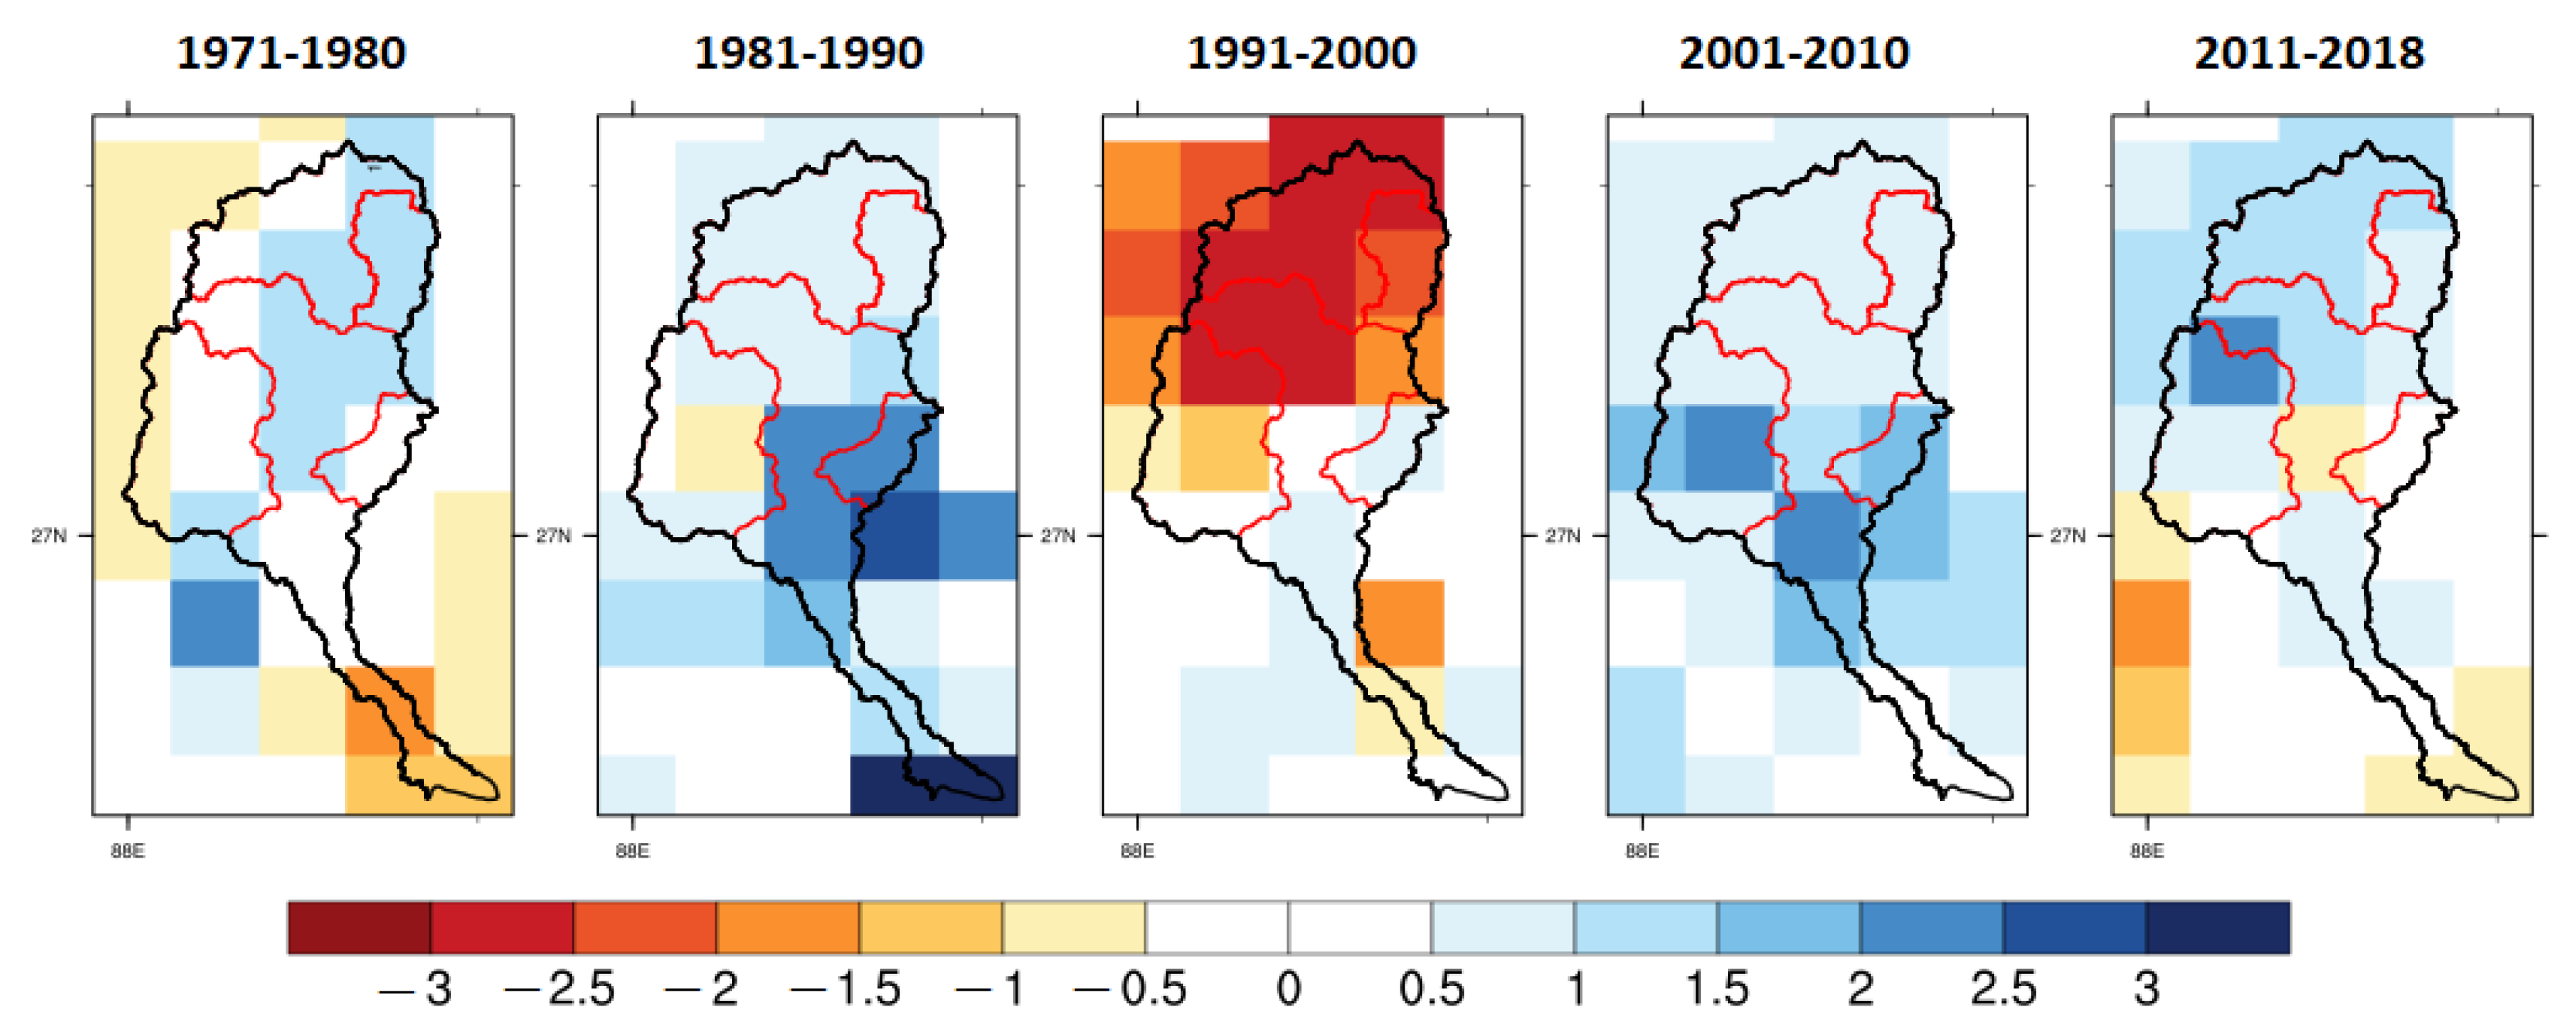
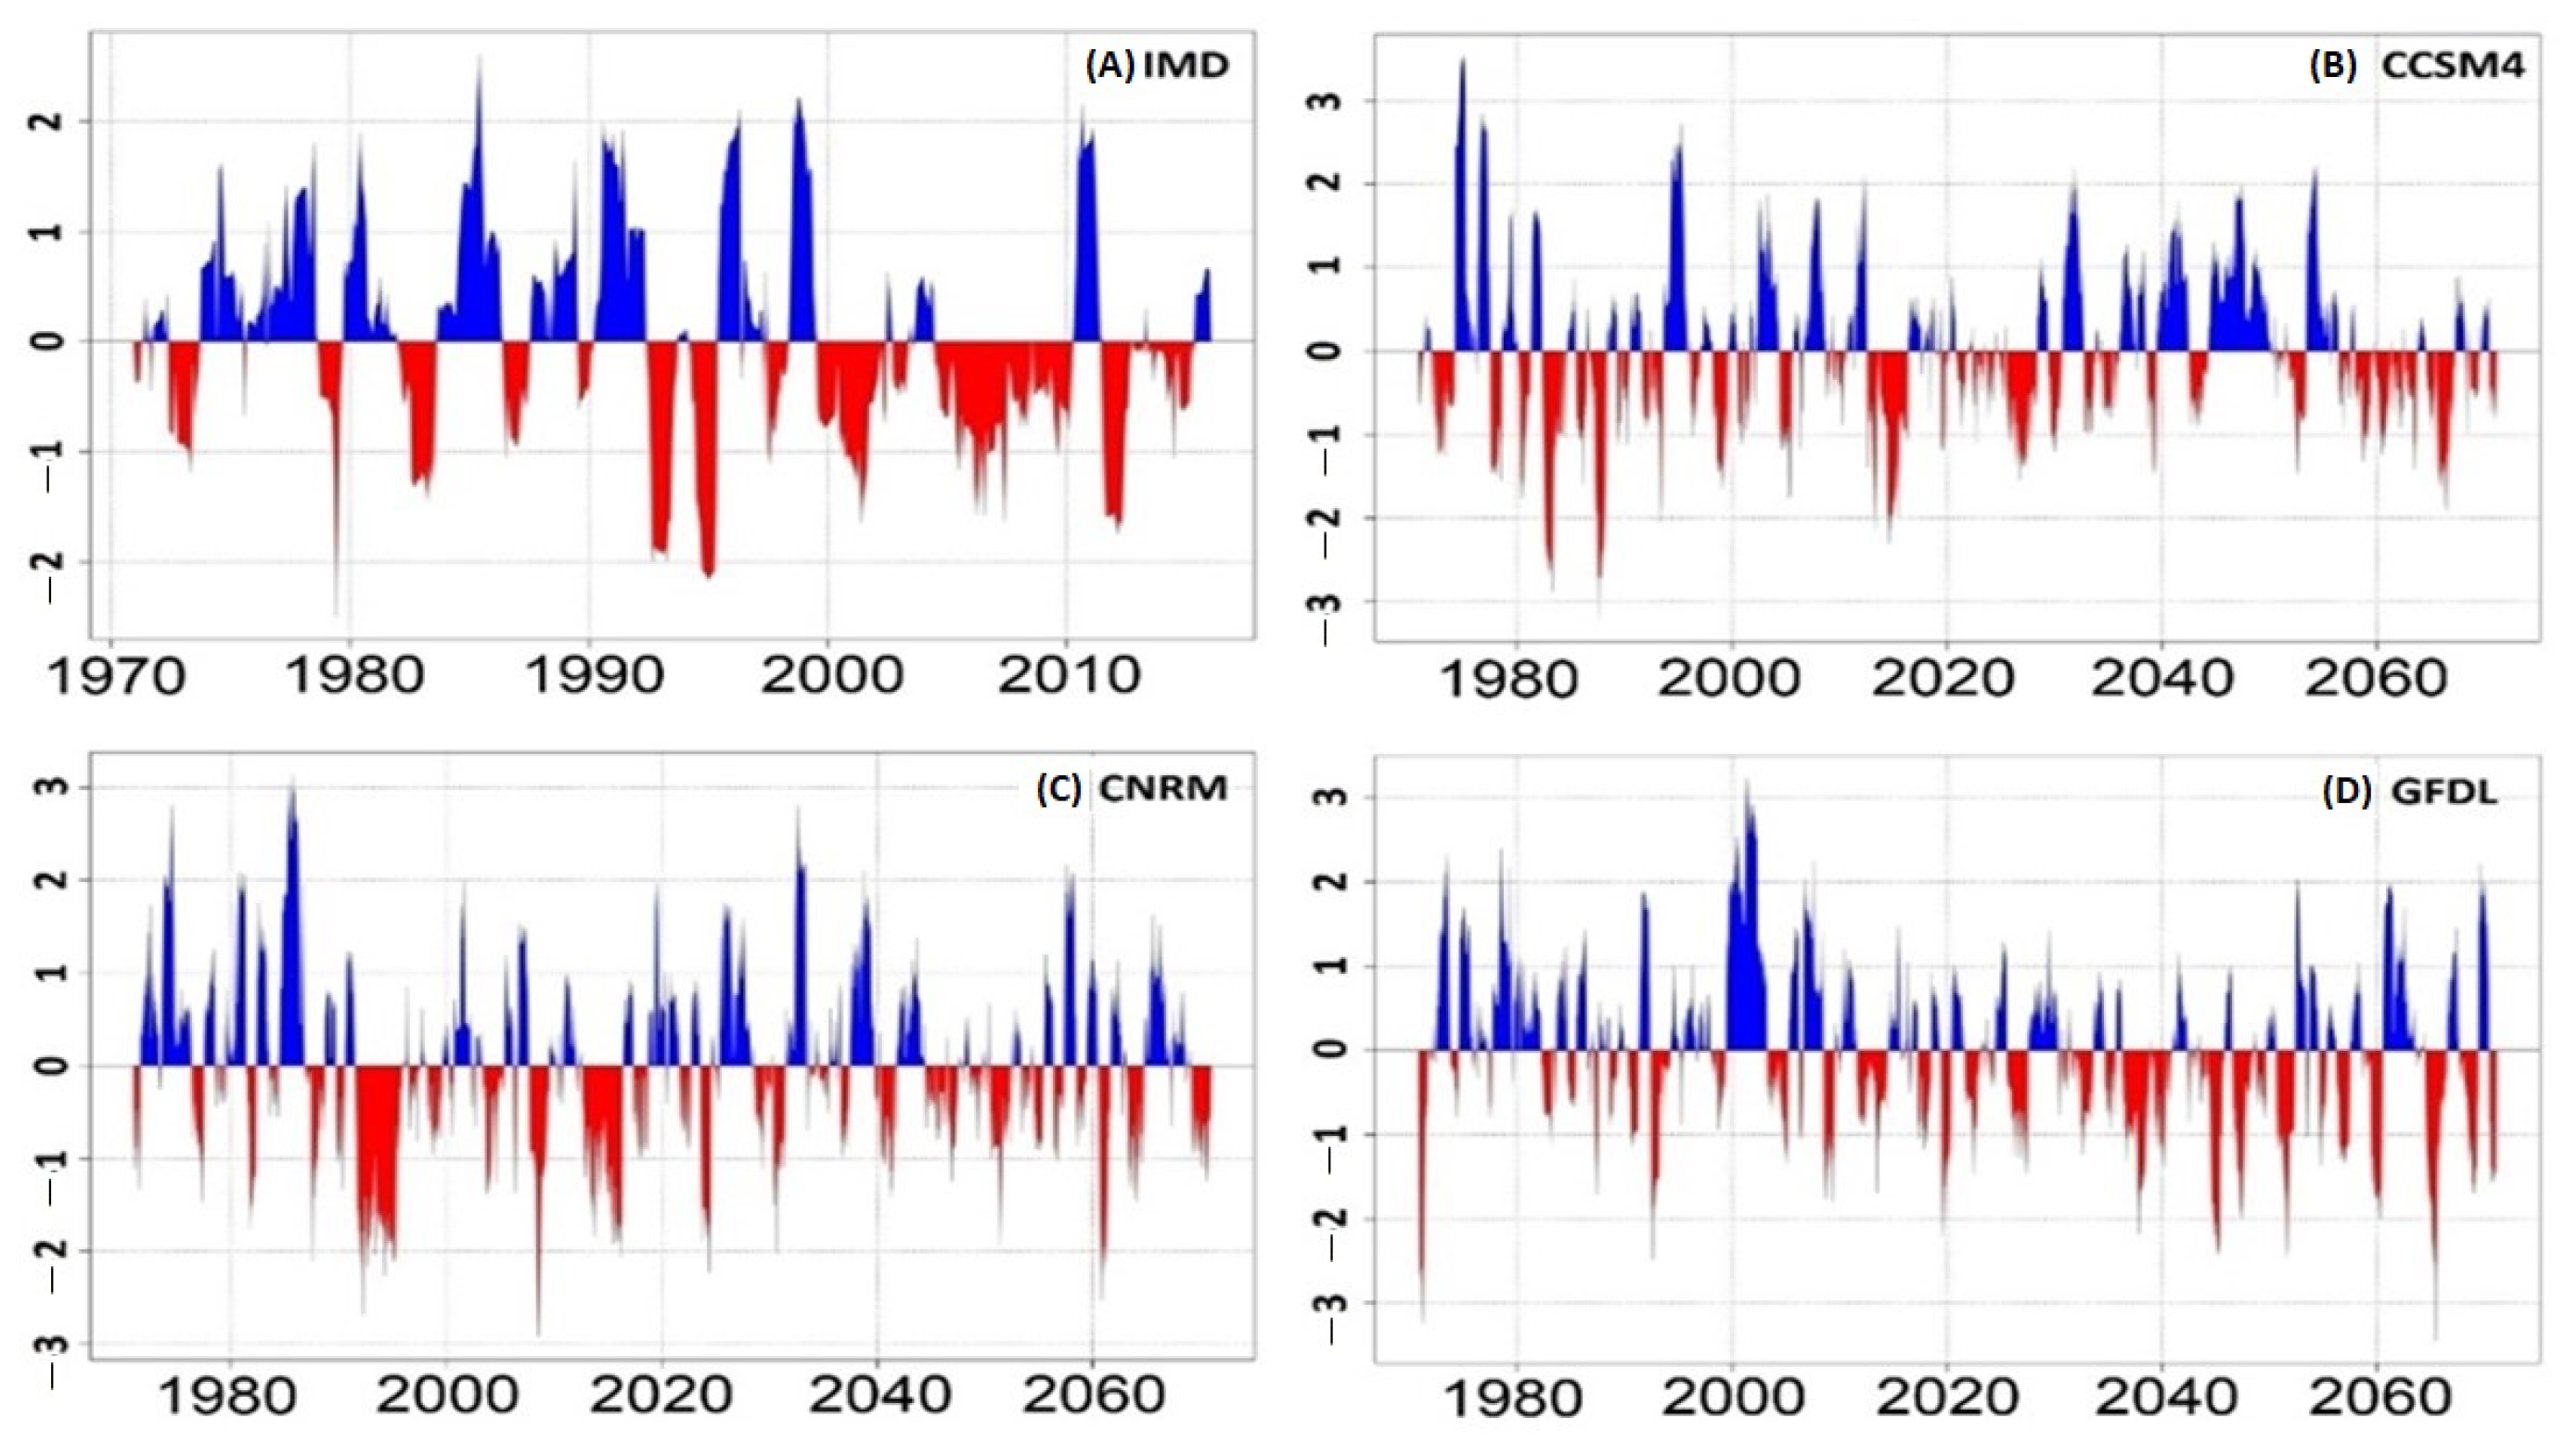
According to the classification of Van Rooy [54] and McKee et al. [42], the dimensionless SPI and RAI values were calculated and assigned in nine classes from extremely wet to dry (Table 3). The SPI was computed over the study area for a twelve-month time scale (Figure 10). Future estimated extreme events from CCSM4 show very wet to extremely wet events (1.5 ≤ SPI ≥ 3.0) from 2040 to 2055, whereas CNRM-CM5 and GFDL-CM3 show no significant pattern in the SPI (Figure 10).
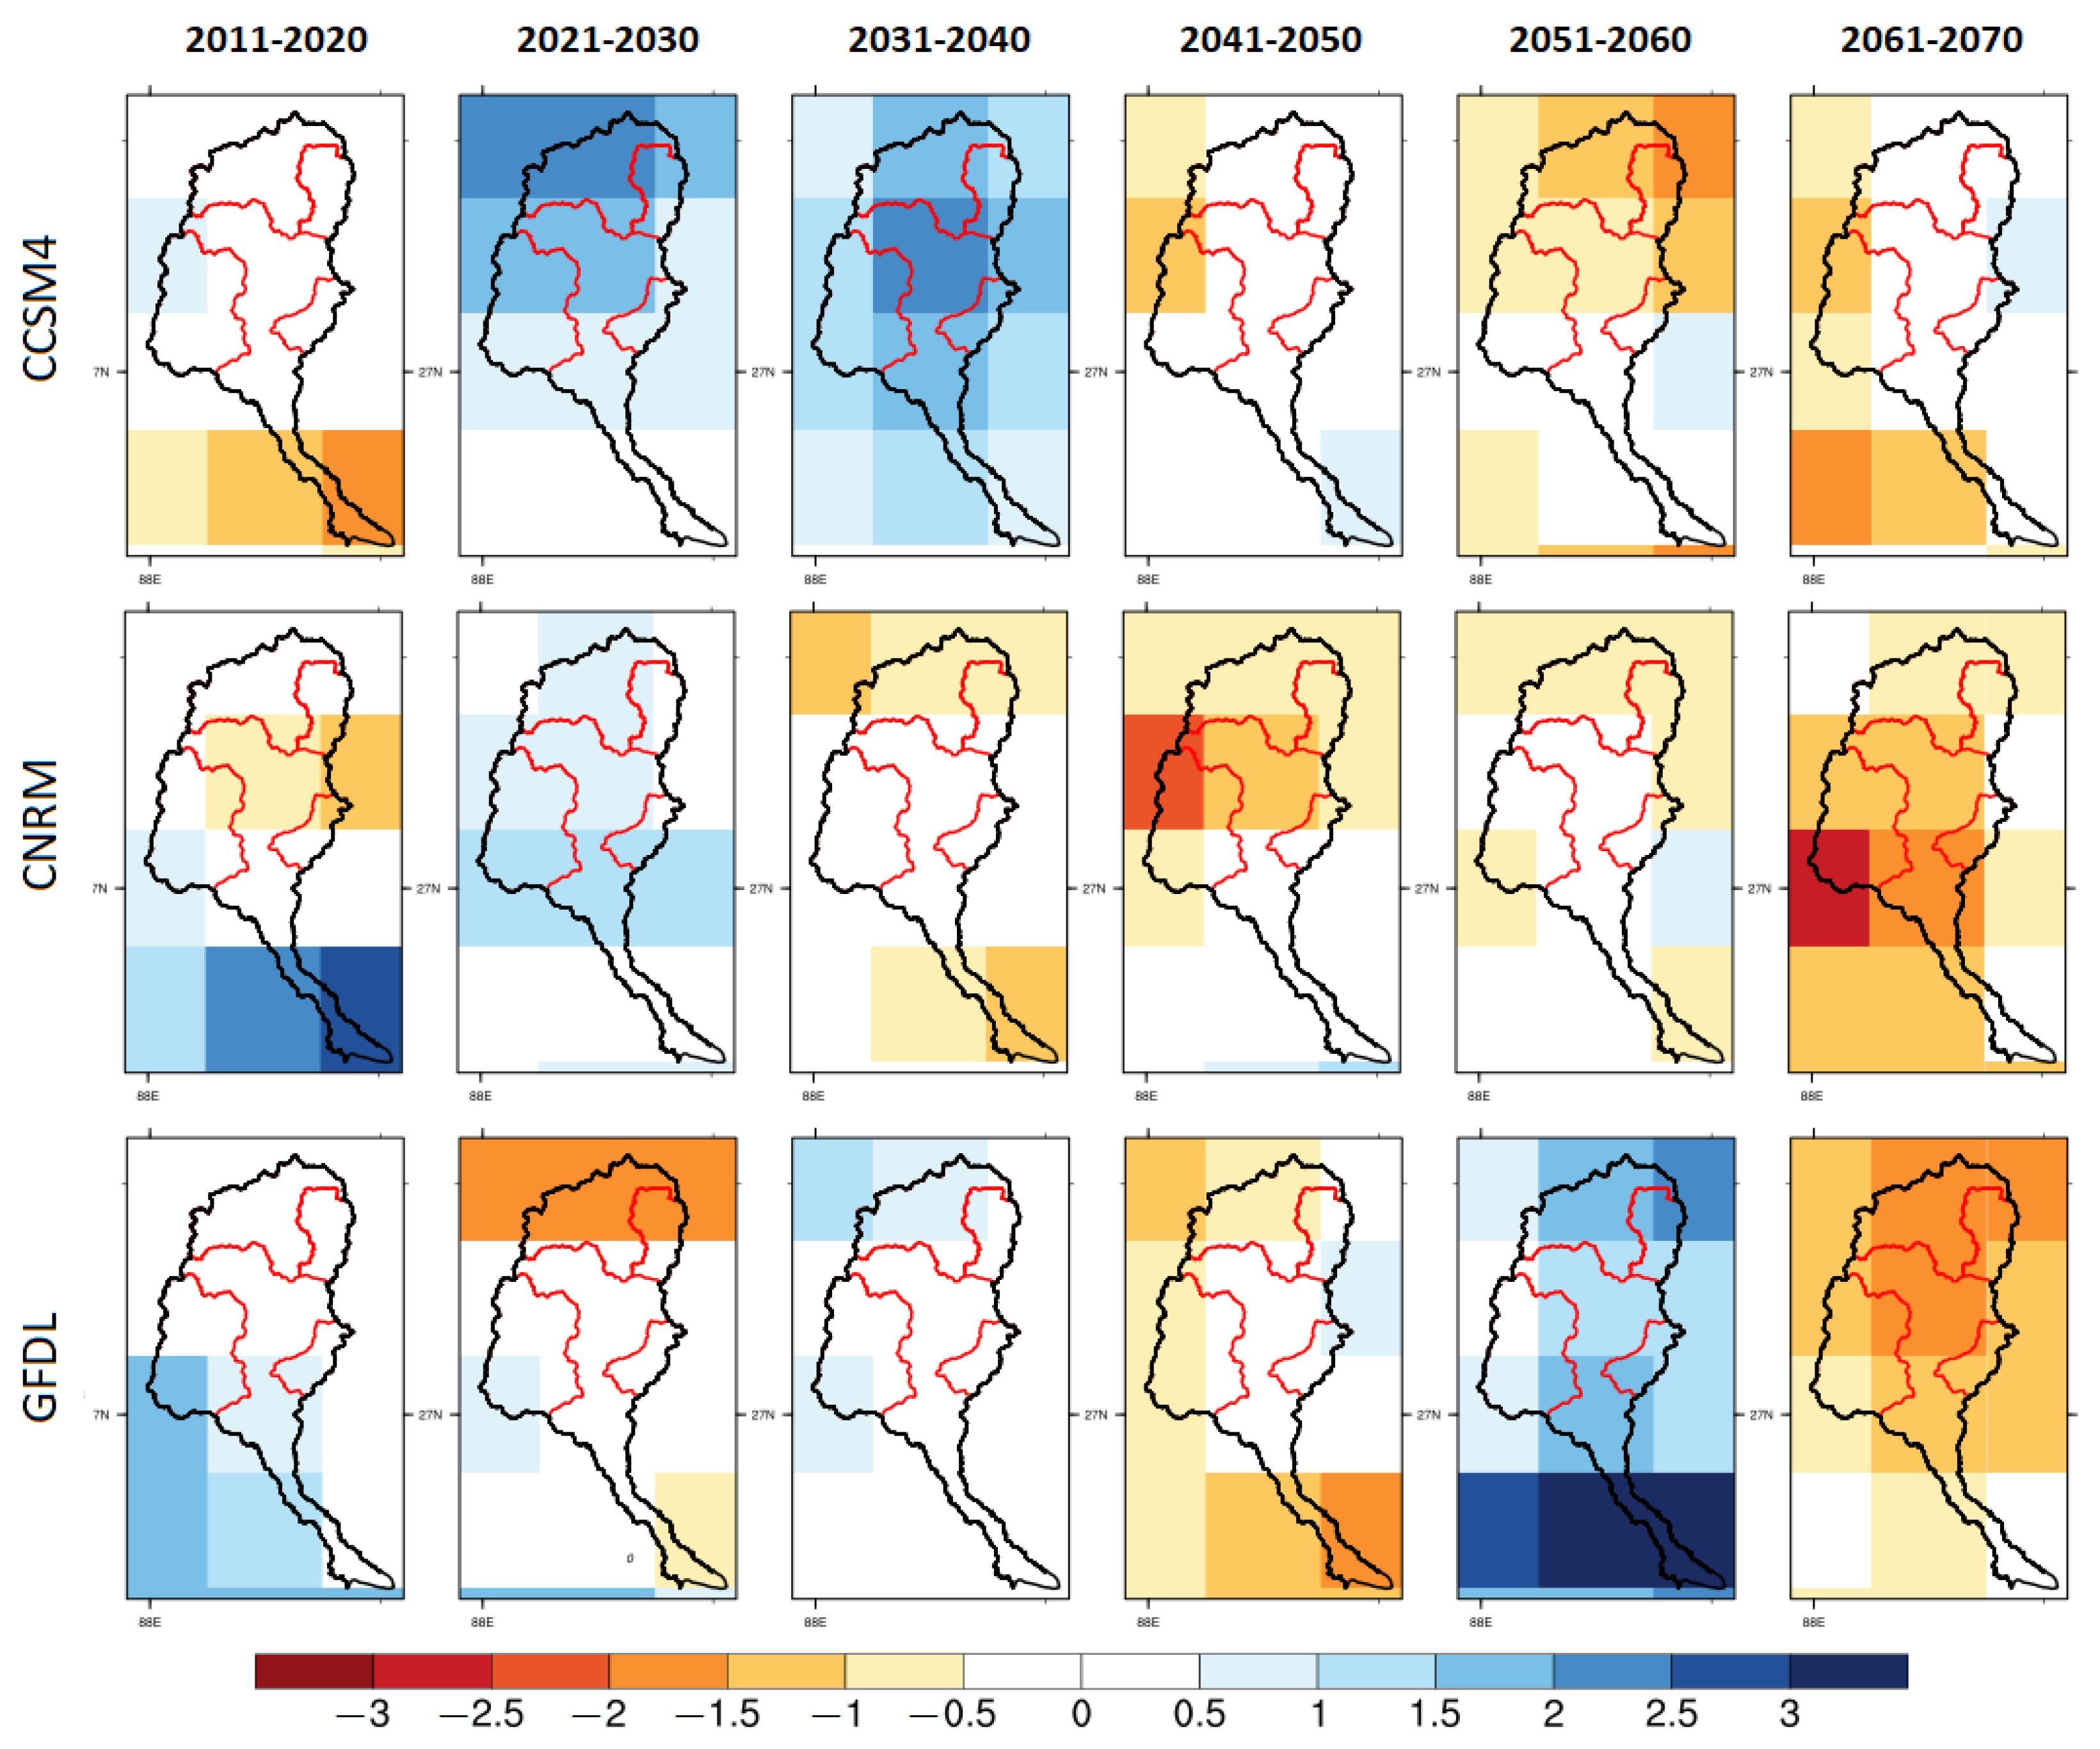
IMD observed rainfall (1970–2018) was used to evaluate the 12-month SPI over the TRB, which shows very wet (SPI ≥ 1.5) to extremely wet (SPI ≥ 2.0) conditions during the observed periods (1970 to 1991) for very wet. However, for extremely wet events from 1996 to 2000 and 2010–11 (Figure 10), Figure A2 shows the observed decadal changes in SPI, which was assessed to estimate the consecutive months compared to the previous years. Projected extreme precipitation events over the study area have been evaluated from SPI on a 12-month timescale with the 100-year CMIP5 model ensemble with CCSM4, CNRM-CM5, and GFDL-CM3 from 1970 to 2070. Annual SPI shows similar variation in extreme precipitation events between the period of observed IMD and historical (1970–2005) CMIP5 model datasets. The twelve-month running SPI for the projected period of CNRM-CM5 represents the very wet conditions (SPI ≥ 1.5) in 2020. Moreover, the projected SPIs (1.0 ≤ SPI ≥ 2.0) of CCSM4 and CNRM-CM5 show moderate to extremely wet conditions between 2025 to 2045. In comparison, GFDL-CM3 shows a flood situation from 2060 to 2064, with SPI ≥ 1.5. Figure 11 shows the projected decadal changes in wet and dry condition over the TRB. None of the three climate models show any significant results. The three decades of the earlier 21st century, that is, the 2010s, 2020s, and 2030s, are indicated as wet in the TRB. However, after the 2040s all the three models project dryness in the TRB.
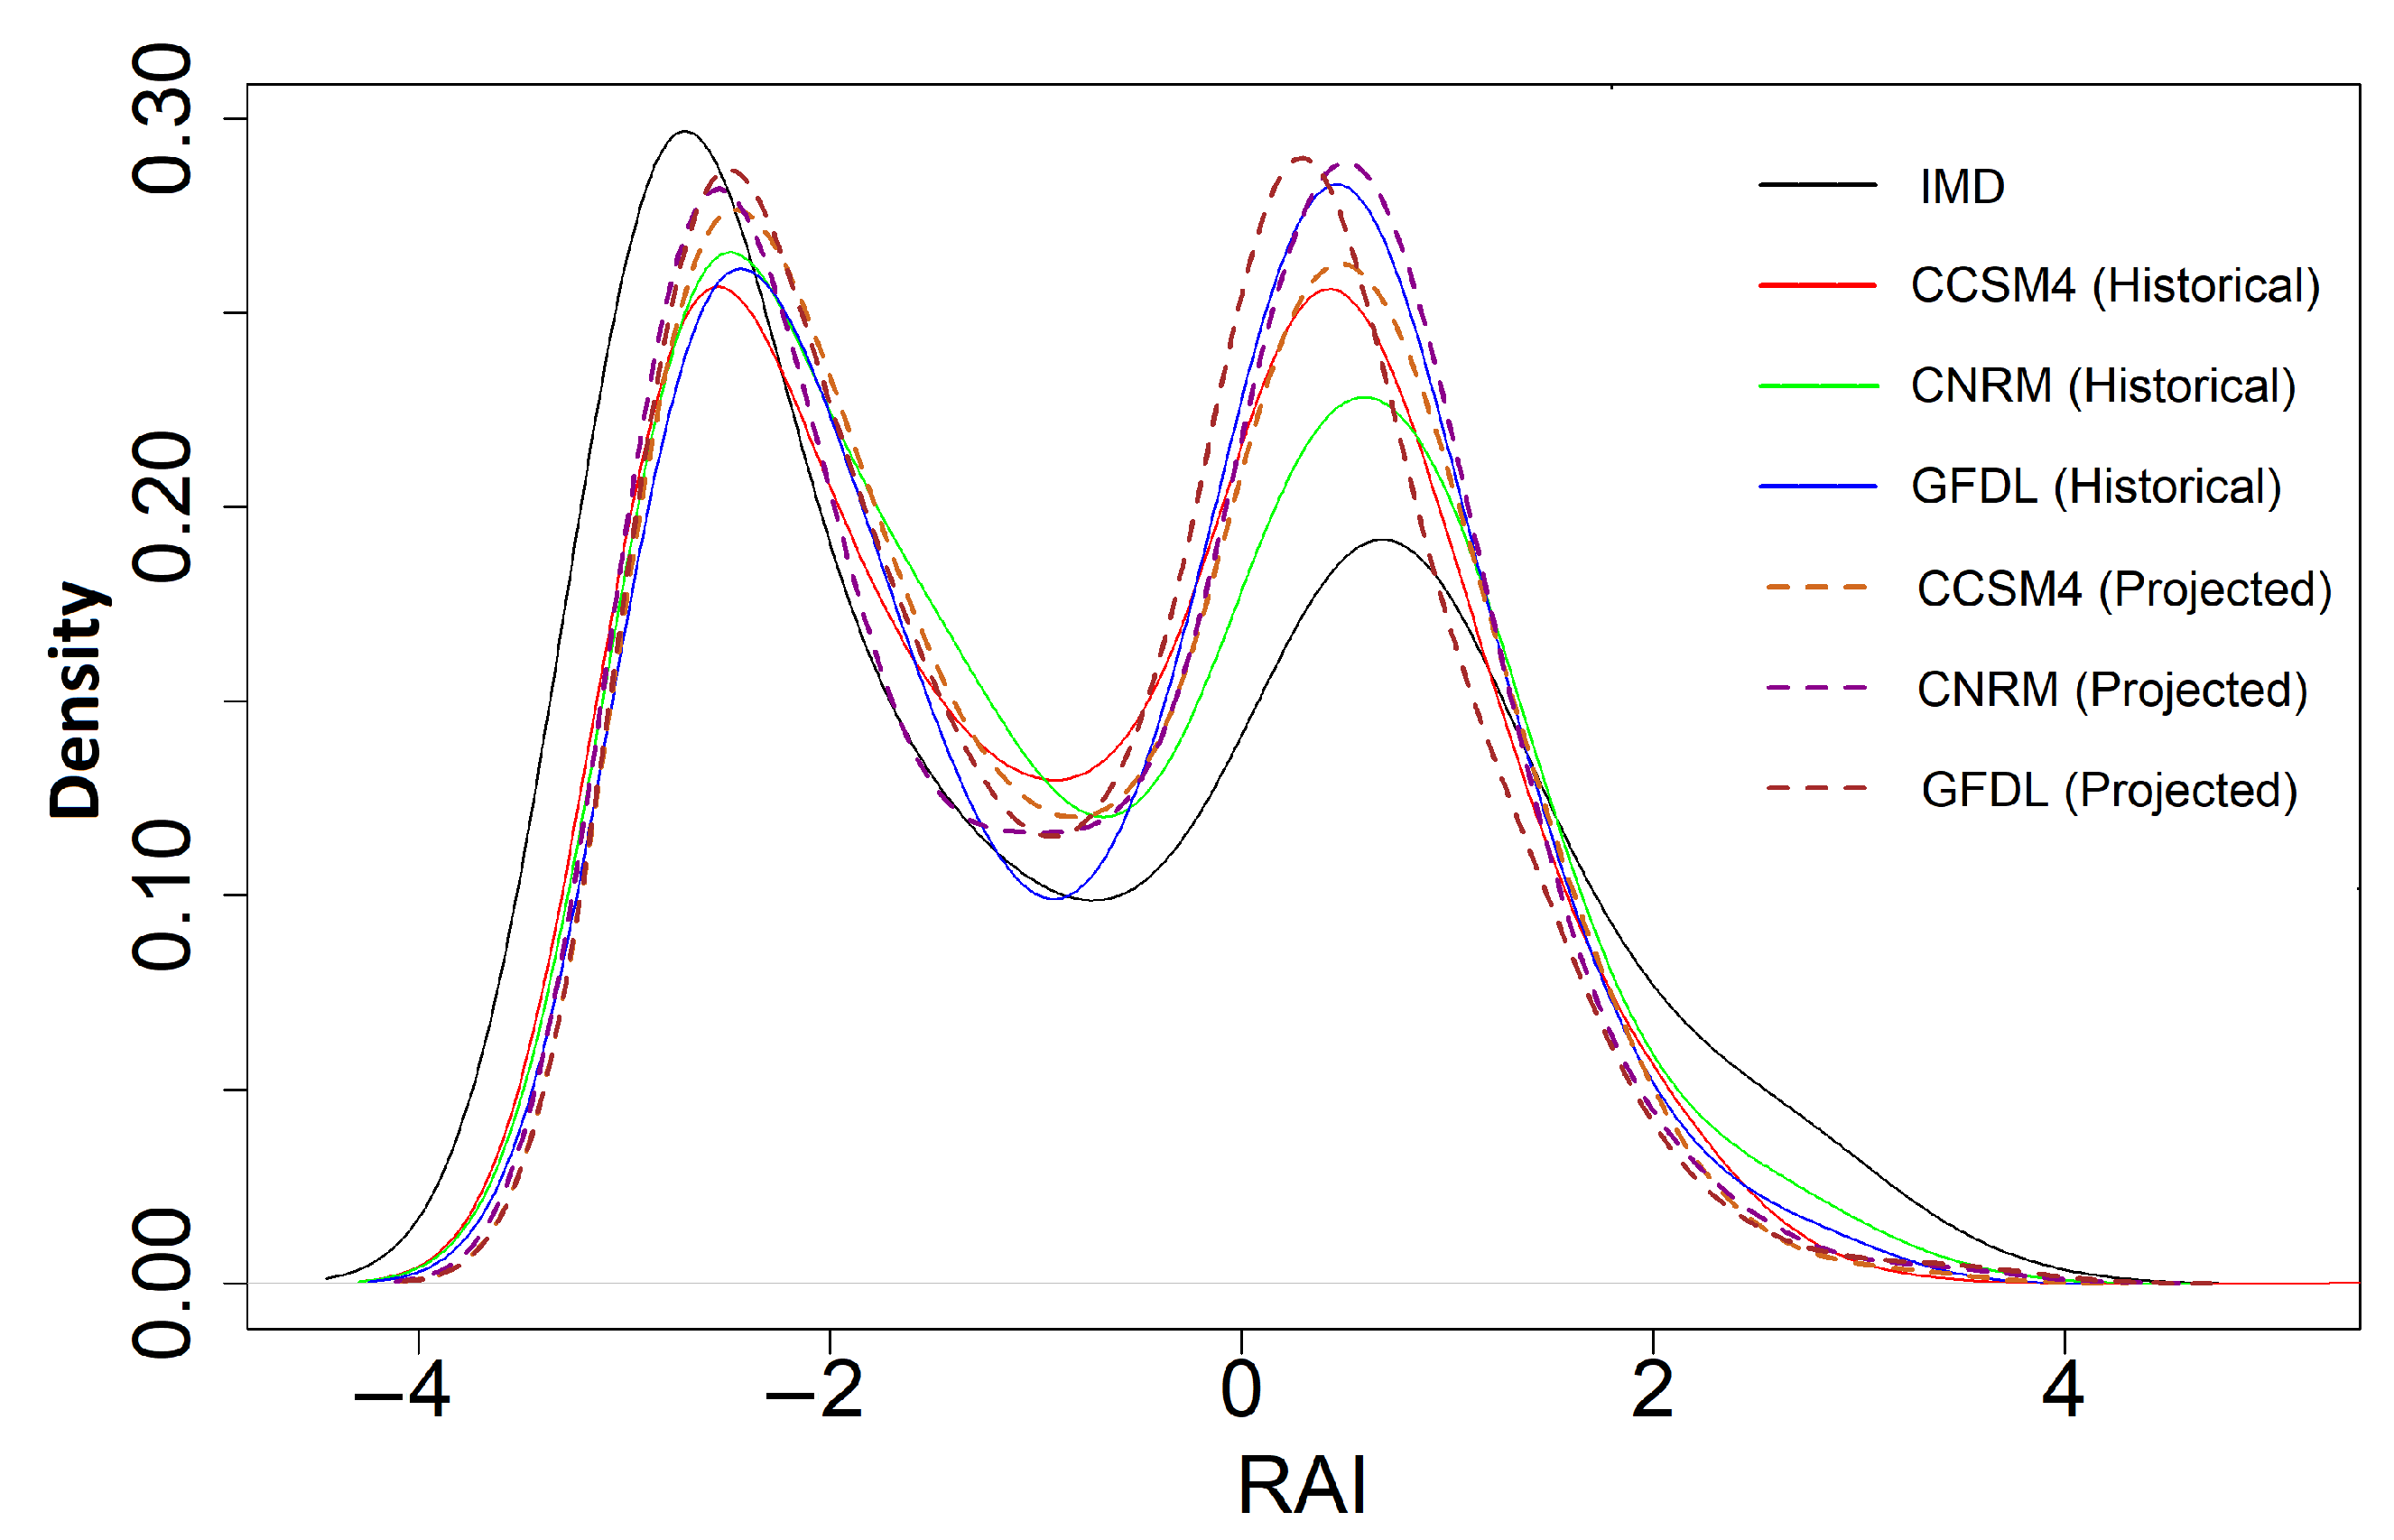
The historical and projected probability of the RAI is shown in Figure A3. The CNRM and GFDL climate show the highest projected probability of rainfall anomalies.

4. Discussion

Geomorphological characteristics play a significant role in elucidating the flood impetuosity of a river basin. This research used an elevation model derived from SRTM-DEM with a 30-m spatial resolution to extract the morphometric characteristics over the TRB and its four major sub-watersheds. The SRTM reflects radar observations and provides the perfect topographic features [20]. The morphometric characteristics computed by the elevation model, such as drainage density, stream magnitude, and relief ratio, show the essential importance of potential flood measurement [48]. In this study, we found the high relief ratio, which indicates a steep structural ridge over the sub-watersheds of the TRB; it reveals an intense discharge in the basin, leading to flooding downstream. Previous research by Starkel et al. [22] has highlighted the changes in basin tributaries due to extreme rainfall events in the frontal zone of high mountains over the TRB.
Another previous study by Merz and Blöschl [56] investigated the high drainage density values that a river basin exerts on flood peaks. The Rangeet watersheds of the TRB have been calculated as having the highest form factor (Rf) (0.58) value, indicating that the Rangeet watersheds is characterized by high peak flows and experiences flash flooding situations. Moreover, a similar finding was confirmed by [31] in his research on a different river basin with similar topography to that found in the TRB. We found the highest drainage density for the Ranpo, Lachung, and Lachen tributaries, indicating that the TRB is vulnerable to flash flooding. Another study by [21] has confirmed that the Rangpo sub-watersheds, located at a lower elevation on the lower part of the basin, are prone to flash flooding as well.
In the current study, we have examined the changes in rainfall extremes in the TRB from the late 20th to the mid-21st century. Our findings show that the highest frequency and intensity of heavy rainfall events over the TRB have been recorded during the past two decades. These finding are confirmed by the study conducted by [9], which showed that cloudbursts in the Himalayan region river basins lead to more flooding due to extreme rainfall events, including in the TRB. The projected changes in rainfall extremes were computed by simulating the outputs of the three best climate models based on RCP 8.5 [6]. We found that the GFDL-CM3 has the best fit to the observed rainfall in the TRB as shown by the density and Taylor plots (Figure 4a,b). The frequency of projected increase in precipitation extremes in the late 21st century was estimated by the rainfall maxima based on GEV for the different return periods, consistent with [11,57]. In this study, we applied seven extreme precipitation indices (magnitude, intensity, and persistence) to evaluate the changes in precipitation extremes in the TRB. The projected changes in precipitation extremes in the simulated outputs were carried out using seven EPIs, showing significant increasing patterns of precipitation over the TRB. A similar study was reported by [34], where different river basins with the same climatic condition were studied. The SPI method at a 12-month time scale can be used to evaluate significant changes in extremely dry and wet events, helping to evaluate extreme hydroclimatic events [42,43,44,45]. The spatial distribution of SPI represents a slightly to extremely wet situation in the near future decades (2011–2040), however, the mod-future shows nearly normal to moderately dry condition over the TRB. Of the projected yearly deviations of precipitation for the three simulated models, CCSM4 showed significant changes in extremely wet events during the middle of the 21st century. Along with SPI, RAI was used for both the simulated and observed datasets, providing significant outcomes that indicate a positive trend in terms of extreme rainfall.

5. Conclusions

In this study, we attempted to understand the extreme events in the TRB through morphometric analysis, indices derived from rainfall obtained through observed datasets, and a regional circulation model. The study demonstrated significant changes in the increasing number of observed rainfall extremes.
This study presents the results of projected future changes in extreme rainfall events over the TRB using three different climate models under the high-emission 8.5 RCP scenario.
Among the three models, GFDL showed a best fit with observed rainfall over the study area. About 23.37% of events at the 90th percentile were found to increase during the middle of the 21st century over the TRB. In another analysis, the five-day projected maximum precipitation led to flooding events during the mid-21st century. The simulated outputs of the CCSM4 climate model demonstrated a high probability of exceedingly extreme rainfall events in the 20-year and 100-year return periods. In the historical analysis, SPI showed heavy rainfalls over the TRB in the most recent two decades. SPI projected an extreme wet situation in terms of monsoonal rainfall during the mid-21st century. Our study results obtained using climate models in respect of the observed situation highlight projected extreme rainfall events under the future climate scenarios over the TRB, and indicate that the frequency of extreme rainfall events in the TRB should be expected to increase.
Thus, outcomes of this study provide solid support for policy-makers in devising proper plans to safeguard against future risks due to extreme rainfall events in the TRB.

Author Contributions

Conceptualization, R.K.M.; methodology, R.K.M.; software, P.K.C.; validation, R.K.M., P.K.S. and P.K.C.; formal analysis, P.K.C.; investigation, P.K.C.; resources, R.K.M.; data curation, P.K.C.; writing—original draft preparation, P.K.C.; writing—review and editing, R.K.M. and P.K.S.; visualization, P.K.C.; supervision, R.K.M.; project administration, R.K.M.; funding acquisition, R.K.M. All authors have read and agreed to the published version of the manuscript.

Funding

The authors would like to thank the Climate Change Programme, Department of Science and Technology, New Delhi for financial support (DST/CCP/CoE/80/2017(G)).

Institutional Review Board Statement

Not applicable.

Informed Consent Statement

Not applicable.

Data Availability Statement

Rainfall data are available online from the IMD website (https://imdpune.gov.in/cmpg/Griddata/Rainfall_25_Bin.html accessed on 20 October 2022). The SRTM datasets used in this study are available online from (https://earthexplorer.usgs.gov/ accessed on 20 October 2022). The climate model datasets for the South Asia region are available from the Climate Data Portal (http://cccr.tropmet.res.in/home/cordexsa_datasets.jsp accessed on 10 January 2023) of the Centre for Climate Change Research—Indian Institute of Tropical Meteorology (CCCR-IITM).

Acknowledgments

We acknowledge the Indian Meteorological Department (IMD) for providing high-resolution gridded daily rainfall datasets. The authors are grateful to the DST-Mahamana Centre for Excellence in Climate Change Research, funded by the Department of Science and Technology, New Delhi, Climate Change Programme for providing financial support.

Conflicts of Interest

The authors declare no conflict of interest.

Abbreviations

The following abbreviations are used in this manuscript:
TRBTeesta River Basin
EPIExtreme Precipitation Index
SPIStandardized Precipitation Index
GEVGeneralized Extreme Value Distribution
CCCRCentre for Climate Change Research
IITMIndian Institute of Tropical Metrology
IMDIndia Meteorological Department
SRTMShuttle Radar Topography Mission

Appendix A

This supporting information provides Figure A1Figure A3, which are discussed in the main article.
Figure A1. Extraction of drainage networks from SRTM DEM.
Sustainability 15 04668 g0a1
Figure A2. Observed decadal changes in wet to dry conditions over the TRB using observed IMD rainfall data at 0.25 × 0.25 spatial resolution.
Sustainability 15 04668 g0a2
Figure A3. Probability distribution of RAI for the historical and projected time periods.
Sustainability 15 04668 g0a3

References

  1. Pratap, S.; Srivastava, P.K.; Routray, A.; Islam, T.; Mall, R.K. Appraisal of hydro-meteorological factors during extreme precipitation event: Case study of Kedarnath cloudburst, Uttarakhand, India. Nat. Hazards 2020, 100, 635–654. [Google Scholar] [CrossRef]
  2. Singh, R.; Mal, S. Trends and variability of monsoon and other rainfall seasons in Western Himalaya, India. Atmos. Sci. Lett. 2014, 15, 218–226. [Google Scholar] [CrossRef]
  3. Xu, J.; Badola, R.; Chettri, N.; Chaudhary, R.P.; Zomer, R.; Pokhrel, B.; Hussain, S.A.; Pradhan, S.; Pradhan, R. Sustaining biodiversity and ecosystem services in the Hindu Kush Himalaya. In The Hindu Kush Himalaya Assessment; Springer: Berlin/Heidelberg, Germany, 2019; pp. 127–165. [Google Scholar]
  4. Hengade, N.; Eldho, T.; Ghosh, S. Climate change impact assessment of a river basin using CMIP5 climate models and the VIC hydrological model. Hydrol. Sci. J. 2018, 63, 596–614. [Google Scholar] [CrossRef]
  5. Mall, R.K.; Gupta, A.; Singh, R.; Singh, R.S.; Rathore, L. Water resources and climate change: An Indian perspective. Curr. Sci. 2006, 90, 1610–1626. [Google Scholar]
  6. Rao, G.V.; Reddy, K.V.; Srinivasan, R.; Sridhar, V.; Umamahesh, N.; Pratap, D. Spatio-temporal analysis of rainfall extremes in the flood-prone Nagavali and Vamsadhara Basins in eastern India. Weather Clim. Extrem. 2020, 29, 100265. [Google Scholar]
  7. Yamazaki, D.; Watanabe, S.; Hirabayashi, Y. Global flood risk modeling and projections of climate change impacts. In Global Flood Hazard: Applications in Modeling, Mapping, and Forecasting; John Wiley & Sons, Inc.: New York, NY, USA, 2018; pp. 185–203. [Google Scholar]
  8. Zhang, Q.; Han, J.; Yang, Z. Spatiotemporal characteristics of regional precipitation events in the Jing-Jin-Ji region during 1989–2018. Int. J. Climatol. 2021, 41, 1190–1198. [Google Scholar] [CrossRef]
  9. Dimri, A.; Chevuturi, A.; Niyogi, D.; Thayyen, R.J.; Ray, K.; Tripathi, S.; Pandey, A.; Mohanty, U. Cloudbursts in Indian Himalayas: A review. Earth-Sci. Rev. 2017, 168, 1–23. [Google Scholar] [CrossRef]
  10. Mall, R.K.; Srivastava, R.K.; Banerjee, T.; Mishra, O.P.; Bhatt, D.; Sonkar, G. Disaster risk reduction including climate change adaptation over south Asia: Challenges and ways forward. Int. J. Disaster Risk Sci. 2019, 10, 14–27. [Google Scholar] [CrossRef] [Green Version]
  11. Mukherjee, S.; Aadhar, S.; Stone, D.; Mishra, V. Increase in extreme precipitation events under anthropogenic warming in India. Weather Clim. Extrem. 2018, 20, 45–53. [Google Scholar] [CrossRef]
  12. Nandargi, S.; Gaur, A.; Mulye, S. Hydrological analysis of extreme rainfall events and severe rainstorms over Uttarakhand, India. Hydrol. Sci. J. 2016, 61, 2145–2163. [Google Scholar] [CrossRef] [Green Version]
  13. Roxy, M.K.; Ghosh, S.; Pathak, A.; Athulya, R.; Mujumdar, M.; Murtugudde, R.; Terray, P.; Rajeevan, M. A threefold rise in widespread extreme rain events over central India. Nat. Commun. 2017, 8, 708. [Google Scholar] [CrossRef] [Green Version]
  14. Vellore, R.K.; Kaplan, M.L.; Krishnan, R.; Lewis, J.M.; Sabade, S.; Deshpande, N.; Singh, B.B.; Madhura, R.; Rama Rao, M. Monsoon-extratropical circulation interactions in Himalayan extreme rainfall. Clim. Dyn. 2016, 46, 3517–3546. [Google Scholar] [CrossRef]
  15. Arora, A.; Pandey, M.; Siddiqui, M.A.; Hong, H.; Mishra, V.N. Spatial flood susceptibility prediction in Middle Ganga Plain: Comparison of frequency ratio and Shannon’s entropy models. Geocarto Int. 2021, 36, 2085–2116. [Google Scholar] [CrossRef]
  16. Bharat, S.; Mishra, V. Runoff sensitivity of Indian sub-continental river basins. Sci. Total Environ. 2021, 766, 142642. [Google Scholar] [CrossRef] [PubMed]
  17. Chanapathi, T.; Thatikonda, S.; Raghavan, S. Analysis of rainfall extremes and water yield of Krishna river basin under future climate scenarios. J. Hydrol. Reg. Stud. 2018, 19, 287–306. [Google Scholar] [CrossRef]
  18. Nie, Y.; Pritchard, H.D.; Liu, Q.; Hennig, T.; Wang, W.; Wang, X.; Liu, S.; Nepal, S.; Samyn, D.; Hewitt, K.; et al. Glacial change and hydrological implications in the Himalaya and Karakoram. Nat. Rev. Earth Environ. 2021, 2, 91–106. [Google Scholar] [CrossRef]
  19. Pachauri, R.; Meyer, L. Climate Change 2014: Synthesis Report. Contribution of Working Groups I, II and III to the Fifth Assessment Report of the Intergovernmental Panel on Climate Change; IPCC: Geneva, Switzerland, 2014. [Google Scholar]
  20. Chaubey, P.K.; Mall, R.; Jaiswal, R.; Payra, S. Spatio-Temporal Changes in Extreme Rainfall Events Over Different Indian River Basins. Earth Space Sci. 2022, 9, e2021EA001930. [Google Scholar] [CrossRef]
  21. Mandal, S.P.; Chakrabarty, A. Flash flood risk assessment for upper Teesta river basin: Using the hydrological modeling system (HEC-HMS) software. Model. Earth Syst. Environ. 2016, 2, 1–10. [Google Scholar] [CrossRef] [Green Version]
  22. Starkel, L.; Wiejaczka, Ł.; Kiszka, K. Role of tributaries in shaping the middle course of the Himalayan River Teesta after the 1968 extreme floods. Curr. Sci. 2017, 112, 1896–1903. [Google Scholar] [CrossRef]
  23. Gemeda, D.O.; Korecha, D.; Garedew, W. Monitoring climate extremes using standardized evapotranspiration index and future projection of rainfall and temperature in the wettest parts of southwest Ethiopia. Environ. Challenges 2022, 7, 100517. [Google Scholar] [CrossRef]
  24. Fofana, M.; Adounkpe, J.; Larbi, I.; Hounkpe, J.; Koubodana, H.D.; Toure, A.; Bokar, H.; Dotse, S.Q.; Limantol, A.M. Urban flash flood and extreme rainfall events trend analysis in Bamako, Mali. Environ. Challenges 2022, 6, 100449. [Google Scholar] [CrossRef]
  25. Chaubey, P.K.; Kundu, A.; Mall, R. A geo-spatial inter-relationship with drainage morphometry, landscapes and NDVI in the context of climate change: A case study over the Varuna river basin (India). Spat. Inf. Res. 2019, 27, 627–641. [Google Scholar] [CrossRef]
  26. Chaubey, P.K.; Srivastava, P.K.; Gupta, A.; Mall, R. Integrated assessment of extreme events and hydrological responses of Indo-Nepal Gandak River Basin. Environ. Dev. Sustain. 2021, 23, 8643–8668. [Google Scholar] [CrossRef]
  27. Jain, A.O.; Thaker, T.P.; Misra, A.K.; Singh, A.K.; Kumari, P. Determination of sensitivity of drainage morphometry towards hydrological response interactions for various datasets. Environ. Dev. Sustain. 2021, 23, 1799–1822. [Google Scholar] [CrossRef]
  28. Pandey, V.; Srivastava, P.K.; Mall, R.; Munoz-Arriola, F.; Han, D. Multi-satellite precipitation products for meteorological drought assessment and forecasting in Central India. Geocarto Int. 2022, 37, 1899–1918. [Google Scholar] [CrossRef]
  29. Youssef, A.M.; Pradhan, B.; Hassan, A.M. Flash flood risk estimation along the St. Katherine road, southern Sinai, Egypt using GIS based morphometry and satellite imagery. Environ. Earth Sci. 2011, 62, 611–623. [Google Scholar] [CrossRef]
  30. Abdel-Fattah, M.; Saber, M.; Kantoush, S.A.; Khalil, M.F.; Sumi, T.; Sefelnasr, A.M. A hydrological and geomorphometric approach to understanding the generation of wadi flash floods. Water 2017, 9, 553. [Google Scholar] [CrossRef] [Green Version]
  31. Asfaw, D.; Workineh, G. Quantitative analysis of morphometry on Ribb and Gumara watersheds: Implications for soil and water conservation. Int. Soil Water Conserv. Res. 2019, 7, 150–157. [Google Scholar] [CrossRef]
  32. Pastén-Zapata, E.; Eberhart, T.; Jensen, K.; Refsgaard, J.; Sonnenborg, T. Towards a More Robust Evaluation of Climate Model and Hydrological Impact Uncertainties. Water Resour. Manag. 2022, 36, 3545–3560. [Google Scholar] [CrossRef]
  33. Ahmed, K.; Iqbal, Z.; Khan, N.; Rasheed, B.; Nawaz, N.; Malik, I.; Noor, M. Quantitative assessment of precipitation changes under CMIP5 RCP scenarios over the northern sub-Himalayan region of Pakistan. Environ. Dev. Sustain. 2020, 22, 7831–7845. [Google Scholar] [CrossRef]
  34. Guo, J.; Guo, S.; Li, Y.; Chen, H.; Li, T. Spatial and temporal variation of extreme precipitation indices in the Yangtze River basin, China. Stoch. Environ. Res. Risk Assess. 2013, 27, 459–475. [Google Scholar] [CrossRef]
  35. Annisa, H.; Nugroho, B. Analysis and Projections of Rainfall using representative concentration pathways (RCPs) Scenarios in Sleman Yogyakarta. In Proceedings of the IOP Conference Series: Earth and Environmental Science; IOP Publishing: Bristol, UK, 2021; Volume 653, p. 012099. [Google Scholar]
  36. Riahi, K.; Krey, V.; Rao, S.; Chirkov, V.; Fischer, G.; Kolp, P.; Kindermann, G.; Nakicenovic, N.; Rafai, P. RCP-8.5: Exploring the consequence of high emission trajectories. Clim. Chang. 2011, 10, 1007. [Google Scholar]
  37. Shrestha, S.; Roachanakanan, R. Extreme climate projections under representative concentration pathways in the Lower Songkhram River Basin, Thailand. Heliyon 2021, 7, e06146. [Google Scholar] [CrossRef]
  38. De Michele, C.; Avanzi, F. Superstatistical distribution of daily precipitation extremes: A worldwide assessment. Sci. Rep. 2018, 8, 1–11. [Google Scholar] [CrossRef] [Green Version]
  39. De Paola, F.; Giugni, M.; Pugliese, F.; Annis, A.; Nardi, F. GEV parameter estimation and stationary vs. non-stationary analysis of extreme rainfall in African test cities. Hydrology 2018, 5, 28. [Google Scholar] [CrossRef] [Green Version]
  40. Martins, E.S.; Stedinger, J.R. Generalized maximum-likelihood generalized extreme-value quantile estimators for hydrologic data. Water Resour. Res. 2000, 36, 737–744. [Google Scholar] [CrossRef]
  41. Easterling, D.R.; Meehl, G.A.; Parmesan, C.; Changnon, S.A.; Karl, T.R.; Mearns, L.O. Climate extremes: Observations, modeling, and impacts. Science 2000, 289, 2068–2074. [Google Scholar] [CrossRef] [Green Version]
  42. McKee, T.B.; Doesken, N.J.; Kleist, J. The relationship of drought frequency and duration to time scales. In Proceedings of the 8th Conference on Applied Climatology, Boston, MA, USA, 17–22 January 1993; Volume 17, pp. 179–183. [Google Scholar]
  43. Seiler, R.A.; Hayes, M.; Bressan, L. Using the standardized precipitation index for flood risk monitoring. Int. J. Climatol. 2002, 22, 1365–1376. [Google Scholar] [CrossRef]
  44. Guerreiro, M.J.; Lajinha, T.; Abreu, I. Flood Analysis with the Standardized Precipitation Index (SPI). 2007. Available online: https://bdigital.ufp.pt/handle/10284/361 (accessed on 20 June 2022).
  45. Wang, Y.; Chen, X.; Chen, Y.; Liu, M.; Gao, L. Flood/drought event identification using an effective indicator based on the correlations between multiple time scales of the Standardized Precipitation Index and river discharge. Theor. Appl. Climatol. 2017, 128, 159–168. [Google Scholar] [CrossRef]
  46. Available online: https://timesofindia.indiatimes.com/india/flash-flood-kills-22-in-sikkim/articleshow/16509127.cms (accessed on 20 June 2022).
  47. Available online: https://www.newindianexpress.com/nation/2020/jun/28/19-buildings-damaged-35-families-affected-in-north-sikkim-flash-flood-2162645.html (accessed on 20 June 2022).
  48. Patton, P.C.; Baker, V.R. Morphometry and floods in small drainage basins subject to diverse hydrogeomorphic controls. Water Resour. Res. 1976, 12, 941–952. [Google Scholar] [CrossRef] [Green Version]
  49. Kumar, S.; Chanda, K.; Pasupuleti, S. Spatiotemporal analysis of extreme indices derived from daily precipitation and temperature for climate change detection over India. Theor. Appl. Climatol. 2020, 140, 343–357. [Google Scholar] [CrossRef]
  50. Gilleland, E.; Katz, R.W. New software to analyze how extremes change over time. Eos Trans. Am. Geophys. Union 2011, 92, 13–14. [Google Scholar] [CrossRef]
  51. Katz, R.W.; Parlange, M.B.; Naveau, P. Statistics of extremes in hydrology. Adv. Water Resour. 2002, 25, 1287–1304. [Google Scholar] [CrossRef] [Green Version]
  52. Coles, S.; Bawa, J.; Trenner, L.; Dorazio, P. An Introduction to Statistical Modeling of Extreme Values; Springer: Berlin/Heidelberg, Germany, 2001; Volume 208. [Google Scholar]
  53. Stephenson, A. Evd: Extreme value distributions. R News 2002, 2, 31–32. [Google Scholar]
  54. Van Rooy, M. A Rainfall Anomally Index Independent of Time and Space. Notos 1965, 14, 43–48. [Google Scholar]
  55. Qian, W.; Lin, X. Regional trends in recent temperature indices in China. Clim. Res. 2004, 27, 119–134. [Google Scholar] [CrossRef] [Green Version]
  56. Merz, R.; Blöschl, G. Flood frequency hydrology: 1. Temporal, spatial, and causal expansion of information. Water Resour. Res. 2008, 44, W08432. [Google Scholar] [CrossRef] [Green Version]
  57. Vittal, H.; Ghosh, S.; Karmakar, S.; Pathak, A.; Murtugudde, R. Lack of dependence of Indian summer monsoon rainfall extremes on temperature: An observational evidence. Sci. Rep. 2016, 6, 31039. [Google Scholar] [CrossRef] [Green Version]
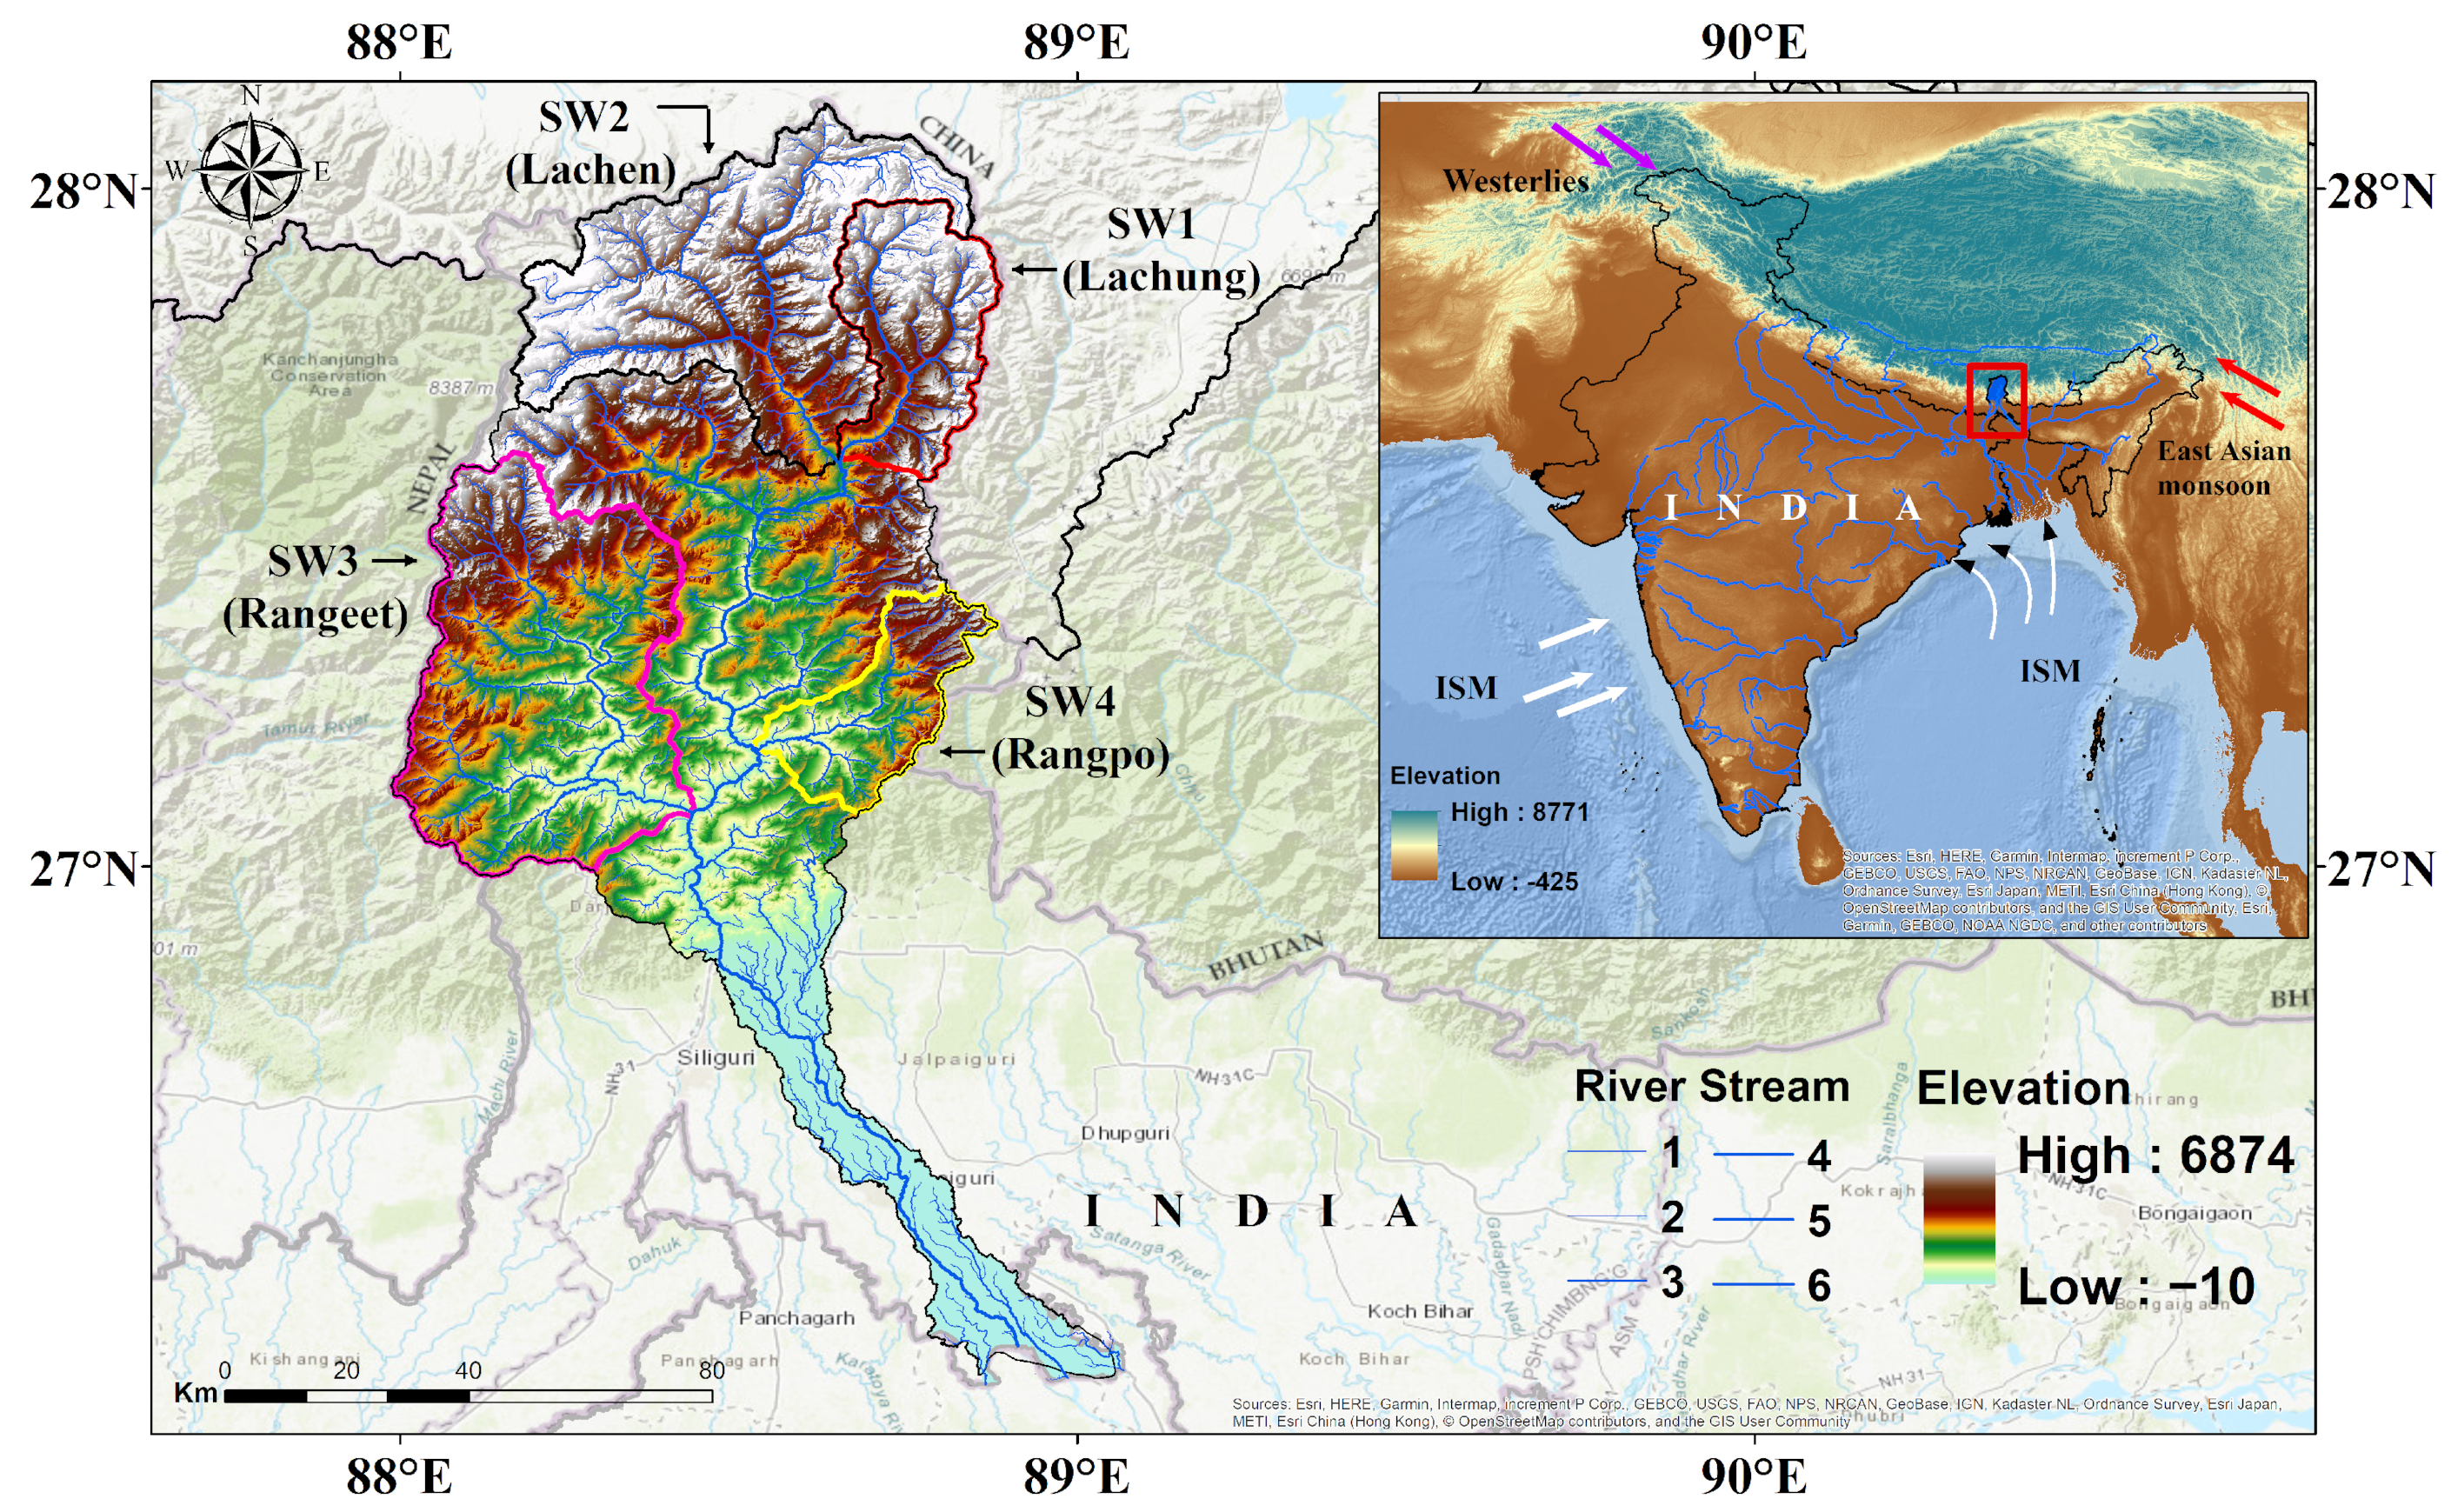
Figure 1. The location map of the study area; weather systems are shown using a shuttle radar topographic mission (SRTM) digital elevation model (DEM) of the central and eastern parts of India. The study area (Teesta Basin) is outlined in red.
Sustainability 15 04668 g001
Figure 2. Temporal variation in the intensity of daily maximum IMD rainfall over the TRB; the red star dots represent the maximum daily rainfall in each year.
Sustainability 15 04668 g002
Figure 3. Matrix plot of temporal monthly variation in IMD rainfall over the TRB.
Sustainability 15 04668 g003
Figure 4. (a) Probability density distribution of precipitation (1970–2005) over the TRB. (b) Normalized statistical pattern of extracted rainfall over the TRB simulated model outputs of the CMIP5 with the observed IMD data from the years 1970 to 2005.
Sustainability 15 04668 g004
Figure 5. Projected annual maximum daily precipitation intensity of simulated outputs (2006–2070) of climate model over the Teesta river basin. The red star dots represent the maximum daily precipitation for each year, and the red line indicates the trend maximum daily precipitation.
Sustainability 15 04668 g005
Figure 6. GEV model density and return-level plot for the observed rainfall (1970–2018) and projected simulated model outputs (2006–2070) over the TRB in Figure (a,c,e,g). The gray dashed lines indicate 95% confidence intervals in Figure (b,d,f,h), while N denotes the number of years.
Sustainability 15 04668 g006
Figure 7. Return level plot for observed and projected precipitation at the 2-year, 20-year, and 100-year return periods over the basin.
Sustainability 15 04668 g007
Figure 8. Temporal variation in projected model outputs (2006–2070) for CCSM4, CNRM-CM5, and GFDL-CM3 scenarios at different extreme precipitation indices as greatest five-day total rainfall per year (Rx5max) and simple daily intensity (rain per rain day ≥1 mm) (Pint), with boxplot of monthly accumulated rainfall for extreme indices.
Sustainability 15 04668 g008
Figure 9. Spatial variation in projected EPI for the maximum five-day total rainfall per year (Rx5max) and number of precipitation days (rain per rain day ≥ 10 mm) (Pint) over the TRB. (TRB is shown in Black color and its sub-watersheds in Red in color).
Sustainability 15 04668 g009
Figure 10. The long-term time trends of SPI12 (annual) over the TRB for the period of 1970–2018 for IMD and 1970–2070 for CMIP5.
Sustainability 15 04668 g010
Figure 11. Decadal changes in projected dry to wet conditions from 2011 to 2070: simulated outputs of CMIP5 models coupled with RCP 8.5.
Sustainability 15 04668 g011
Table 1. Morphometric aspects of the linear, area, and relief parameters of the TRB.
Morphometric ParametersMW
(Teesta)
SW1
(Lachung)
SW2
(Lachen)
SW3
(Rangeet )
SW4
(Rangpo)
Linear
Bifurcation ratio (Rb)4.353.514.074.223.12
Rho coefficient (q)0.220.170.120.130.18
Areal aspect
Drainage density (Dd)0.50.520.510.20.46
Stream frequency (Fs)0.170.210.180.080.17
Drainage texture (T)1.130.930.970.680.69
Length of overland flow (Lg)10.960.982.441.08
Constant of channel maintenance (C)1.991.921.964.892.16
Form factor (Rf)0.050.220.250.580.23
Circulatory ratio (Rc)0.050.360.20.210.35
Elongation ratio (Re)0.250.530.570.860.54
Relief aspect
Basin relief (R) (km)68746514687459154612
Relief ratio (Rr)14.7886.8961.763.2488.16
Ruggedness number (Rn)3.52.592.731.182.02
Table 2. Specifications of datasets.
Data UsedSpatial ResolutionSourceTime PeriodData Source
DEM30 mSRTM——http://srtm.csi.cgiar.org
Observed Gridded Rainfall0.25° × 0.25°IMD1970–2018http://dsp.imdpune.gov.in/
CCSM4, CNRM-CM5,
GFDL-CM3
0.5° × 0.5°CCCR, IITM1970–2005
(Historical)
2006–2070
(Projected)
http://cccr.tropmet.res.in
Table 3. SPI and RAI classification according to their original definitions as applied in this study.
SPI
(McKee et al. [42])
DescriptionRAI
(VanRooy [54])
≥ 2.00Extremely wet≥3.00
1.50 to 1.99Very wet2.00 to 2.99
1.00 to 1.49Moderately wet1.00 to 1.99
0.50 to 0.99Slightly wet0.50 to 0.99
−0.49 to 0.49Near normal−0.49 to 0.49
−0.99 to −0.50Slightly dry−0.99 to −0.50
−1.49 to − 1.00Moderately dry−1.99 to −1.00
−1.99 to −1.50Very dry−2.99 to −2.00
≤−2.00Extremely dry≤−3.00
Table 4. Extreme precipitation indices.
CategoryIndexUnitDefinition
Precipitation magnitudePRwn90
PRwn95
PRwn99
90th, 95th and 99th percentile of precipitation on wet days
Rx5maxmmGreatest 5-day total rainfall per year
Precipitation intensityPintmm/dSimple daily intensity (rain per rain day ≥ 1 mm)
Pnl90dNo. of events >long-term 90th percentile
Precipitation persistencePn10mmdNo. of days precipitation ≥10 mm
Table 5. Calculated EPI for projected simulated model outputs of CMIP5.
ModelPrecipitation on Wet Days at PercentilePnl90Pn10mm
90th (PRwn90)95th (PRwn95)99th (PRwn99)
CCSM450.3368.80115.4012435927
CNRM47.7266.40112.3612315733
GFDL48.9568.07119.5612225513
Disclaimer/Publisher’s Note: The statements, opinions and data contained in all publications are solely those of the individual author(s) and contributor(s) and not of MDPI and/or the editor(s). MDPI and/or the editor(s) disclaim responsibility for any injury to people or property resulting from any ideas, methods, instructions or products referred to in the content.