
Forecast of Advanced Human Capital Gap Based on PSO-BP Neural Network and Coordination Pathway: Example of Beijing–Tianjin–Hebei Region


Abstract
1. Introduction
1.1. Background
1.2. Literature Review and Theoretical Mechanism
1.2.1. Role of Advanced Human Capital in Economy and Society
1.2.2. Role of Advanced Human Capital in Regional Coordinated Development

| Category | Abbr. | Implication | Measurement Method |
|---|---|---|---|
| Explained variable | HHC | Stock of advanced human capital. | Calculate by measuring the proportion of people with higher education in society, which means this part of people have a college degree or above, using the five-equal length of education year method measurement refer to Morett (2004), Li et al. (2013), Liang et al. (2016) [44,45,46]. |
| Explanatory variable | GDP | Real regional gross regional product: reflected the total output of a region for a certain period. | By deflation of the base period to eliminate the influence of price factors, 2005 is the base period in this paper. |
| PL | Independent innovation ability. | Takes the amount of patent authorization as the agency index. | |
| AIS | The advanced industrial structure. | Calculation formula is: . | |
| UR | Population urbanization, use urbanization rate to represent. | Calculated by the urbanization rate of the permanent resident population, refer to Wu et al. (2018) [47], Wang et al. (2019) [48], Du et al. (2022) [49]. | |
| CS | Physical capital stock. | Using perpetual inventory method, calculation formula is: ; . Among them, represents the capital stock of phase is of i province. represents phase i province t’s constant price fixed asset investment, represents the depreciation rate of fixed assets in i province, and represents the growth rate of fixed asset investment in i province. represents the initial capital stock of i province, and the depreciation rate of fixed assets in this paper is 9.6%, refer to Zhang et al. (2003) [50]. |
2. Data and Methods
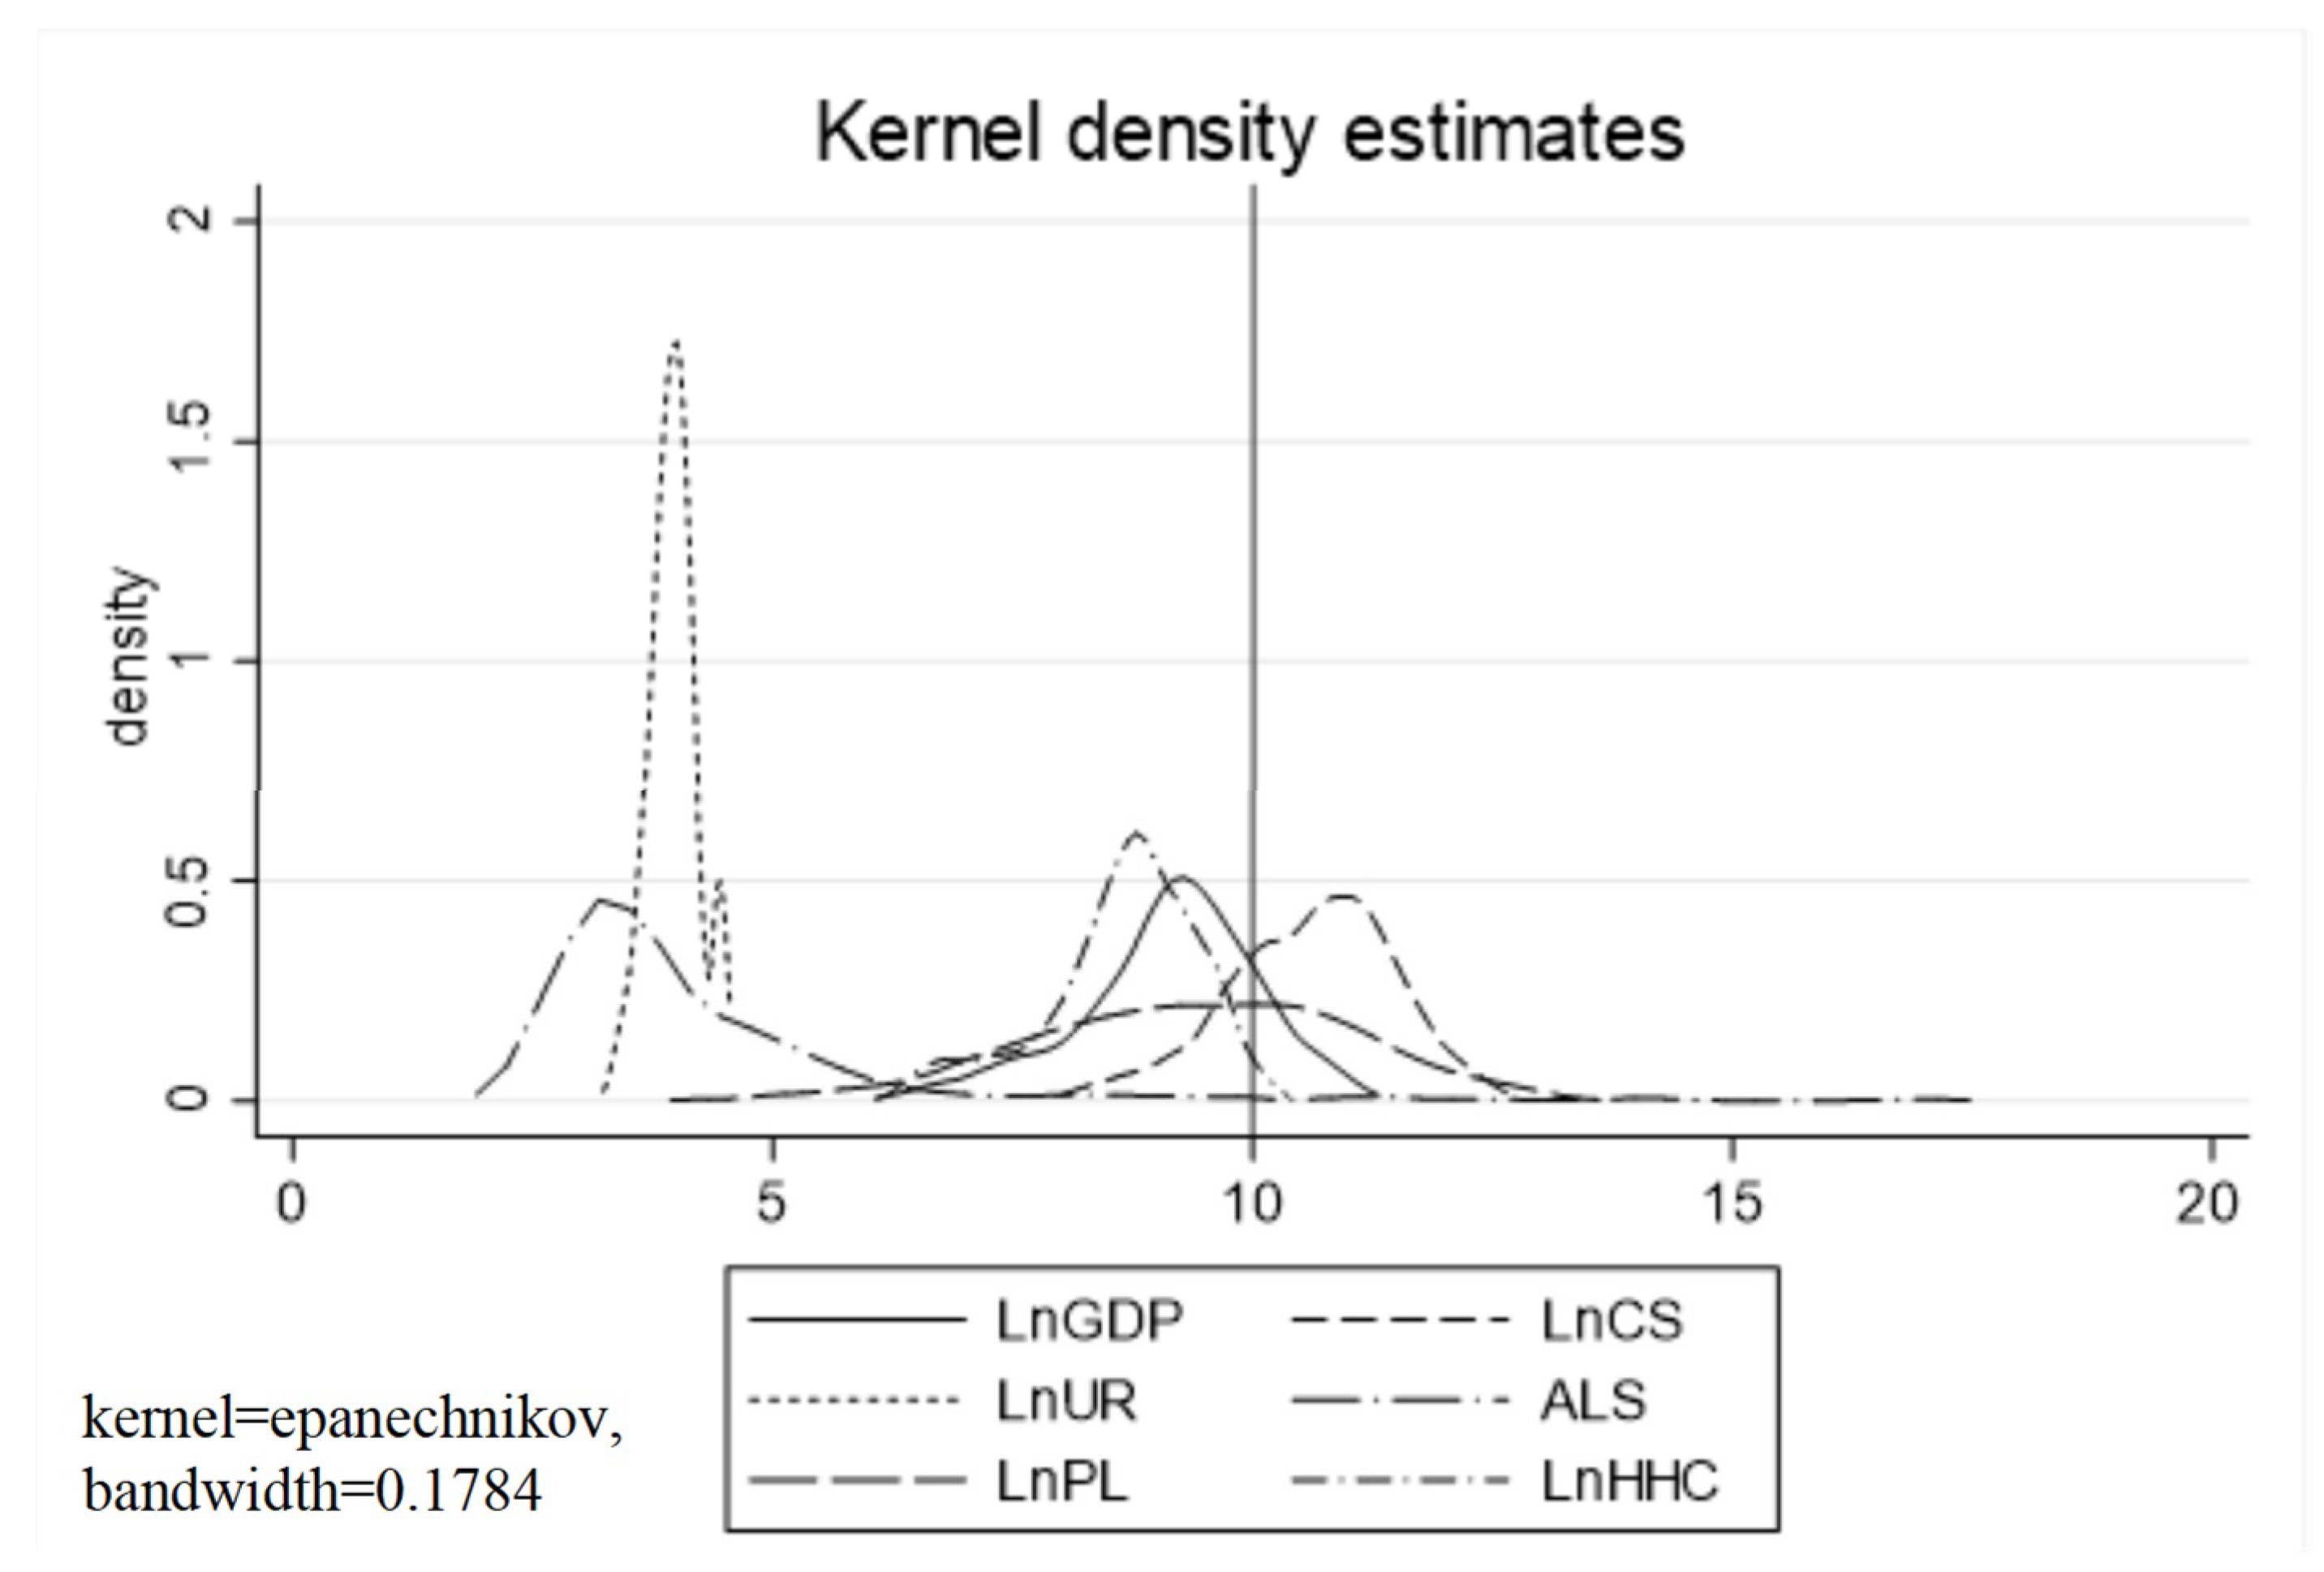
2.1. Data
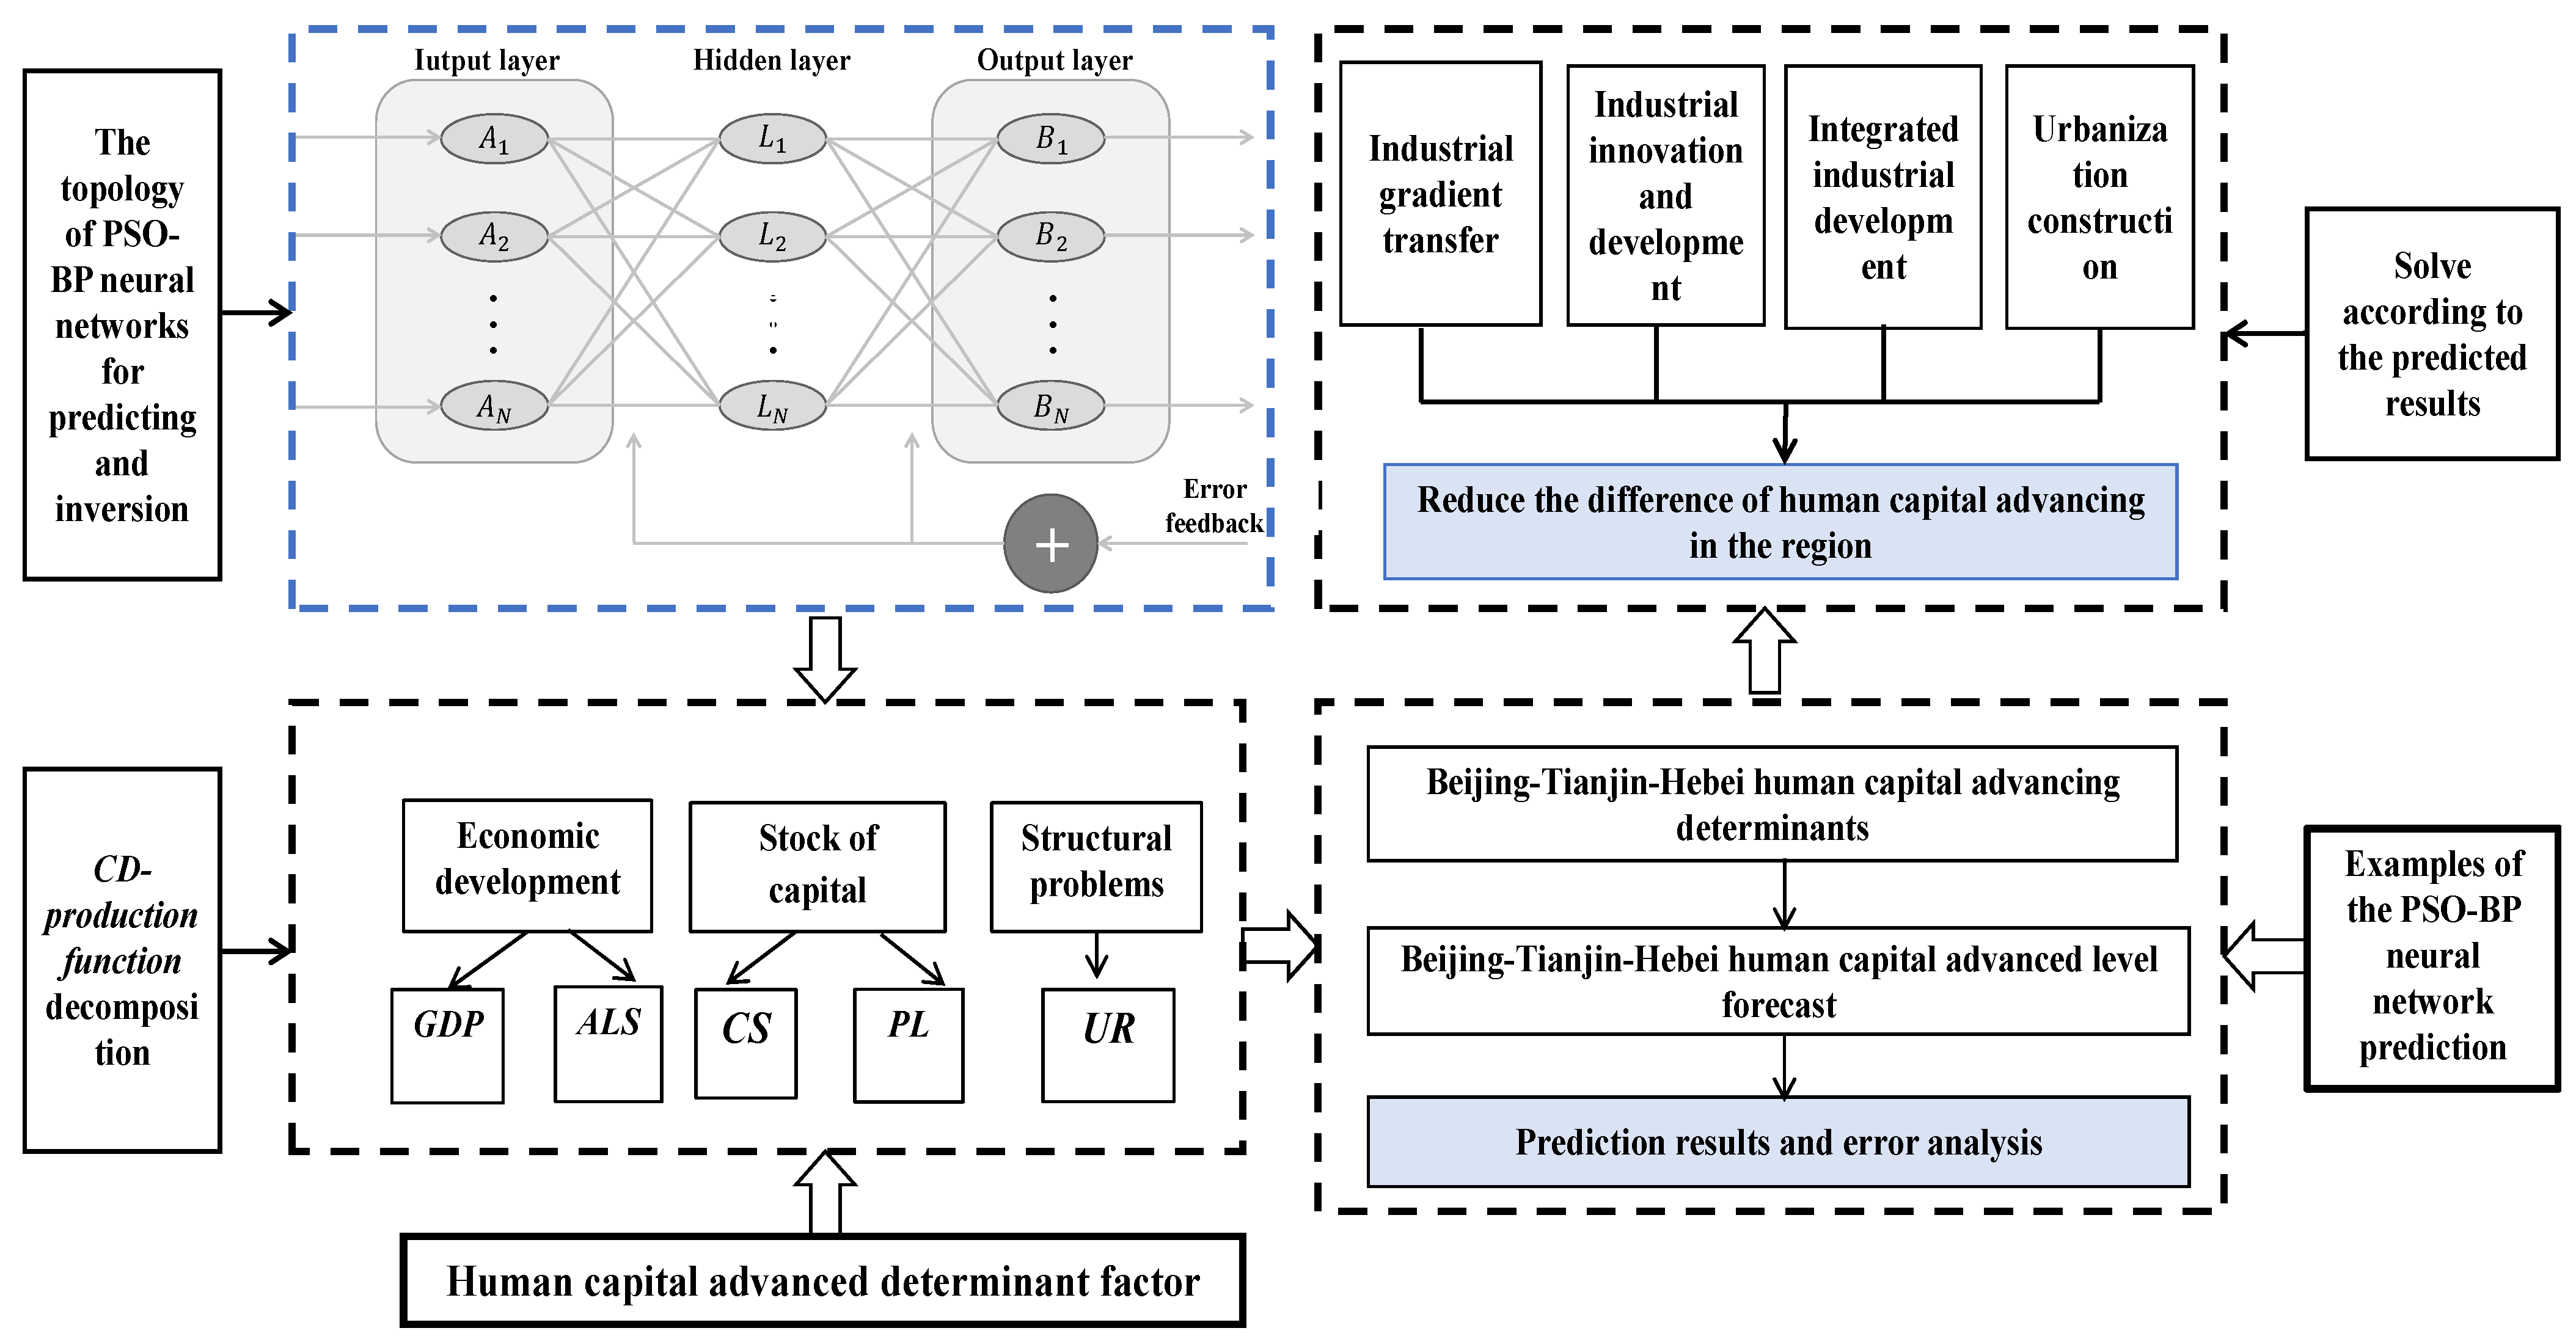
2.2. Methods
2.2.1. Estimating Screening Prediction Influencing Factors of OLS Model
2.2.2. Introduction of the Selection of the PSO-BP Algorithm
3. Forecast Results
3.1. Screening Results of Influencing Factors Based on OLS Model
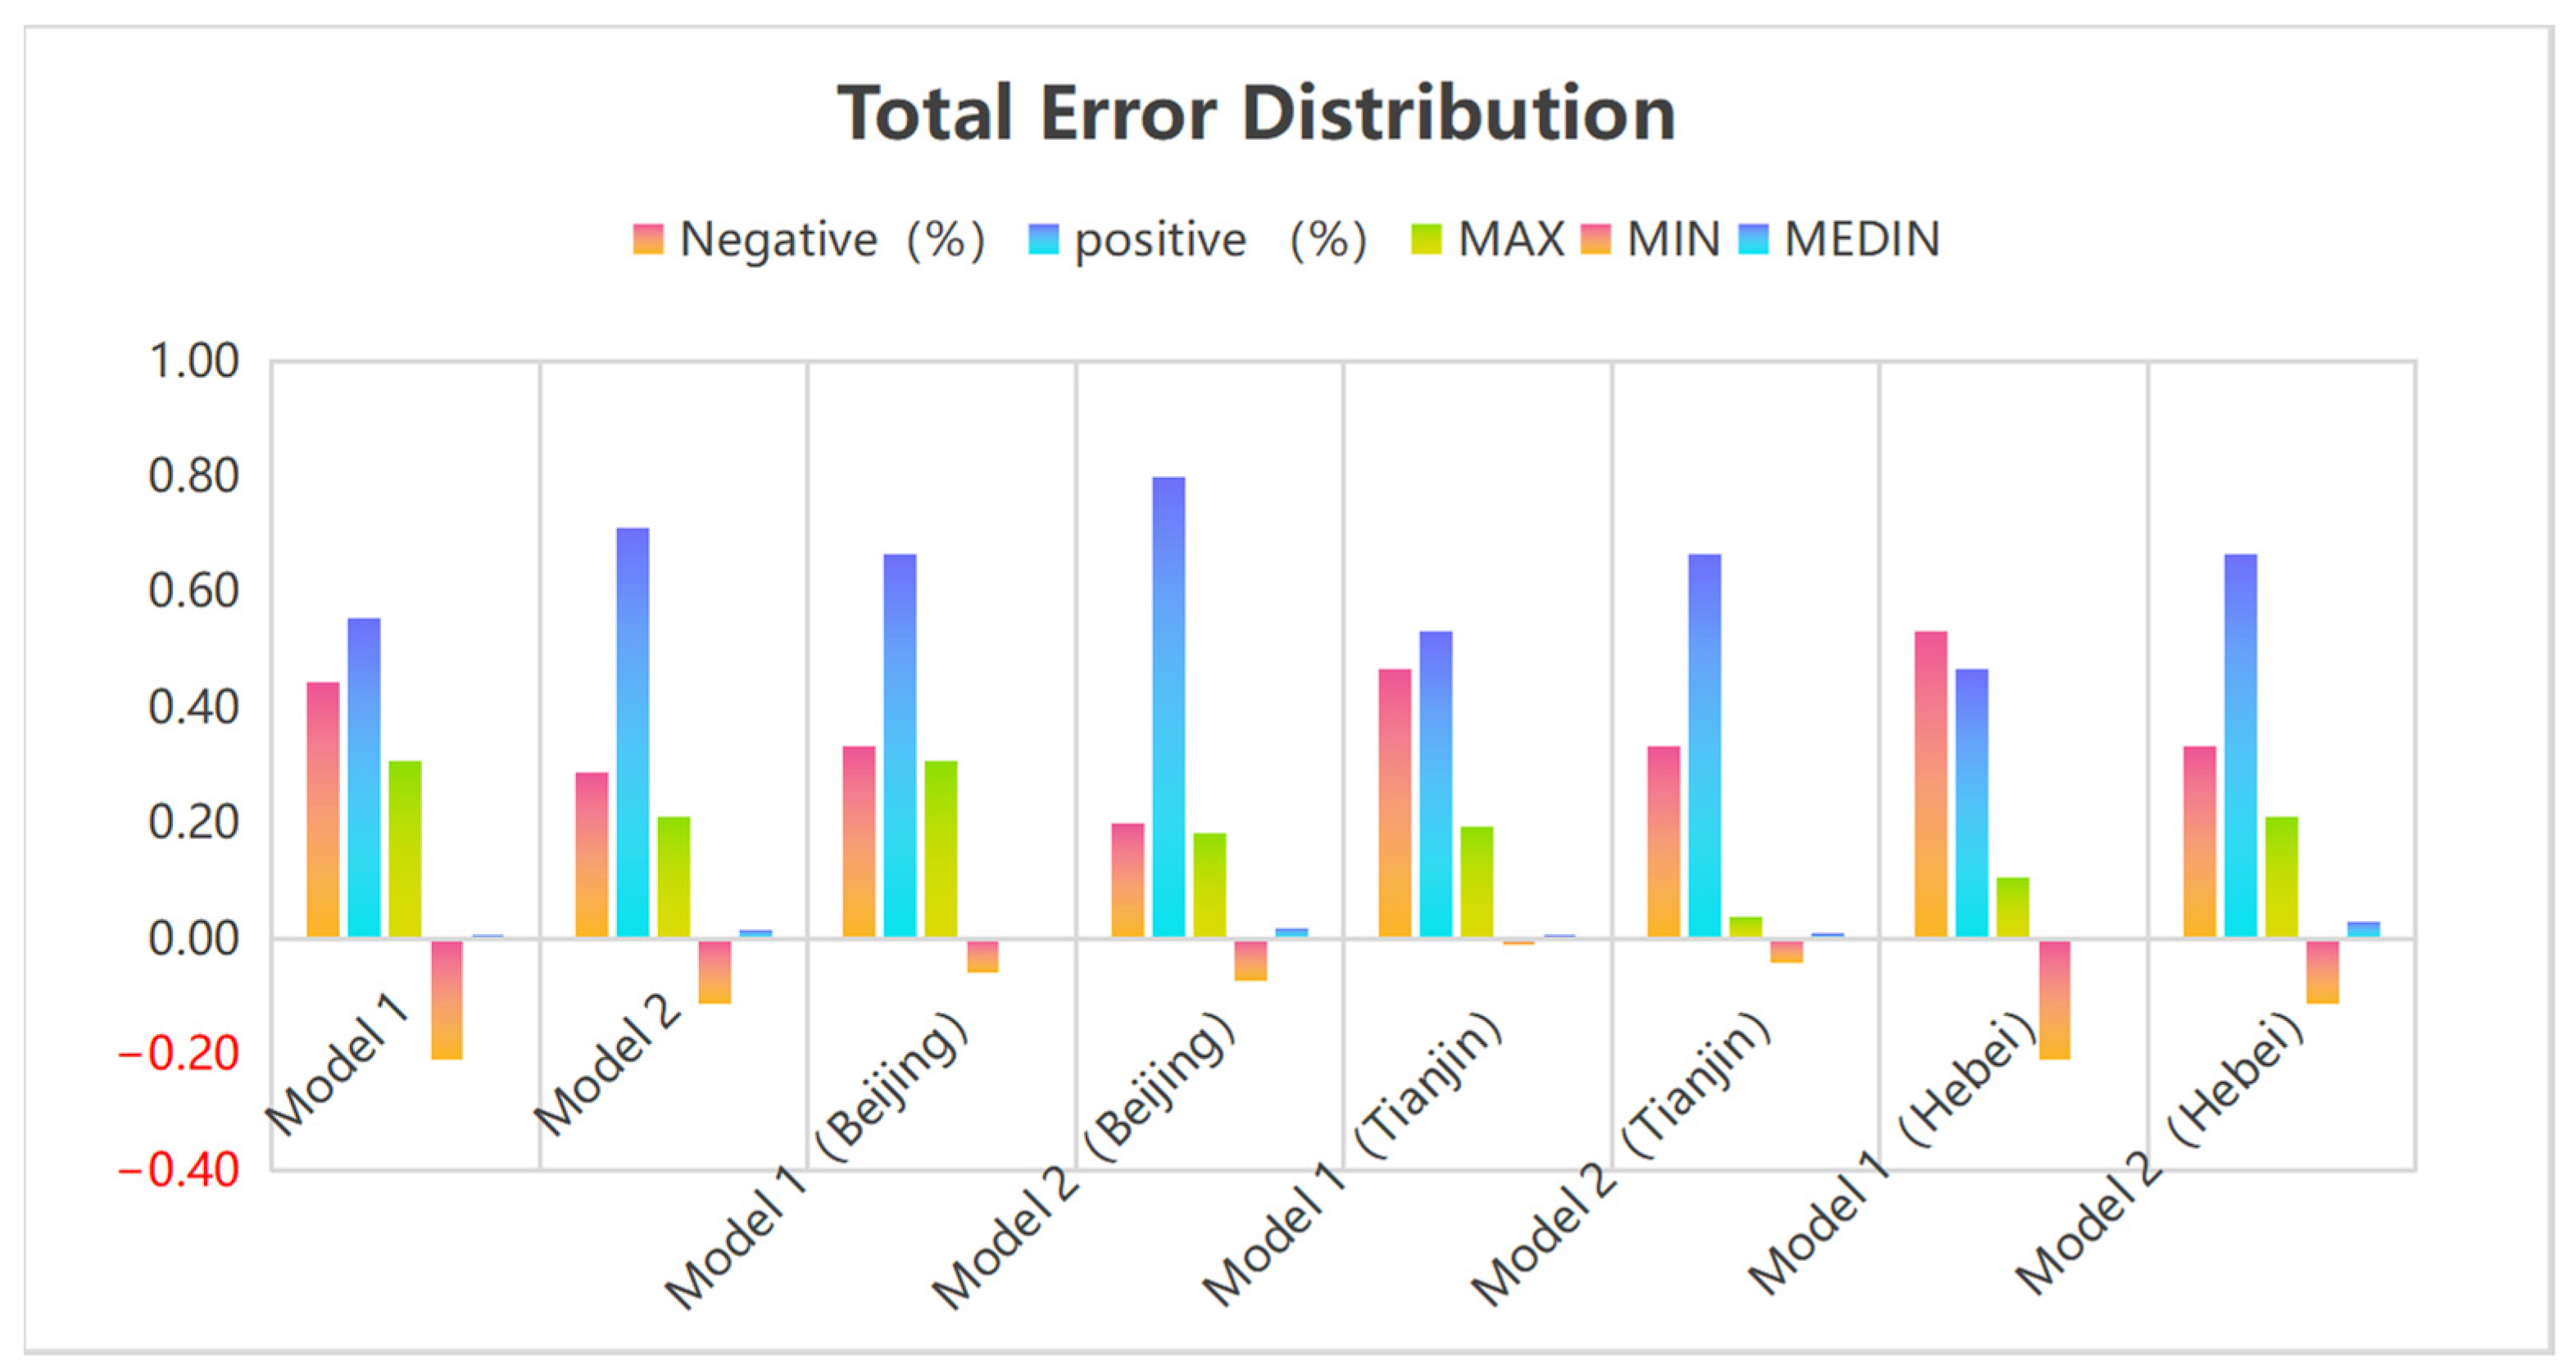
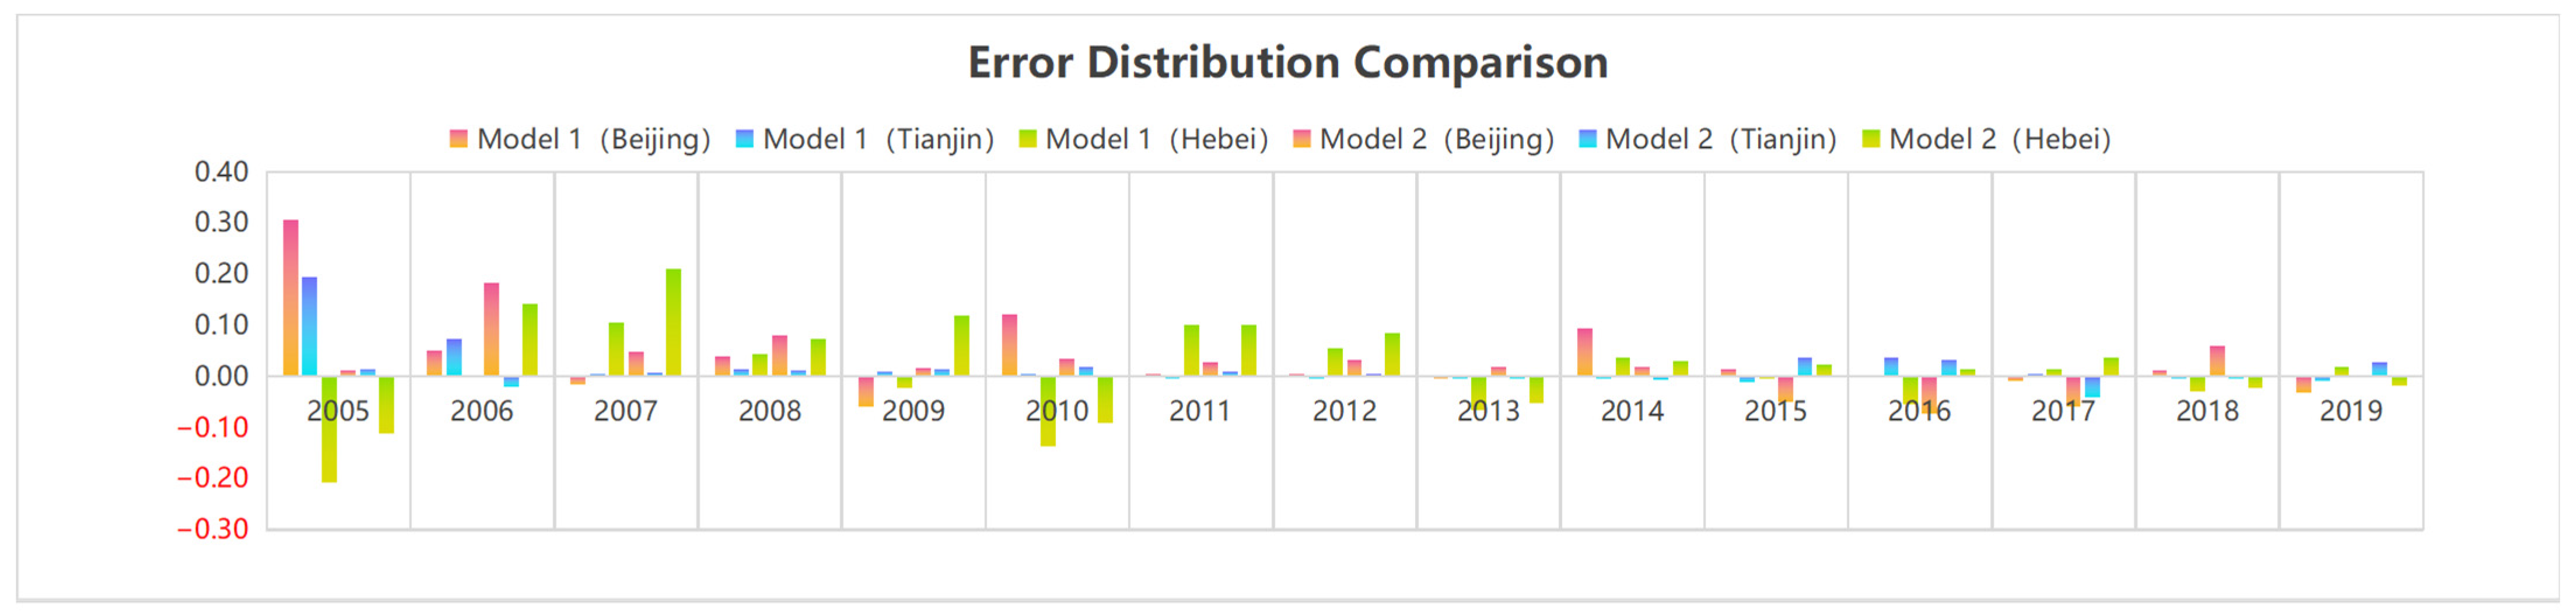
3.2. Based on the PSO-BP Prediction Results
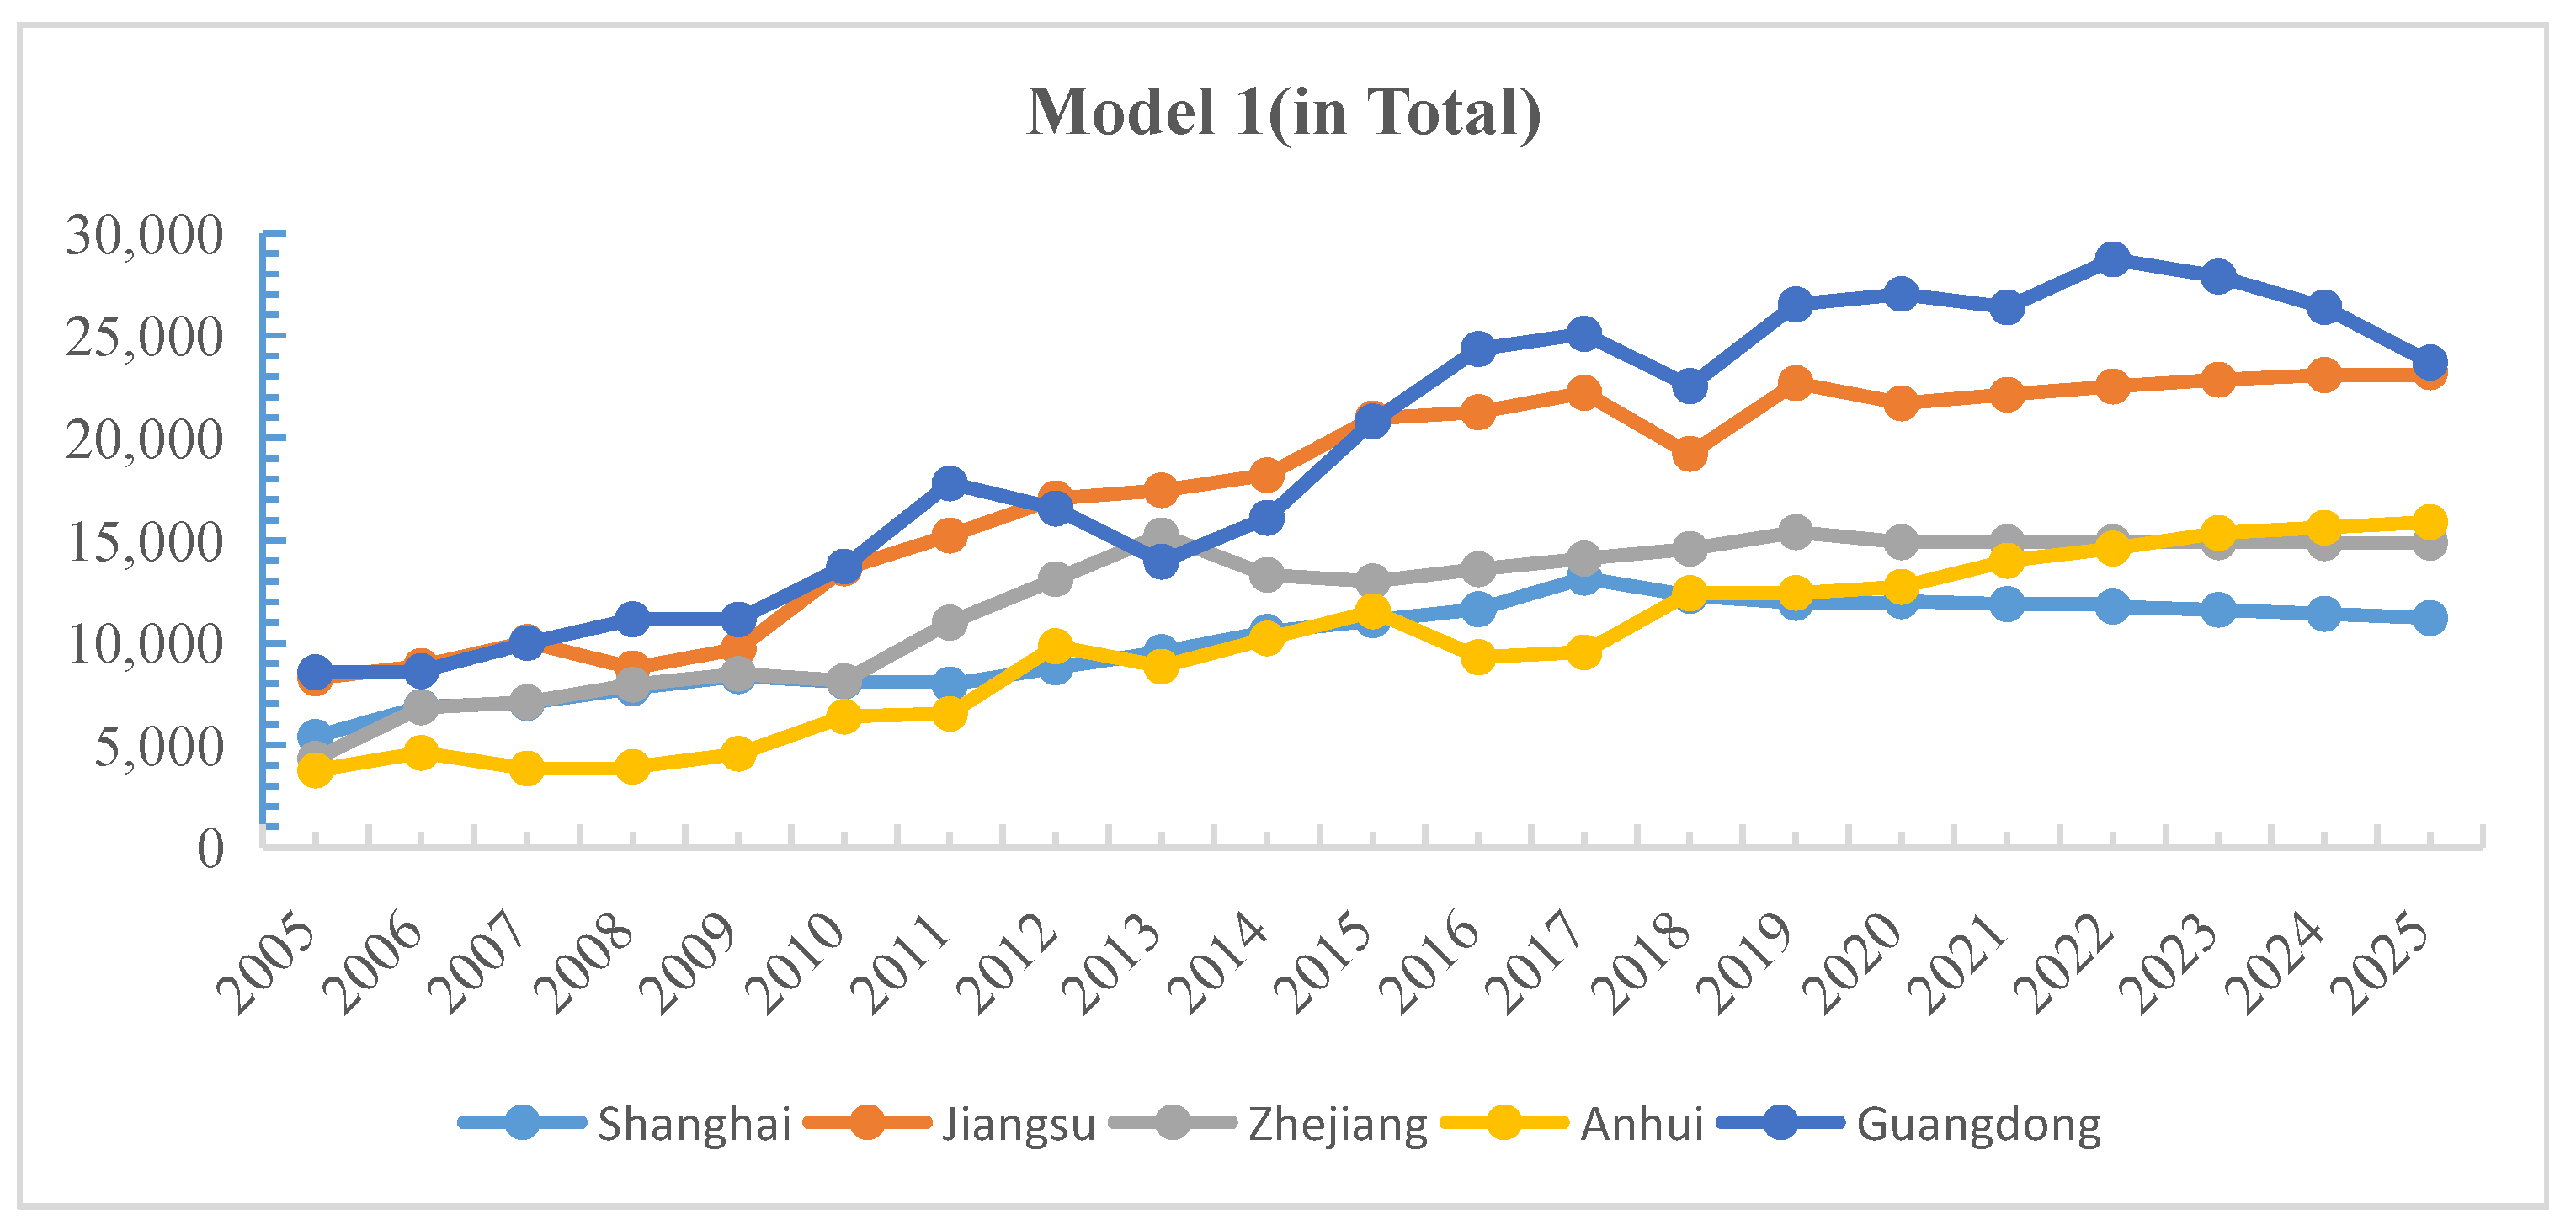
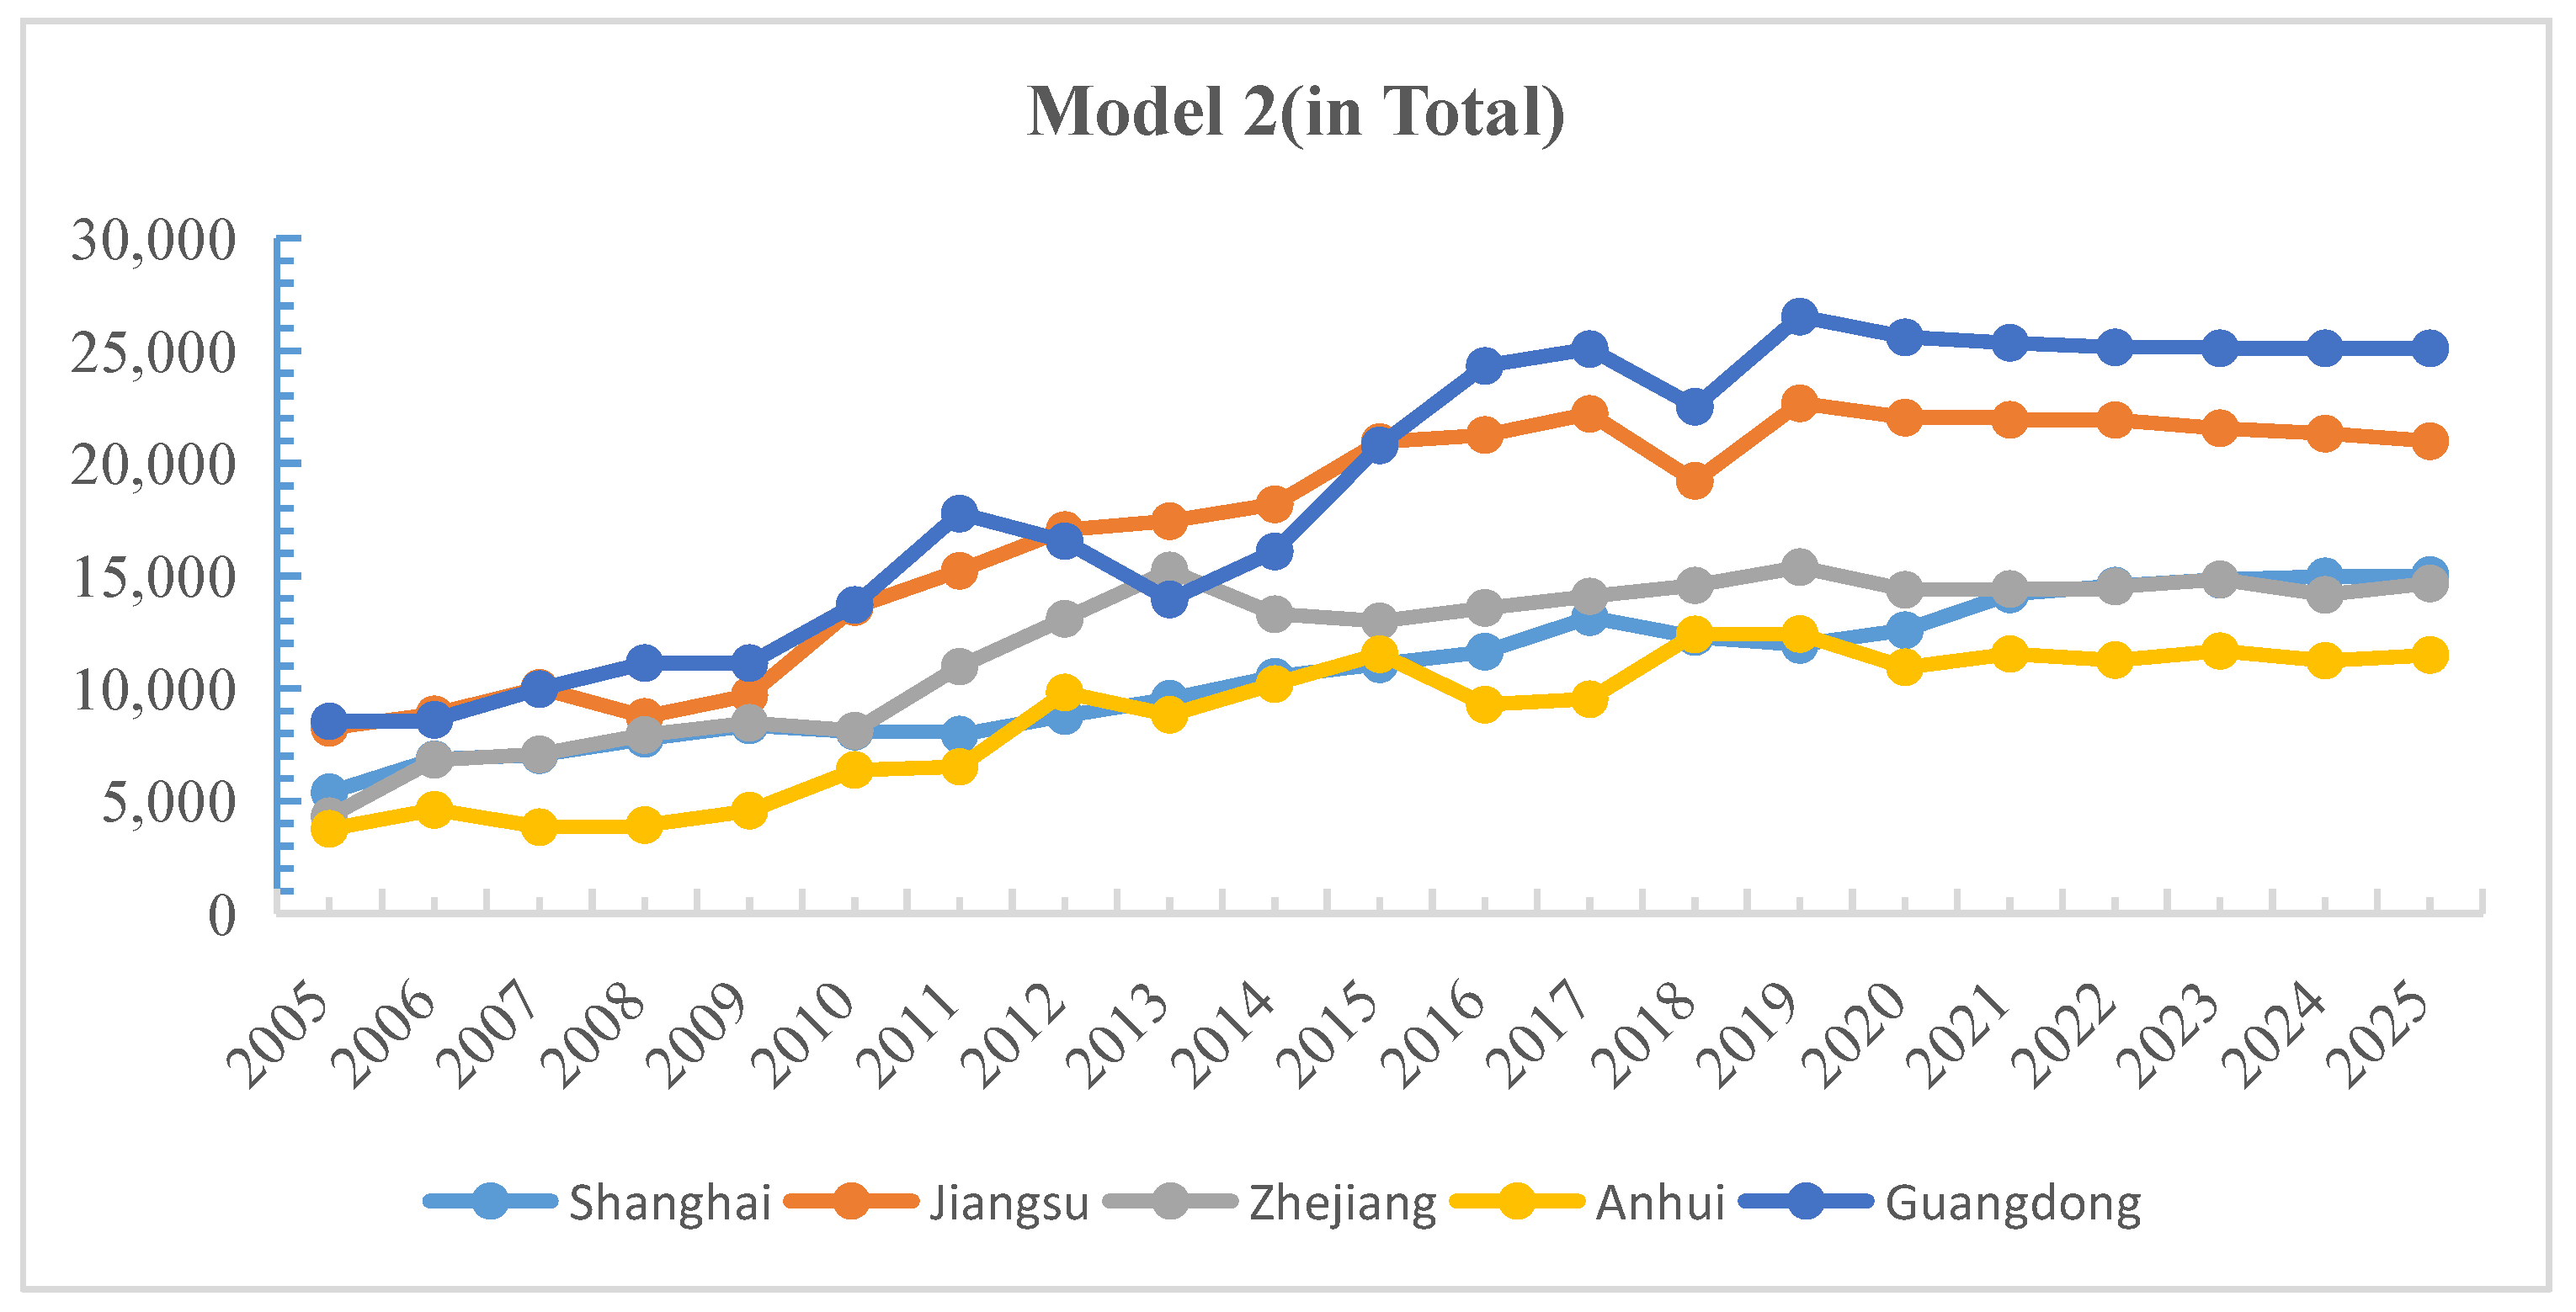
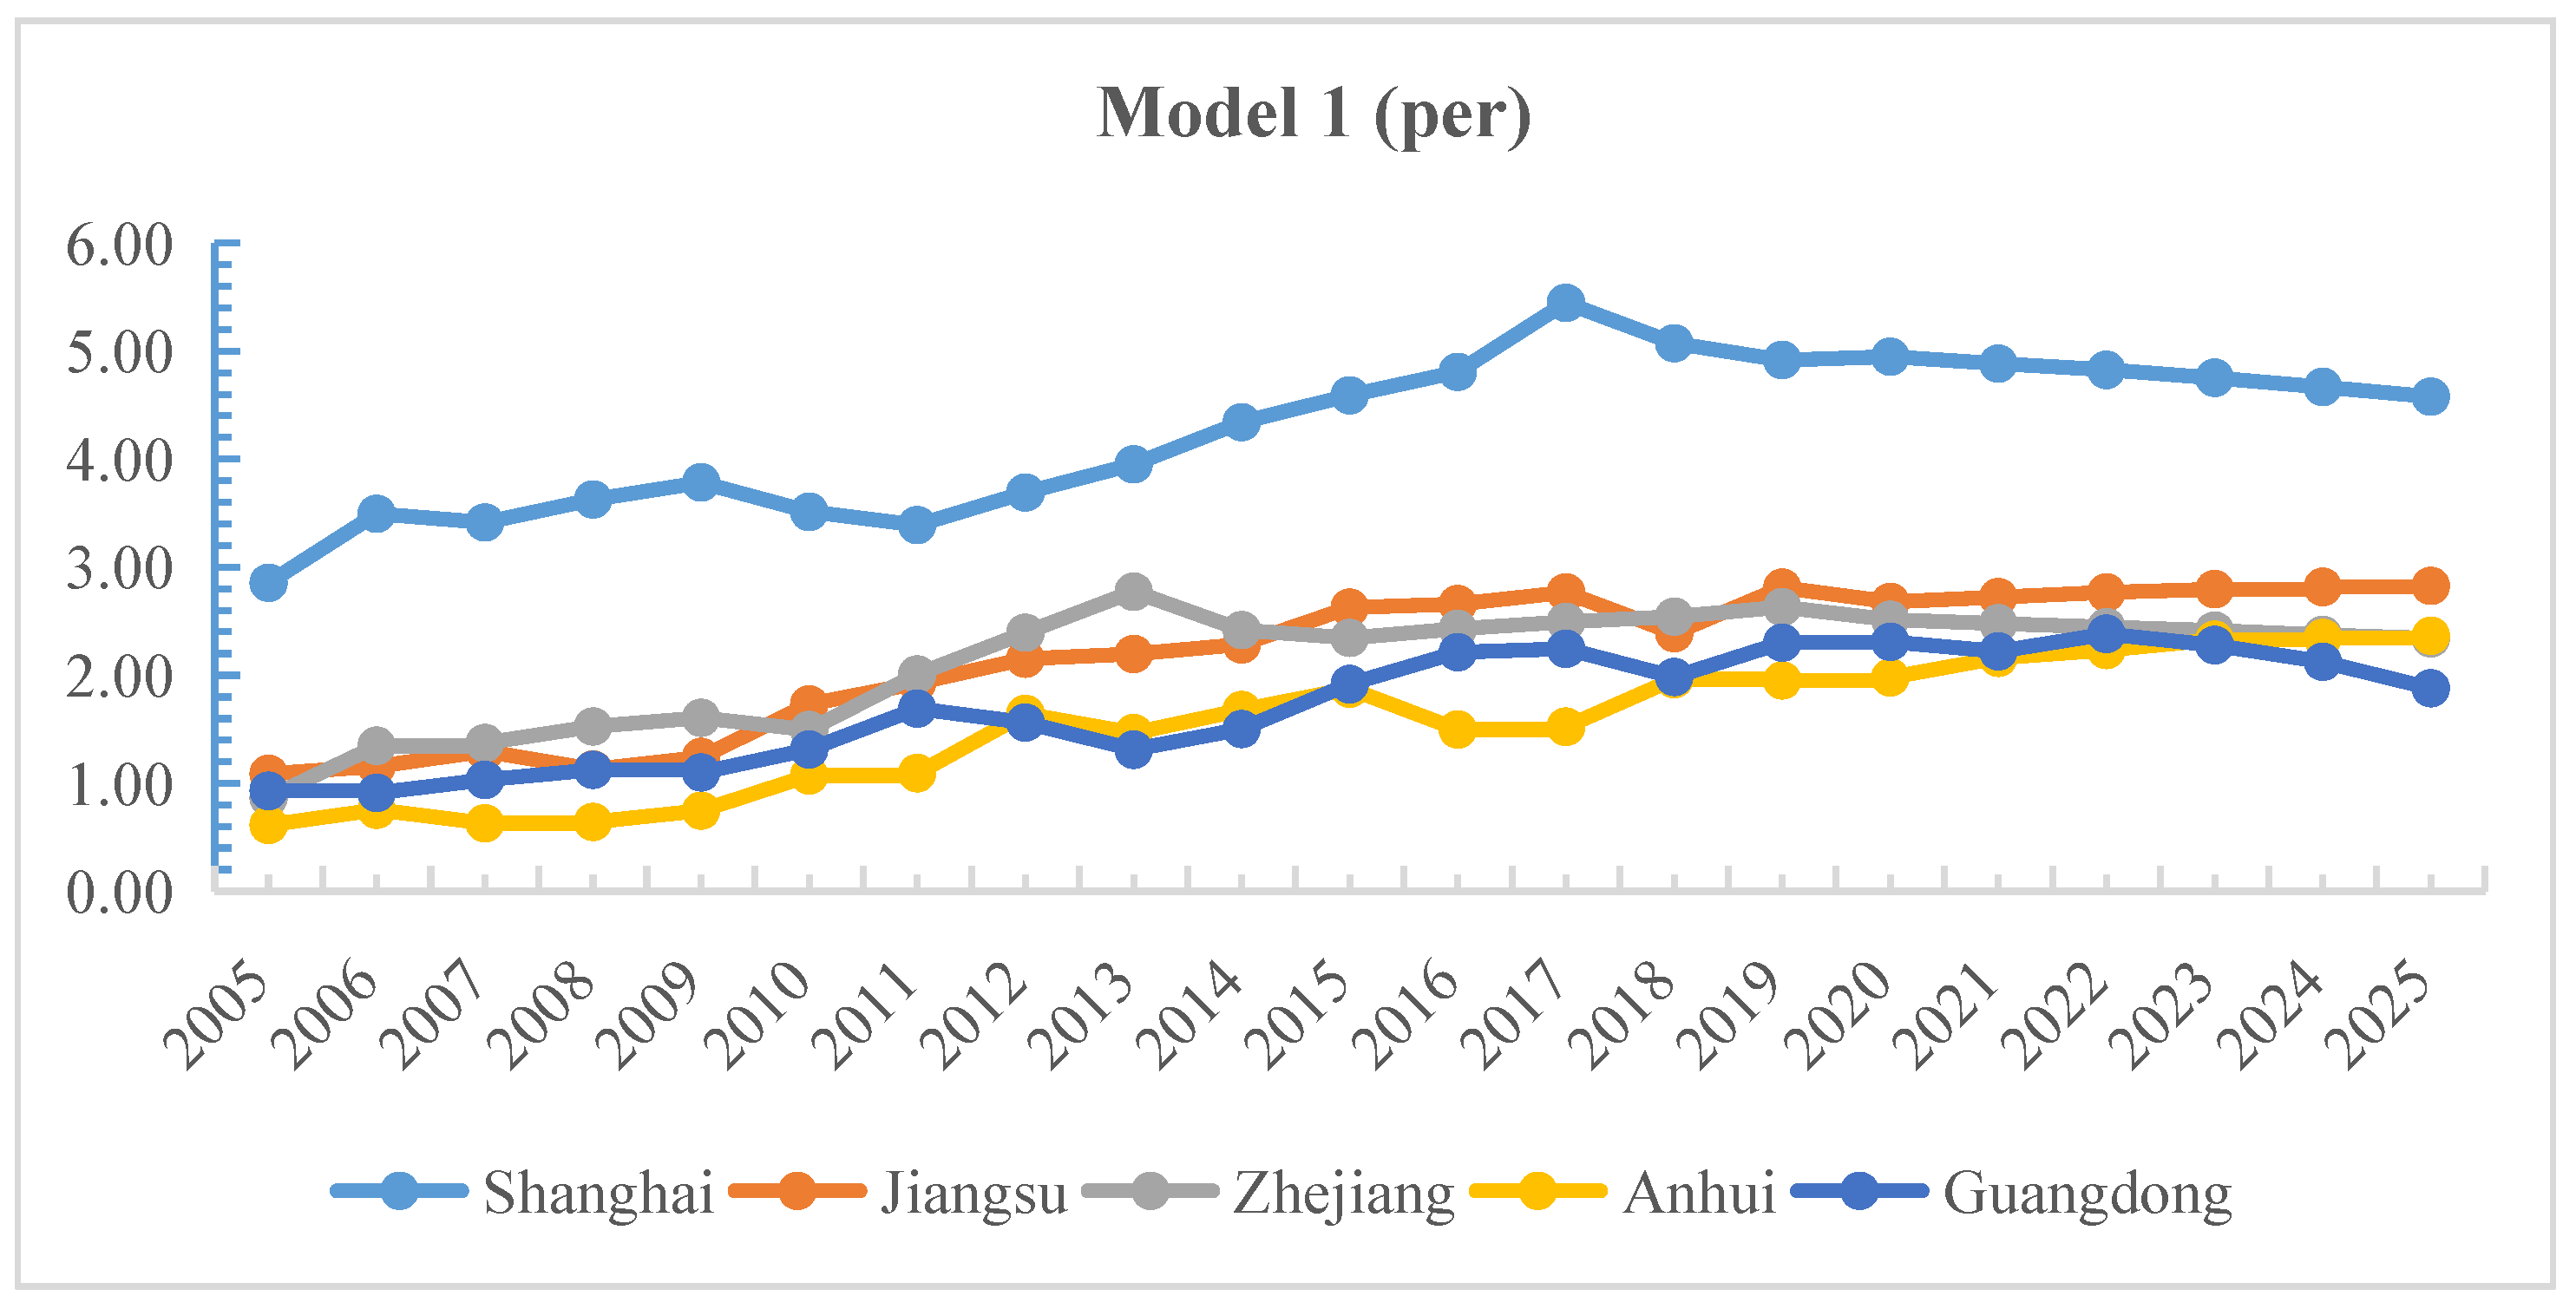
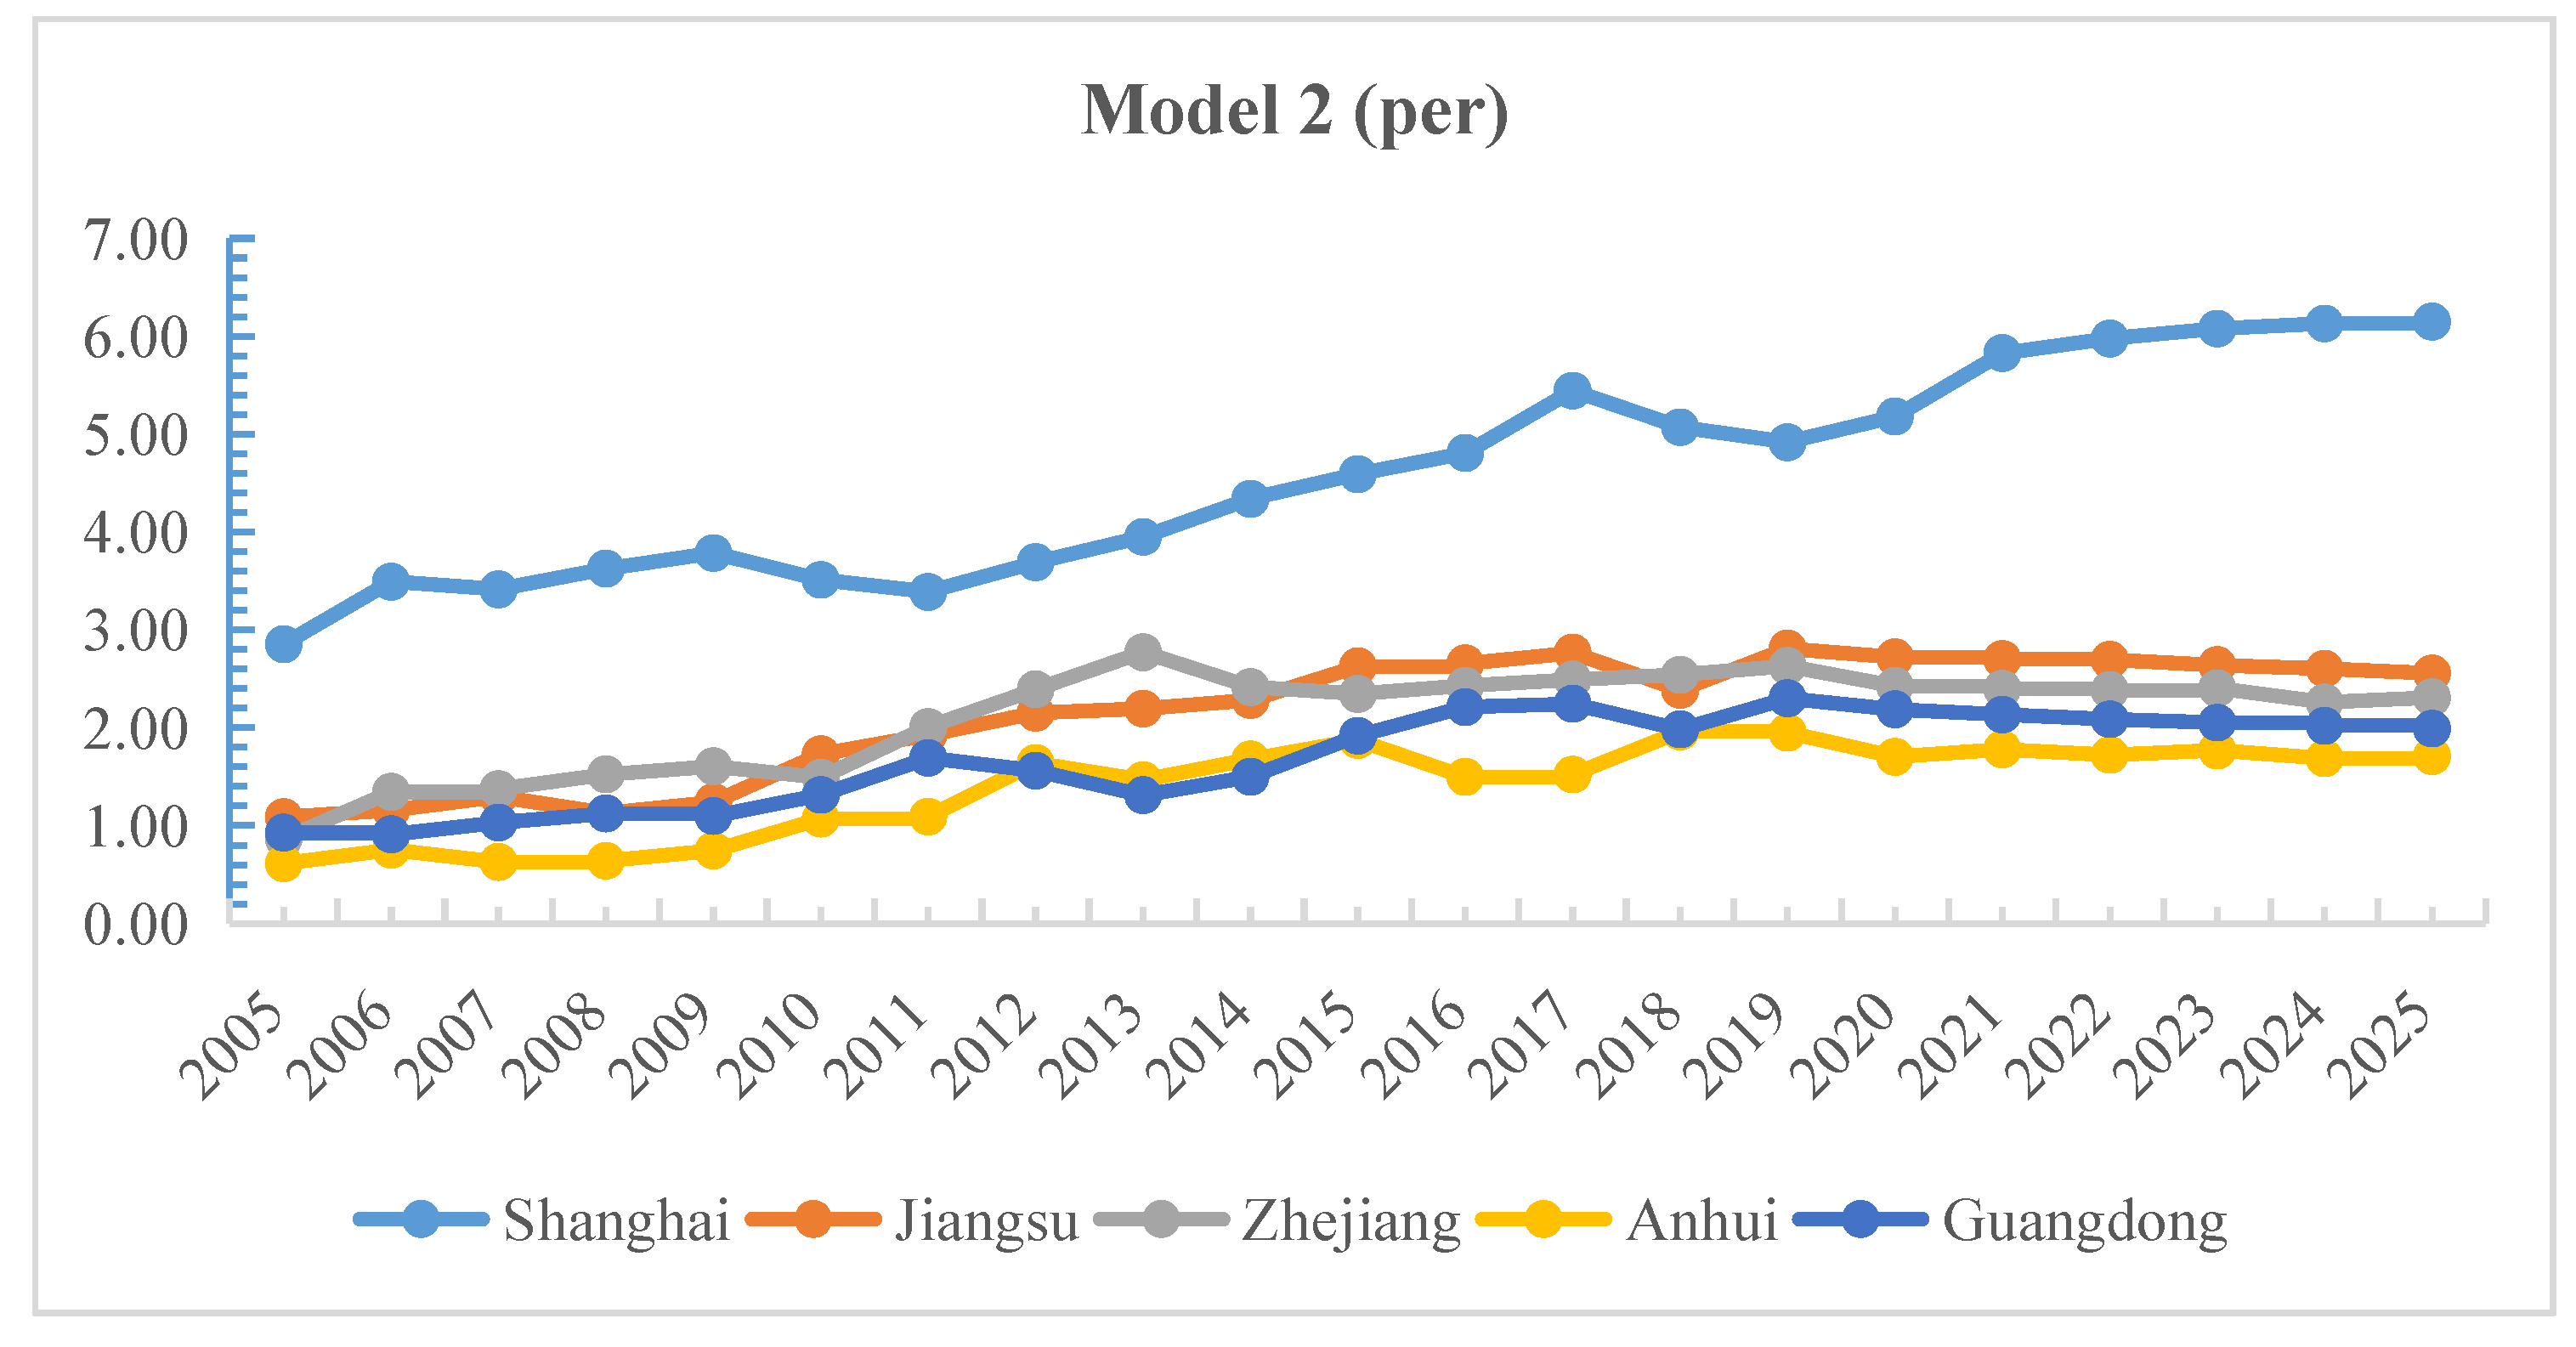
3.3. Comparison with the Forecast Results of Advanced Human Capital Gap in the Yangtze River Delta and the Guangdong–Hong Kong–Macao Greater Bay Area
4. Conclusions and Discussion
Author Contributions
Funding
Institutional Review Board Statement
Informed Consent Statement
Data Availability Statement
Conflicts of Interest
References
- Chen, Y.; Toda, T. The Economic Development and Regional Difference of the Yangtze River Delta. Stud. Reg. Sci. 2000, 31, 107–134. [Google Scholar] [CrossRef]
- Zhen, Y.; Qingjian, Z. Research on the Coordinated Governance Mechanism of Cross-Regional and Cross-Basin Ecological Compensation in the Yangtze River Delta. Int. J. Environ. Res. Public Health 2022, 19, 9881. [Google Scholar]
- Beyer, L. Training and Educating: A Critique of Technical-Mindedness in Teacher Preparation. Curr. Issues Educ. 2016, 8, 21–40. [Google Scholar]
- Newson, J.A. Industry and Higher Education: Collaboration to Improve Students’ Learning and Training. J. High. Educ. 1992, 63, 344–346. [Google Scholar] [CrossRef]
- Yuan, M.; Thellufsen, J.Z.; Lund, H.; Liang, Y. The first feasible step towards clean heating transition in urban agglomeration: A case study of Beijing-Tianjin-Hebei region. Energy Convers. Manag. 2020, 223, 113282. [Google Scholar] [CrossRef]
- Deng, X. The analysis for Beijing’s service industry and its effects on regional development. SHS Web Conf. 2019, 61, 01035. [Google Scholar]
- Wu, C.; Chen, J. The Current Situation, Problems and Countermeasures of Legal Regulation on the Coordinated Development of Express Industry in Beijing, Tianjin and Hebei. J. Trend Sci. Res. Dev. 2019, 4, 348–357. [Google Scholar]
- Chakraborty, K.; Chakraborty, B. Publisher Correction: Low level equilibrium trap, unemployment, efficiency of education system, child labour and human capital formation. J. Econ. 2018, 125, 105. [Google Scholar] [CrossRef]
- Cristian, O.; Rafael, A.; Priscila, M.; Jorge, F.-C. Environmental impact of the shadow economy, globalisation, and human capital: Capturing spillovers effects using spatial panel data approach. J. Environ. Manag. 2022, 308, 114663. [Google Scholar]
- Chen, Y.; Hu, Y.; Zhang, S.; Mei, X.; Shi, Q. Optimized Erosion Prediction with MAGA Algorithm Based on BP Neural Network for Submerged Low-Pressure Water Jet. Appl. Sci. 2020, 10, 2926. [Google Scholar] [CrossRef]
- Liu, X.; Li, Y.; Zhang, Z.; Wang, Q. Cultural Heritage Resource Development and Industrial Transformation Resource Value Assessment Based on BP Neural Network. Comput. Intell. Neurosci. 2022, 2022, 2288358. [Google Scholar] [CrossRef] [PubMed]
- Casalegno, C.; Pellicelli, M.; Civera, C. CSR and human capital as levers for enhancing shareholder value creation. An early investigation of the largest European companies. Glob. Bus. Econ. Rev. 2017, 19, 448. [Google Scholar] [CrossRef]
- Wang, M.; Xu, M.; Ma, S. Corrigendum to ’The effect of the spatial heterogeneity of human capital structure on regional green total factor productivity’ [Structural Change and Economic Dynamics 59 (2021) 427–441]. Struct. Chang. Econ. Dyn. 2022, 61, 463–466. [Google Scholar] [CrossRef]
- Lucas Robert, E. On the mechanics of economic development. J. Monet. Econ. 1988, 22, 3–42. [Google Scholar] [CrossRef]
- He, S.; Yao, H. Business environment, human capital structural upgrading, and economic development quality. Front. Environ. Sci. 2022, 10, 1707. [Google Scholar] [CrossRef]
- Cinnirella, F.; Streb, J. The role of human capital and innovation in economic development: Evidence from post-Malthusian Prussia. J. Econ. Growth 2017, 22, 193–227. [Google Scholar] [CrossRef]
- Desdoigts, A.; Jaramillo, F. Bounded learning by doing, inequality, and multi-sector growth: A middle-class perspective. Rev. Econ. Dyn. 2020, 36, 198–219. [Google Scholar] [CrossRef]
- Fu, L.; Wang, Y.; He, L. Age composition change and inter-provincial labor productivity: A study from the perspective of population dividend and population urbanization. J. Appl. Econ. 2020, 23, 183–198. [Google Scholar] [CrossRef]
- Liu, Z.; Fang, Y.; Ma, L. A Study on the Impact of Population Age Structure Change on Economic Growth in China. Sustainability 2022, 14, 3711. [Google Scholar] [CrossRef]
- Wang, X. Application of Internet of Things Technology to Promote High-Quality Development of Resource-Based City Industrial Transformation and Upgrading Demonstration Areas. Mob. Inf. Syst. 2022, 2022, 1–14. [Google Scholar] [CrossRef]
- Bian, Y.; Song, K.; Bai, J. Impact of Chinese market segmentation on regional collaborative governance of environmental pollution: A new approach to complex system theory. Growth Chang. 2020, 52, 283–309. [Google Scholar] [CrossRef]
- Wang, C.; Zhan, J.; Zhang, F.; Liu, W.; Twumasi-Ankrah, M.J. Analysis of urban carbon balance based on land use dynamics in the Beijing-Tianjin-Hebei region, China. J. Clean. Prod. 2021, 281, 125138. [Google Scholar] [CrossRef]
- Liang, P.; Xie, S.; Qi, F.; Huang, Y.; Wu, X. Environmental Regulation and Green Technology Innovation under the Carbon Neutrality Goal: Dual Regulation of Human Capital and Industrial Structure. Sustainability 2023, 15, 2001. [Google Scholar] [CrossRef]
- Wu, Y. Focusing on the new proposition of human capital and the coordinated development of Beijing-Tianjin-Hebei—The Research on the Path of Human Capital accumulation in Hebei Province under the Background of the Coordinated Development of Beijing-Tianjin-Hebei. Hebei Acad. J. 2018, 38, 226. [Google Scholar]
- Xiao, Z.; Li, H.; Gao, Y. Analysis of the impact of the Beijing-Tianjin-Hebei coordinated development on environmental pollution and its mechanism. Environ. Monit. Assess. 2022, 194, 91. [Google Scholar] [CrossRef]
- You, J.; Xiao, H. Can FDI facilitate green total factor productivity in China? Evidence from regional diversity. Environ. Sci. Pollut. Res. 2022, 29, 49309–49321. [Google Scholar] [CrossRef] [PubMed]
- Zhao, R.; Du, Y. The Impact of Higher Education and Human Capital Quality on “Local-Neighborhood” Economic Growth. Best Evid. Chin. Educ. 2021, 8, 1041–1057. [Google Scholar] [CrossRef]
- Mao, J.; Liu, J. Analysis of the spatial and temporal evolution and influencing factors of human capital in the 20 years of Western Development. Ind. Technol. Econ. 2022, 41, 37–45. [Google Scholar]
- Liu, B.; Zeng, J.; Liang, L.; Li, Q. Evolution of the spatial pattern of the distribution of science and technology talents and its driving factors in the Beijing-Tianjin-Hebei region. Tech. Econ. 2018, 37, 86–92+123. [Google Scholar]
- Delong, H.; Shausen, Z. Take Jiangxi province as an example. Jiangxi Soc. Sci. 2007, 242, 230–235. [Google Scholar]
- Guo, Z.; Duan, M. Research on human capital supply and demand prediction in China. Stat. Decis. -Mak. 2014, 409, 114–116. [Google Scholar]
- Xie, Q.; Cai, Y. Analysis of the supply and demand situation of educational human capital in China during the 14th Five-Year Plan period. Hum. Resour. Dev. China 2020, 37, 17–33. [Google Scholar]
- Aigner, D.; Lovell, C.A.K.; Schmidt, P. Formulation and estimation of stochastic frontier production function models. J. Econom. 1977, 6, 21–37. [Google Scholar] [CrossRef]
- Charnes, A.; Cooper, W.W.; Rhodes, E. Measuring the efficiency of decision making units. Eur. J. Oper. Res. 1978, 2, 429–444. [Google Scholar] [CrossRef]
- Yuan, R.; Liao, H.; Wang, J. A nexus study of carbon emissions and financial development in China using the decoupling analysis. Environ. Sci. Pollut. Res. 2022, 29, 88224–88239. [Google Scholar] [CrossRef] [PubMed]
- Liu, H.; Xiong, W.; Mottaleb, K.A.; Krupnik, T.J.; Burgueño, J.; Pequeno, D.N.; Wu, W. Contrasting contributions of five factors to wheat yield growth in China by process-based and statistical models. Eur. J. Agron. 2021, 130, 126370. [Google Scholar] [CrossRef]
- Attanasio, O.; Cattan, S.; Fitzsimons, E.; Meghir, C.; Rubio-Codina, M. Estimating the Production Function for Human Capital: Results from a Randomized Controlled Trial in Colombia. Am. Econ. Rev. 2020, 110, 48–85. [Google Scholar] [CrossRef]
- Cvetanovic, S.; Filipovic, M.; Nikolic, M.; Belovic, D. Endogenous growth theory and regional development policy. Spatium 2015, 2015, 10–17. [Google Scholar] [CrossRef]
- Kumar, A.; Kober, B. Urbanization, human capital, and cross-country productivity differences. Econ. Lett. 2012, 117, 14–17. [Google Scholar] [CrossRef]
- Ahmed, Z.; Asghar, M.M.; Malik, M.N.; Nawaz, K. Moving towards a sustainable environment: The dynamic linkage between natural resources, human capital, urbanization, economic growth, and ecological footprint in China. Resour. Policy 2020, 67, 101677. [Google Scholar] [CrossRef]
- Mohanmed, M.M.A.; Liu, P.F.; Nie, G.H. Causality between Technological Innovation and Economic Growth: Evidence from the Economies of Developing Countries. Sustainability. 2022, 14, 3586. [Google Scholar] [CrossRef]
- Romer, P. Increasing Returns and Long-Run Growth. J. Polit. Econ. 1986, 94, 1002–1037. [Google Scholar] [CrossRef]
- Wu, H. The contribution of interregional and inter-field knowledge spillovers to regional Smart Specialisation. Reg. Stud. 2023, 57, 356–369. [Google Scholar] [CrossRef]
- Moretti, E. Workers’ Education, Spillovers, and Productivity: Evidence from Plant-Level Production Functions. Am. Econ. Rev. 2004, 94, 656–690. [Google Scholar] [CrossRef]
- Li, G.; Zhao, G.; Li, C. The relationship between rural human capital level and urban-rural income gap—Take Small Northwest as an example. Financ. Theory Pract. 2013, 34, 97–101. [Google Scholar]
- Liang, W.; Lu, M. Cities in the post-industrial era: The microscopic evidence of urban size influencing the externality of human capital in the service industry. Econ. Res. 2016, 51, 90–103. [Google Scholar]
- Wu, Y.; Liu, Y.; Li, Y. Spatio-temporal coupling characteristics and driving mechanism of population and land urbanization in China. J. Geogr. 2018, 73, 1865–1879. [Google Scholar]
- Wang, Z.; Zhang, X. Path selection for the high-quality development of Chinese small towns in the Post-industrial period. China Ind. Econ. 2019, 370, 62–80. [Google Scholar]
- Du, X.; Zhang, Y. The dynamic decomposition of China’s urbanization rate increase and the trend prediction of the new development stage —A new method based on international comparison. Stat. Study 2022, 39, 33–47. [Google Scholar]
- Zhang, J.; Wu, G.; Zhang, J. Estimation of inter-provincial material capital stock in China: 1952–2000. Econ. Res. 2004, 10, 35–44. [Google Scholar]
- Sun, Z.; Zhang, J. Research on Prediction of Housing Prices Based on GA-PSO-BP Neural Network Model: Evidence from Chongqing, China. Int. J. Found. Comput. Sci. 2022, 33, 805–818. [Google Scholar] [CrossRef]
- Dong, Z.W.; Yi, Q.C.; Ying, H.N.; Xiang, K.Y.; Ya, Z.Z.; Wei, L.Y. Research on Chlorophyll-a Concentration Retrieval Based on BP Neural Network Model—Case Study of Dianshan Lake, China. Sustainability 2022, 14, 8894. [Google Scholar]
- Lu, Y.; Li, Z.; Zhao, X.; Lv, S.; Wang, X.; Wang, K.; Ni, H. Recognition of Rice Sheath Blight Based on a Backpropagation Neural Network. Electronics 2021, 10, 2907. [Google Scholar] [CrossRef]
- Xu, M.; Zheng, Y.; Li, Y.; Wu, W. Prediction of antibreast drug properties based on PSO-BP neural network and PSO-SVM. J. Nanjing Univ. Inf. Sci. Technol. 2023, 15. [Google Scholar]
- Li, N.; Li, M. Forecast of Chemical Export Trade Based on PSO-BP Neural Network Model. J. Math. 2022, 2022, 1487746. [Google Scholar] [CrossRef]
- Lin, Z. Poverty belt around Beijing” looks forward to “special economic Zone. China Secur. J. 2010, 17, A10. [Google Scholar]
- He, R.; Fan, J.; Li, G.Q. The spatial and temporal evolution and formation mechanism of the poverty belt around Beijing and Tianjin. Econ. Geogr. 2018, 38, 1–9. [Google Scholar]


| Var | Obs | Mean Value | Standard Deviation | Variance | Minimum Value | Maximal Value | Median | One Quartile | Three Quartiles |
|---|---|---|---|---|---|---|---|---|---|
| LnHHC | 450 | 8.6456 | 0.8000 | 0.6340 | 6.2574 | 10.1859 | 8.7507 | 8.2727 | 9.1802 |
| LnGDP | 450 | 9.1382 | 0.9196 | 0.8457 | 6.2977 | 11.0963 | 9.2306 | 8.6545 | 9.7671 |
| LnPL | 450 | 9.1382 | 1.6327 | 2.6656 | 4.3694 | 13.1757 | 9.4252 | 8.2522 | 10.5976 |
| LnUR | 450 | 3.9583 | 0.2491 | 0.6205 | 3.2910 | 4.4954 | 3.9581 | 3.8024 | 4.0993 |
| LnCS | 450 | 10.6048 | 0.8547 | 0.7306 | 8.2141 | 12.4174 | 10.7281 | 10.0015 | 11.2145 |
| ALS | 450 | 4.2155 | 1.9943 | 3.9774 | 2.2048 | 17.1814 | 3.6123 | 3.1232 | 4.5977 |
| LnHHC | Model 1 | Model 2 |
|---|---|---|
| ALS | 0.0282 ** (−0.0107) | |
| LnGDP | 0.0134 (−0.1138) | |
| LnPL | 0.0432 * (−0.0238) | 0.0423 * (−0.0239) |
| LnUR | 0.4822 *** (−0.1217) | 0.6485 *** (−0.1377) |
| LnCS | −0.0115 (−0.044) | |
| _CON | 6.3077 *** (−0.644) | 5.2724 *** (−0.6252) |
| IF | Yes | Yes |
| TF | Yes | Yes |
| R2 | 0.9774 | 0.9776 |
| p (p > F) | 0 | 0 |
| Province | Model 1 | Model 2 | ||
|---|---|---|---|---|
| MAPE | MAPE | |||
| Beijing | 5.09% | 0.11 | 1.19% | 0.11 |
| Tianjin | 2.40% | 0.14 | 0.56% | 0.06 |
| Hebei | 5.99% | 0.55 | 4.42% | 0.81 |
| Advanced Level of Human Capital | Advanced Human Capital Level (Per Capita) | ||||||
|---|---|---|---|---|---|---|---|
| Year | Beijing | Tianjin | Hebei | Beijing | Tianjin | Hebei 1 | |
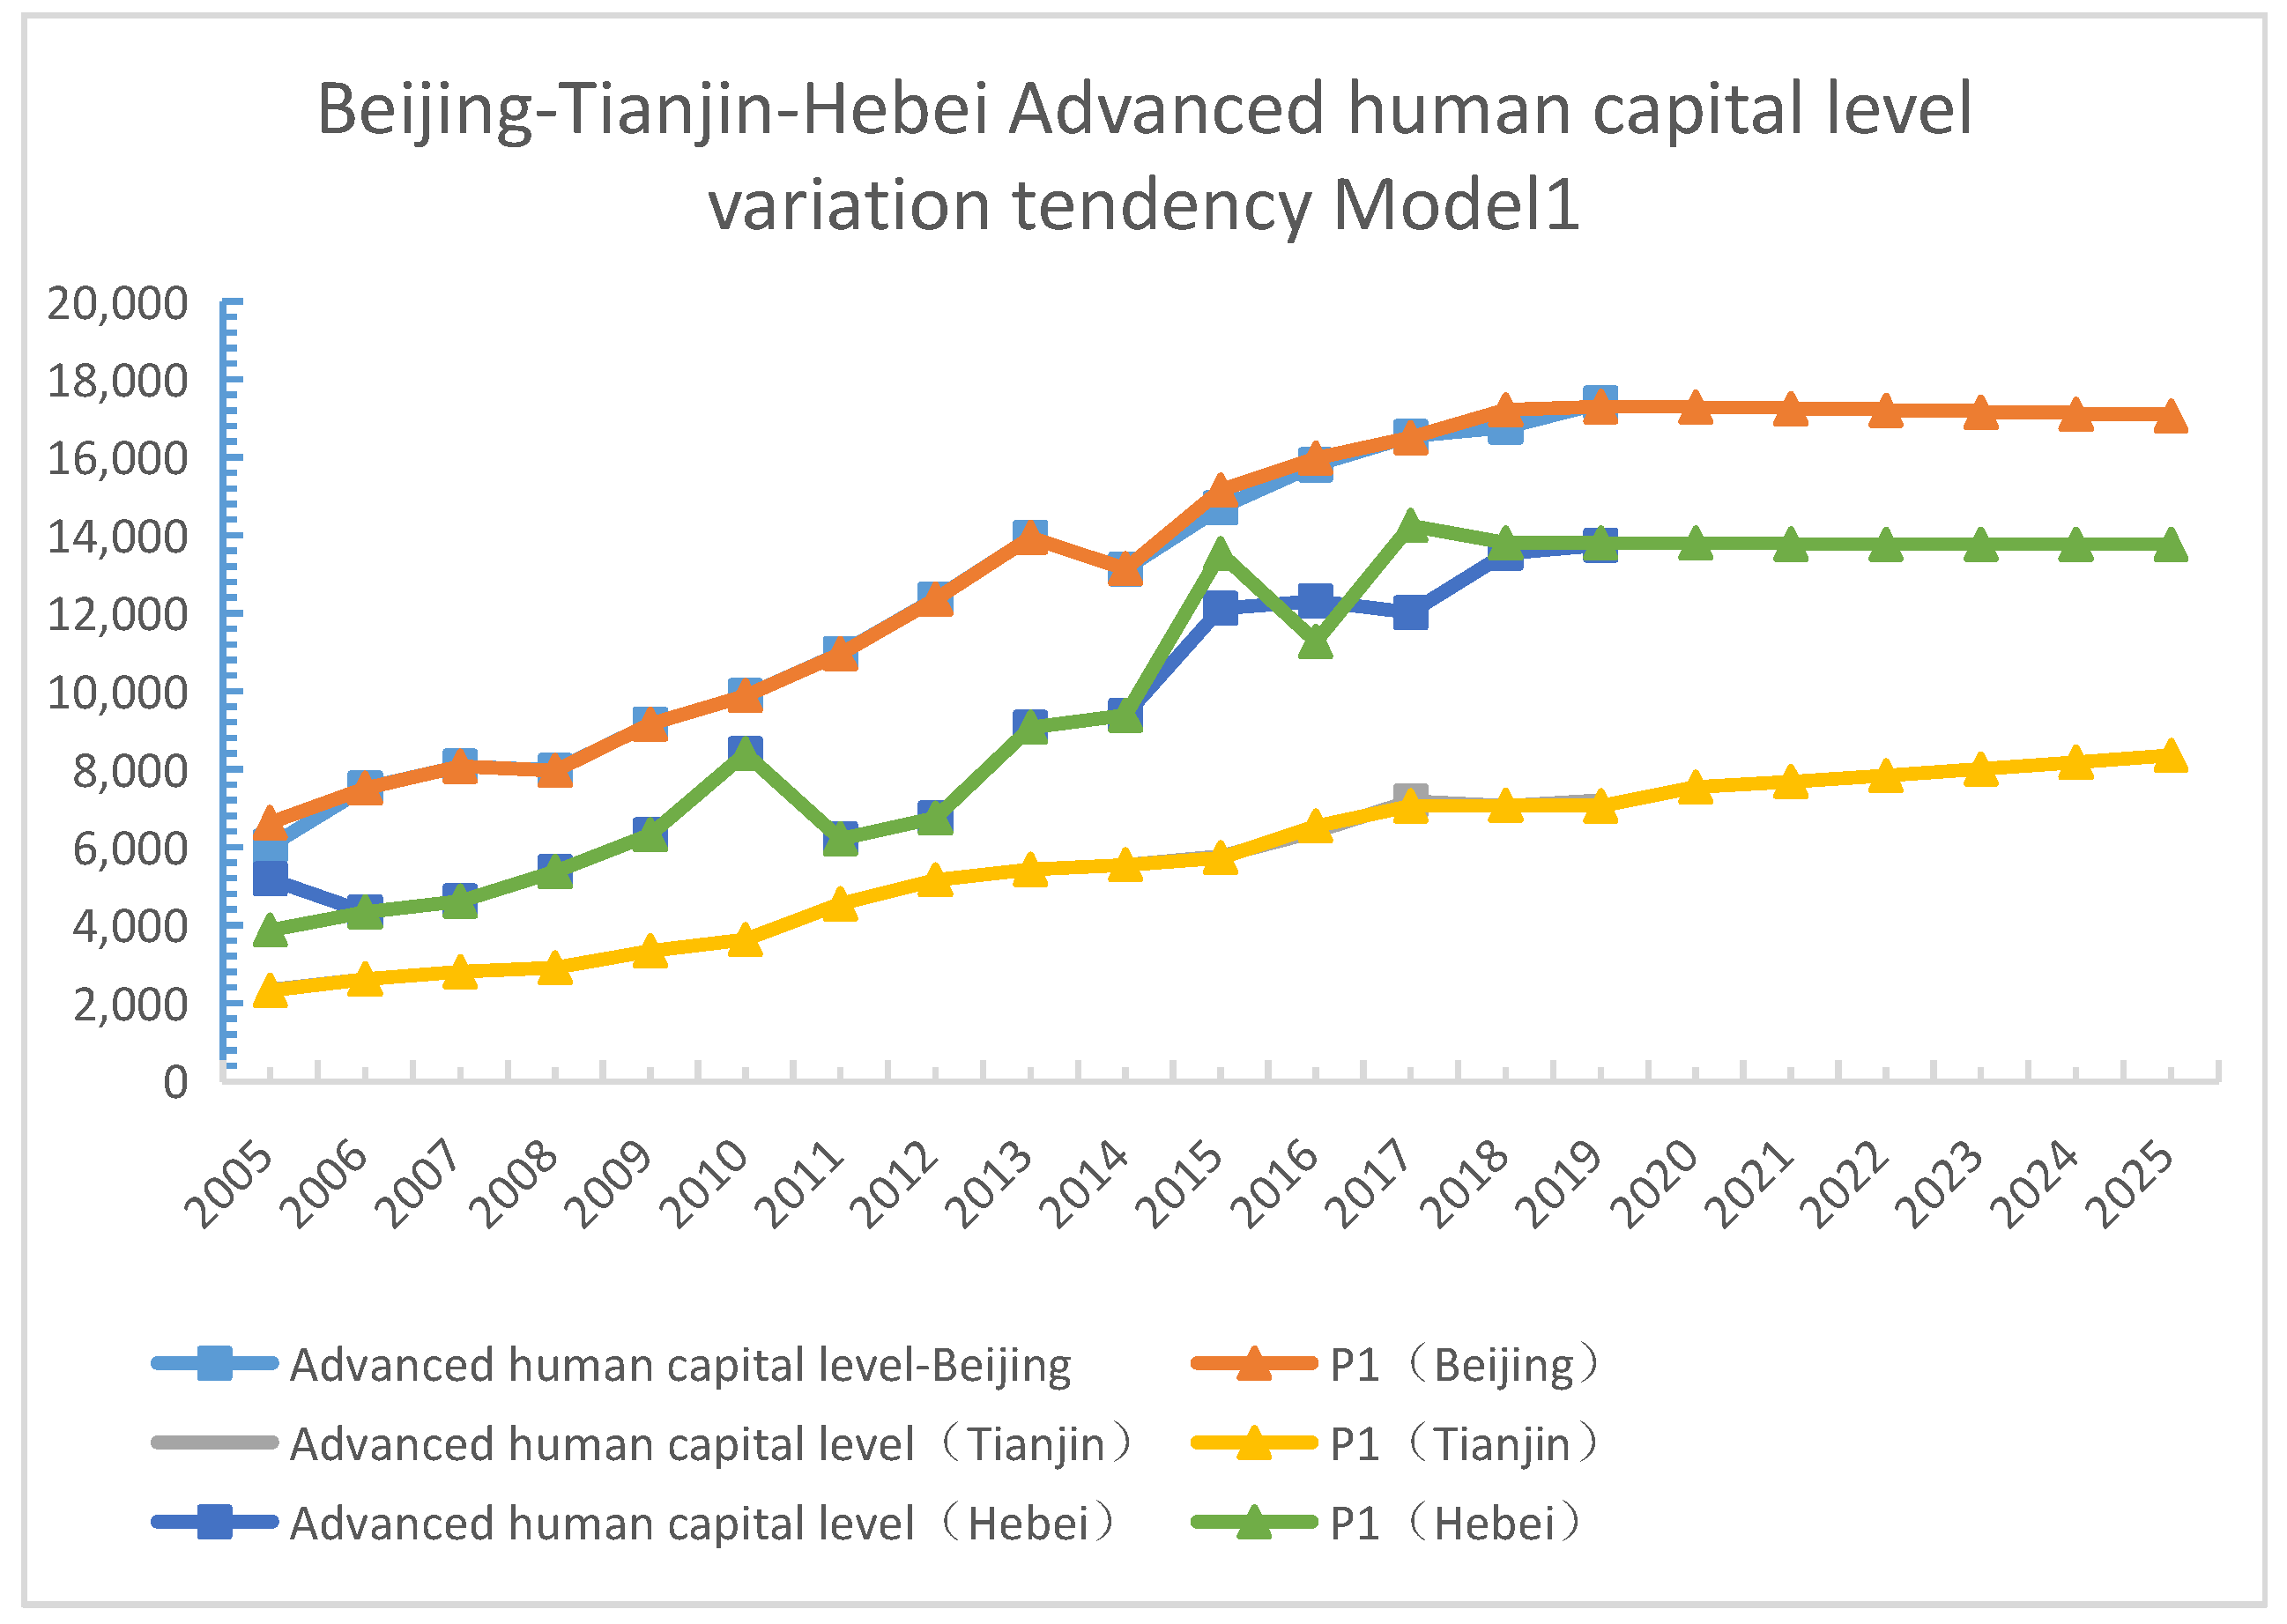
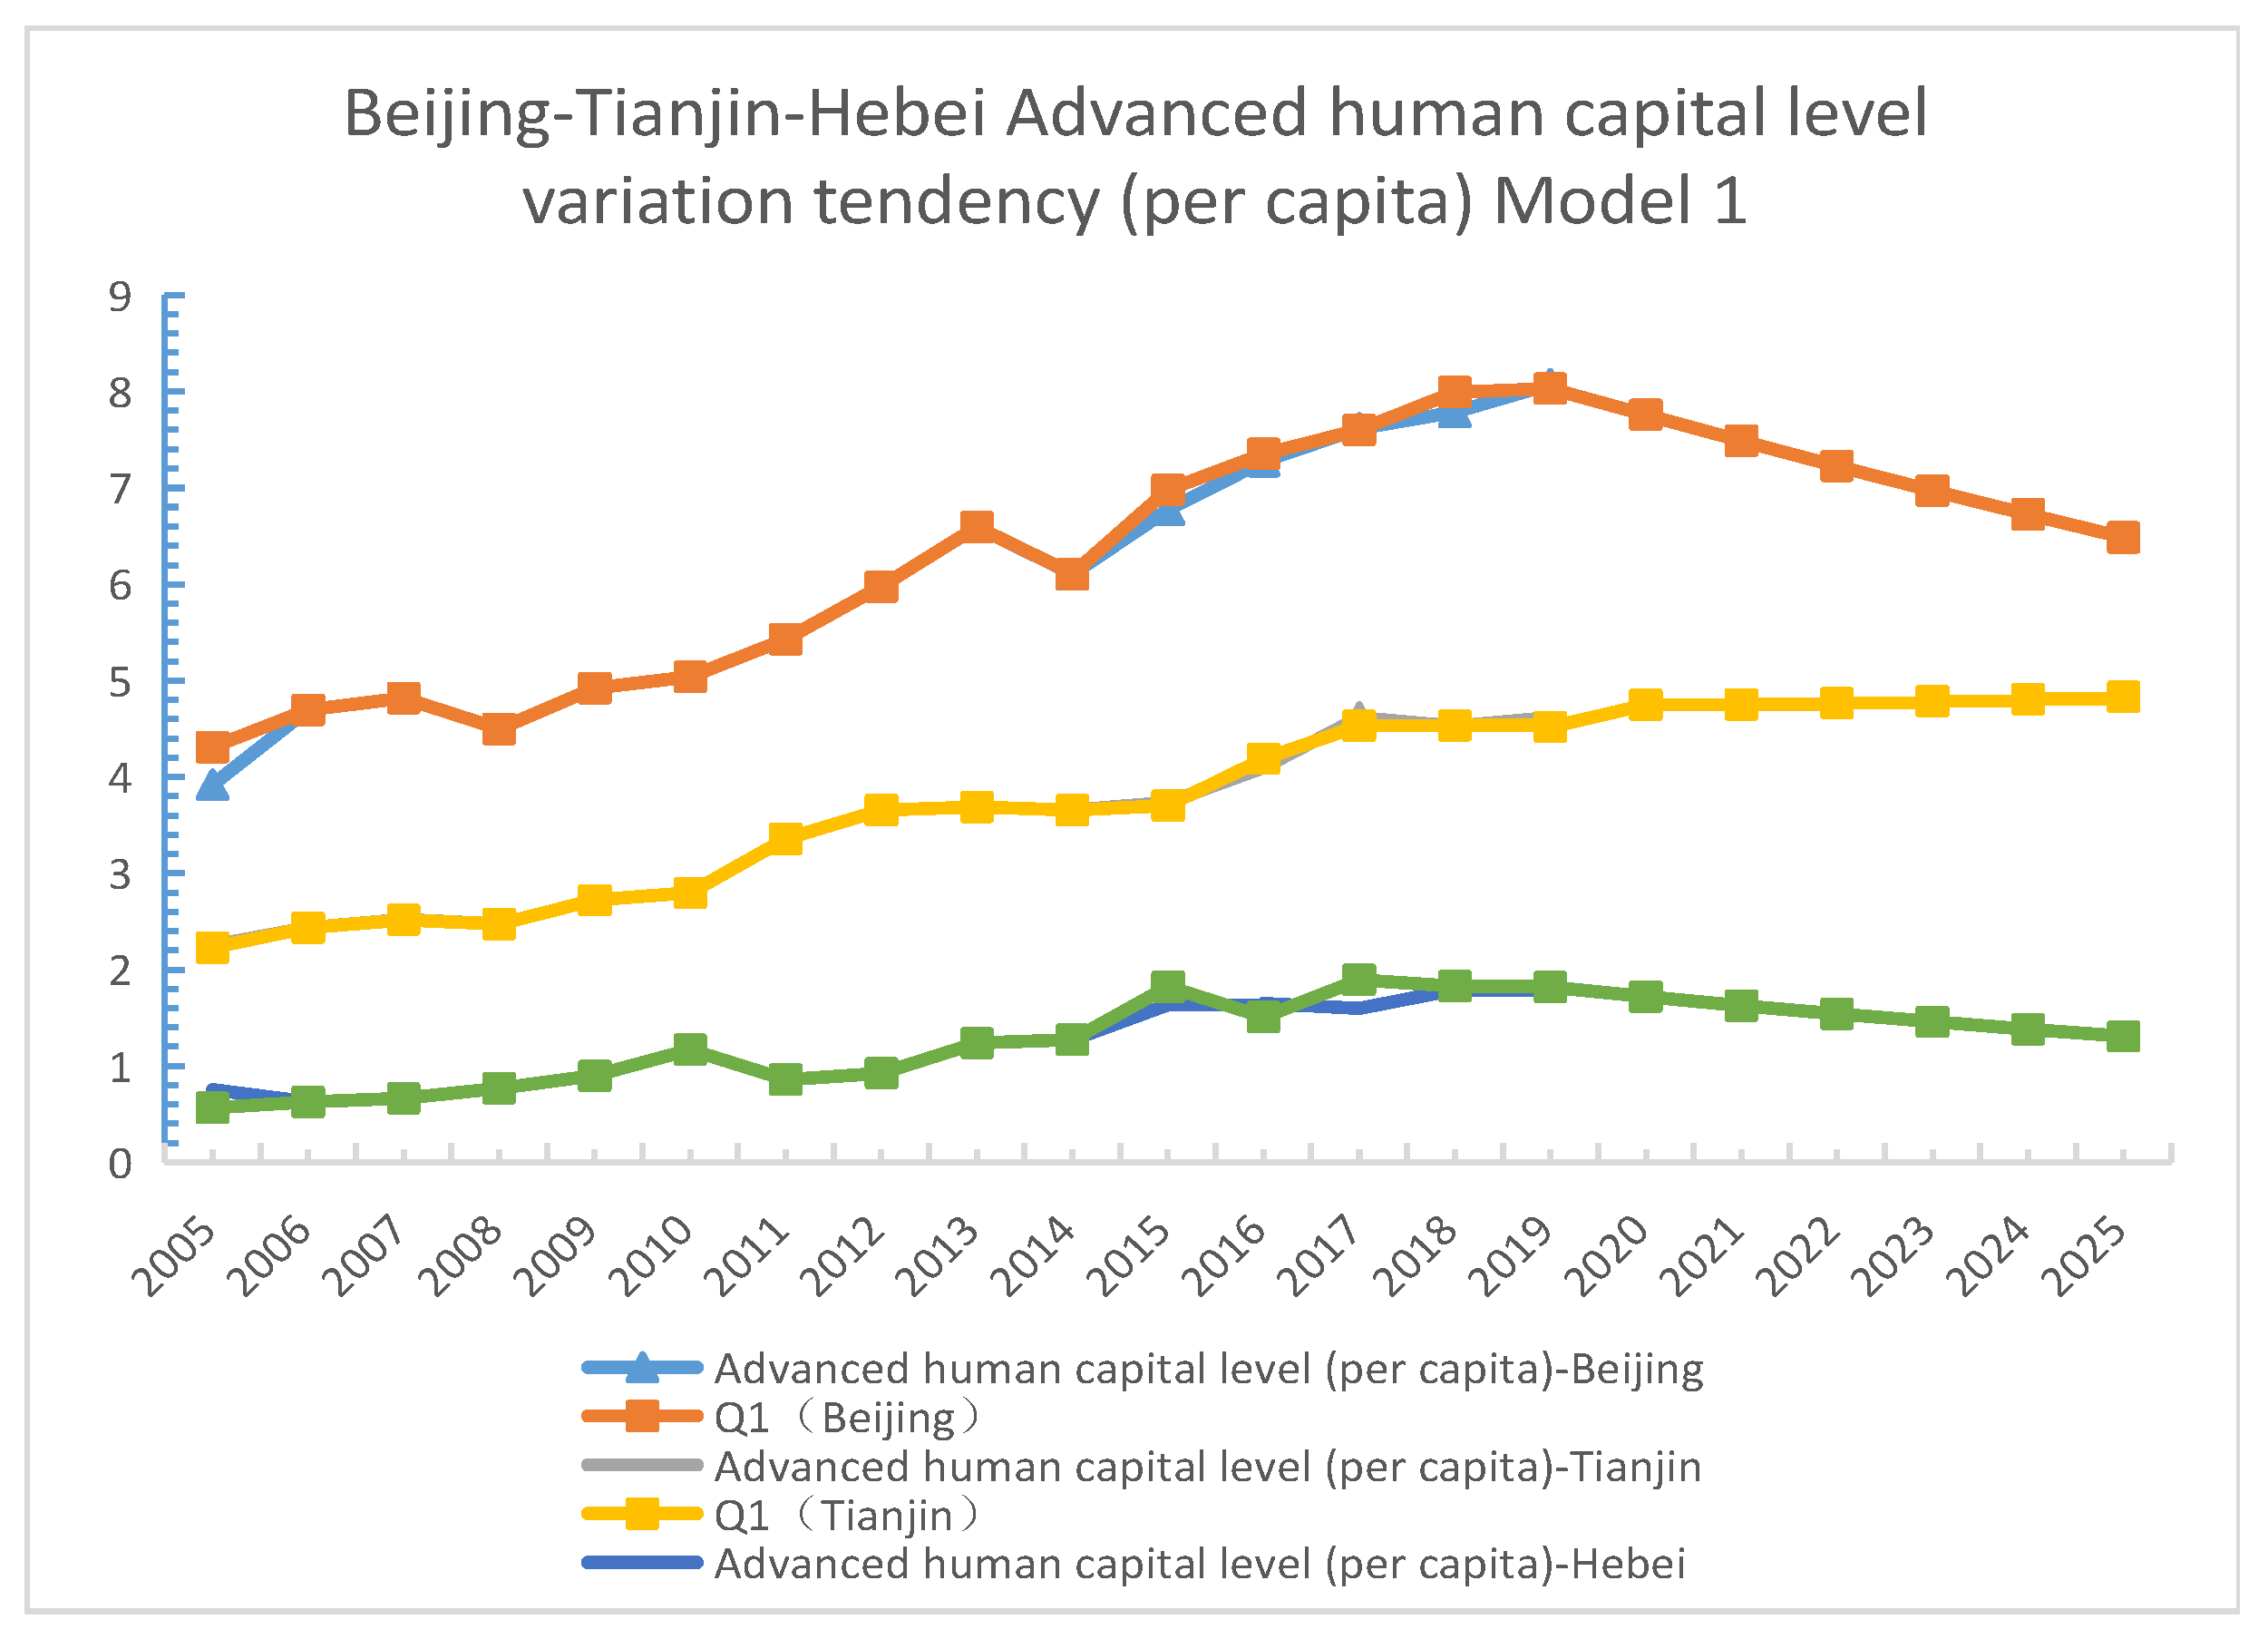
| Model 1 | 2020 | 17,516.69 | 7530.93 | 13,584.61 | 7.87 | 4.74 | 1.69 |
| 2021 | 18,451.41 | 7733.38 | 13,669.25 | 8.02 | 4.79 | 1.61 | |
| 2022 | 19,251.92 | 7826.98 | 13,808.05 | 8.09 | 4.76 | 1.54 | |
| 2023 | 19,666.50 | 7867.69 | 13,898.24 | 7.99 | 4.71 | 1.47 | |
| 2024 | 19,815.89 | 7884.59 | 13,943.63 | 7.79 | 4.64 | 1.40 | |
| 2025 | 19,858.93 | 7890.04 | 13,962.88 | 7.55 | 4.56 | 1.33 | |
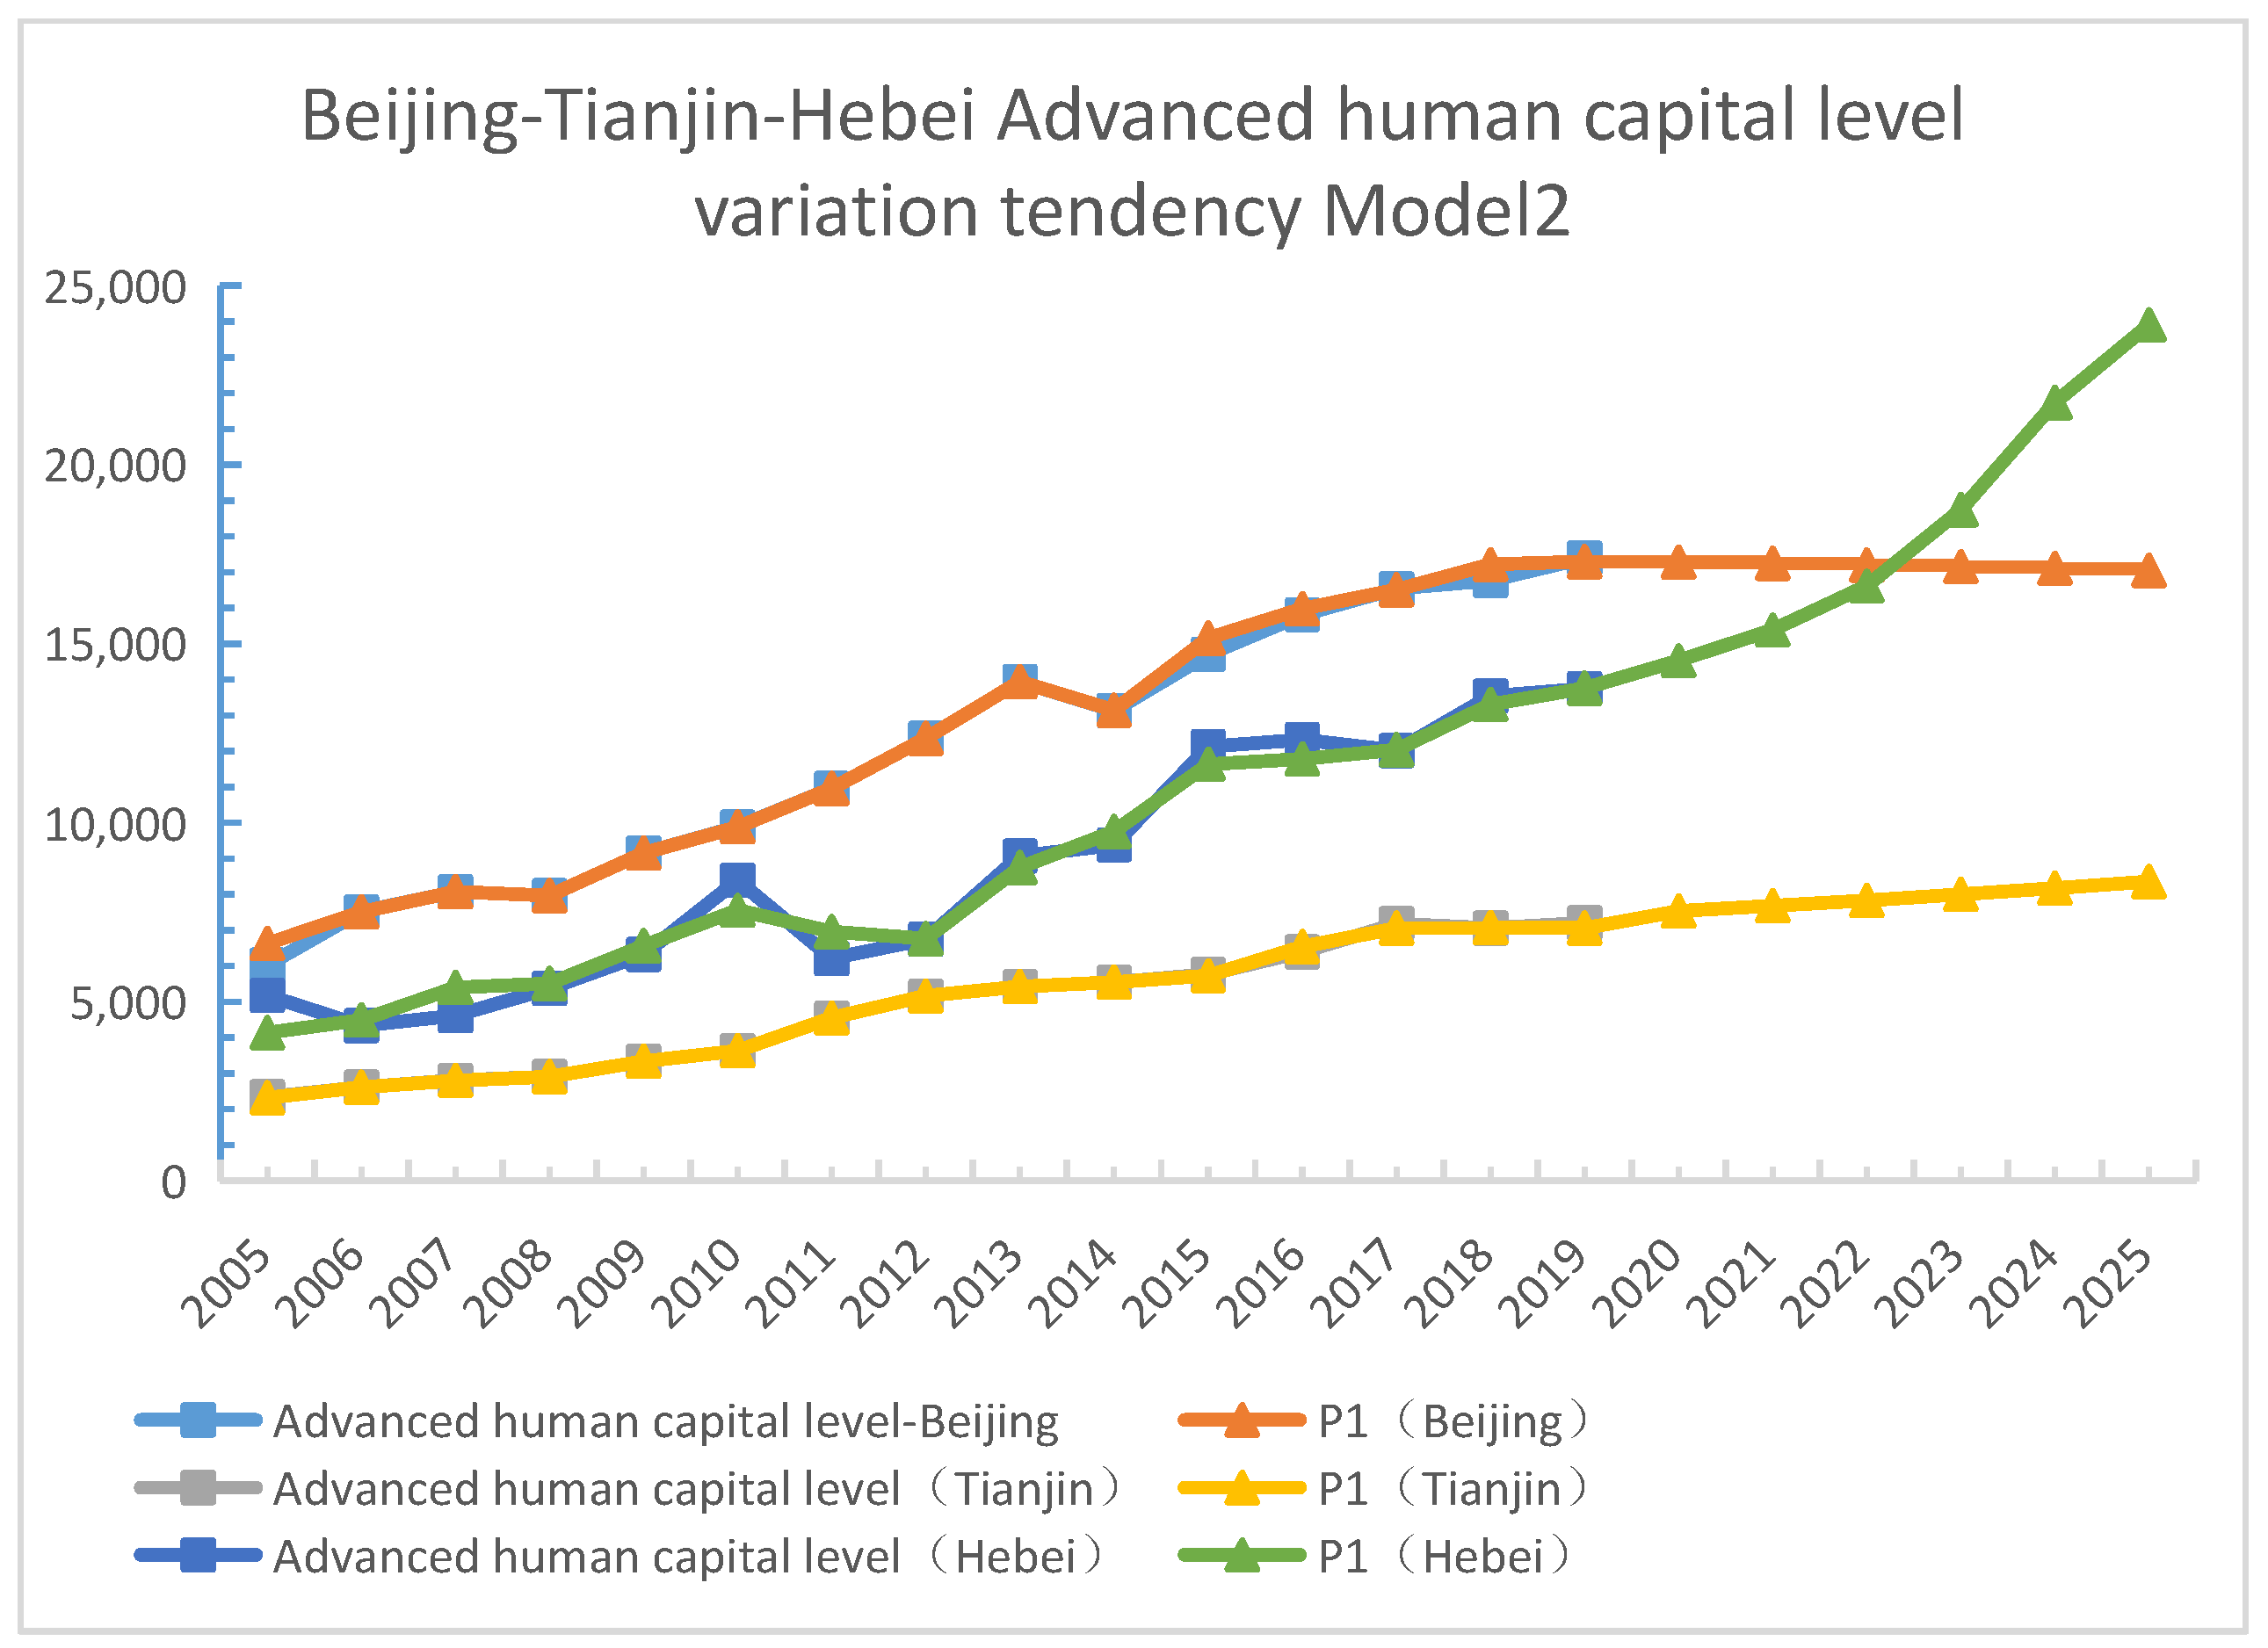
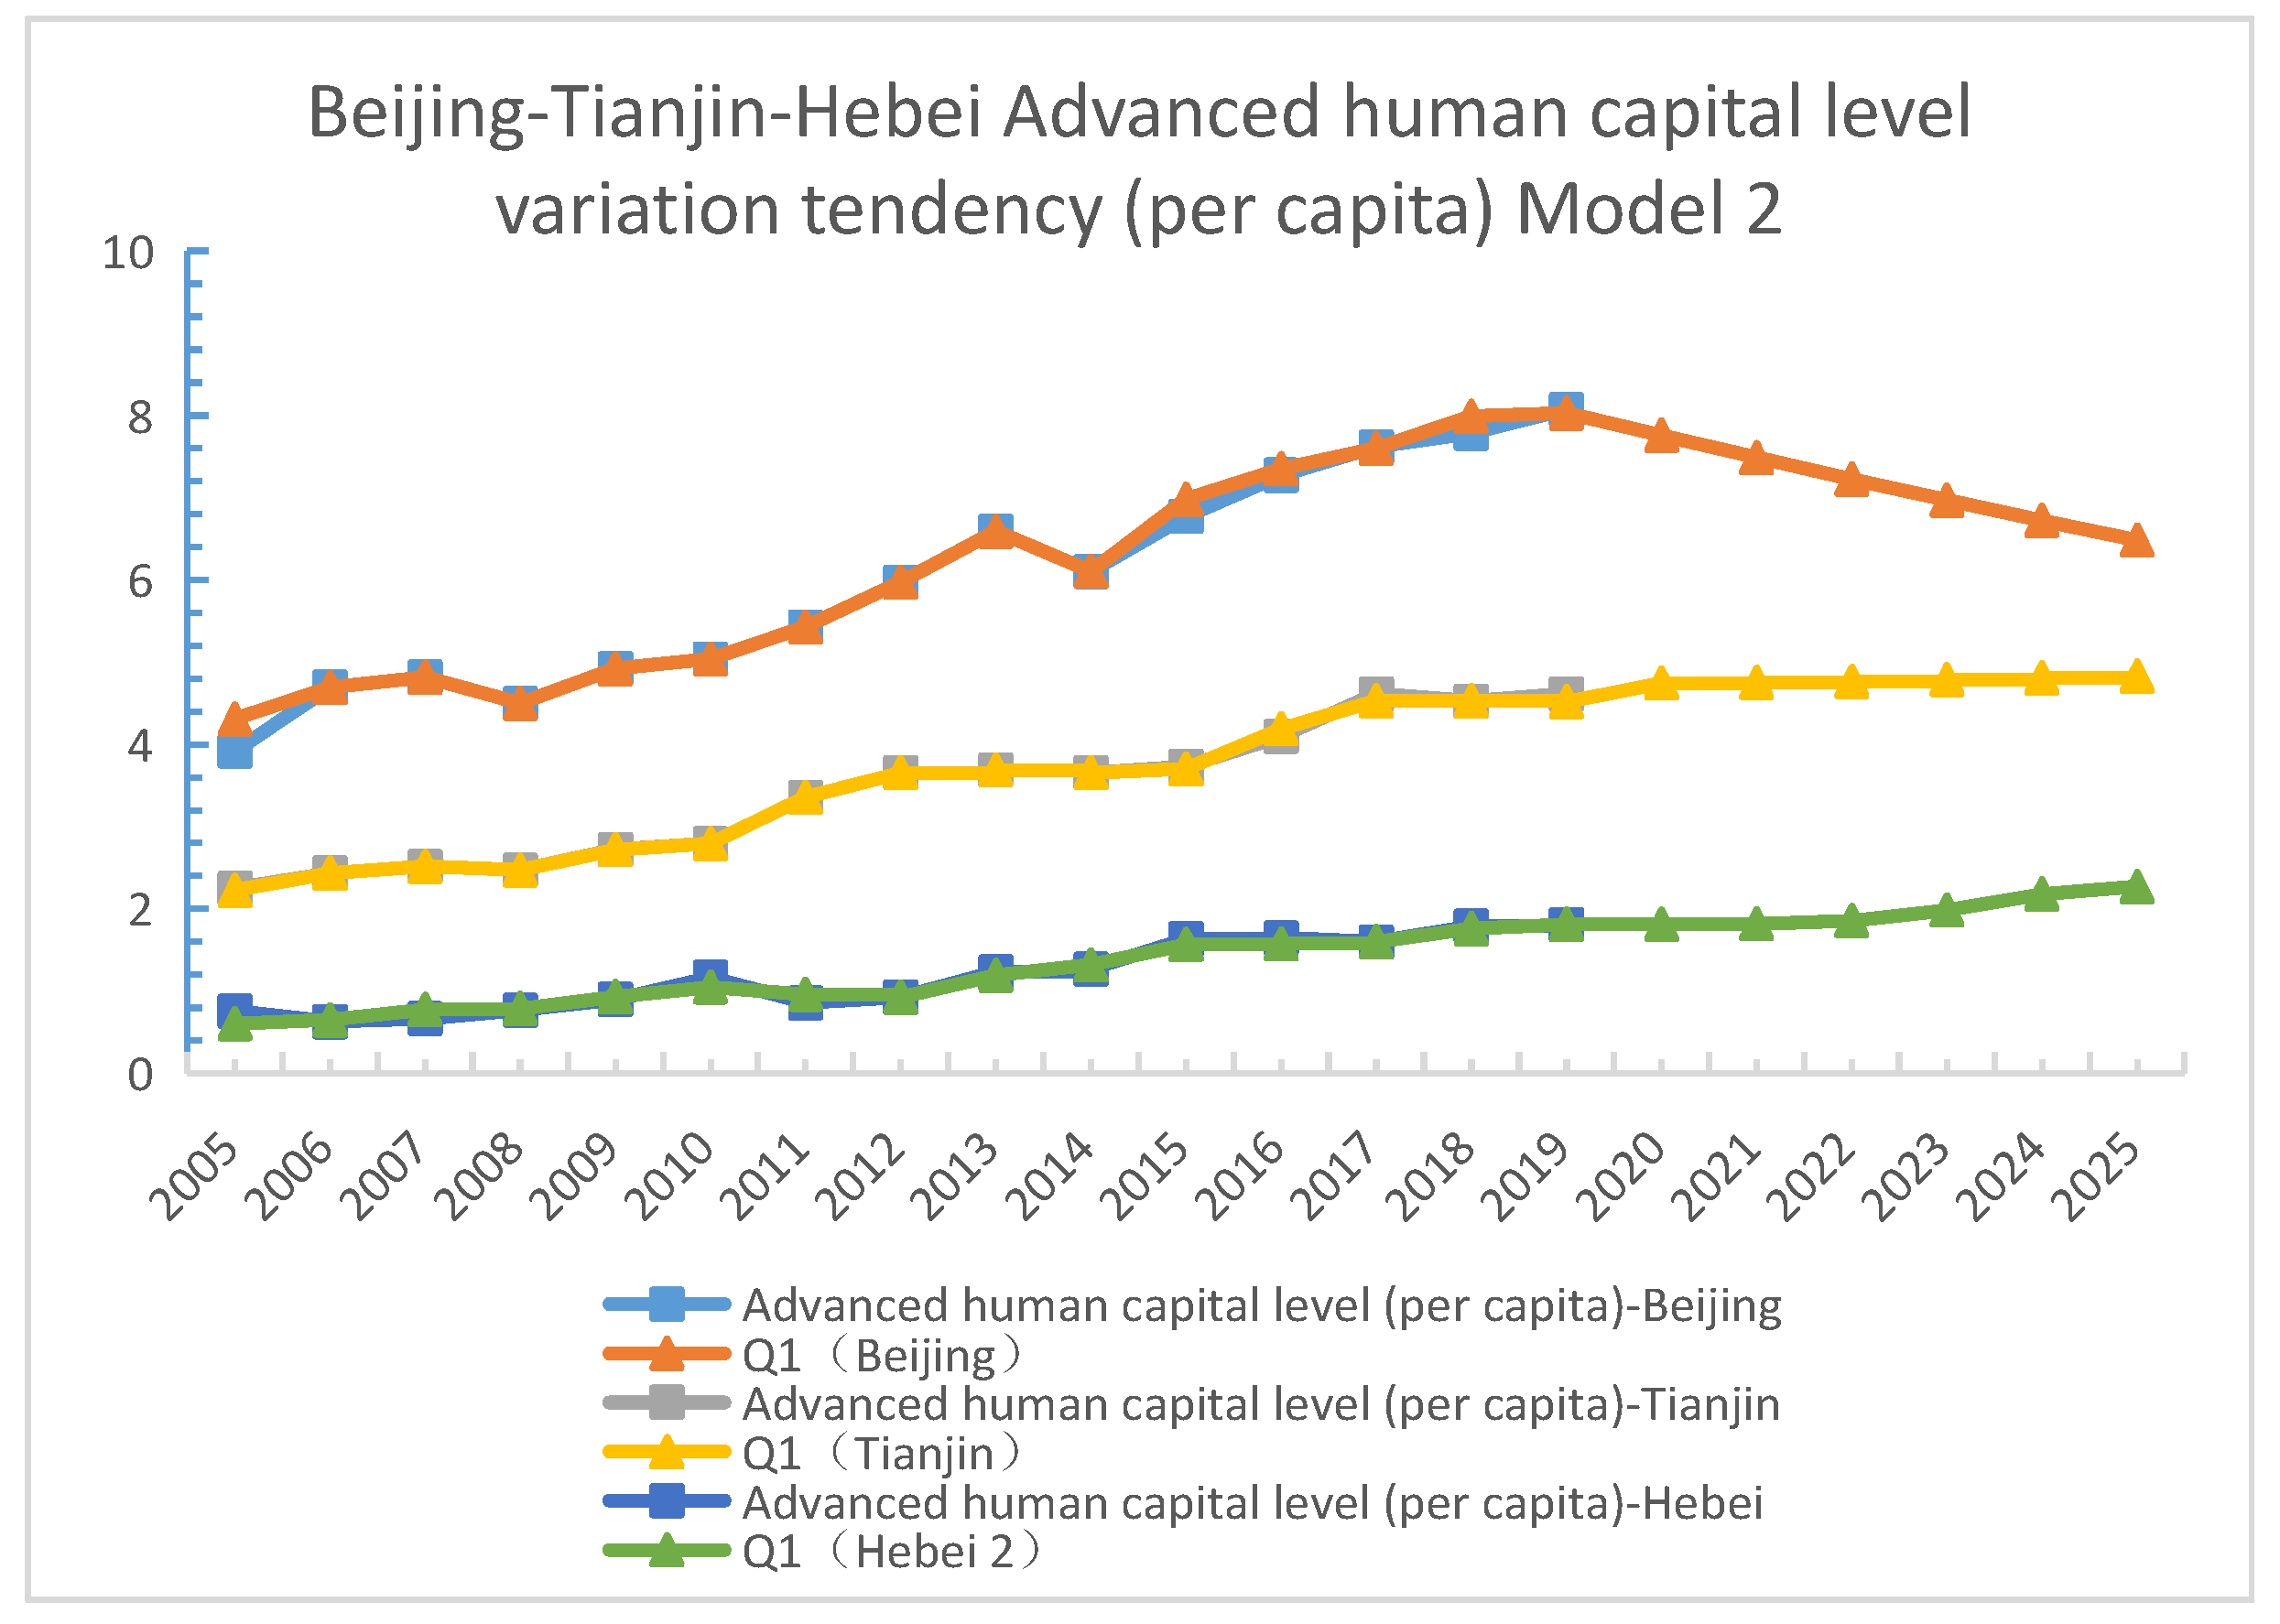
| Model 2 | 2020 | 17,276.57 | 7541.79 | 13,795.87 | 7.76 | 4.75 | 1.72 |
| 2021 | 17,239.43 | 7682.66 | 13,772.42 | 7.49 | 4.75 | 1.63 | |
| 2022 | 17,196.79 | 7836.22 | 13,768.24 | 7.23 | 4.77 | 1.54 | |
| 2023 | 17,150.76 | 8002.29 | 13,767.39 | 6.97 | 4.79 | 1.46 | |
| 2024 | 17,101.88 | 8177.06 | 13,767.19 | 6.72 | 4.81 | 1.38 | |
| 2025 | 17,051.35 | 8355.89 | 13,767.14 | 6.49 | 4.83 | 1.31 | |
| Province | Model (1) | Model (2) | ||
|---|---|---|---|---|
| MAPE (%) | RMSE (103) | MAPE (%) | RMSE (103) | |
| Shanghai | 2.70% | 0.30 | 3.63% | 0.43 |
| Jiangsu | 3.94% | 0.75 | 3.69% | 0.69 |
| Zhejiang | 2.66% | 0.32 | 3.24% | 0.52 |
| Anhui | 9.52% | 0.81 | 8.81% | 0.79 |
| Guangdong | 4.55% | 1.12 | 3.76% | 0.92 |
| Total | Year | Shanghai | Jiangsu | Zhejiang | Anhui | Guangdong |
|---|---|---|---|---|---|---|
| Model (1) | 2020 | 12,032 | 21,688 | 14,910 | 12,719 | 27,022 |
| 2021 | 11,888 | 22,110 | 14,907 | 14,004 | 26,372 | |
| 2022 | 11,765 | 22,511 | 14,906 | 14,591 | 28,722 | |
| 2023 | 11,604 | 22,839 | 14,908 | 15,359 | 27,882 | |
| 2024 | 11,413 | 23,069 | 14,865 | 15,614 | 26,384 | |
| 2025 | 11,208 | 23,208 | 14,877 | 15,888 | 23,687 | |
| Model (2) | 2020 | 12,597 | 22,033 | 14,394 | 10,948 | 25,604 |
| 2021 | 14,189 | 21,933 | 14,425 | 11,538 | 25,359 | |
| 2022 | 14,572 | 21,929 | 14,535 | 11,263 | 25,159 | |
| 2023 | 14,841 | 21,561 | 14,853 | 11,670 | 25,116 | |
| 2024 | 14,987 | 21,325 | 14,168 | 11,238 | 25,111 | |
| 2025 | 15,054 | 20,992 | 14,676 | 11,491 | 25,111 |
| Per | Year | Shanghai | Jiangsu | Zhejiang | Anhui | Guangdong |
|---|---|---|---|---|---|---|
| Model (1) | 2020 | 4.95 | 4.88 | 4.83 | 4.75 | 4.67 |
| 2021 | 2.68 | 2.72 | 2.77 | 2.80 | 2.82 | |
| 2022 | 2.51 | 2.48 | 2.45 | 2.41 | 2.37 | |
| 2023 | 1.98 | 2.16 | 2.23 | 2.33 | 2.35 | |
| 2024 | 2.31 | 2.22 | 2.38 | 2.28 | 2.12 | |
| 2025 | 4.95 | 4.88 | 4.83 | 4.75 | 4.67 | |
| Model (2) | 2020 | 5.18 | 5.83 | 5.98 | 6.08 | 6.13 |
| 2021 | 2.72 | 2.70 | 2.69 | 2.64 | 2.60 | |
| 2022 | 2.43 | 2.40 | 2.38 | 2.40 | 2.26 | |
| 2023 | 1.70 | 1.78 | 1.72 | 1.77 | 1.69 | |
| 2024 | 2.19 | 2.14 | 2.09 | 2.05 | 2.02 | |
| 2025 | 5.18 | 5.83 | 5.98 | 6.08 | 6.13 |
Disclaimer/Publisher’s Note: The statements, opinions and data contained in all publications are solely those of the individual author(s) and contributor(s) and not of MDPI and/or the editor(s). MDPI and/or the editor(s) disclaim responsibility for any injury to people or property resulting from any ideas, methods, instructions or products referred to in the content. |
© 2023 by the authors. Licensee MDPI, Basel, Switzerland. This article is an open access article distributed under the terms and conditions of the Creative Commons Attribution (CC BY) license (https://creativecommons.org/licenses/by/4.0/).
Share and Cite
He, M.; Huang, J.; Sun, R. Forecast of Advanced Human Capital Gap Based on PSO-BP Neural Network and Coordination Pathway: Example of Beijing–Tianjin–Hebei Region. Sustainability 2023, 15, 4671. https://doi.org/10.3390/su15054671
He M, Huang J, Sun R. Forecast of Advanced Human Capital Gap Based on PSO-BP Neural Network and Coordination Pathway: Example of Beijing–Tianjin–Hebei Region. Sustainability. 2023; 15(5):4671. https://doi.org/10.3390/su15054671
Chicago/Turabian StyleHe, Miao, Junli Huang, and Ruyi Sun. 2023. "Forecast of Advanced Human Capital Gap Based on PSO-BP Neural Network and Coordination Pathway: Example of Beijing–Tianjin–Hebei Region" Sustainability 15, no. 5: 4671. https://doi.org/10.3390/su15054671
APA StyleHe, M., Huang, J., & Sun, R. (2023). Forecast of Advanced Human Capital Gap Based on PSO-BP Neural Network and Coordination Pathway: Example of Beijing–Tianjin–Hebei Region. Sustainability, 15(5), 4671. https://doi.org/10.3390/su15054671