Abstract
Buildings and constructions are responsible for a great amount of global energy and energy-related carbon dioxide emissions. Because of these negative impacts, there is an increase in Life cycle assessment research in the construction sector to measure these effects and evaluate the sustainability performances. Life cycle assessment is a tool that can facilitate the decision-making process in the construction sector for material selection, or for the selection of the best environmentally friendly option in the building component level or building level. In this study, a comparative life cycle assessment analysis is conducted among 12 roof coverings of 1 square meter in the 60-year lifetime of a building. Impact categories that are available in environmental product declarations and included in this study are the global warming potential, ozone depletion potential, acidification potential, eutrophication potential, photochemical ozone creation potential, abiotic depletion potential of non-fossils and abiotic depletion potential of fossils resources. To facilitate the decision-making process, panel and monetary weightings are applied to convert environmental product declaration data of seven impact categories into one single-score. Monetary weightings applied in the study are in Euro 2019, differentiating itself from other comparative life cycle assessment studies. The single-score results are ranked and compared. R04 has the best performance for all panel weightings, while for monetary weightings, R03, R07 and R08 have the best performance for EPS, MMG and EVR, respectively. As a result, for 12 roof coverings, the weighted results could not address one single roof-covering material for numerous reasons. Among the weighting methods, panel weighting sets show more similarity in ranking results, while monetary-weighting sets results are more diverse.
1. Introduction
Buildings and constructions are responsible for 36% of global energy and 37% of energy related to carbon dioxide (CO2) emissions. Governments and authorities have regulations to decrease these negative impacts. In 2021, the Global Status Report for Buildings and Construction stated that 81 countries have building energy codes, while 136 countries mentioned buildings in their nationally determined contributions [1]. To measure and decrease these negative effects of buildings, life cycle assessment (LCA) is used as a tool in line with the ISO 14040 [2] as an internationally accepted method. While conducting an LCA analysis, environmental product declarations (EPDs) provide information on the environmental aspects of products as described in ISO 14025 [3] and ISO 21930 [4].
LCA in the built environment facilitates comparing different alternatives of designs in terms of their environmental performances. In the built environment and architecture, the level of analysis varies as the scale changes from material to whole building or in some cases district level. For instance, Wickramaratne [5] studied LCA for building level, Hasik et al. [6] studied LCA for the renovation of a building, Kanafani et al. [7] performed LCA for building in early design stages.
Fazlı [8] compared four building envelope configurations in the building component level and Ottele et al. [9] conducted LCA for green façades and living wall systems. El Bachawati et al. [10] studied vegetative roof LCA for a case study in Lebanon. Zigart et al. [11] studied the LCA of building envelope components for low-rise buildings. Botejara-Antunez et al. [12] studied the roof systems of healthcare buildings.
Regarding the material level, Dogan [13] conducted a material-level LCA using the BEES database for cement-based façade materials. Thiel et al. [14] studied the LCA of pavement types, Gu et al. [15] studied mass timber. Construction materials, such as adobe bricks [16], tiles [17], hempcrete blocks [18], are also subjects for LCA in a built environment to facilitate the decision-making process for a sustainable built environment.
For the roof coverings, Le et al. [19] studied only carbon footprint and embodied energy. Sravani et al. [20] compared passive cooling roof materials for residential buildings in India. Contarini and Meijer [21] conducted LCA for flat roof options. However, a comparative LCA among roof-covering materials, the subject of this study, are not found in the literature.
Single Score and Weighting in LCA
While conducting LCA, whether the generic data [13] or EPD data [22] are used, in the end, interpreting diverging results and drawing conclusions, to decision-makers, is challenging due to the broad variety of environmental impacts studied in the analyses, such as the global warming potential (GWP), ozone depletion potential (ODP), acidification potential (AP), eutrophication potential (EP), photochemical ozone creation potential (POCP), abiotic depletion potential for elements (non-fossil resources) (ADPe), abiotic depletion potential for fossil resources (ADPF), land use, water use, eco-toxicity, noise, human toxicity (cancer and non-cancer) ionizing radiation and particulate matter (PM).
The need of a single score is stated in many studies such as [23,24,25,26]. As stated in Figure 1, in all levels in architecture, decision-makers may desire to make a comparison between or among different alternatives for the construction materials, building components and whole building alternatives. To decide the most sustainable alternative for the related level, LCA must be performed. The results of LCA analyses contain rankings according to impact categories. The number of impact categories studied may change from 7 to 15 or more. For a decision-maker, it is hard to decide on the material or component or the whole building alternative in terms of sustainability with 15 or more variables. As stated in the last row of Figure 1, weighting narrows down the pattern of options from matrices to a single item.
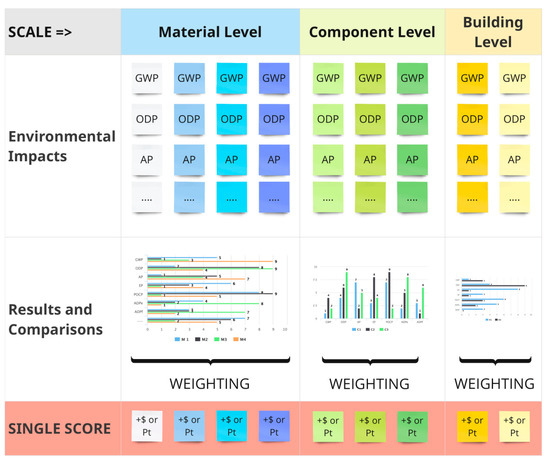
Figure 1.
Weighting applied in different levels in built environment.
Weighting is a method used in LCA as an optional step in ISO 14040/44 [2,27] due to the inclusion of value choices. Even if it is optional and requires value choices, it is widely used to provide insights to decision-makers in the construction sector, architects, civil engineers, investors, real estate developers, project owners, etc. There are a few weighting methods and many weighting sets developed and available that are calculated using different techniques, namely: (i) Proxy; (ii) Panel weighting; (iii) Equal weighting; (iv) Distance to target; (v) Meta-models; (vi) Monetary weighting [25,26,28]. Sala and Cerutti [29] classify the weighting methods and provide an overall taxonomy as in Figure 2. Even the names and levels of classification vary, the main categories fall into five main weighting method groups: single item, distance-to-target, panel, monetary and meta/combined methods.
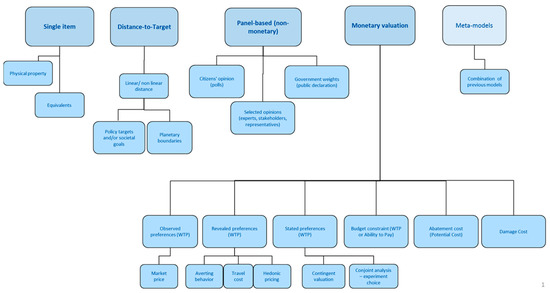
Figure 2.
Weighting methods in LCA [29].
Ecological footprints, carbon footprints and cumulative energy demands are examples of proxy/single item weightings in LCA. Environmental footprints [29], BEES [30], NOGEPA and EPA provide panel weightings for the midpoint level, while Eco-indicator 99 [31] and LIME for the endpoint level [32]. Panels may consist of stakeholders, experts and advisory boards. In equal, weighting gives exactly the same importance to each impact category. The distance to target approach calculates weighting according to political targets such as EDIP [33], the ecological scarcity method (ESM) [34], as in the work of Miao et al. [35] for China.
Arendt et al. [36] summarizes monetary weightings in three groups: (i) The market price approach; (ii) The revealed preferences approach; (iii) The stated preferences approach. Alroth [25] grouped them as: (i) Market price/revealed willingness to pay; (ii) Expressed willingness to pay; (iii) Imputed willingness to pay; (iv) Political willingness to pay; and (v) Avoidance costs. Pizzol et al. [28] provides a broad review on monetary valuation in LCA.
Arendt et al. [36] also provide a qualitative and quantitative assessment for monetary weightings of Ecovalue12 [37], Stepwise 2006 [38], LIME3 [39], Ecotax [40], EVR [41], Environmental Prices Handbook [42], Trucost [43] and MMG-Method [44]. The conversion factors applied are in line with the ISO 14008 [45]. By applying conversion factors, all monetary weightings expressed and analyzed as one unit per impact category and it is namely Euro2019.
Which weighting factors should apply during the decision-making process of a building design is one of the main questions for LCA practitioners in the construction sector. When different weighting sets are available, the comparability of all methods and weighting sets are critically significant to draw concrete decisions.
This study aims to provide a comparative LCA of 12 roof coverings using monetary-weighting factors from EPS, EVR and MMG that are qualitatively and quantitatively assessed in Arendt et al. [36] and panel weighting factors of YDED-TR [46], EF [29] and BRE [47]. The reason for the selection of EPS, EVR and MMG is that only these monetary weightings exist in the study by Arendt et al. [36] and the panel weightings in YDED-TR, EF and BRE include the same impact categories as in the EPDs of 12 roof coverings.
The main question behind this comparative LCA analysis is whether the selected weightings demonstrate an effective benefit during construction material selection process or not. In more detail, our questions are:
- “Do single-score weightings in building LCA point out the same material for decision-making in terms of sustainability?”
- “Are the results of LCA consistent when the applied weighting methods changed?”
- “Is there any parallelism or similarity in weighted LCA results?”
2. Materials and Methodology
The aim of this comparative LCA is to test the results of different weighting factors. In this study, the material level is selected for this aim since it is less complicated than the component level LCA and building level LCA. To narrow down the material selection, roof-covering materials are chosen. For functional unit is defined as 1 sqm of the roof covered. The selected materials and their attributes are given in Table 1 and Table 2.

Table 1.
List of roof-covering materials (1–6).
Table 2.
List of roof-covering materials (7–12).
In Table 1 and Table 2, in the first/title row, the code given to materials is stated, in the second row, the EPD numbers are given. In the third-row, an image of the roof-covering material is included, while in the fourth-row, the material’s description is given. The last two columns illustrate the service life of materials and the number of replacements.
In this study the service life of the building is assumed as 60 years. Therefore, the number of replacements is calculated as 0 (zero) for R01, R03, R04, R05, R07 and R08 since the service life of materials is equal to building service life; 1 replacement for R09, R10, R11, R12 and 3 replacements for R02 and R06.
Among these 12 materials, most of the EPDS are cradle-to-gate, while a few are cradle-to-grave. For comparability, the scope of the study is limited to cradle-to-gate. In other words, A1, A2 and A3 modules are calculated for all 12 roof coverings. In the EPDs, the calculated environmental impacts and their units were:
- GWP: the global warming potential is measured in [kg CO2-Eq.];
- ODP: the depletion potential of the stratospheric ozone layer is measured in [kg CFC11-Eq.];
- AP: the acidification potential of land and water is measured in [kg SO2-Eq.];
- EP: the eutrophication potential is measured in [kg PO43-Eq.];
- POCP: the formation potential of tropospheric ozone photochemical oxidants is measured in [kg Ethen Eq.];
- ADPE: the abiotic depletion potential for non-fossil resources is measured in [kg Sb Eq.];
- ADPF: the abiotic depletion potential for fossil resources is measured in [MJ].
As stated in Figure 3, comparisons are made in two parts: (1) First, environmental data are gathered from EPDs. The numbers of replacements are calculated and demonstrated in Table 1 and Table 2. In the next step, the impact category results are calculated, taking into consideration their replacements. A comparison is made based on the EPD data throughout its life cycle; (2) Then, the calculated results from Part 1 are multiplied with monetary weightings of EPS, EVR and MMG and the panel weightings of YDED-TR, EF and BRE. In the next step, single-score results are analyzed, evaluated and compared; then, the conclusion is drawn. For the calculations to achieve single score, the formula below is followed:
where:
Single Score LCAx = ∑ [ICix · (R + 1)x · Wi]
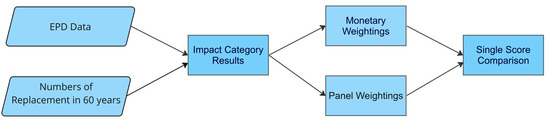
Figure 3.
Framework of the study.
- x is the roof-covering material
- IC is the impact category results for material x,
- I is the impact category, such as GWP, ODP, AP, EP, POCP, ADPE and ADPF
- R is the number of replacements.
- R + 1 is the initial installation and replacement during the 60 years of the lifetime of the building.
For each material and for each impact category, the impact category results stated in EPDs are multiplied by (R + 1). The number 1 is the first implementation/installation of construction materials. Then, the result is multiplied by the weighting factor of the related impact category. After the weighted results are calculated for all impact categories, the total impact, single score, is achieved by the sum of weighted results of all impact categories for that specific material.
3. Results and Discussion
Before giving the results of single-score LCA, it is important to show the comparison of LCAs at the midpoint level. These calculations are performed by multiplying the midpoint impact category results by (R + 1) to achieve the 60-year lifetime performance of materials as explained in the Part 1 calculation in the methodology section. The LCA results of GWP, ODP, AP and EP for 60 years are given in Figure 4 as a, b, c and d, respectively, while the LCA results of POCP, ADPE and ADPF for 60 years are given in Figure 5 as a, b and c, respectively.
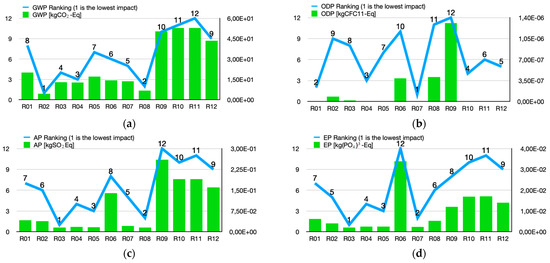
Figure 4.
LCA results (60 years) for GWP (a); ODP (b); AP (c); and EP (d).
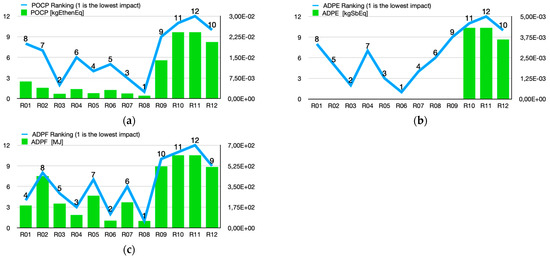
Figure 5.
LCA results (60 years) for POCP (a); ADPE (b); and ADPF (c).
When the environmental performances of 12 roof-covering materials are compared, it is obvious from Figure 4a that R09, R10, R11 and R12 have the highest global warming impact. The lowest global warming impact belongs to R02, bitumen corrugated sheet. It can also be seen in Figure 4a that there is a break off of the performances among metals and the rest of the roof coverings.
When the ODP is concerned, seen in Figure 4b, the highest impacts belong to R09, and then R08 and R06, respectively. The best performance in terms of ODP belongs to R07, clay roof tile.
AP results in Figure 4c, which shows that metal profiles, R09, R11, R10 and R12 have the highest negative impacts, while clay roof tile, R03, has the lowest AP results.
Regarding eutrophication, it is clear in Figure 4d that the fiber cement composite roof covering, R06, has the highest impact. All metal profiles, R11, R10, R12 and R09 follow the R06, while R03, clay tile, has the lowest eutrophication potential.
In Figure 5a, POCP results show that the highest negative impacts belong to metal profiles R11, R10, R12 and R09. There is a huge difference in the performances of metal profiles and the rest of the roof coverings. On the other hand, R08 has the lowest POCP impact. When ADPE is concerned (Figure 5b), three of the metal profiles have the highest negative impacts, namely R11, R10 and R12. On the contrary, R06 has the lowest impact on ADPE. For ADPF, seen in Figure 5c, similarly, metal profiles have the highest negative performances. Coated fiber cement slates have the lowest ADPF among others.
Since the graphics of the impact category results do not point out a single material, the ranking for the environmental performances of 12 roof coverings are demonstrated all together in Table 3. Red, orange, yellow, green, cyan and blue represent the ranking of impacts in the order of highest to lowest. Red represents the highest negative impacts, while blue represents the lowest environmental impact; in other words, blue points out the best environmentally friendly options. Green and yellow represent the average performances.
Table 3.
Rankings of environmental impact results.
R03 is the most environmentally friendly roof covering in terms of rankings of AP (first), EP (first), POCP (second) and ADPE (second). However, R03 has an average performance for ODP (eighth) and ADPF (fifth). The GWP performances of R03 take fourth place in the ranking, while R02 has the best performance in terms of GWP, namely a CO2 equivalent. As for ADPF, R08 has the lowest negative impact and R06 is the second lowest.
This study, therefore, questions:
- ○
- Can “weighting” solve this problem and address only one sustainable or environmentally friendly material?
- ○
- Is there any parallelism or similarity in weighted LCA results?
To answer those questions, the weighting factors listed in Table 4 are applied to 60 years of environmental performance data of 12 roof-covering materials, as described in the methodology in Part 2. Both in panel weighting sets and monetary-weighting sets, the highest value is marked as bold. Italics are used to demonstrate the extremely higher values in the series. The reason to choose those weighting methods is that they provide the same environmental categories that are available in EPDs. Another reason is that, together with the panel weightings, monetary weightings have the advantage of providing single scores in monetary terms when LCC is also integrated into the design option decision process.
Table 4.
Weighting factors used in the study.
The results are given in Figure 6 below. When YDED-TR is concerned, the best performance belongs to R04 with the value of 2.42 × 10⁴, while the worst performance belongs to R10 and R11 with the value of 1.69 × 10⁴. In the EF results, the best and worst performances belong to R04 with 1.46 × 10³ and R09 with 1.60 × 10⁴. The BRE results indicate a similarity with the EF results in terms of best and worst performances. R04 has the best performance in the EF weightings (1.12 × 10³), while R09 has the worst performances in the EF weightings (2.41 × 10⁴).
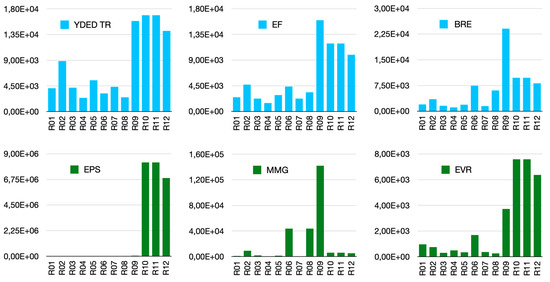
Figure 6.
Weighted LCA results of 12 roof-covering materials (linear axis scale).
When monetary weightings are concerned, for EPS, the environmental performances of R10, R11 and R12 have the worst performances, which are extremely higher than the rest. For the EPS results, R03 has the lowest value (2.59 × 10³ 2019 Euro), while R10 and R11 have the highest value (8.24 × 10⁶ 2019 Euro). The ratio of the highest and the lowest value is 3.181.
MMG method results show that R07 has the lowest negative impact (3.21 × 10² 2019 Euro) and R09 has the highest negative impact with the value 1.42 × 10⁵ 2019 Euro. The ratio of the highest and the lowest performances is 442 for the MMG weighting method.
For EVR, the highest negative impact belongs to R10 and R11 (7.58 × 10³ 2019 Euro), while R08 has the lowest negative impact that is 2.69 × 10² 2019 Euro. The ratio of the highest and the lowest impact for EVR is 28.
It can be concluded from Figure 6 that in panel weightings, metal roof coverings have the highest negative impacts in common. However, there is no similarity in other types of roof-covering materials.
Monetary weighting results show that for R10, R11 and R12 (three of the metal roof coverings) there is a similarity between EPS and EVR contrasting the MMG weighting results. The reason for these results could be the relatively higher weighting factors of EP and ODP in the MMG method. Since the graph of ADPE results in Figure 5b is so similar to EPS graph in Figure 6. The ADPE weighting factor of EPS is 19,063.00, whereas the ADPE weighting factor of MMG and EVR are 6.658 and 8.169, respectively. The weighting factor of EP in MMG is 64.124, while in EPS it is 0.011. The weighting factor of ODP in the MMG method is 106.873, while in EPS it is 11.748.
Since the data set spacing, the ratios of the highest and the lowest performances vary from 28 to 442 and 3181, the graph of the logarithmic axis scale of all 12 roof coverings is given in Figure 7. It is clear that the EPS results of R10, R11 and R12 are extremely higher than the rest. The reason for this is the fact that R09, R10, R11 and R12 have the highest negative impacts in all impact categories except ODP, the weighting factor of ODP in EPS is 10 times lower than the MMG and the weighting factors of GWP and ADPE in EPS have the highest value among monetary weightings. Especially the monetary weighting of ADPE in EPS, which is 19,063.00, while the second highest is 8.16.
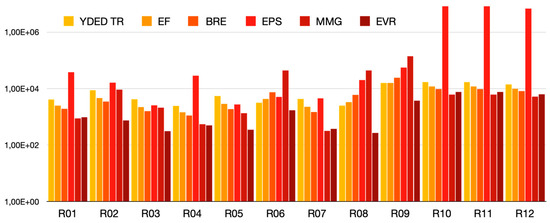
Figure 7.
Overall weighted LCA results of 12 roof-covering materials (logarithmic axis scale).
The overall environmental performances of R03, R05 and R07 are significantly lower when compared to R01, R02, R04, R06, R08 and R09 and other metal roof coverings, namely R10, R11 and R12. However, among R03, R05 and R07, Figure 7 does not clearly point out the best suited product.
To indicate the similarity and parallelism among the weighted LCA results, we also looked at the rankings. In Figure 8a, the panel weightings are grouped, and the rankings are demonstrated. The rankings of monetary weightings are given in Figure 8b.
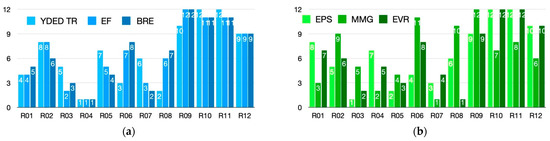
Figure 8.
Overall weighted LCA rankings of 12 roof coverings: (a) Panel weightings; (b) Monetary weightings.
For panel weightings sets, it can be concluded from Figure 8a that the most sustainable and environmentally friendly option is R04; clay roof tile taking first place in the ranking in all three panel-weighting methods. R12 has the ninth best environmental performance in all three panel-weighting methods. R01 has the fourth best performance for both YDED-TR and EF and fifth in BRE. R10 and R11 have the 12th best performance for YDED-TR and the 11th for both EF and BRE. According to results of panel weightings, for two of the materials, R04 and R12, the ranking is identical for YDED-TR, EF, and BRE. For five of the materials, R01, R02, R09, R10 and R11, the rankings are the same for two panel weightings. For the remaining five roof-covering materials, R03, R05, R06, R07 and R08, the rankings are totally different in the panel-weighting methods.
For monetary weightings, unfortunately, even the monetary value is quantified in Euro 2019, the ranking results of the three monetary-weighting methods do not address the same best performance. There is no similarity in the overall results; only 2 similarities are detected partially: (i) The ranking of R09 in EPS and the EVR methods are the same, the ninth best performance; (ii) The ranking in EPS and EVR are the same for R10 and R11 as it takes 12th place in both, and for R12 as it takes 10th in both methods.
The first place in rankings belongs to R03 in EPS, R07 in MMG and R08 in EVR. On the other hand, the first rankings of panel weightings point out only one material, which is R04.
It is obvious in Figure 8a that panel-weighting sets have more similarity in the ranking results, while the similarity in the ranking of monetary-weighting methods is less than the similarity in panel weightings. The reason for that could be that the value of the weighting factors for impact categories varies between 0.006 and 19,063.00, while in panel-weighting sets of YDED-TR, EF and BRE, the value varies between 2.8 and 24.1. The wide range of intervals in monetary-weighting sets may cause a deviation and spread that affects the ranking of materials in terms of their environmental performance.
In Figure 8a,b, in the performance of metal roof coverings, a similarity is observed: the highest impacts in both panel and monetary weightings. During the manufacture process of metal roof coverings, production methods, raw material and water usage may cause these results. The manufacturing process of metal construction materials can be deeply analyzed in other studies in the future.
For a visual presentation and an easier comparison, colored rankings of unweighted and weighted LCA results are shown in Table 3 and Figure 9, respectively. Red, orange, yellow, green, cyan and blue represent the ranking of impacts in the order of highest to lowest. Red represents the highest negative impacts, while blue represents the lowest environmental impact; in other words, blue points out the best environmentally friendly options. Green and yellow represent the average performances.
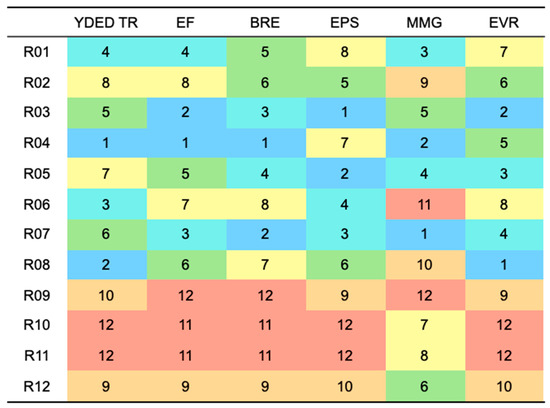
Figure 9.
Comparison of rankings of 12 roof coverings after weighting.
When the ranking in Table 3 is concerned, there is a contrast in the ODP results of the materials. Similarly, in the weighted results, the MMG method results show a contrast to other rankings. How the ODP is treated and weighted in the MMG method could be the reason for this because the weighting factor of ODP in the MMG method is 106,873 2019 Euro. Similarly, the ODP ranking of environmental data in Table 3 is so similar to the ranking of the MMG method in Figure 9. In Arendt et al. [36], it is said that building and building materials are also included as an area of protection during the development of the weighting factors. This could be one of the reasons that the results of the MMG method are differentiated. New studies on the weighting process and methodologies are recommended.
R04 has the top two rankings in four weighting methods, and R03 has the top two rankings in three weighting methods. However, when the unweighted results are concerned, R03 has the top two ranking in four impact categories, while R08 has the top two rankings in four impact categories for the unweighted results. Materials that have the top two rankings in the unweighted results are R03 and R08 (four impact categories), R07 and R06 (two impact categories) and R01 and R02 (one impact category), while for the weighted results, R04 has the top two rankings in four methods, R03 in three methods, R07 and R08 in two methods and R05 in one method. It is comprehensible that after weighting applied, the order of the rankings changes. However, it is seen in the comparative results that a concrete consensus is needed in weighting in LCA, especially in monetary weightings.
In the previous study of Bayazıt and Taş [23] in which the shadow costs from different sources are applied to roof coverings, the ranking results of the same 12 roof coverings were as follows: Roof Covering 06 has the best performance, and 08, 04, 02, 01, 03, 07, 12, 09 and 05 follow, ranked from the best to the worst. Roof Coverings 10 and 11 share the last position. However, in this study, R04 has the best performance in terms of panel weightings, R03, R07 and R08 have the best performance according to EPS, MMG, and EVR, respectively. This also states that the shadow cost approach also differs from the panel weighting approach and the monetization approach when single-score LCA results are compared.
4. Conclusions
This study aims to demonstrate a comparative LCA for 12 roof-covering materials to facilitate an environmentally friendly decision-making process. There were two main questions that this study aims to answer:
- ○
- Can “weighting” solve the problem of addressing only one sustainable or environmentally friendly material?
- ○
- Is there any parallelism or similarity in weighted LCA results?
As an answer to these questions, after analyzing the results it can be concluded that:
- ○
- ○
- It can be concluded from Figure 6 that in panel weightings, metal roof coverings have the highest negative impacts in common. However, there is no similarity in other types of roof-covering materials.
- ○
- Even the panel weightings and monetary weightings do not point out the same material for the selection process in terms of environmentally best performance; the materials that are first in raking are R04 (clay roof tile), R03 (clay roof tile), R07 (clay roof tile) and R08 (coated fiber cement slates). It can be deduced that clay roof tiles have the best environmental performances;
- ○
- Another outcome is that in both the unweighted results and weighted results, metal roof-covering profiles, except for the MMG method, present higher impacts when compared to others;
- ○
- There is a similarity between EPS and EVR contrasting the MMG weighting results. The reason for these results could be the relatively higher weighting factors of EP and ODP in the MMG method since the graph of ADPE results in Figure 5b is so similar to EPS graph in Figure 6. The ADPE weighting factor of EPS is 19,063.00, whereas the ADPE weighting factor of MMG and EVR are 6.658 and 8.169, respectively. The weighting factor of EP in MMG is 64.124, while in EPS it is 0.011. The weighting factor of ODP in the MMG method is 106.873, while in EPS it is 11.748. Therefore, the methods used for developing weighting factors are also significant.
When the limitation of the study is concerned, for further research, it is suggested to conduct more comparative LCA analyses for other construction materials, including roof coverings. Since, in this study, only the roof coverings materials are evaluated, the structure underneath the roof coverings should be considered in further research and must be compared to the outcomes of this study.
In terms of impact categories, in this study, only seven impact categories are considered because of the availability of the data revealed in published EPDs. The LCA methodology evolves, and new impact categories are added to calculations in EPDs. It is advised that in future studies, comparative LCA analyses are conducted including a wide variety of impact categories such as ionizing radiation, land use, water use, particulate matter, etc.
As illustrated in Figure 1, in architecture, evaluations and comparisons are made in different scales as a part of the nature of the architectural design. This study is an example of material-level analysis. In further research, LCA is also recommended to be performed in both the building component level and building level.
Since the available monetary weightings do not address the same material and do not provide a similar ranking, for future research, studies on a consensus for weighting methodology or new updated weightings are suggested.
In this paper, only the environmental aspects are included in the analysis. With the integration of monetary weighting methods, the deviation may disappear, and the holistic approach could be achieved in the evaluation of a building design, alternative throughout its life cycle with the consideration of both the environmental and economic aspects in a single unit. In future research, it is suggested to include initial costs, use phase costs, end-of-life phase costs and environmental impact costs for building materials, building components and the whole building for the decision-making process to achieve sustainability.
Author Contributions
Conceptualization, A.B.S.; Methodology, A.B.S.; Validation, E.F.T.; Formal analysis, A.B.S.; Data curation, A.B.S.; Writing—original draft, A.B.S.; Writing—review & editing, E.F.T.; Visualization, A.B.S.; Supervision, E.F.T. All authors have read and agreed to the published version of the manuscript.
Funding
This research received no external funding.
Institutional Review Board Statement
Not applicable.
Informed Consent Statement
Not applicable.
Data Availability Statement
The data presented in this study are available in [29,36,46,47,48].
Conflicts of Interest
The authors declare no conflict of interest.
References
- UNEP. 2021 Global Status Report for Buildings and Construction Towards a Zero-Emissions, Efficient and Resilient Buildings and Construction Sector. 2021. Available online: www.globalabc.org (accessed on 27 September 2022).
- ISO 14040:2006+A1:2020; Environmental Management—Life Cycle Assessment—Principles and Framework. International Standard Organization: Geneva, Switzerland, 2020.
- ISO 14025; Environmental Labels and Declarations-Type III Environmental Declarations-Principles and Procedures. International Standard Organization: Geneva, Switzerland, 2010.
- ISO 21930; Sustainability in Buildings and Civil Engineering Works-Core Rules for Environmental Product Declarations of Construction Products and Services. International Standard Organization: Geneva, Switzerland, 2017. Available online: www.iso.org (accessed on 27 September 2022).
- Wickramaratne, K.S.L.; Kulatunga, A.K. Building Life Cycle Assessment to Evaluate Environment Sustainability of Residential Buildings in Sri Lanka. Eng. J. Inst. Eng. Sri Lanka 2020, 53, 1. [Google Scholar] [CrossRef]
- Hasik, V.; Escott, E.; Bates, R.; Carlisle, S.; Faircloth, B.; Bilec, M.M. Comparative whole-building life cycle assessment of renovation and new construction. Build. Environ. 2019, 161, 106218. [Google Scholar] [CrossRef]
- Kanafani, K.; Zimmermann, R.K.; Rasmussen, F.N.; Birgisdóttir, H. Early Design Stage Building LCA using The LCAbyg Tool: New Strategies For Bridging The Data Gap. IOP Conf. Ser. Earth Environ. Sci. 2019, 323, 012117. [Google Scholar] [CrossRef]
- Fazli, T. Comparing Environmental Impacts Of Four Building Envelope Configurations Using E-Tool LCA; Middle East Technical University: Ankara, Türkiye, 2013. [Google Scholar]
- Ottelé, M.; Perini, K.; Haas, E. Life cycle assessment (LCA) of green façades and living wall systems. In Eco-Efficient Construction and Building Materials: Life Cycle Assessment (LCA), Eco-Labelling and Case Studies; Woodhead Publishing: Sawston, UK, 2014; pp. 457–483. [Google Scholar] [CrossRef]
- El Bachawati, M.; Manneh, R.; Belarbi, R.; Dandres, T.; Nassab, C.; El Zakhem, H. Cradle-to-gate Life Cycle Assessment of traditional gravel ballasted, white reflective, and vegetative roofs: A Lebanese case study. J. Clean. Prod. 2016, 137, 833–842. [Google Scholar] [CrossRef]
- Žigart, M.; Lukman, R.K.; Premrov, M.; Leskovar, V. Environmental impact assessment of building envelope components for low-rise buildings. Energy 2018, 163, 501–512. [Google Scholar] [CrossRef]
- Botejara-Antúnez, M.; González-Domínguez, J.; García-Sanz-Calcedo, J. Comparative analysis of flat roof systems using life cycle assessment methodology: Application to healthcare buildings. Case Stud. Constr. Mater. 2022, 17, e01212. [Google Scholar] [CrossRef]
- Dogan, N. Vinil ve Çimento Esaslı Cephe Kaplamaların Çevresel Performanslarının İncelenmesi. J. Archit. Sci. Appl. 2021, 6, 494–508. [Google Scholar] [CrossRef]
- Thiel, C.; Stengel, T.; Gehlen, C. Life cycle assessment (LCA) of road pavement materials. In Eco-Efficient Construction and Building Materials: Life Cycle Assessment (LCA), Eco-Labelling and Case Studies; Woodhead Publishing: Sawston, UK, 2014; pp. 368–403. [Google Scholar] [CrossRef]
- Gu, H.; Liang, S.; Pierobon, F.; Puettmann, M.; Ganguly, I.; Chen, C.; Pasternack, R.; Wishnie, M.; Jones, S.; Maples, I. Mass Timber Building Life Cycle Assessment Methodology for the U.S. Regional Case Studies. Sustainability 2021, 13, 14034. [Google Scholar] [CrossRef]
- Christoforou, E.; Kylili, A.; Fokaides, P.A.; Ioannou, I. Cradle to site Life Cycle Assessment (LCA) of adobe bricks. J. Clean. Prod. 2016, 112, 443–452. [Google Scholar] [CrossRef]
- Cellura, M.; Longo, S.; Mistretta, M. Sensitivity analysis to quantify uncertainty in Life Cycle Assessment: The case study of an Italian tile. Renew. Sustain. Energy Rev. 2011, 15, 4697–4705. [Google Scholar] [CrossRef]
- Arrigoni, A.; Pelosato, R.; Melià, P.; Ruggieri, G.; Sabbadini, S.; Dotelli, G. Life cycle assessment of natural building materials: The role of carbonation, mixture components and transport in the environmental impacts of hempcrete blocks. J. Clean. Prod. 2017, 149, 1051–1061. [Google Scholar] [CrossRef]
- Le, A.B.D.; Whyte, A.; Biswas, W.K. Carbon footprint and embodied energy assessment of roof covering materials. Clean Technol. Environ. Policy 2019, 21, 1913–1923. [Google Scholar] [CrossRef]
- Sravani, T.; Venkatesan, R.P.; Madhumathi, A. A comparative LCA study of passive cooling roof materials for a residential building: An Indian Case study. Mater. Today Proc. 2022, 64, 1014–1022. [Google Scholar] [CrossRef]
- Contarini, A.; Meijer, A. LCA comparison of roofing materials for flat roofs. Smart Sustain. Built Environ. 2015, 4, 97–109. [Google Scholar] [CrossRef]
- Feng, H.; Kassem, M.; Greenwood, D.; Doukari, O. Whole building life cycle assessment at the design stage: A BIM-based framework using environmental product declaration. Int. J. Build. Pathol. Adapt. 2022. ahead-of-print. [Google Scholar] [CrossRef]
- Bayazıt, A.; Taş, E.F. Case Study: Do Database Sources Affect Environmental Performance of Roof Coverings? In Proceedings of the ZEMCH 2018 International Conference, Melbourne, Australia, 29 January–1 February 2018.
- Kägi, T.; Dinkel, F.; Frischknecht, R.; Humbert, S.; Lindberg, J.; De Mester, S.; Ponsioen, T.; Sala, S.; Schenker, U.W. Session “Midpoint, endpoint or single score for decision-making?”—SETAC Europe 25th Annual Meeting, May 5th, 2015. Int. J. Life Cycle Assess. 2015, 21, 129–132. [Google Scholar] [CrossRef]
- Ahlroth, S. The use of valuation and weighting sets in environmental impact assessment. Resour. Conserv. Recycl. 2014, 85, 34–41. [Google Scholar] [CrossRef]
- Roesch, A.; Sala, S.; Jungbluth, N. Normalization and weighting: The open challenge in LCA. Int. J. Life Cycle Assess. 2020, 25, 1859–1865. [Google Scholar] [CrossRef]
- British Standards Institution. Environmental Management. Life Cycle Assessment. Requirements and Guidelines; British Standards Institution: London, UK, 2006. [Google Scholar]
- Pizzol, M.; Weidema, B.; Brandão, M.; Osset, P. Monetary valuation in Life Cycle Assessment: A review. J. Clean. Prod. 2015, 86, 170–179. [Google Scholar] [CrossRef]
- Sala, S.; Cerutti, A.K. Development of a Weighting Approach for the Environmental Footprint; Publications Office of the European Union: Luxembourg, 2018. [Google Scholar] [CrossRef]
- BEES 4.0: Building for Environmental and Economic Sustainability. Technical Manual and User Guide|NIST. Available online: https://www.nist.gov/publications/bees-40-building-environmental-and-economic-sustainability-technical-manual-and-user (accessed on 7 December 2022).
- Eco-Indicator 99 Manual for Designers a Damage Oriented Method for Life Cycle Impact Assessment. Available online: https://pre-sustainability.com/legacy/download/EI99_annexe_v3.pdf (accessed on 27 September 2022).
- Huppes, G.; van Oers, L. Evaluation of Weighting Methods for Measuring the EU-27 Overall Environmental Impact; European Commission. Joint Research Centre. Institute for Environment and Sustainability: Luxembourg, 2011; p. 75. [Google Scholar] [CrossRef]
- Hauschild, M.Z.; Olsen, S.I.; Wenzel, H. Environmental Assessment of Products; Chapman & Hall: London, UK, 1997; Available online: https://link.springer.com/book/9780412808005 (accessed on 8 December 2022).
- Muhl, M.; Berger, M.; Finkbeiner, M. Development of Eco-factors for the European Union based on the Ecological Scarcity Method. Int. J. Life Cycle Assess. 2019, 24, 1701–1714. [Google Scholar] [CrossRef]
- Miao, J.; Wang, X.; Bai, S.; Xiang, Y.; Li, L. Distance-to-target weighting factor sets in LCA for China under 2030 vision. J. Clean. Prod. 2021, 314, 128010. [Google Scholar] [CrossRef]
- Arendt, R.; Bachmann, T.; Motoshita, M.; Bach, V.; Finkbeiner, M. Comparison of Different Monetization Methods in LCA: A Review. Sustainability 2020, 12, 10493. [Google Scholar] [CrossRef]
- Göran, F.; Håkansson, C.; Noring, M. A New Set of Valuation Factors for LCA and LCC Based on Damage Costs—Ecovalue 2012. In Proceedings of the 6th International Conference on Life Cycle Management in Gothenburg, Gothenburg, Sweden, 25–28 August 2013. [Google Scholar]
- Weidema, B.P. Using the budget constraint to monetarise impact assessment results. Ecol. Econ. 2009, 68, 1591–1598. [Google Scholar] [CrossRef]
- Itsubo, N.; Murakami, K.; Kuriyama, K.; Yoshida, K.; Tokimatsu, K.; Inaba, A. Development of weighting factors for G20 countries—Explore the difference in environmental awareness between developed and emerging countries. Int. J. Life Cycle Assess. 2018, 23, 2311–2326. [Google Scholar] [CrossRef]
- Eldh, P.; Johansson, J. Weighting in LCA Based on Ecotaxes—Development of a Mid-point Method and Experiences from Case Studies. Int. J. Life Cycle Assess. 2006, 11, 81–88. [Google Scholar] [CrossRef]
- Vogtländer, J.G.; Bijma, A.; Brezet, H.C. Communicating the eco-efficiency of products and services by means of the eco-costs/value model. J. Clean. Prod. 2002, 10, 57–67. [Google Scholar] [CrossRef]
- Bijleveld, M.; de Graaff, L.; Schep, E.; Schroten, A.; Vergeer, R.; Ahdour, S. Environmental Prices Handbook EU28 Version N54-Environmental Prices Handbook Environmental Prices Handbook EU28 Version; 2018. Available online: https://cedelft.eu/publications/environmental-prices-handbook-eu28-version/ (accessed on 27 September 2022).
- Trucost’s Valuation Methodology. 2015. Available online: http://www.naturalcapitalcoalition.org/natural-capital-protocol.html (accessed on 7 December 2022).
- MMG: Environmental Profile of Building Elements|EnergyVille. Available online: https://www.energyville.be/en/research/mmg-environmental-profile-building-elements (accessed on 7 December 2022).
- ISO 14008; Monetary Valuation of Environmental Impacts and Related Environmental Aspects. International Standard Organization: Geneva, Switzerland, 2020.
- Oztas, S.K.; Tanacan, L. Development of Local Weighting Factors in the Context of LCIA. Adv. Mater. Res. 2014, 935, 293–296. [Google Scholar] [CrossRef]
- Abbe, O.; Hamilton, L. BRE Global Environmental Weighting for Construction Products using Selected Parameters from EN 15804. 2017. Available online: www.bre.co.uk (accessed on 27 September 2022).
- Öztaş, S.K. Türk Yapı Malzemesi Sektörü için Yaşam Döngüsü Etki Değerlendirilmesine Yönelik Bir Model Önerisi. Doctoral Dissertation, Istanbul Teknik Üniversitesi Fen Bilimleri Enstitüsü, Istanbul, Türkiye, 2014. [Google Scholar]


Disclaimer/Publisher’s Note: The statements, opinions and data contained in all publications are solely those of the individual author(s) and contributor(s) and not of MDPI and/or the editor(s). MDPI and/or the editor(s) disclaim responsibility for any injury to people or property resulting from any ideas, methods, instructions or products referred to in the content. |
© 2023 by the authors. Licensee MDPI, Basel, Switzerland. This article is an open access article distributed under the terms and conditions of the Creative Commons Attribution (CC BY) license (https://creativecommons.org/licenses/by/4.0/).