Article

Big Data Application in Urban Commercial Center System Evaluation

1
School of Mechanics and Civil Engineering, China University of Mining and Technology, Xuzhou 221116, China
2
Jiangsu Collaborative Innovation Center for Building Energy Saving and Construction Technology, Jiangsu Vocational Institute of Architectural Technology, Xuzhou 221116, China
3
Jiangsu Provincial Planning and Design Group, Nanjing 213004, China
*
Author to whom correspondence should be addressed.
Sustainability 2023, 15(5), 4205; https://doi.org/10.3390/su15054205
Submission received: 31 January 2023 / Revised: 20 February 2023 / Accepted: 23 February 2023 / Published: 26 February 2023

Abstract

:
Big data has provided new opportunities, directions, and methods for research on urban commercial center systems. Based on a quantitative assessment of big data and public participation, the “big data + public feedback” evaluation model can objectively and scientifically quantify the scale and structural characteristics of urban commercial center systems. In this paper, socioeconomic and material spatial attributes were considered in the selection of four indexes, including commercial agglomeration centrality, commercial facility service level, commercial industry status, and industry attraction. Specifically, we based our selection on the big data of the point-of-interest network, housing price, and population. ArcGIS, SPSS, and other analytical tools were employed to conduct a comparative analysis, cluster analysis, spatial network analysis, and correlation analysis. Using these data, we constructed an assessment index system, which was then utilized to comprehensively evaluate the current commercial land use in Nanjing’s main urban area and measure the degree of commercialization. The commercial center system in the main urban area of Nanjing was found to be consistent with the spatial structure system of “one main core, five secondary cores, multiple district cores, three horizontal axes, and one vertical axis.” Meanwhile, a public questionnaire was used to evaluate the public’s perception of the commercialization level in Nanjing. Finally, the results obtained were used for comparison with the structure of the commercial center system of Nanjing commercial network planning. We discovered that the results of the public’s perception of the commercialization level in Nanjing were similar to those of the big data analysis, which confirmed the credibility of big data analysis results. In conclusion, the findings of this study provide a basis for developing urban commercial center-level positioning and propose a method for data-assisted planning research.

1. Introduction

Big data has considerable potential for advancing urban planning practice and bringing forth new opportunities for quantitative research at the urban scale. In traditional research on commercial centers in urban areas, data on features, such as land use, buildings, the layout of business facilities, and the type and quantity of commercial centers, are collected mainly through field investigation and interviews. However, the reliability of data collected via these conventional methods often depends on the time and location of their collection, the efforts exerted by the investigators, and their experience and expertise due to the large workload, small sample size, high cost, and no or infrequent update(s). To keep pace with continuous urban development, it is thus necessary to introduce multisource big data (e.g., on urban infrastructure, commercial activities, point of interest (POI), and housing prices) into quantitative research of urban commercial centers. Using computer data mining technology and spatial analysis technology, with the help of the GIS information technology platform, combined with UNA and other research methods, a reasonable evaluation index system is established to carry out research and evaluation of the urban commercial center system, which provides a new way of thinking for people to quickly and directly recognize the complex urban commercial space layout and understand the inherent characteristics of the commercial center system. In this way, the problems of the current commercial network planning can be identified and analyzed, and specific suggestions for improvement and refinement can be made to provide suggestions and support for the subsequent adjustment of planning schemes, policies, and implementation. Such an approach can provide useful methods and valuable ideas for determining the scale and type of urban commercial centers and the growth and change in commercial activities. Meanwhile, quantitative research results can facilitate the assessment of a range of aspects of the location of the urban commercial center system in commercial network planning, which is of practical value for the promotion and adjustment of the implemented planning.

2. Literature Review

Globally, there have been a large number of longitudinal empirical studies and theories involving the system of business centers. Yet, surprisingly, the issue of applying big data to retail distribution has attracted relatively little attention from the scholarly community. Previous research on the urban business structure has merely been oriented around business spaces’ relationships with demographics, household consumption, social economy, transportation, and market realities [1]. And through the systematic analysis of business districts and centers, together with relevant theoretical research, the features, impacts, and challenges of the distribution of commercial facilities can be identified and followed by suggestions for improvement. So far, however, no large-scale studies have been performed to investigate the structure of urban commercial spaces using such point-of-interest (POI) data as commercial outlets, housing prices, and urban information [2]. Outside China, POI-data-based urban research tends to have a strong social impact as it examines employment and the influence of social behavior [1,2,3,4,5,6,7]. In China, however, studies of this kind focus on presenting statistics of phenomena themselves and are of less social value, given inaccessibility to platforms for urban public information and to urban societal data [8,9,10,11,12,13,14,15,16,17].
Studies on the system of commercial centers are of great significance to urban research. As a blend of spatial theory in geography and value-related arguments in economics, central place theory marks a shift of geographical research from conventional regional description to the investigation into laws of geographic space. Driven by multiple indicators typical of a city with a single business center, including economic agglomeration, commuting costs, and population of consumers, medium- and large-scale retailers would build their larger and more important facilities in the core area, while smaller ones are more likely to go for areas of less significance or near residential districts. As for a city boasting more business centers, American economist William J. Reilly developed the law of retail gravitation in 1929, acknowledging the critical role that population and distance play in urban business districts. The attractiveness of a city to its surrounding area is positively correlated to its scale and negatively correlated to the distance between them, according to the law, thus forming the basis of a gravity model that has come to serve as a measure for selecting urban retail locations. The retail classic by Ken Jones and Jim Simmons, Location, Location, Location—Analyzing the Retail Environment, which examines the retail environment in terms of retail structure, consumer behavior, and location analysis, has underpinned retail geography theory. With research on the internal and spatial structures of cities as the basis, the book considers the impact of hierarchy, population, and transportation in the retail industry, location selection of retail chains, the scale of site-based regions, and retailing realities of urban cores and business districts. Beyond that, it also justifies market decisions and location-related strategies, expounds on site selection, and analyzes trade areas. Upon an investigation into the spatial integration of railway stations in the existing urban fabric, Camelia Mulders-Kusumo (2005) analyzed the influence of the railway station’s location on the distribution pattern of retail and service firms. The findings demonstrated that the distribution of street-edge shopping, and the local qualities which support this function, appeared to be more strongly impacted by spatial-configurational indicators [18]. Using multi-factor analysis and applying AHP and several operation research models, J. Córdova and D. Merchán et al. (2014) redesigned the beverage distribution in the historic center of Quito in Ecuador from an urban logistics perspective, proposed network restrictions, diminished route distances, and balanced daily delivery times [19].
At the same time, a large number of case studies dependent on POI data can also be found. Research connecting POI data to the urban spatial structure and population is as follows.
In the research on 17 historic and cultural districts in China and their surroundings within a radius of 1.5 km, Fang Wang et al. (2019) analyzed the spatial structure and population agglomeration associated with POIs, including commercial service POIs and tourist attraction POIs. Results suggested that there was a strong coupling and consistent connection between population clustering and spatial patterns of POIs [10]. Based on POI data, Changhui. Hu et al. (2019) assessed the spatial clustering features of regions in Ningbo, Zhejiang Province, using spatial point-pattern analysis [13]. Building on the data of POI and road networks, Fang Wang et al. (2019) proposed a new methodology for identifying and classifying urban commercial districts (UCDs) and developed a model which blended the Huff model with the Voronoi method, for the analysis of how the distribution of all types of UCDs was affected by the spatial pattern of the population [14]. Hanfa Xing and Yuan Meng (2020) examined the spatial distribution of the decomposed business models by delineating potential deep semantic topics. Structural equation modeling was subsequently utilized to determine relationships between urban landscapes and business models, resulting in spatial patterns manifested by four types of city landscapes to reveal the commercial characteristics of such landscapes from various perspectives [8]. Guided by Jane Jacobs’ theory of development, Yue Cao and Sugie Lee (2021) utilized the GPS-based data of de facto population and POIs to investigate the correlation between surroundings affecting urban vibrancy, which, as shown in results, was closely linked to POI-based land-use variables and other physical environmental indicators [20]. To explore urban shrinkage, Yining Zhang et al. (2022) examined the data on supply, demand, and consumption and the multisource POIs of residents. They found that urban shrinkage did not bring down the occupancy rate or the supply of various commercial facilities, and the supply of catering, shopping, and living facilities was on the rise, except those for leisure and recreation [21].
Studies based on POI data and spatial structure features identified with kernel density are shown below.
Nandi Santosh (2013) et al. presented the details of a map mashup called PINdex+4 spatial identification system, which was proposed to overcome the shortcomings of the existing location addressing system in geocoding the points of interest and contributed to conducting business analyses more effectively [7]. Ragusa Francesco et al. (2019) observed that a “point of interest” in a cultural site may be either an object or an environment and highlighted that the use of an object detector is beneficial to recognize points of interest which occupy a small part of the frame [1]. Jing Yang et al. (2019) developed a more efficient kernel density estimation associated with commercial intersections, which could identify business centers based on POI data [11]. Upon a POI-data-based examination of Beijing’s spatial structure, Shaohua Luo et al. (2021) identified single- and mixed-functional areas using two kernel density indicators, namely frequency density and category ratio [22]. Barta Maximilian et al. (2020) proposed a system to automatically extract and categorize points of interest (POIs) out of any given geographical data set [4]. Built on data about POIs and night-time light remote sensing, Liangliang Zhou et al. (2021) identified the business-area structure of Yiwu’s city proper, unveiled the correlation between business-area features and the night-time economy, and depicted the structural features of various combinations of business activities by adopting an array of methods, including bifactor mapping, kernel density analysis, DBSCAN clustering, and the localized contour tree method [23]. Under the proposed framework by Anqi Lin et al. (2021) of progressively identifying the functions of urban buildings based on remote sensing imagery and POI data, the spatial similarity of buildings and kernel density were merged to make identification more accurate and comprehensive. It was found that the identification of urban building functions was sensitive to the bandwidth of kernel density estimation, with 200 m as the optimal size. The results also suggested that the spatial clustering of residential and commercial buildings was significant on both macro and micro levels [24]. With geographic information system (GIS) spatial analysis techniques, such as the average nearest neighbor, kernel density estimation, and analysis of spatial correlation and cellular network, Lei Zhou et al. (2022) quantified the connectivity between commercial and residential spaces in Beijing and found their spatial distribution was highly correlated and maintained a relatively close link with consumption spaces. However, the extent to which different commercial formats were correlated to residential spaces varied, with daily consumption pulling them together and nondaily consumption driving them apart [25]. Xiaoying Zhang et al. (2022) studied the spatiotemporal evolution features of the distribution of commercial facilities in large cities using GIS spatial analysis and kernel density estimation [26].
The following is about previous research on how the algorithm and model of POI can be optimized.
With the scale of commercial clusters as their research of interest, Jiabin Wei et al. (2019) proposed an enhanced density-based spatial clustering of applications with noise (DBSCAN) algorithm, which, together with a multidimensional analysis of how clusters of business activity were distributed, determined the optimal epsilon and MinPts parameters for the clustering features typical of each type of activity [12]. Yingbin Deng et al. (2022) proposed a hierarchical data-mining model to identify building function types using accessible auxiliary data. Basing their case study on the model, they assessed residential building property to complement the missing POI data of residential buildings [27].
Beyond that, the studies on how POI data can be used to improve and assess the location selection of commercial facilities are as follows.
Fang Liang et al. (2021) investigated the northwestern Chinese city of Xi’an using space syntax and POI data (shopping and catering service). Results showed that it was preferable to predict potential commercial locations by measuring the centrality of the study area within a radius of 10–20 km [28]. Employing Beijing’s bus and subway smart-card data (SCD) and POI data, Cong Liao et al. (2021) studied the locational pattern of retail outlets and their daily dynamic relationships with three weighted centrality indices for the networks of public transport flows—degree, betweenness, and closeness. The findings indicated that a majority of retail stores were highly correlated to these indices [29]. Yang Wang et al. (2022) reviewed the dimensions of residents’ quality of life, merged the commercial POI data acquired through objective observation and subjective appraisal, and investigated how the quality of life could be improved from the perspectives of recreation and transportation [30]. A POI-data-based empirical investigation of the locational indicators’ roles in the rise and fall of restaurants was conducted by Mingbo Wu et al. (2021). They explored the spatial pattern of restaurants using POI data that described the whole period of their existence [31]. Based on POI data, Yuan Zeng et al. (2021) quantitatively identified business clusters in Wuhan, Hubei Province, in terms of the spatial distribution and agglomeration of commercial facilities. And such methods as kernel density estimation, Getis-Ord G_i~*, and spatial autocorrelation were adopted to identify commercial clusters and examine their grade from the perspectives of the number and area of POIs in such clusters, and the extent to which hotspots aggregated [32]. There has been, indeed, quite a large amount of scholarly literature on the distribution of commercial facilities in other Chinese provinces and cities and on POI-data-based urban research. But we would have to leave it at that.
Up to now, far too little attention has been paid to the quantitative evaluation of and research on urban planning in China. The ongoing evaluation and research projects have been part of advanced planning evaluation conducted abroad. There remains a wide gap between Chinese and foreign assessments of urban planning, with foreign countries boasting the better-developed theory and practice of planning evaluation. The planning system with Chinese features and China’s actualities means that there are limitations to the methods and techniques of conducting quantitative research on ongoing planning and to the types of studies on planning evaluation. Assessment of urban planning should be about integrating planning preparation and execution with subsequent results in a systematic manner and about basing case studies on a qualitative evaluation while centering on quantitative assessment. As such, practices of international cities can offer much guidance.

3. The Value Argumentation of Spatial Correlation of Urban Commercial Activities

In this study, we included data from 260,000 commercial POIs located within the main urban area of Nanjing. Three main types of commercial establishments were identified in these areas: shops that sell various types of goods (G), various types of restaurants (R), and commercial establishments that provide various services to citizens (S). These three commercial establishment types in the main urban area carry significant weight and play a crucial role in promoting the regional economy, employment, and neighborhood vitality. Notably, spatial coupling between different commercial establishments dispersed in the main urban area of Nanjing was observed (Figure 1).
In this work, the study area was divided into several 300 m * 300 m grids, and the number of the three types of commercial establishments in each grid cell was calculated. After linear regression calculation (Table 1), we found that the pairwise spatial layout of shopping, catering, and life service in the main urban area of Nanjing was strongly correlated. Moreover, spatial clustering was observed in the layout of different types of commercial POIs.
The paper reviewed the worldwide theoretical and empirical research on the system of urban commercial centers and its relevant POI data. On that basis, a novel model for assessing the system of commercial centers was developed by involving the public and using big-data-based quantitative evaluation. As such, a comparison was made between the assessment results and the encouraged system of commercial centers proposed by the commercial network construction planning of Nanjing from 2007 to 2015, part of the city’s ambitious blueprint spanning from 2007 to 2020. The effort identified the issues of the current architecture of urban commercial centers and offered concrete suggestions about how the city’s commercial network plan could be better developed and implemented and how relevant guiding policies could be tailored. The specifics are as follows:
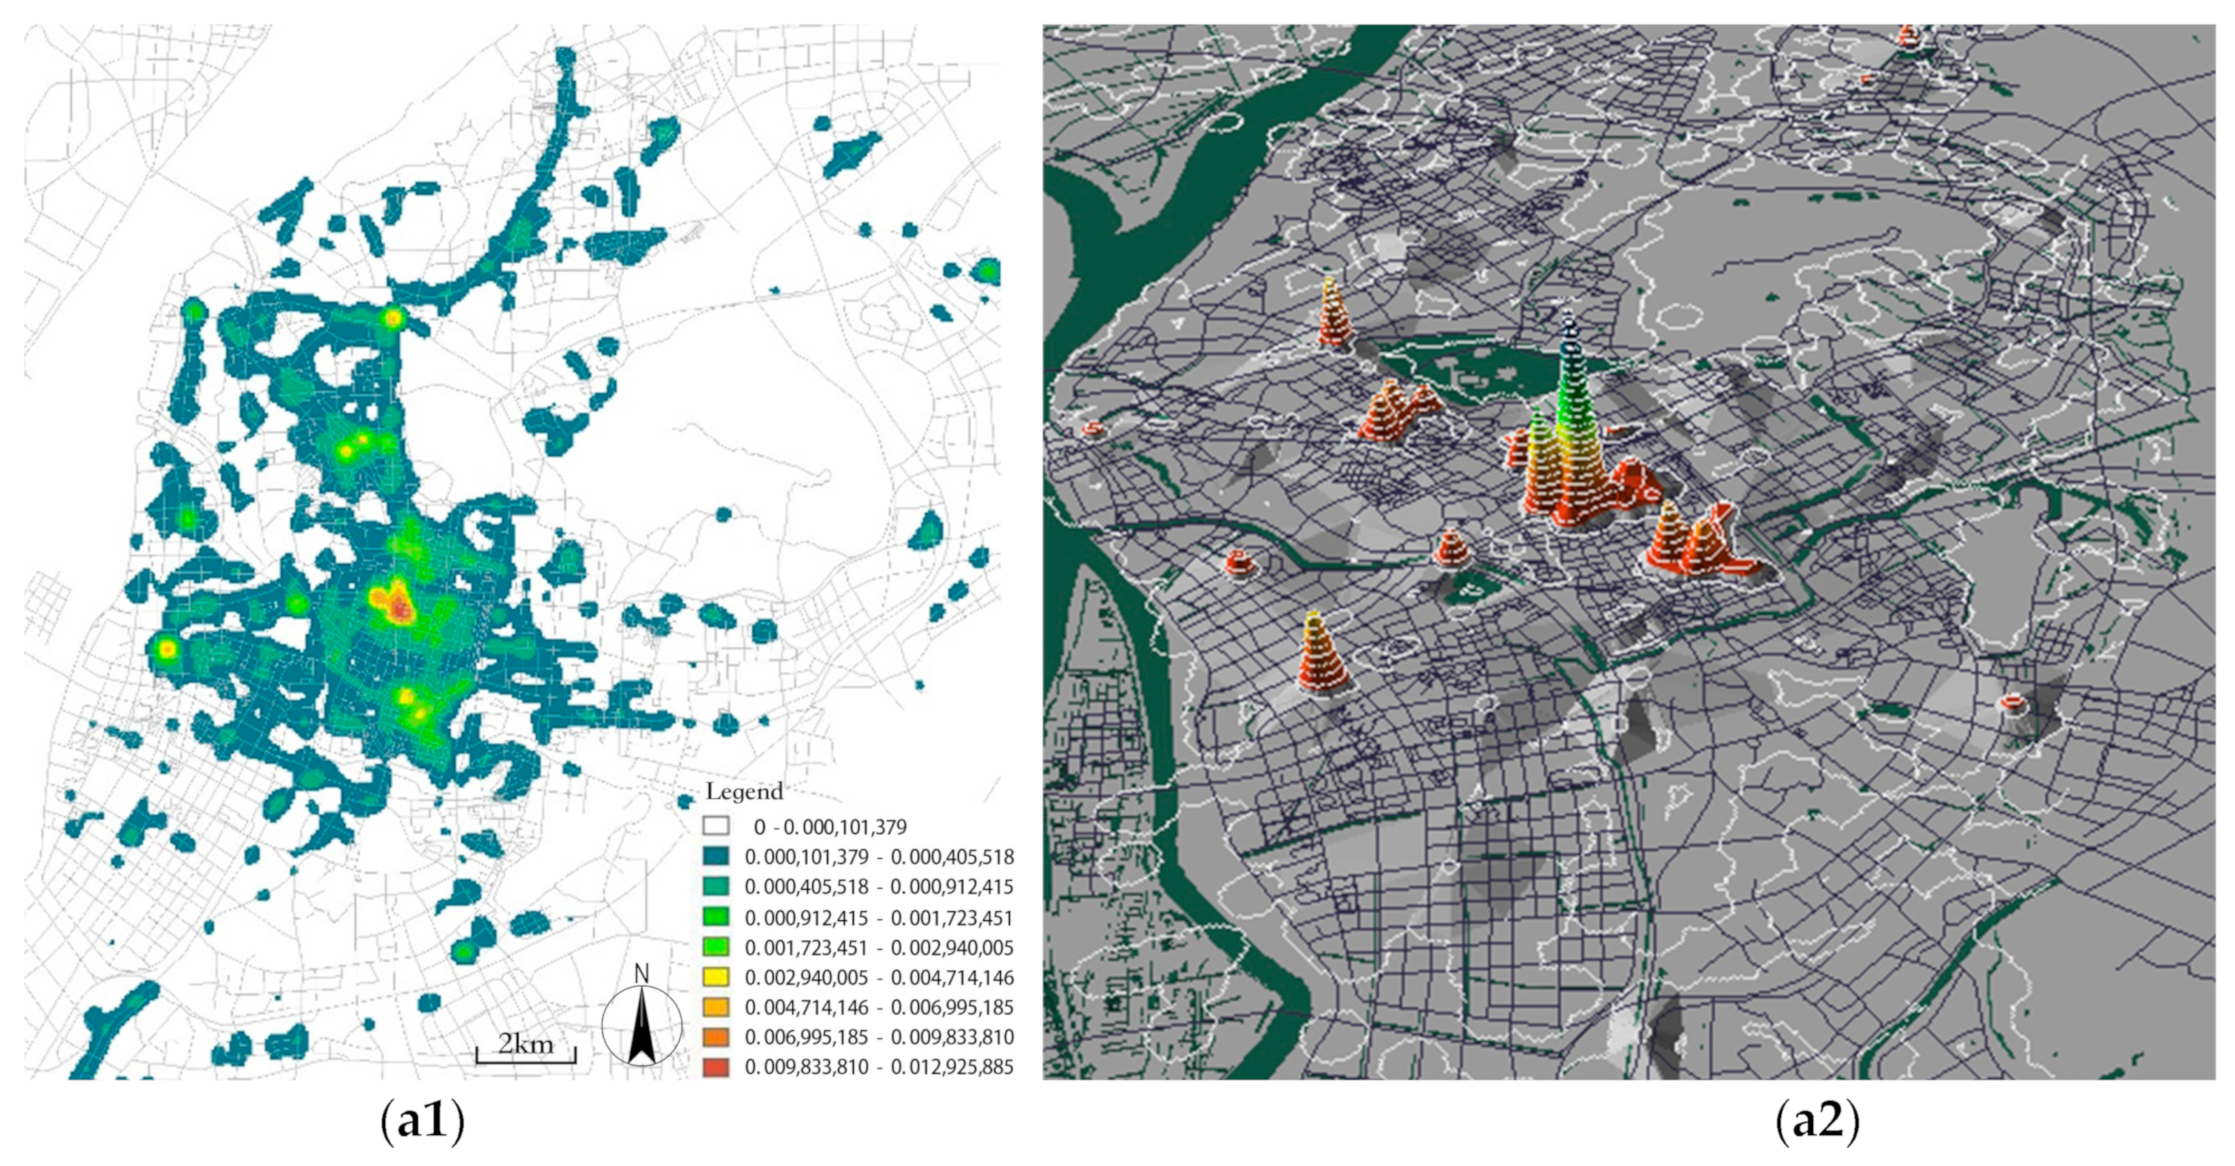
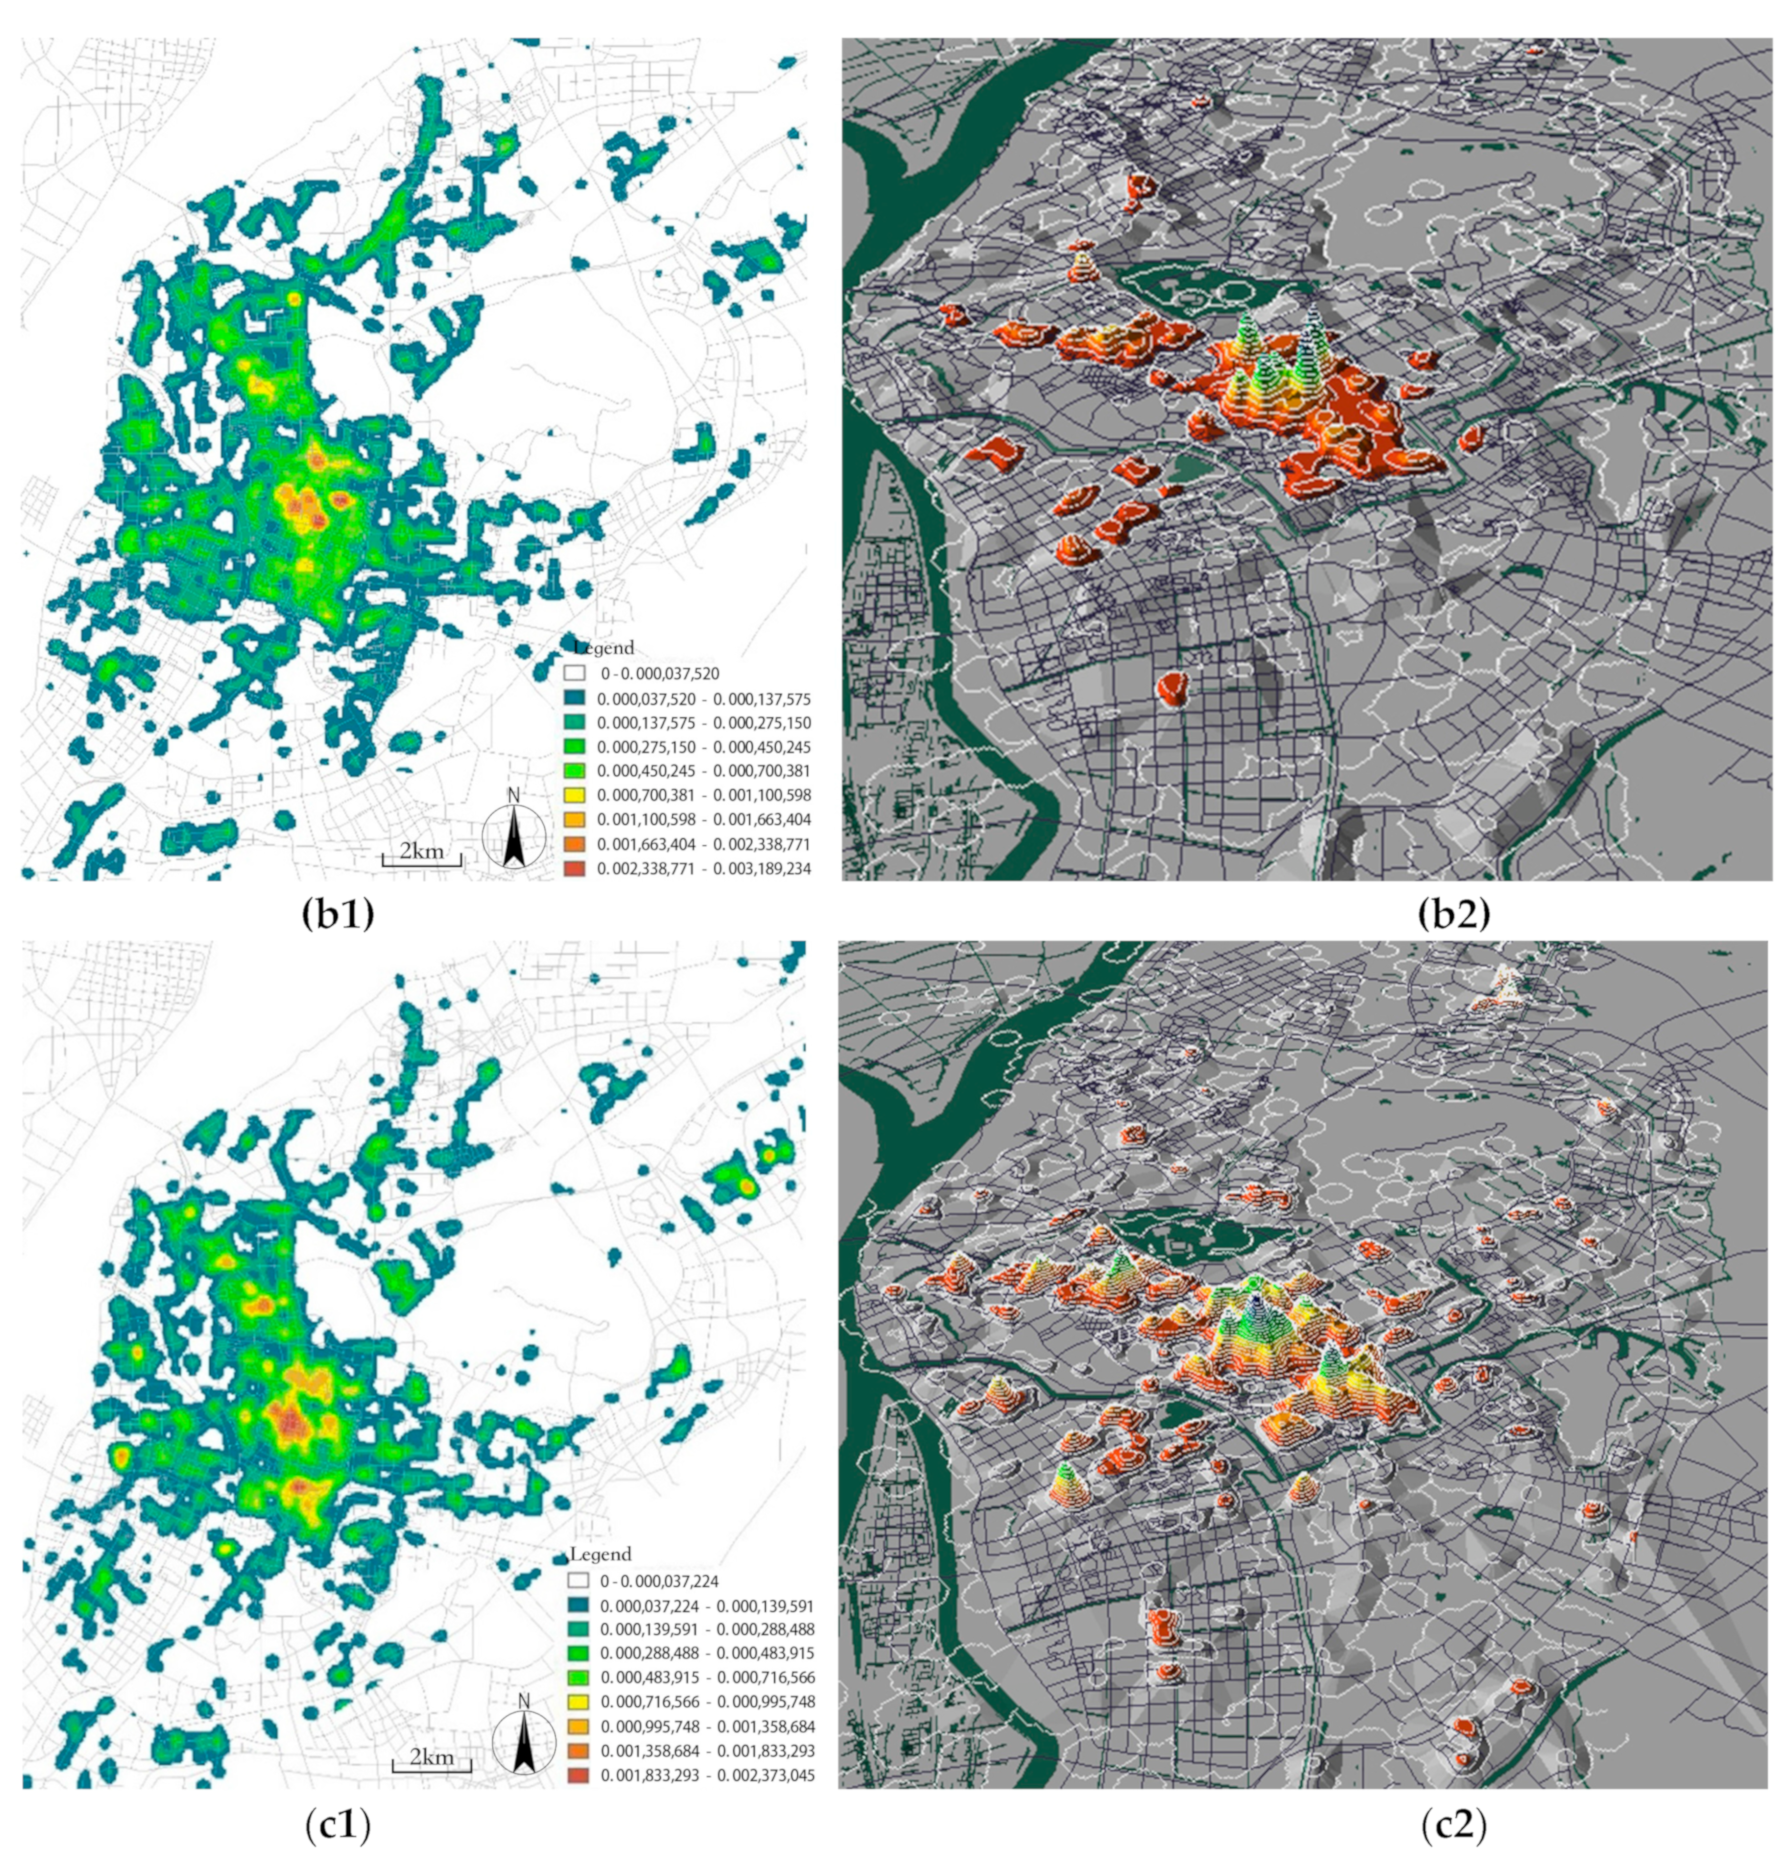
  • Research on features of the spatial distribution of commercial establishments. Building on the value of researching Nanjing’s business community and the interpretation of the current planning, we studied the features of the spatial distribution of shopping, catering, and life service facilities in the city proper using kernel density estimation. And a subsequent analysis of how the distribution of the three forms of business are spatially connected was used to verify the value and possibility of a spatial connection between different commercial formats.
  • Research on the development, evaluation, and formation mechanism of the current system of urban commercial centers. Taking into account socioeconomic, material, and spatial attributes, as well as such big data as commercial POI, housing prices, population, and basic urban information, we examined the commercial agglomeration centrality, services by commercial facilities, parity between business forms, and attractiveness of such forms and comprehensively evaluated the land for existing commercial establishments in a way that measures the extent to which a piece of land has been commercialized. In the meantime, feedback from the questionnaire for the general public and results from the big-data assessment were investigated. Building on that, we studied how the system of current urban commercial centers was created.
  • Evaluation results offered feedback on the existing commercial network planning, identified its weak spots, and provided suggestions for improvement. Upon a comparison between results from evaluating the system of commercial centers and the one proposed in the existing commercial network planning, we recognized the issues with the encouraged system and offered suggestions on optimizing the planning of commercial centers in Nanjing proper and better implementing them.
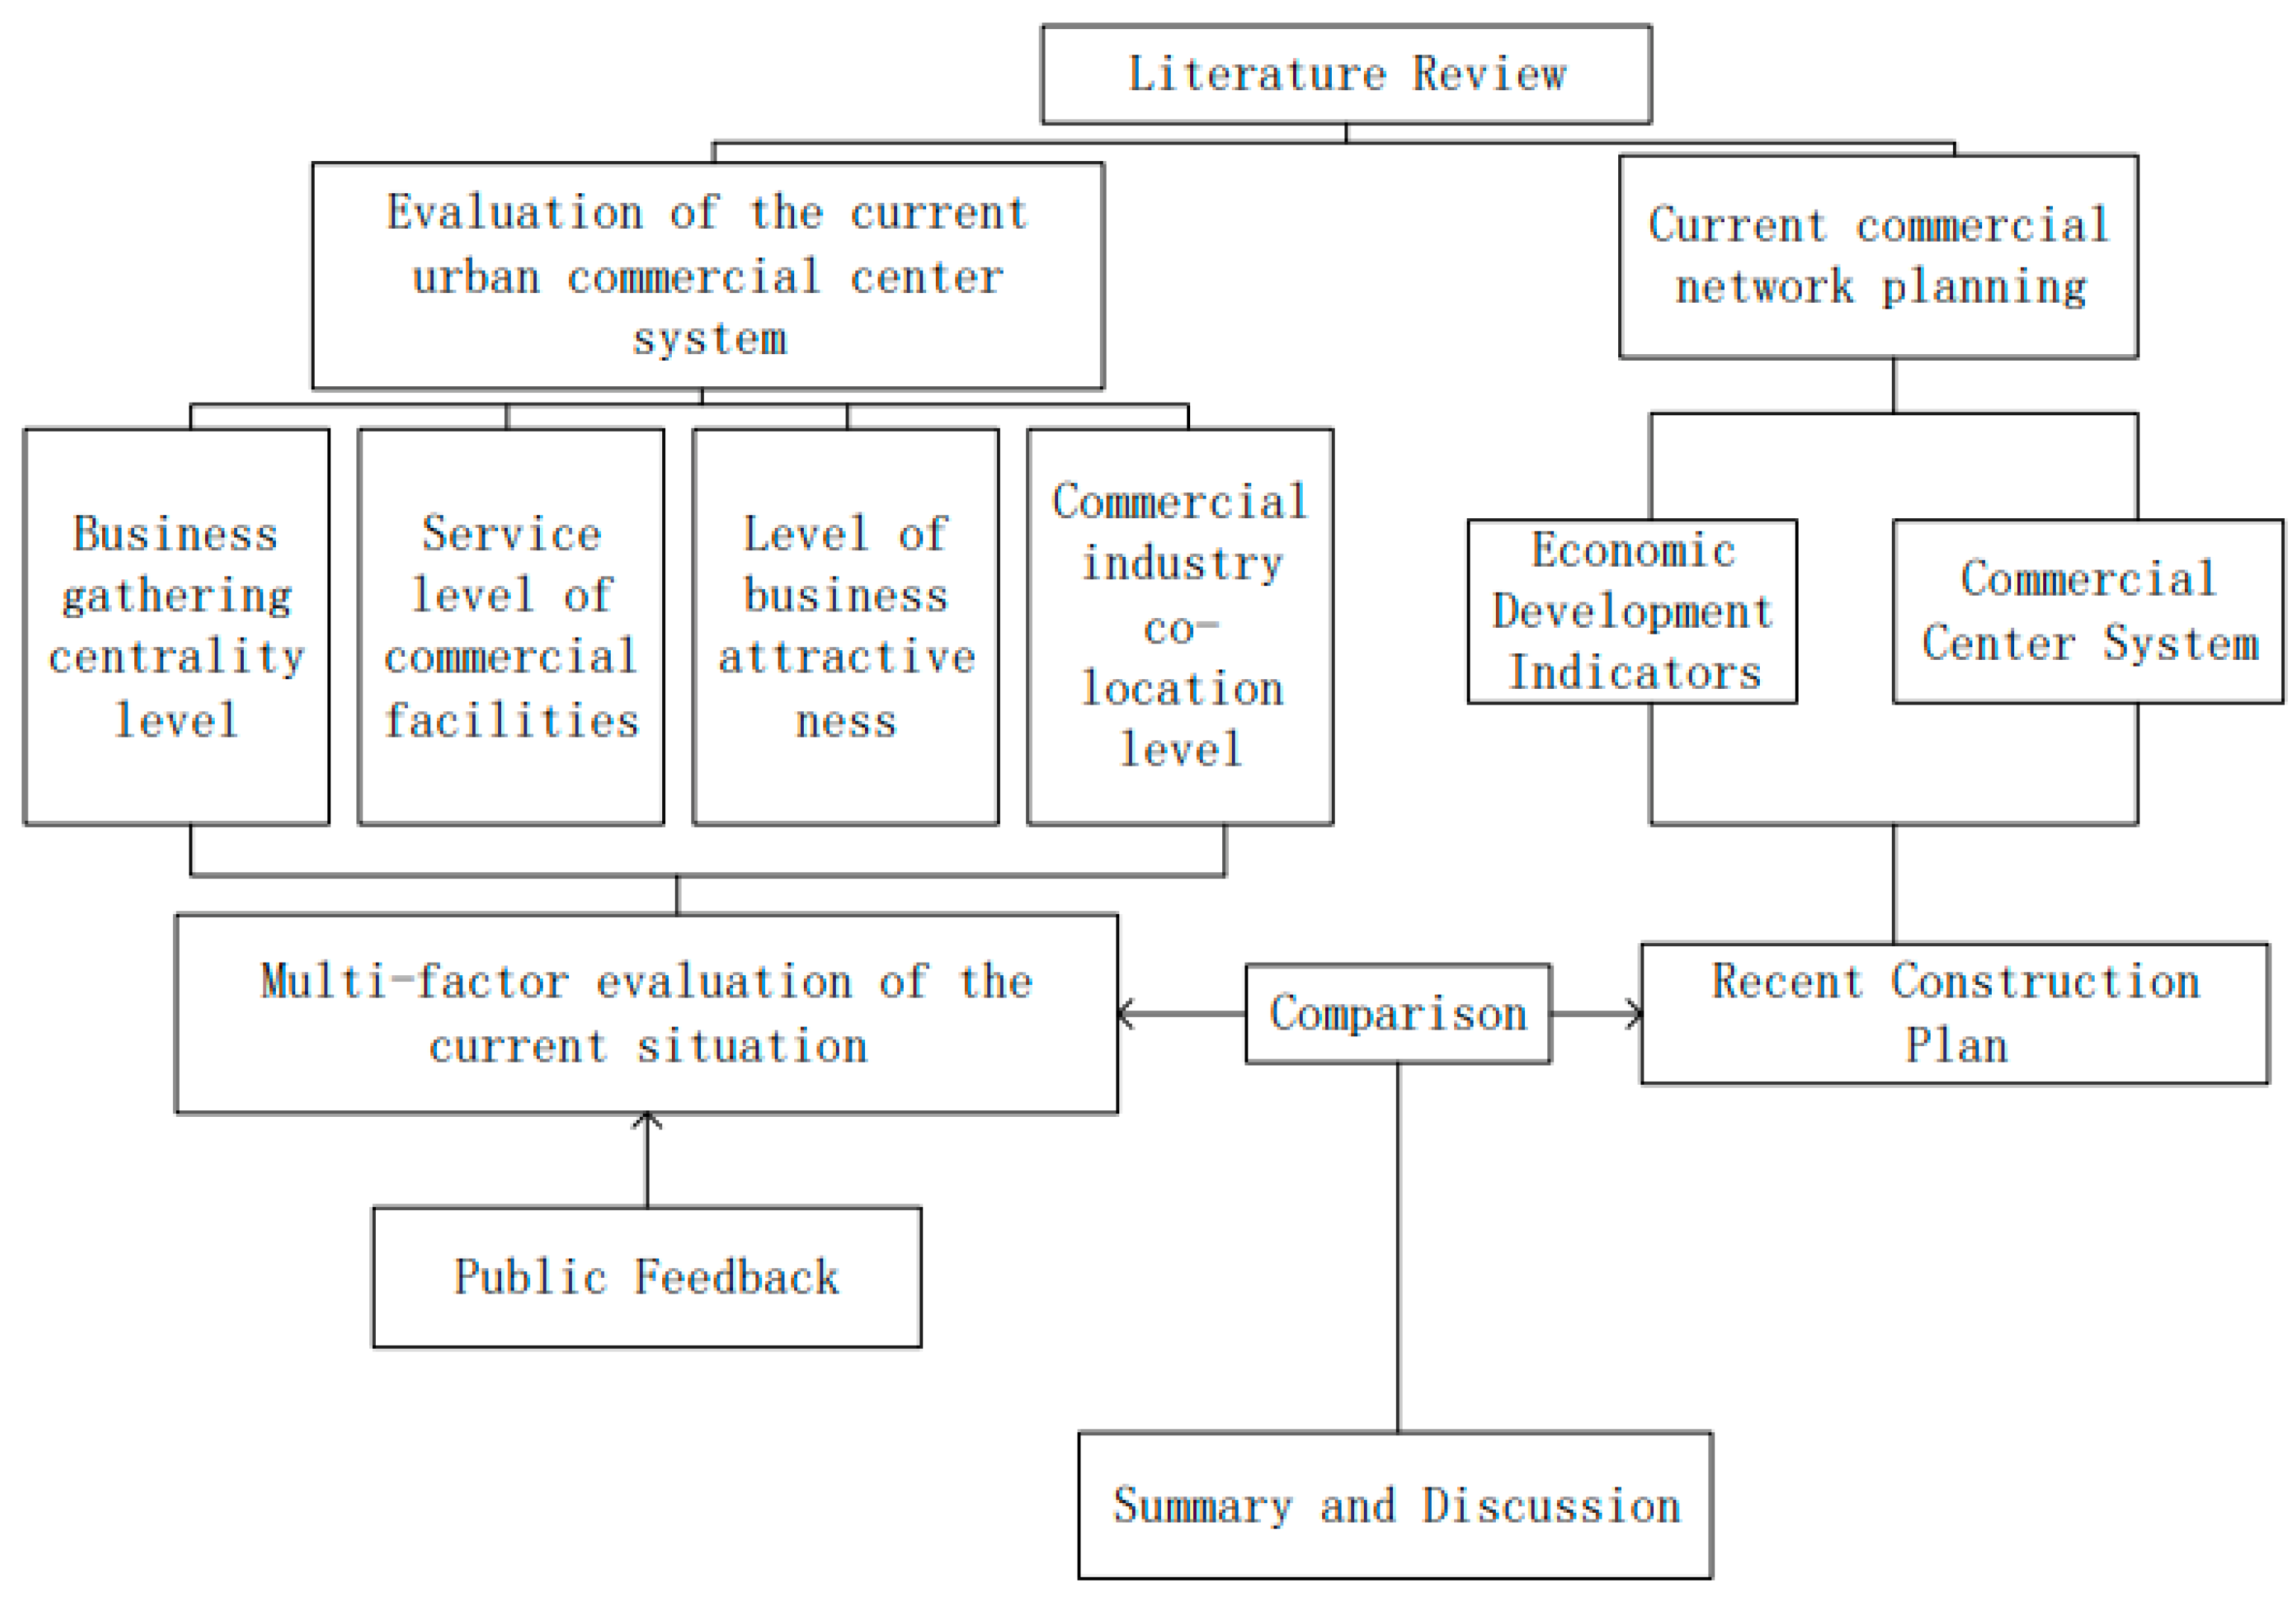
  • To summarize, based on the explanation of the purpose and significance of the research, the core concepts of the article are analyzed, and the theoretical and practical research on commercial center system and POI-based big data at home and abroad are introduced, and the relevant empirical summaries are given to assist the later analysis and research. The article is also divided into three main parts: the study of spatial layout characteristics of the commercial network, the construction and evaluation of the assessment system of the current urban commercial center system, and the feedback of the assessment results on the current commercial network planning, proposing planning problems and providing improvement strategies (Figure 2).

4. Evaluation System of the Current Urban Commercialization Level

4.1. Supporting Data and Evaluation Object

Nanjing’s central area was what we studied in this paper, and the data involved such AutoNavi-based POI as commercial facilities and road networks in the city proper in 2015 and the Planning for Commercial Facilities in Nanjing Municipality (2007–2020). In the research, we studied 260,000 commercial establishments in the city’s central area, including shopping, catering, and life services.
After selecting the main urban area of Nanjing as the study area, we collected data on the three types of commercial POI: road network, land usage, architecture, satellite imagery, housing price, and population. The commercial establishments in the study area were situated on three main types of urban land, namely urban public service land (A), commercial land (B), and residential land (R). After we excluded the grid cells containing less than 20 commercial POIs, the final sample selected for this study included nearly 8000 commercial establishments.

4.2. Selection of Evaluation Indicators

Considering both physical space and socioeconomic attributes, in this work, we examined the spatial structure, scale, and development of the commercial activities in the study area. A quantitative index system consisting of four indicators was then established to evaluate the level of commercial development. The four indicators analyzed were commercial aggregation centrality, commercial facility service level, commercial attractiveness, and commercial activity integration level.

4.3. Analysis and Explanation of the Evaluation Indicators

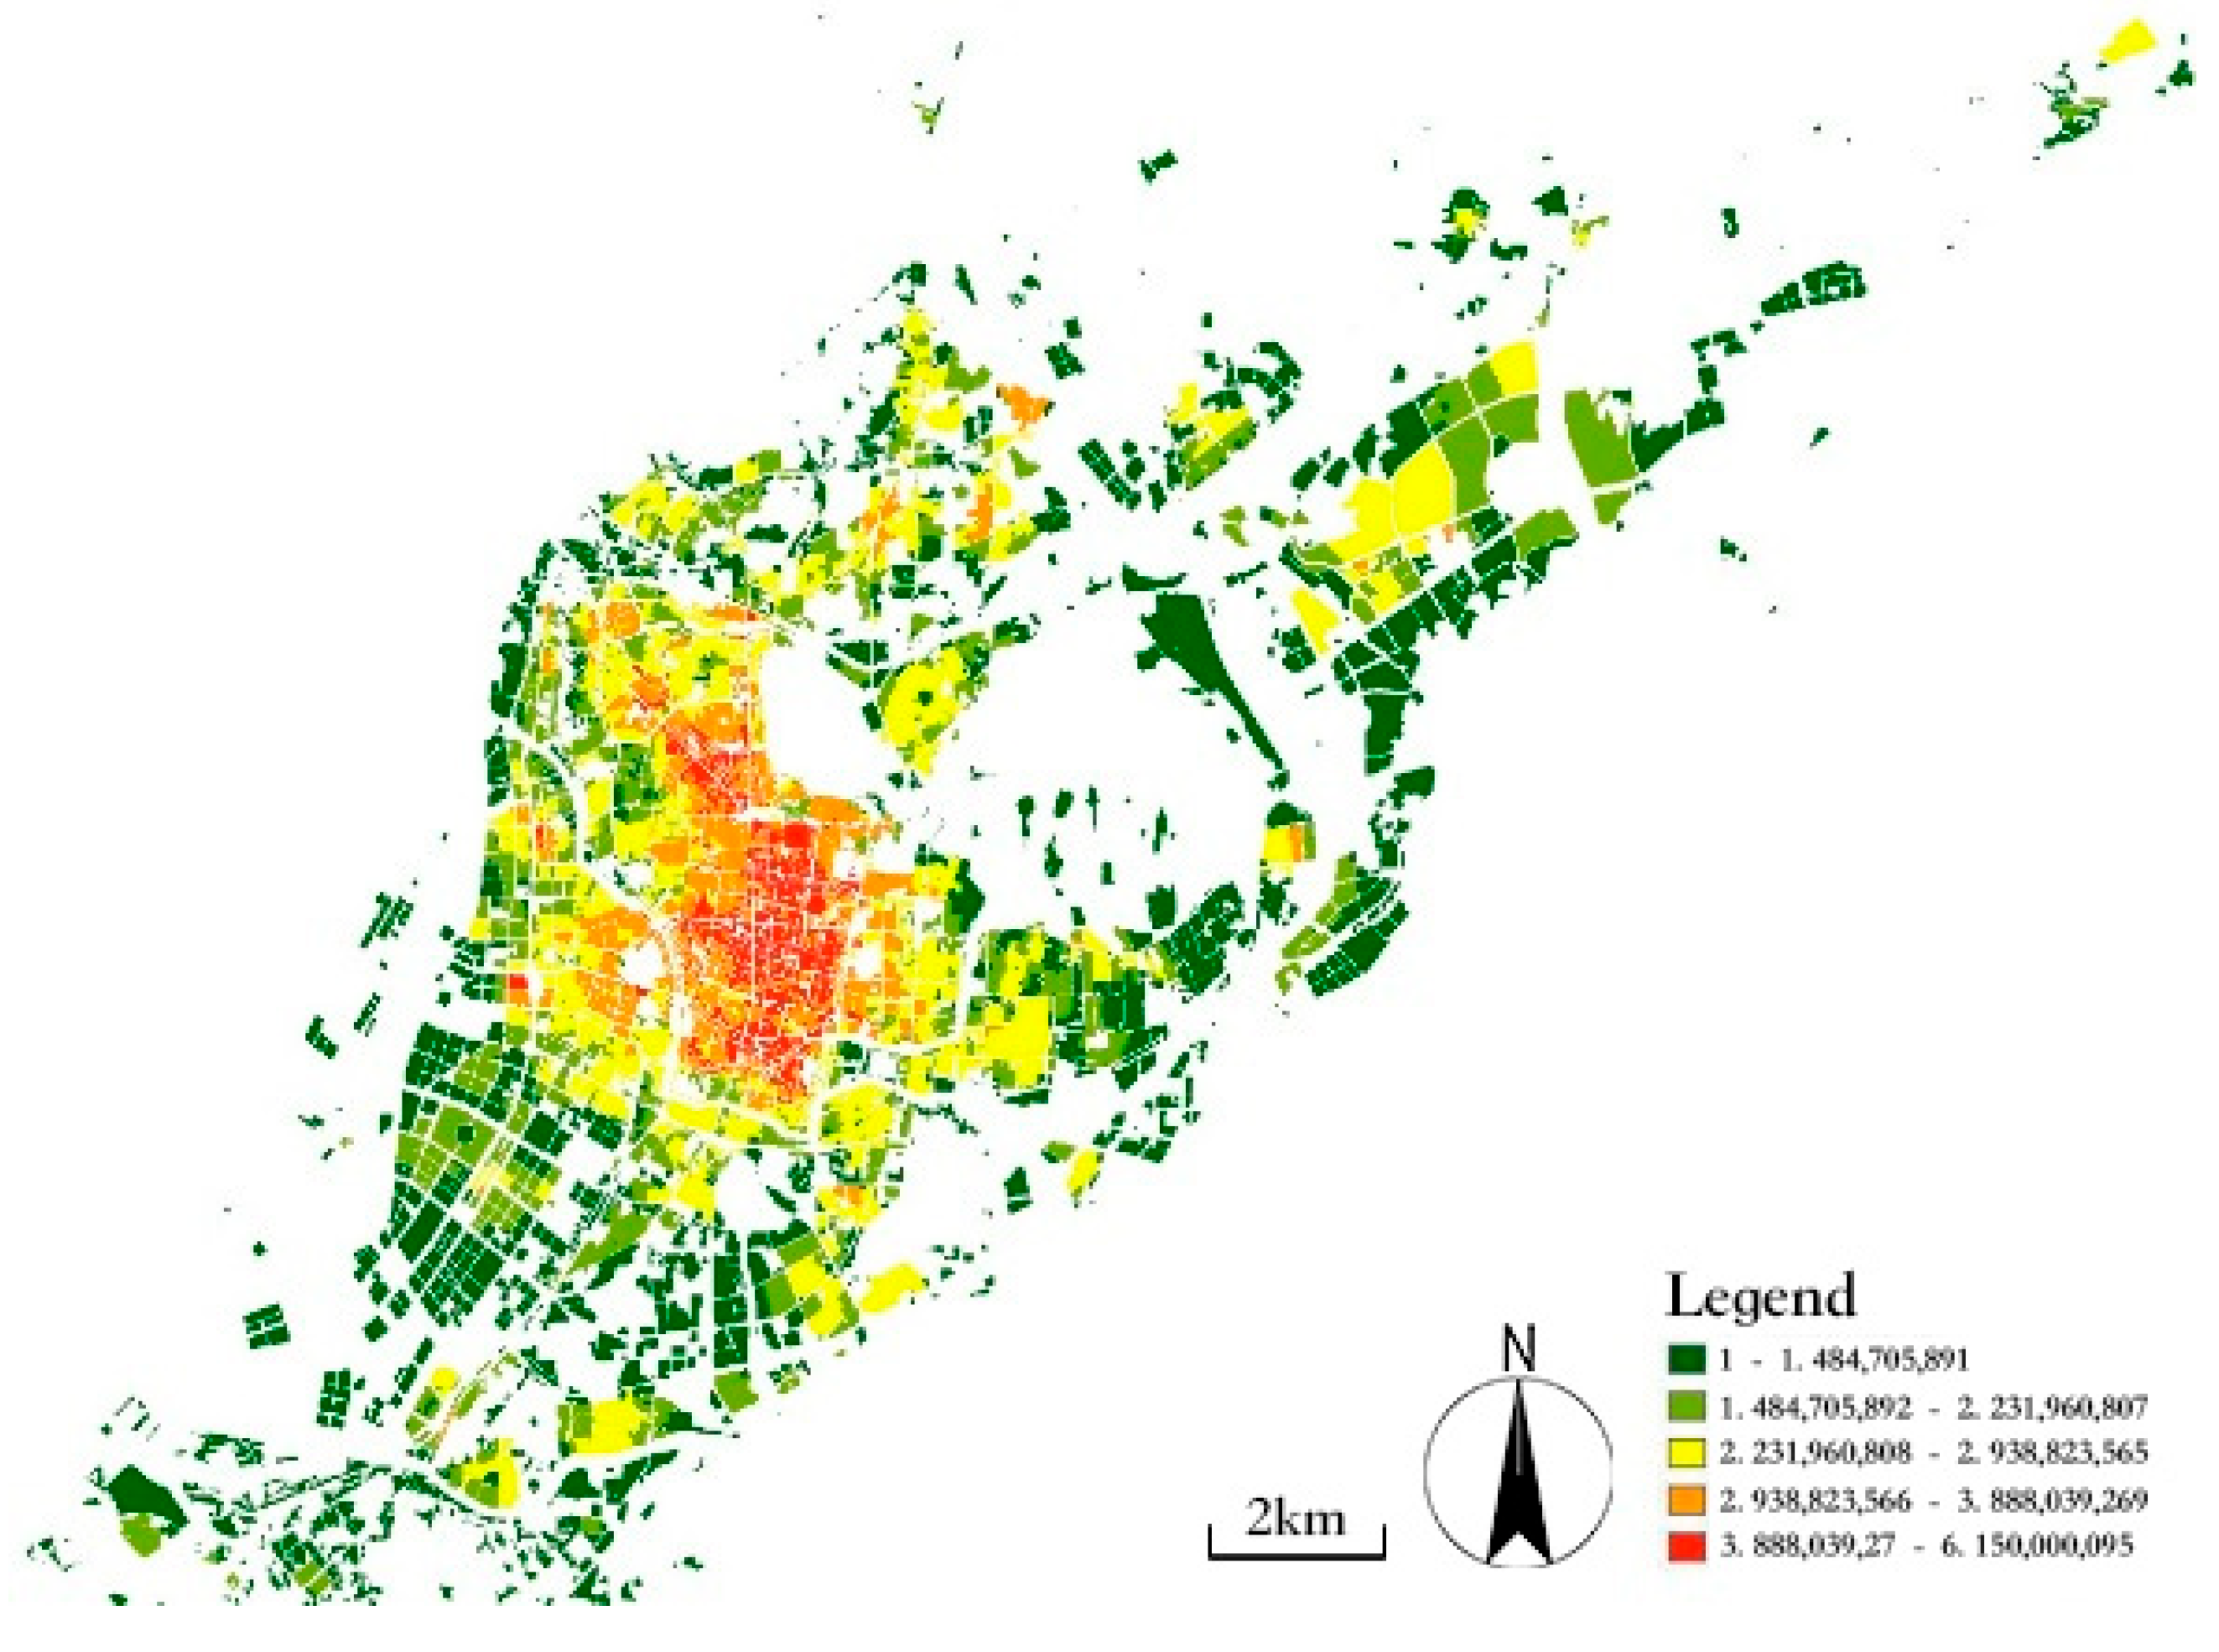
4.3.1. Commercial Aggregation Centrality

Frequency Density (FD), known as a POI data eigenvector index, was developed for land usage cells A, B, and R, which were taken together as a single group.
FD = the number of commercial POIs in the A, B, and R land usage/corresponding cell area.
A value of the global Moran’s I coefficient of FD of 0.28 was obtained in our global spatial autocorrelation analysis, indicating that the spatial distribution of commercial establishments in Nanjing’s main urban area has a significant spatial positive correlation characteristic and the overall layout presents a feature of aggregation. In order to identify core commercial agglomerations and analyze the structure of commercial districts, a partial spatial autocorrelation analysis was used (Figure 3), and we found that the Xinjiekou area was the core commercial agglomeration. Besides, “high-high” commercial agglomeration in Nanjing’s main urban area was located along three east–west axes and one north–south axis, including Xinjiekou Hanzhong Road–Zhongshan East Road, Guangzhou Road–Zhujianglu Road and Shuiximen Street–Shengzhou Road–Jiankang Road, and Zhongshan South Road–Zhongshan North Road. Therefore, the whole layout of commercial activities can be described as “one core, three horizontal axes, and one vertical axis”.
In addition to the main core and axes, there are also minor clusters of commercial establishments, such as Zhongyangmen, Longjiang, and Jiangdong, which are commercial cores with a higher concentration of commercial agglomeration.

4.3.2. Density of Commercial Establishments

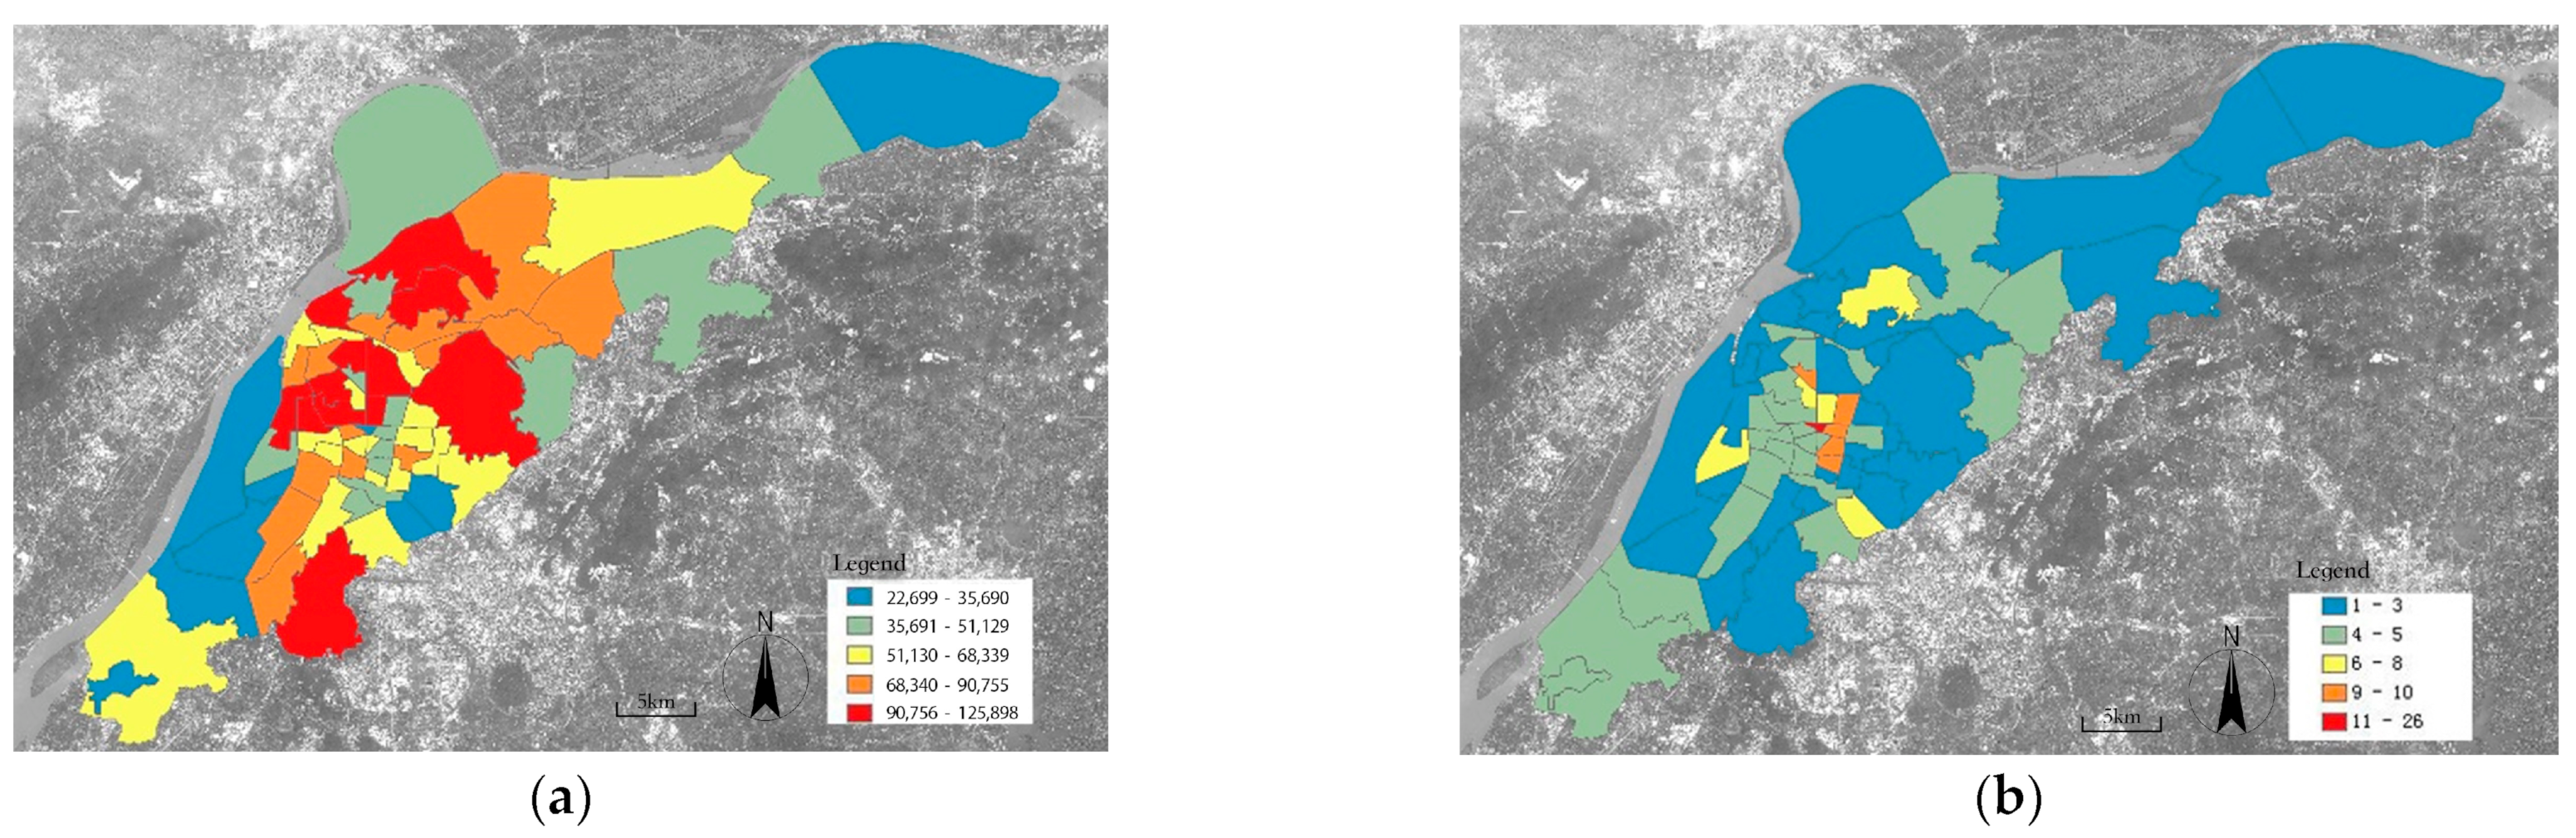
  • Facility population service level
Police data were used for this assessment because the areas of police precincts or jurisdictions were the smallest of all population enumeration units of government agencies and the census bureau. Based on the latest population statistics data obtained from police stations, the populations of different jurisdictions were uneven. Among them, the Zhongyangmen and Ninghai Road areas had a notably larger population than the others (Figure 4). By calculating the commercial facility service level per capita of different jurisdictions, it was concluded that the service level of the urban central area was considerably higher than that of the rural area. In Nanjing, the service levels of the commercial facilities differed among jurisdictions, but the Huaihailu Road area had the highest such level of the jurisdictions in Nanjing’s main urban area. Therefore, this unbalance needs to be addressed.
2.
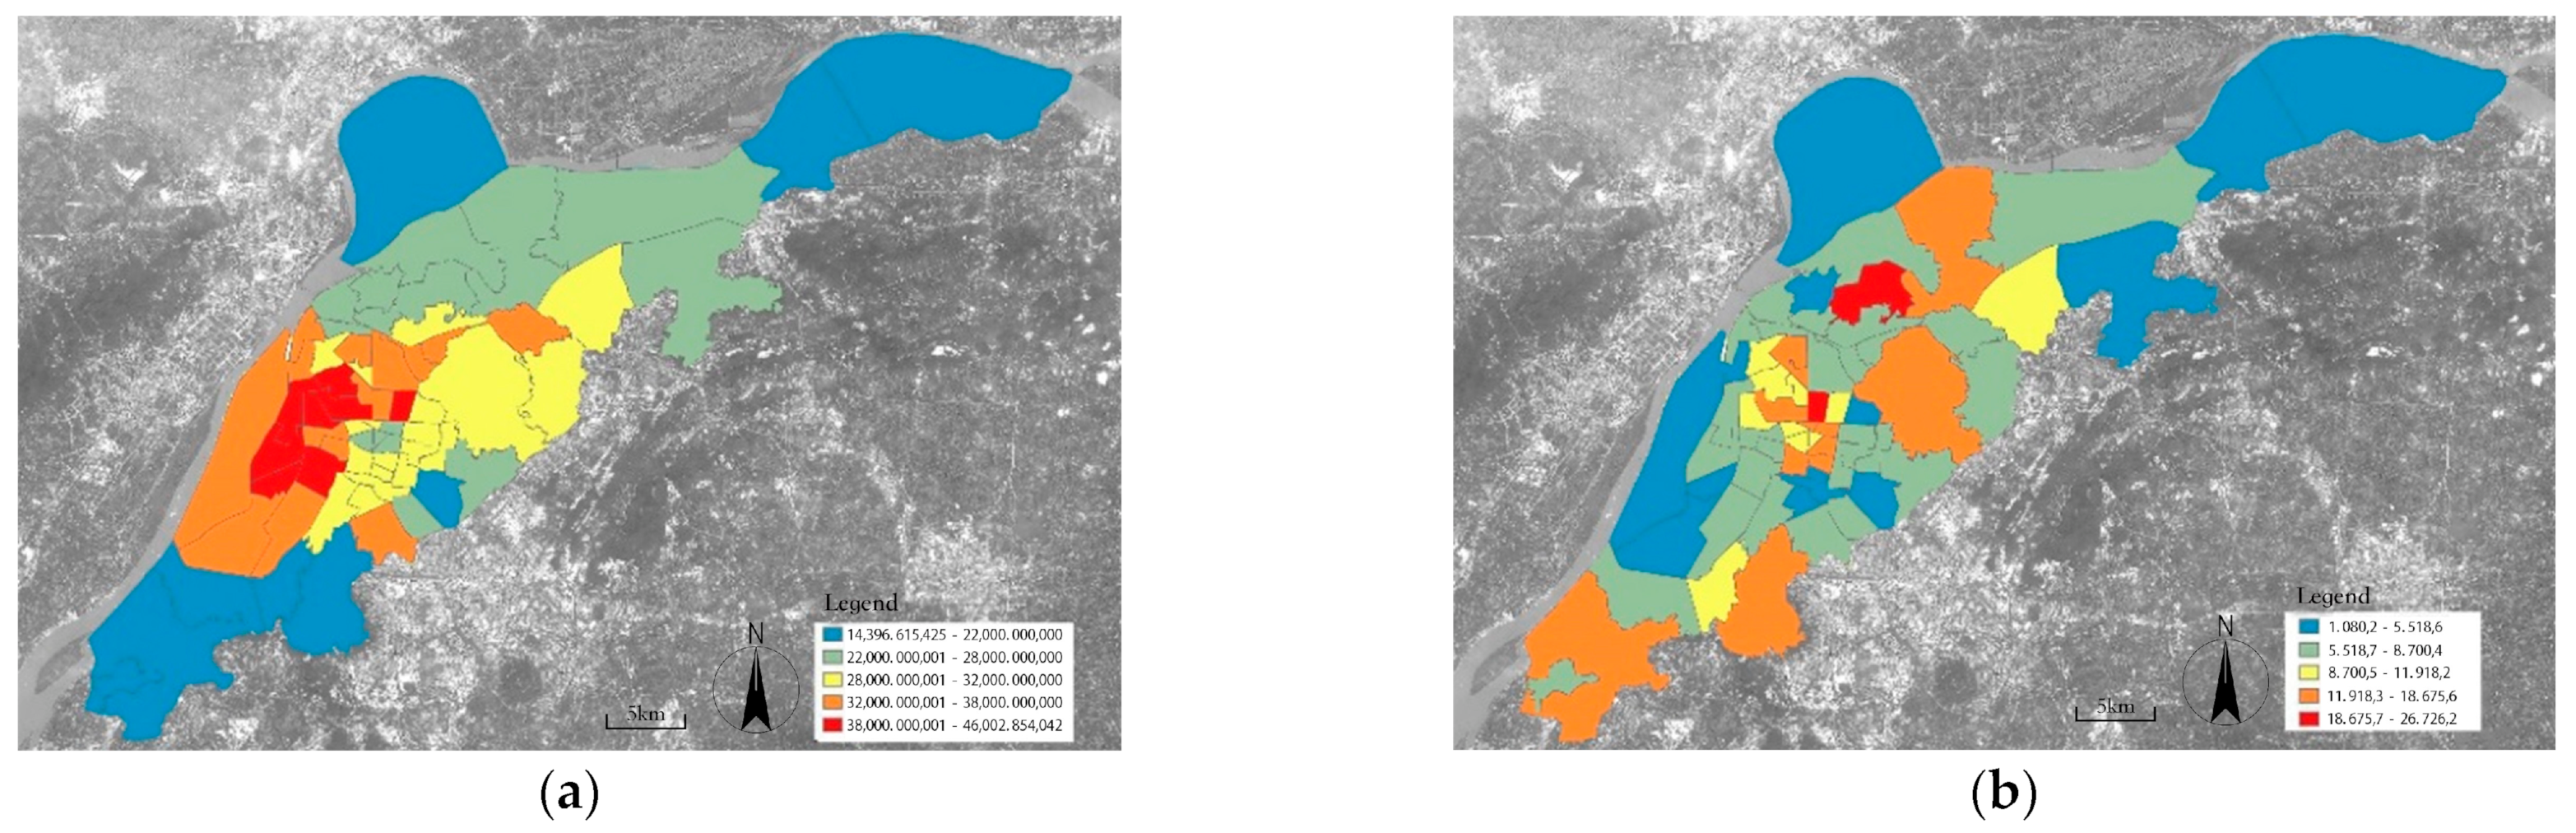
Housing price and service level
To analyze the housing price data (Figure 5a) for Nanjing’s main area, we collected information from Anjuke, one of the largest and most authoritative online real estate agencies in China (https://shenzhen.anjuke.com/ (accessed on 1 January 2015)), which is a popular online platform that publishes real estate information of homes/apartments for sale or rent. We found that most areas with high housing prices but low densities of commercial establishments were located in Hexi District (Figure 5b). In the main urban area of Nanjing, the areas with high housing prices and high densities of commercial establishments included Xinjiekou, Ninghai Road, and Zhongyangmen. Moreover, there were areas with low housing prices but with high densities of commercial establishments, the most prominent among which was Maigaoqiao. No positive correlations were established between the density of the commercial establishments and the housing price in the main urban area of Nanjing.
3.
The relationship among population density, land price, and commercial facility service level
The analysis of the number of commercial establishments per capita and commercial establishments under housing price per unit revealed that the density of the commercial establishments in the Huaihailu Road area and the Wulaocun area ranked in the top two, which indicated that the densities of their commercial establishments were not strictly related to the population. Similarly, our results showed that the housing price was not merely associated with the population density but was also affected by the population structure, history, industrial structure, and other indicators. In addition, no higher densities of commercial establishments were observed in areas with higher housing prices.

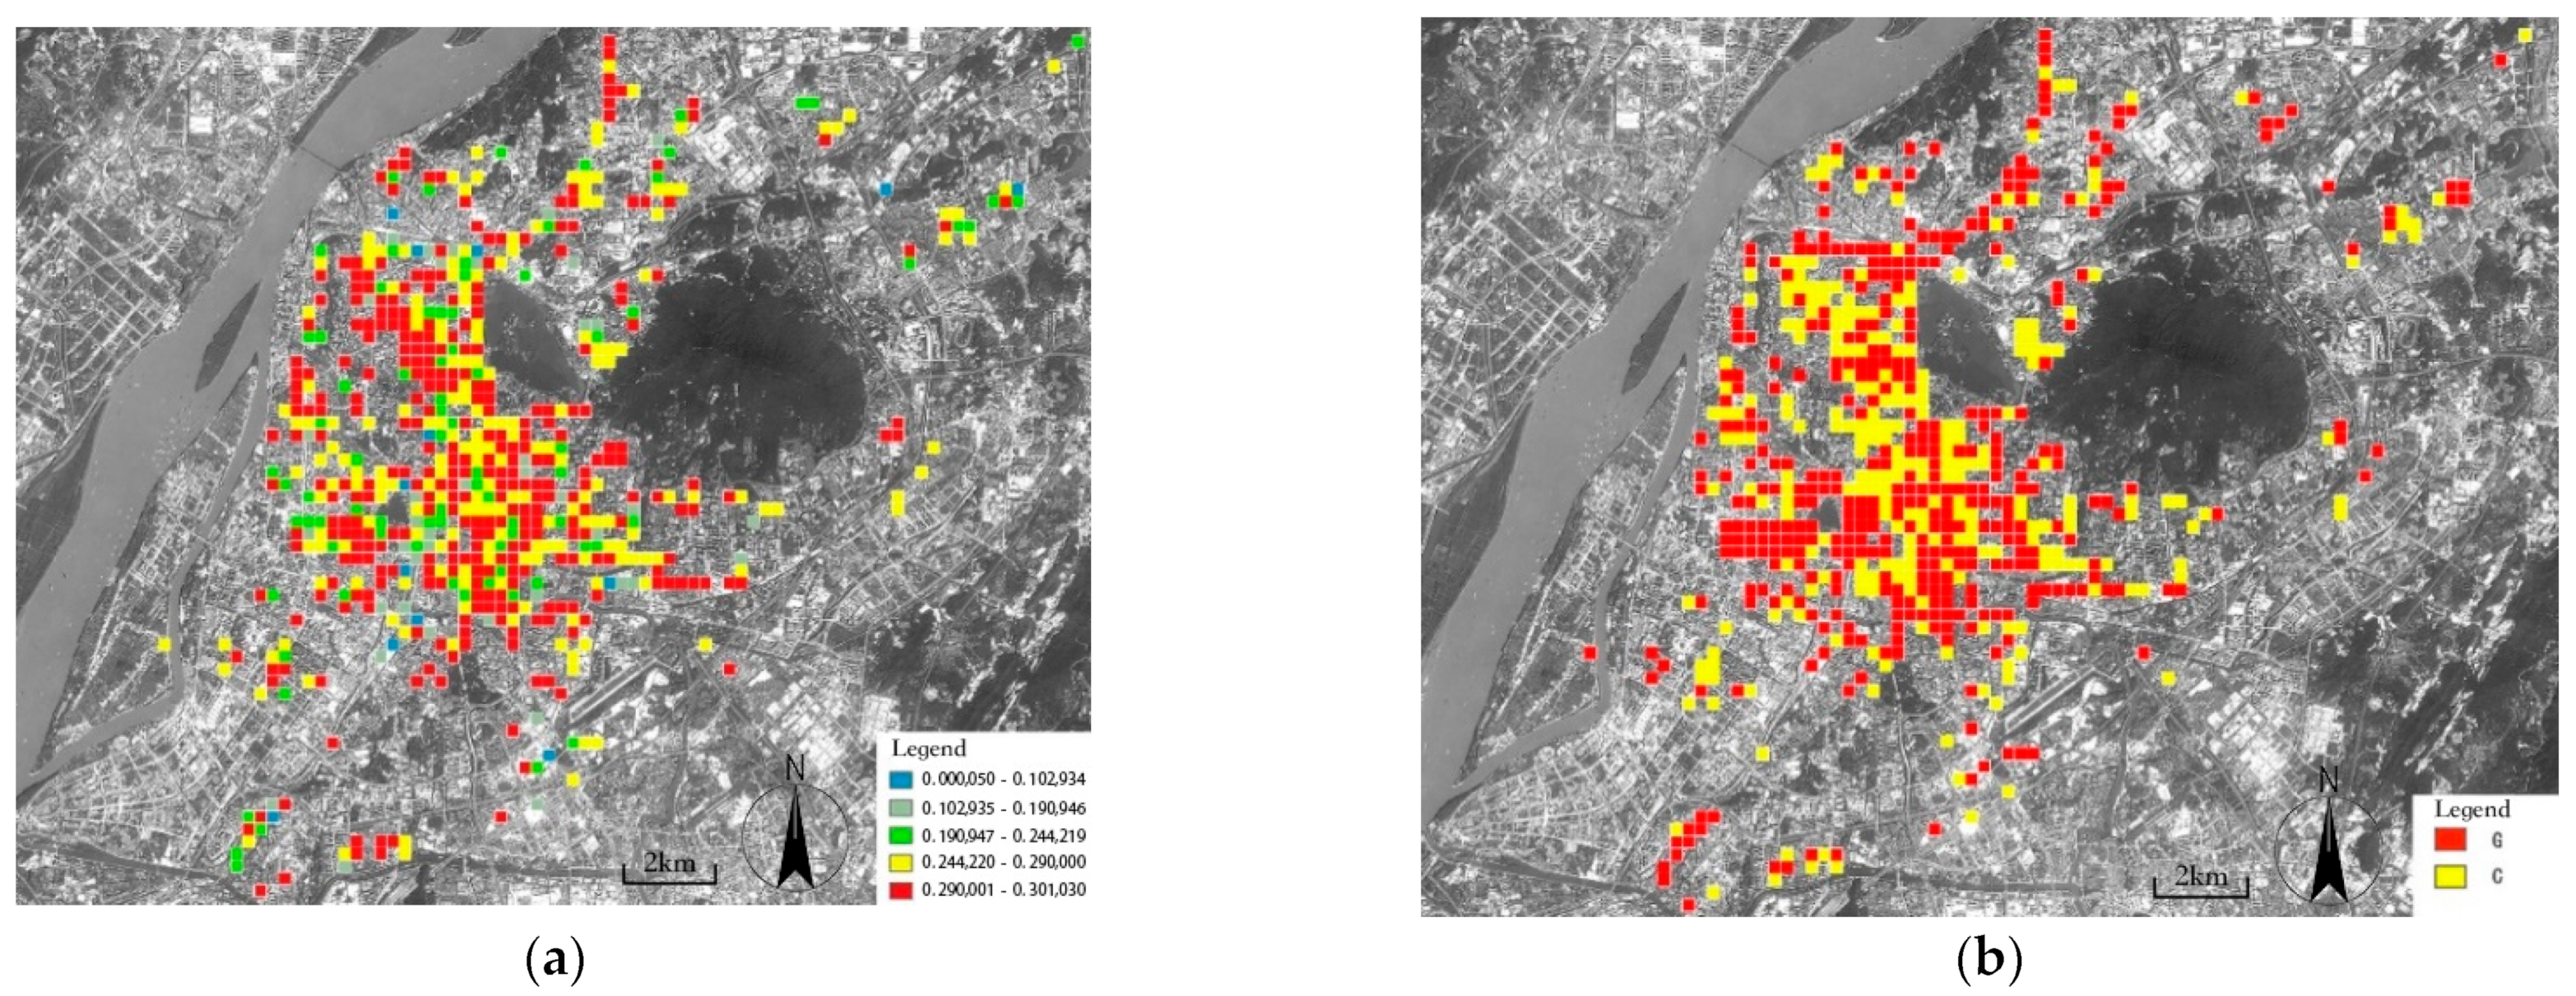
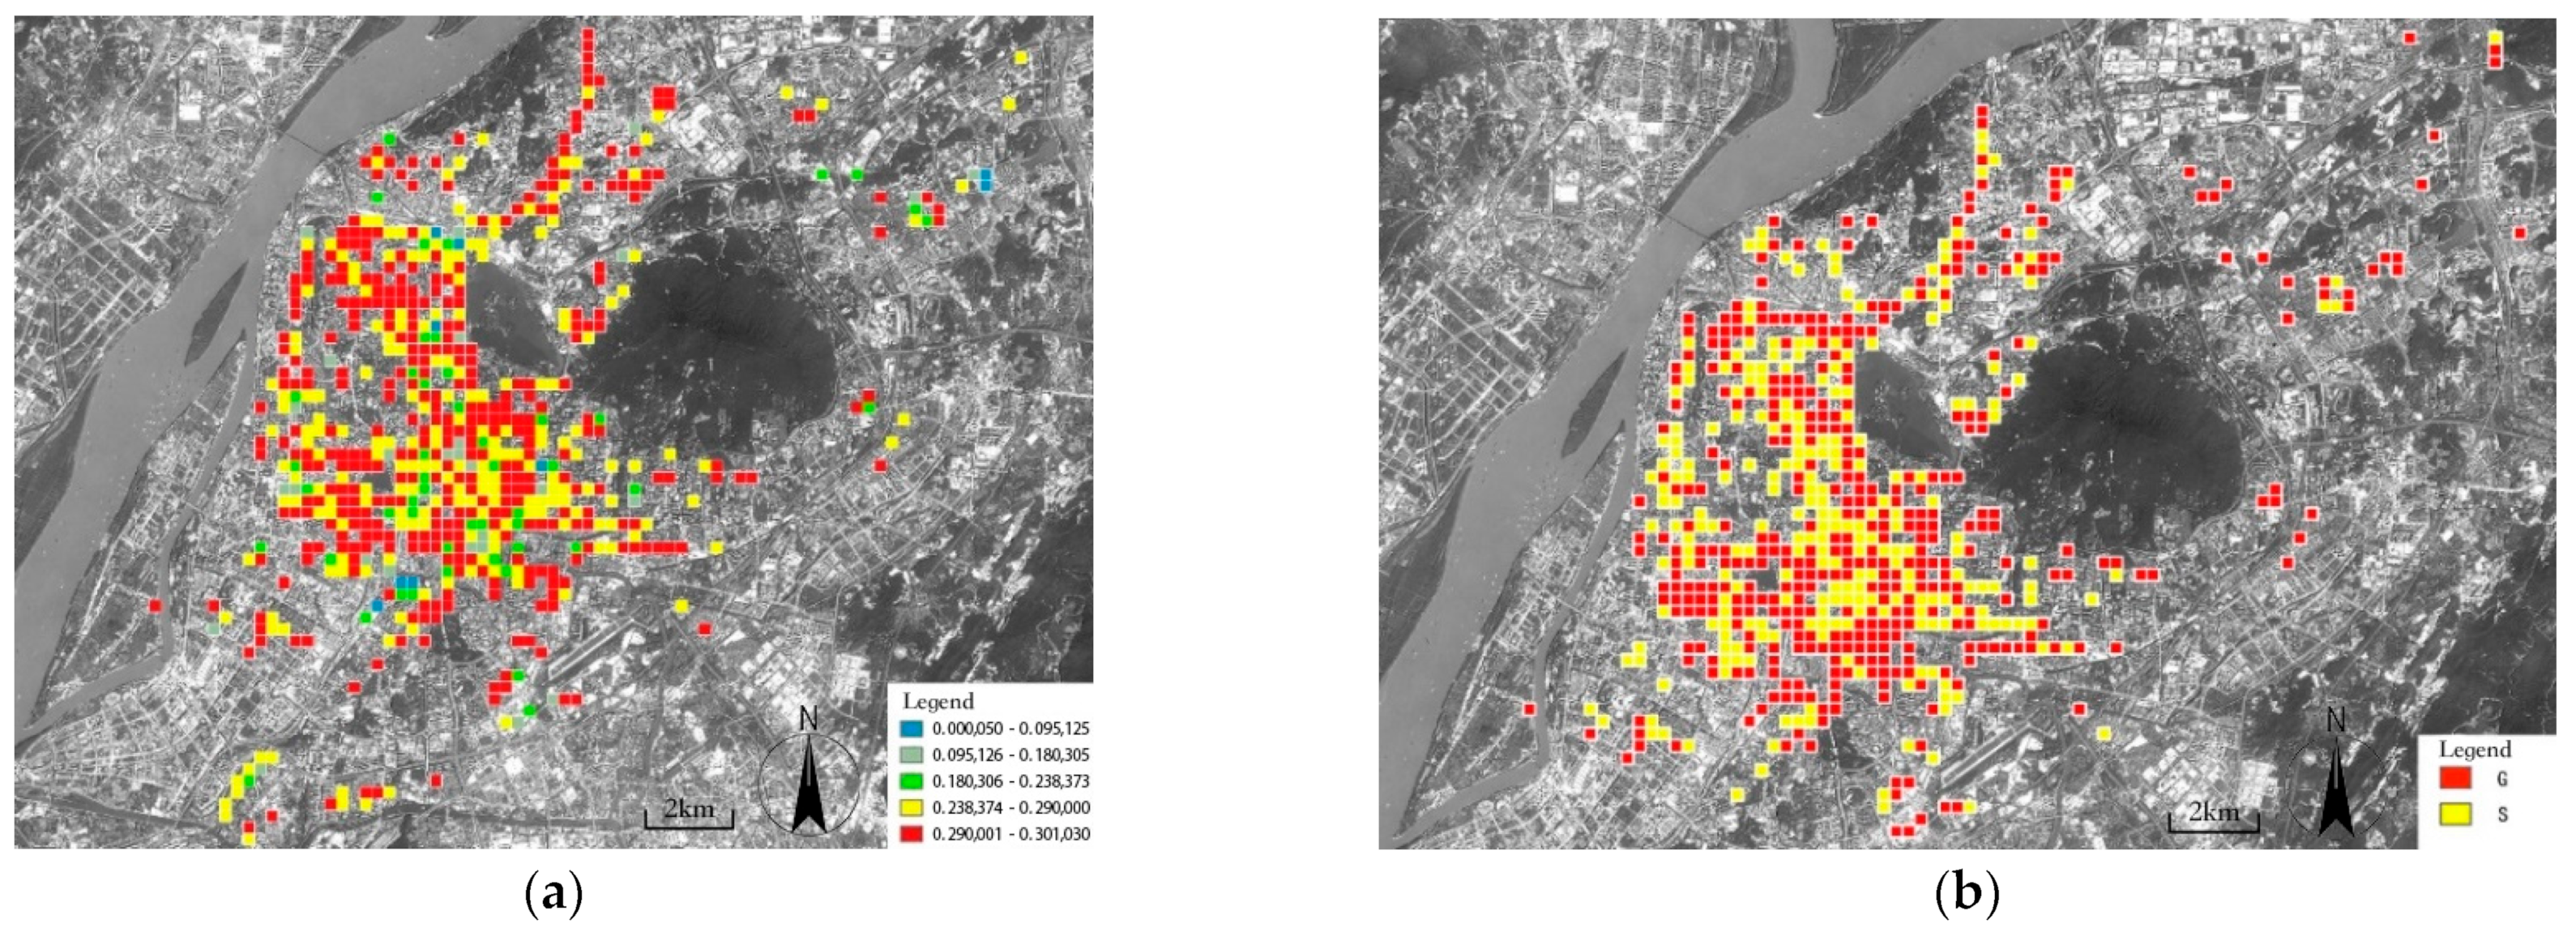
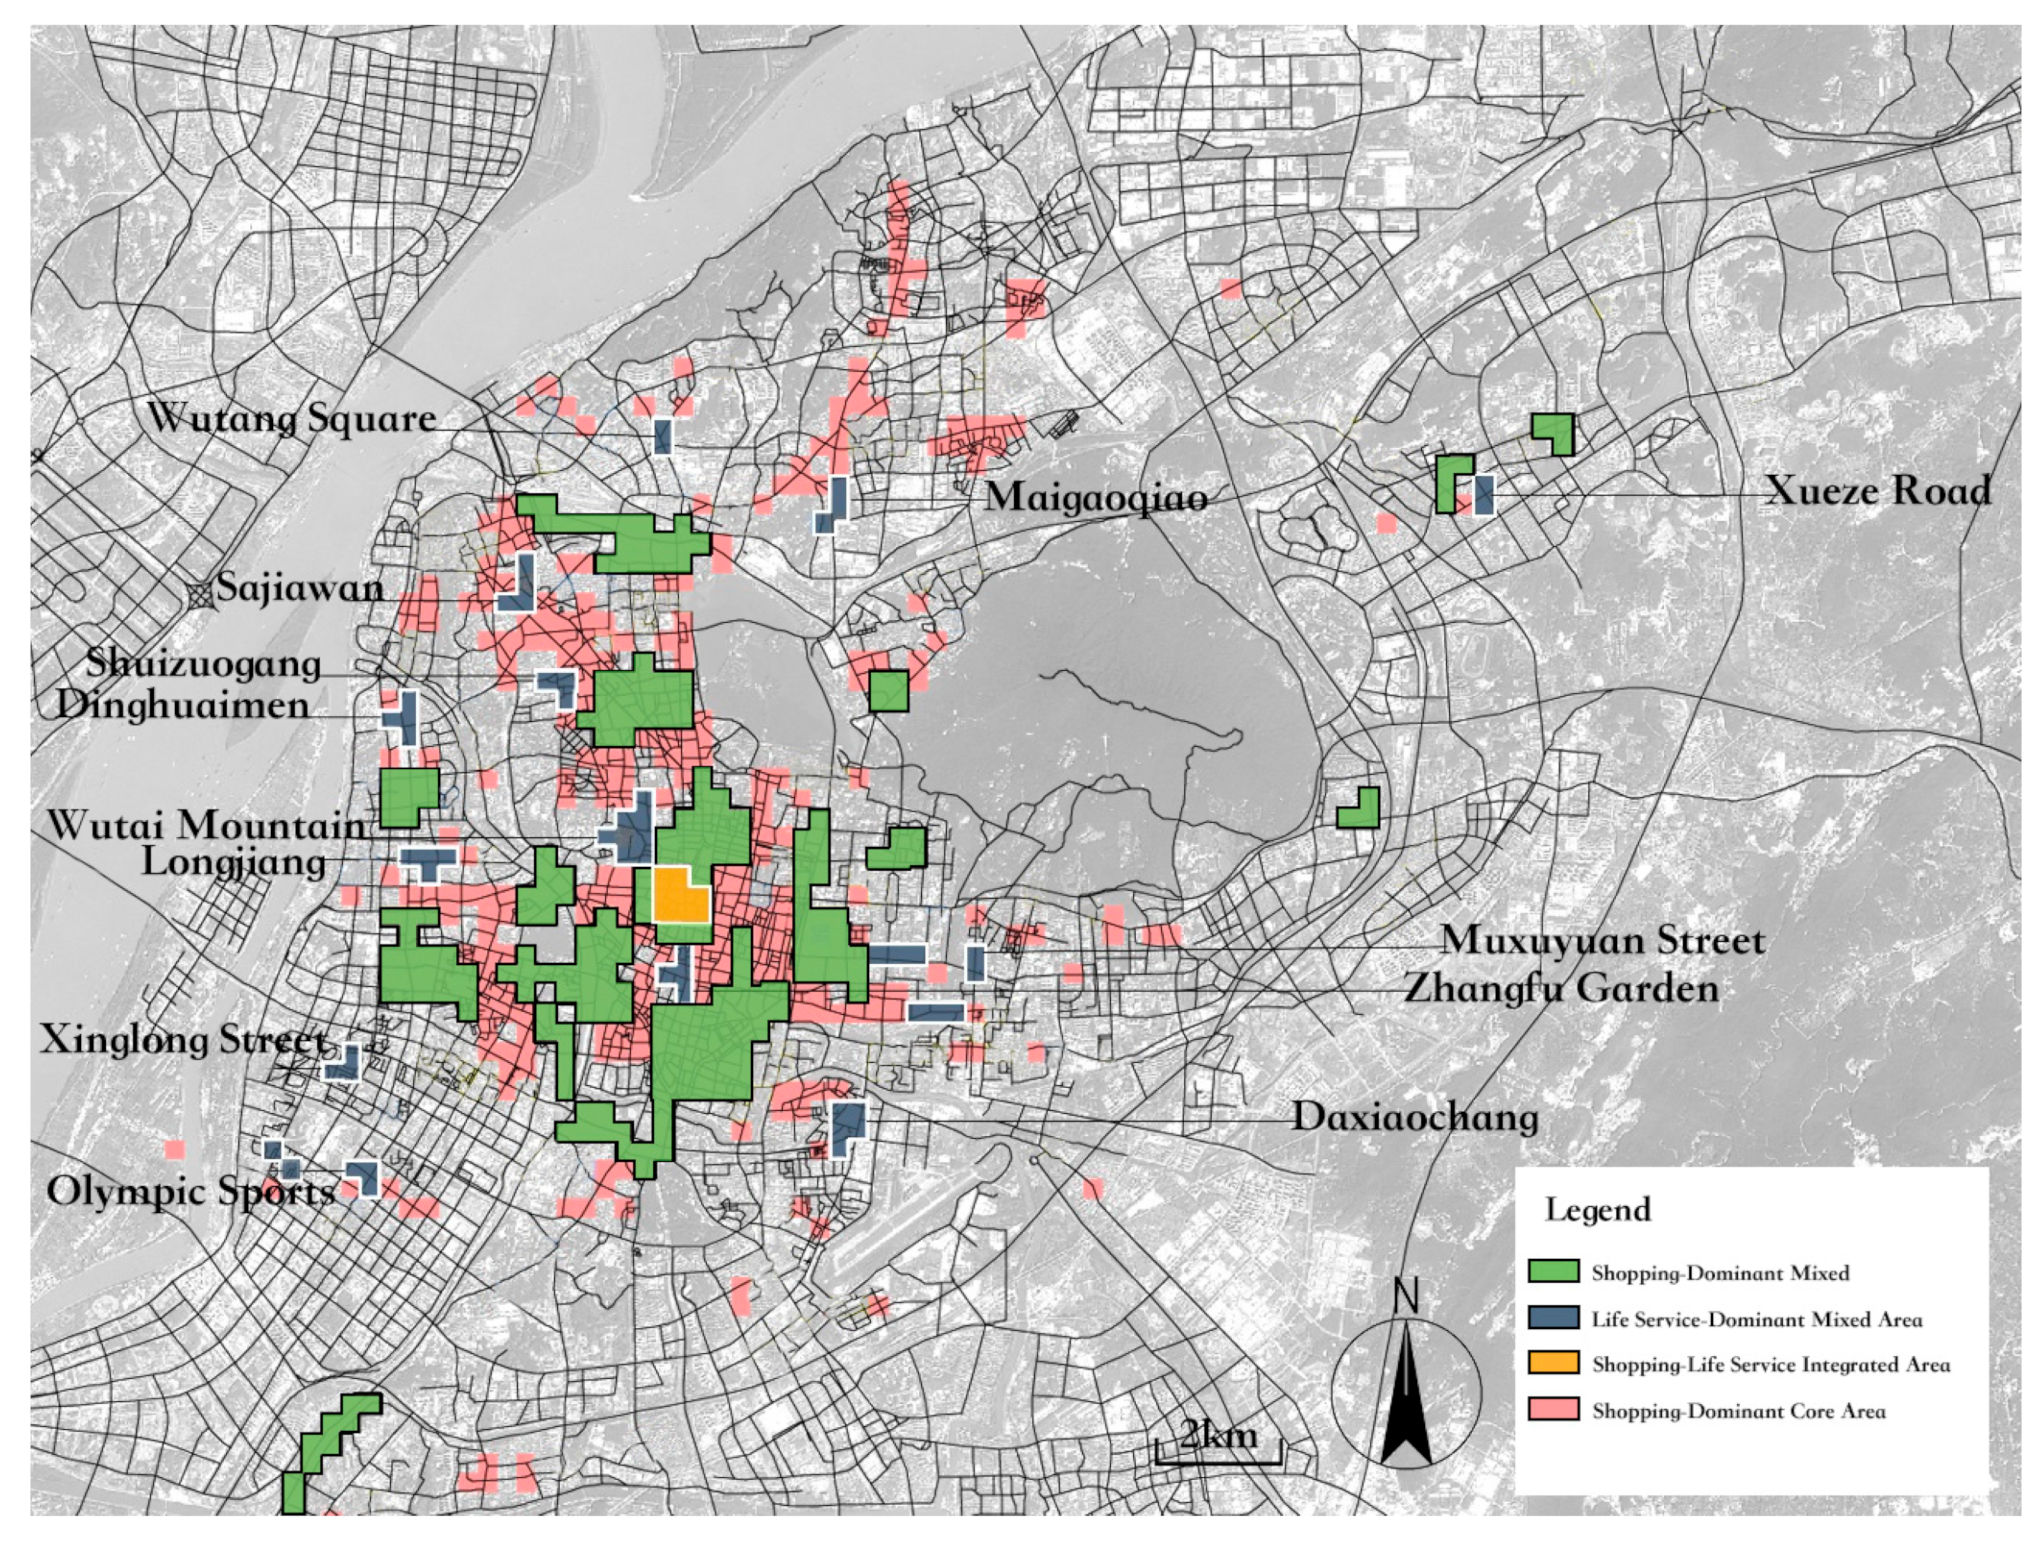
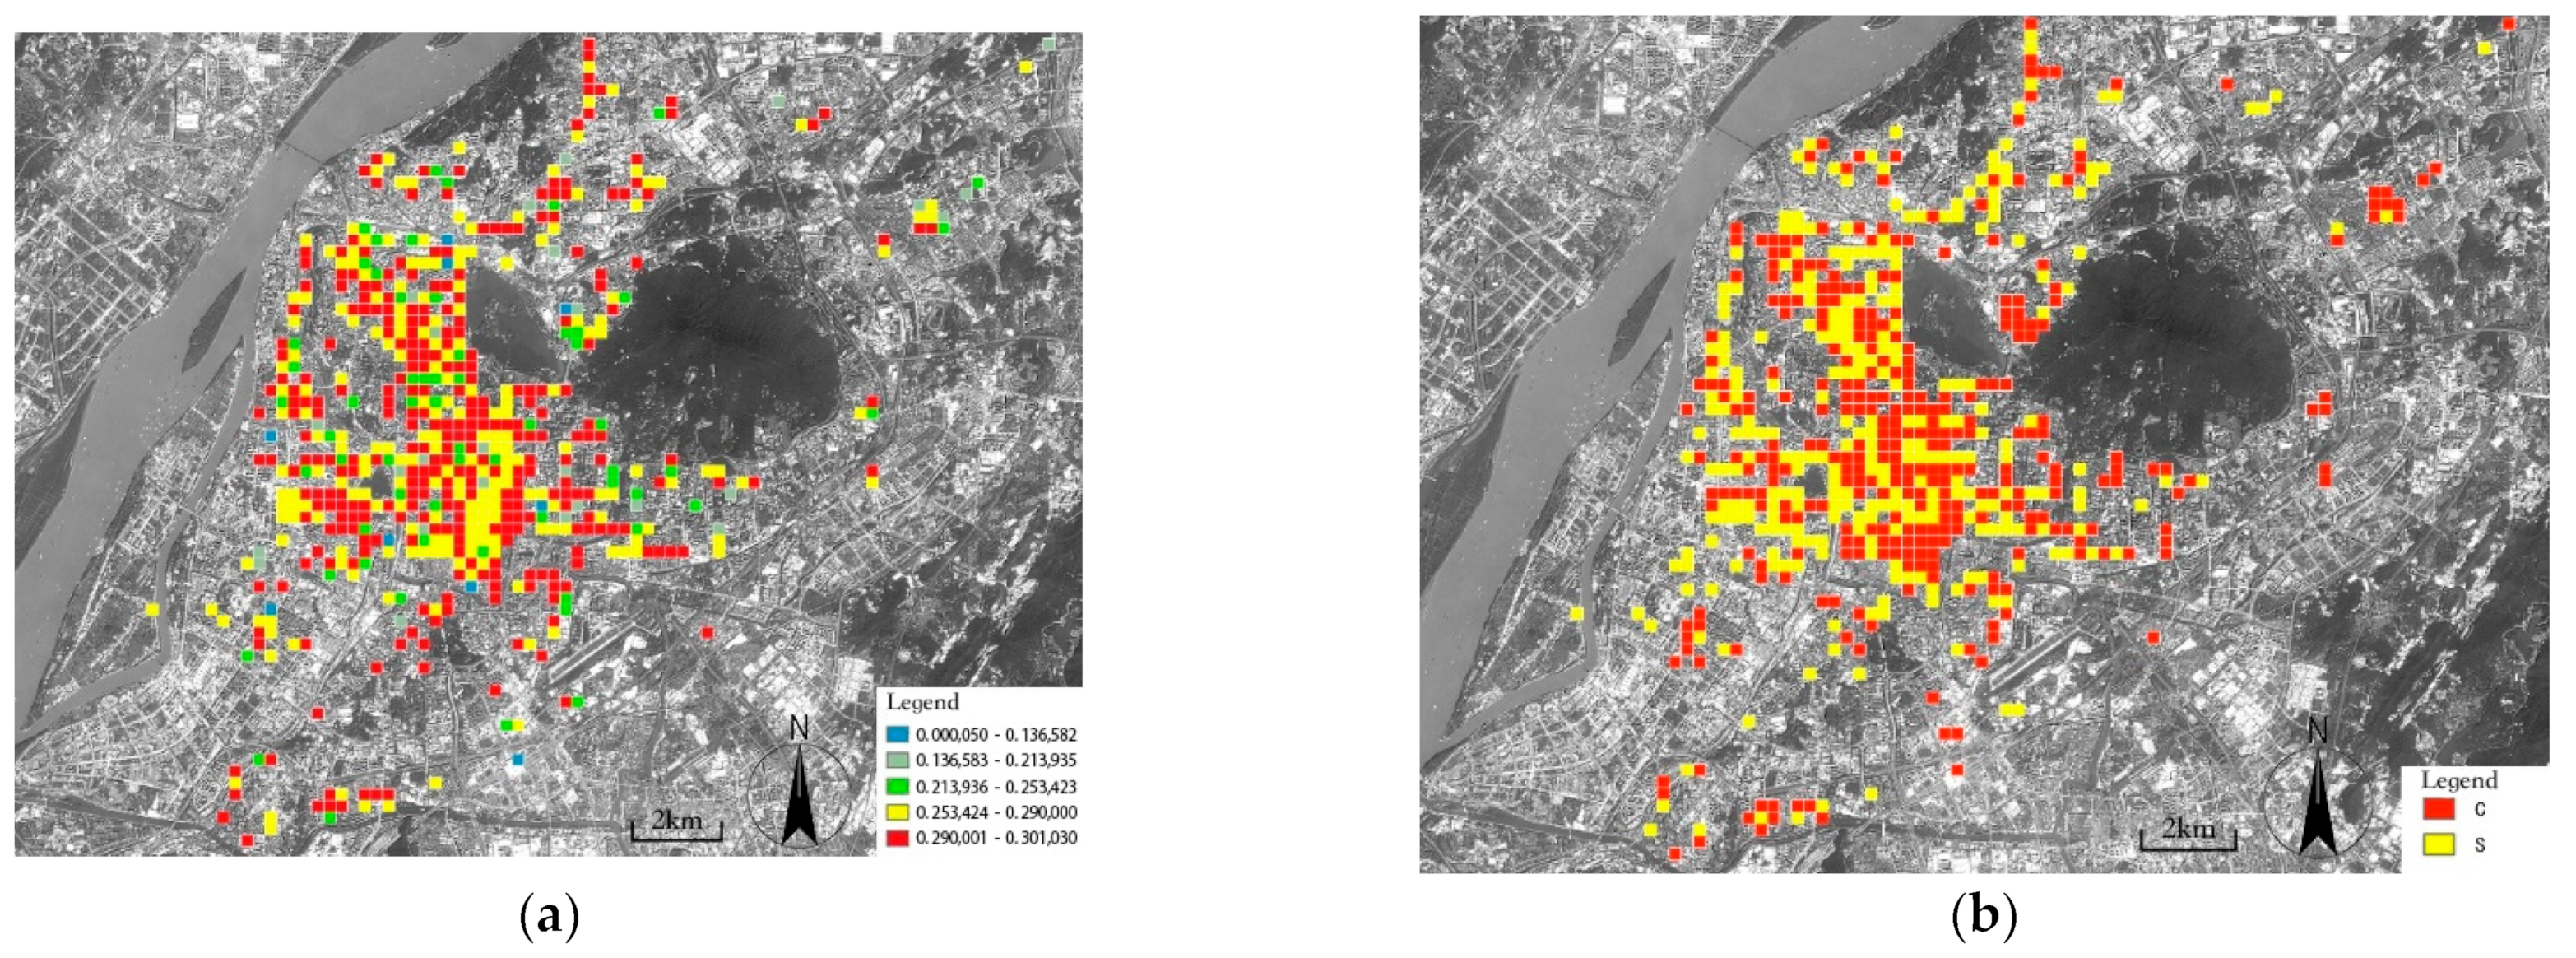
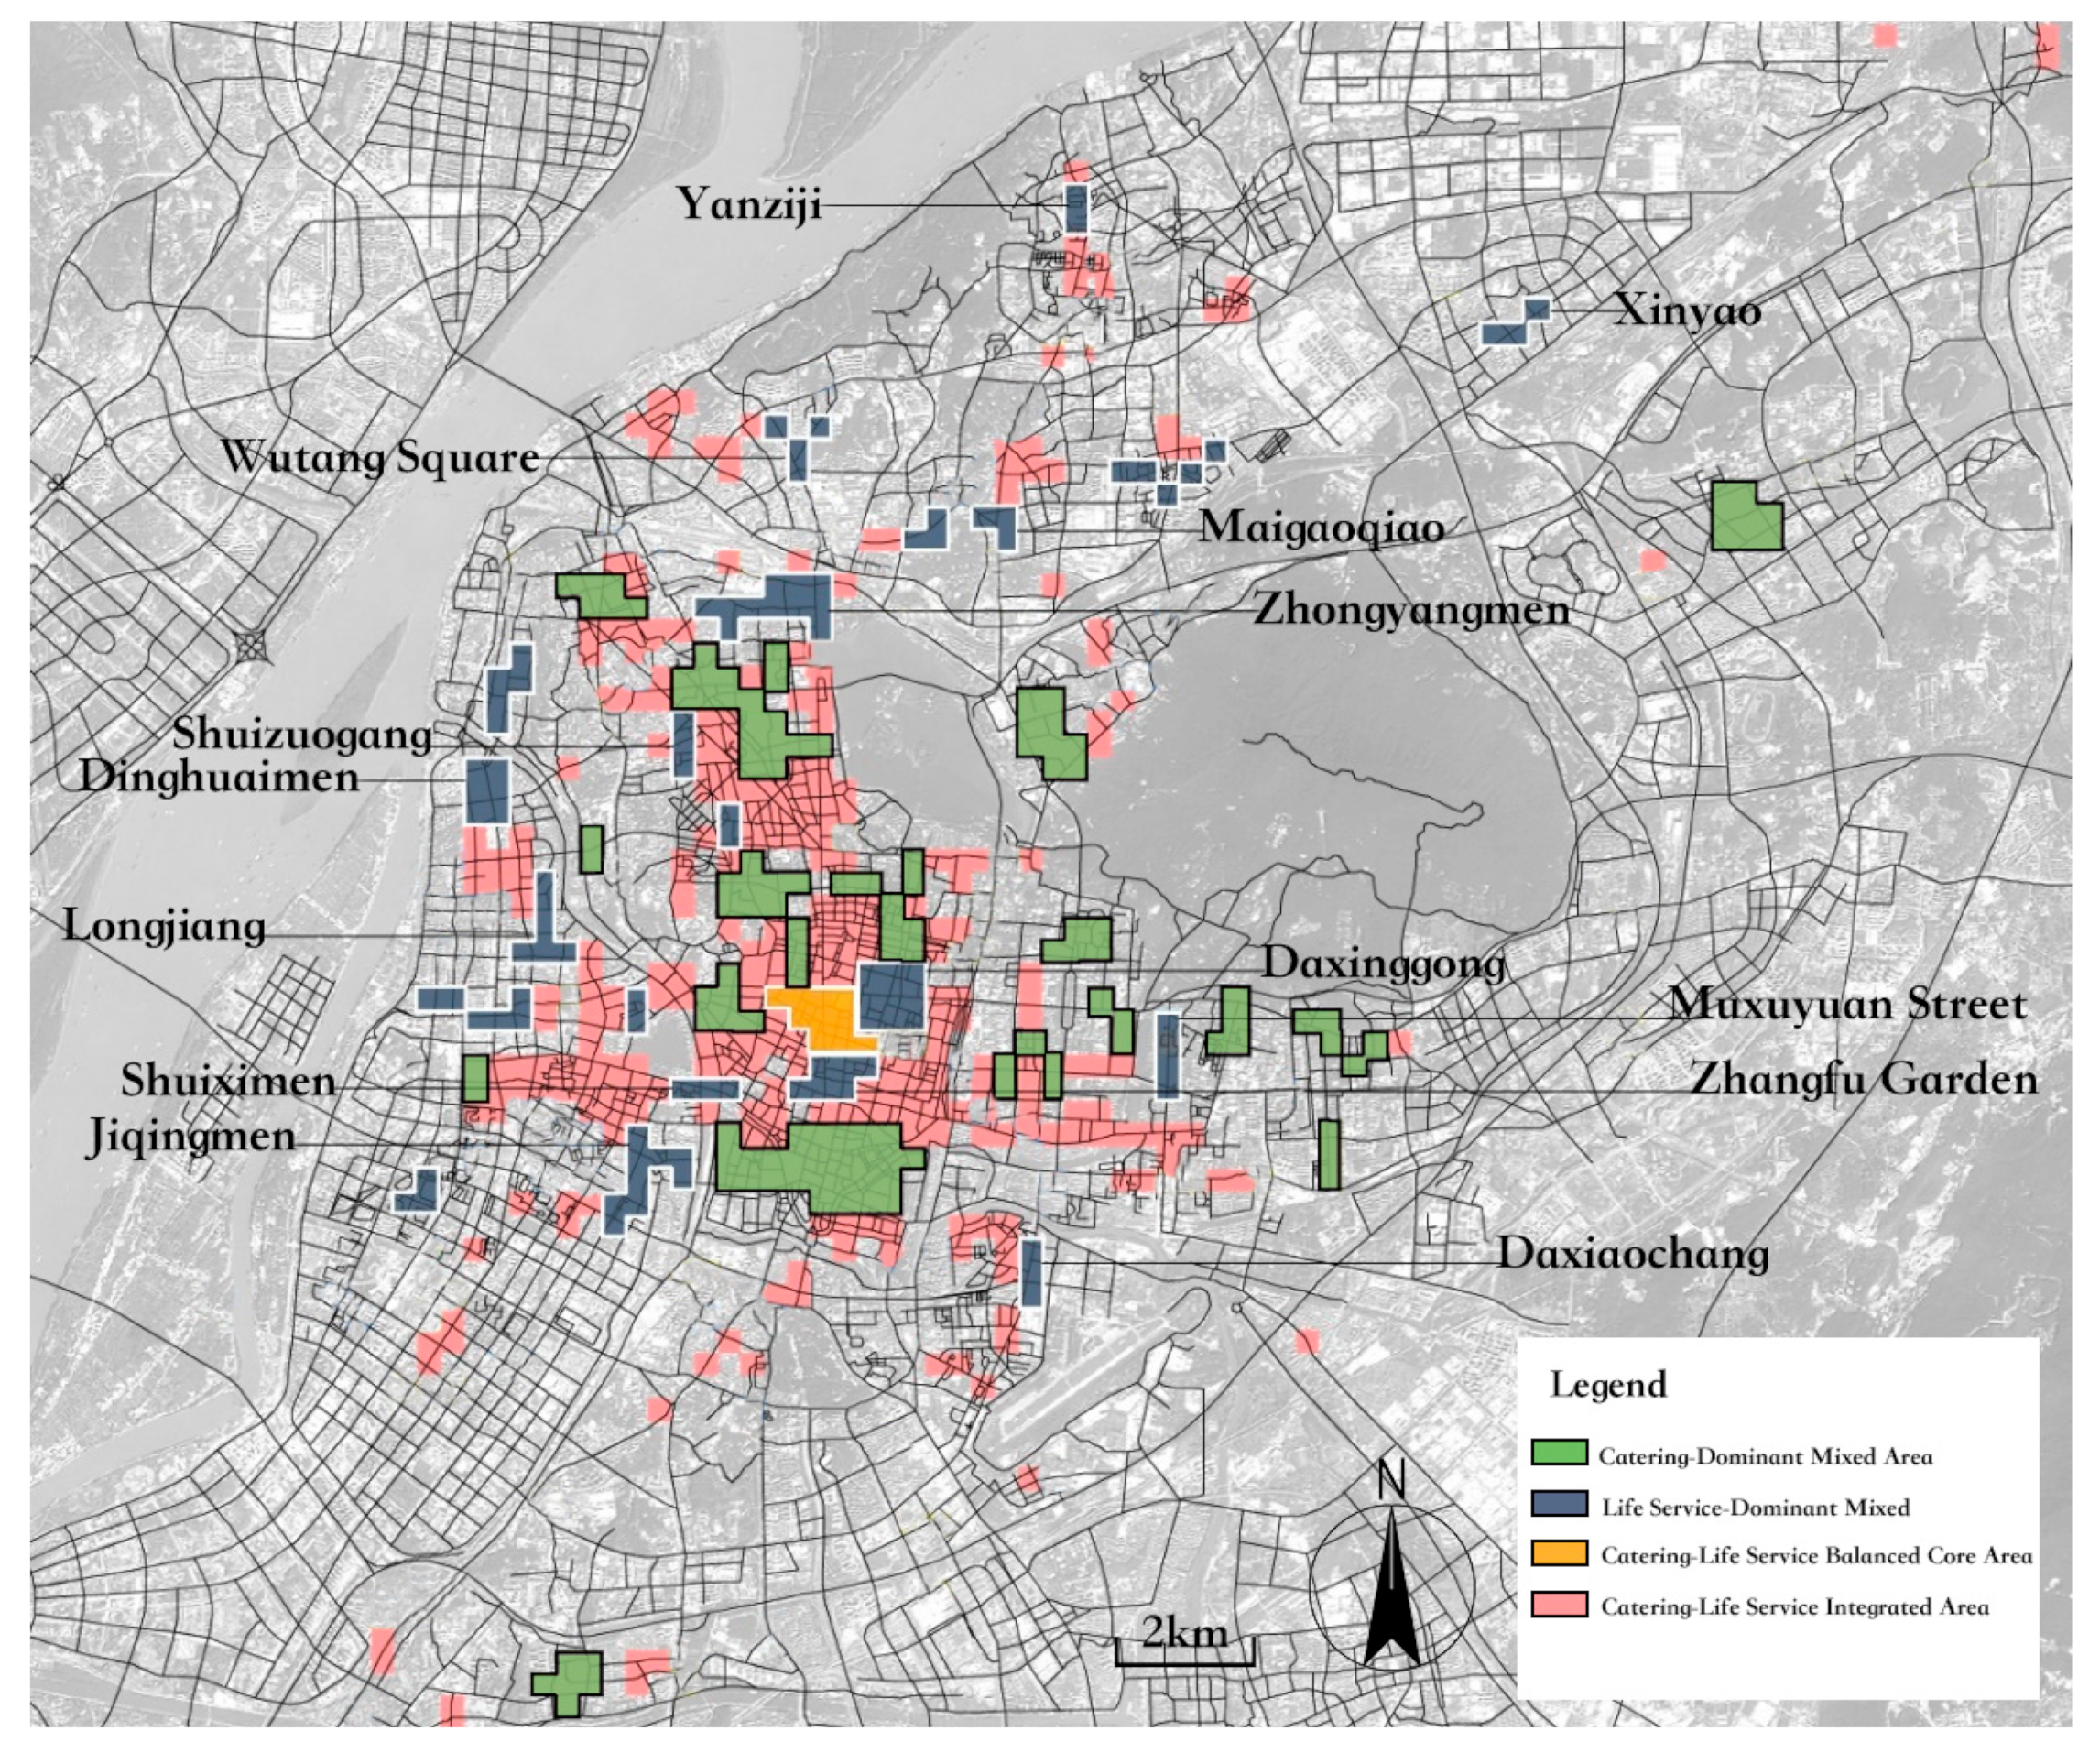
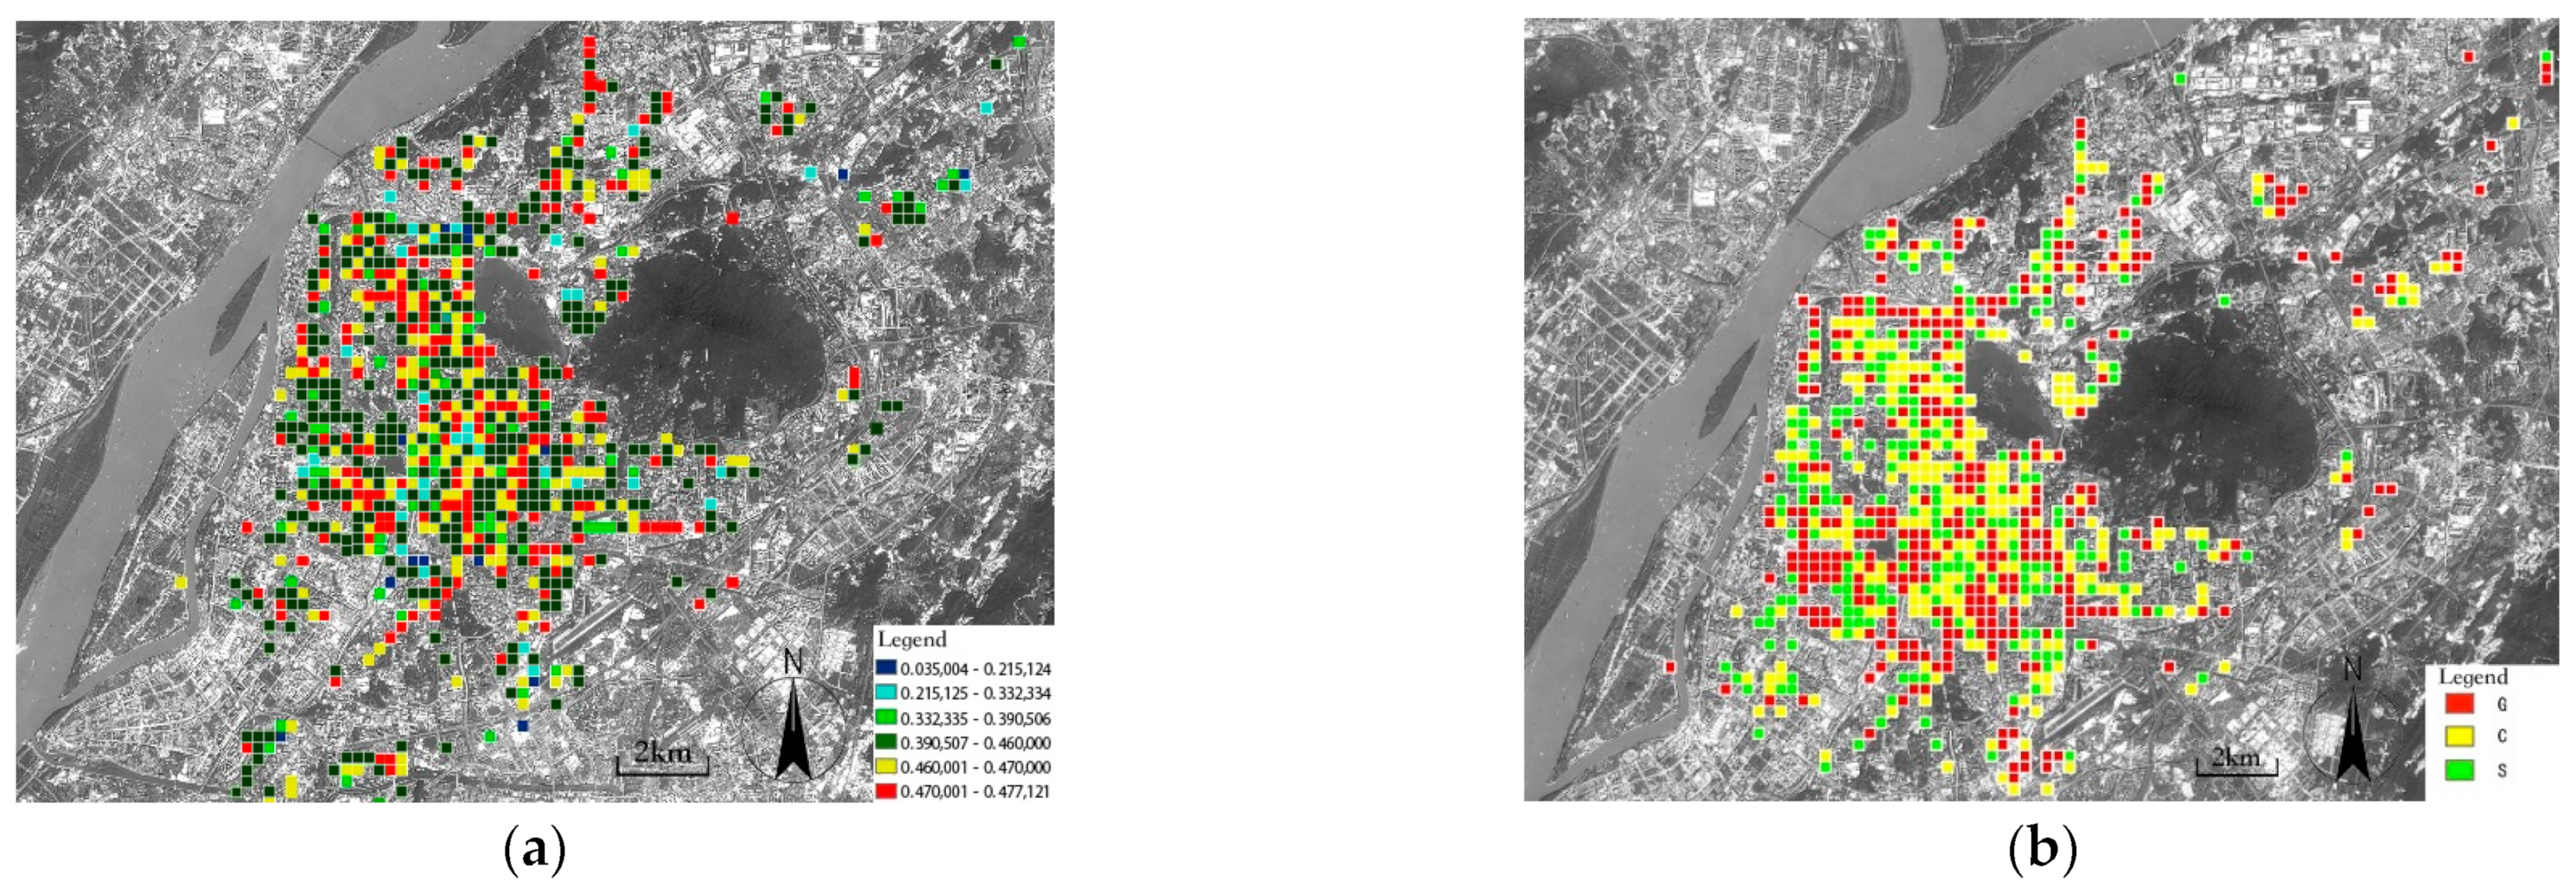
4.3.3. The Spatial Mix of Commercial Establishments

The urban structure pattern often reflects the spatial dependency among different establishments and facilities, as suggested by the First Law of Geography (which states that “everything is related to everything else, but near things are more related than distant things”). This universal law reveals the internal relationship and layout based on urban spatial data and interprets the geographic processes of the objective world. The level of the distinct mixture of different commercial establishments in an area characterizes its urban functions and is an important indicator of the diversity of its commercial activities and service abilities.
In this work, we implemented the concept of entropy in the information theory to calculate the level of mixing of the commercial establishments in the study area. Entropy is an important concept in information theory, which is used to measure the occurrence probability of random variables in a certain experiment. A more orderly system has lower entropy. Conversely, a more chaotic and mixed system has a higher entropy. Information entropy is a measurement of the order of a system that can be used to measure the level of integration of local commercial establishments.
The following formula is used for entropy calculation:
S X = i = 1 n P i l o g P i
where S[X] represents the entropy of a random variable; Pi is the probability of X equaling an Xi value. This study examined three main types of commercial establishments in the study area: shops that sell various types of goods (G), various types of restaurants (R), and shops that provide various types of services (S). For example, let us take two cells (numbered I and II) in the study area. In cell I, G accounts for 35%, R for 34%, and S for 31% of the total number of these three types of commercial establishments. In cell II, G accounts for 72%, R for 20%, and S for 8% of these three commercial establishments. The entropy calculation result is S[I] = 0.476 and S[II] = 0.332. The entropy calculation result shows that the mixing level in cell I is higher.
To analyze the mixing pattern of the three types of commercial establishments in the study area, we first covered the study area with a spatial grid structure of 300 m * 300 m. We then calculated the number of the three commercial activities in each grid cell, ignoring the grid cells with less than 20 commercial establishments. The level of mixing of the three types of commercial establishments in the main urban area of Nanjing was finally computed using the entropy method. The spatial patterns of the entropy levels of the grid cells in the study area are presented in Figure 6 and Figure 7. On that basis, the present research suggests an approach for the improvement of the diversity of commercial activities and commercial service capacity.
As can be seen in Figure 6 and Figure 7, the following observations can be made about the patterns of spatial mixing of the three types of commercial establishments in the study areas: (1) in the main urban area of Nanjing, restaurant-dominant (R) areas are located mainly around colleges, universities, and the Olympic Center; (2) restaurants and goods selling (RG)-integrated areas are situated between restaurant-dominant (R) areas and areas where shops that sell various types of goods are dominant (G), forming transition areas between R areas and G areas; and (3) Xinjiekou area is the only extraordinary shopping core in the entire city of Nanjing.
As visible in Figure 8 and Figure 9, the following observations can be made: (1) Service-dominant (S) areas tend to be connected with GS-integrated areas and shopping-dominant (G) areas. (2) Shopping–service balanced areas (GS) are located mainly between shopping-dominant zones. Life-service-dominant mixed zones exist independently, and the area is not big. (3) Under the binary structure of shopping and life service commercial activities, there is no life-service-dominant core area, but the shopping-dominant core area is in the main urban area of Nanjing.
The following conclusions can be drawn from the above analysis (Figure 10 and Figure 11):
1.
In the main urban area of Nanjing, the layouts of catering and life service activities are generally in a state of equilibrium parity integration.
2.
Xinjiekou area is the extraordinary core of catering and life service.
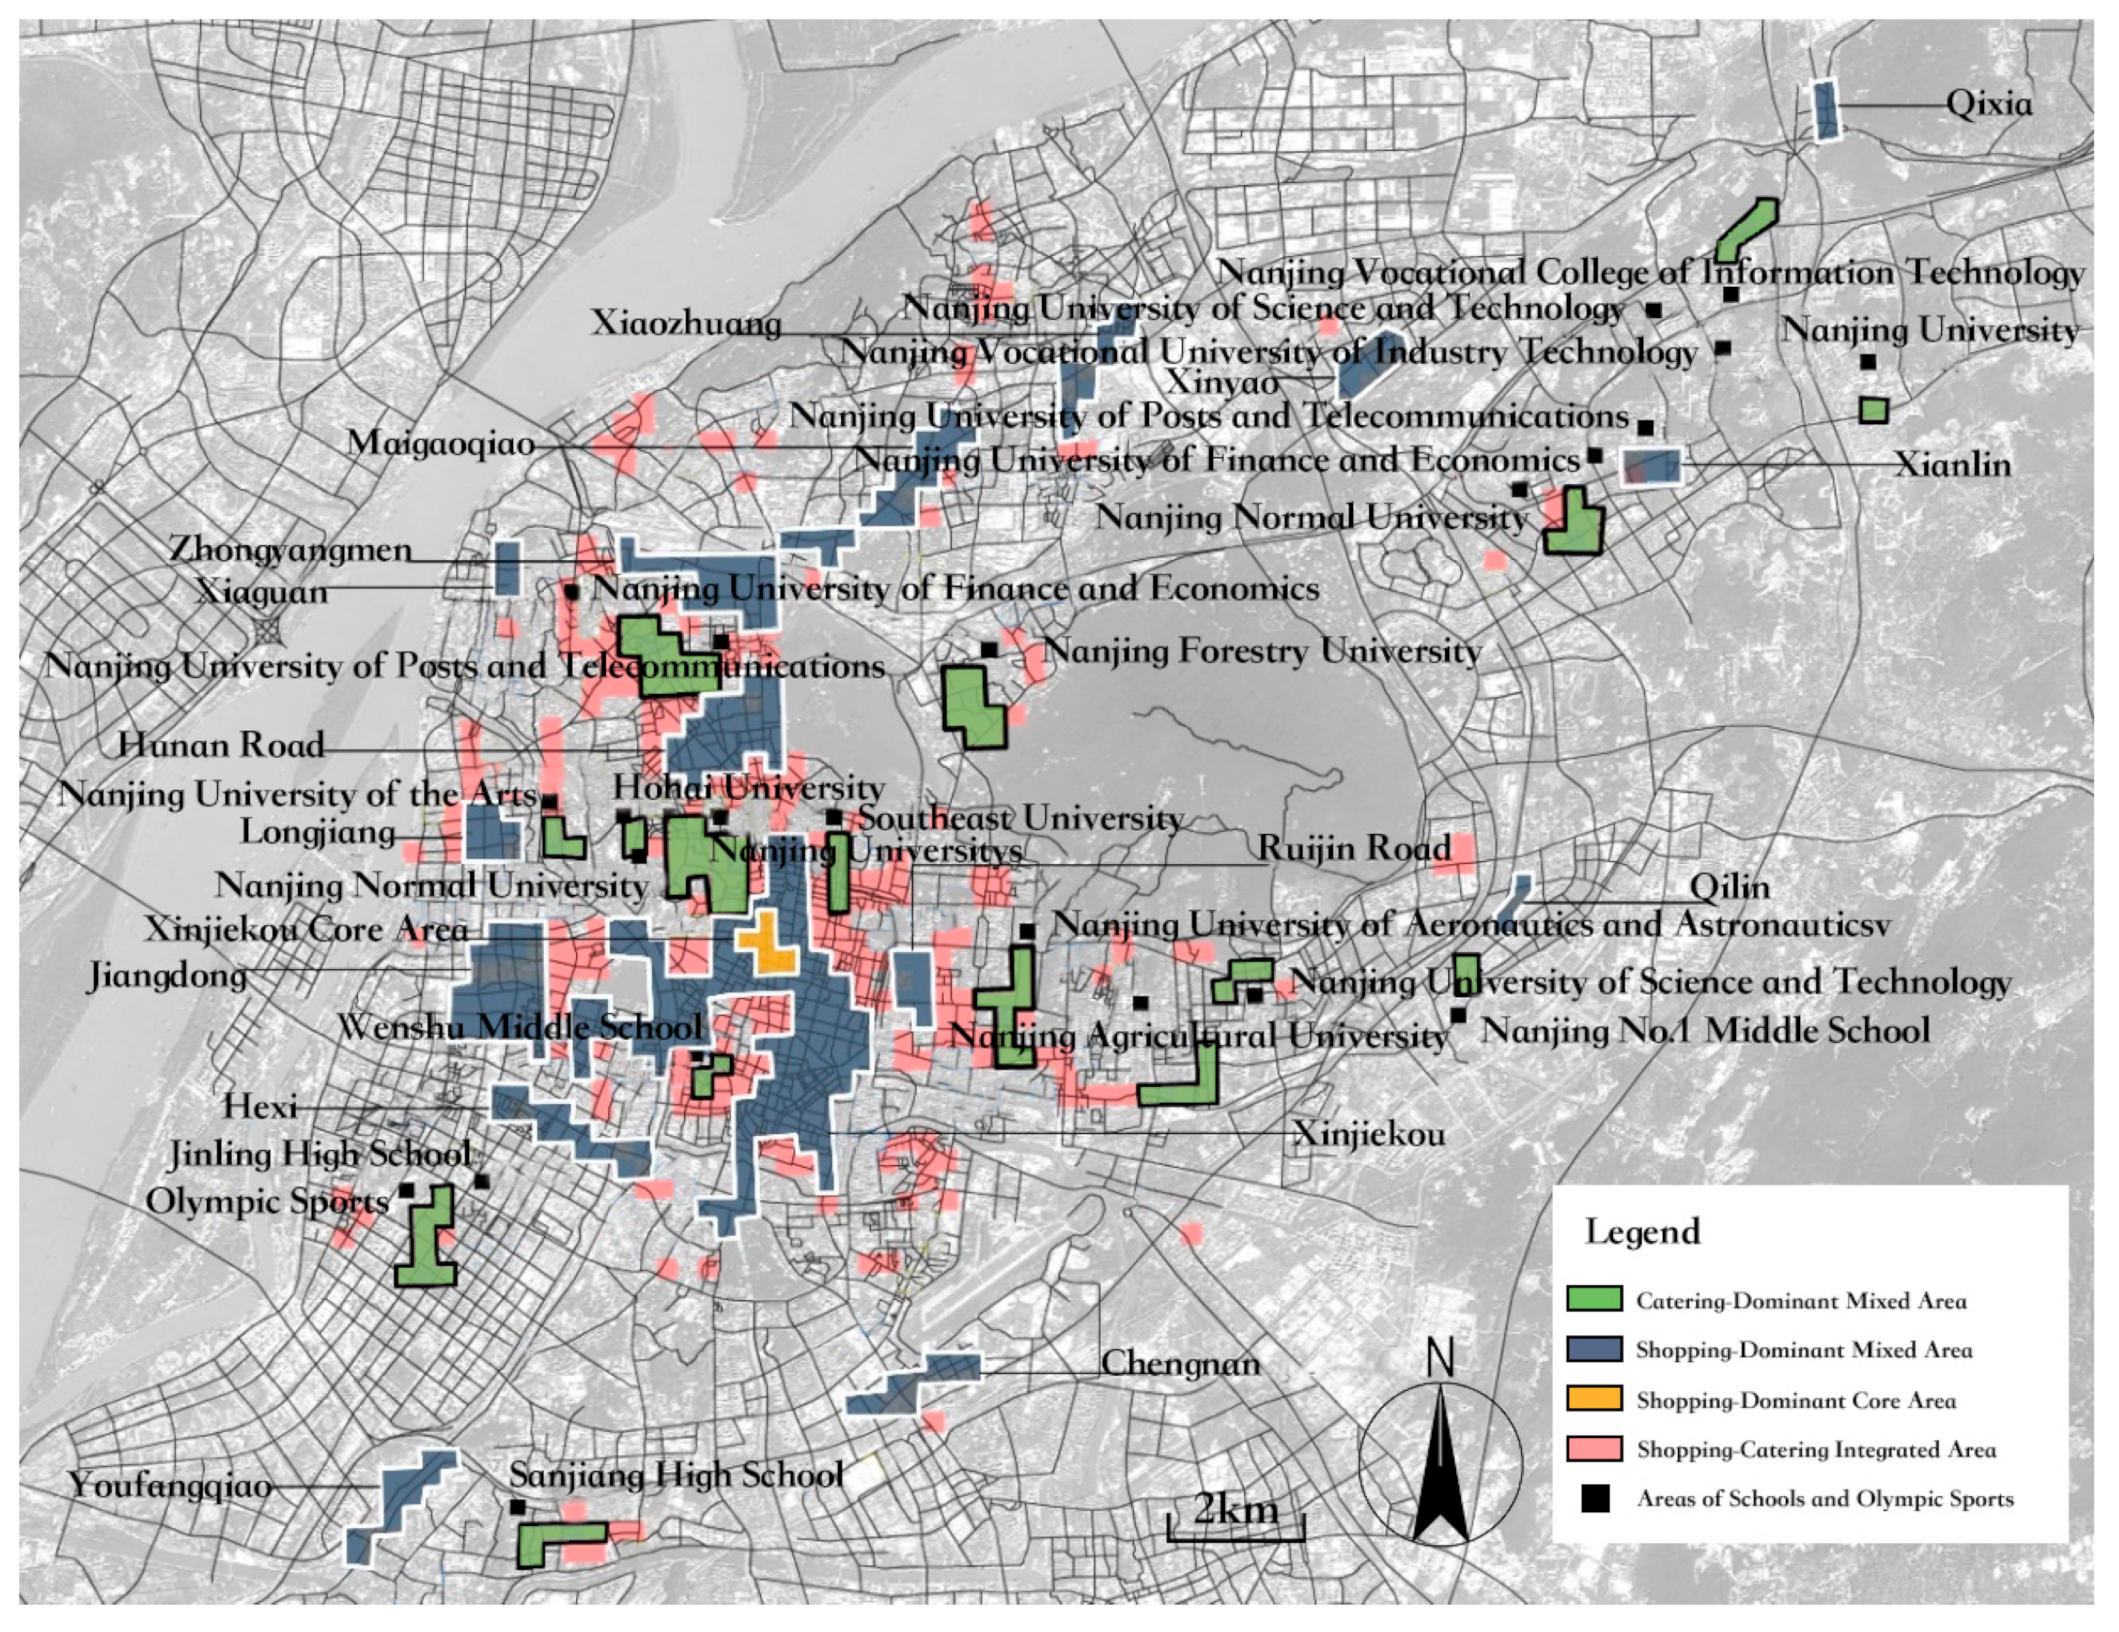
3.
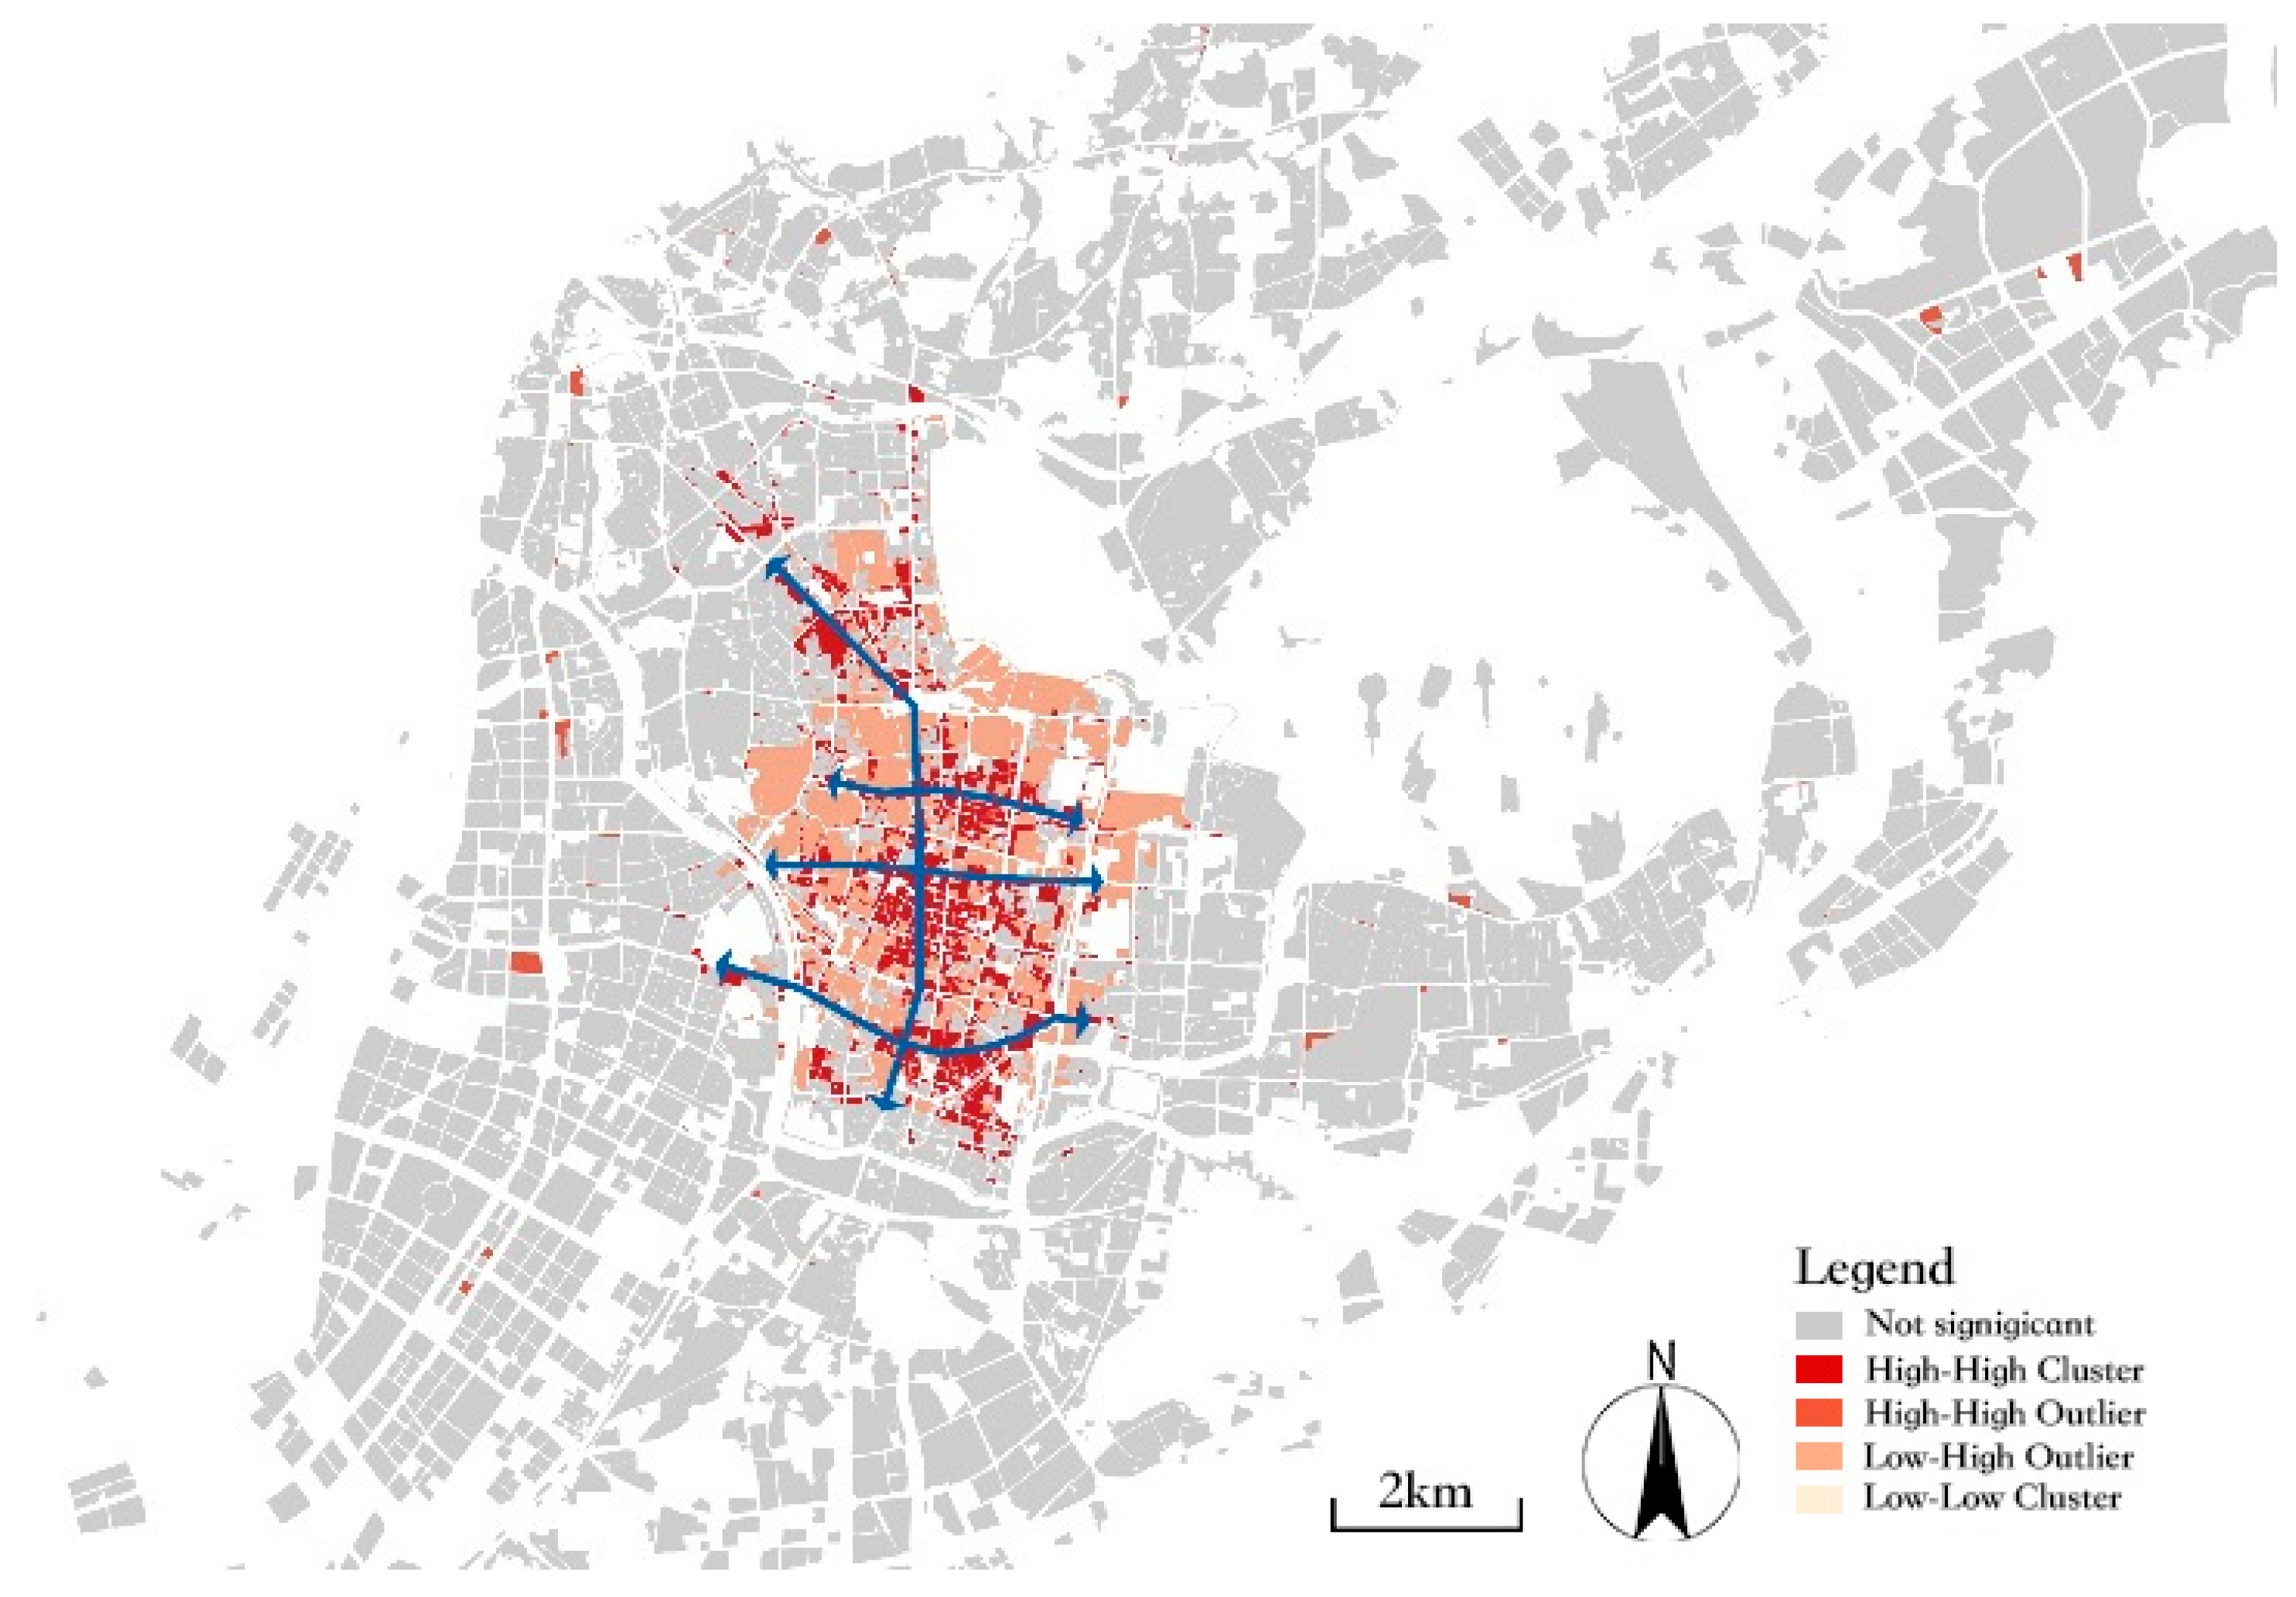
Under the binary structure of catering and life service commercial activities, the catering-dominant mixed area is more common than the life service in the main urban area of Nanjing. The catering industry forms a “cross“ equilibrium parity and advantageous mixing state in the main urban area of Nanjing.
By calculating the entropy value, we established that the lands with high parity equilibrium levels of ternary commercial activities of shopping, catering, and life services in the main urban area of Nanjing were as follows: Daxinggong, Guanghuamen, Guanghua Road, Qinhong, and the Drum Tower (Figure 12). These lands are mainly residential communities near subway stations, famous natural or historical sites, such as the Gongjiaoyicunnear Jiming Temple subway station and Xuanwu Lake, and Yulanli near MoChou Lake subway station and MoChou Lake park.

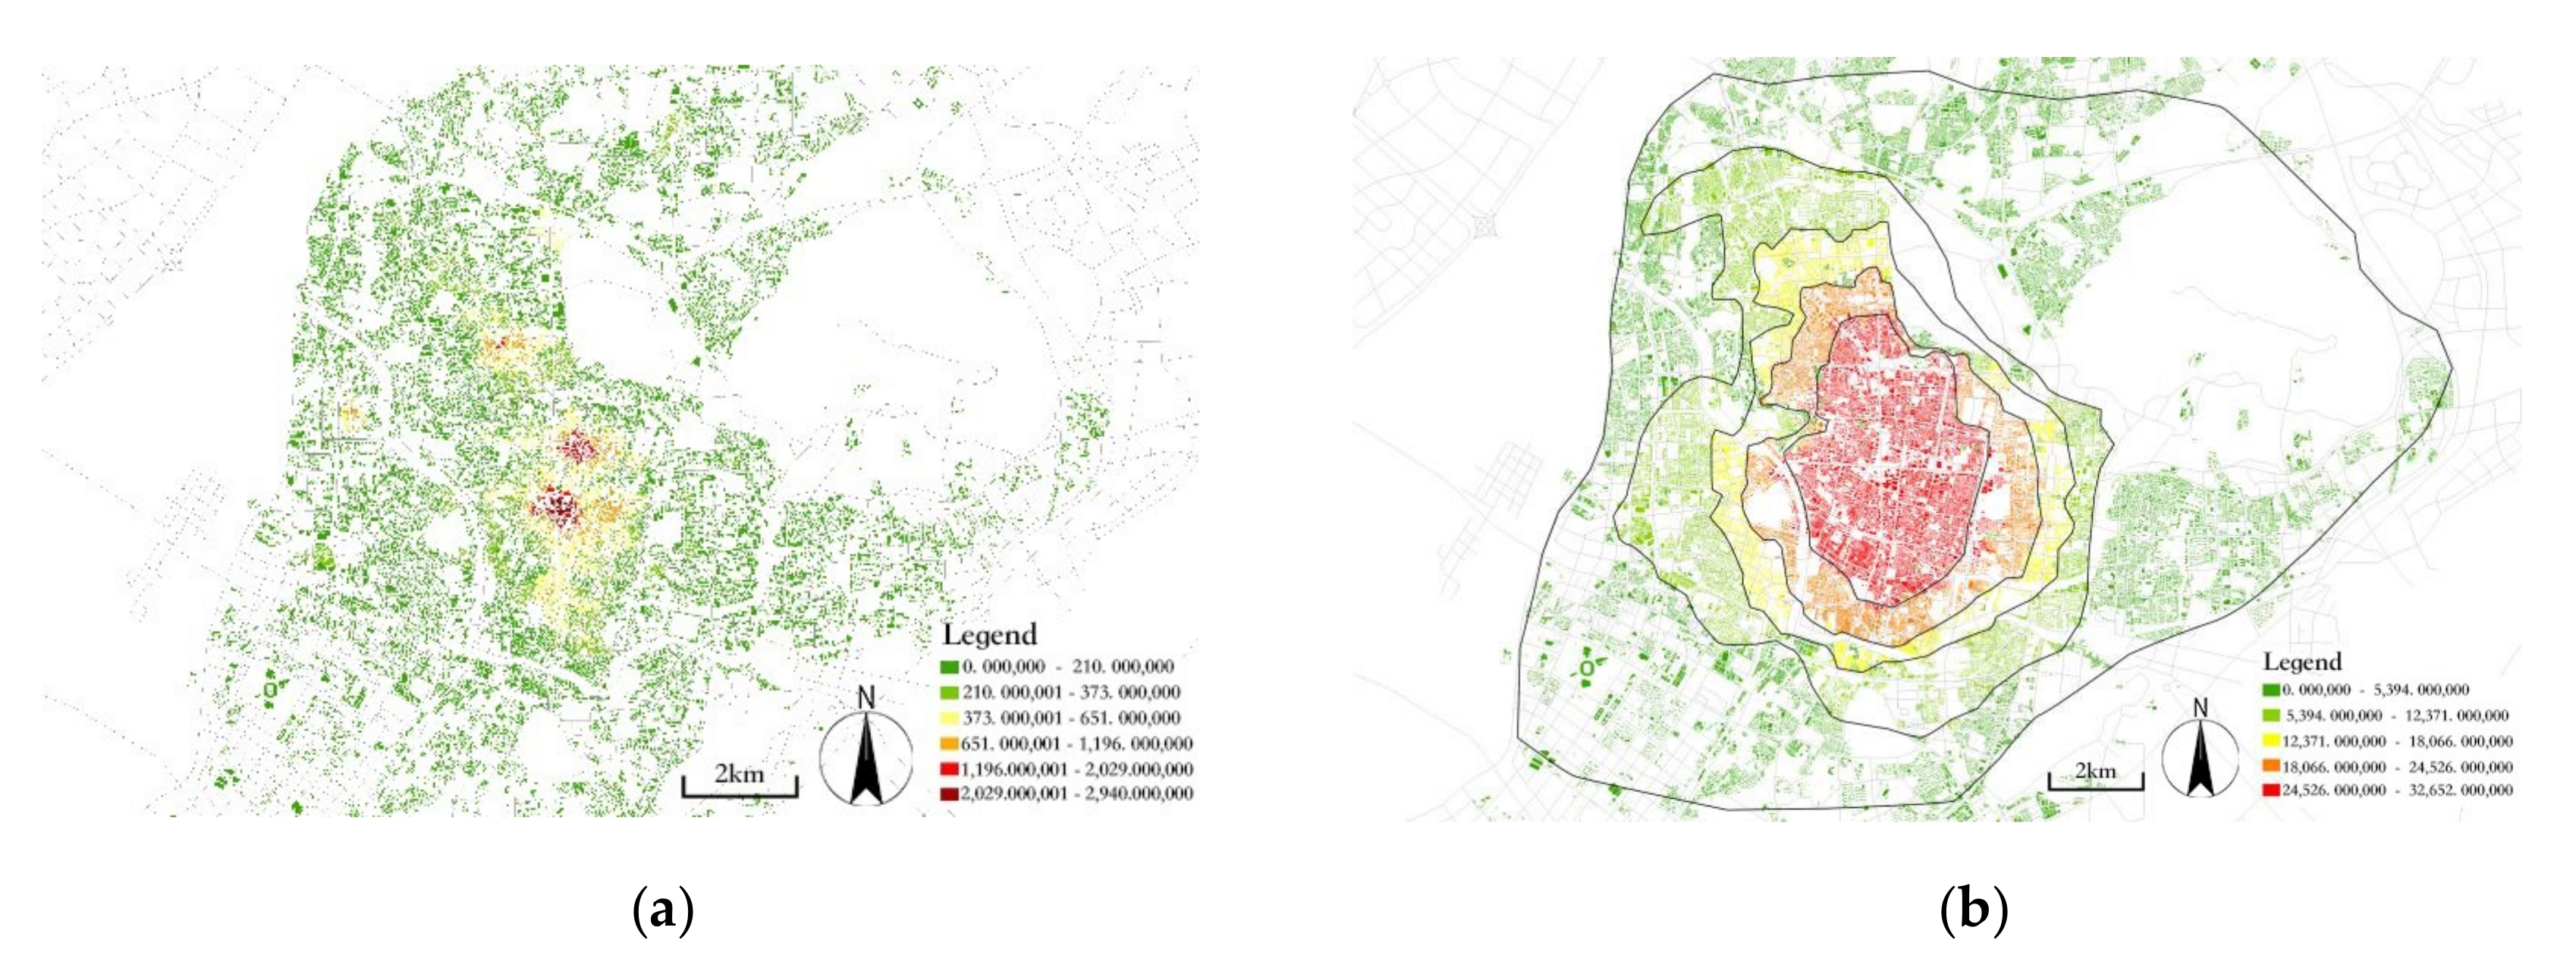
4.3.4. Research on Commercial Attractiveness Level

UNA (Urban Network Analysis Toolbox) is a new computer analysis tool for urban spatial network analysis based on space syntax. UNA is an open source software developed based on GIS network analysis tools, not based on the spatial syntax of new urban spatial network computer analysis tools, using the urban form of the specific urban network and node connectivity, accessibility, and other indicators to solve specific planning problems. The influence area was used to measure the number of other buildings around each building within a given search radius in the network. The influence scope reveals the characteristics represented by a certain weight assigned to the buildings in the network. In this study, we selected the commercial POIs in buildings as the weight, introducing the urban big data factor to expand the research field of UNA. The mathematical formula can be expressed as:
C R r i = j G i , d i , j r W j ,
C R r i : the network diagram G represents the influence scope of building I with a search range R; d[i,j]: the minimum distance from I to J; and W[j]: the weight of J.
We collected data on the building boundary in the urban A, B, and R land usage areas (approximately 230,000) to build the database, using the number of commercial POIs as the weight to analyze the influence scope.
In the city proper of Nanjing, an overwhelming majority of commercial POI was built on land either for the city’s public management and public services or for commercial facilities and residences. On that note, to deliver cost-efficient research, we considered establishments under UNA as data on building boundaries in the three types of land use, and the number of such buildings was close to 230,000.
We examined two assumed search radiuses:
  • Search radius of 400 m (walking scale)
On the walking scale, the UNA network analysis identified the structural characteristics of the commercial space in the main urban area of Nanjing, namely, “one core, three dispersive horizontal axes, and one longitudinal axis with weak North and strong South” (Figure 13a). As can be seen in the figure, the Xinjiekou area is the core area with the broadest radiation range. Three horizontal commercial axes are formed along Xinjiekou, Zhujianglu Road, and Sanshan Street, representing the largest commercial cluster area of the city. One vertical axis is formed along the Zhongshan South Road to the Zhongshan North Road, creating the Hunan Road regional commercial core in the south, whereas the influence of the northern region is relatively weakened.
  • Search radius of 4000 m (vehicle scale)
On the vehicle scale, the UNA network analysis showed that the commercial space in the main urban area of Nanjing was characterized by a “five circles” distribution mode (Figure 13b). As displayed in the figure, the inner layer spans from the Xinjiekou core area to the Hanzhoungmen subway station in the east, to the Xi’anmen subway station in the west, to the Sanshan Street subway station in the south, and to Xuanwumen subway station in the north. The three internal circles are relatively close, and the commercial space influence is concentrated. The influence of the two outer layers on the vehicle scale is poor and gradually weakening. It cannot affect the overall situation, so it cannot affect the whole urban area.

5. Discussion

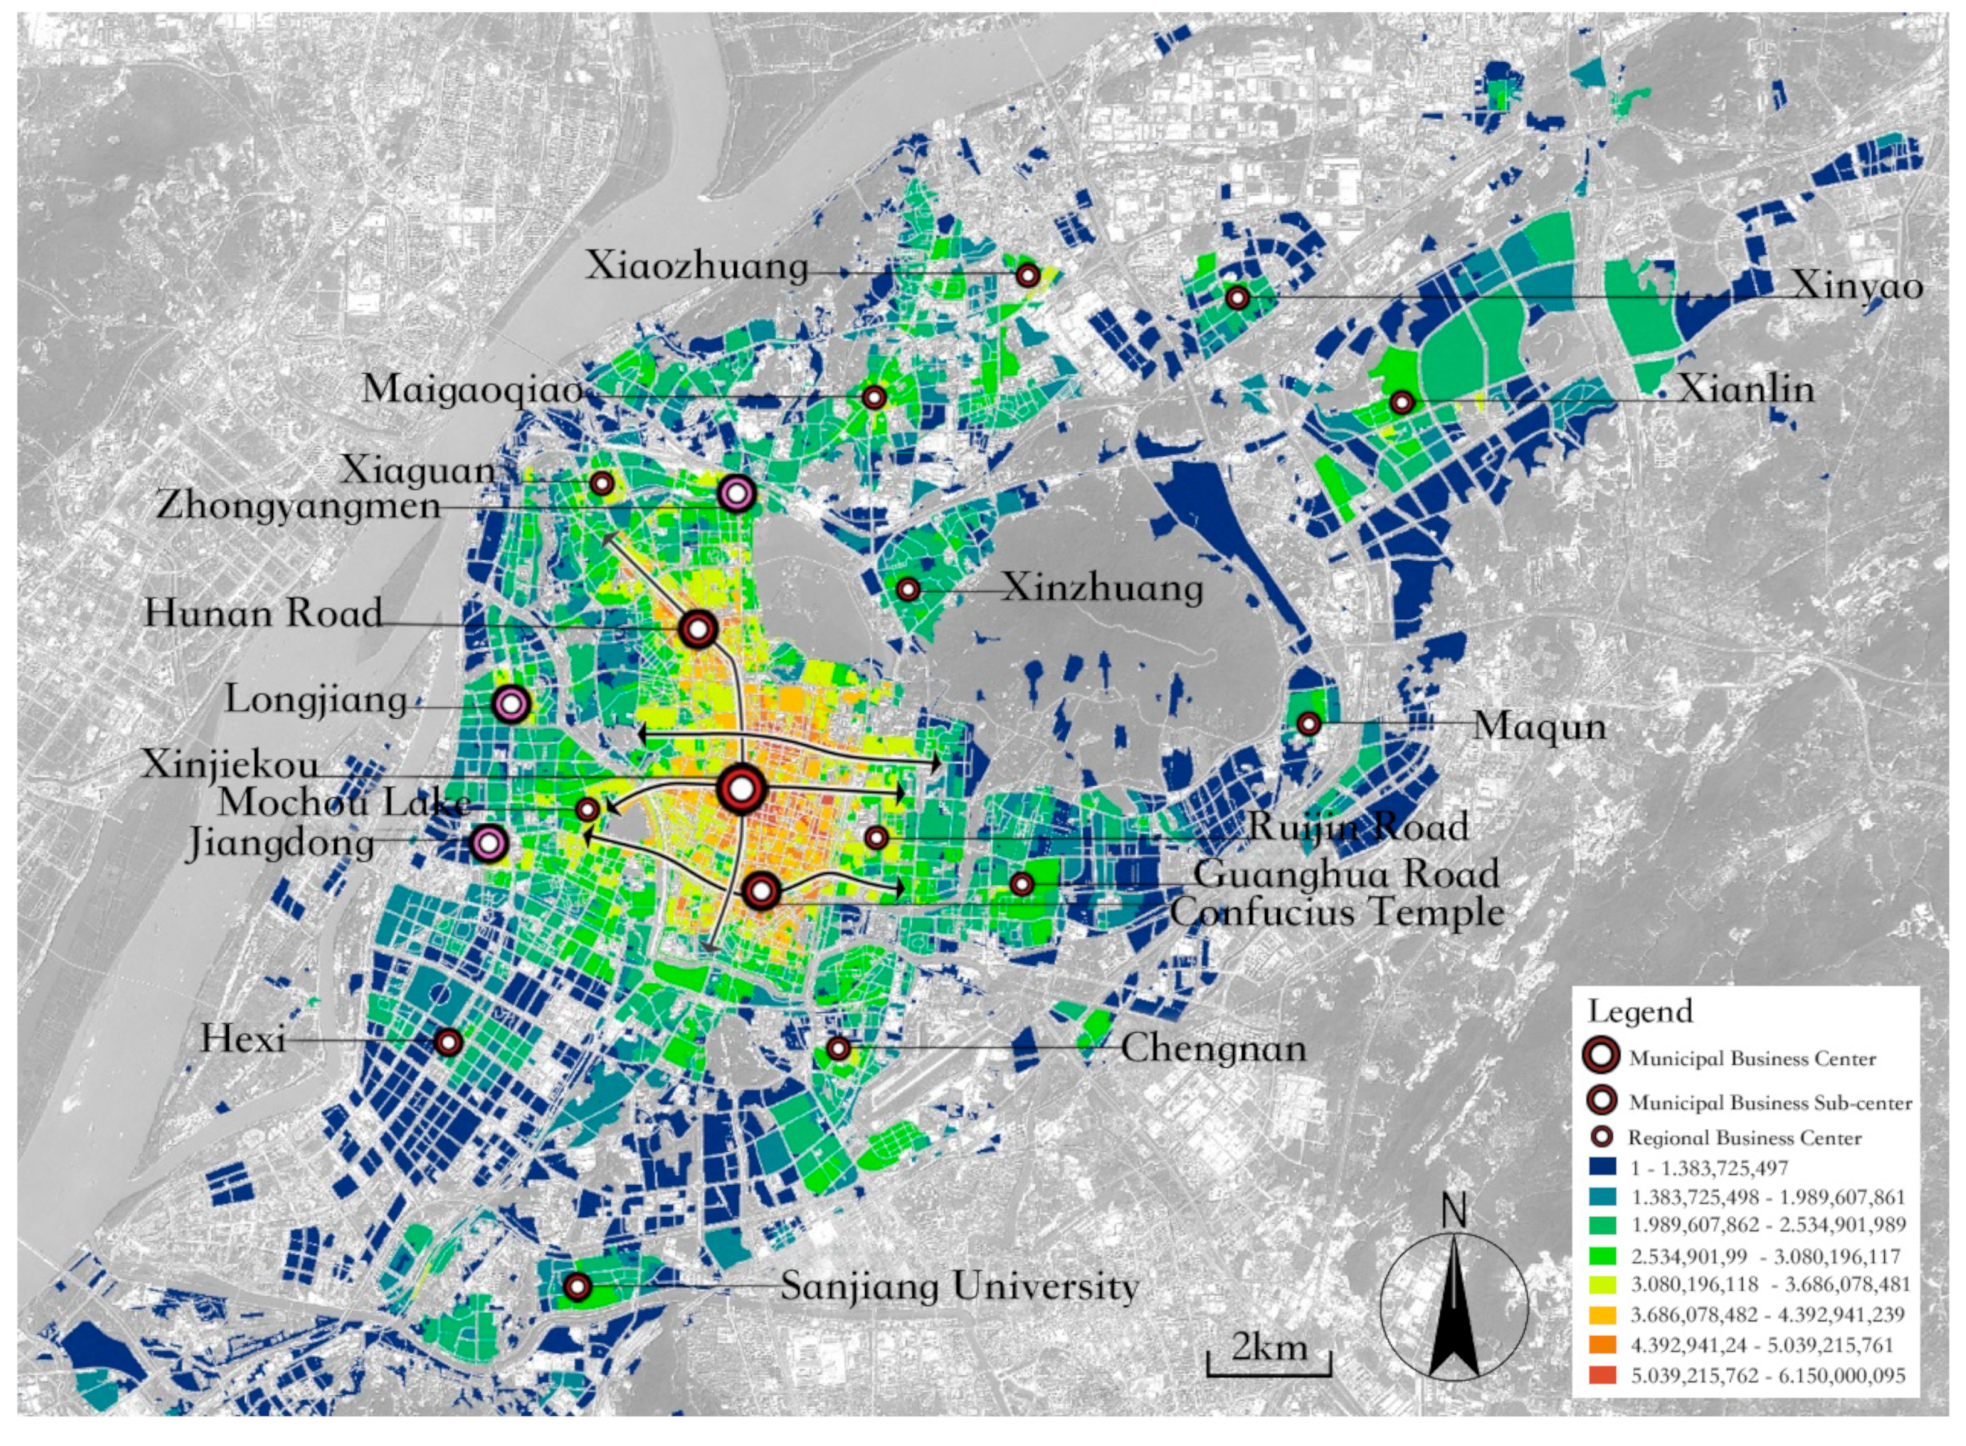
5.1. Evaluation of the Current Commercial Center System in the Main Urban Area of Nanjing

5.1.1. Weight Analysis of the Evaluation Indicators

Four indicators were used for the evaluation of the current commercial center level of Nanjing’s main urban area, including commercial aggregation centrality, commercial attractiveness, commercial facility service level, and commercial activity parity level. The weight ratios of different indicators were established by the analytic hierarchy process and expert scoring methods (Table 2).
Through comprehensive superposition factor analysis, we established that the layout feature of the horizontal threshold of the commercialization level in the main urban area of Nanjing could be described as “three axes in the horizontal direction, a single axis in the longitudinal direction, and one strong core” (Figure 14). Besides, the overall commercialization development has a layered structure. It puts forward a new test for the layout of important commercial facilities, relevant policy guidance, and changing implementation conditions.

5.1.2. Comparison and Evaluation of the Current Commercial Network Planning

Our quantitative analysis identified three east–west commercial axes in the main urban area of Nanjing, including Hanzhong Road–Zhongshan East Road, Guangzhou Road–Zhujiang Road, and Shuiximen Street–Shengzhou Road–Jiankang Road, and one north–south commercial axis, which is Zhongshan South Road–Zhongshan North Road. The Xinjiekou area is the extraordinary core that constitutes the municipal commercial center. The Confucius Temple and Hunan Road areas form two municipal sub-centers due to their mature commercialization level. Longjiang, Jiangdong, and Zhongyangmen areas are defined as potential commercial sub-centers since their commercialization level is close to those of the Confucius Temple and Hunan Road. This configuration forms a “2 + 3” municipal, commercial sub-center pattern. Xiaozhuang, Xianlin, Xinyao, Maigaoqiao, Xinzhuang, Xiaguan, Maqun, Ruijin Road, Guanghua Road, Chengnan, Mochou Lake, Hexi, and Sanjiang University are the district nodes in the commercial network (Figure 15).
The planning of the commercial network of Nanjing’s main urban area is as follows. Xinjiekou and Hexi are defined as municipal commercial centers. Chengnan, Xianlin, and Hunan Road are sub-commercial centers, and Xiaozhuang, Xiaolingwei, Ruijin Road, South Hexi, Jiangdong, Longjiang, Xiaguan, Zhongyangmen, Andemen, and Xinyaoare have been planned to serve as district commercial nodes.
Certain discrepancies exist between the present commercial development level and the previously planned orientation of recent development (from 2007 to 2015). Taking the economic development indicators in Nanjing’s immediate construction planning as a reference, it can be seen that indicators such as the proportion of tertiary industry in GDP and the total sales of consumer goods are higher than the planned targets. During 2007–2015, the level of economic construction and development in Nanjing was in line with the development requirements set by planning. Therefore, the development of the Nanjing tertiary industry in the immediate construction planning stage has good momentum and performance. To achieve sustainable and balanced development of commercial activities, it is essential to make specific adjustments to the existing commercial network planning.

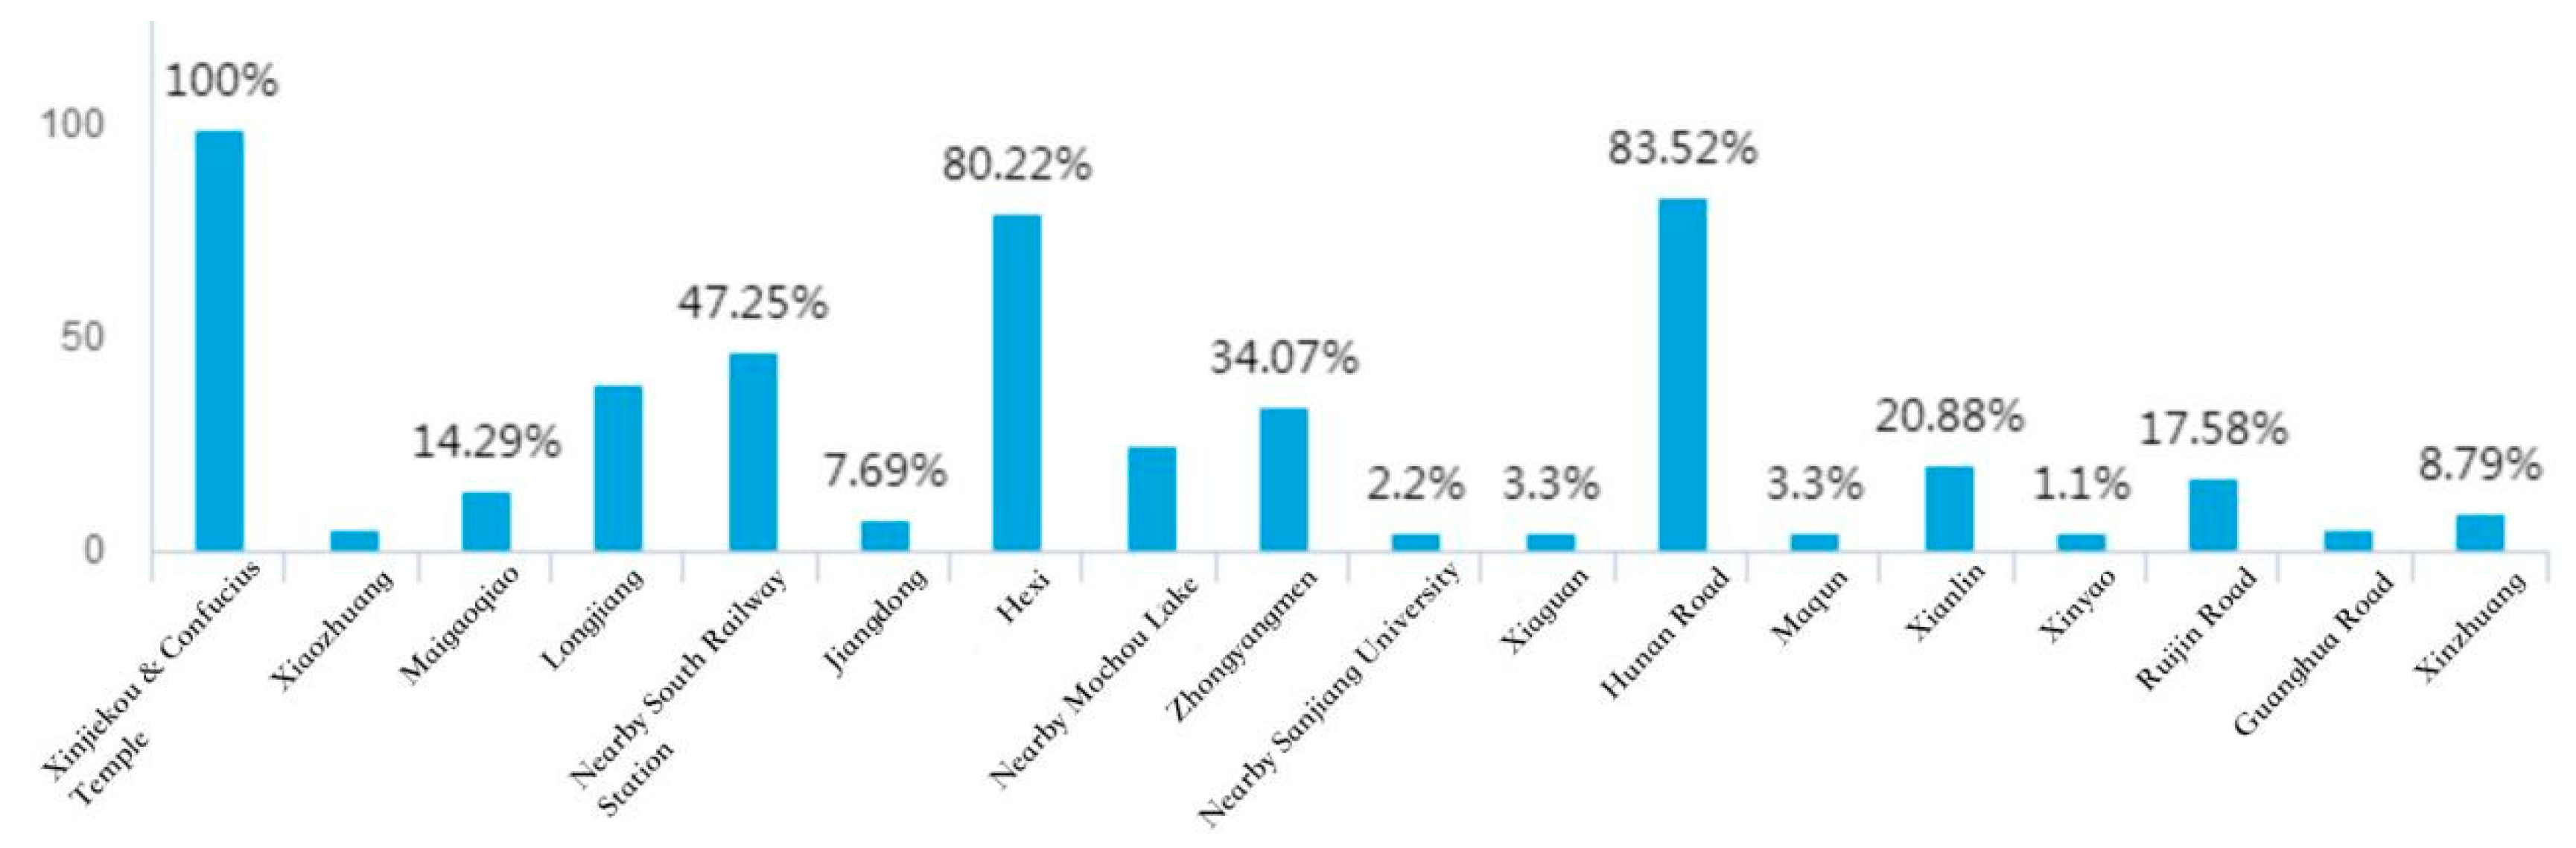
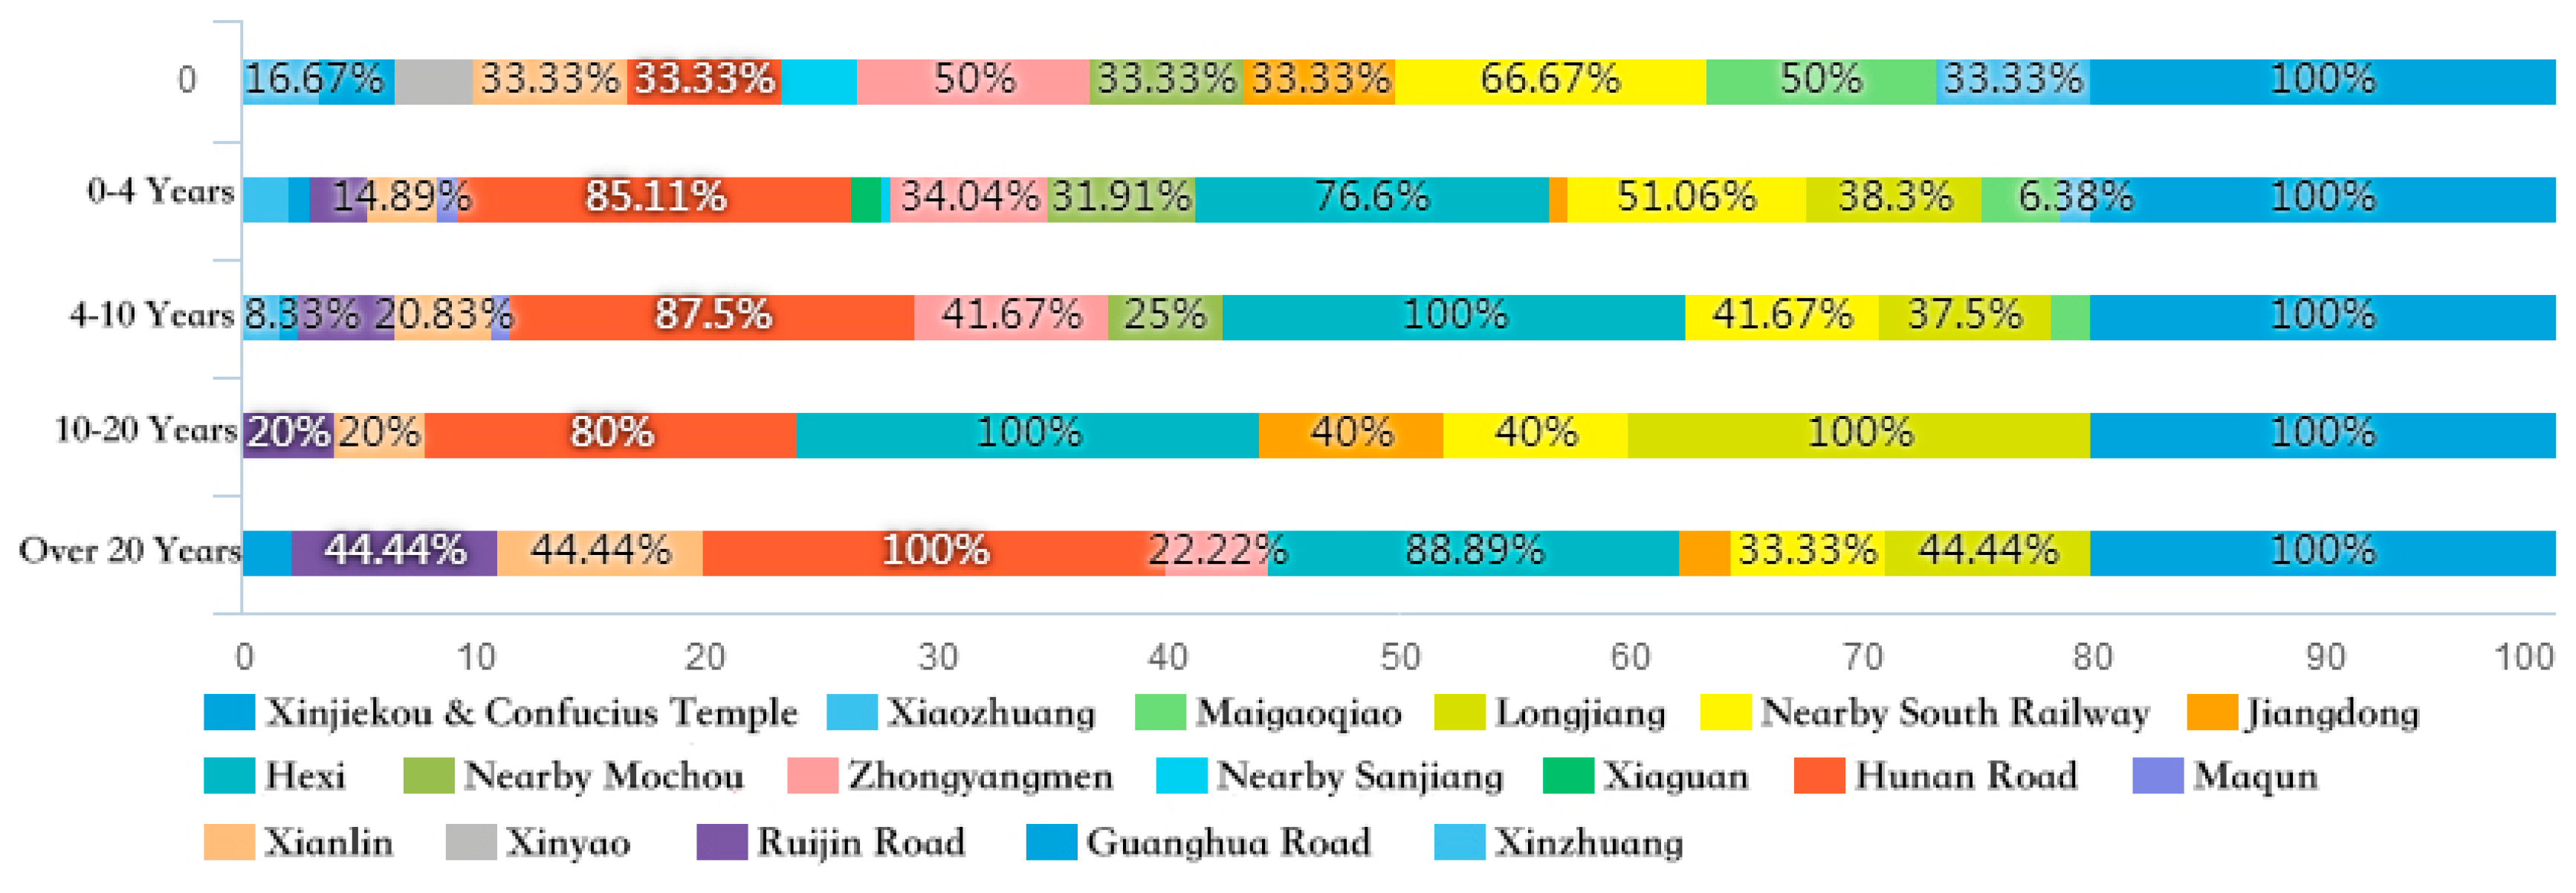
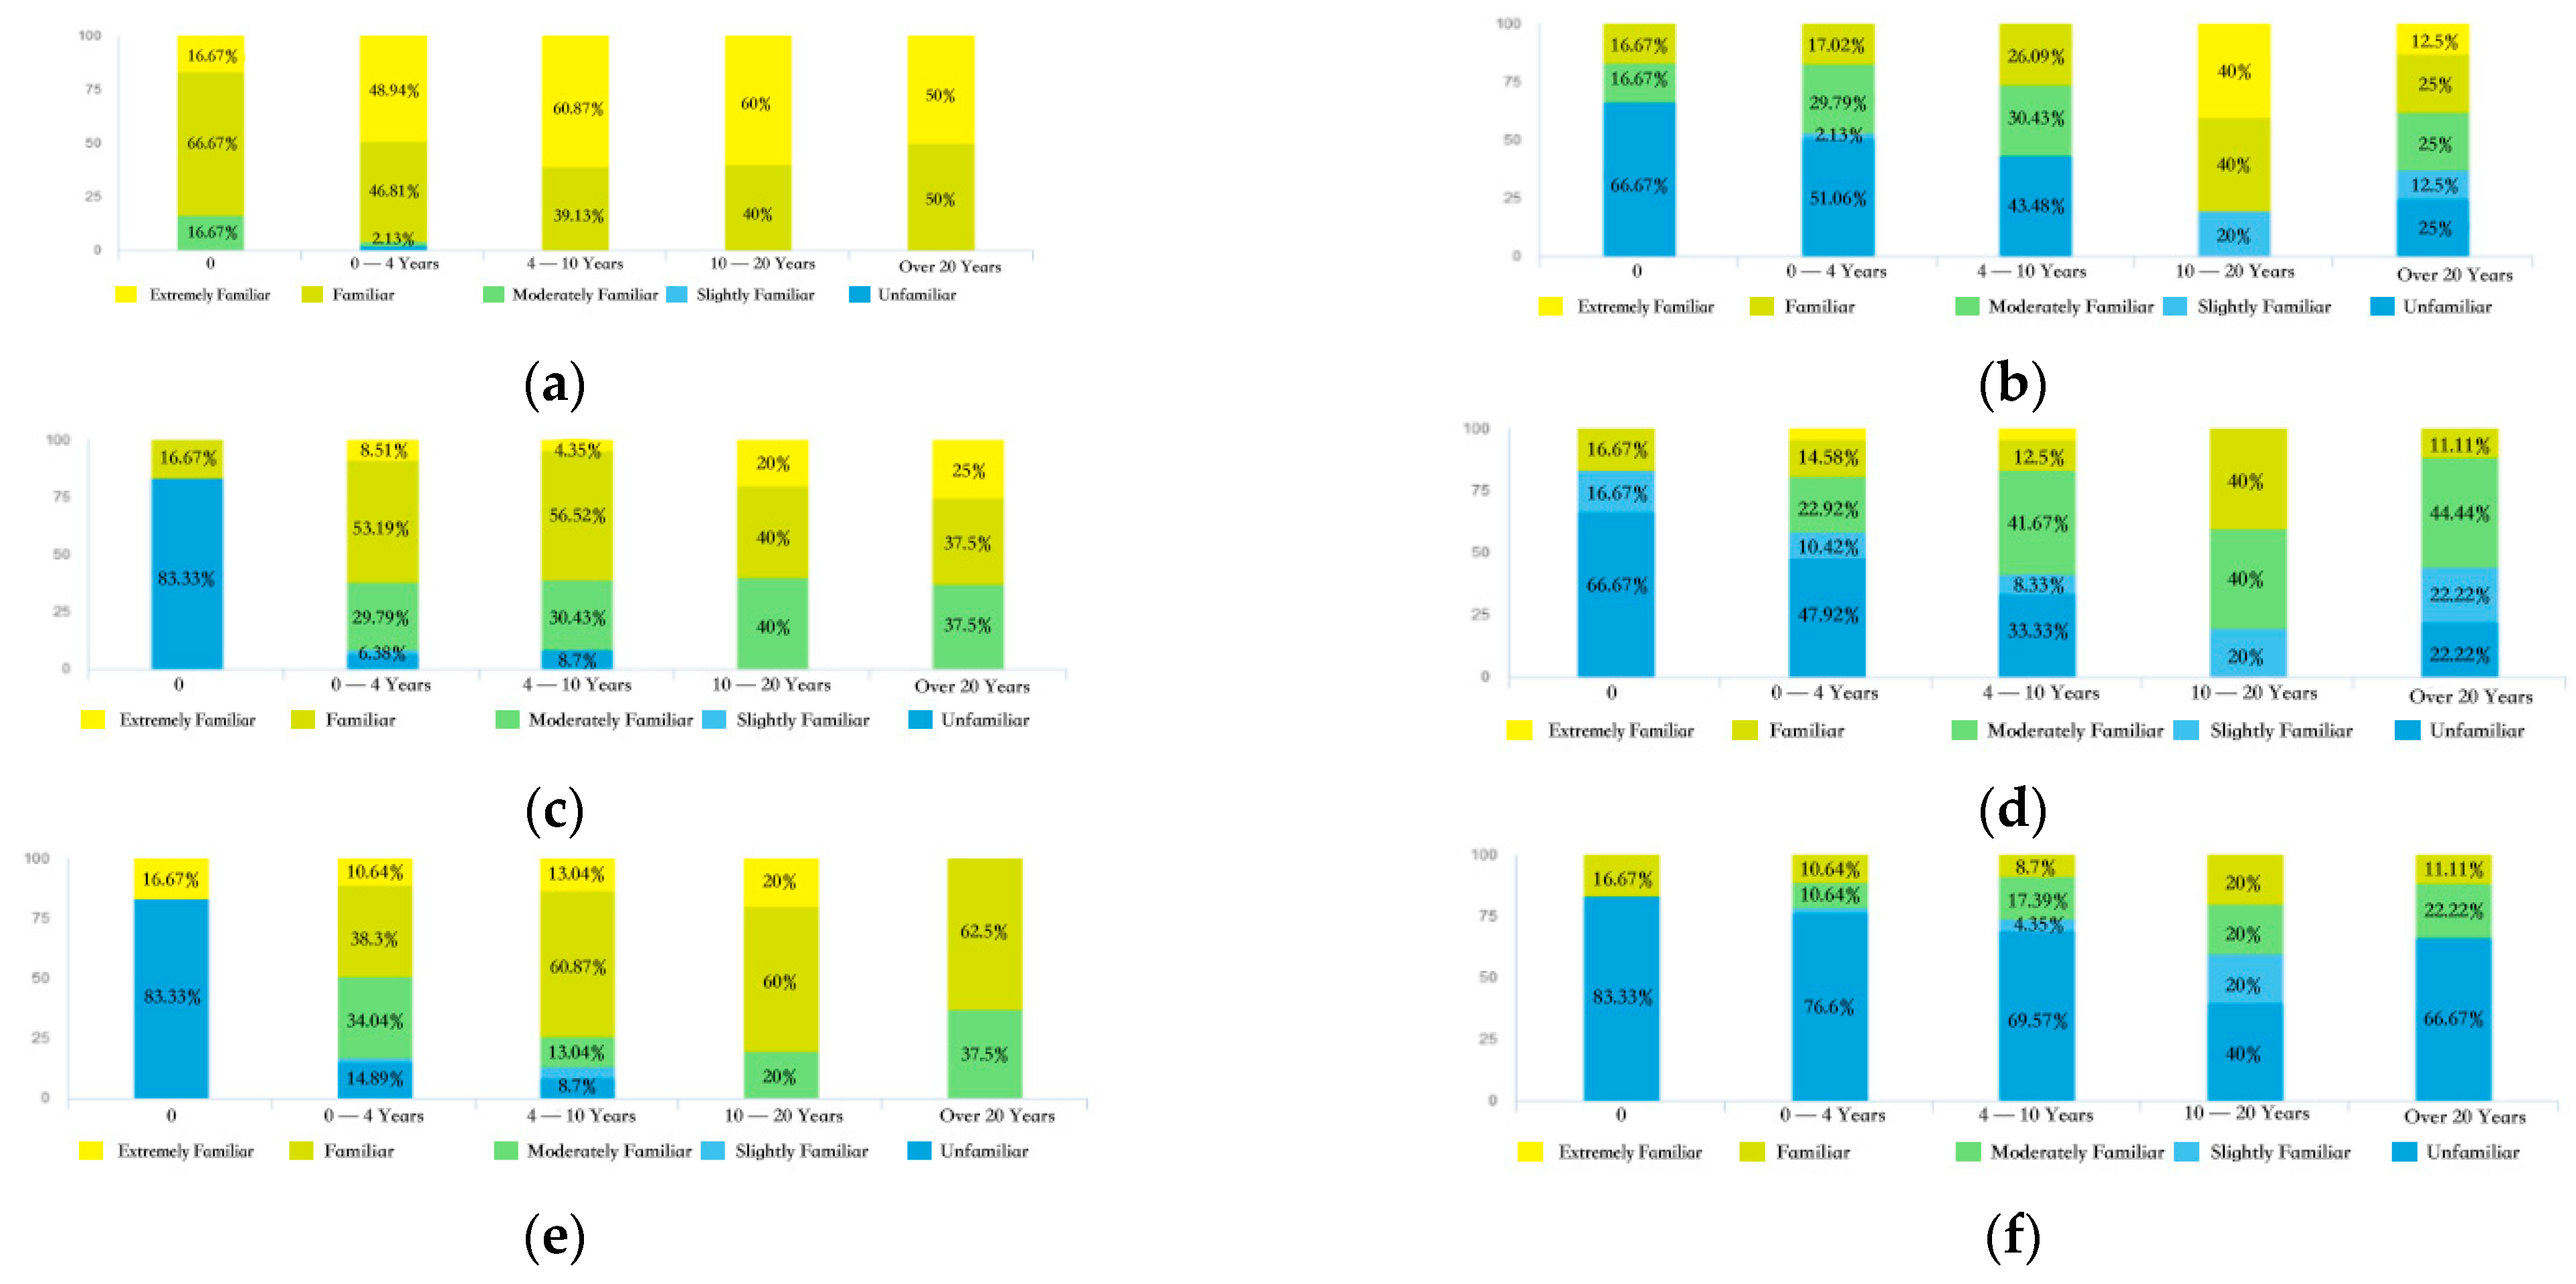
5.1.3. Public Feedback on the Evaluation Result

In this article, we report the results of our analysis of the public cognition for the commercialization level in different parts of Nanjing’s main urban area, which were obtained by public surveys in the areas with a high commercial development level. The statistical evaluation of the data from 188 valid questionnaires revealed that the public deemed Xinjiekou, Confucius Temple, Hunan Road, Hexi, Nanjing South Railway Station, Longjiang, and Zhongyangmen as the most commercialized areas, among which Xinjiekou and Confucius Temple were most widely acknowledged (Figure 16). These results showed that people of different ages have similarities and differences in their perception of Nanjing’s commercialization level (Figure 17 and Figure 18). People who have lived in Nanjing for 0–4 years and 4–10 years have the same perception of Nanjing’s commercialization level, while people who have lived in Nanjing for 10–20 years and 20 years or more have the same perception of Nanjing’s commercialization level. Those who have not lived in Nanjing, those who have lived in Nanjing for 0–4 years and 4–10 years, and those who have lived in Nanjing for 10–20 years and more than 20 years have more differences in their perception of Nanjing’s commercialization level, and those who have lived in Nanjing for a shorter time have more perceptions of high commercialization areas.

5.1.4. Analysis of the Formation Mechanism of the Commercial Center System

The formation of the commercial center system in Nanjing’s main urban area has been influenced by many indicators, including development history, market adjustment, information technology, supply and demand, population density, policy regulation, traffic conditions, culture, and natural resources. The forming of Xinjiekou, Hunan Road, and Confucius Temple business circles is a process of historical accumulation which brings agglomeration of commercial activities and cultural facilities. As a result, the commercial activity density and space elements are relatively high in these areas. Besides, the public feedback indicated that the radiating power of areas such as Xinjiekou and Confucius Temple was not limited only to Nanjing but also spread outside the city. Hence, the commercial character and prosperity of these regions have historical and propagation effects.
The age of information technology promotes the operation of social capital and urban space and enhances the diffusion of urban space elements and activities, thus stimulating the upgrade of the traditional urban commercial space. Furthermore, information technology plays a crucial guiding role in the interactive circulation of space resources. To some extent, it has made urban spatial agglomeration more significant, especially in the Xinjiekou area.
In addition, Nanjing’s GDP has grown significantly since 2007. The increase in residents’ per capita income stimulates the total amount of urban commercial consumption as well as the consumption demand level. The consumer positioning levels of different commercial centers vary according to their superior planning. The market economy system dominates urban resources and has profoundly influenced the formation of the commercial center system. The formation of the current commercial center system represents the mapping of the residents’ consumption supply and demand relationship.
The population density differences among the zones in Nanjing’s main urban area are related to industrial, residential, and functional structures. The employment level has a crucial impact on attracting the population, which promotes the construction of commercial and public service facilities. Population density and quantity play a decisive role in commodity consumption and consumption structure.
The market adjustment mechanism spurs the renewal and upgrading of urban commercial activities, and the scale economy promotes the agglomeration of commercial activities. Affected by differential land rents, the land use intensity varies. Thus, hierarchical differences in the commercial center system appear. Xinjiekou has a high concentration of commercial activities, which has created a large gap with other city zones.
The urban traffic of Nanjing has been developing rapidly, and the subway construction has profoundly impacted the development of its urban commercial center system. Spatial network analysis results revealed that the distribution of commercial impact circles in Nanjing’s main urban area is highly correlated with urban traffic nodes. In other words, urban traffic nodes have a profound impact on the commercial central system of Nanjing’s main urban area. Our quantitative research shows that major railway stations are often the intersection of different commercial activities’ parity integration, which triggers various commercial activities.
As an important national center of cultural and educational resource concentration, Nanjing is home to top universities. The research on the integration levels of different commercial activities in Nanjing’s main urban area that we conducted revealed that educational resources play an important guiding role in the distribution of commercial activities, which reveals the interrelationships of complementarity and attractiveness between educational resources and commercial activities. Meanwhile, Nanjing’s main urban area boasts rich natural landscape resources, such as Xuanwu Lake and Mochou Lake. With traffic gathering points around them, commercial activities take place and possess scale characteristics.
Policy regulation plays a guiding role in the formation of the commercial center system, mainly via macroeconomic policy and correlative planning. Certain differences exist in the industrial structure orientation and policy guidance set by different district governments. Additionally, the planning is closely related to each specific implementation mechanism, forming the current structure of the commercial center system.

5.2. Reflection and Promotion of the Current Commercial Network Planning

5.2.1. Reflection on the Current Commercial Network Planning

The research we conducted on the urban commercial center system evaluation model based on “big data + public feedback” established that there are certain differences between the development of the current commercial center system and the specific targets of the planning of Nanjing. The commercialization levels of some areas in the planning are too high or too low. Meanwhile, it failed to provide reasonable guidance and control for the balanced development of urban commerce. The details are as follows:
As the “strong core” of the urban commercial center, the primacy ratio of the Xinjiekou area is too high. Big data assessment and public feedback showed that all its indicators are far higher than the development indicators of other regions in the main urban area of Nanjing. Notably, the perception of non-residents of this area revealed that Xinjiekou has a regional commercial radiation influence. Relevant guidance on commercial center system planning is critically important for the long-term balanced development of the whole city. Such a differential approach would contribute to the achievement of a balanced and sustainable development of urban commerce while meeting the specific development needs of various regions. Obviously, the current commercial network planning has failed to provide reasonable guidance and corresponding development control for the balanced development of urban commerce.
The positioning of Hexi in planning is that of an urban commercial center level, whereas its current commercial development level can only reach the level of a regional commercial center. Hence, the planning orientation is not consistent with the current real-life development situation. It is thus necessary to perfect the format and scale structure of commercial activities to achieve the planned target of becoming an urban commercial center. With their good commercialization levels, the Confucius Temple and Hunan Road areas have the potential to develop into urban commercial centers. Their commercial centers are linked together and mature, which meet the service level and scale of an urban commercial sub-center. The commercial levels of Jiangdong, the central gate, and the Longjiang commercial core area are similar to those of the Confucius Temple and Hunan Road, which have the potential to move towards the development of an urban commercial center. While their planning is low-level positioning, guidance and development support should be provided based on the current commercial development and related policies for the orderly development of the functional structure and scale of the commercial activities in these areas that can provide reasonable functional relief for Xinjiekou.
The current commercial development level in the southern city, an important transportation hub of Eastern China, has not reached the level of an urban commercial sub-center despite its planning orientation as a commercial center, and its current development is relatively slow. Although Xianlin district is positioned as an urban commercial sub-center in the development plan and has the traffic advantage of running metro lines 2 and 4 and the construction of the University City, its construction and development are relatively slow. The current planning and construction stage has reached only reached the level of a regional commercial center in contrast to its further planned development. The regional commercial networks of Xiaolingwei, southern Hexi, and Ande gate are regional commercial centers in the development plan, but their actual development needs to be promoted. Each assessment factor acting in the southern Hexi region was found to have very low performance, and thus the construction of all related facilities should be further strengthened. Xiaolingwei and Ande gate areas have achieved a certain development scale and level, but their capacities and structures should still be further improved. The areas of Maigaoqiao, Ma Qun, Guanghua Road, Mo Chou Lake area, and Sanjiang University have the characteristics of regional commercial centers, which were established by large quantitative assessment and public feedback, with no specific positioning and development guidance given in their commercial networks’ planning.

5.2.2. Promotion of Current Commercial Network Planning

4.
Improving the structure positioning of planning a commercial center system
According to the local and global goals of the functioning of infrastructures, combined with the cognitive psychology involved in business activities, such as architectural colors, spatial flow, and other factors, developers must re-integrate the commercial development level and the commercial activities’ structure and scale in various regions and further improve and groom the commercial spatial structure of the main urban area of Nanjing. Meanwhile, the positioning problems at the commercial center level in different regions should be prevented. The planning stage should further provide reasonable guidance and the corresponding development control to achieve balanced city business development. The ease of access to POI data enables city managers to keep track of city business trends more frequently, allowing for more scientific policy making and planning revisions.
5.
Upgrading planning and implementing safeguard measures
A legal and statute guarantee mechanism should be established by the government and the relevant competent authorities to maintain the legal status of planning. Meanwhile, a perfect access guarantee mechanism should be set up to guarantee the hearing, approval, filing, and usage supervision before project implementation. Relevant support for commercial facilities’ construction includes policy inclination and encouragement, market operation, and so on. Competent departments’ renewal and guidance for the facility construction and control of macro-policies are crucial to the stage construction of commercial facilities.
6.
The necessity of establishing the action-planning mechanism
The rapid growth of business offices, financial trade, and cultural and recreational facilities in urban central area planning has interacted with the development of their commercial functions. Planning should, therefore, be changed from static to dynamic, from goal to strategy, and from scheme to implementation. In order to find the best solution for urban development through a flexible setting, especially to provide a complete solution for decision makers and development organizers, it is necessary to evaluate the whole process of planning implementation, and we can find out the difference and extent between the current development and the planning guidance.
It is important to note that when enabling the evaluation of urban business center systems with the help of POI data, the drawbacks associated with its technological upgrade should be considered. Since the collection and storage of POI data are highly dependent on networked electronic devices, they are vulnerable to resource attacks. Therefore, City Hall needs to focus on the security of POI data during its storage and processing. At the same time, in the process of previous work, although the objectivity of evaluation has been enhanced through technological means, for managers, the interpretation and perception of results often determine the effectiveness of their policy implementation. Therefore, it is especially necessary to establish an action-planning mechanism.

6. Conclusions

With its practical guiding value, the business center evaluation model “big data + public feedback” increases research potential and comprehensiveness. Based on big data, we established an evaluation index system of the urban commercial center system and evaluated the urban commercial development levels in different cities and regions. Our present findings can be applied at the land usage level, which was difficult to reach in previous research. In this work, public feedback was implemented for verification feedback of big data analysis results.
Meanwhile, it offers whole-process solutions for contemporary urban space construction and ensures advanced dynamic guidance of the transition of city government decisions into planning scheme implementation. The inclusion of wider public feedback will make planning even more scientifically sound, rational, effective, and humane.

Author Contributions

Conceptualization, X.L. and X.J.; methodology, X.L.; software, Y.G.; validation, X.L., Y.G. and Z.W.; formal analysis, L.N.; investigation, X.L.; resources, Y.G.; data curation, X.L.; writing—original draft preparation, X.L.; writing—review and editing, X.L.; visualization, Y.G.; supervision, X.L.; project administration, X.L.; funding acquisition, X.L. All authors have read and agreed to the published version of the manuscript.

Funding

This research was funded by National Key R&D Program Projects of China, grant number 2018YFC0704903; National Natural Science Foundation of China, grant number 51778611; and Special Fund Projects of Jiangsu Collaborative Innovation Center for Building Energy Saving and Construction Technology, grant number SJXTBS2108.

Institutional Review Board Statement

Not applicable.

Informed Consent Statement

Not applicable.

Data Availability Statement

The data presented in this study are available on request from the author.

Conflicts of Interest

The authors declare no conflict of interest.

References

  1. Ragusa, F.; Furnari, A.; Battiato, S.; Signorello, G.; Farinella, G.M. Egocentric Point of Interest Recognition in Cultural Sites. In Proceedings of the 14th International Joint Conference on Computer Vision, Imaging and Computer Graphics Theory and Applications (VISAPP), Prague, Czech Republic, 25–27 February 2019; Tremeau, A., Farinella, G.M., Braz, J., Eds.; Volume 5, pp. 381–392. [Google Scholar]
  2. Corradi, A.; Curatola, G.; Foschini, L.; Ianniello, R.; De Rolt, C.R. Automatic Extraction of POIs in Smart Cities: Big Data Processing in ParticipAct. In Proceedings of the IFIP/IEEE International Symposium on Integrated Network Management (IM), Ottawa, ON, Canada, 11–15 May 2015; Badonnel, R., et al., Eds.; pp. 1059–1064. [Google Scholar]
  3. Giglio, S.; Bertacchini, F.; Bilotta, E.; Pantano, P. Machine learning and point of interests: Typical tourist Italian cities. Curr. Issues Tour. 2020, 23, 1646–1658. [Google Scholar] [CrossRef]
  4. Barta, M.; Farooghi, D.; Tutsch, D. A System for User Centered Classification and Ranking of Points of Interest Using Data Mining in Geographical Data Sets. In Proceedings of the Advances in Artificial Intelligence, Software and Systems Engineering: Proceedings of the AHFE 2019 International Conference on Human Factors in Artificial Intelligence and Social Computing, the AHFE International Conference on Human Factors, Software, Service and Systems Engineering, and the AHFE International Conference of Human Factors in Energy, Washington, DC, USA, 24–28 July 2019; Ahram, T., Ed.; pp. 571–579. [Google Scholar]
  5. Semanjski, I.; Ramachi, M.; Gautama, S. Detection of Points of Interest from Crowdsourced Tourism Data. In Proceedings of the PT II: 19th International Conference on Computational Science and Its Applications (ICCSA), Saint Petersburg, Russia, 1–4 July 2019; Misra, S., Ed.; pp. 203–216. [Google Scholar]
  6. Thomee, B.; Arapakis, I.; Shamma, D.A. Finding Social Points of Interest from Georeferenced and Oriented Online Photographs. ACM Trans. Multimed. Comput. Commun. Appl. 2016, 12, 1–23. [Google Scholar] [CrossRef]
  7. Nandi, S.; Nichols, P.; Nandi, M.L. PINdex + 4: A spatial identification system for points of interest in Indian cities. In Proceedings of the 10th International Symposium Geoinformatics for City Transformations, 2013; GIS, Ostrava, Ostrava, Czech Republic, 21–23 January 2013; Ivan, I., et al., Eds.; pp. 185–190. [Google Scholar]
  8. Xing, H.; Meng, Y. Revealing deep semantic commercial patterns: Insights from urban landscape depiction. Comput. Environ. Urban Syst. 2020, 79, 101404. [Google Scholar] [CrossRef]
  9. Liu, J.; Deng, Y.; Wang, Y.; Huang, H.; Du, Q.; Ren, F. Urban Nighttime Leisure Space Mapping with Nighttime Light Images and POI Data. Remote Sens. 2020, 12, 541. [Google Scholar] [CrossRef] [Green Version]
  10. Wang, F.; Liu, Z.; Shang, S.; Qin, Y.; Wu, B. Vitality continuation or over-commercialization? Spatial structure characteristics of commercial services and population agglomeration in historic and cultural areas. Tour. Econ. 2019, 25, 1302–1326. [Google Scholar] [CrossRef]
  11. Yang, J.; Zhu, J.; Sun, Y.; Zhao, J. Delimitating Urban Commercial Central Districts by Combining Kernel Density Estimation and Road Intersections: A Case Study in Nanjing City, China. ISPRS Int. J. Geo-Inf. 2019, 8, 93. [Google Scholar] [CrossRef] [Green Version]
  12. Wei, J.; Sun, S. IEEE, Commercial Activity Cluster Recognition with Modified DBSCAN Algorithm: A Case Study of Milan. In Proceedings of the 5th IEEE Annual International Smart Cities Conference (ISC2), Morocco, North Africa, 14–17 October 2019; pp. 228–234. [Google Scholar]
  13. Hu, C.; Liu, W.; Jia, Y.; Jin, Y. Characterization of Territorial Spatial Agglomeration Based on POI Data: A Case Study of Ningbo City, China. Sustainability 2019, 11, 5083. [Google Scholar] [CrossRef] [Green Version]
  14. Wang, F.; Niu, F.-Q. Urban Commercial Spatial Structure Optimization in the Metropolitan Area of Beijing: A Microscopic Perspective. Sustainability 2019, 11, 1103. [Google Scholar] [CrossRef] [Green Version]
  15. Lu, X.; Xing, H.; Yu, M.; Xu, Y. Study on Spatial Distribution of Commercial Network in Jinan Based on POI Information-Taking Food and Shopping Network for Example. In Proceedings of the 2nd International Conference on Big Data Research (ICBDR), Weihai, China, 27–29 October 2018; pp. 178–181. [Google Scholar]
  16. Wang, W.; Yang, S.; He, Z.; Wang, M.; Zhang, J.; Zhang, W. Urban Perception of Commercial Activeness from Satellite Images and Streetscapes. In Proceedings of the 27th World Wide Web (WWW) Conference, Lyon, France, 23–27 April 2018; pp. 647–654. [Google Scholar]
  17. Wang, T.; Wang, Y.; Zhao, X.; Fu, X. Spatial distribution pattern of the customer count and satisfaction of commercial facilities based on social network review data in Beijing, China. Comput. Environ. Urban Syst. 2018, 71, 88–97. [Google Scholar] [CrossRef]
  18. Mulders-Kusumo, C.M.C. Is a railway station a ‘central’ urban place? Spatial conflguration study of retail distribution pattern around railway stations. In Proceedings of the 5th International Space Syntax Symposium, Delft, The Netherlands, 13–17 June 2005. [Google Scholar]
  19. Cordova, J.; Merchan, D.; Torres, S. Redesigning a Retail Distribution Network in Restricted Urban Areas: A Case Study on Beverage Distribution in the Historic Center of Quito. J. Appl. Res. Technol. 2014, 12, 850–859. [Google Scholar] [CrossRef] [Green Version]
  20. Cao, Y.; Lee, S. Analysis of Urban Vitality and Its Determinant Factors Using POI Bigdata in Seoul, Korea. J. Korea Plan. Assoc. 2021, 56, 87–102. [Google Scholar] [CrossRef]
  21. Zhang, Y.; Zhou, G.; Liu, Y.; Fu, H.; Sun, H. Matching of Residential and Commercial Space in Shrinking Cities from the Perspective of Supply and Demand: A Case Study of Yichun City, China. Chin. Geogr. Sci. 2022, 32, 389–404. [Google Scholar] [CrossRef]
  22. Luo, S.; Liu, Y.; Du, M.; Gao, S.; Wang, P.; Liu, X. The Influence of Spatial Grid Division on the Layout Analysis of Urban Functional Areas. ISPRS Int. J. Geo-Inf. 2021, 10, 189. [Google Scholar] [CrossRef]
  23. Zhou, L.; Shi, Y.; Zheng, J. Business Circle Identification and Spatiotemporal Characteristics in the Main Urban Area of Yiwu City Based on POI and Night-Time Light Data. Remote Sens. 2021, 13, 5153. [Google Scholar] [CrossRef]
  24. Lin, A.; Sun, X.; Wu, H.; Luo, W.; Wang, D.; Zhong, D.; Wang, Z.; Zhao, L.; Zhu, J. Identifying Urban Building Function by Integrating Remote Sensing Imagery and POI Data. IEEE J. Sel. Top. Appl. Earth Obs. Remote Sens. 2021, 14, 8864–8875. [Google Scholar] [CrossRef]
  25. Zhou, L.; Liu, M.; Zheng, Z.; Wang, W. Quantification of Spatial Association between Commercial and Residential Spaces in Beijing Using Urban Big Data. ISPRS Int. J. Geo-Inf. 2022, 11, 249. [Google Scholar] [CrossRef]
  26. Zhang, X.Y.; Wu, X. Spatial-temporal evolution characteristics and trends of commercial layout of metropolis in the e-commerce era—Based on multi-period POI data. Resour. Dev. Mark. 2022, 4, 468–475. [Google Scholar]
  27. Deng, Y.; Chen, R.; Yang, J.; Li, Y.; Jiang, H.; Liao, W.; Sun, M. Identify urban building functions with multisource data: A case study in Guangzhou, China. Int. J. Geogr. Inf. Sci. 2022, 36, 2060–2085. [Google Scholar] [CrossRef]
  28. Liang, F.; Liu, J.; Liu, M.; Zeng, J.; Yang, L.; He, J. Scale-Dependent Impacts of Urban Morphology on Commercial Distribution: A Case Study of Xi’an, China. Land 2021, 10, 170. [Google Scholar] [CrossRef]
  29. Liao, C.; Dai, T.; Zhao, P.; Ding, T. Weighted Centrality and Retail Store Locations in Beijing, China: A Temporal Perspective from Dynamic Public Transport Flow Networks. Appl. Sci. 2021, 11, 9069. [Google Scholar] [CrossRef]
  30. Wang, Y.; Zhang, H.; Liu, L. Does city construction improve life quality? Evidence from POI data of China. Int. Rev. Econ. Finance 2022, 80, 643–653. [Google Scholar] [CrossRef]
  31. Wu, M.; Pei, T.; Wang, W.; Guo, S.; Song, C.; Chen, J.; Zhou, C. Roles of locational factors in the rise and fall of restaurants: A case study of Beijing with POI data. Cities 2021, 113, 103185. [Google Scholar] [CrossRef]
  32. Zeng, Y.; Wang, G.; Zhang., Y. Identification and grading of Wuhan commercial center based on POI. Mod. Urban Res. 2021, 6, 109–116. [Google Scholar]
Figure 1. POIs Visualization: (a1) 2D Shopping POIs; (a2) 3D Shopping POIs; (b1) 2D Life service POIs; (b2) 3D Life service POIs; (c1) 2D Catering POIs; (c2) 3D Catering POIs.
Sustainability 15 04205 g001aSustainability 15 04205 g001b
Figure 2. Research Framework.
Sustainability 15 04205 g002
Figure 3. Partial spatial autocorrelation analysis.
Sustainability 15 04205 g003
Figure 4. (a) Population density on street level; (b) Commercial facility service level.
Sustainability 15 04205 g004
Figure 5. (a) Housing price distribution; (b) Life and Facilities services level.
Sustainability 15 04205 g005
Figure 6. Binary parity research on catering and shopping facilities: (a) Parity entropy distribution of shopping and catering commercial activities; (b) Spatial distribution of shopping and catering dominant zones.
Sustainability 15 04205 g006
Figure 7. Shopping–Catering commercial facilities system.
Sustainability 15 04205 g007
Figure 8. Binary parity research on shopping and life service facilities: (a) Parity entropy distribution of shopping and life service commercial activities; (b) Spatial distribution of shopping and life-service-dominant zones.
Sustainability 15 04205 g008
Figure 9. Shopping–Life service facilities system.
Sustainability 15 04205 g009
Figure 10. Binary parity research on catering and life service facilities: (a) Parity entropy distribution of catering and life service commercial activities; (b) Spatial distribution of catering and life-service-dominant zones.
Sustainability 15 04205 g010
Figure 11. Catering and life service commercial facilities main system.
Sustainability 15 04205 g011
Figure 12. (a) Shopping–catering–life service entropy value; (b) Space distribution of majority percentage of shopping–catering–life.
Sustainability 15 04205 g012
Figure 13. Search radius: (a) Taking 400 m as the search radius; (b) Taking 4000 m as the search radius.
Sustainability 15 04205 g013
Figure 14. Comprehensive evaluation of commercialization level.
Sustainability 15 04205 g014
Figure 15. Business development system.
Sustainability 15 04205 g015
Figure 16. Commercial level rankings under public investigation.
Sustainability 15 04205 g016
Figure 17. Top five commercial level rankings according to personal differentiation.
Sustainability 15 04205 g017
Figure 18. Public cognition: (a) Public cognition on Xinjiekou, Confucius Temple; (b) Public cognition on Longjiang; (c) Public cognition on Hunan Road; (d) Public cognition on Zhongyangmen; (e) Public cognition on Hexi; (f) Public cognition on Longjiang.
Sustainability 15 04205 g018
Table 1. Binary correlations of shopping, catering, and life service commercial POIs.
CateringShopping
CorrelationCatering1.0000.761
Shopping0.7611.000
SignificanceCatering-0.000
Shopping0.000-
CasesCatering15951595
Shopping15951595
ShoppingLife Service
CorrelationShopping1.0000.791
Life Service0.7911.000
SignificanceShopping-0.000
Life Service0.000-
CasesShopping16581658
Life Service16581658
ShoppingLife Service
CorrelationShopping1.0000.791
Life Service0.7911.000
SignificanceShopping-0.000
Life Service0.000-
CasesShopping16581658
Life Service16581658
Table 2. Factor weights in the current commercial-level evaluation.
CategoryGrade I WeightSubcategoryGrade IIWeighted Score
1357
Commercial Aggregation Centrality0.2926FD Aggregation Centrality Discrepancy1L, Non-significant Land UseH-L, L-HH-H/
Commercial Attractiveness0.1849Attractiveness at a Walking Scale (400 m)0.7750Grade IGrade IIGrade IIIGrade IV
Attractiveness at a Driving Scale (4000 m)0.2250Grade IGrade IIGrade IIIGrade IV
Commercial Services0.3155Commercial Facility Services by Population Per Unit0.6667Grade IGrade IIGrade IIIGrade IV
Commercial Facility Services by Housing Price Per Unit0.3333Grade IGrade IIGrade IIIGrade IV
Commercial Activity0.2070Mixture of Catering and Shopping Facilities0.5586Non-significant Land UseLand Dominated by Catering FacilitiesLand Dominated by Shopping FacilitiesLand Equally Shared
Mixture of Catering and Life Service Facilities0.1786Non-significant Land UseLand Dominated by LifeLand Dominated by Catering FacilitiesLand Equally Shared
Mixture of Shopping and Life Service Facilities0.2628Non-significant Land UseLand Dominated by LifeLand Dominated by Shopping FacilitiesLand Equally Shared
Disclaimer/Publisher’s Note: The statements, opinions and data contained in all publications are solely those of the individual author(s) and contributor(s) and not of MDPI and/or the editor(s). MDPI and/or the editor(s) disclaim responsibility for any injury to people or property resulting from any ideas, methods, instructions or products referred to in the content.

