

Analysis of the Ecosystem Structure and Energy Flow in the Waters of the Wangjiadao Islands


 , , ,
, , ,
Abstract
1. Introduction
2. Materials and Methods
2.1. Data Source
2.2. Research Methods and Rationale
2.3. Ecopath Model Building
2.4. Source of Functional gr 2.4 Source of Functional Group Parameters
2.5. Model Quality Analysis
3. Results
3.1. Analysis of Energy Flow Data of Wangjiadao Islands Waters’ Ecosystem
3.1.1. Trophic Level Characteristics of Wangjiadao Islands Waters’ Ecosystem
3.1.2. Trophic Level Energy Flow and Transfer Efficiency of Wangjiadao Islands Waters’ Ecosystem
3.1.3. Analysis of Mixed Trophic Effects in Wangjiadao Islands Waters’ Ecosystem
3.1.4. Analysis of Key Species in Wangjiadao Islands Waters’ Ecosystem
3.1.5. General Characteristics of Wangjiadao Islands’ Marine Ecosystem
4. Discussion
4.1. General Characteristics of Wangjiadao Islands Waters’ Ecosystem
4.2. Suggestions for Increasing Stocking in Wangjiadao Islands Waters
5. Conclusions
Author Contributions
Funding
Institutional Review Board Statement
Informed Consent Statement
Data Availability Statement
Acknowledgments
Conflicts of Interest
References
- Sha, S. The early warning model of tourism environmental carrying capacity measurement in Coast and Island Regions. J. Coast. Res. 2020, 103, 1042–1046. [Google Scholar] [CrossRef]
- Yuan, Y.; Yu, Z. Report of HAB Case Studies on Coastal Waters of Qingdao and Dalian in China; NOWPAP CEARAC: Toyama, Japan, 2011; pp. 1–42. [Google Scholar]
- Song, J.; Zhang, Z.; Chen, L. Changes in ecosystem services values in the south and north Yellow Sea between 2000 and 2010. Ocean Coast. Manag. 2021, 202, 105497. [Google Scholar] [CrossRef]
- Lin, Q.; Wang, J.; Li, Z. Ecological capacity of shellfish in waters adjacent to the Yellow River estuary. J. Appl. Ecol. 2018, 29, 337–344. [Google Scholar]
- Bueno-Pardo, J.; García-Seoane, E.; Sousa, A.I. Trophic web structure and ecosystem attributes of a temperate coastal lagoon (Ria de Aveiro, Portugal). Ecol. Model. 2018, 378, 13–25. [Google Scholar] [CrossRef]
- Moreau, J.; Mavuti, K.; Daufresne, T. A synoptic Ecopath model of biomass flows during two different static ecological situations in Lake Nakuru (Kenya). Hydrobiologia 2001, 458, 63–74. [Google Scholar] [CrossRef]
- Aoki, I. Diversity–productivity–stability relationship in freshwater ecosystems: Whole-systemic view of all trophic levels. Ecol. Res. 2003, 18, 397–404. [Google Scholar] [CrossRef]
- Polovina, J.J. Model of a coral reef ecosystem. Coral Reefs 1984, 3, 1–11. [Google Scholar] [CrossRef]
- Ulanowicz, R.E. Growth and Development: Ecosystems Phenomenology; Springer Science & Business Media: Berlin/Heidelberg, Germany, 2012. [Google Scholar]
- Walters, C.J.; Christensen, V.; Martell, S.J. Possible ecosystem impacts of applying MSY policies from single-species assessment. ICES J. Mar. Sci. 2005, 62, 558–568. [Google Scholar] [CrossRef]
- Zeng, X.L.; Wei, B.C.; Liu, X.G. Analysis of compound culturing pond build based on Ecopath model. J. Fish. China 2018, 42, 711–719. [Google Scholar]
- Fetahi, T.; Mengistou, S. Trophic analysis of Lake Awassa (Ethiopia) using mass-balance Ecopath model. Ecol. Model. 2007, 201, 398–408. [Google Scholar] [CrossRef]
- Tong, L.; Tang, Q.; Pauly, D. A preliminary approach on mass-balance ecopath model of the Bohai Sea. Ying Yong Sheng Tai Xue Bao 2000, 11, 435–440. [Google Scholar]
- Lin, Q.; Jin, X.; Zhang, B. Trophic interactions, ecosystem structure and function in the southern Yellow Sea. Chin. J. Oceanol. Limnol. 2013, 31, 46–58. [Google Scholar] [CrossRef]
- Lin, Q.; Li, X.-S.; Li, Z.-Y.; Jin, X.-S. Ecological carrying capacity of Chinese shrimp stock enhancement in Laizhou Bay of East China based on Ecopath model. J. Appl. Ecol. 2013, 24, 1131–1140. [Google Scholar]
- Chen, Z.; Qiu, Y.; Jia, X. Using an ecosystem modeling approach to explore possible ecosystem impacts of fishing in the Beibu Gulf, northern South China Sea. Ecosystems 2008, 11, 1318–1334. [Google Scholar] [CrossRef]
- Wu, Z.X.; Zhang, X.M.; Zhang, L.; Tong, F.; Liu, H.J. Structure and function of Lidao artificial reef ecosystem in Rongcheng of Shandong Province, East China: An evaluation based on Ecopath model. Ying Yong Sheng Tai Xue Bao 2012, 23, 10. [Google Scholar]
- Yang, H.C. Ecological Effect Assessment of Artificial Reef Area in Tangshan Marine Ranch Based on Ecopath Model. Bachelor’s Thesis, Dalian Ocean University, Liaoning, China, 2019. [Google Scholar]
- Calderon-Aguilera, L.E.; Reyes-Bonilla, H.; Olán-González, M. Estimated flows and biomass in a no-take coral reef from the eastern tropical Pacific through network analysis. Ecol. Indic. 2021, 123, 107359. [Google Scholar] [CrossRef]
- GB/T12763.6-2007; National Standardization Administration of China, Specification for Marine Surveys, Part 6: Marine Biological Surveys. Standard Publishing Press: Beijing, China, 2008.
- Yang, H.S. Marine Rangeland Monitoring and Biological Carrying Capacity Assessment; Science Press: Beijing, China, 2018. [Google Scholar]
- Moreau, J. Analysis of species changes in Lake Victoria using ECOPATH, a multispecies trophic model. In The Impact of Species Changes in African Lakes; Springer: Dordrecht, The Netherlands, 1995; pp. 137–161. [Google Scholar]
- Christensen, V.; Walters, C.J. Ecopath with Ecosim: Methods, capabilities and limitations. Ecol. Model. 2004, 172, 109–139. [Google Scholar] [CrossRef]
- Jiang, W.; Gibbs, M. Predicting the carrying capacity of bivalve shell-fish culture using a steady, linear food web model. Aquaculture 2005, 244, 171–185. [Google Scholar] [CrossRef]
- Weitzman, J.; Filgueira, R. The evolution and application of carrying capacity in aquaculture: Towards a research agenda. Rev. Aquac. 2020, 12, 1297–1322. [Google Scholar] [CrossRef]
- Li, C.; Xian, Y.; Ye, C. Wetland ecosystem status and restoration using the Ecopath with Ecosim (EWE) model. Sci. Total Environ. 2019, 658, 305–314. [Google Scholar] [CrossRef]
- Pauly, D.; Christensen, V. Stratified models of large marine ecosystems: A general approach and an application to the South China Sea. In Large Marine Ecosystems: Stress, Mitigation and Sustainability; AAAS Press: Washington, DC, USA, 1993; pp. 148–174. [Google Scholar]
- Gui, J.; Wei, Y.; Sun, J. Summer phytoplankton assemblages and carbon biomass in the northern south China sea. Cont. Shelf Res. 2020, 210, 104276. [Google Scholar] [CrossRef]
- Pauly, D. On the interrelationships between natural mortality, growth parameters, and mean environmental temperature in 175 fish stocks. ICES J. Mar. Sci. 1980, 39, 175–192. [Google Scholar] [CrossRef]
- Palomares, M.L.D.; Pauly, D. Predicting food consumption of fish populations as functions of mortality, food type, morphometrics, temperature and salinity. Mar. Freshw. Res. 1998, 49, 447–453. [Google Scholar] [CrossRef]
- Xu, S.; Chen, Z.; Li, S. Modeling trophic structure and energy flows in a coastal artificial ecosystem using mass-balance Ecopath model. Estuaries Coasts 2011, 34, 351–363. [Google Scholar] [CrossRef]
- Morissette, L.; Hammill, M.O.; Savenkoff, C. The trophic role of marine mammals in the northern Gulf of St. Lawrence. Mar. Mammal Sci. 2006, 22, 74–103. [Google Scholar] [CrossRef]
- Lindeman, R.L. The trophic-dynamic aspect of ecology. Ecology 1942, 23, 399–417. [Google Scholar] [CrossRef]
- Libralato, S.; Christensen, V.; Pauly, D. A method for identifying keystone species in food web models. Ecol. Model. 2006, 195, 153–171. [Google Scholar] [CrossRef]
- Cao, L.; Wang, W.; Yang, Y. Environmental impact of aquaculture and countermeasures to aquaculture pollution in China. Environ. Sci. Pollut. Res. Int. 2007, 14, 452–462. [Google Scholar]
- Zhao, L.; Wei, H.; Feng, S. Annual cycle and budgets of nutrients in the Bohai Sea. Environ. Sci. 2002, 23, 78–81. [Google Scholar]
- Wang, S.D.H.; Zhan, B.-Y. Marine fishery resource management in PR China. Mar. Policy 1992, 16, 197–209. [Google Scholar] [CrossRef]
- Menge, B.A.; Daley, B.A.; Wheeler, P.A. Benthic–pelagic links and rocky intertidal communities: Bottom-up effects on top-down control? Proc. Natl. Acad. Sci. USA 1997, 94, 14530–14535. [Google Scholar] [CrossRef]
- Yan, L.; Zhongxin, W.; Changping, Y. Ecological carrying capacity of six species of stock enhancement in Pearl River estuary based on Ecopath model. South Fish. Sci. 2019, 15, 19–28. [Google Scholar]
- Zhang, Z.; Zhang, J.; Wu, W. Ecological capacity assessment of bottom-sown scallop enrichment in Swertia swertia. China Fish. Sci. 2021, 28, 878–887. [Google Scholar]
- Officer, C.B.; Smayda, T.J.; Mann, R. Benthic filter feeding: A natural eutrophication control. Mar. Ecol. Prog. Ser. 1982, 9, 203–210. [Google Scholar] [CrossRef]
- Qin, P.-B.; Lu, J.W. Effects of filter-feeding shellfish on nutrient cycling in shallow mariculture systems. Mar. Sci. 2001, 5, 27–29. [Google Scholar]
- Yang, L.L.; Jiang, A.S.; Yuan, X.W. Ecological capacity assessment of typical enrichment species in Xiangshan Harbor. Mar. Fish. 2016, 38, 273–282. [Google Scholar]


| No. | Group Name | Species Composition |
|---|---|---|
| 1 | Scomber japonicus | Scomber japonicus |
| 2 | Platycephalus indicus | Platycephalus indicus |
| 3 | Other pelagic fish | Pholis nebulosa, Scomberomorus niphonius, Engraulis japonius, Setipinna tenuifilis |
| 4 | Other demersal fish | Larimichthys polyactis, Gobiidae tenuifilis, Hexagrammos otakii |
| 5 | Stichopus japonicus | Stichopus japonicus |
| 6 | Penaeus orientalis | Penaeus japonicus, Fenneropenaeus chinensis |
| 7 | Portunus trituberculatus | Portunus trituberculatus |
| 8 | Oratosquilla oratoria | Oratosquilla oratoria |
| 9 | Small crustaceans | Alpheus distinguendus, Palaemon gravieri |
| 10 | Mizuhopecten yessoensis | Mizuhopecten yessoensis |
| 11 | Chlamys farreri | Chlamys farreri |
| 12 | Ruditapes philippinarum | Ruditapes philippinarum |
| 13 | Ostrea gigas thunberg | Ostrea gigas thunberg |
| 14 | Scapharca broughtonii | Scapharca broughtonii |
| 15 | Other mollusks | Abalone, Octopodidae, Rapana venosa |
| 16 | Copepods | Calanus sinicus, Euchaeta concinna |
| 17 | Other benthos | Nereis succinea |
| 18 | Microzooplankton | Protozoa, Rotifer |
| 19 | Other macrozooplankton | Euphysora spp. |
| 20 | Macroalgae | zostera marina, Porphyra, crispata, Kjellm, Gelidium amansii |
| 21 | Phytoplankton | diatom, Cyanobacteria, Dinoflagellates |
| 22 | Detritus | Bodies of animals and plants, excrement Organic matter imported from rivers |
| Group Name | Trophic Level | Biomass (t/km²) | Production/Biomass (a−1) | Consumption/Biomass (a−1) | Ecotrophic Efficiency | Production/Consumption (a−1) |
|---|---|---|---|---|---|---|
| Scomber japonicus | 3.91 | 1.81 | 2.16 | 5.20 | 0.07 | 0.41 |
| Platycephalus indicus | 3.79 | 1.43 | 1.28 | 11.35 | 0.11 | 0.11 |
| Other pelagic fish | 3.47 | 13.10 | 0.99 | 7.10 | 0.69 | 0.14 |
| Other demersal fish | 3.13 | 1.60 | 3.91 | 6.54 | 0.62 | 0.59 |
| Stichopus japonicus | 2.30 | 54.20 | 1.30 | 3.36 | 0.31 | 0.39 |
| Penaeus orientalis | 3.34 | 3.35 | 25.37 | 45.20 | 0.35 | 0.56 |
| Portunus trituberculatus | 3.52 | 1.28 | 3.13 | 12.30 | 0.82 | 0.25 |
| Oratosquilla oratoria | 2.94 | 3.66 | 1.10 | 8.00 | 0.44 | 0.14 |
| Small Crustaceans | 2.56 | 46.00 | 6.10 | 41.22 | 0.46 | 0.15 |
| Mizuhopecten yessoensis | 2.30 | 417.10 | 1.86 | 16.65 | 0.41 | 0.11 |
| Chlamys farreri | 2.57 | 346.60 | 1.67 | 6.10 | 0.49 | 0.27 |
| Ruditapes philippinarum | 2.51 | 194.00 | 5.00 | 20.00 | 0.13 | 0.25 |
| Ostrea gigas thunberg | 2.71 | 175.50 | 3.99 | 16.90 | 0.14 | 0.24 |
| Scapharca broughtonii | 2.51 | 114.30 | 22.86 | 457.3 | 0.11 | 0.05 |
| Other molluscs | 2.30 | 18.30 | 5.30 | 50.60 | 0.92 | 0.11 |
| Copepods | 2.05 | 260.00 | 68.90 | 150.10 | 0.76 | 0.46 |
| Other benthos | 3.13 | 11.00 | 5.13 | 27.50 | 0.49 | 0.19 |
| Microzooplankton | 2.00 | 265.00 | 88.30 | 297.90 | 0.97 | 0.29 |
| Other Macrozooplankton | 2.00 | 15.03 | 27.00 | 57.70 | 0.88 | 0.47 |
| Macroalgae | 1.00 | 14.64 | 100.00 | -- | 0.71 | -- |
| Phytoplankton | 1.00 | 400.90 | 285.00 | -- | 0.81 | -- |
| Detritus | 1.00 | 311.60 | -- | -- | 0.57 | -- |
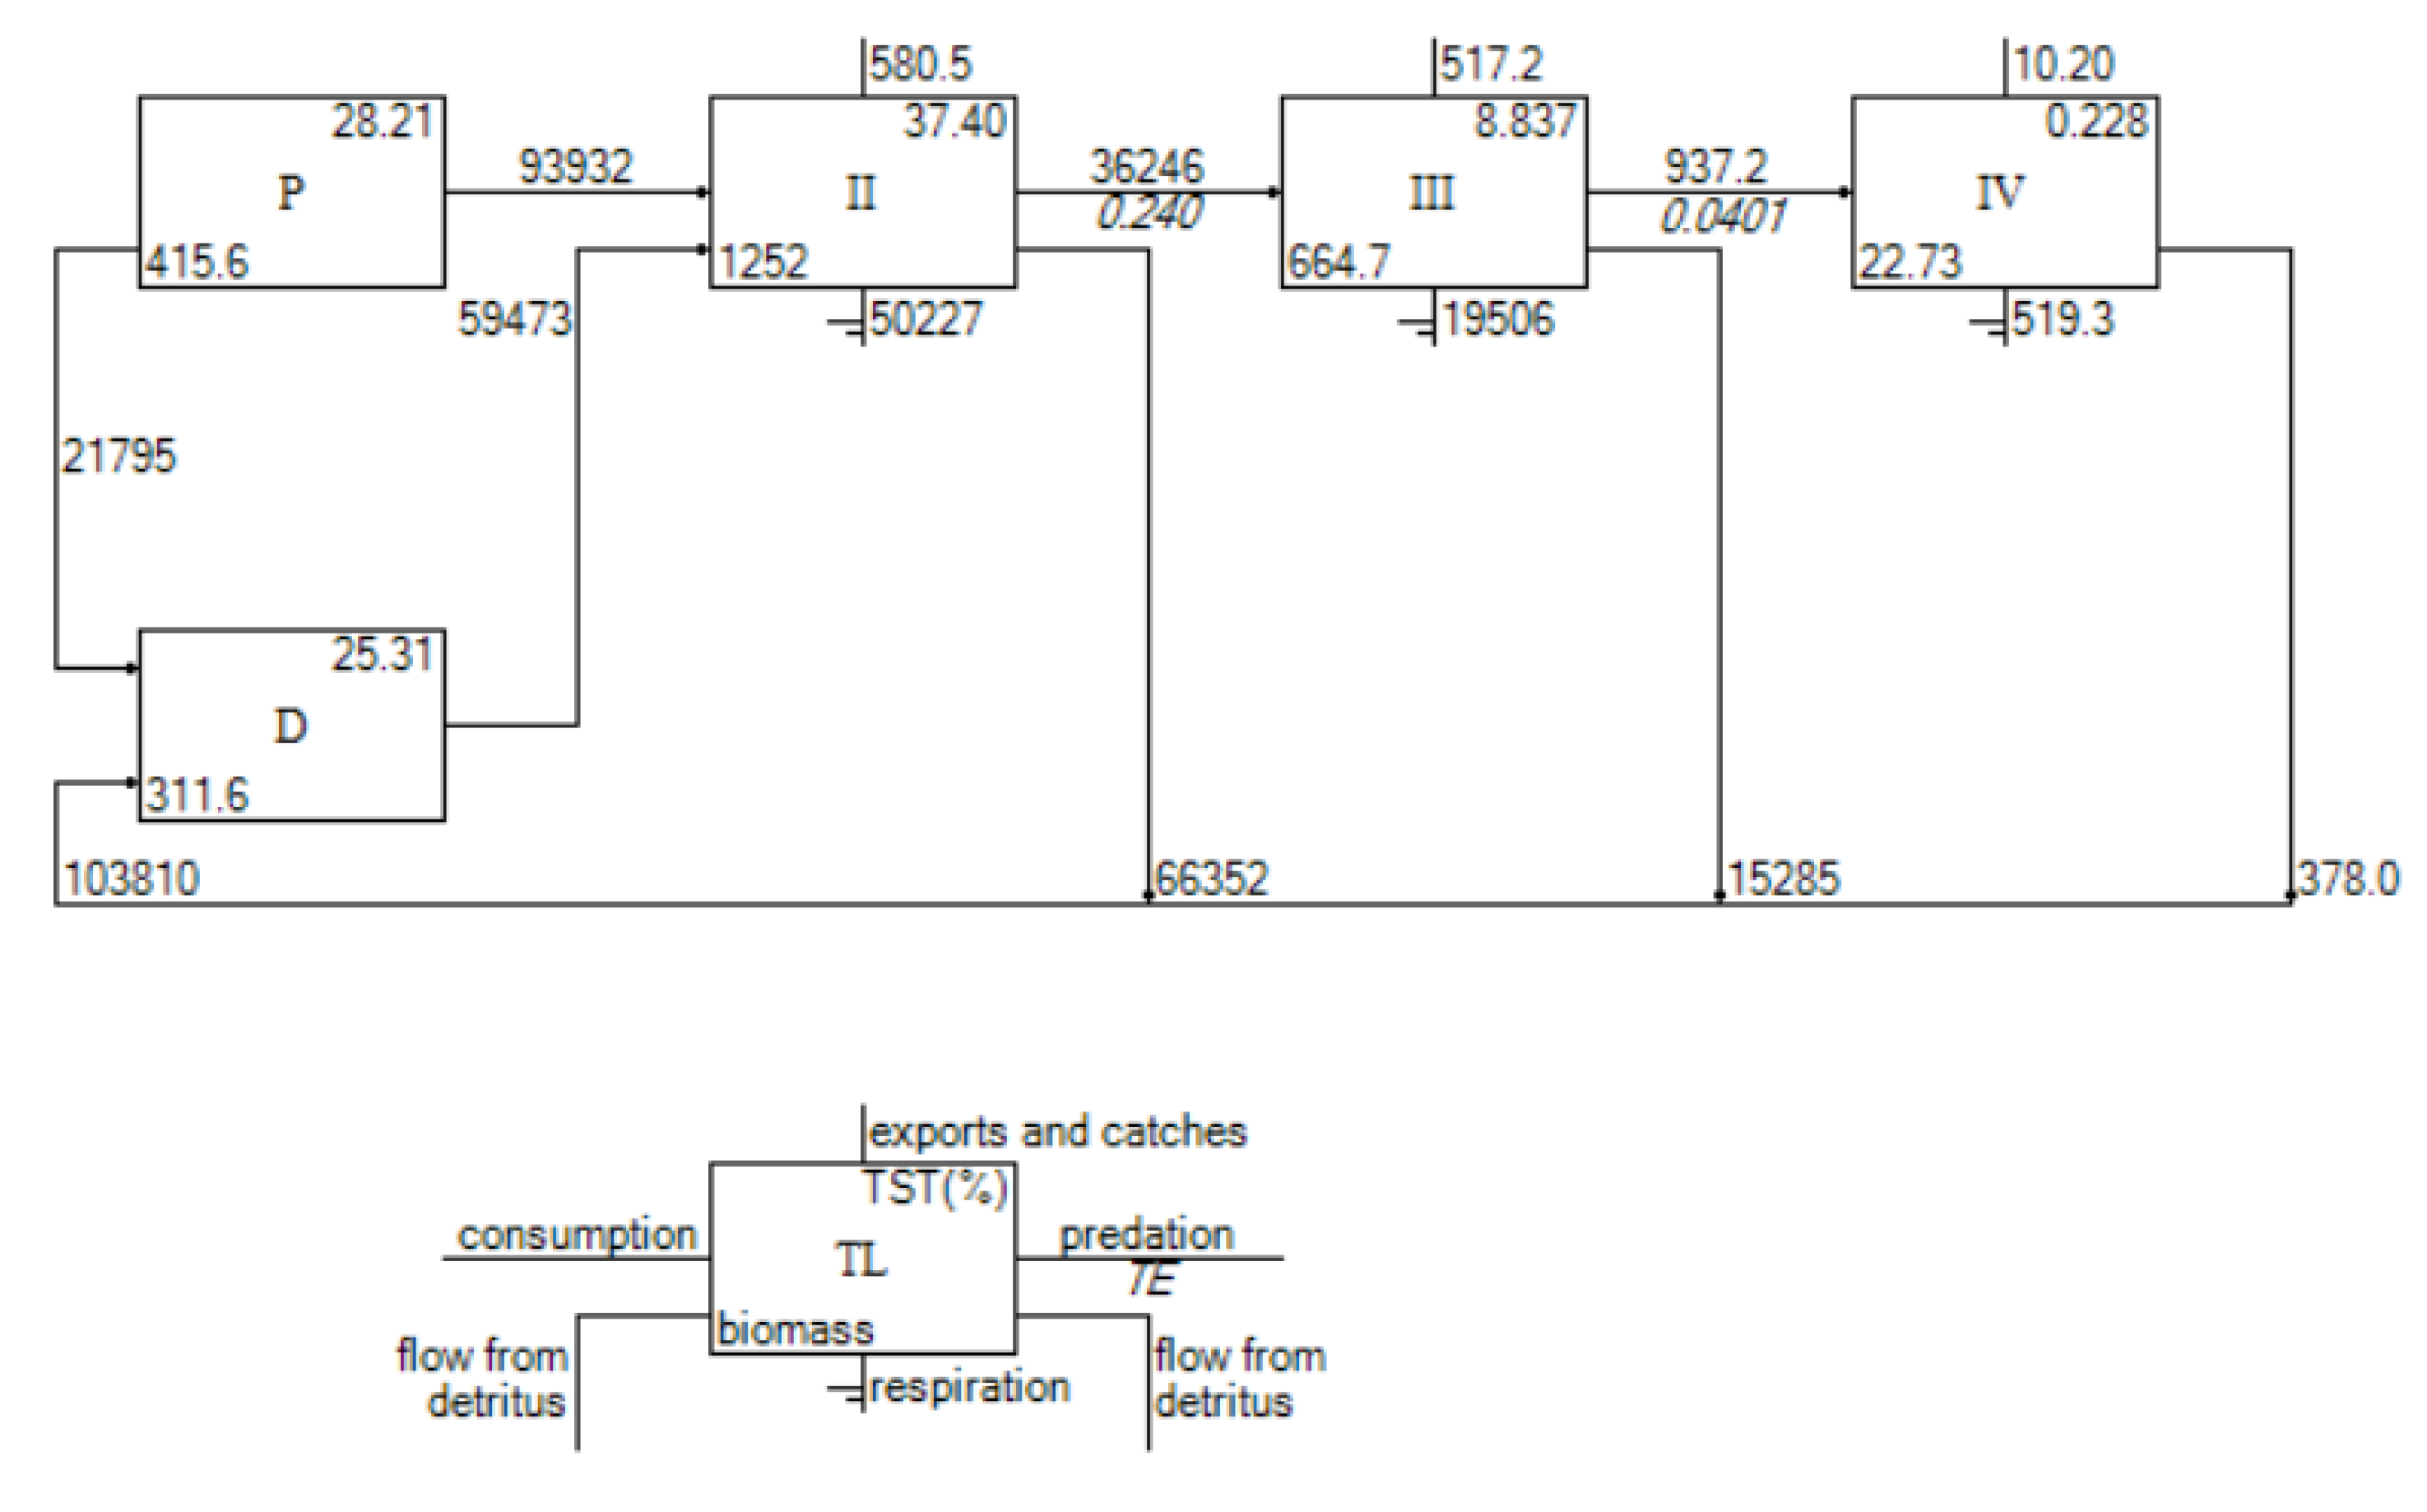
| Trophic Levels | Integrated Trophic Level Energy Flow Distribution | ||||
|---|---|---|---|---|---|
| Consumption by Predators | Export | Flow to Detritus | Respiration | Throughput | |
| V | 2.93 | 0.25 | 11.12 | 15.23 | 29.53 |
| IV | 29.53 | 7.50 | 380.70 | 519.10 | 936.90 |
| III | 936.90 | 403.9 | 15,398.00 | 19,505.00 | 36,245.00 |
| II | 36,245.00 | 460.5 | 66,473.00 | 50,226.00 | 153,405.00 |
| I | 153,405.00 | 44,589.00 | 21,797.00 | 0 | 219,790.00 |
| Sum | 190,619.00 | 45,461.00 | 104,062.00 | 70,268.00 | 410,409.00 |
| Source | Trophic Level (TL) | ||
|---|---|---|---|
| II | III | IV | |
| Producer | 24.45 | 3.620 | 4.696 |
| Detritus | 23.30 | 4.661 | 3.723 |
| All flows | 24.01 | 4.013 | 4.247 |
| Proportion of total flow originating from detritus | 43% | ||
| Transfer efficiencies (calculated as geometric mean for TL II-IV) | |||
| From primary producers | 7.463% | ||
| From detritus | 7.395% | ||
| Total transfer efficiencies | 7.423% | ||
| Index | Functional Group | Keystone Index #1 | Keystone Index #2 | Keystone Index #3 | Relative Total Impact |
|---|---|---|---|---|---|
| 1 | Scomber japonicus | −0.19 | 2.93 | 1.04 | 0.51 |
| 2 | Platycephalus indicus | −0.04 | 3.17 | 1.26 | 0.71 |
| 3 | Other pelagic fish | −0.01 | 2.25 | 1.14 | 0.78 |
| 4 | Other demersal fishes | −0.72 | 2.45 | 0.56 | 0.15 |
| 5 | Stichopus japonicus | −0.88 | 0.77 | 0.09 | 0.11 |
| 6 | Penaeus orientalis | −0.14 | 2.71 | 1.06 | 0.57 |
| 7 | Portunus trituberculatus | 0.05 | 3.32 | 1.38 | 0.88 |
| 8 | Oratosquilla oratoria | −0.81 | 2.34 | 0.45 | 0.12 |
| 9 | Small Crustaceans | −0.74 | 1.71 | 0.99 | 0.78 |
| 10 | Mizuhopecten yessoensis | −0.01 | −0.14 | −0.89 | 0.10 |
| 11 | Chlamys farreri | −1.01 | −0.11 | −0.47 | 0.09 |
| 12 | Ruditapes philippinarum | −0.84 | 0.28 | −0.03 | 0.12 |
| 13 | Ostrea gigas thunberg | −0.58 | 0.58 | 0.29 | 0.22 |
| 14 | Scapharca broughtonii | −0.16 | 1.18 | 0.76 | 0.57 |
| 15 | Other molluscs | −0.28 | 1.82 | 0.76 | 0.41 |
| 16 | Copepods | −0.34 | 0.67 | 0.41 | 0.41 |
| 17 | Other benthos | 0.10 | 2.44 | 1.28 | 1.00 |
| 18 | Microzooplankton | −0.34 | 0.66 | 0.31 | 0.40 |
| 19 | Other Macrozooplankton | −0.46 | 1.74 | 0.62 | 0.27 |
| 20 | Macroalgae | −0.34 | 1.87 | 0.77 | 0.36 |
| 21 | Phytoplankton | −0.17 | 0.68 | 0.21 | 0.64 |
| Parameter | At Present | After Enhancement |
|---|---|---|
| Sum of all consumption/t·km−2·a−1 | 190,618.91 | 194,110.50 |
| Sum of all exports/t·km−2·a−1 | 45,460.69 | 43,190.28 |
| Sum of all respiratory flows /t·km−2·a−1 | 70,267.95 | 72,538.38 |
| Sum of all flows into detritus/t·km−2·a−1 | 104,061.70 | 102,427.10 |
| Total system throughput/t·km−2·a−1 | 410,409.31 | 412,266.31 |
| Sum of all production/t·km−2·a−1 | 163,706.09 | 164,229.00 |
| Calculated total net primary production/t·km−2·a−1 | 115,728.60 | 115,728.60 |
| Total primary production/total respiration | 1.65 | 1.59 |
| Net system production/t·km−2·a−1 | 45,460.69 | 43,190.27 |
| Total primary production/total biomass | 49.10 | 43.25 |
| Total biomass/total throughput | 0.006 | 0.006 |
| Total biomass (excluding detritus) | 2356.83 | 2675.65 |
| Connectance Index | 0.24 | 0.24 |
| System Omnivory Index | 0.18 | 0.19 |
| Ecopath pedigree | 0.475 | 0.475 |
| Finn Cycling Index | 13.89 | 13.89 |
| Mean Path Length | 3.55 | 3.55 |
Disclaimer/Publisher’s Note: The statements, opinions and data contained in all publications are solely those of the individual author(s) and contributor(s) and not of MDPI and/or the editor(s). MDPI and/or the editor(s) disclaim responsibility for any injury to people or property resulting from any ideas, methods, instructions or products referred to in the content. |
© 2023 by the authors. Licensee MDPI, Basel, Switzerland. This article is an open access article distributed under the terms and conditions of the Creative Commons Attribution (CC BY) license (https://creativecommons.org/licenses/by/4.0/).
Share and Cite
Zhao, Z.; Sun, J.; Yin, Z.; Cui, J.; Gu, H.; Wang, Y.; Li, J.; Xu, M.; Yang, J.; Tian, T. Analysis of the Ecosystem Structure and Energy Flow in the Waters of the Wangjiadao Islands. Sustainability 2023, 15, 4104. https://doi.org/10.3390/su15054104
Zhao Z, Sun J, Yin Z, Cui J, Gu H, Wang Y, Li J, Xu M, Yang J, Tian T. Analysis of the Ecosystem Structure and Energy Flow in the Waters of the Wangjiadao Islands. Sustainability. 2023; 15(5):4104. https://doi.org/10.3390/su15054104
Chicago/Turabian StyleZhao, Zhongfang, Jiaqi Sun, Zengqiang Yin, Jiuru Cui, Haifeng Gu, Yan Wang, Jiaxing Li, Min Xu, Jisong Yang, and Tao Tian. 2023. "Analysis of the Ecosystem Structure and Energy Flow in the Waters of the Wangjiadao Islands" Sustainability 15, no. 5: 4104. https://doi.org/10.3390/su15054104
APA StyleZhao, Z., Sun, J., Yin, Z., Cui, J., Gu, H., Wang, Y., Li, J., Xu, M., Yang, J., & Tian, T. (2023). Analysis of the Ecosystem Structure and Energy Flow in the Waters of the Wangjiadao Islands. Sustainability, 15(5), 4104. https://doi.org/10.3390/su15054104