
Development of Performance Measurement Models for Two-Lane Roads under Vehicular Platooning Using Conjugate Bayesian Analysis


Abstract
1. Introduction
2. Literature Review
3. Research Method
- ATS: this measure is the best-known performance measure for evaluating road users’ perceptions of the quality of traffic flow on two-lane roads [22].
- ATS/FFS: this measure shows the average speed reduction from interactions with other vehicles. Reducing this measure is accompanied by a decrease in the LOS. Because the FFS of roads changes under various traffic conditions, including FFS in the ATS could control the reduction rate of the LOS in two-lane roads [6].
- ATSPC/FFSPC: this measure is defined similarly to ATS/FFS, but it refers only to passenger cars because of the sensitive interaction of their speeds under various traffic conditions compared with heavy vehicles, especially under high traffic flow [26].
- PF: this measure denotes the percentage of vehicles with short headways in the traffic flow. This measure is obtained on the basis of the headway, in which the HCM considers 3 s [22] as the time headway for estimating PF. However, for other roads, the time headway should be modified.
- FD: this measure represents the number of followers in a directional traffic flow over a given unit of length, which is defined as 1 km or 1 mile. It is important to consider the degree of congestion through PF and the density of two-lane roads [22,25]. This measure is obtained by using density (D) and PF according to Equations (1) and (2), as follows:
- Platoon speed: one of the characteristics of vehicular platooning in a two-lane road under the formation of the platoon of vehicles is platoon speed in the direction of traffic flow, based on the following vehicle headway and slow-moving vehicles [70]. Vehicles in the platoon have a speed less than the ATS of the traffic flow [2].
- NFPC: this measure is introduced as a criterion for evaluating the effect of vehicular platooning and potential followers in platoon size and the degree of congestion as NFPC [30]. Thus, Equation (4) is proposed as a function of NF and capacity in two-lane roads, as follows:
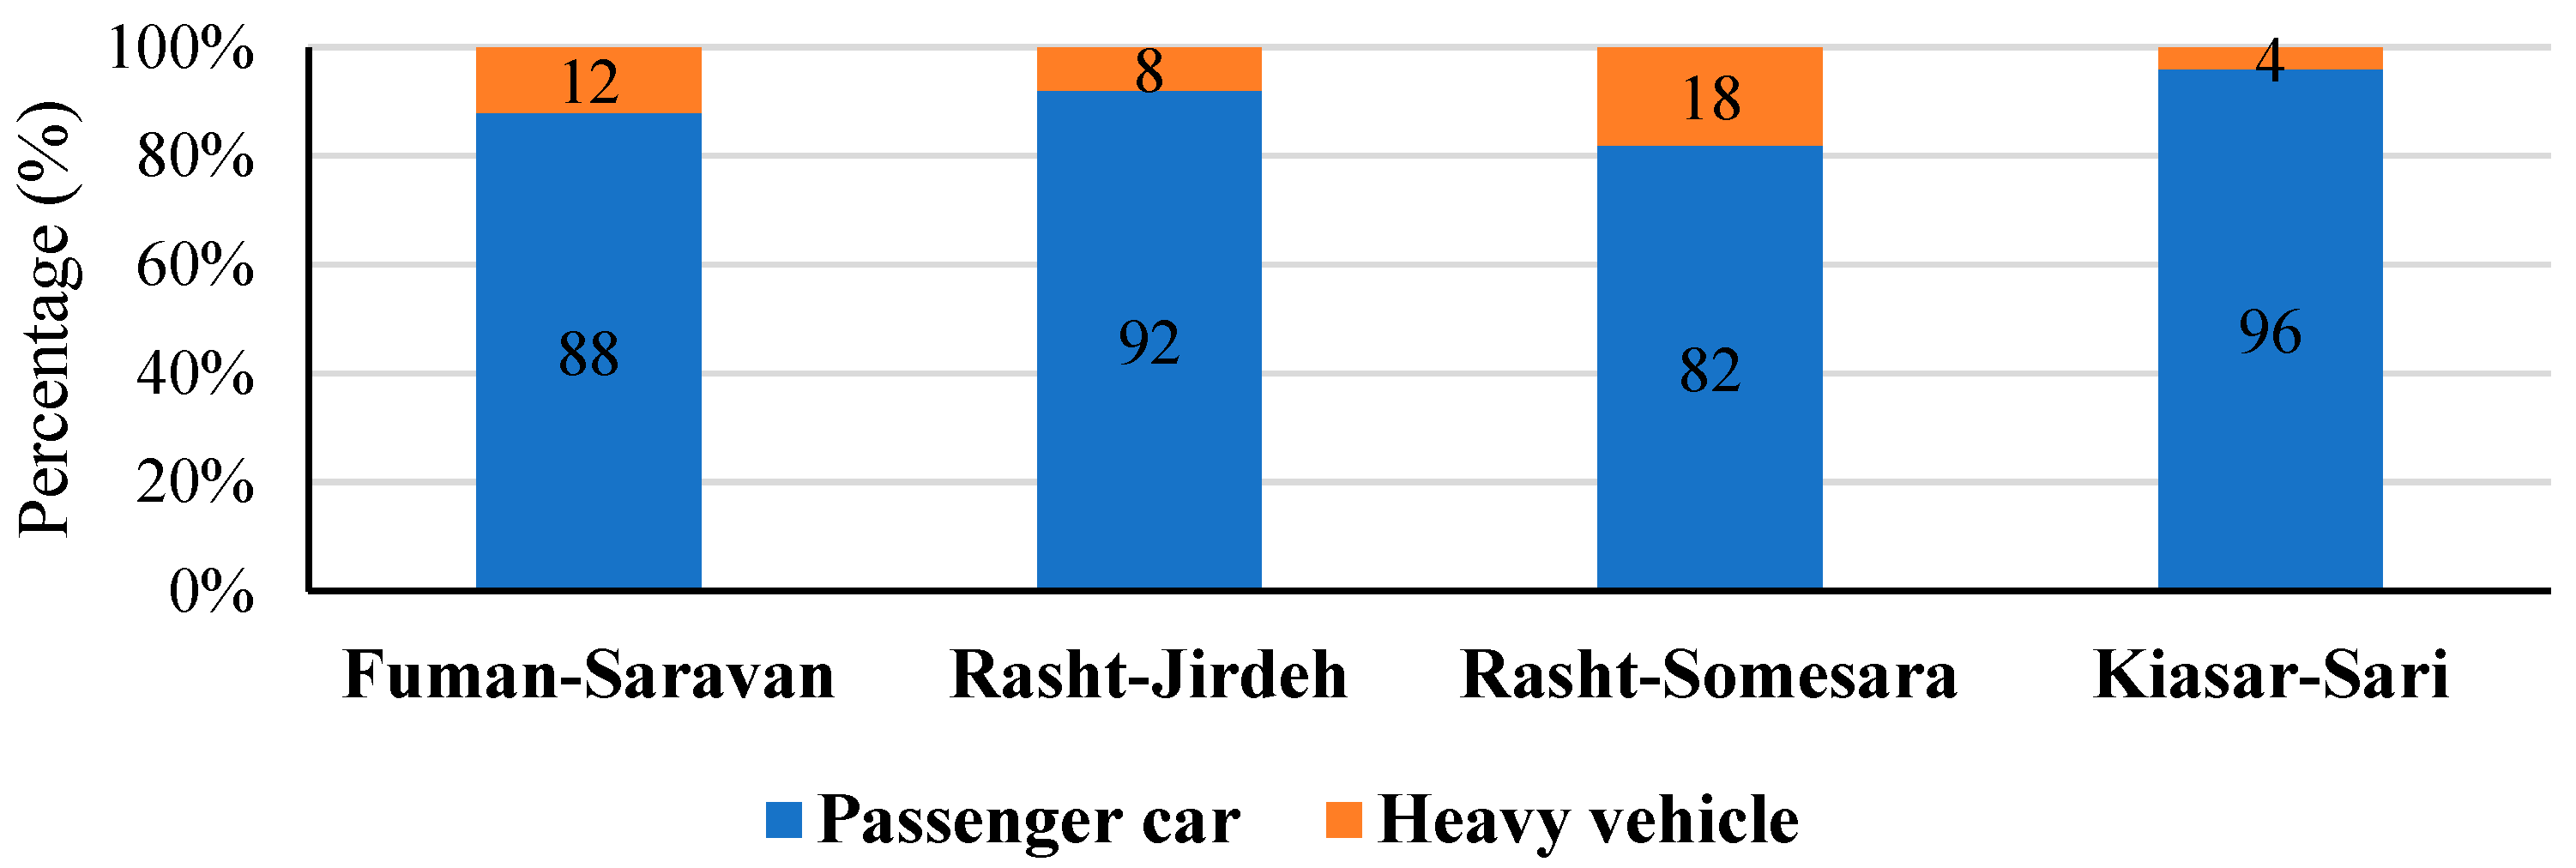
3.1. Case Study
3.2. Data Collection
3.3. MLR Model
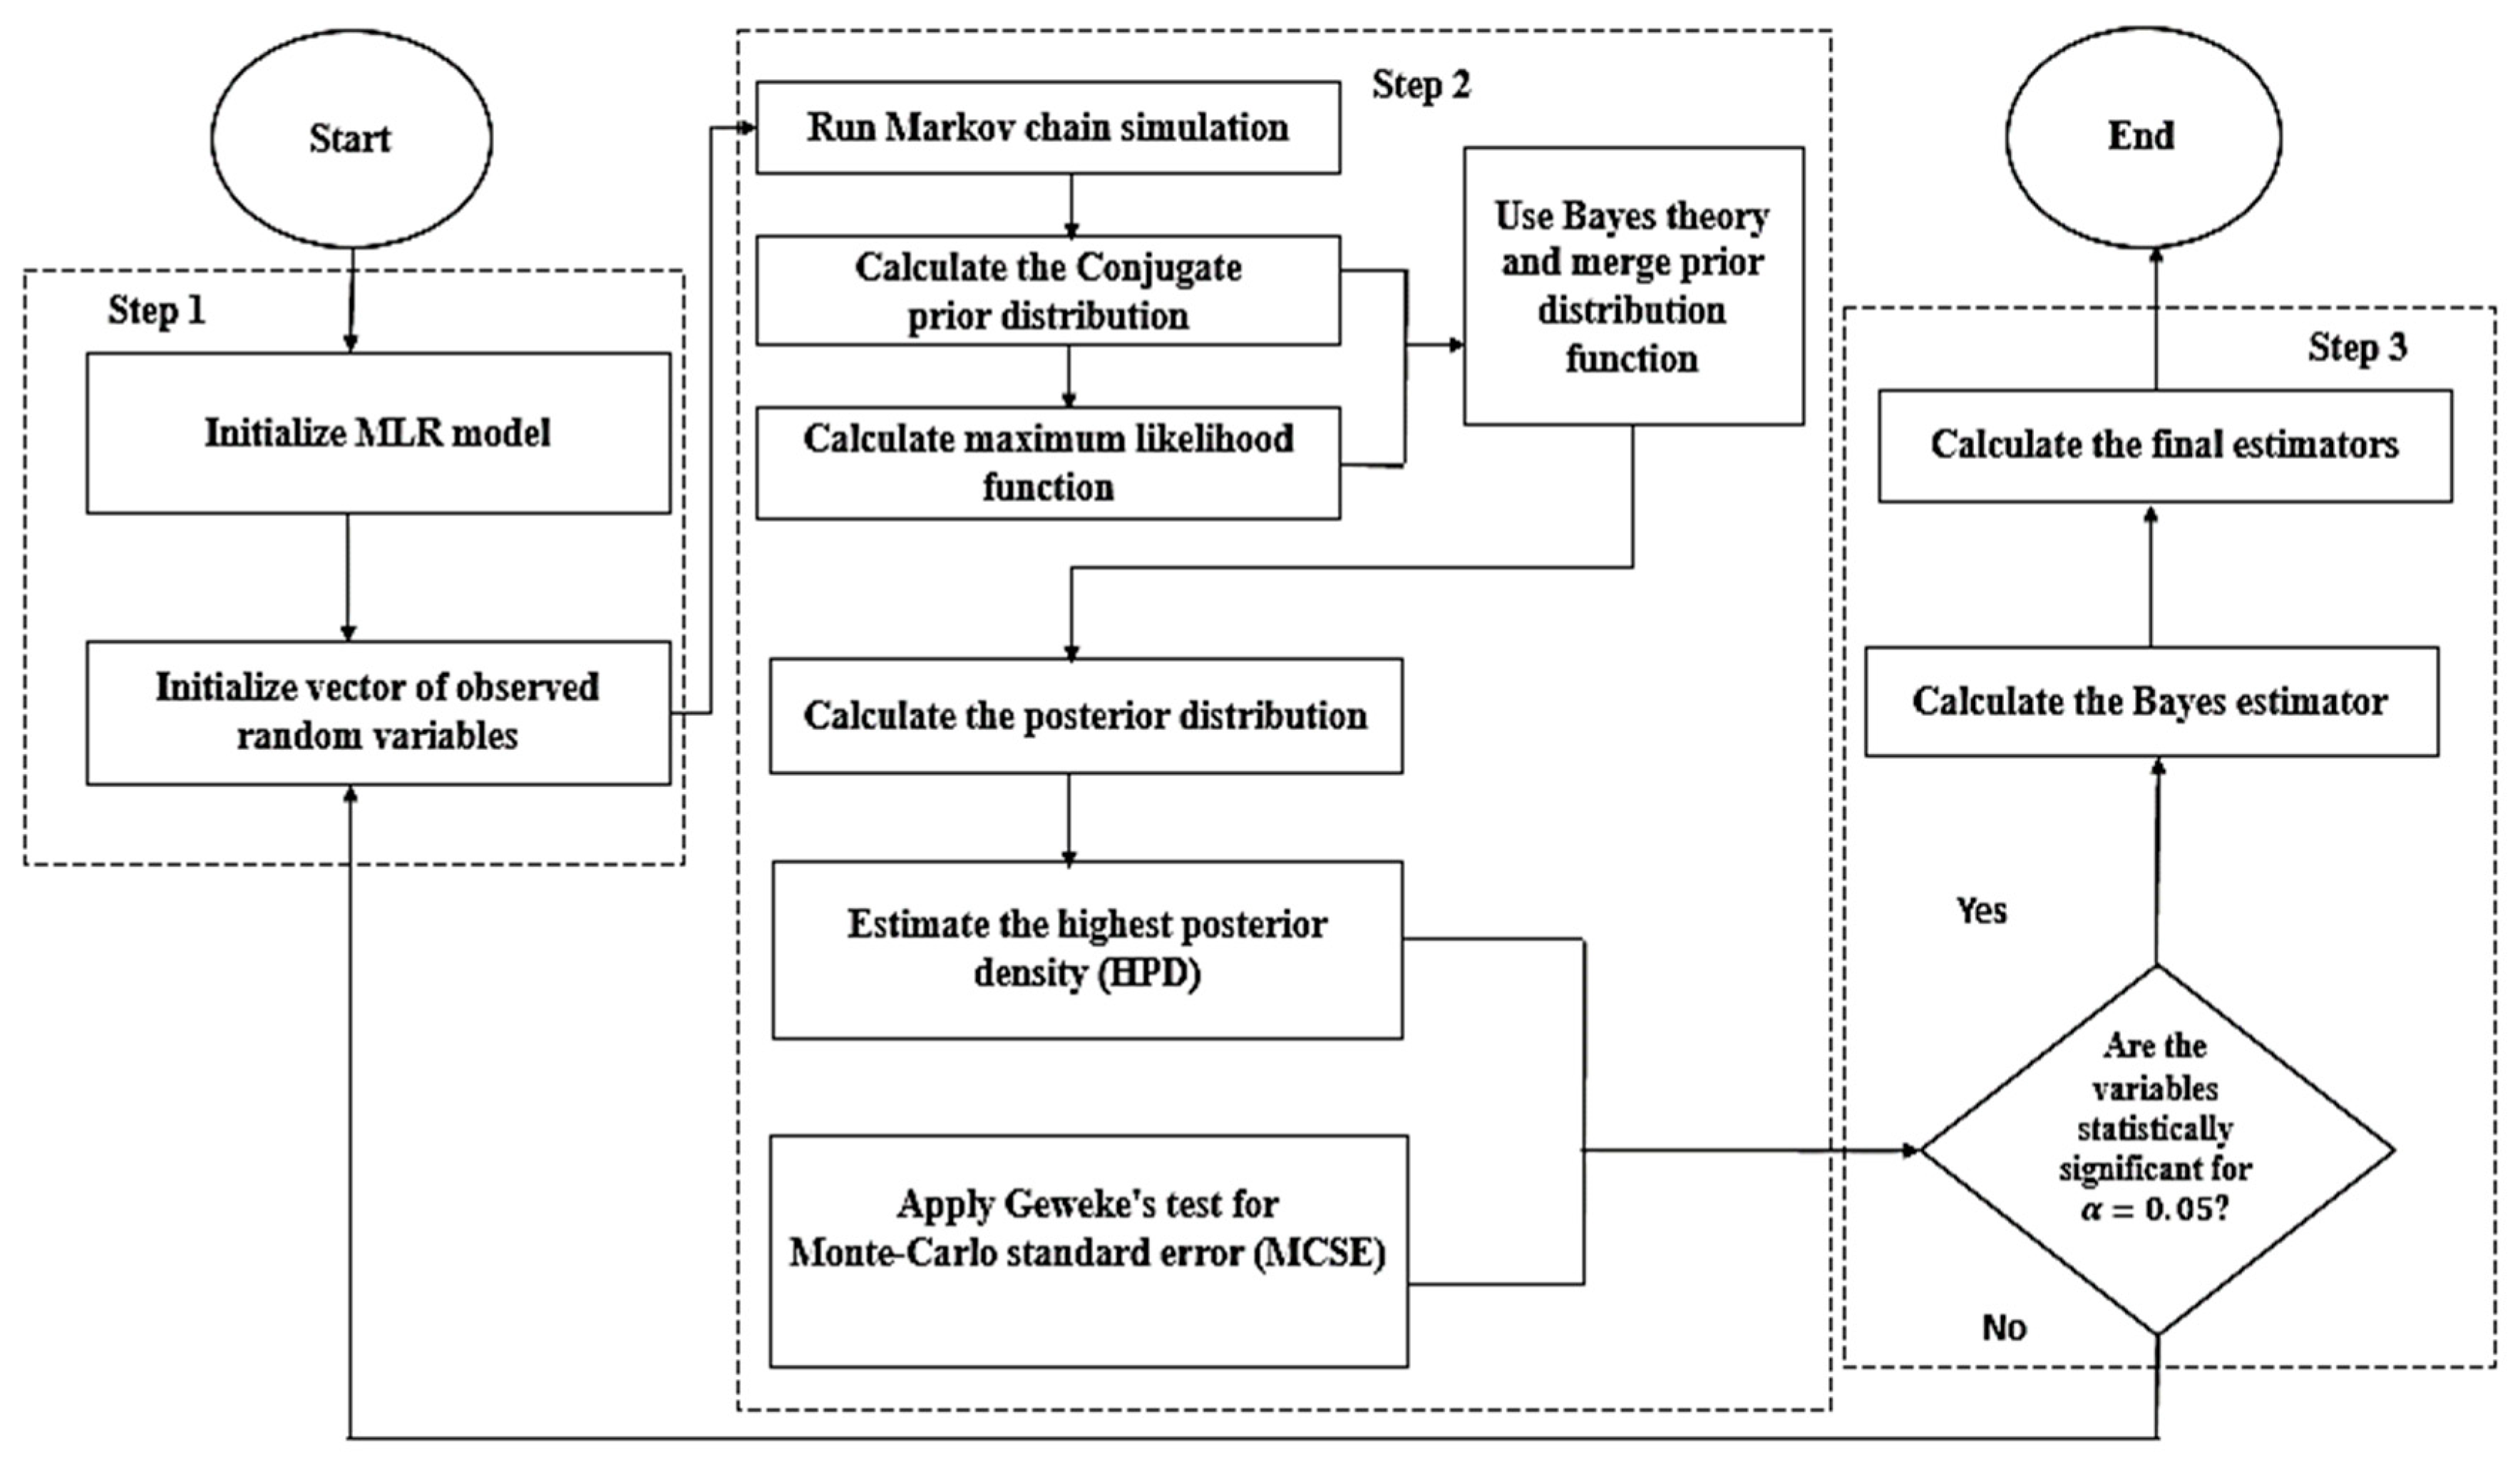
3.4. BLR Model Using Conjugate Prior Distribution
3.5. Comparison of Prediction Performance of Models
4. Results and Discussion
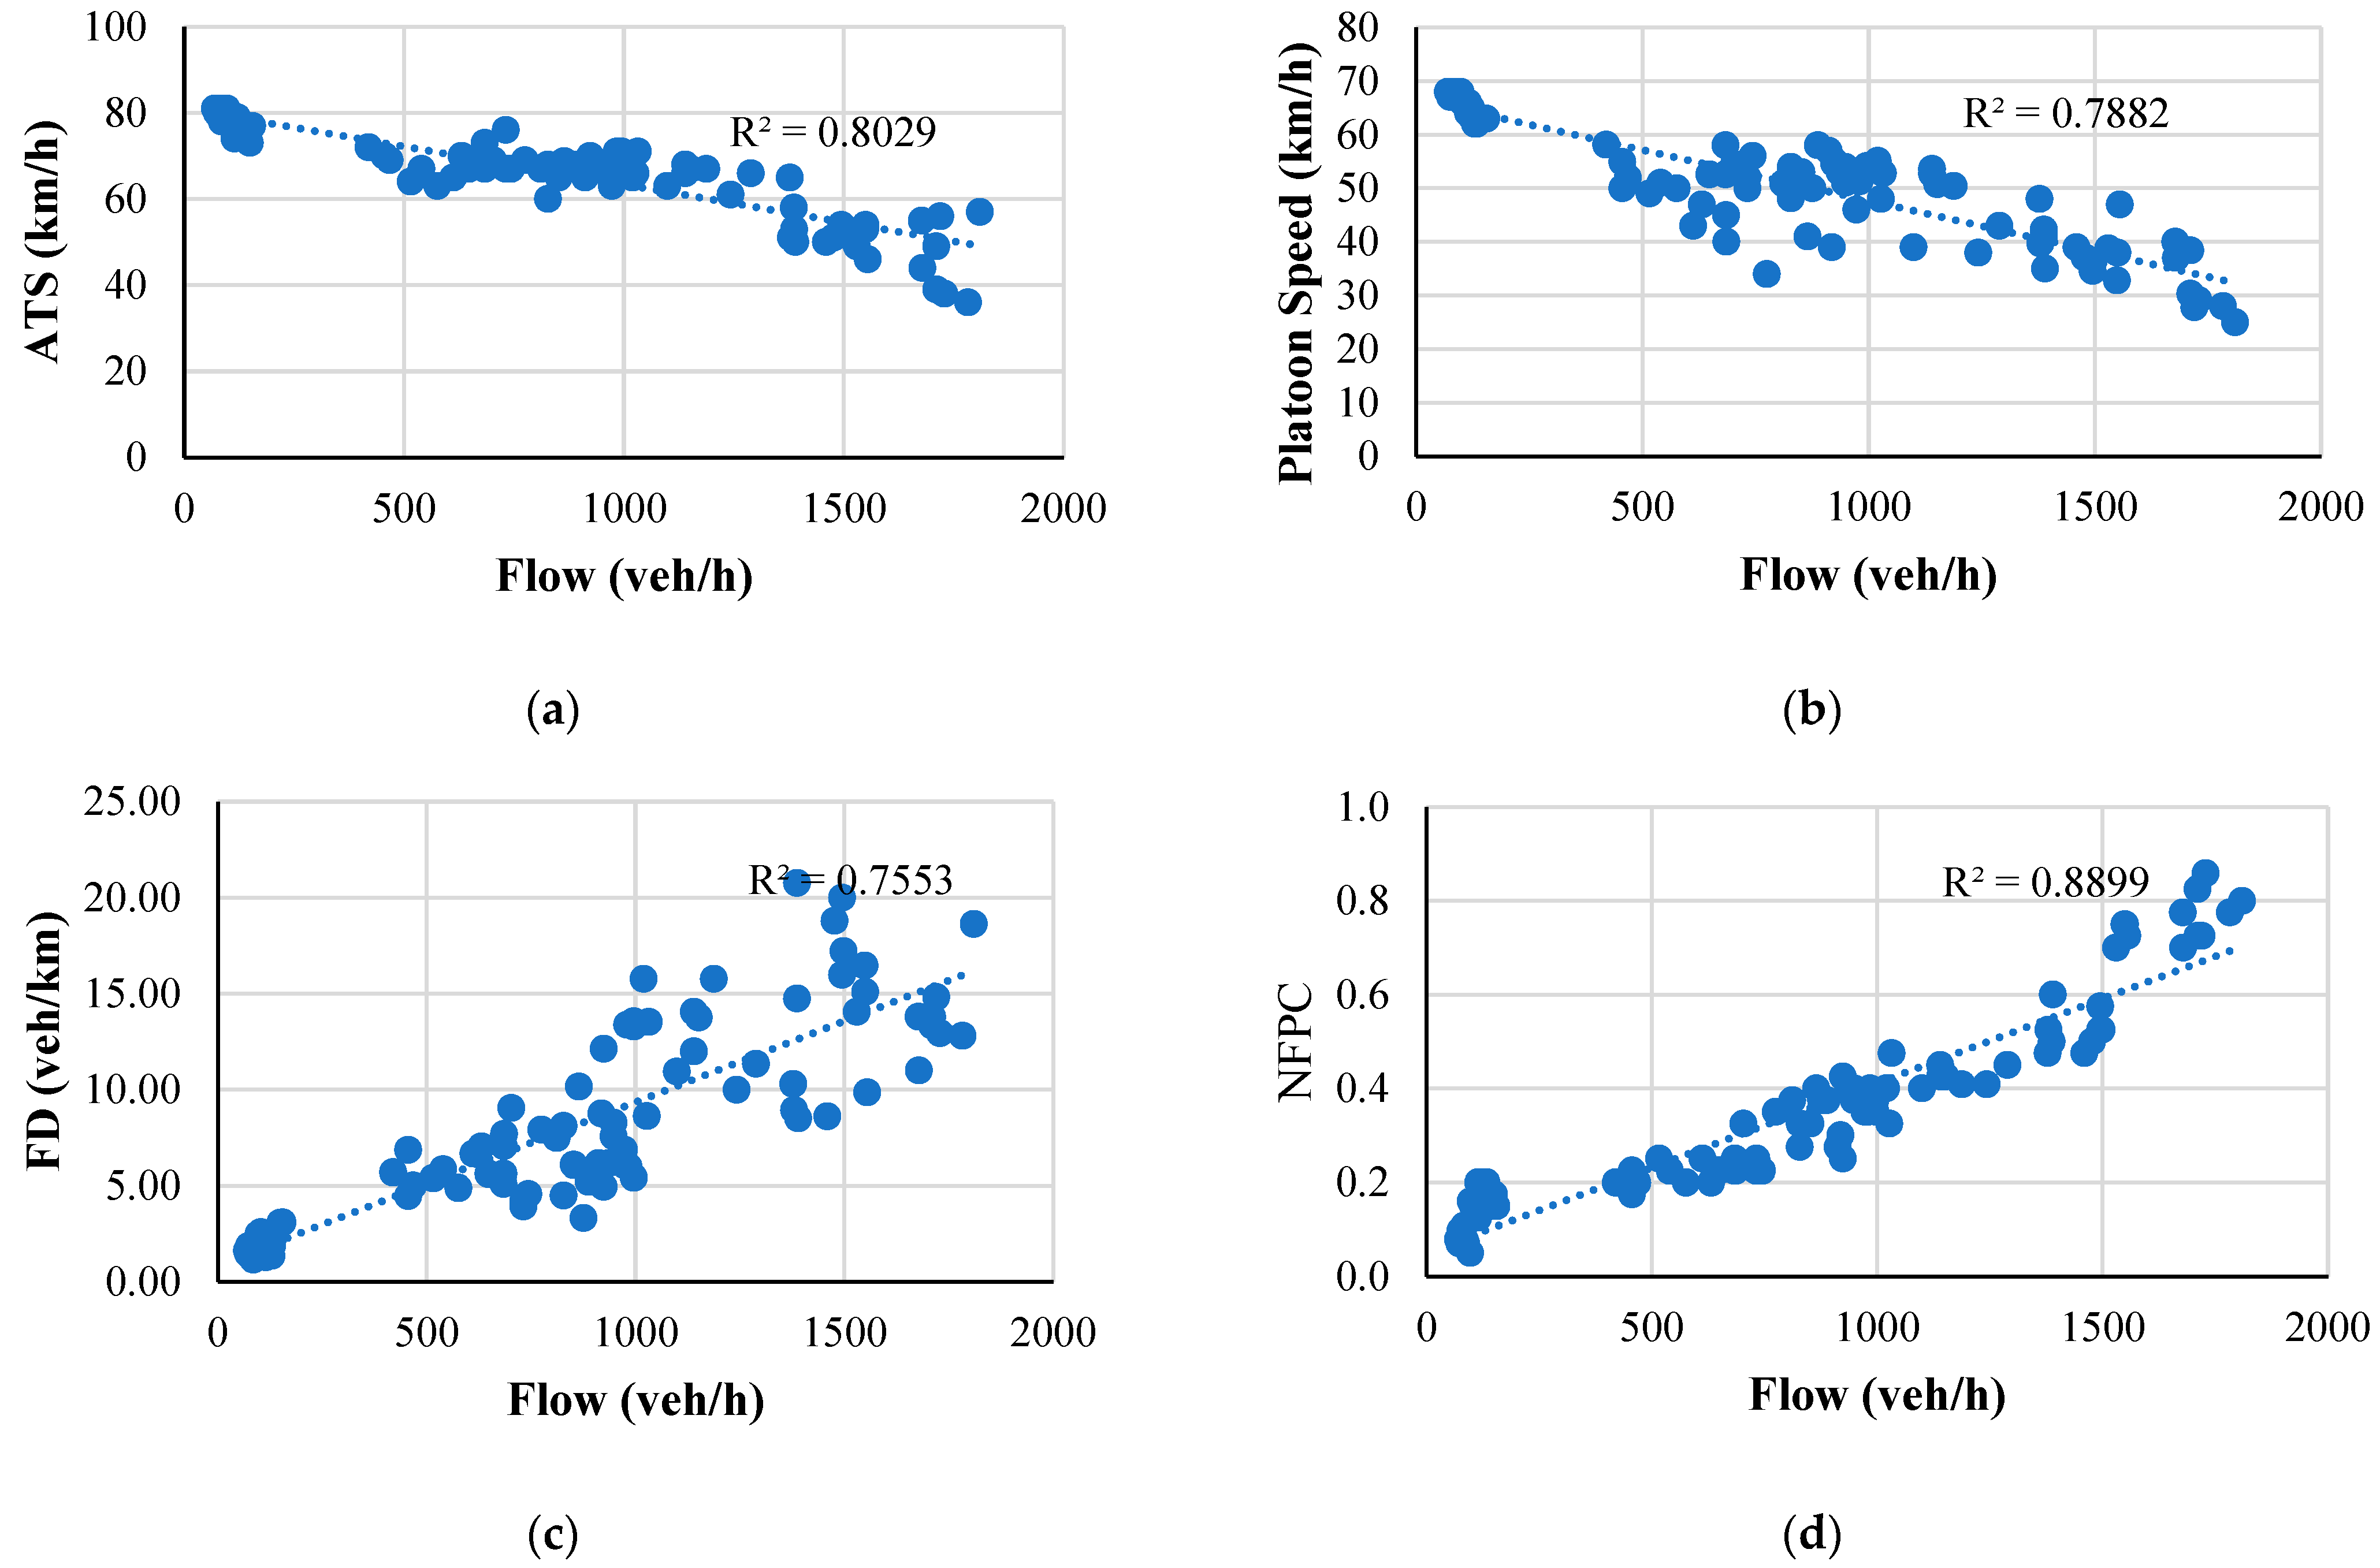
4.1. Pearson Correlation and MLR Model
4.2. BLR Model
4.3. Analysis of the Most-Influential Platooning Variable on Performance Measures
4.4. Evaluation of the LOS by Using the Preferred Performance Measure
4.5. Policy Implications
5. Conclusions
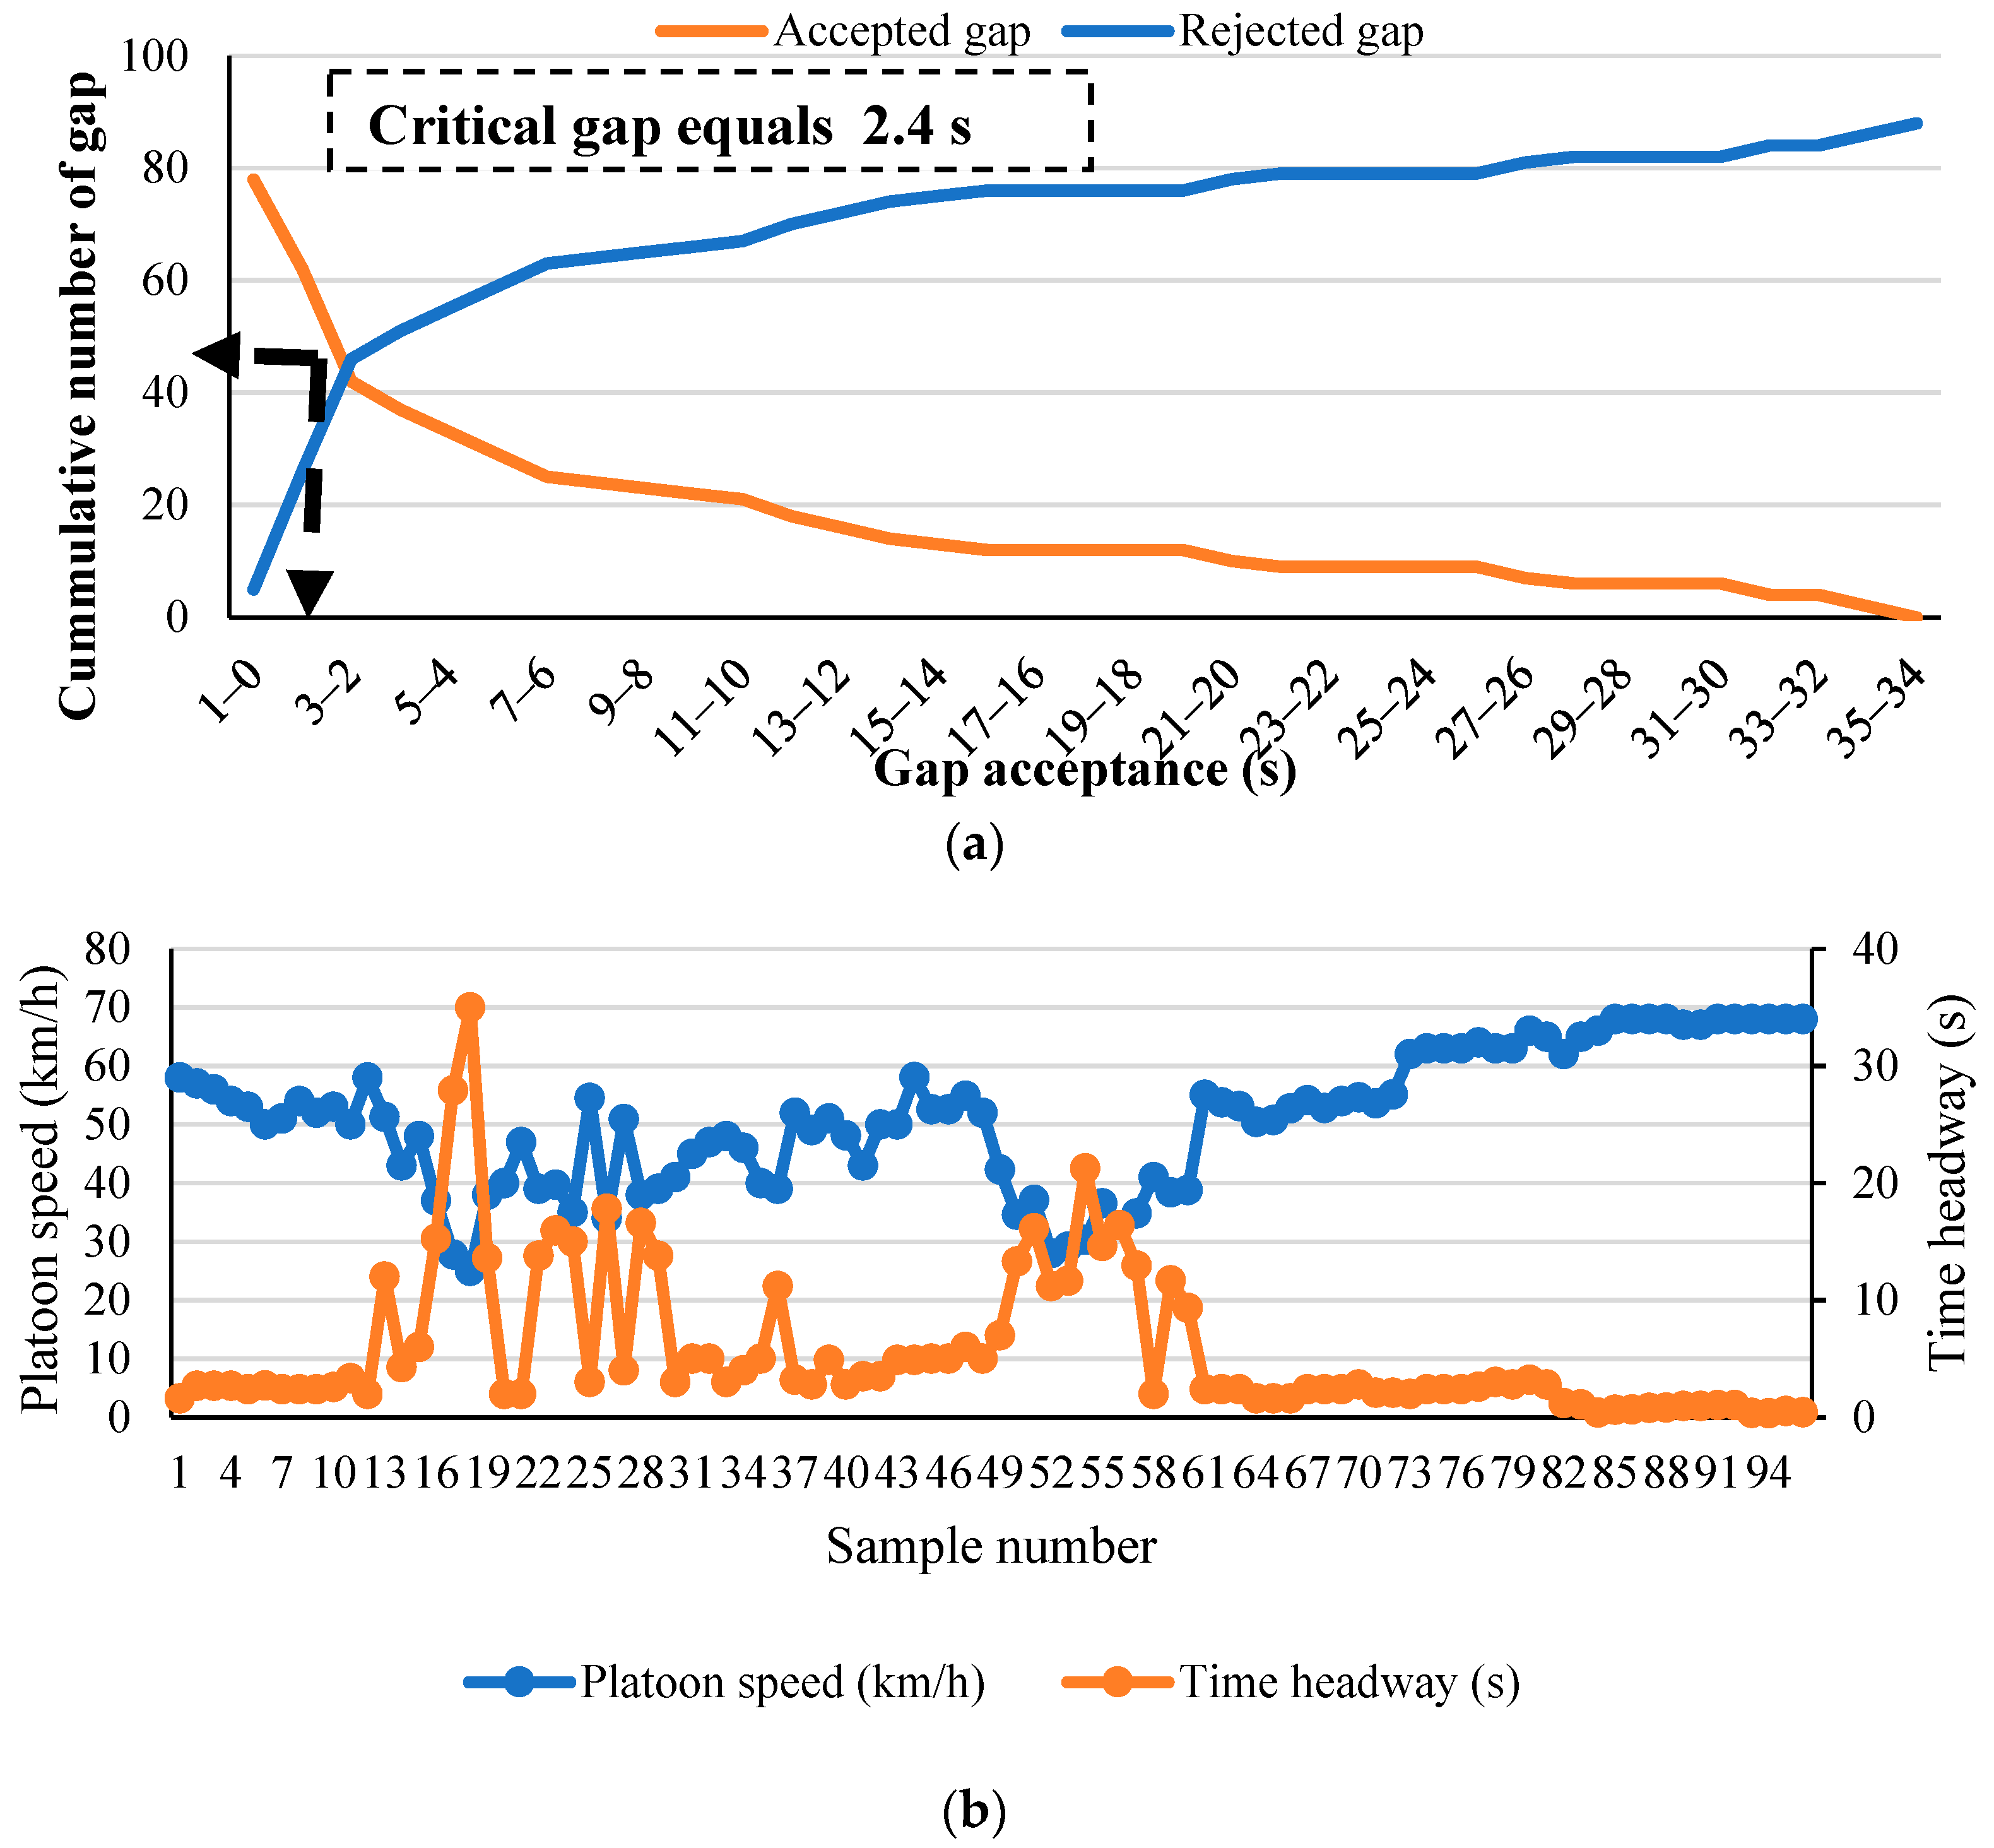
- According to the vehicle-gap-acceptance behavior, it was found that headways less than 2.4 s were identified as the thresholds for forming platooning in two-lane roads.
- The results of the Pearson correlation indicated that the traffic flow has the highest correlation with NFPC, ATS, platoon speed, FD, PI, PF, NO, and ATSPC, in that order. Moreover, the opposing flow strongly correlated with NFPC, PF, ATS, FD, and PI, in that order. Further, by examining the relationship between the %HV and performance measures, it can be concluded that the %HV had a high correlation with FD, ATS, PF, and PI, in that order. The relationships between platoon size and platoon speed, PI, ATS, and ATSpc are significant, in that order. Time headway was also significantly correlated with ATS, NFPC, ATSpc, and FD, in that order.
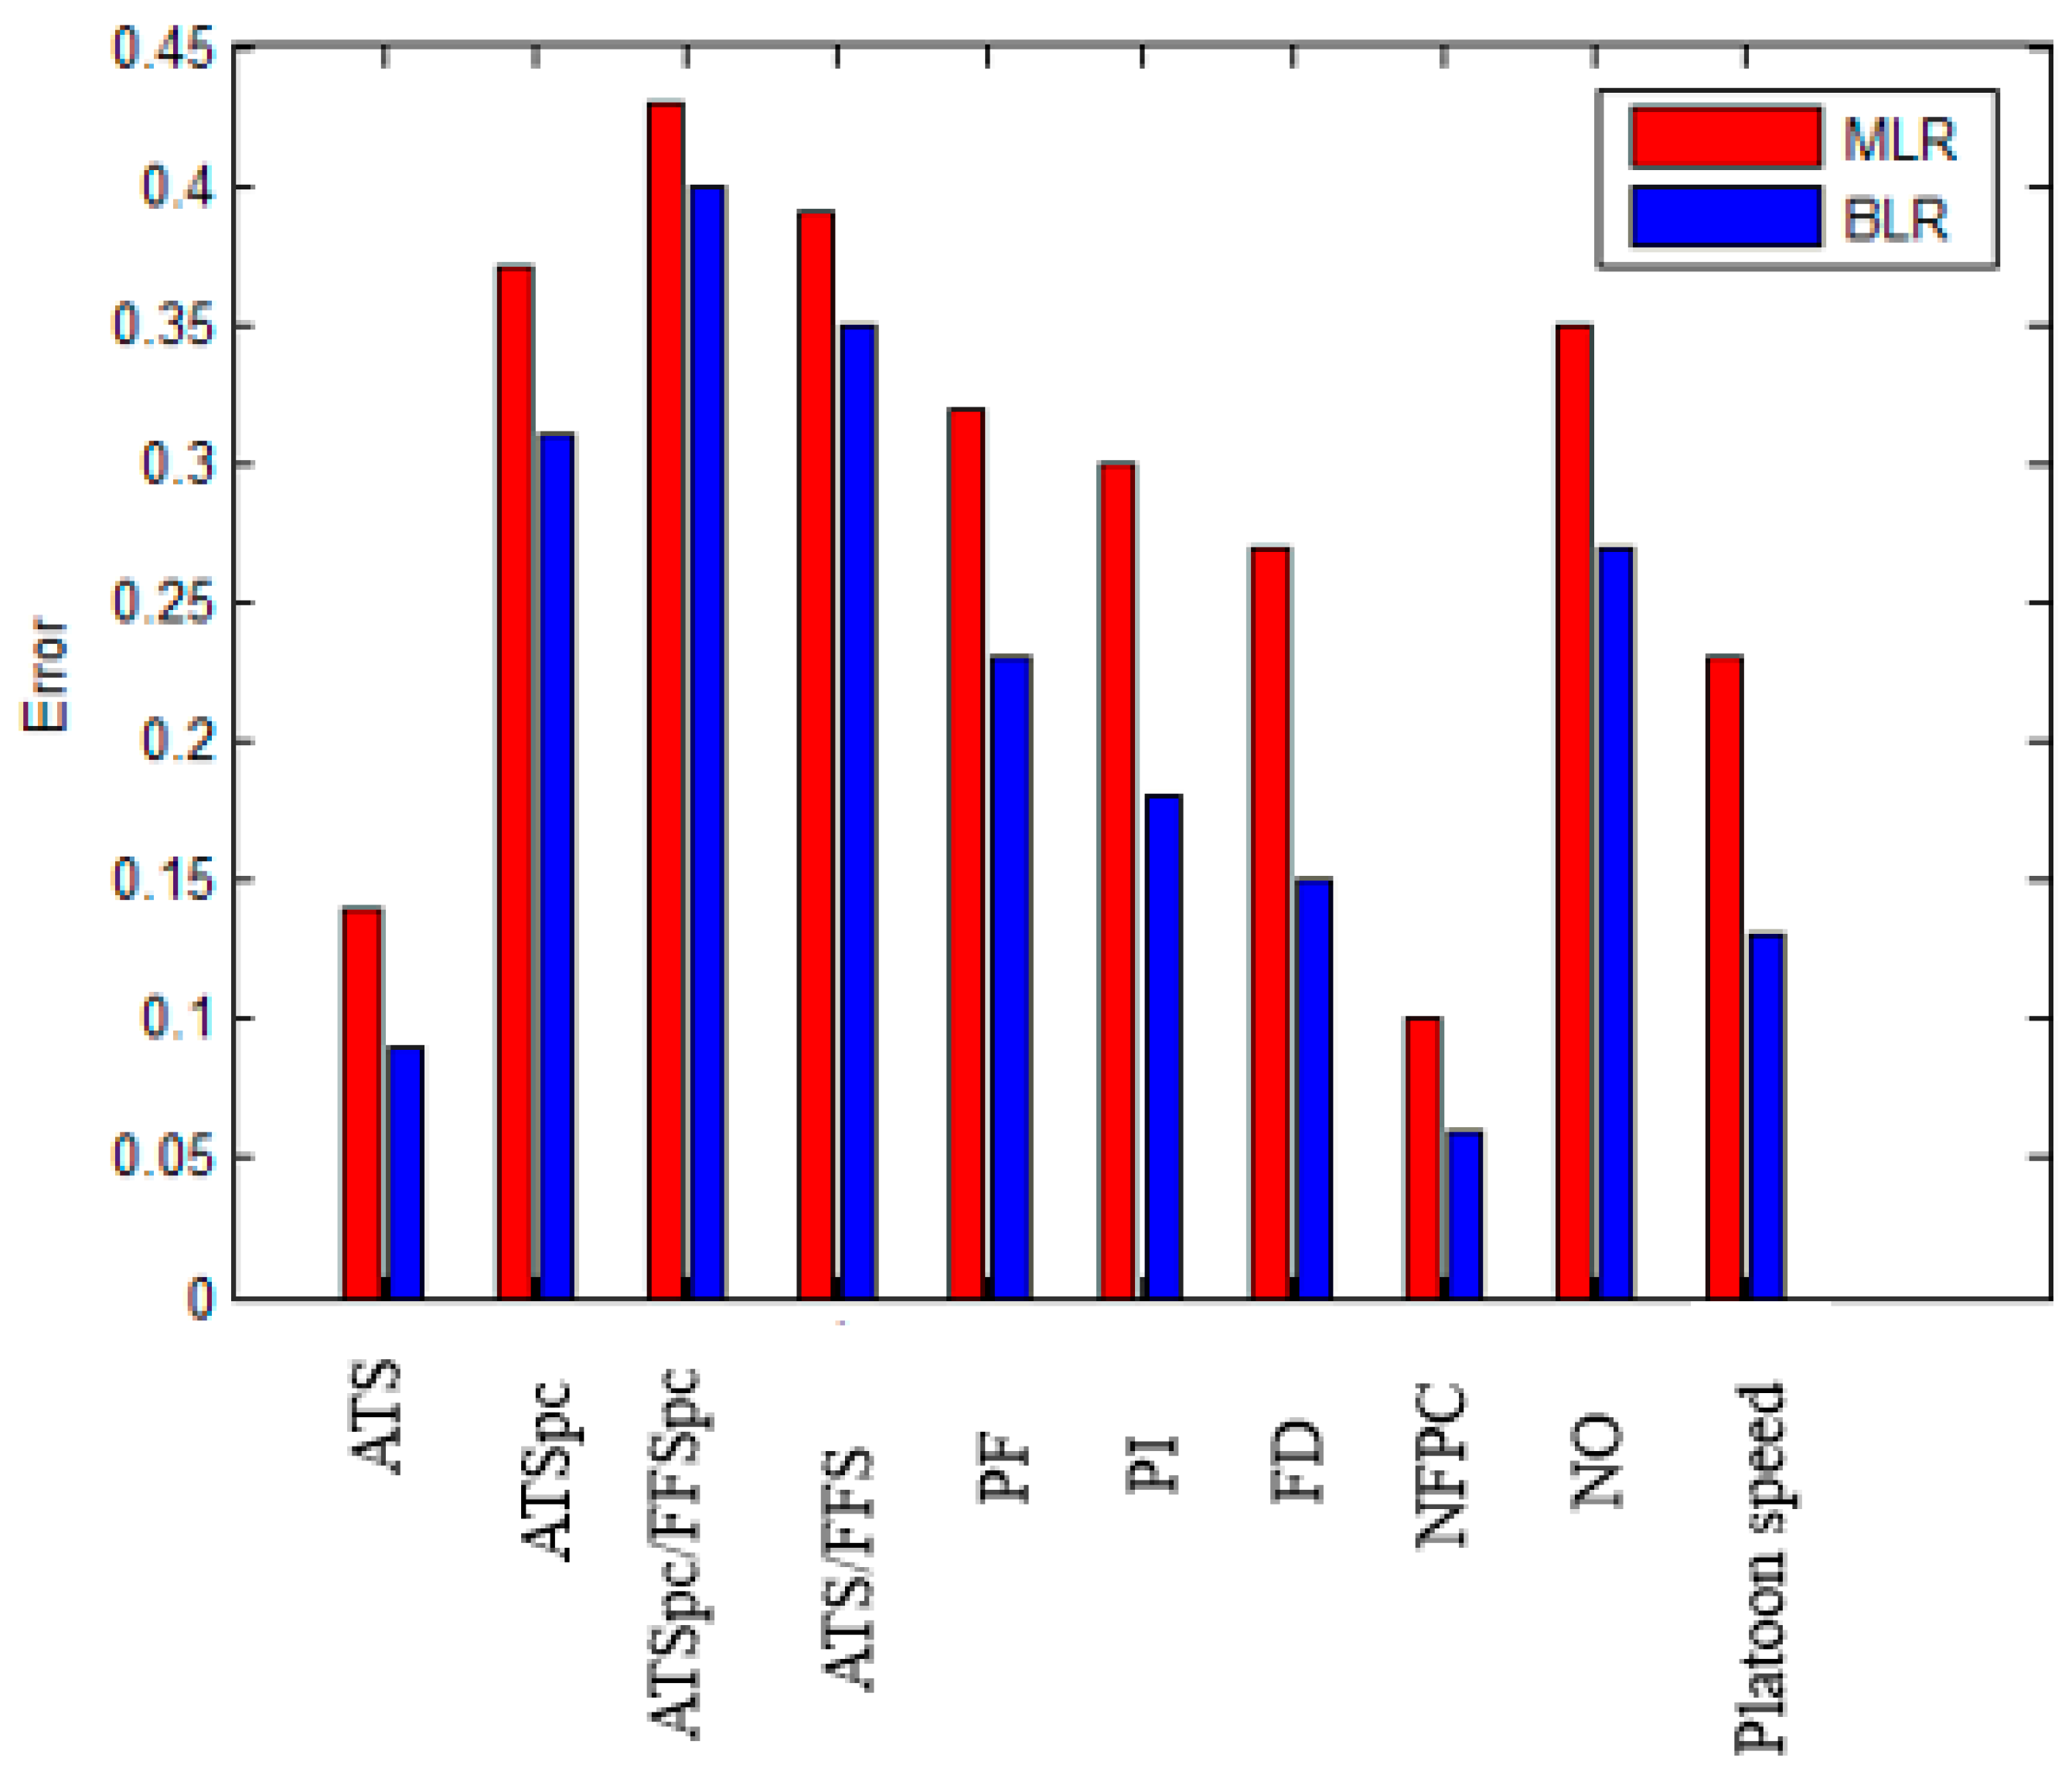
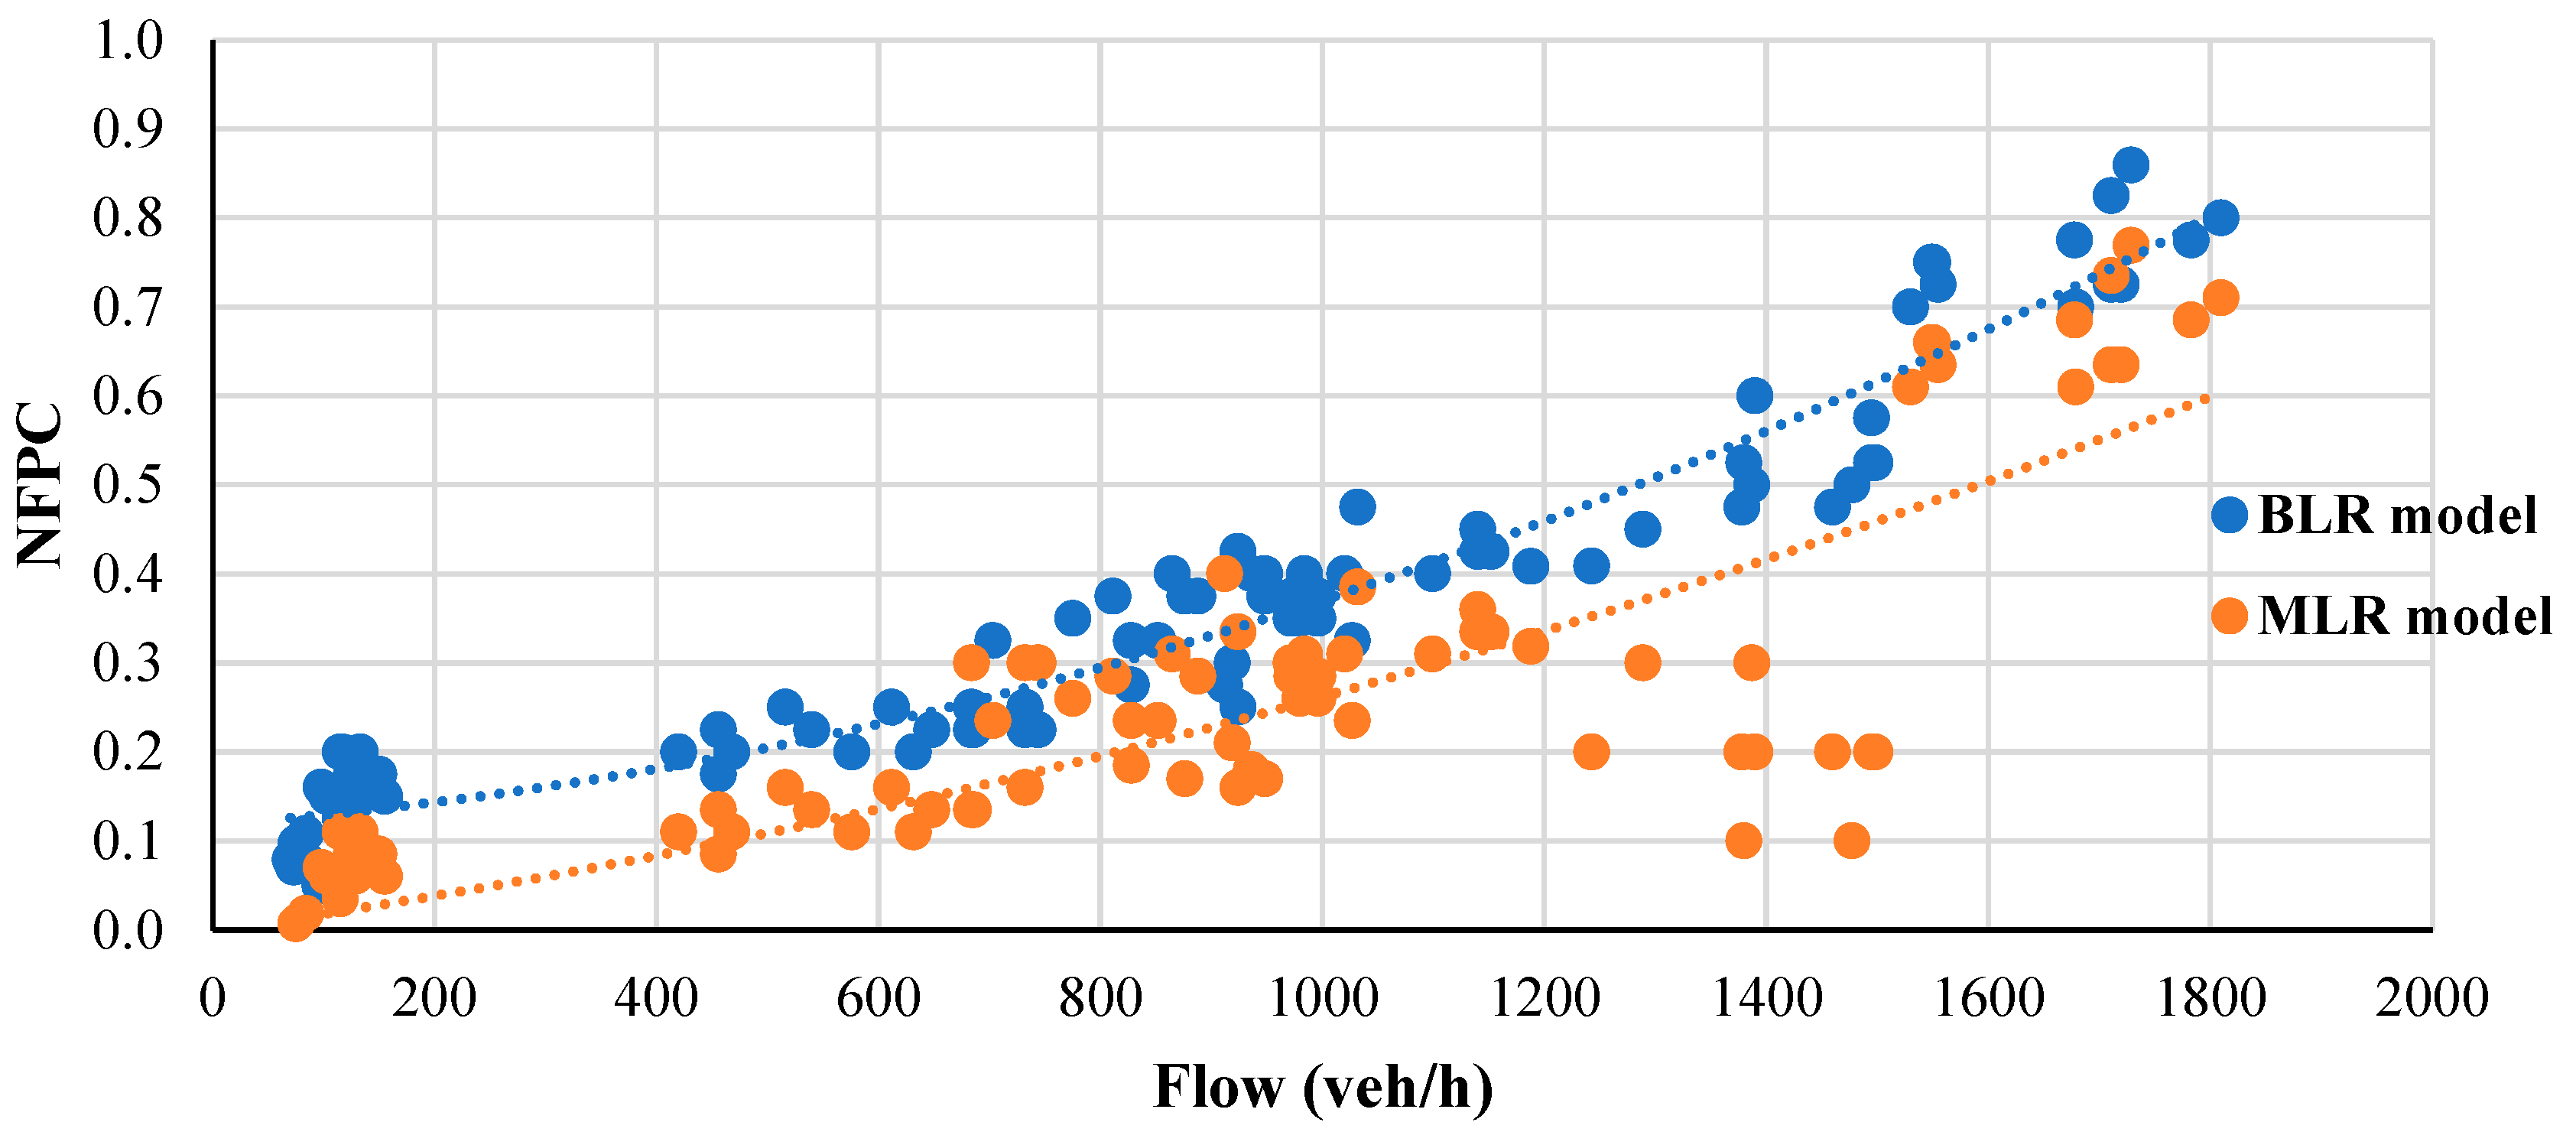
- The results of the developed MLR and BLR models indicated that BLR could predict NFPC as the most-influential performance measure to classify the LOS of two-lane roads on the basis of accuracy and error values.
- The comparison evaluation from the proposed surrogate measures with performance measures recommended in the HCM [22] indicated that the NFPC could be a surrogate performance measure for better predicting the LOS under unsaturated and saturated conditions compared to the two measures of the HCM [22], namely PTSF and ATS, under vehicular platooning.
Author Contributions
Funding
Institutional Review Board Statement
Informed Consent Statement
Data Availability Statement
Conflicts of Interest
Appendix A

References
- Iran Road Maintenance and Transportation Organization, RMTO [Online] Iran Road Maintenance and Transportation Organization. 2009. Available online: http://www.rmto.ir/newtto/Download/Roads.pdf (accessed on 15 January 2009).
- Al-Kaisy, A.; Durbin, C. Platooning on two-lane two-way highways: An empirical investigation. J. Adv. Transp. 2009, 43, 71–88. [Google Scholar] [CrossRef]
- Moreno, A.; Llorca, C.; Washburn, S.; Bessa, J.; Hale, D.; Garcia, A. Modification of the highway capacity manual’s two-lane highway analysis procedure for spanish conditions. J. Adv. Transp. 2016, 50, 1650–1665. [Google Scholar] [CrossRef]
- Al-Kaisy, A. Two-Lane Highways: Indispensable Rural Mobility. Encyclopedia 2022, 2, 625–631. [Google Scholar] [CrossRef]
- Boora, A.; Ghosh, I.; Chandra, S.; Rani, K. Examination of Platooning Variables on Two-Lane Highways Having Mixed Traf-fic Situation. In Advances in Construction Materials and Sustainable Environment: Select Proceedings of ICCME 2020; Springer: Singapore, 2022; pp. 95–110. [Google Scholar]
- Al-Kaisy, A.; Karjala, S. Indicators of performance on two-lane rural highways: Empirical investigation. Transp. Res. Rec. 2008, 2071, 87–97. [Google Scholar] [CrossRef]
- Mizanur, R.M.; Nakamura, F. A study on passing-overtaking characteristics and level of service of heterogeneous traffic flow. J. East. Asia Soc. Transp. Stud. 2005, 6, 1471–1483. [Google Scholar]
- Vijay, B.G.; Khatavkar, R. Comparative Study of Methods Used for a Capacity Estimation on Two Lane Undivided National Highways. J. Traffic Transp. Eng. 2019, 7, 29–37. [Google Scholar] [CrossRef]
- Swalih, P.M.; Sangeetha, M.; Harikrishna, M.; Anjaneyulu, M.V.L.R. Probabilistic Approach for the Evaluation of Two-Lane Two-Way Rural Highways. In Proceedings of the Sixth International Conference of Transportation Research Group of India; CTRG 2021; Springer Nature Singapore: Singapore, 2021; Volume 1, pp. 217–230. [Google Scholar]
- Zhu, L.; Tang, Y.; Yang, D. Cellular automata-based modeling and simulation of the mixed traffic flow of vehicle platoon and normal vehicles. Phys. A Stat. Mech. Its Appl. 2021, 584, 126368. [Google Scholar] [CrossRef]
- Torkashvand, M.B.; Aghayan, I.; Qin, X.; Hadadi, F. An extended dynamic probabilistic risk approach based on a surrogate safety measure for rear-end collisions on two-lane roads. Phys. A Stat. Mech. Its Appl. 2022, 603, 127845. [Google Scholar] [CrossRef]
- Martín, S.; Romana, M.G.; Santos, M. Fuzzy model of vehicle delay to determine the level of service of two-lane roads. Expert Syst. Appl. 2016, 54, 48–60. [Google Scholar] [CrossRef]
- Cheng, G.; Zhang, S.; Wu, L.; Qin, L. Spacing and geometric design indexes of auxiliary lanes on two-lane highway in China. Adv. Mech. Eng. 2017, 9, 1687814017723294. [Google Scholar] [CrossRef]
- Peng, G.; Yang, S.; Zhao, H. The difference of drivers’ anticipation behaviors in a new macro model of traffic flow and numerical simulation. Phys. Lett. A 2018, 382, 2595–2597. [Google Scholar] [CrossRef]
- Jeong, H.; Park, S.; Park, S.; Cho, H.; Yun, I. Study on the Selection of Sections Applicable to Truck Platooning in the Expressway Network. Sustainability 2020, 12, 8058. [Google Scholar] [CrossRef]
- Fiems, D.; Prabhu, B.J. Macroscopic modelling and analysis of flows during rush-hour congestion. Perform. Eval. 2021, 149, 102218. [Google Scholar] [CrossRef]
- Naito, Y.; Nagatani, T. Safety–collision transition induced by lane changing in traffic flow. Phys. Lett. A 2011, 375, 1319–1322. [Google Scholar] [CrossRef]
- Dixon, M.; Dyre, B.; Grover, A.; Meyer, M.; Rember, J.; Abdel-Rahim, A. Modeling Passing Behavior on Two-Lane Rural Highways: Evaluating Crash Risk under Different Geometric Configurations. University of Idaho, Moscow, ID, USA, 2013. Available online: https://digital.lib.washington.edu/researchworks/handle/1773/43573 (accessed on 20 December 2022).
- Shirmohammadi, H.; Hadadi, F.; Saeedian, M. Clustering analysis of drivers based on behavioral characteristics regarding road safety. Int. J. Civ. Eng. 2019, 17, 1327–1340. [Google Scholar] [CrossRef]
- Rezaei, D.; Aghayan, I.; Hadadi, F. Studying perturbations and wave propagations by lane closures on traffic characteristics based on a dynamic approach. Phys. A Stat. Mech. Its Appl. 2021, 566, 125654. [Google Scholar] [CrossRef]
- Yang, Y.; He, K.; Wang, Y.P.; Yuan, Z.Z.; Yin, Y.H.; Guo, M.Z. Identification of dynamic traffic crash risk for cross-area free-ways based on statistical and machine learning methods. Phys. A Stat. Mech. Its Appl. 2022, 595, 127083. [Google Scholar] [CrossRef]
- HCM. Highway Capacity Manual; Transportation Research Board, National Research Council: Washington, DC, USA, 2010. [Google Scholar]
- Luttinen, R.T. Percent time-spent-following as performance measure for two-lane highways. Transp. Res. Rec. 2001, 1776, 52–59. [Google Scholar] [CrossRef]
- Dixon, M.P.; Sarepali, S.S.K.; Young, K.A. Field evaluation of highway capacity manual 2000 analysis procedures for two-lane highways. Transp. Res. Rec. 2002, 1802, 125–132. [Google Scholar] [CrossRef]
- Van As, C. The Development of an Analysis Method for the Determination of Level of Service of Two-Lane Undivided Highways in South Africa. Project Summary. South African National Roads Agency Limited. 2003. Available online: https://scholar.google.com/scholar?hl=en&as_sdt=0,5&q=the+development+of+an+analysis+method+for+the+determination+of+level+of+service+of+two-lane+undivided+highways+in+south+africa.+proj.+summary.+south+africa.+national.+roads+agency+limited (accessed on 20 December 2022).
- Brilon, W.; Weiser, F. Two-lane rural highways: The German experience. Transp. Res. Rec. 2006, 1988, 38–47. [Google Scholar] [CrossRef]
- Catbagan, J.L.; Nakamura, H. Evaluation of performance measures for two-lane expressways in Japan. Transp. Res. Rec. 2006, 1988, 111–118. [Google Scholar] [CrossRef]
- Catbagan, J.L.; Nakamura, H. Two-lane highway desired speed distributions under various conditions. In Proceedings of the TRB 87th Annual Meeting Compendium of Papers, CDROM, Washington, DC, USA, 13–17 January 2008; Transportation Research Board of the National Academies: Washington, DC, USA, 2008. [Google Scholar]
- Kim, J.; Elefteriadou, L. Estimation of capacity of two-lane two-way highways using simulation model. J. Transp. Eng. 2010, 136, 61–66. [Google Scholar] [CrossRef]
- Penmetsa, P.; Ghosh, I.; Chandra, S. Evaluation of performance measures for two-lane intercity highways under mixed traffic conditions. J. Transp. Eng. 2015, 141, 04015021. [Google Scholar] [CrossRef]
- Jrew, B.; Msallam, M.; Naser, E.M. Analysis, Evaluation and Improvement the Level of Service of Two-Lane Highways in Jordan (Case Study/Jordan). 2016. Available online: https://hrcak.srce.hr/ojs/index.php/acae/article/view/20033 (accessed on 20 December 2022).
- Roy, N.; Roy, R.; Talukdar, H.; Saha, P. Effect of mixed traffic on capacity of two-lane roads: Case study on Indian highways. Procedia Eng. 2017, 187, 53–58. [Google Scholar] [CrossRef]
- Boora, A.; Ghosh, I.; Chandra, S. Assessment of level of service measures for two-lane intercity highways under heterogeneous traffic conditions. Can. J. Civ. Eng. 2017, 44, 69–79. [Google Scholar] [CrossRef]
- Bessa, J.E., Jr.; Setti, J.R. Evaluating Measures of Effectiveness for Quality of Service Estimation on Two-Lane Rural Highways. J. Transp. Eng. Part A Syst. 2018, 144, 04018056. [Google Scholar] [CrossRef]
- Gaur, A.; Mirchandani, P. Method for real-time recognition of vehicle platoons. Transp. Res. Rec. 2001, 1748, 8–17. [Google Scholar] [CrossRef]
- Arasan, V.T.; Kashani, S.H. Modeling platoon dispersal pattern of heterogeneous road traffic. Transp. Res. Rec. 2003, 1852, 175–182. [Google Scholar] [CrossRef]
- Rahman, A.; Lownes, N.E. Analysis of rainfall impacts on platooned vehicle spacing and speed. Transp. Res. Part F Traffic Psychol. Behav. 2012, 15, 395–403. [Google Scholar] [CrossRef]
- Yu, S.; Shi, Z. An extended car-following model considering vehicular gap fluctuation. Measurement 2015, 70, 137–147. [Google Scholar] [CrossRef]
- Saha, P.; Sarkar, A.K.; Pal, M. Evaluation of speed–flow characteristics on two-lane highways with mixed traffic. Transport 2017, 32, 331–339. [Google Scholar] [CrossRef]
- Saha, P.; Roy, R.; Sarkar, A.K.; Pal, M. Preferred time headway of drivers on two-lane highways with heterogeneous traffic. Transp. Lett. 2019, 11, 200–207. [Google Scholar] [CrossRef]
- Zhang, B.; Wilschut, E.S.; Willemsen, D.M.; Martens, M.H. Transitions to manual control from highly automated driving in non-critical truck platooning scenarios. Transp. Res. Part F Traffic Psychol. Behav. 2019, 64, 84–97. [Google Scholar] [CrossRef]
- Riccardo, R.; Massimiliano, G. An empirical analysis of vehicle time headways on rural two-lane two-way roads. Procedia-Soc. Behav. Sci. 2012, 54, 865–874. [Google Scholar] [CrossRef]
- Al-Kaisy, A.; Jafari, A.; Washburn, S.; Lutinnen, T.; Dowling, R. Performance measures on two-lane highways: Survey of practice. Res. Transp. Econ. 2018, 71, 61–67. [Google Scholar] [CrossRef]
- Yang, D.; Kuijpers, A.; Dane, G.; van der Sande, T. Impacts of large-scale truck platooning on Dutch highways. Transp. Res. Procedia 2019, 37, 425–432. [Google Scholar] [CrossRef]
- Nadimi, N.; Nasser Alavi, S.S.; Bagheri, S.R. Headway Analysis for Different Combination of Vehicles in a Congested Traffic Flow in freeways. Q. J. Transp. Eng. 2012, 3, 379–386. [Google Scholar]
- Tammanaei, M.; Abtahi, S.M.; Haghshenas, H. Modeling of time headway distributions in day and night conditions under heavy traffic flow. J. Transp. Res. 2012, 9, 223–234. [Google Scholar]
- Daqiqi., A.; Aflaki, S. Study of Time Interval in Traffic Flow Using Data Analysis and Modeling of Distance Distribution. In Proceedings of the 13th International Conference on Transportation and Traffic Engineering, Tehran. 2015. Available online: https://civilica.com/doc/259721 (accessed on 20 December 2022).
- Polus, A.; Cohen, M. Theoretical and empirical relationships for the quality of flow and for a new level of service on two-lane highways. J. Transp. Eng. 2009, 135, 380–385. [Google Scholar] [CrossRef]
- Hashim, I.H.; Abdel-Wahed, T.A. Evaluation of performance measures for rural two-lane roads in Egypt. Alex. Eng. J. 2011, 50, 245–255. [Google Scholar] [CrossRef]
- Rossi, R.; Gastaldi, M.; Pascucci, F. Flow rate effects on vehicle speed at two way-two lane rural roads. Transp. Res. Procedia 2014, 3, 932–941. [Google Scholar] [CrossRef]
- Al-Kaisy, A.; Jafari, A.; Washburn, S. Measuring performance on two-lane highways: Empirical investigation. Transp. Res. Rec. 2017, 2615, 62–72. [Google Scholar] [CrossRef]
- Moreno, A.T. Estimating traffic performance on Spanish two-lane highways. Case study validation. Case Stud. Transp. Policy 2020, 8, 119–126. [Google Scholar] [CrossRef]
- Al-Zerjawi, A.K.; Al-Jameel, H.A.; Zagroot, S.A. Traffic Characteristics of Two-WayTwo-Lane (TWTL) Highway in Iraq: Al-Mishkhab Road As A Case Study. In IOP Conference Series: Materials Science and Engineering; IOP Publishing: Bristol, UK, 2020; Volume 888, p. 012030. [Google Scholar]
- Ahmed, F.; Easa, S. Development of Direct Models for Percent Time-Spent Following on Two-Lane Highways. Front. Built Environ. 2020, 6, 1. [Google Scholar] [CrossRef]
- Kim, J. Truck platoon control considering heterogeneous vehicles. Appl. Sci. 2020, 10, 5067. [Google Scholar] [CrossRef]
- Shiomi, Y.; Yoshii, T.; Kitamura, R. Platoon-based traffic flow model for estimating breakdown probability at single-lane expressway bottlenecks. Transp. Res. Part B Methodol. 2011, 45, 1314–1330. [Google Scholar] [CrossRef]
- Asaithambi, G.; Kanagaraj, V.; Srinivasan, K.K.; Sivanandan, R. Study of traffic flow characteristics using different vehicle-following models under mixed traffic conditions. Transp. Lett. 2018, 10, 92–103. [Google Scholar] [CrossRef]
- Bhoopalam, A.K.; Agatz, N.; Zuidwijk, R. Planning of truck platoons: A literature review and directions for future research. Transp. Res. Part B Methodol. 2018, 107, 212–228. [Google Scholar] [CrossRef]
- Jin, L.; Cicic, M.; Johansson, K.H.; Amin, S. Analysis and design of vehicle platooning operations on mixed-traffic highways. IEEE Trans. Autom. Control 2020, 66, 4715–4730. [Google Scholar] [CrossRef]
- Vijay, B.G.; Khatawkar, R. capacity estimation of two lane highways based on linear regression model using SPSS. J. Eng. Sci. 2020, 11, 78–82. [Google Scholar]
- Jain, M.; Gore, N.; Arkatkar, S.; Easa, S. Developing Level-of-Service Criteria for Two-Lane Rural Roads with Grades under Mixed Traffic Conditions. J. Transp. Eng. Part A Syst. 2021, 147, 04021013. [Google Scholar] [CrossRef]
- Jin, L.; Čičić, M.; Amin, S.; Johansson, K.H. Modeling the impact of vehicle platooning on highway congestion: A fluid queuing approach. In Proceedings of the 21st International Conference on Hybrid Systems: Computation and Control (part of CPS Week), Porto, Portugal, 11–13 April 2018; pp. 237–246. [Google Scholar]
- Mena-Oreja, J.; Gozalvez, J.; Sepulcre, M. Effect of the configuration of platooning maneuvers on the traffic flow under mixed traffic scenarios. In Proceedings of the 2018 IEEE Vehicular Networking Conference (VNC), Taipei, Taiwan, 5–7 December 2018; IEEE: Piscataway Township, NJ, USA; pp. 1–4. [Google Scholar]
- Kita, E.; Yamada, M. Vehicle velocity control in case of vehicle platoon merging. In Proceedings of the 2019 4th International Conference on Intelligent Transportation Engineering (ICITE), 6–8 September 2019; IEEE: Piscataway Township, NJ, USA, 2019; pp. 340–344. [Google Scholar]
- Mauro, R.; Pompigna, A. A Statistically Based Model for the Characterization of Vehicle Interactions and Vehicle Platoons Formation on Two-Lane Roads. Sustainability 2022, 14, 4714. [Google Scholar] [CrossRef]
- Luttinen, R.T. Capacity and level-of-service estimation in Finland. In Proceedings of the 5th International Symposium on Highway Capacity and Quality of Service, Yokohama, Japan, 25–29 July 2006. [Google Scholar]
- Al-Kaisy, A.; Freedman, Z. Estimating performance on two-lane highways: Case study validation of a new methodology. Transp. Res. Rec. 2010, 2173, 72–79. [Google Scholar] [CrossRef]
- Morrall, J.F.; Werner, A. Measuring level of service of two-lane highways by overtaking. Transp. Res. Rec. 1990, 1287, 62–69. [Google Scholar]
- Llorca, C.; Farah, H. Passing behavior on two-lane roads in real and simulated environments. Transp. Res. Rec. 2016, 2556, 29–38. [Google Scholar] [CrossRef]
- Surasak, T.; Okura, I.; Nakamura, F. Measuring of level of service on multi-lane expressway by using platoon mechanism. In Proceedings of the Fourth International Summer Symposium, Kyoto, Japan, 3 August 2002; pp. 319–322. [Google Scholar]
- Yongjun, W.; Gang, Y.; Yanying, H. Research on Correlation analysis of industry electricity quantity. In Proceedings of the International Conference on Information Technology and Management Innovation (ICITMI 2015), Shenzhen, China, 19–20 September 2015; Atlantis Press: Shenzhen, China; pp. 906–912. [Google Scholar]
- Aarthi, S.; Sarvathanayan, M.; Kumar, B.K.; Rakesh, G.S. Post Graduate College Admission Recommender Using Data Analytics. Int. J. Innov. Technol. Explor. Eng. 2019, 8, 2278–3075. [Google Scholar]
- Permai, S.D.; Tanty, H. Linear regression model using bayesian approach for energy performance of residential building. Procedia Comput. Sci. 2018, 135, 671–677. [Google Scholar] [CrossRef]
- Draper, N.R.D.; Smith, H. Applied Regression Analysis, 3rd ed.; John Willey & Sons, Ltd.: Hoboken, NJ, USA, 1998; Volume 326, pp. 327–368. [Google Scholar]
- Liang, F.; Truong, Y.K.; Wong, W.H. Automatic Bayesian model averaging for linear regression and applications in Bayesian curve fitting. Stat. Sin. 2001, 11, 1005–1029. [Google Scholar]
- Zhan, Z.; Fu, Y.; Yang, R.J.; Xi, Z.; Shi, L. A Bayesian inference based model interpolation and extrapolation. SAE Int. J. Mater. Manuf. 2012, 5, 357–364. [Google Scholar] [CrossRef]
- Al-Sabri, I.H.A. Comparison of the Estimation Efficiency of Regression Parameters Using the Bayesian Method and the Quantile Function. J. Stat. Appl. Probab. Lett. Int. J. 2019, 6, 11–20. [Google Scholar] [CrossRef]
- Adepoju, A.A.; Ogundunmade, T.P. Dynamic linear regression by bayesian and bootstrapping techniques. Estud. De Econ. Apl. 2019, 37, 166–181. [Google Scholar] [CrossRef]
- Mil, S.; Piantanakulchai, M. Modified Bayesian data fusion model for travel time estimation considering spurious data and traffic conditions. Appl. Soft Comput. 2018, 72, 65–78. [Google Scholar] [CrossRef]
- Labban, J.A. Estimating multiple linear regression parameters using term omission method. Period. Eng. Nat. Sci. (PEN) 2020, 8, 2290–2299. [Google Scholar]
- AlKheder, S.; Alkhamees, W.; Almutairi, R.; Alkhedher, M. Bayesian combined neural network for traffic volume short-term forecasting at adjacent intersections. Neural Comput. Appl. 2021, 33, 1785–1836. [Google Scholar] [CrossRef]
- Zhu, Y.; Wang, W.; Yu, G.; Wang, J.; Tang, L. A Bayesian robust CP decomposition approach for missing traffic data imputation. Multimed. Tools Appl. 2022, 81, 33171–33184. [Google Scholar] [CrossRef]
- Feng, Y.; Chen, Y.; He, X. Bayesian quantile regression with approximate likelihood. Bernoulli 2015, 21, 832–850. [Google Scholar] [CrossRef]
- Najm, A.A.; Abood, A.H.; Al-Sabbah, S.A. Estimation Parameters Of The Multiple Regression Using Bayesian Approach Based On The Normal Conjugate Function. In Journal of Physics: Conference Series; IOP Publishing: Bristol, UK, 2021; Volume 1897, p. 012007. [Google Scholar]
- Caliendo, C.; Guida, M.; Postiglione, F.; Russo, I. A Bayesian bivariate hierarchical model with correlated parameters for the analysis of road crashes in Italian tunnels. Stat. Methods Appl. 2022, 31, 109–131. [Google Scholar] [CrossRef]
- George, G.; Judge, W.E.; Griffiths, R.; Carter, H. The Theory and Practice of Econometrics, 2nd ed.; John Wiley & Sons: Hoboken, NY, USA, 1984. [Google Scholar]
- Zhang, H.; Liu, Y.; Zhang, Q.; Cui, Y.; Xu, S. A Bayesian network model for the reliability control of fresh food e-commerce logistics systems. Soft Comput. 2020, 24, 6499–6519. [Google Scholar] [CrossRef]
- Geweke, J. Evaluating the accuracy of sampling-based approaches to calculating posterior moments. In Bayesian Statistics; Bernardo, J., Berger, J., Dawiv, A., Smith, A., Eds.; Federal Reserve Bank of Minneapolis: Minneapolis, MN, USA, 1992; Volume 4, pp. 169–193. [Google Scholar]
- Ghosh, I.; Chandra, S.; Boora, A. Operational performance measures for two-lane roads: An assessment of methodological alternatives. Procedia-Soc. Behav. Sci. 2013, 104, 440–448. [Google Scholar] [CrossRef]


| Author (Year) | Subject | Platooning Variable and Performance Measure | Conclusion |
|---|---|---|---|
| Gaur and Mirchandani [35] | A method for real-time recognition of vehicle platoons | Traffic flow, FD, number of platoons, and time headway | Vehicular platooning as the most-influential phenomenon on performance measures |
| Arasan and Kashani [36] | Investigating the most effective vehicular platooning variables on performance measures | Platoon size, ATS, and PF | Platoon size as the most effective vehicular platooning variable on performance measures |
| Al-Kaisy and Karjala [6] | Evaluating indicators of performance on two-lane rural highways | Platoon size, heavy vehicle, ATS, FFS, FD, and FP | Identification of performance measures under the effect of vehicular platooning |
| Kim and Elefteriadou [29] | Evaluating the effect of %HV on the capacity of two-lane roads | HV, ATS, flow, capacity | Reduction in capacity under the effect of heavy vehicle |
| Hashim and Abdel-Wahed [49] | Investigating performance measures for rural two-lane roads in Egypt | Flow, ATS, FD, and PF | Follower density as the surrogate performance measure under vehicular platooning |
| Nadimi et al. [45] | Time headway analysis using vehicle types affecting on performance measures | Time headways, heavy vehicles, ATS, and FFS | Time headways and heavy vehicles with a negative effect on performance measures |
| Rossi et al. [50] | Flow-rate effects and the relationship between vehicular platooning and traffic characteristics in two-lane roads | Flow, time headway, and ATS | Time headway with a strong correlation with ATS instead of flow |
| Penmetsa et al. [30] | Evaluation of LOS under vehicular platooning | Flow, NF, NFPC, and PTSF | NFPC as the best platooning indicator compared with PTSF in the HCM (2010) |
| Jrew et al. [31] | Analysis and improvement of the LOS in two-lane roads under vehicular platooning | ATS, FFS, and PTSF | An increase in ATS and FFS and a reduction in PTSF |
| Boora et al. [33] | A study of performance measures in two-lane roads | ATS, FFS, vehicle type, and PTSF | Improvement of traffic performance in two-lane roads |
| Bessa and Setti [34] | Identifying the most effective performance measures in two-lane roads | PTSF and ATS | PTSF as the main performance measure of two-lane roads affecting the LOS |
| Al-Kaisy et al. [43] | An empirical analysis of vehicle time headways on platooning formation | Time headway, platoon size, platoon speed, ATS, and FD | Time headway between 3 and 7 s for forming vehicular platooning |
| Zhang et al. [41] | Examination of vehicle-gap acceptance on the formation of vehicular platooning | Time headway, platoon size, flow, and gap acceptance | Platoon size by vehicle-gap acceptance and the critical headway |
| Yang et al. [44] | Evaluating the impacts of heavy vehicles platooning on Dutch highways | Heavy vehicles, platoon size, and flow | Heavy vehicles and platoon size have a negative relationship with traffic flow |
| Moreno [52] | Identifying platooning variables on performance measure in two-lane roads in Spain | Flow, time headway, opposing flow, %HV, ATS, and FD | %HV as the main platooning variable affecting performance measures |
| Al-Zerjawi et al. [53] | Traffic characteristics of two-lane roads in Iraq | Flow, ATS, and NO | A strong relationship between platooning variables and performance measures |
| Ahmed and Easa [54] | Development of performance measurement models under vehicular platooning in two-lane highways | Flow, ATS, and PTSF | PTSF as the main performance measurement as compared with the HCM (2010), with low error in prediction |
| Kim [29] | Controlling heavy vehicle platoons according to platooning characteristics | Platoon size, %HV, NO, ATS, FD, and PTSF | %HV as the main influencing platooning variable on performance measures in comparison with others |
| Jain et al. [61] | Evaluating the most effective vehicular platooning variables on performance measures | ATS, PTSF, FD, HV (%), flow, platoon size, and platoon speed | Performance measures contributing to the improvement of traffic performance |
| Variables | Mean | Std. Deviation | Variance | Minimum | Maximum | CV | |
|---|---|---|---|---|---|---|---|
| Platooning Variables | Flow (veh/h) | 825.96 | 534.74 | 273,889.0 | 70.00 | 1810.00 | 0.65 |
| Opposing Flow (veh/h) | 579.17 | 374.27 | 140,079.0 | 50.00 | 1268.00 | 0.64 | |
| Time Headway (s) | 5.34 | 2.60 | 73.60 | 0.40 | 35.00 | 0.49 | |
| %HV (%) | 11.00 | 5.88 | 34.54 | 3.00 | 25.00 | 0.53 | |
| Platoon Size (veh/h) | 85.76 | 56.34 | 7.96 | 0.00 | 225.00 | 0.66 | |
| Performance Measures | ATS (km/h) | 66.87 | 10.75 | 110.50 | 36.00 | 81.00 | 0.16 |
| ATSpc (km/h) | 84.90 | 12.97 | 168.29 | 46.08 | 99.63 | 0.15 | |
| ATSpc/FFSpc | 0.97 | 0.14 | 0.020 | 0.82 | 1.40 | 0.14 | |
| ATS/FFS | 0.76 | 0.11 | 0.012 | 0.64 | 1.09 | 0.14 | |
| PF (%) | 13.27 | 6.93 | 48.02 | 5.00 | 33.00 | 0.52 | |
| FD (veh/km) | 7.89 | 5.19 | 27.12 | 1.17 | 20.75 | 0.66 | |
| PI (%) | 0.20 | 0.08 | 0.006 | 0.02 | 0.31 | 0.40 | |
| NFPC | 0.35 | 0.20 | 0.040 | 0.05 | 0.86 | 0.57 | |
| NO (veh/h) | 33.38 | 21.45 | 445.20 | 0.00 | 96.00 | 0.64 | |
| Platoon Speed (km/h) | 51.00 | 11.41 | 130.20 | 25.00 | 68.00 | 0.22 | |
| Performance Measures | Platooning Variables | ||||
|---|---|---|---|---|---|
| Flow (veh/h) | Opposing Flow (veh/h) | %HV | Platoon Size (veh/h) | Time Headway (s) | |
| ATS (km/h) | −0.80 * | −0.66 * | −0.70 * | −0.63 * | −0.72 * |
| ATS/FFS | −0.09 | −0.09 | −0.10 | −0.15 | −0.32 |
| ATSPC (km/h) | −0.48 * | −0.27 | −0.19 | −0.56 * | −0.60 * |
| ATSPC/FFSPC | −0.07 | −0.05 | −0.08 | −0.09 | −0.08 |
| FD (veh/km) | 0.71 * | 0.62 * | 0.75 * | 0.45 | 0.58 * |
| PI (%) | 0.62 * | 0.58 * | 0.56 * | 0.70 * | 0.43 |
| PF (%) | 0.56 * | 0.70 * | 0.63 * | 0.40 | 0.40 |
| NO (veh/h) | 0.52 * | 0.36 | 0.20 | 0.37 | −0.39 |
| NFPC | 0.84 * | 0.75 * | 0.38 | 0.39 | 0.67 * |
| Platoon Speed (km/h) | −0.76 * | −0.41 | −0.50 | −0.75 * | −0.33 |
| Variable | Statistical Analysis | Performance Measures | |||||||||
|---|---|---|---|---|---|---|---|---|---|---|---|
| ATS (km/h) | ATSpc (km/h) | ATSpc/FFSpc | ATS/FFS | PF (%) | FD (veh/km) | PI (%) | NFPC | Platoon Speed (km/h) | NO (veh/h) | ||
| Constant | Coefficient | 81.84 | 109.08 | 0.83 | 0.65 | −1.27 | 0.25 | 0.21 | −0.005 | 60.26 | −3.21 |
| t (p-value) | 33.93 (0.00) | 53.74 (0.00) | 23.47 (0.001) | 23.64 (0.00) | −0.98 (0.00) | 0.27 (0.04) | 12.85 (0.00) | −0.20 (0.001) | 27.33 (0.00) | −1.35 (0.02) | |
| Flow (veh/h) | Coefficient | −15.72 | −2.54 | −70.97 | −69.27 | 1.22 | 4.34 | 1.78 | 0.53 | −49.54 | 1.19 |
| t (p-value) | −4.28 (0.002) | −0.46 (0.001) | −10.30 (0.092) | −7.78 (0.081) | 0.59 (0.04) | 2.78 (0.00) | 0.85 (0.003) | 7.76 (0.004) | −3.34 (0.01) | 0.50 (0.01) | |
| Opposing Flow (veh/) | Coefficient | −0.03 | −0.023 | −0.001 | −0.003 | 0.016 | 0.008 | 0.001 | 0.001 | −0.042 | 0.069 |
| t (p-value) | −3.91 (0.003) | −4.61 (0.06) | −3.89 (0.073) | −3.85 (0.082) | 4.63 (0.003) | 3.18 (0.02) | 1.95 (0.004) | 3.71 (0.01) | −7.07 (0.06) | 10.73 (0.09) | |
| %HV | Coefficient | −0.65 | −0.37 | −0.016 | −0.013 | 0.34 | 0.34 | 0.004 | 0.004 | −0.28 | 0.034 |
| t (p-value) | −3.04 (0.03) | −2.03 (0.44) | −5.17 (0.081) | −5.17 (0.10) | 2.92 (0.004) | 4.18 (0.001) | 2.84 (0.006) | 1.96 (0.07) | −1.41 (0.059) | 1.17 (0.11) | |
| Platoon Size (veh/h) | Coefficient | −1.09 | −1.22 | −0.025 | −0.02 | 0.13 | 0.10 | 0.013 | 0.004 | −3.19 | 1.43 |
| t (p-value) | −1.59 (0.01) | −0.86 (0.03) | −2.45 (0.32) | −2.47 (0.42) | 0.34 (0.15) | 0.383 (0.087) | 2.80 (0.003) | 0.59 (0.08) | −5.03 (0.02) | 2.01 (0.13) | |
| Time Headway (s) | Coefficient | −0.40 | −0.27 | −0.01 | −0.008 | 0.25 | 0.009 | 0.005 | 0.003 | −0.081 | −0.29 |
| t (p-value) | −3.49 (0.00) | −2.34 (0.007) | −6.08 (0.45) | −6.08 (0.50) | 3.98 (0.21) | 0.21 (0.031) | 6.09 (0.07) | 2.92 (0.021) | −0.77 (0.10) | −2.54 (0.21) | |
| SSR | 1983.67 | 9095.07 | 0.91 | 0.55 | 0.51 | 3343.82 | 0.39 | 3.24 | 6040.12 | 30,075.99 | |
| SSE | 420.67 | 5886.96 | 0.85 | 0.46 | 0.19 | 1026.39 | 0.12 | 0.38 | 1421.36 | 12,436.42 | |
| SST | 2404.34 | 14,982.03 | 1.76 | 1.01 | 0.70 | 4370.21 | 0.51 | 3.62 | 7461.48 | 42,512.41 | |
| R2 | 0.83 | 0.61 | 0.52 | 0.54 | 0.73 | 0.77 | 0.76 | 0.90 | 0.81 | 0.71 | |
| F (p-value) | 100.69 (0.00) | 60.45 (0.00) | 35.97 (0.00) | 56.24 (0.00) | 79.22 (0.00) | 90.86 (0.00) | 87.86 (0.00) | 189.44 (0.00) | 94.21 (0.00) | 66.07 (0.00) | |
| Variable | Prior Distributions | Posterior Distributions | ||||
|---|---|---|---|---|---|---|
| Mean | Std. Deviation | HPD | ||||
| Mean | Std. Deviation | Minimum | Maximum | |||
| Intercept | 75.34 | 2.7 | 73.64 | 2.64 | 68.80 | 78.22 |
| Flow (veh/h) | −10.99 | 1.29 | −9.76 | 1.16 | −11.61 | −7.23 |
| Opposing Flow (veh/h) | −0.09 | 0.08 | −0.04 | 0.04 | −0.13 | 0.03 |
| %HV (%) | −0.23 | 0.009 | −0.25 | 0.013 | −0.26 | −0.12 |
| Platoon Size (veh/h) | −0.61 | 0.012 | −0.55 | 0.014 | −0.93 | −0.19 |
| Time Headway (s) | −1.23 | 0.015 | −0.87 | 0.012 | −1.32 | −0.46 |
| Variable | Geweke Diagnostics | MCSE | |
|---|---|---|---|
| z | p-Value | ||
| Intercept | 1.37 | 0.102 | 0.032 |
| Flow (veh/h) | 0.46 | 0.089 | 0.016 |
| Opposing Flow (veh/h) | 0.12 | 0.076 | 0.013 |
| %HV (%) | −0.57 | 0.065 | 0.033 |
| Platoon Size (veh/h) | −0.24 | 0.059 | 0.028 |
| Time Headway (s) | −0.13 | 0.067 | 0.018 |
| Performance Measures | ||||||||||||||||||||
|---|---|---|---|---|---|---|---|---|---|---|---|---|---|---|---|---|---|---|---|---|
| Platooning Variables | ATS (km/h) | ATSpc | ATSpc/FFSpc | ATS/FFS | PF (%) | FD (veh/km) | PI (%) | NFPC | NO (veh/h) | Platoon Speed (km/h) | ||||||||||
| p-Value | p-Value | p-Value | p-Value | p-Value | p-Value | p-Value | p-Value | p-Value | p-Value | |||||||||||
| Constant | 73.64 | 0.001 | 98.65 | 0.003 | 0.39 | 0.002 | 0.41 | 0.001 | −2.60 | 0.004 | 0.82 | 0.004 | 0.14 | 0.002 | −0.009 | 0.001 | −6.02 | 0.00 | 48.90 | 0.003 |
| Flow (veh/h) | −9.76 | 0.003 | −2.07 | 0.002 | −77.08 | 0.058 | −49.87 | 0.084 | 2.98 | 0.003 | 4.30 | 0.0003 | 2.44 | 0.002 | 0.67 | 0.001 | 3.02 | 0.003 | −5.43 | 0.002 |
| Opposing Flow (veh/h) | −0.04 | 0.002 | −0.01 | 0.083 | −0.003 | 0.091 | −0.002 | 0.13 | 0.05 | 0.002 | 0.032 | 0.0005 | 0.003 | 0.00 | 0.005 | 0.013 | 0.080 | 0.083 | −0.030 | 0.077 |
| %HV (%) | −0.25 | 0.002 | −0.57 | 0.51 | −0.023 | 0.09 | −0.016 | 0.07 | 0.14 | 0.001 | 0.54 | 0.004 | 0.005 | 0.003 | 0.007 | 0.073 | 0.48 | 0.091 | −0.40 | 0.071 |
| Platoon Size (veh/h) | −0.55 | 0.00 | −0.35 | 0.002 | −0.03 | 0.22 | −0.011 | 0.31 | 0.18 | 0.10 | 0.39 | 0.091 | 0.72 | 0.007 | 0.006 | 0.12 | 0.10 | 0.08 | −4.08 | 0.001 |
| Time Headway (s) | −0.87 | 0.00 | −0.18 | 0.002 | −0.018 | 0.053 | −0.060 | 0.43 | 0.34 | 0.18 | 0.10 | 0.003 | 0.002 | 0.09 | 0.004 | 0.002 | −0.030 | 0.17 | −0.040 | 0.07 |
| SSR | 2690.33 | 10,001.05 | 0.98 | 0.78 | 0.65 | 3989.06 | 0.70 | 6.78 | 38,022.68 | 8732.12 | ||||||||||
| SSE | 410.29 | 5476.12 | 0.86 | 0.52 | 0.22 | 1043.23 | 0.20 | 0.54 | 14,110.20 | 1721.08 | ||||||||||
| SST | 3100.62 | 15,477.17 | 1.84 | 1.30 | 0.87 | 5032.29 | 0.90 | 7.32 | 52,132.88 | 10,453.20 | ||||||||||
| R2 | 0.87 | 0.65 | 0.53 | 0.60 | 0.75 | 0.80 | 0.78 | 0.93 | 0.73 | 0.84 | ||||||||||
|
F (p-value) | 183.06 (0.00) | 63.55 (0.00) | 43.80 (0.00) | 58.71 (0.00) | 81.20 (0.00) | 130.51 (0.00) | 96.22 (0.00) | 225.08 (0.00) | 70.49 (0.00) | 159.20 (0.00) | ||||||||||
| Model | Best Fit | R2 Value | MAPE |
|---|---|---|---|
| BLR | 0.93 | 0.09 | |
| MLR | 0.70 | 0.20 |
| LOS | The HCM [22] | This Study | |
|---|---|---|---|
| ATS (km/h) | PTSF (%) | NFPC | |
| A | >88 | ≤35 | 0.20≤ |
| B | >80–88 | >35–50 | >0.20–0.40 |
| C | >72–80 | >50–65 | >0.40–0.60 |
| D | >64–72 | >65–80 | >0.60–0.80 |
| E | ≤64 | >80 | >0.80 |
| Two-Lane Roads | NFPC | LOS | |
|---|---|---|---|
| This Study | The HCM (2010) [22] | ||
| Fuman-Saravan | 0.48 | C | D |
| Rasht-Jirdeh | 0.32 | B | C |
| Rasht-Somesara | 0.70 | D | E |
| Kiasar-Sari | 0.23 | B | C |
Disclaimer/Publisher’s Note: The statements, opinions and data contained in all publications are solely those of the individual author(s) and contributor(s) and not of MDPI and/or the editor(s). MDPI and/or the editor(s) disclaim responsibility for any injury to people or property resulting from any ideas, methods, instructions or products referred to in the content. |
© 2023 by the authors. Licensee MDPI, Basel, Switzerland. This article is an open access article distributed under the terms and conditions of the Creative Commons Attribution (CC BY) license (https://creativecommons.org/licenses/by/4.0/).
Share and Cite
Samadi, H.; Aghayan, I.; Shaaban, K.; Hadadi, F. Development of Performance Measurement Models for Two-Lane Roads under Vehicular Platooning Using Conjugate Bayesian Analysis. Sustainability 2023, 15, 4037. https://doi.org/10.3390/su15054037
Samadi H, Aghayan I, Shaaban K, Hadadi F. Development of Performance Measurement Models for Two-Lane Roads under Vehicular Platooning Using Conjugate Bayesian Analysis. Sustainability. 2023; 15(5):4037. https://doi.org/10.3390/su15054037
Chicago/Turabian StyleSamadi, Hossein, Iman Aghayan, Khaled Shaaban, and Farhad Hadadi. 2023. "Development of Performance Measurement Models for Two-Lane Roads under Vehicular Platooning Using Conjugate Bayesian Analysis" Sustainability 15, no. 5: 4037. https://doi.org/10.3390/su15054037
APA StyleSamadi, H., Aghayan, I., Shaaban, K., & Hadadi, F. (2023). Development of Performance Measurement Models for Two-Lane Roads under Vehicular Platooning Using Conjugate Bayesian Analysis. Sustainability, 15(5), 4037. https://doi.org/10.3390/su15054037