


FSPV-Grid System for an Industrial Subsection with PV Price Sensitivity Analysis


 ,
,
Abstract
1. Introduction
- ▪
- Birds are drawn to the projects because they are on water, and their nests, droppings and other debris cause problems;
- ▪
- There are important concerns in terms of freshwater’s difference from saltwater/seawater;
- ▪
- Power losses in PV modules may occur as a result of micro-cracks caused by motions triggered by wind, waves and other external forces;
- ▪
- Solar radiation, fog, the presence of shade and other factors can have a direct impact on generation;
- ▪
- Water level fluctuations, frozen regions, inflows of floating matter, accessibility, interference from dam facilities and so on are all factors that may affect installation and maintenance;
- ▪
- The power system connection, distance to distribution line, load, etc.
- ▪
- There are also legal constraints: water source protection zones, environmental protection, flora and fauna protection, marine activists, etc. [7].
2. Development of the FSPV System and Related Work
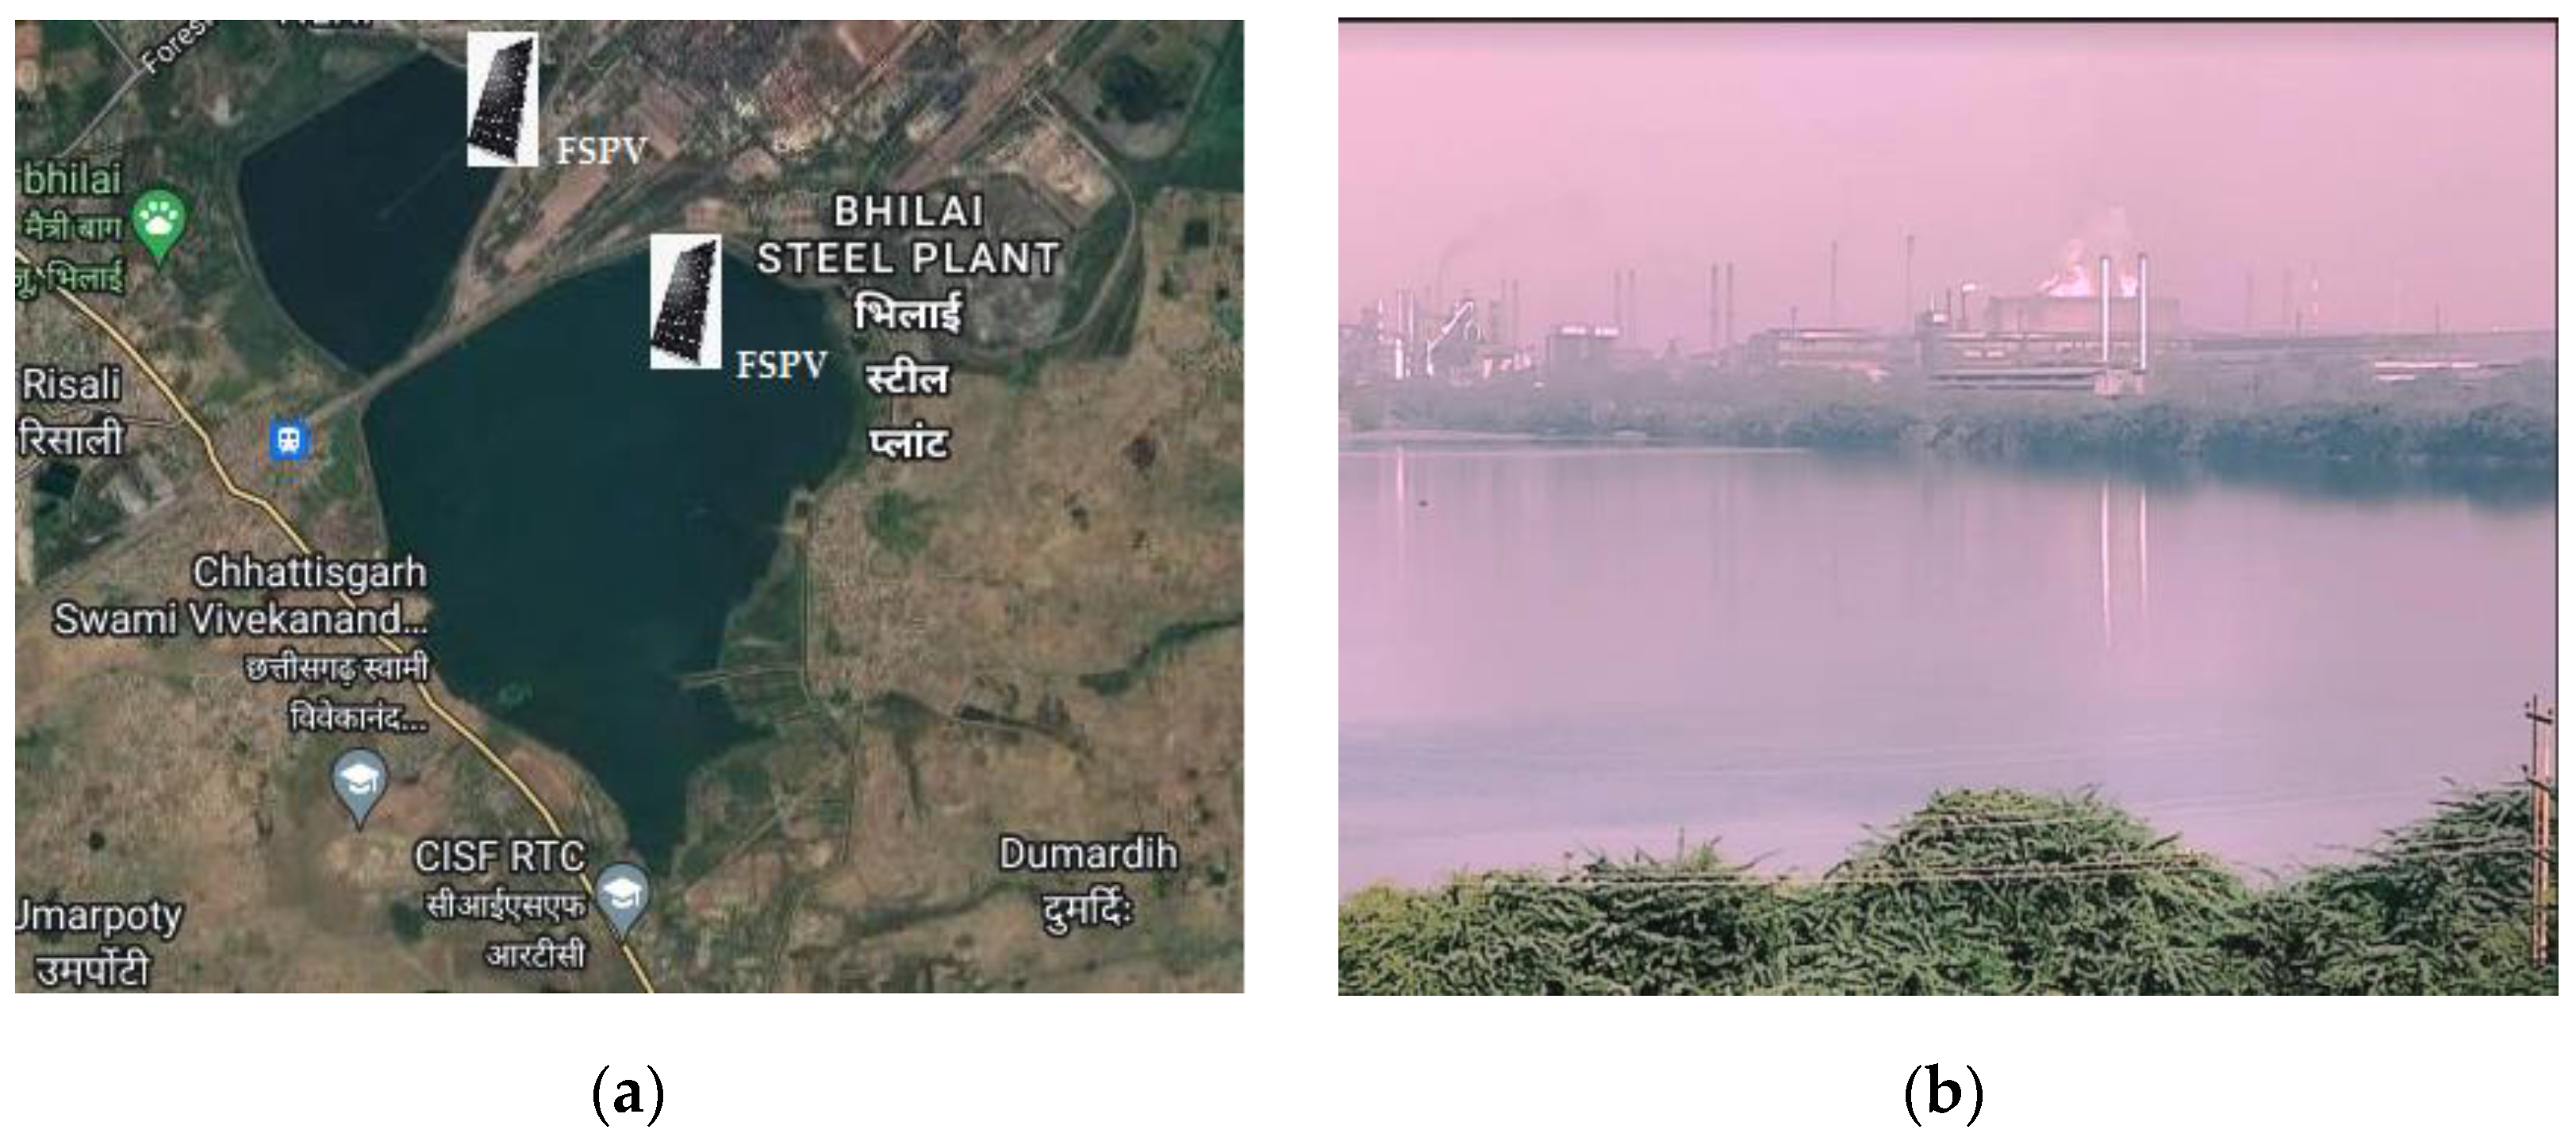
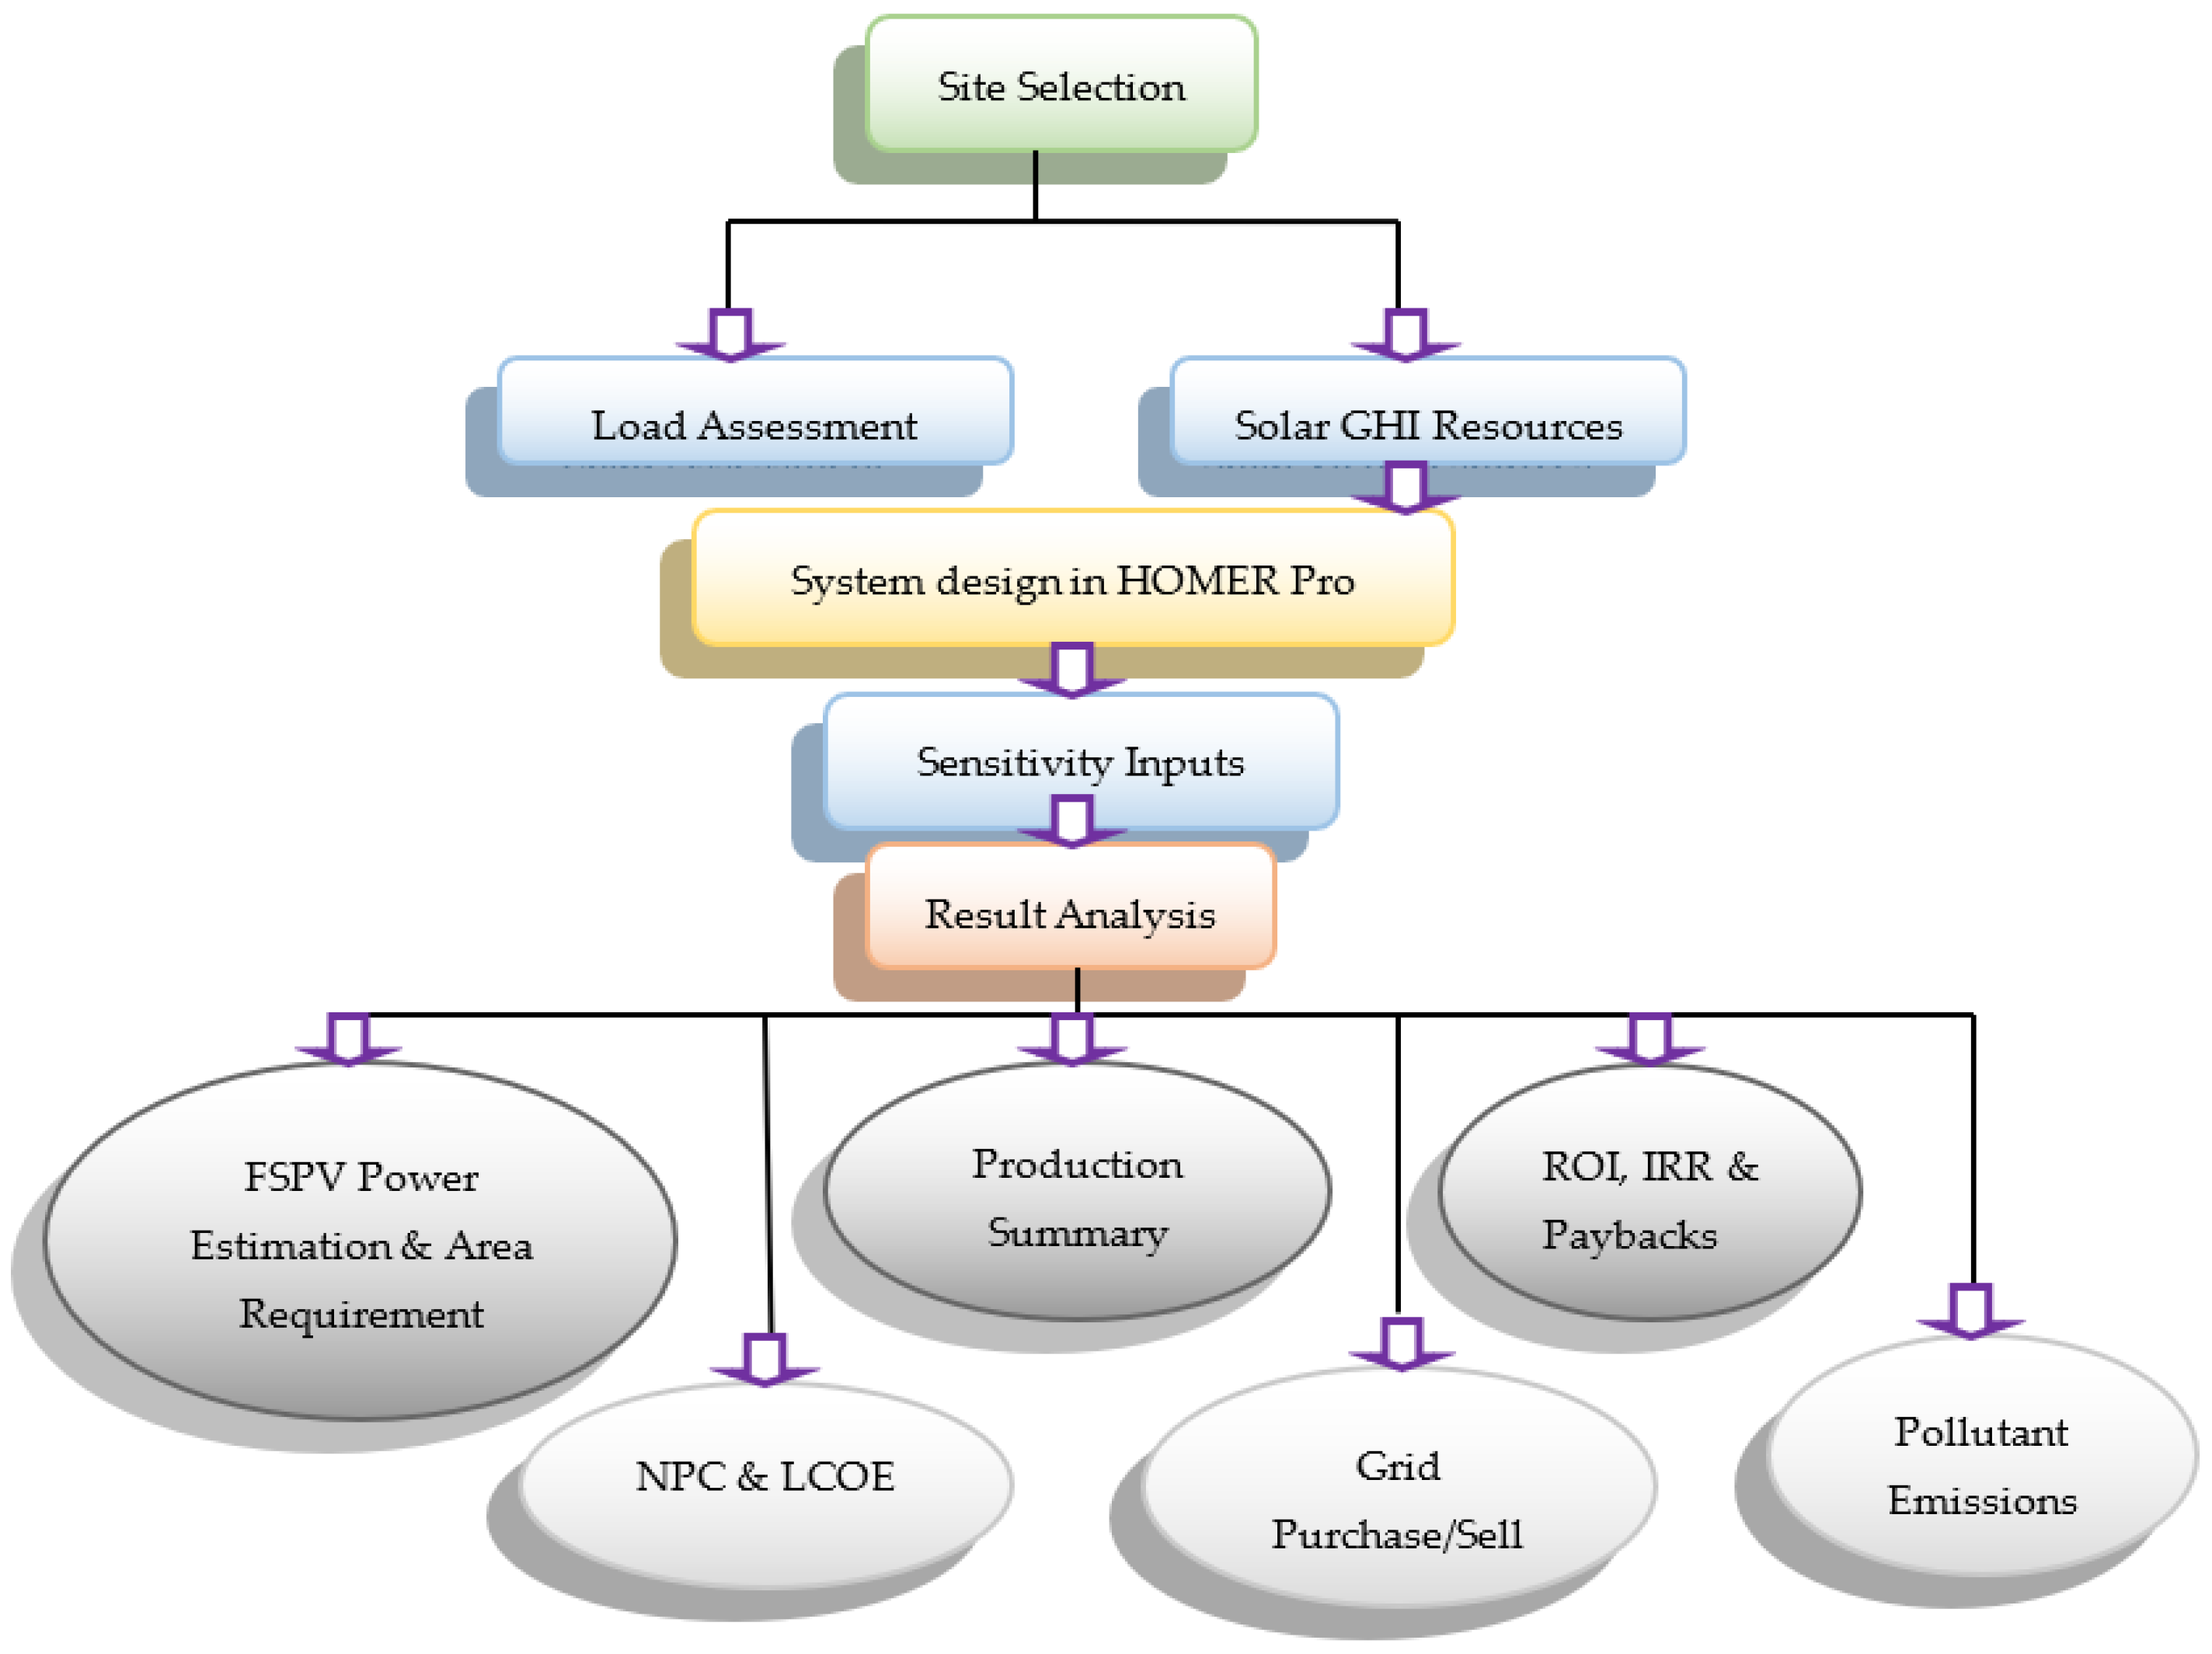
3. Site Selection, Resources and System Modelling
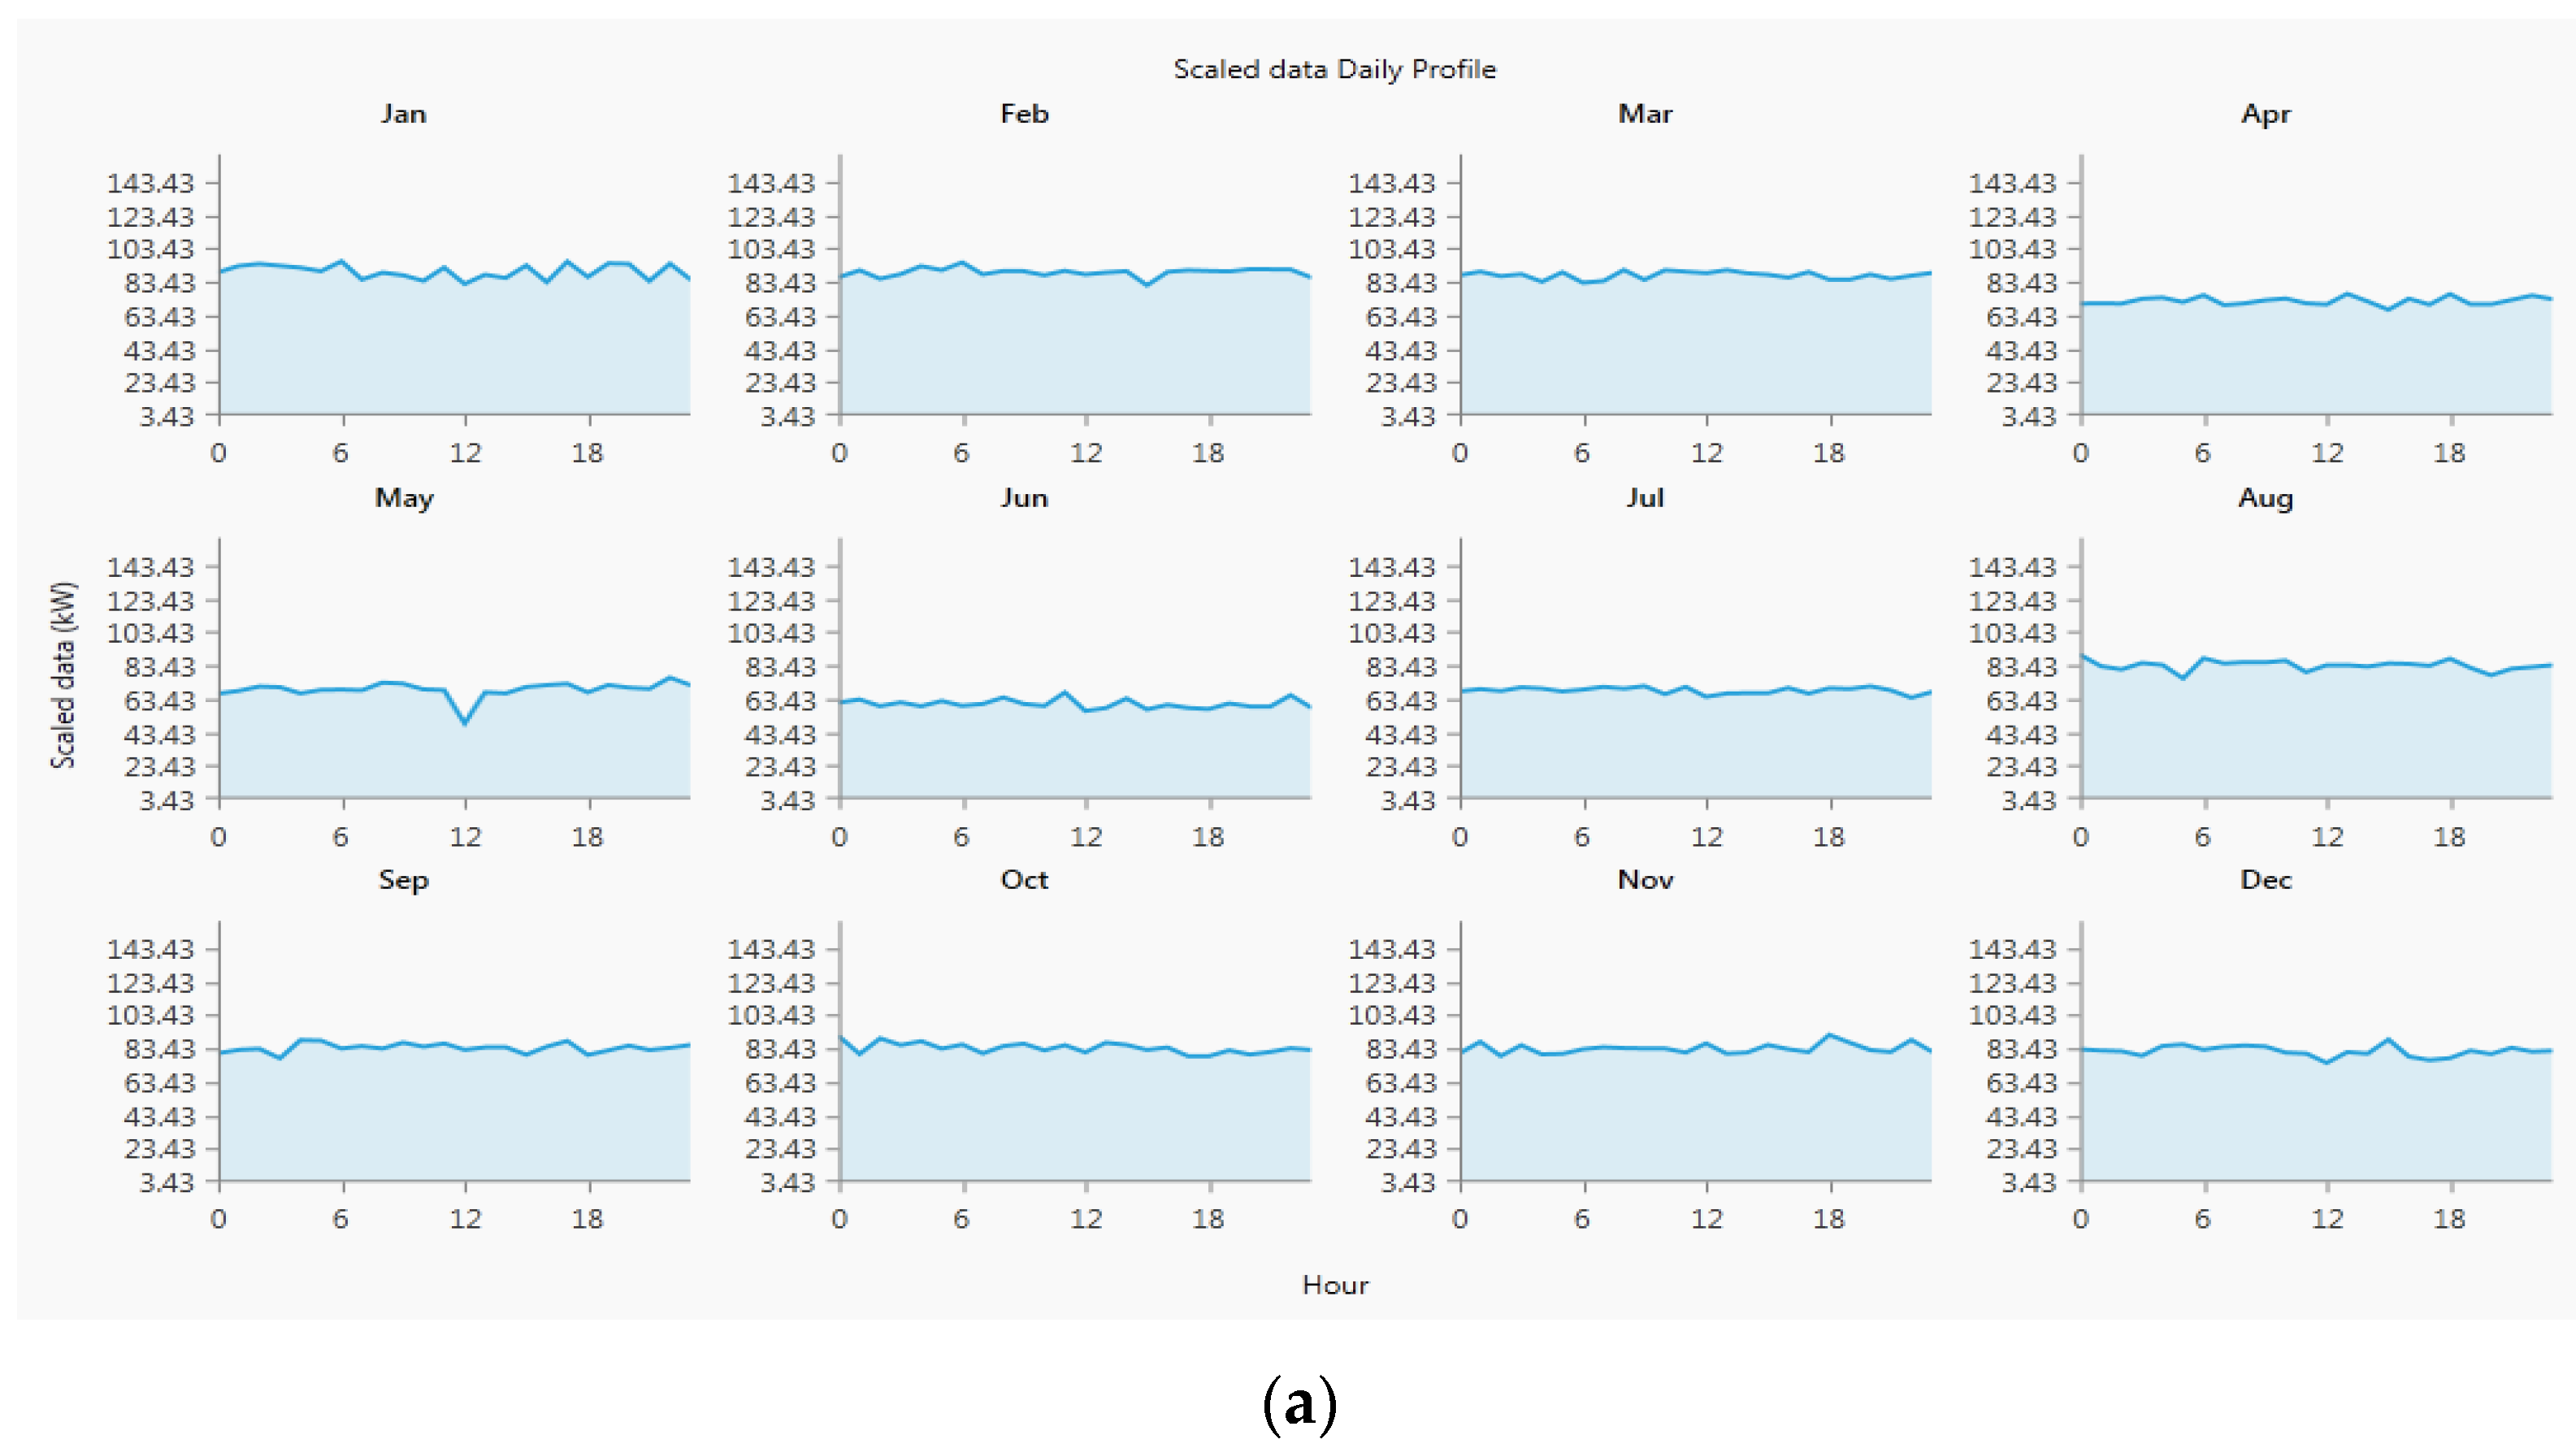
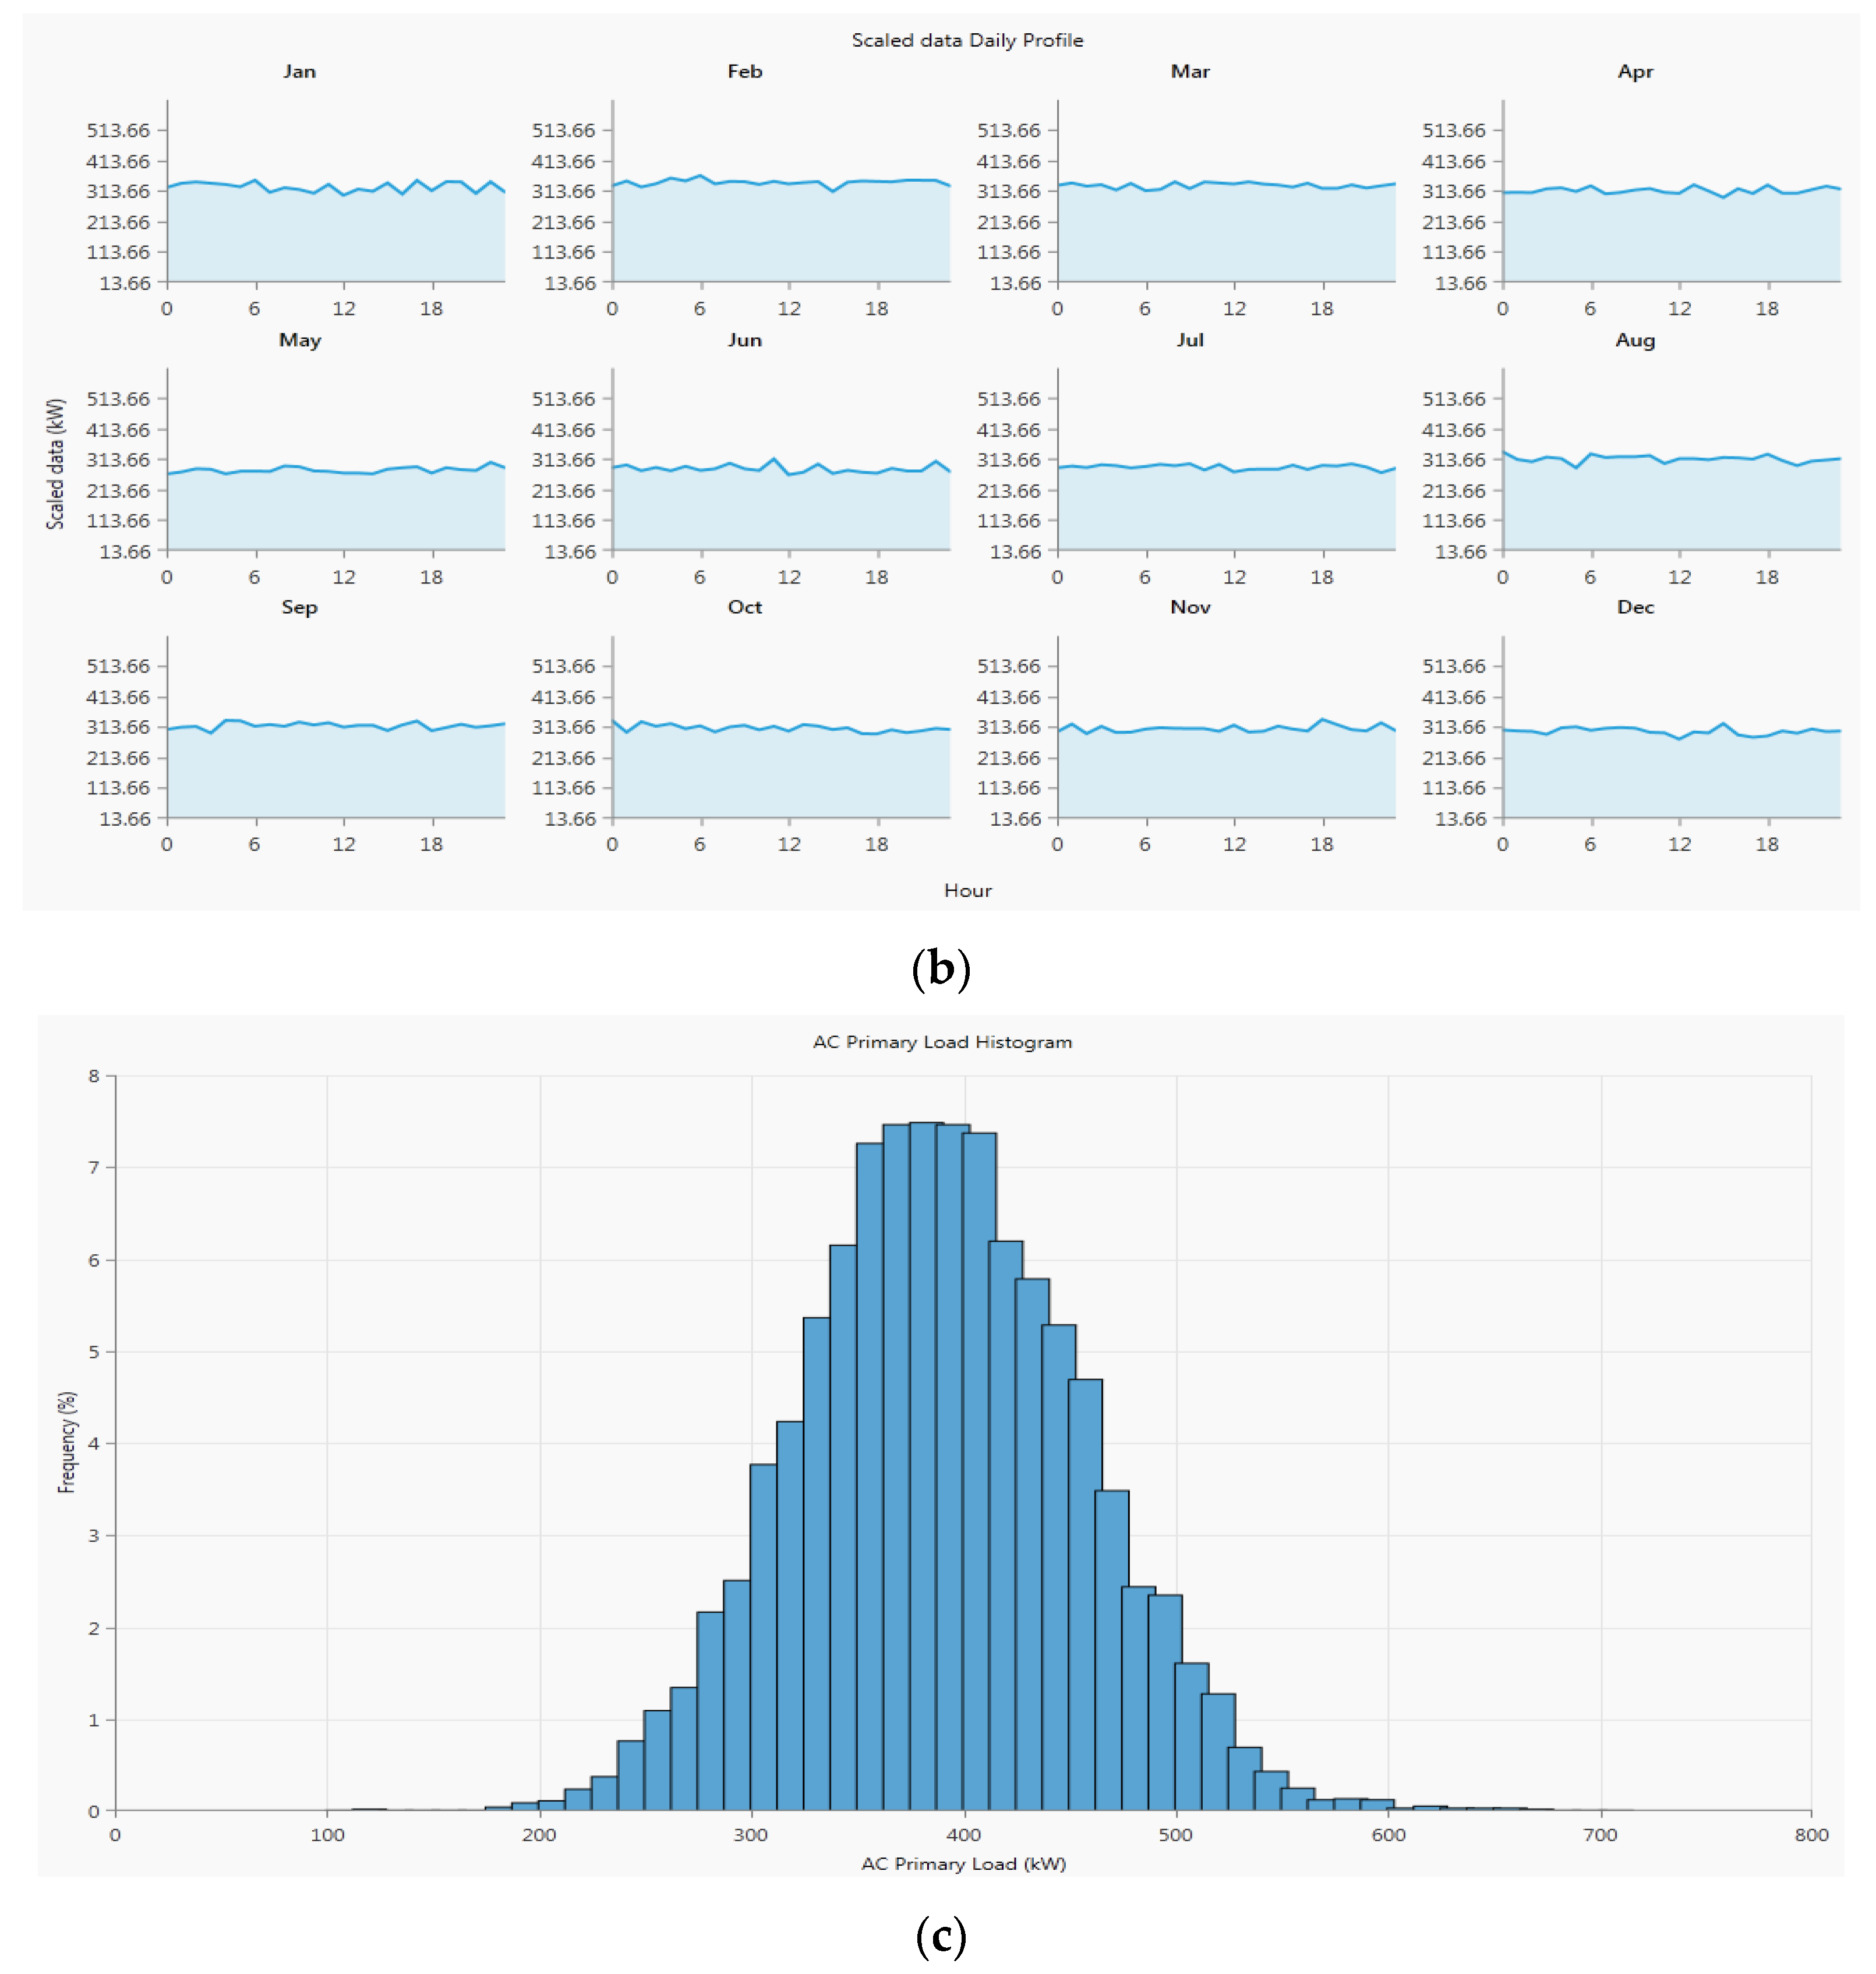
3.1. Load/Demand Assessment
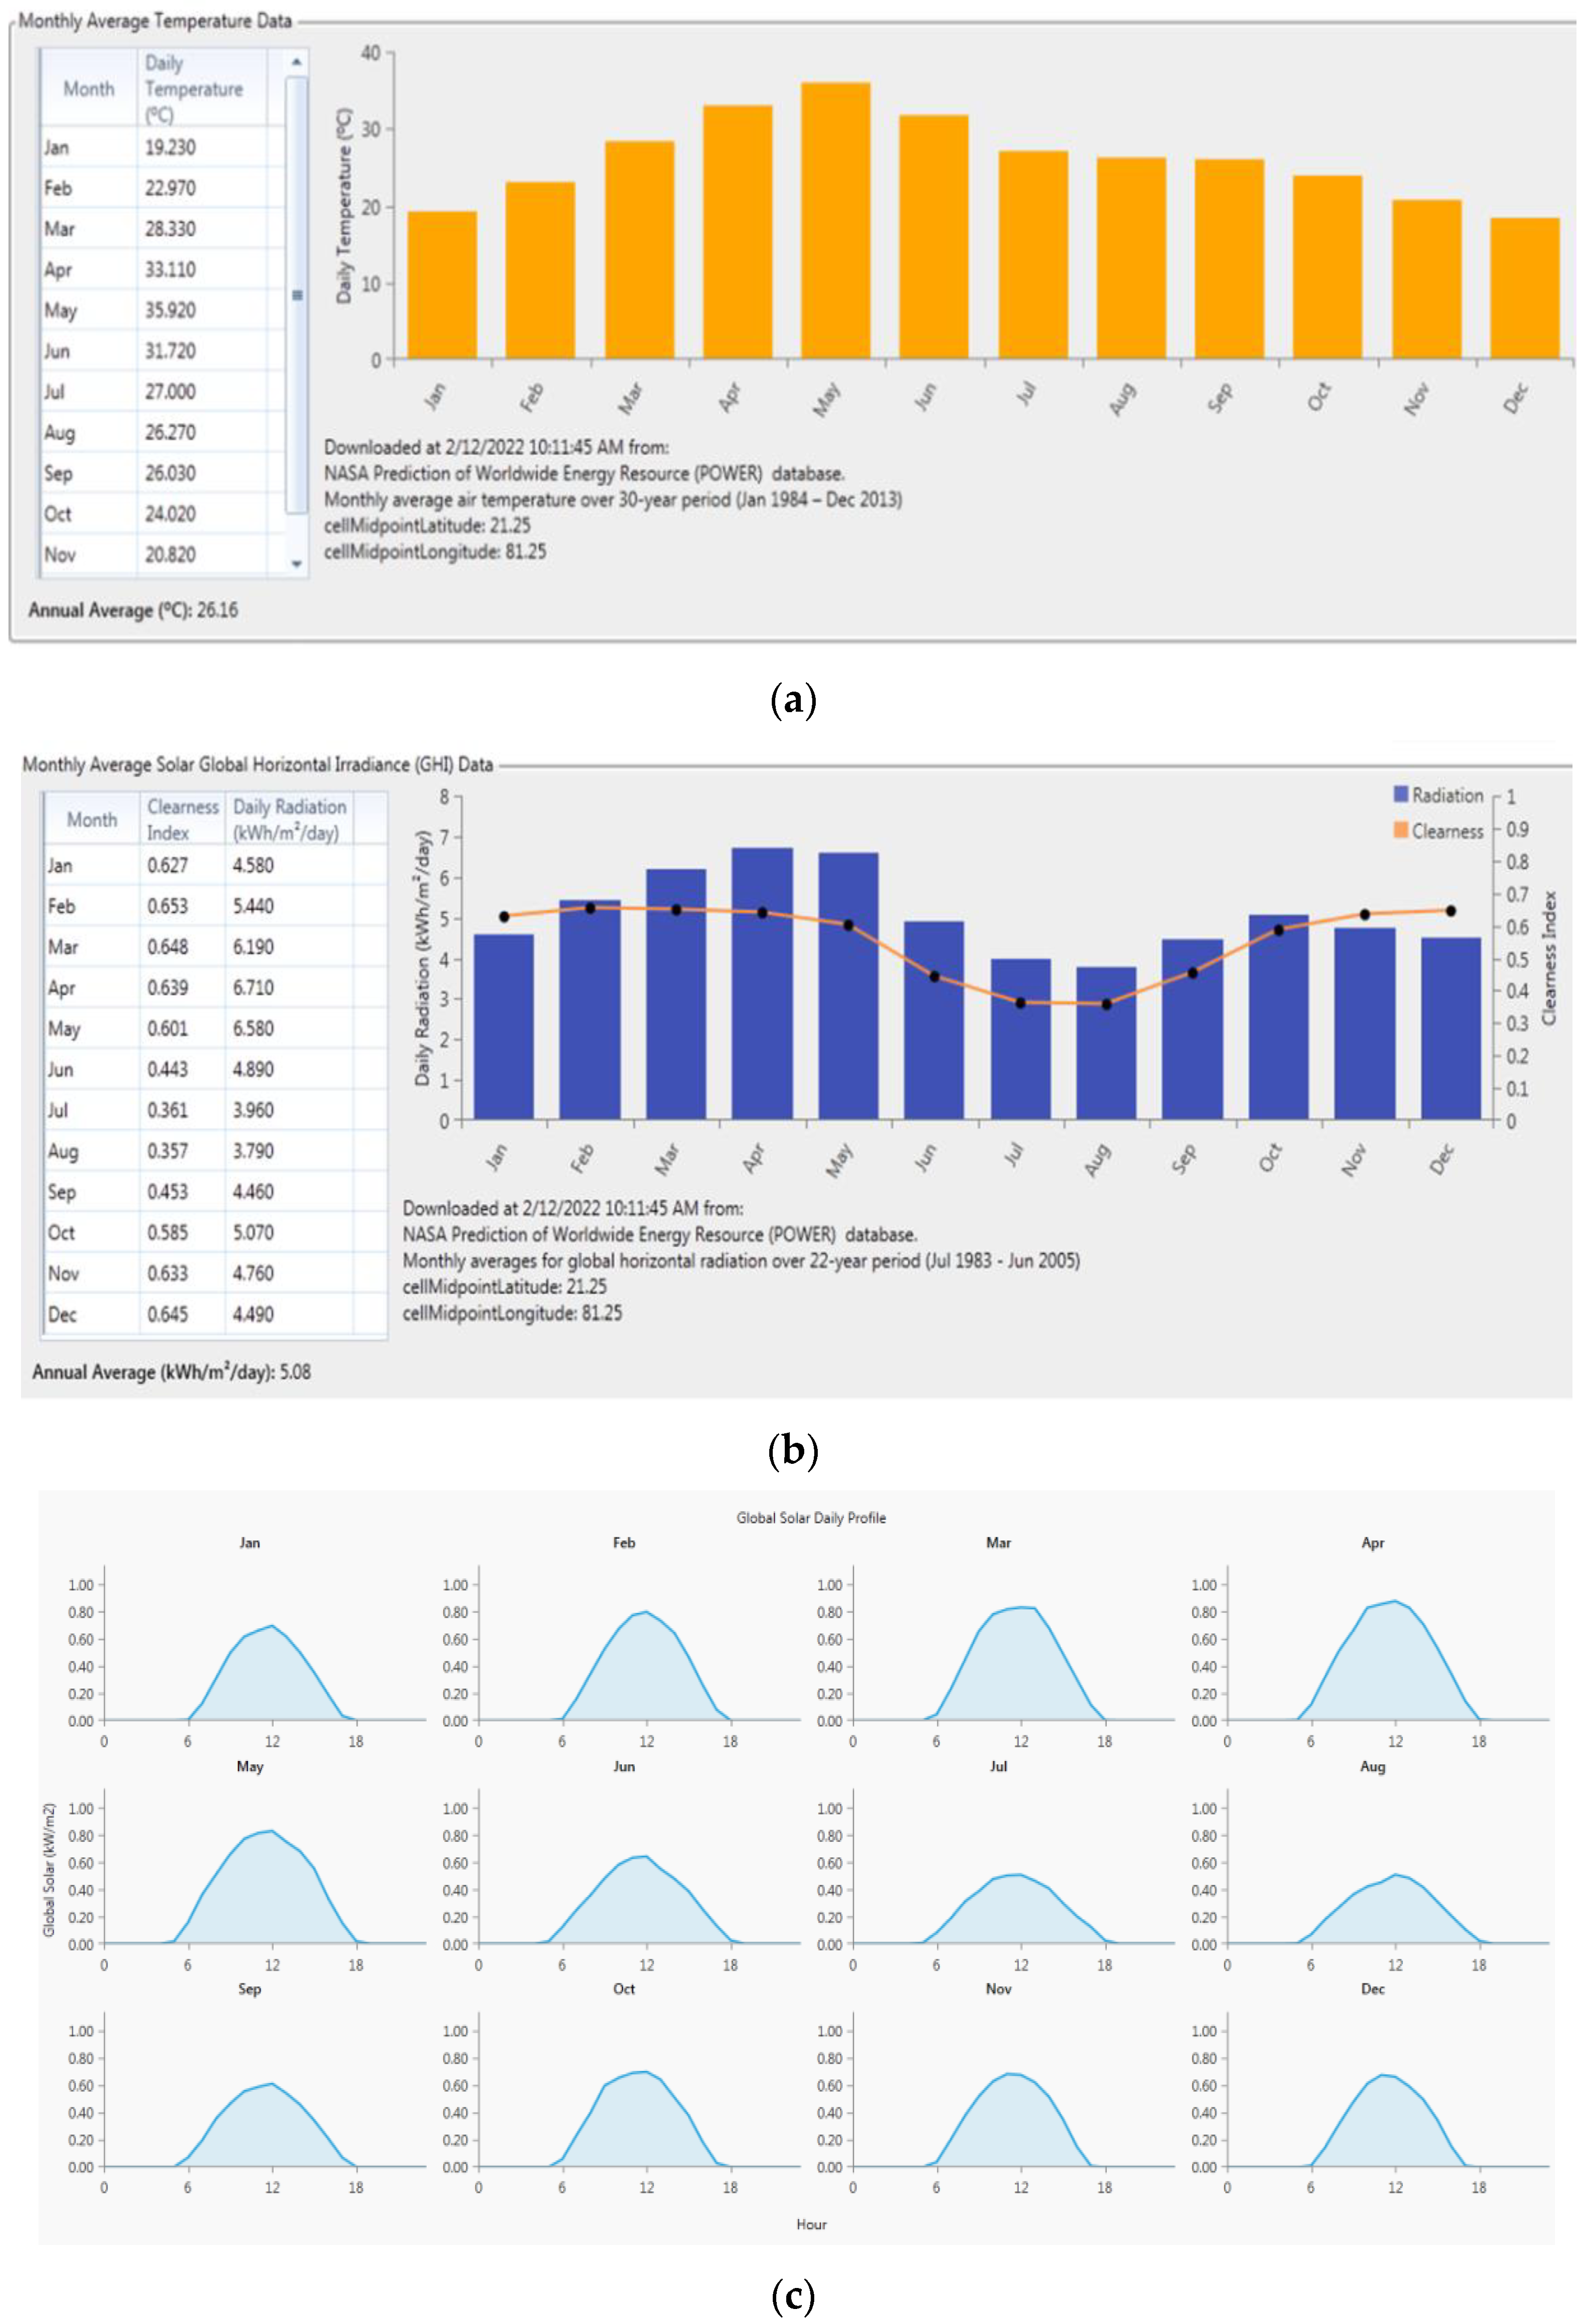
3.2. Availability of Solar GHI Resources
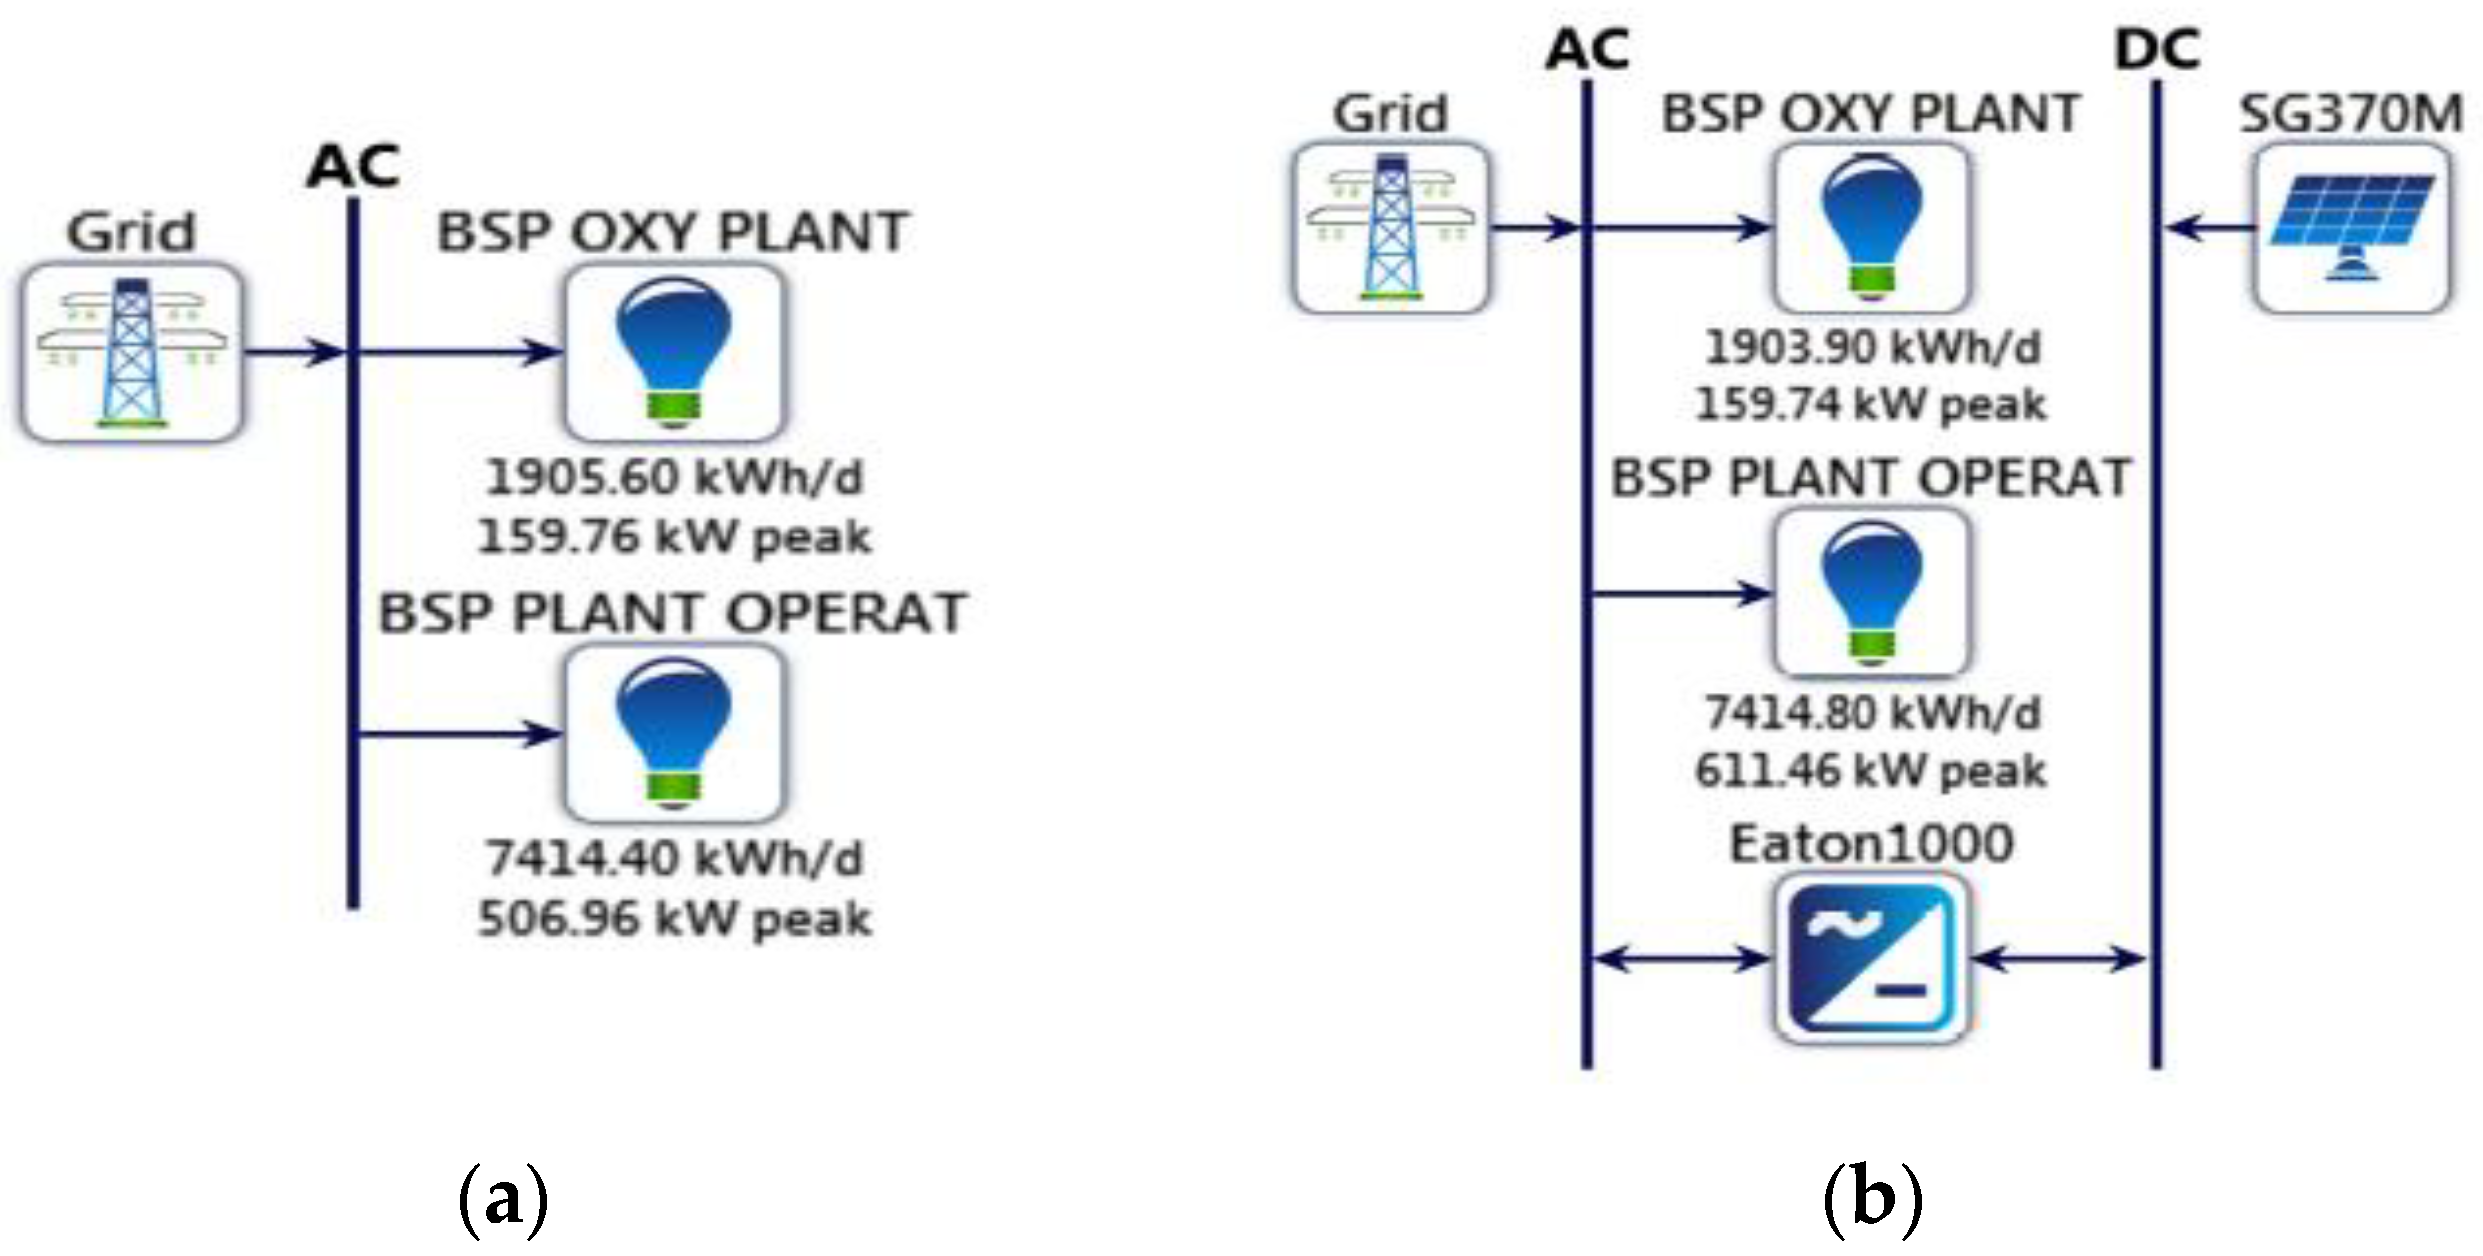
3.3. Input Data for Homer Pro and System Modelling
3.3.1. FSPV Module Input
3.3.2. Converter Inputs
3.3.3. Grid Inputs
3.3.4. Controlling Inputs
3.3.5. Economic Inputs
3.3.6. System Constraints
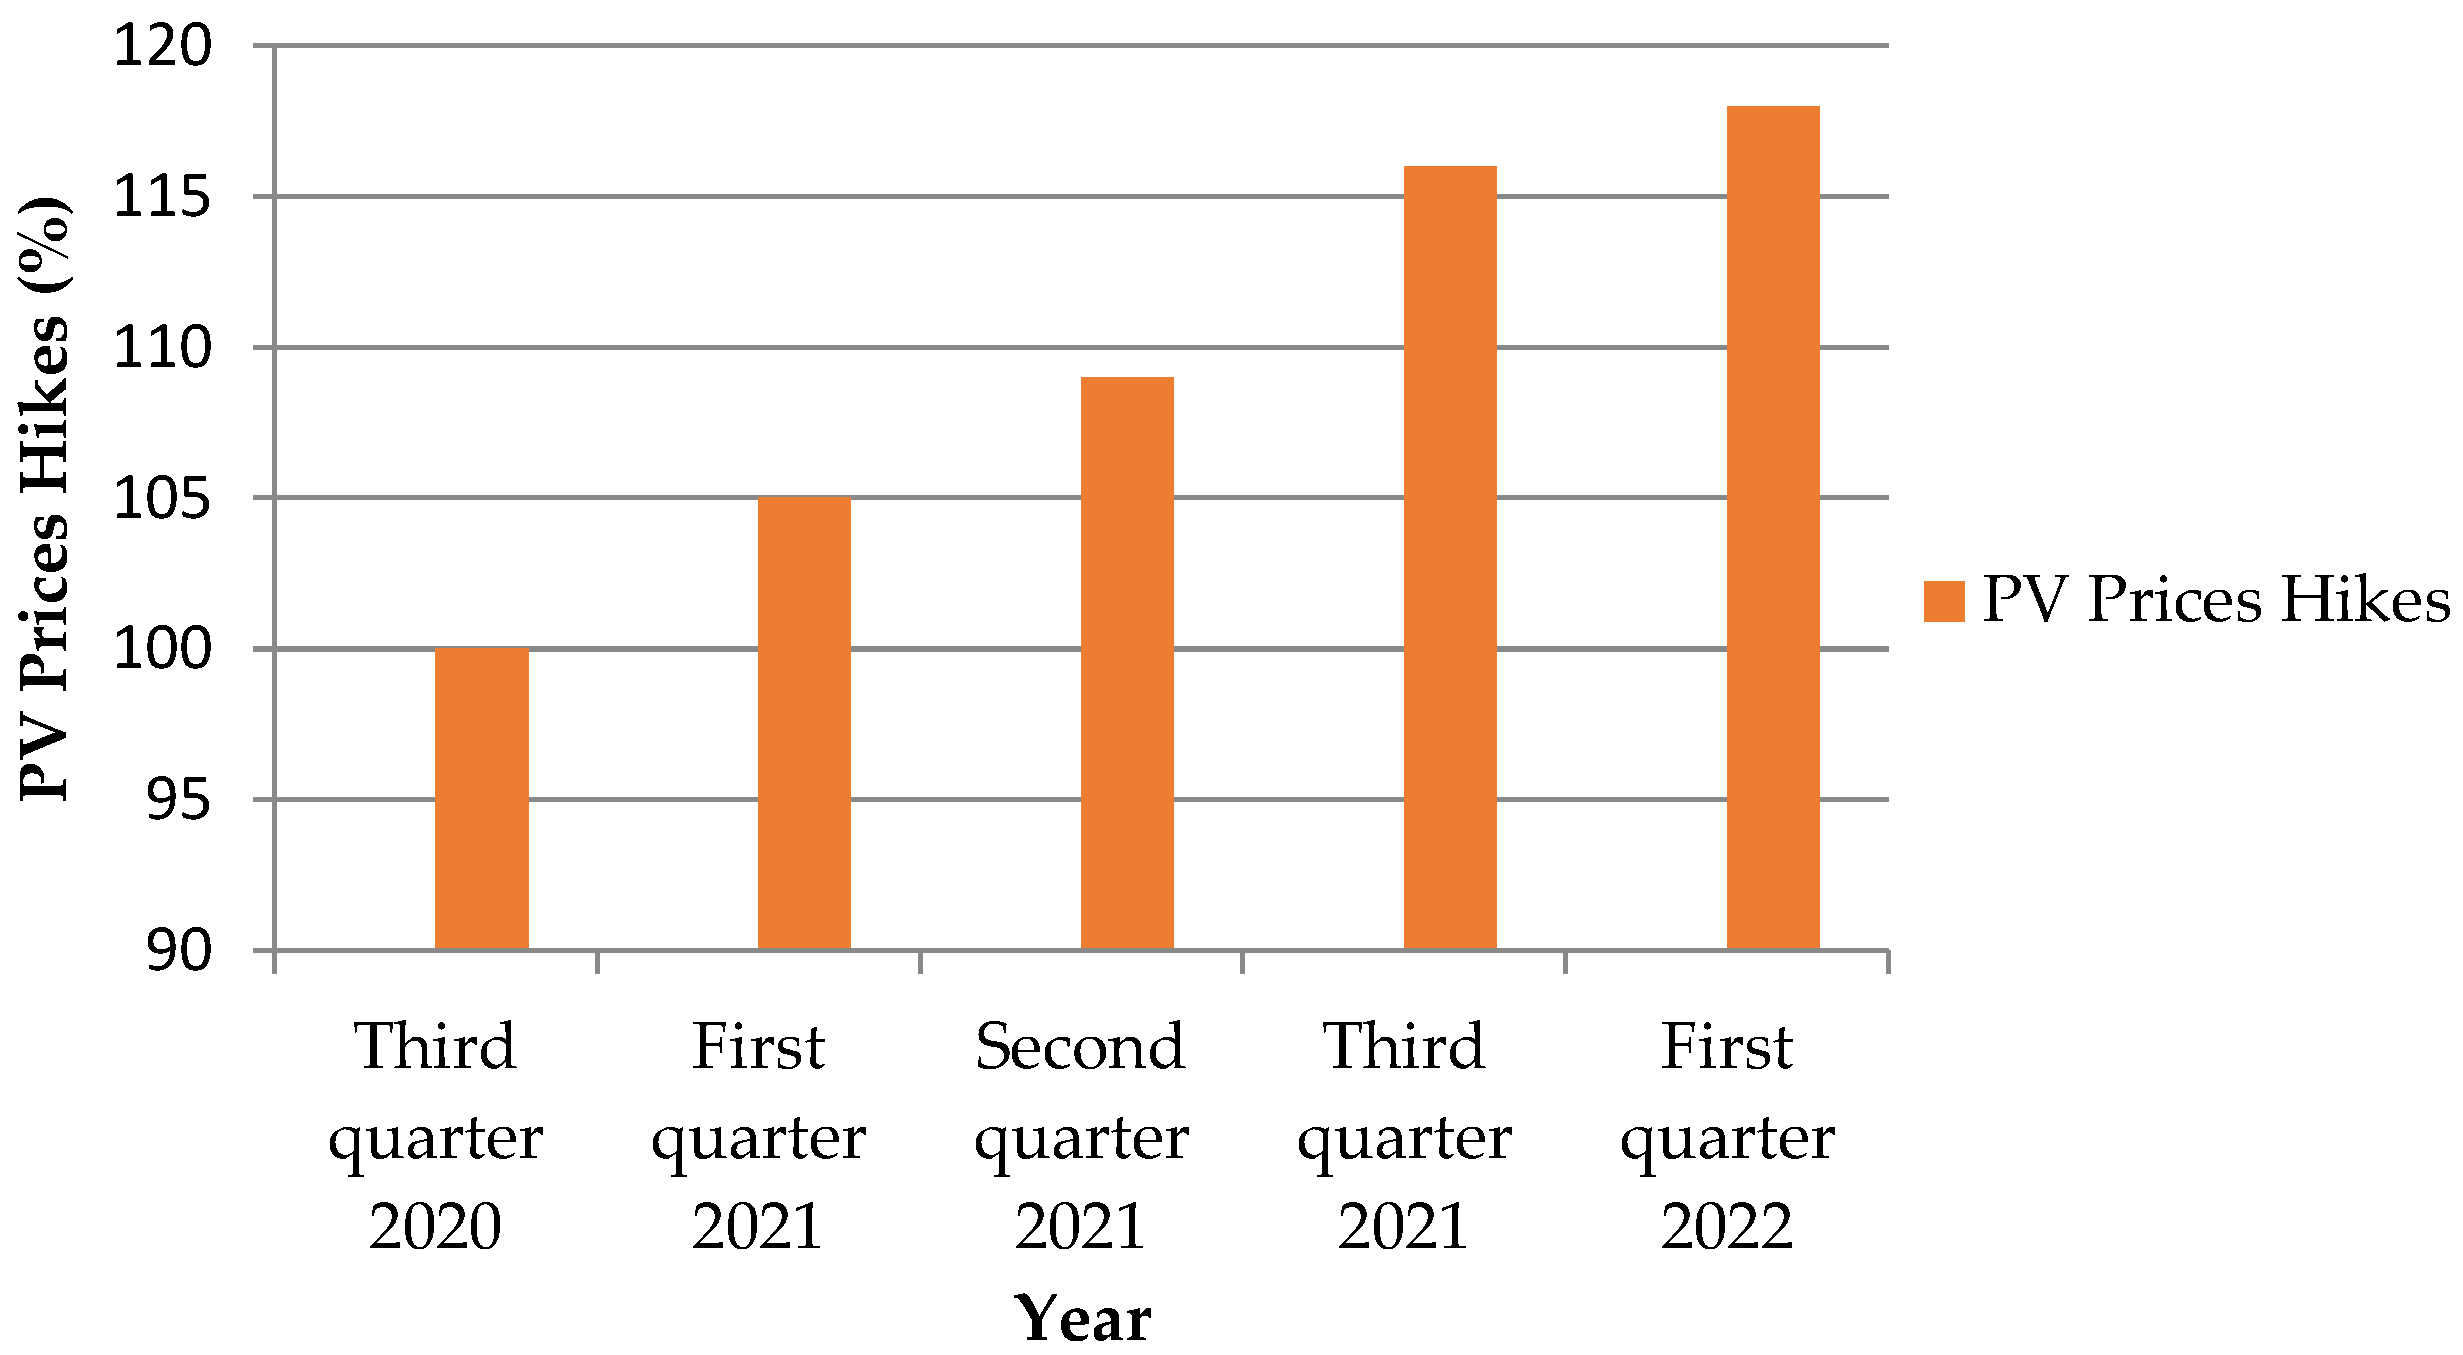
3.3.7. Sensitivity Parameters
4. Results and Sensitivity Analysis
- ▪
- FSPV system power estimations and area requirement;
- ▪
- NPC and LCOE;
- ▪
- Production summary;
- ▪
- Grid purchase/sell;
- ▪
- IRR, ROI and paybacks;
- ▪
- Pollutant emissions.
4.1. FSPV System Power Estimations and Area Requirements
- ▪
- According to estimates, Maroda Reservoir-1 and Maroda Reservoir-2 have the potential to generate 20 MW and 65 MW, respectively, with a minimum of 20% area coverage. For a maximum of 100% coverage, generation increases to 100 MW and 325 MW, respectively;
- ▪
- According to a conservative estimate of 40 MW capacity FSPV per square km of reservoir surface area covered, as shown in Table 3, a minimum area of 0.083 km2 was calculated for a rating of 4185 kW as selected for FSPV–grid generation with a 1% PV price increase;
- ▪
- Similarly, an area of 0.041 km2 was calculated for a rating of 2097 kW as selected for FSPV–grid generation with the maximum 18% PV price increase;
- ▪
- The above three results were theoretically calculated to be consistent with the optimized HOMER Pro results. Furthermore, the calculated area required for the FSPV installation could come from either Maroda Reservoir-1 or Maroda Reservoir-2.

| System | FSPV Price Hike (%) | FSPV (kW) | Area Required for FSPV Installation (km2) |
|---|---|---|---|
| Grid-only | NA | NA | NA |
| FSPV–grid | 1 | 4185 | 0.083 |
| FSPV–grid | 1.09 | 3930 | 0.078 |
| FSPV–grid | 1.18 | 2097 | 0.041 |
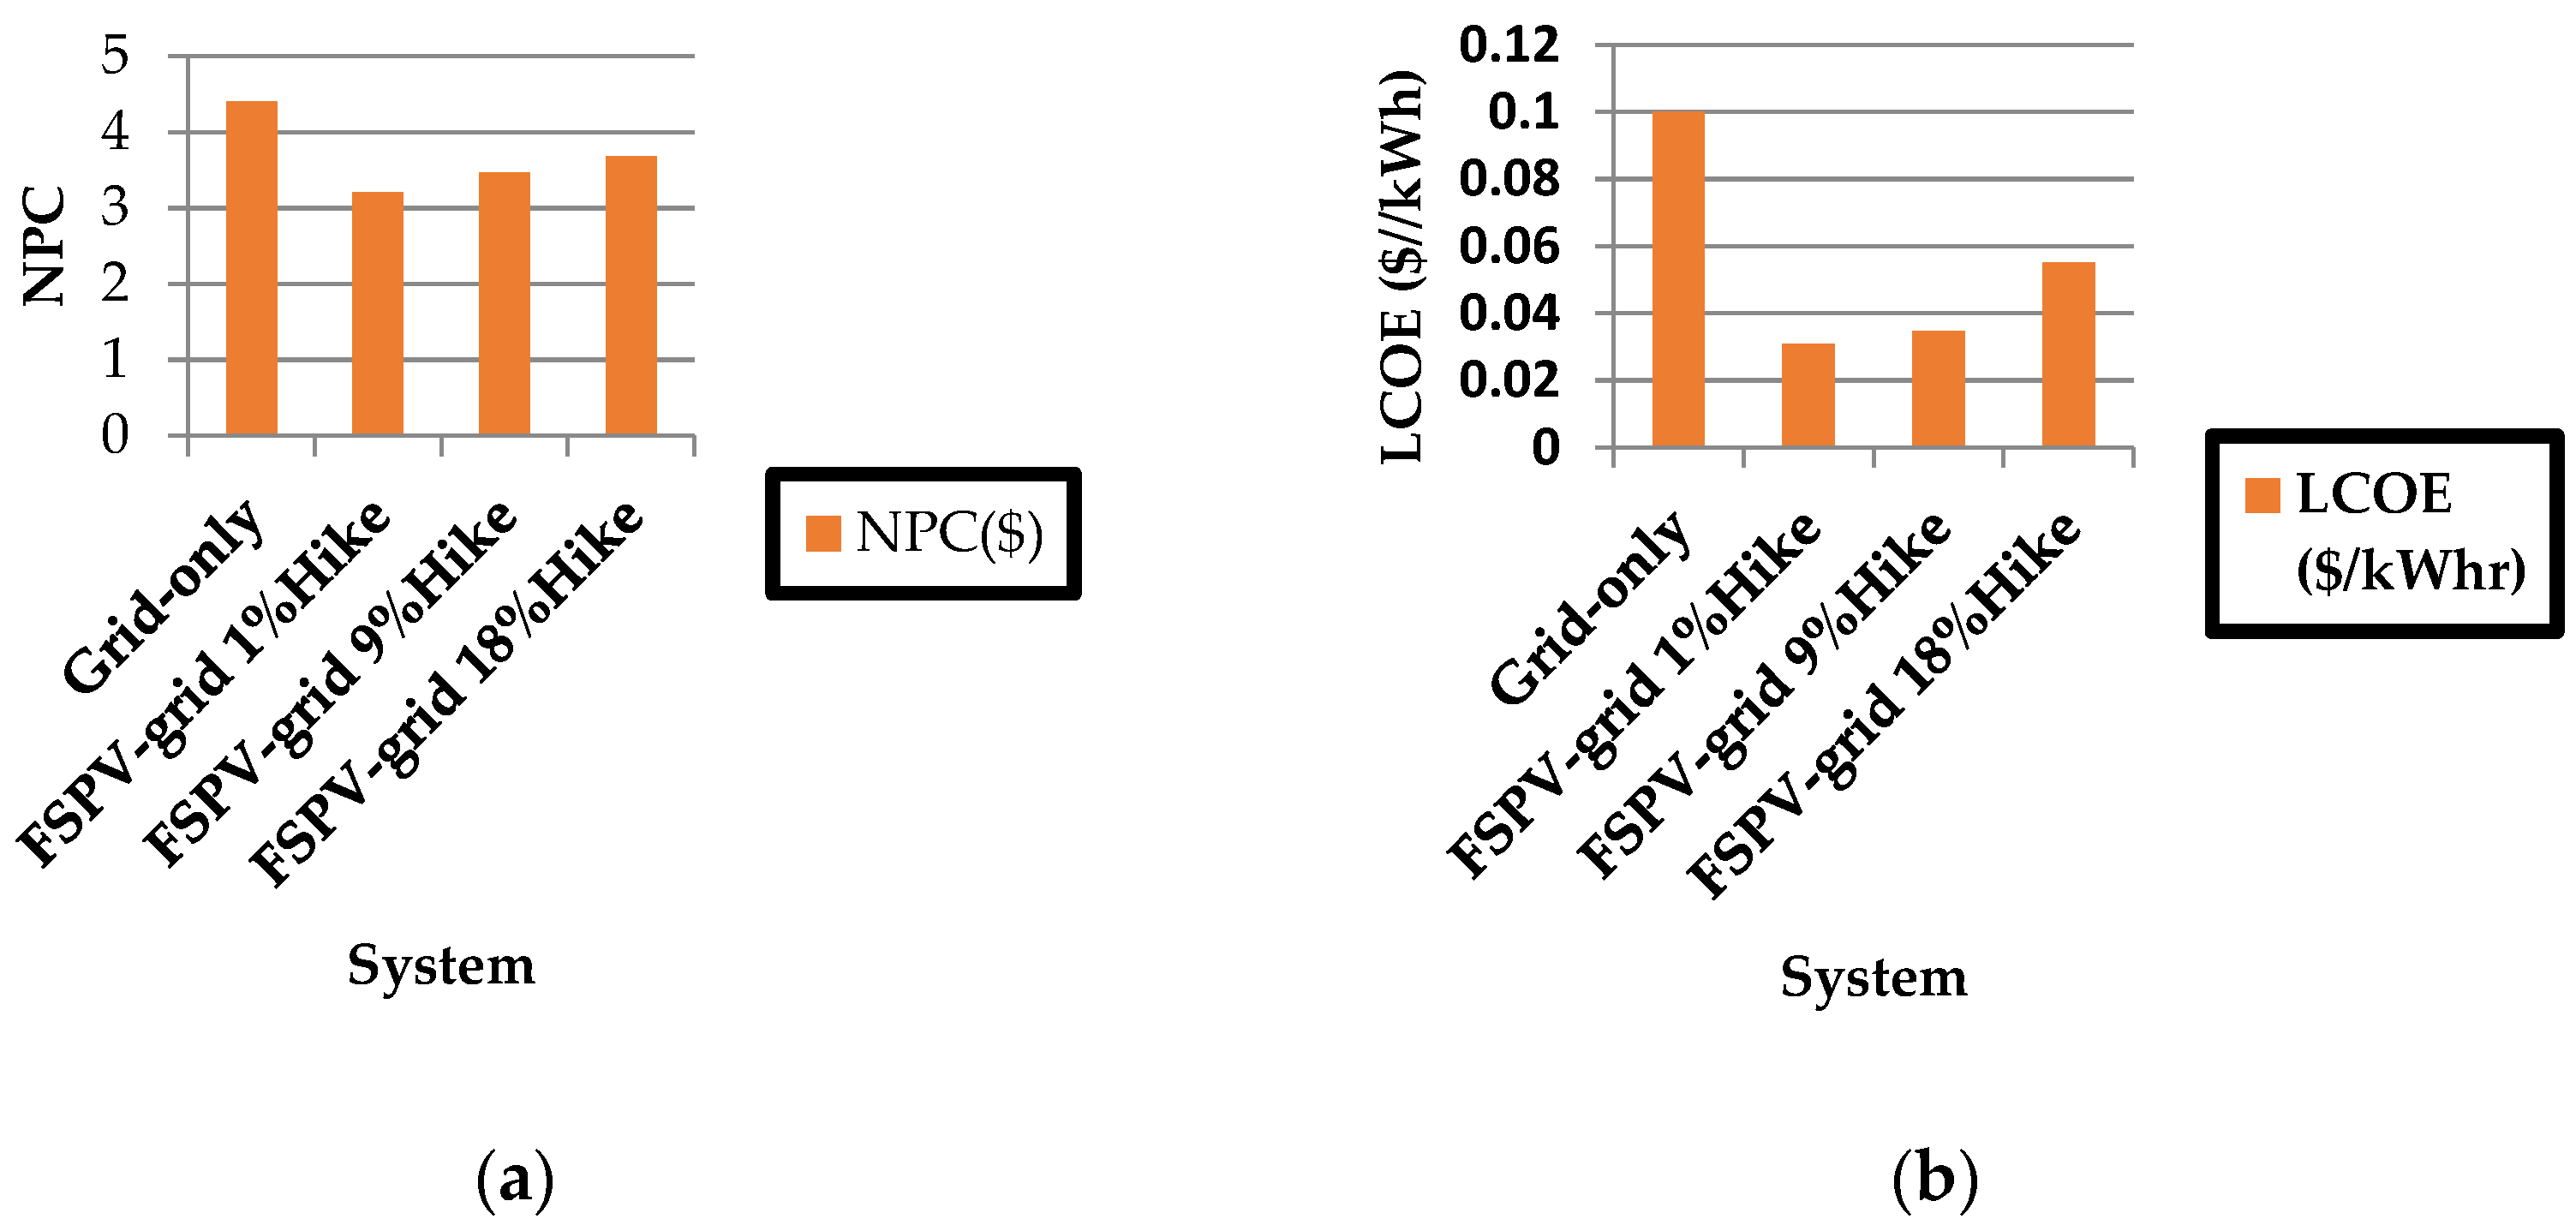
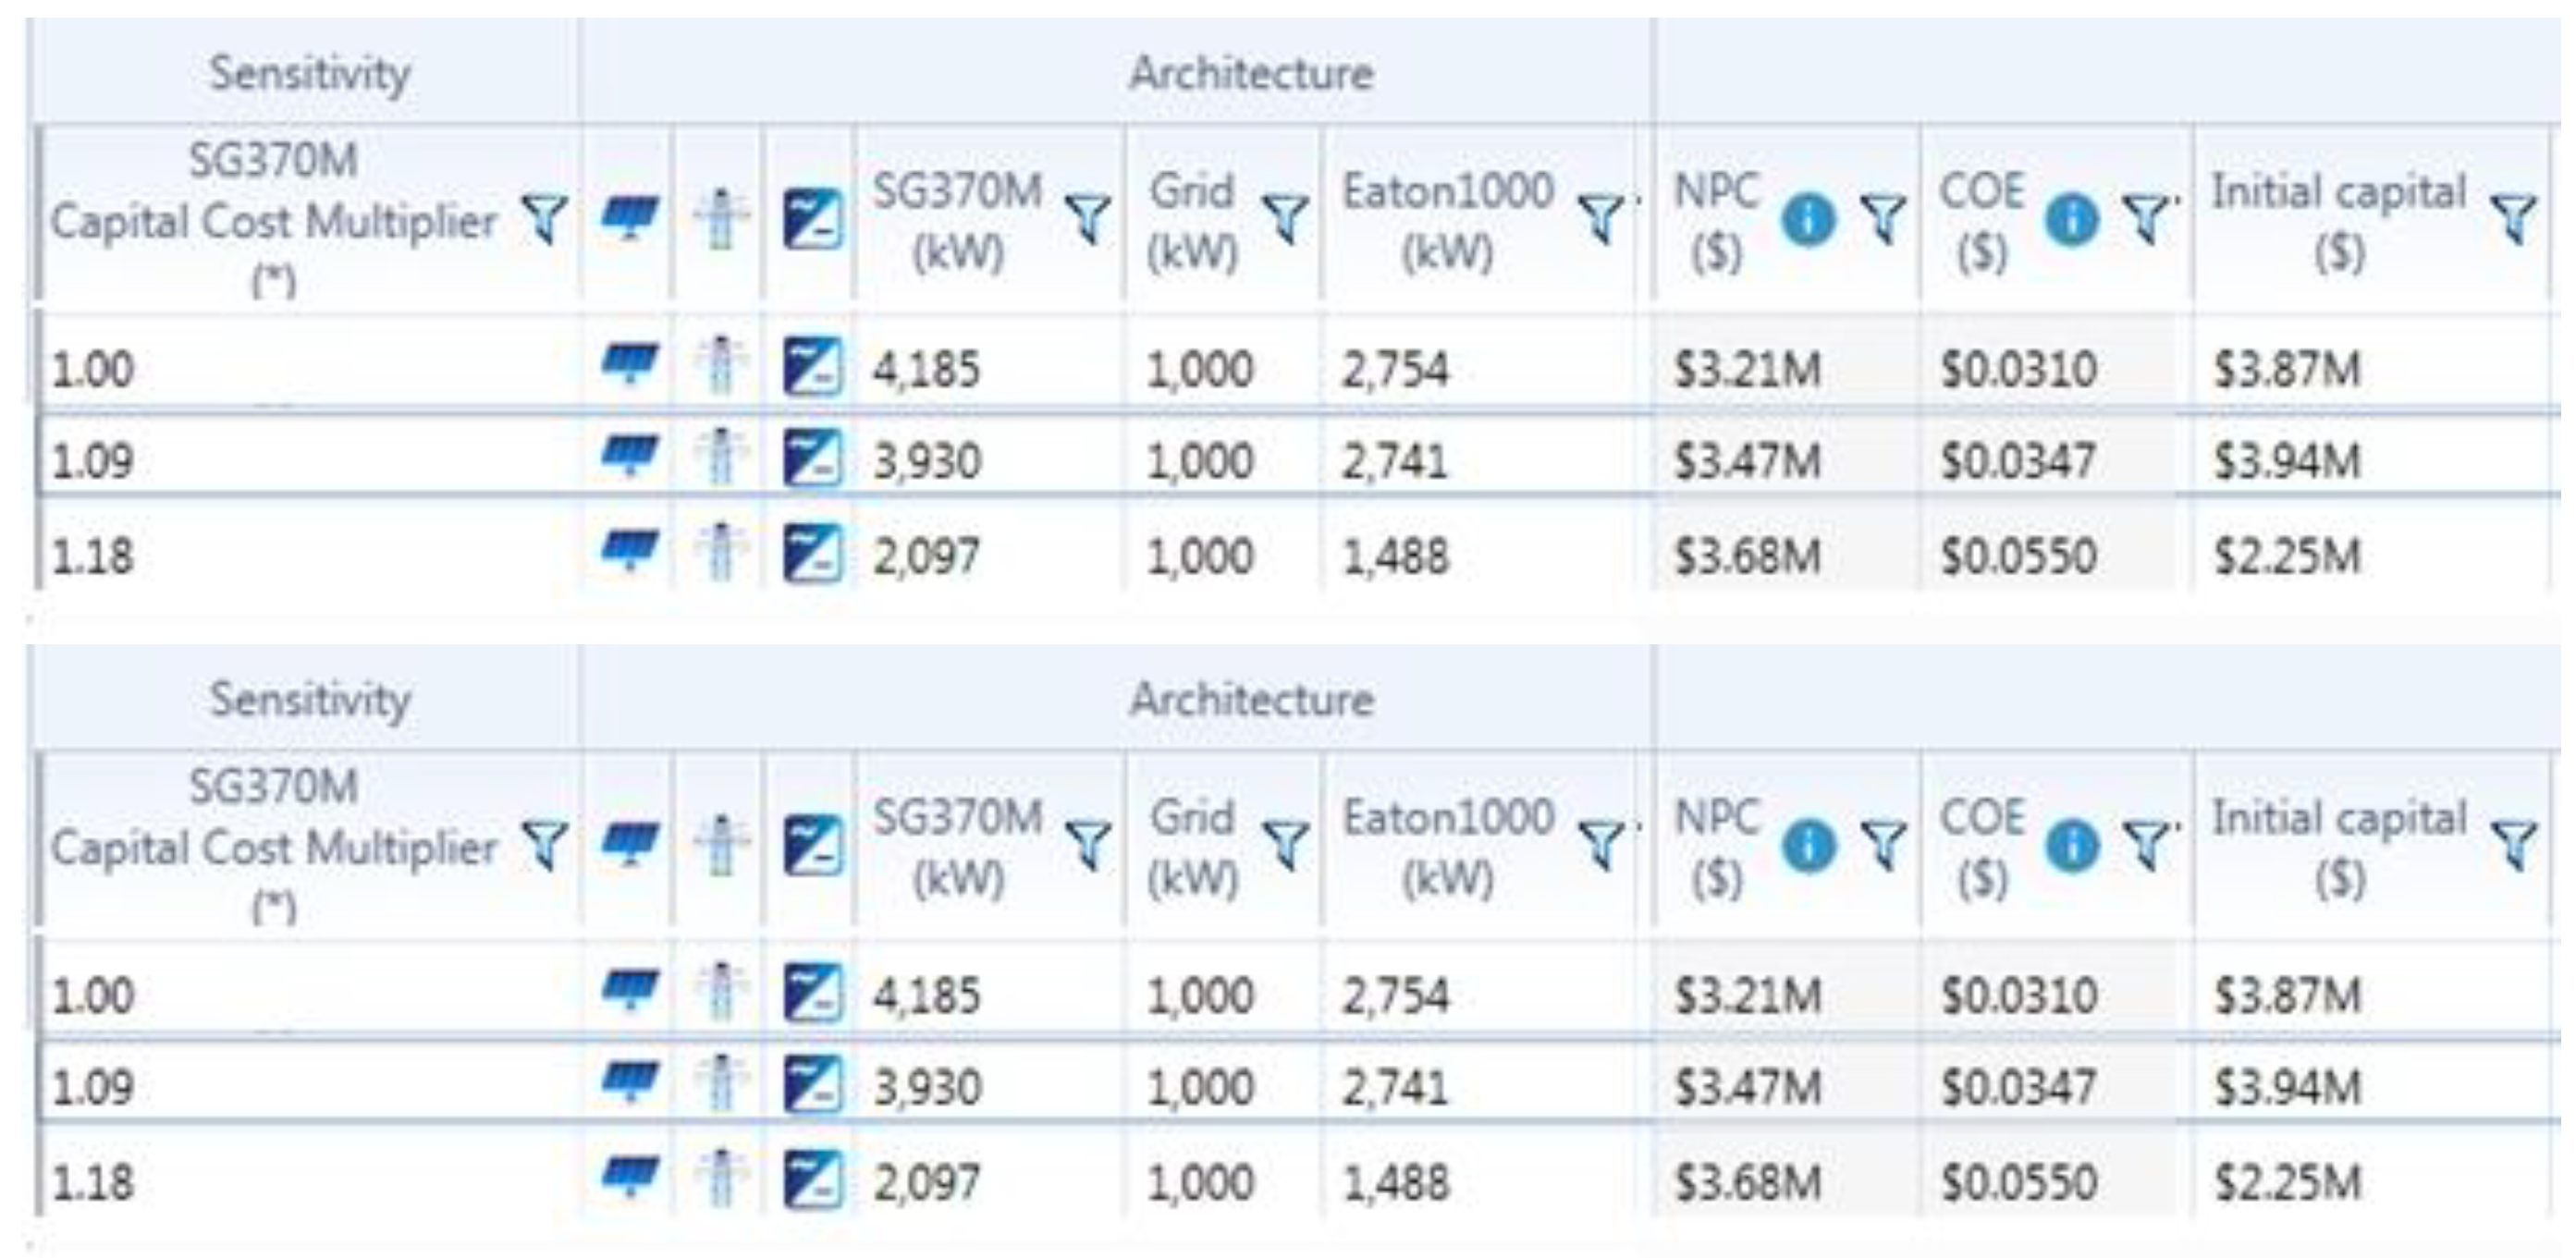
4.2. NPC and LCOE
- ▪
- The NPC and LCOE varied in direct proportion to the percentage PV price increases;
- ▪
- Hikes in PV prices affected the NPC and LCOE of the proposed FSPV–grid system directly, due to which the initial capital cost and other operating costs changed, reflecting the change in NPC and LCOE;
- ▪
- In comparison to the grid-only system, the NPC dropped to 27% with the FSPV–grid system for the nominal price (1%), 21.1% with the FSPV–grid system for the 9% hike and 16.36% with the FSPV–grid system for an 18% price increase;
- ▪
- The LCOE fell to 69% with the FSPV–grid system for the nominal price (1%), 65.3% with the FSPV–grid system for the 9% hike and 45% with the FSPV–grid system for an 18% price increase.
| System | FSPV Price Hike (%) | Initial Capital (USD) | Total NPC (USD) | Decrease in NPC (%) | LCOE (USD/kWh) | Decrease in LCOE (%) |
|---|---|---|---|---|---|---|
| Grid-only | NA | NA | 4.40 M | 0 | 0.1000 | 0 |
| FSPV–grid | 1 | 3.87 M | 3.21 M | 27 | 0.0310 | 69 |
| FSPV–grid | 1.09 | 3.94 M | 3.47 M | 21.1 | 0.0347 | 65.3 |
| FSPV–grid | 1.18 | 2.25 M | 3.68 M | 16.36 | 0.0550 | 45 |

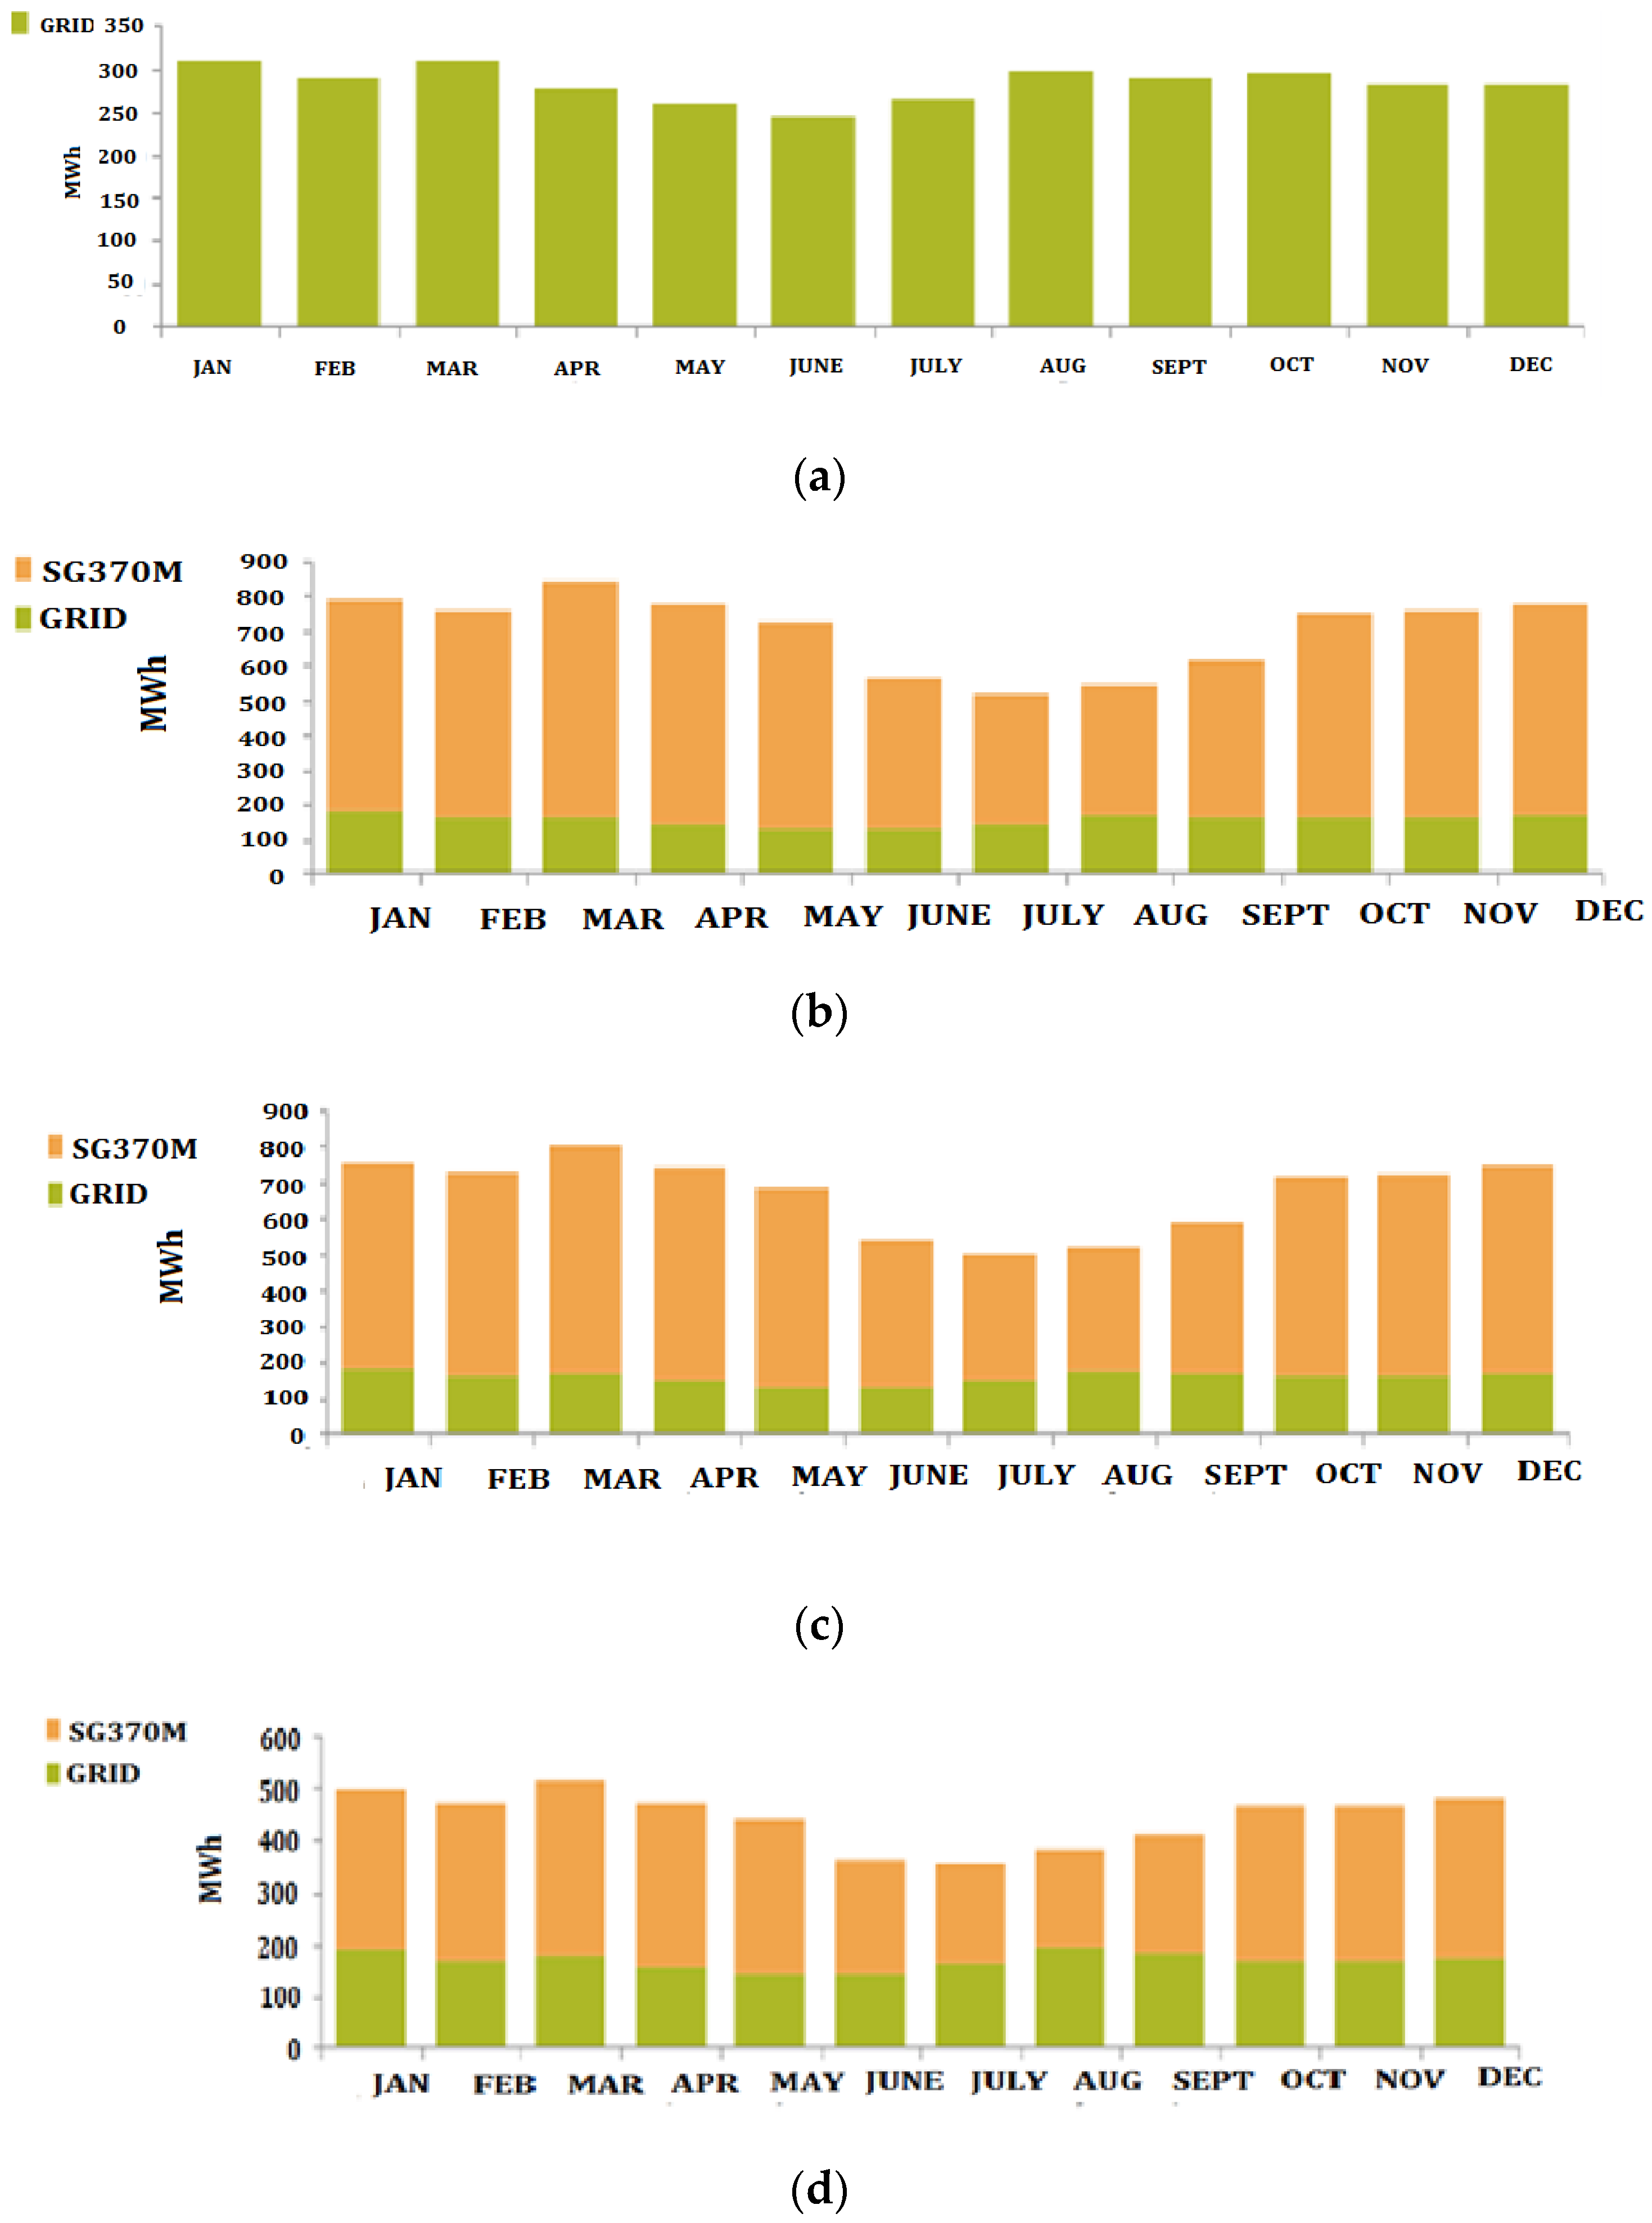
4.3. Production Summary
- ▪
- The most feasible combination of plant loads was the FSPV–grid system with nominal 1% pricing, for which 76.6% was contributed by the FSPV and 22.3% by the grid;
- ▪
- As the percentage price increases, production proportions also change: 75.6% FSPV + 23.5% grid for the 9% price hike and 60.7% + 38.2% grid for the 18% PV price hike;
- ▪
- As optimized by HOMER Pro, the proportions of the FSPV and grid generation systems varied directly with the kW rating of the FSPV and converter system used;
- ▪
- The FSPV rating was reduced to 2097 kW from 4185 kW to obtain a feasible solution with increasing PV prices and, similarly, the converter ratings were also reduced to 1488 kW from 2754 KW, respectively, to support the FSPV ratings.
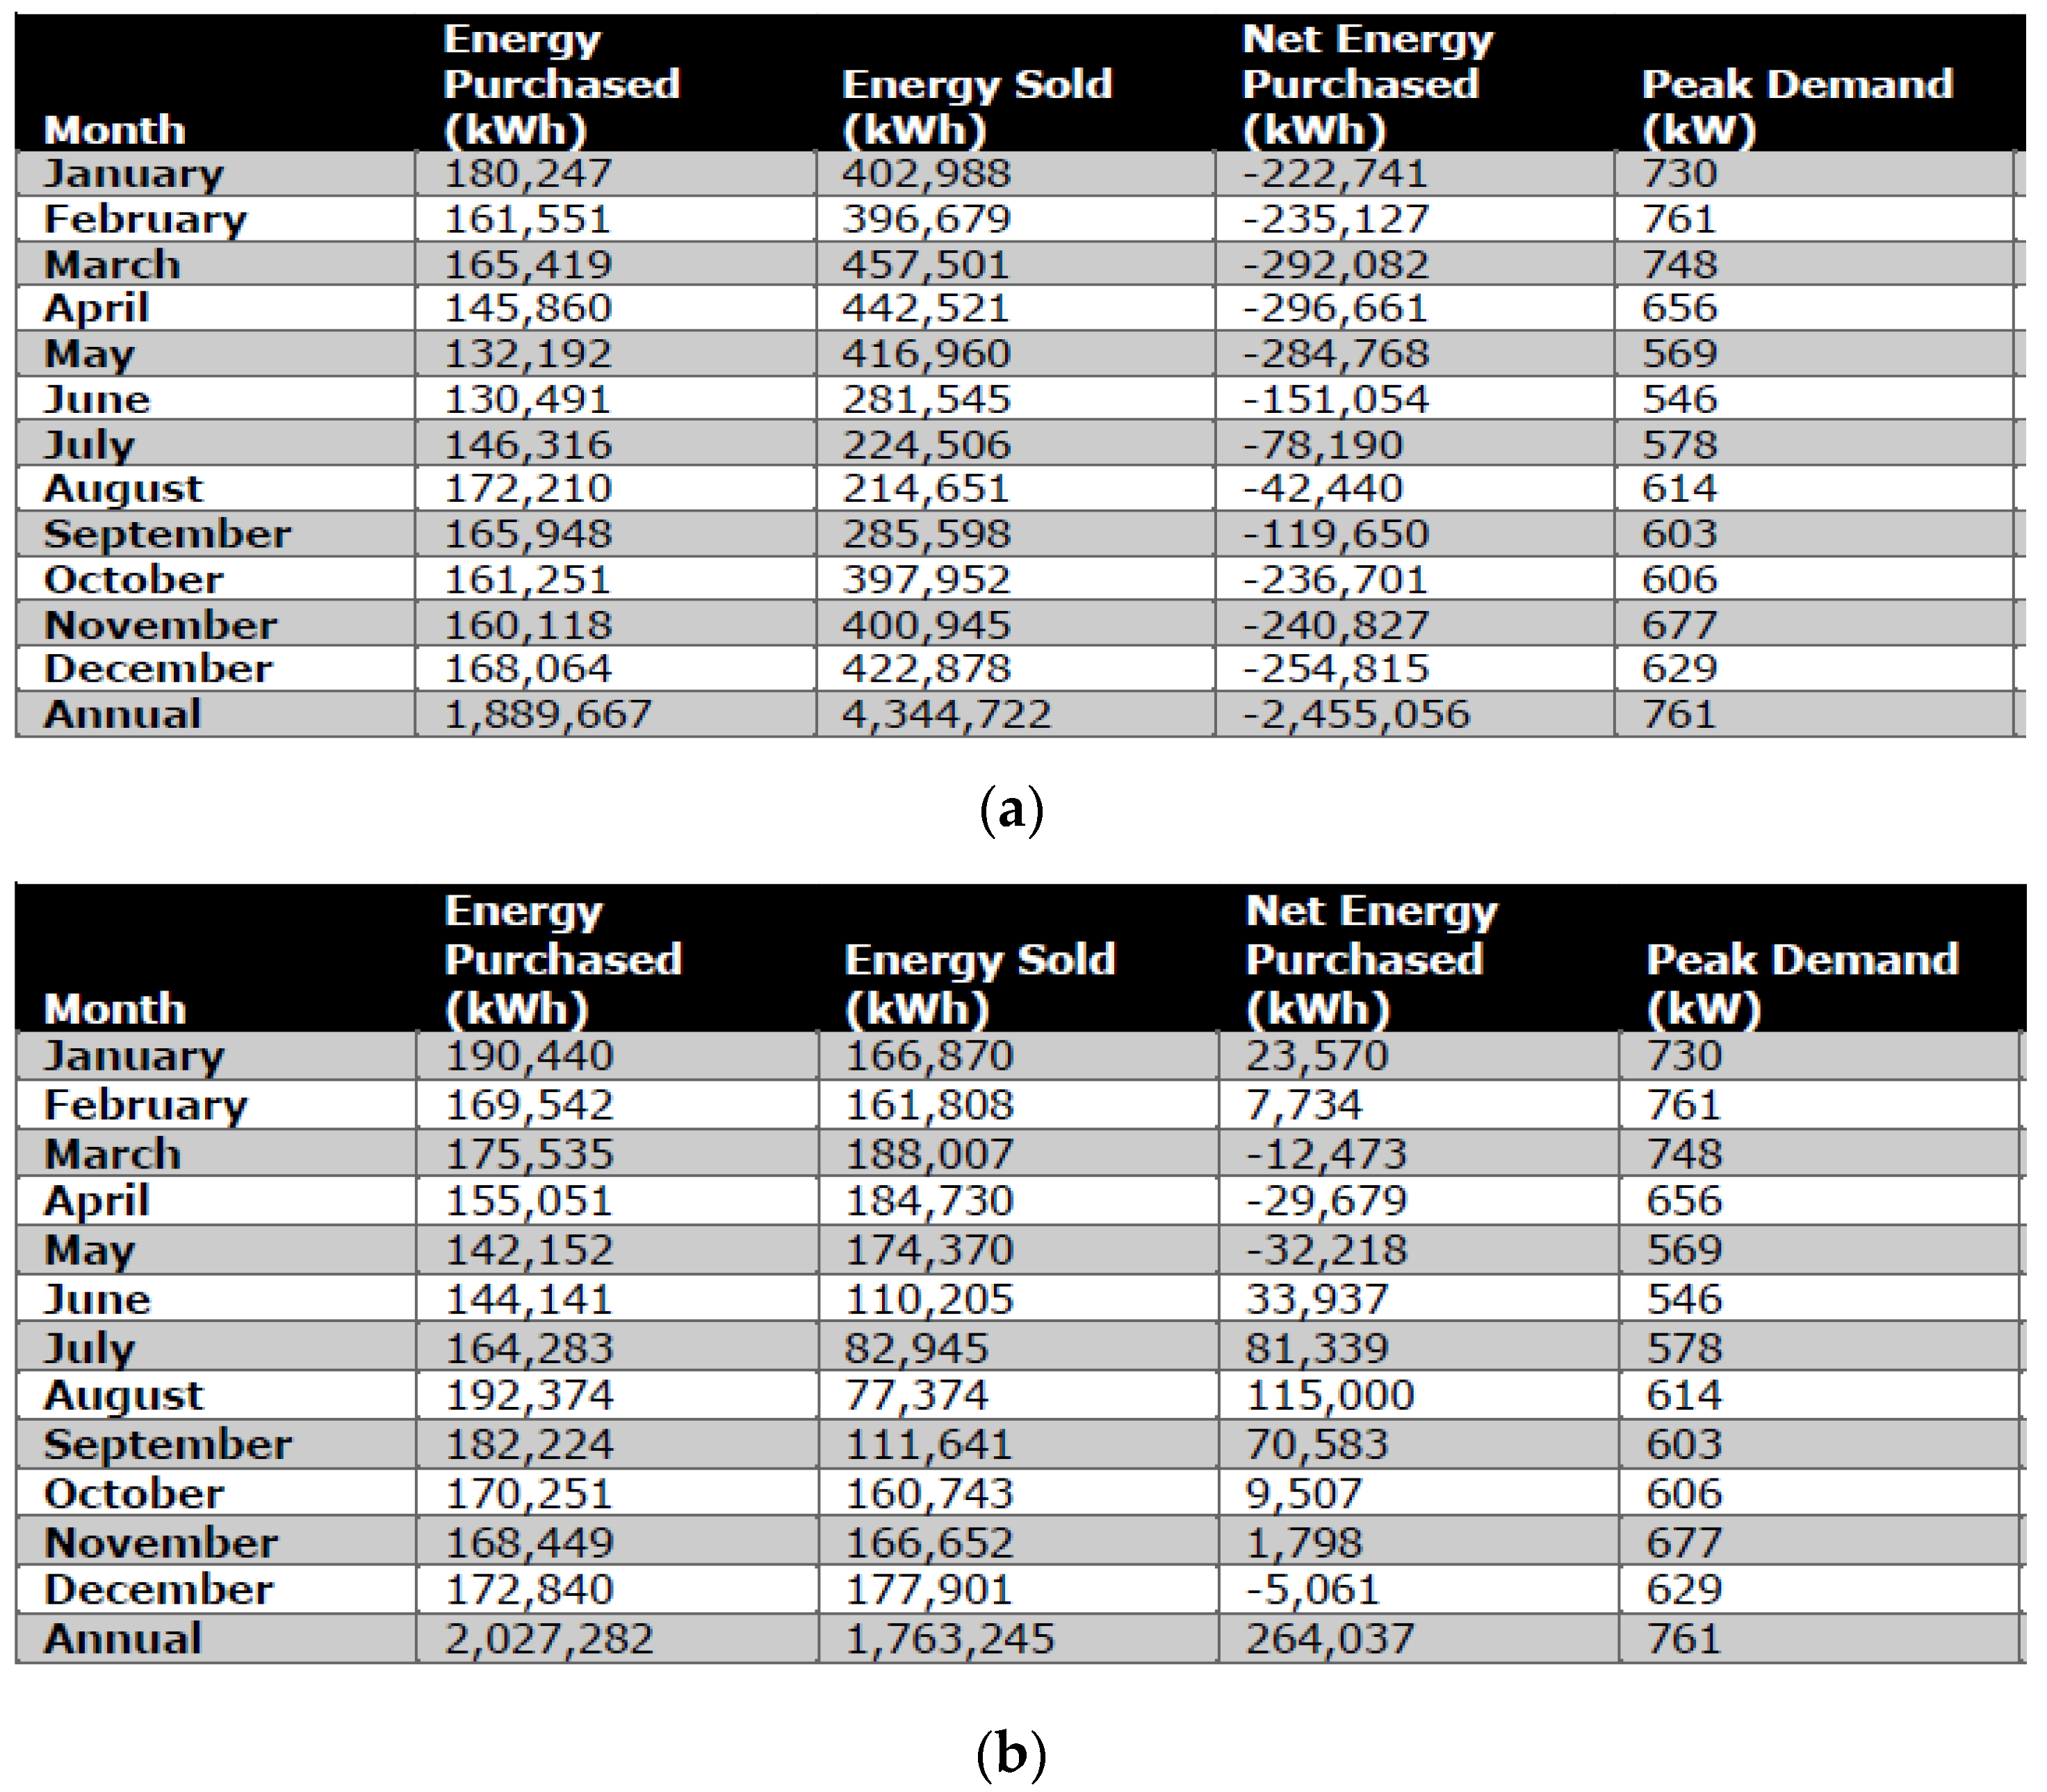
4.4. Grid Purchase/Sell
4.5. ROI, IRR and Paybacks
- ▪
- The ROI ultimately remained the same;
- ▪
- The IRR reached 9.0% from 8.8%;
- ▪
- The discounted payback time increased from 15.81 years to 17.37 years and then decreased to 15.44 years due to a change in the production proportions in the FSPV and grid system;
- ▪
- The simple payback time increased from 10.11 years to 10.70 years and then decreased to 9.77 years due to a change in the production proportions in the FSPV and grid system.
| System | FSPV Price Hike (%) | IRR (%) | ROI (%) | Simple Payback (year) | Discounted Payback (year) |
|---|---|---|---|---|---|
| Grid-only | Not Applicable | Not Applicable | Not Applicable | Not Applicable | Not Applicable |
| FSPV–grid | 1 | 8.8 | 6.4 | 10.11 | 15.81 |
| FSPV–grid | 1.09 | 8.2 | 5.8 | 10.70 | 17.37 |
| FSPV–grid | 1.18 | 9.0 | 6.4 | 9.97 | 15.44 |
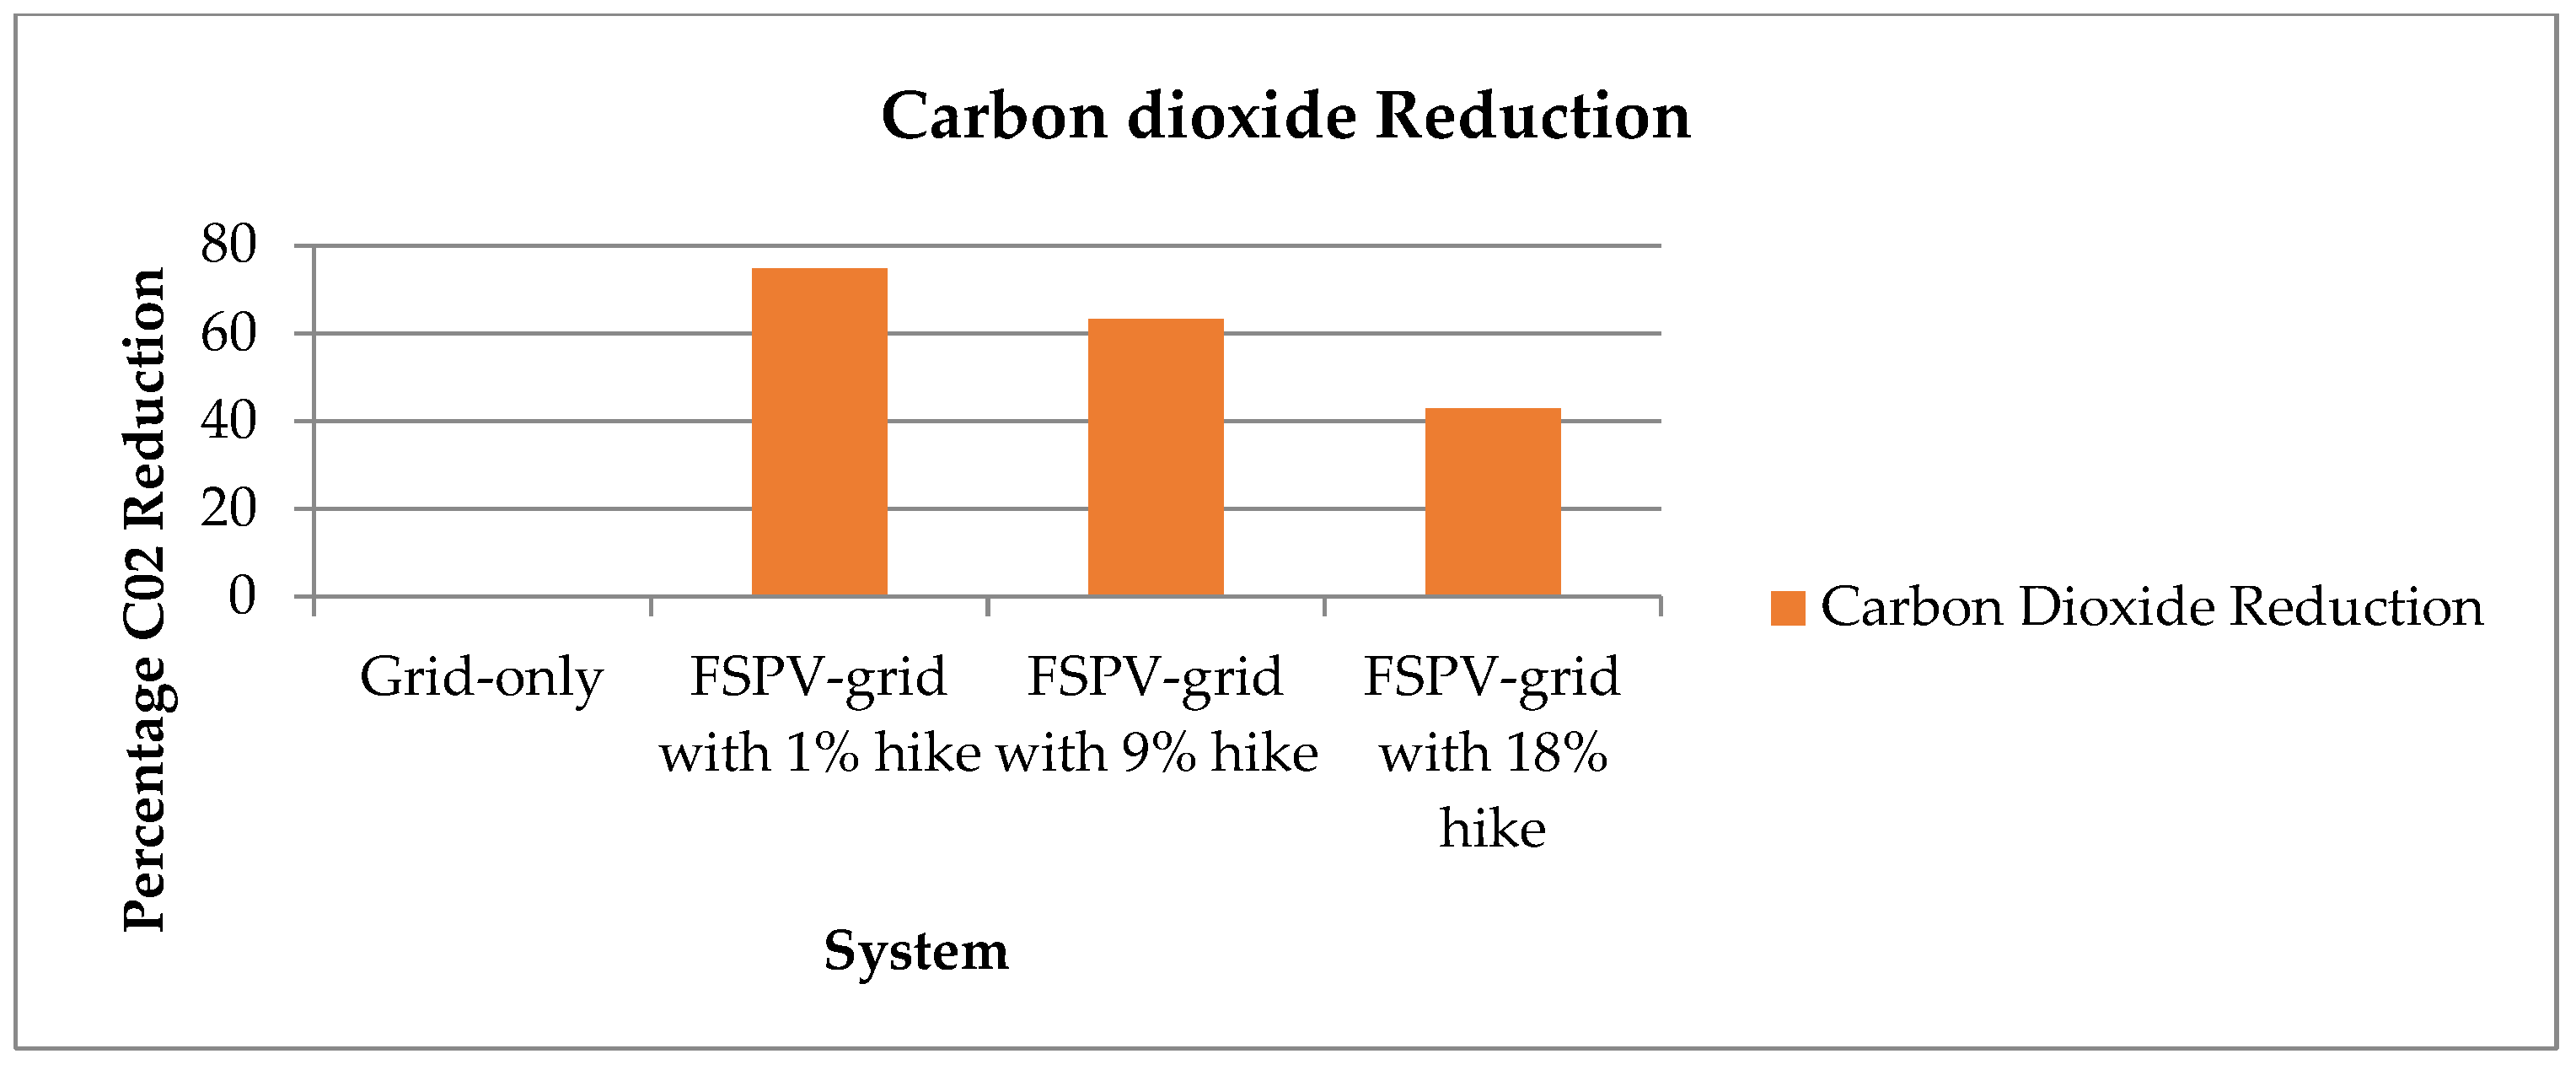
4.6. Pollutant Emissions
- ▪
- Pollutant emissions, such as carbon dioxide, sulphur dioxide and nitrogen dioxide, were high in the case of the grid-only system;
- ▪
- In the case of the FSPV–grid system:
- Carbon dioxide was reduced by 74.8% for 1%, 63.4% for 9% and 42.9% for 18% increases in PV prices, as shown in Figure 11;
- Sulphur dioxide was reduced by 44.76% for 1%, 42.4% for 9% and 33.3% for 18% increases in PV prices;
- Nitrogen oxides were reduced by 54.3% for 1%, 51.9% for 9% and 38.3% for 18% increases in PV prices.
| System | FSPV Price Hike (%) | Carbon Dioxide (kg/year) | Sulphur Dioxides (kg/year) | Nitrogen Oxides (kg/year) | Decrease in Carbon Dioxide (%) | Decrease in Sulphur Dioxide (%) | Decrease in Nitrogen Oxides (%) |
|---|---|---|---|---|---|---|---|
| Grid-only | Not Applicable | 2,149,681 | 9320 | 4558 | 0 | 0 | 0 |
| FSPV–grid | 1 | 1,187,451 | 5148 | 2518 | 74.8 | 44.76 | 54.3 |
| FSPV–grid | 1.09 | 1,194,269 | 5178 | 2532 | 63.4 | 42.4 | 51.9 |
| FSPV–grid | 1.18 | 1,281,242 | 5555 | 2717 | 41.9 | 33.3 | 38.3 |

5. Conclusions
- ▪
- Maroda Reservoir-1 and Maroda Reservoir-2, with areas of 2 km2 and 6.5 km2, respectively, have sufficient potential to meet the power requirements of the abovementioned BSP industrial sections;
- ▪
- Theoretically, 100 MW and 325 MW of maximum power could be drawn using an FSPV installation with 100% coverage. However, when the optimized results of HOMER Pro were evaluated, they showed that for an FSPV–grid system with a rating of 4185 kW and a 1% PV price increase, an area of 83 km2 would be required, while an area of 78 km2 would be required for an FSPV–grid system with a rating of 3930 kW and a9% PV price increase and an area of 41 km2 area would be required for an FSPV–grid system with a rating of 2097 kW and an 18% PV price increase;
- ▪
- The above areas for the FSPV installation calculated based on HOMER Pro results could be taken from either reservoir;
- ▪
- The NPC and LCOE were found to be proportional to the percentage increase in the PV price;
- ▪
- The proportion of FSPV and grid generation, as optimized by HOMER Pro, varied directly with the kW rating of the FSPV and converter system used;
- ▪
- The amount of energy purchased from the grid and sold back to it varied with the proportions of the FSPV–grid contributions, which changed as a result of PV price increases;
- ▪
- The ROI ultimately remained constant, while the IRR rose due to changes in the production proportions of the FSPV and grid systems. The discounted payback time and simple payback time rose with PV price increases;
- ▪
- Pollutant emissions, such as carbon dioxide, sulphur dioxide and nitrogen dioxide, were high with the grid-only system, whereas they were significantly reduced in the case of the FSPV–grid system.
Author Contributions
Funding
Institutional Review Board Statement
Informed Consent Statement
Data Availability Statement
Conflicts of Interest
References
- Campana, P.E.; Wasthage, L.; Nookuea, W.; Tan, Y.; Yan, J. Optimization and Assessment of Floating and Floating-Tracking PV Systems Integrated in On- and Off-Grid Hybrid Energy Systems. Sol. Energy 2019, 177, 782–795. [Google Scholar] [CrossRef]
- Mayville, P.; Patil, N.V.; Pearce, J.M. Distributed Manufacturing of After Market Flexible Floating Photovoltaic Modules. Sustain. Energy Technol. Assess. 2020, 42, 100830. [Google Scholar] [CrossRef]
- Junianto, B.; Dewi, T.; Carlos, R.; Sitompul, C.R. Development and Feasibility Analysis of Floating Solar Panel Application in Palembang, South Sumatra. J. Phys. Conf. Ser. 2020, 1500, 012016. [Google Scholar] [CrossRef]
- Sheikh, Y.A.; Butt, A.D.; Paracha, K.N.; Awan, A.B.; Bhatti, A.R.; Zubair, M. An Improved Cooling System Design to Enhance Energy Efficiency of Floating Photovoltaic Systems. J. Renew. Sustain. Energy 2020, 12, 053502. [Google Scholar] [CrossRef]
- Belhadi, A.; Djenouri, Y.; Srivastava, G.; Jolfaei, A.; Lin, J.C. Privacy reinforcement learning for faults detection in the smart grid. Ad Hoc Netw. 2021, 119, 122. [Google Scholar] [CrossRef]
- Tariq, M.; Adnan, M.; Srivastava, G.; Poor, H.V. Instability detection and prevention in smart grids under asymmetric faults. IEEE Trans. Ind. Appl. 2020, 56, 4510–4520. [Google Scholar] [CrossRef]
- Choi. Y., K. Empirical Research on the efficiency of Floating PV systems compared with Overland PV System. In Proceedings of the 3rd International Conference on Circuits, Control, Communication, Electricity, Electronics, Energy, System, Signal and Simulation (CES-CUBE 2013), Guam, USA, 18–20 July 2013. [Google Scholar]
- Available online: https://www.google.co.in/search?q=Solar+Energy+Industries+Association+and+Wood+Mackenzie&sxsrf=ALiCzsZQi-LxeNa7rccx3Oxk0poszByvKw%3A1667400496859&source=hp&ei=MINiY5ujMcOB2roP67-2As&iflsig=AJiK0e8AAAAAY2KRQM1uKLJCDrqg7QnaWg7LkIEQ-tDr&ved=0ahUKEwib-73y3o_7AhXDgFYBHeufCbsQ4dUDCAg&uact=5&oq=Solar+Energy+Industries+Association+and+Wood+Mackenzie&gs_lp=Egdnd3Mtd2l6uAED-AEC-AEBMgUQABiABDIFEAAYgAQyBRAAGIYDMgUQABiGA0jfCVAAWABwAHgAyAEAkAEAmAHAAaABwAGqAQMwLjE&sclient=gws-wiz (accessed on 15 January 2023).
- Farfan, J.; Breyer, C. Combining Floating Solar Photovoltaic Power Plants and Hydropower Reservoirs a Virtual Battery of Great Global Potential. Energy Procedia 2018, 155, 403–411. [Google Scholar] [CrossRef]
- Mohiddin, M.K.; Dutt, V.B.S.S.I. Routing Path Estimation Based on RWS Method for Competent Energy Dissipation Employing X-Layer Network. Int. J. Recent Technol. Eng. 2019, 8, 6296–6303. [Google Scholar] [CrossRef]
- Makhija, S.P.; Dubey, S.P. Optimally Sized Hybrid Energy System for Auxiliaries of a Cement Manufacturing Unit with Diesel Fuel Price Sensitivity Analysis. Int. J. Ambient. Energy 2016, 38, 267–272. [Google Scholar] [CrossRef]
- Ryu, J.H.; Lee, S.B.; Hodge, B.M.; Lee, I.B. Techno-Economic Simulation Approach in Preparation of Employing Renewable Energies for Process Industry. In Proceedings of the IEEE 43rd Conference on Photovoltaic Specialist, Portland, OR, USA, 5–10 June 2016; pp. 1862–1864. [Google Scholar]
- Siddiquee, S.M.S.; Alam, M.S.; Mortuza, M.K.I.; Reza, H.; Arafat, M.A. Optimized Hybrid Renewable Energy System for Efficient Industrial Electrification. In Proceedings of the IEEE 2nd International Conference on Electrical Engineering and Information & Communication Technology, Dhaka, Bangladesh, 21–23 May 2015; pp. 1–5. [Google Scholar]
- Mishra, R.; Ralhan, S.; Mohiddin, M.K. A Review on Frequency Stability Enhancement and Effective Energy Storage through Various Optimization Techniques. Mob. Inf. Syst. 2022, 2022, 4170938. [Google Scholar] [CrossRef]
- Trapani, K.; Santafe, M.R. A Review of Floating Photovoltaic Installations: 2007–2013. Prog. Photovolt. Res. Appl. 2015, 23, 524–532. [Google Scholar] [CrossRef]
- Sahu, A.; Yadav, N.; Sudhakar, K. Floating Photovoltaic Power Plant: A Review. Renew. Sustain. Energy Rev. 2016, 66, 815–824. [Google Scholar] [CrossRef]
- Pinto, O.S.; Stokkermans, J. Assessment of the potential of different floating solar technologies—Overview and analysis of different case studies. Energy Convers. Manag. 2020, 211, 112747. [Google Scholar] [CrossRef]
- Rosa, C.M.; Tina, G.M. Submerged and Floating Photovoltaic Systems; Academic Press: Boston, MA, USA, 2018; pp. 89–136. [Google Scholar]
- Choi, Y.K. A study on power generation analysis of floating PV system considering environmental impact. Int. J. Softw. Eng. Its Appl. 2014, 8, 75–84. [Google Scholar] [CrossRef]
- Shukla, A.; Shukla, S.P.; Chacko, S.T.; Mohiddin, M.; Fante, K.A. Monitoring of Single-Phase Induction Motor through IoT Using ESP32 Module. J. Sens. 2022, 2022, 8933442. [Google Scholar] [CrossRef]
- Rosa, C.M.; Tina, G.M.; Nizetic, S. Floating photovoltaic plants and wastewater basins: An Australian project. Energy Procedia 2017, 134, 664–674. [Google Scholar] [CrossRef]
- Choi, J.S. Analysis of the Potential for Use of Floating Photovoltaic Systems on Mine Pit Lakes: Case Study at the Ssangyong Open-Pit Limestone Mine in Korea. Energies 2016, 9, 102. [Google Scholar]
- Liu, L.; Wanga, Q.; Lina, H.; Lib, H.; Suna, Q.; Wennerstena, R. Power Generation Efficiency and Prospects of Floating Photovoltaic Systems. In Proceedings of the 8th International Conference on Applied Energy (ICAE2016), Beijing, China, 8–11 October 2016; pp. 1136–1142. [Google Scholar]
- Gisbert, F.C.; Gozalvez, J.J.F.; Santafe, R.M. A new photovoltaic floating cover system for water reservoirs. Renew. Energy 2013, 60, 63–70. [Google Scholar] [CrossRef]
- Green, M.; Emery, K.; Hishikawa, Y. Solar cell efficiency tables (version 40). IEEE Trans. Fuzzy Syst. 2012, 20, 1114–1129. [Google Scholar] [CrossRef]
- Aryani, D.R.; Khairurraziq, T.A.; Ramadhan, G.R.; Wardana, N.S.; Husnayain, F.; Garniwa, I. Simulation of Stand-Alone Floating Photovoltaic and Battery Systems. IOP Conf. Ser. Mater. Sci. Eng. 2019, 673, 012059. [Google Scholar] [CrossRef]
- Rizvi, T.; Dubey, S.P.; Tripathi, N. Designing of a Feasible Low Pollutant Grid Integrated System for Steel Plant. CSVTU Res. J. 2022, 10, 144–154. [Google Scholar] [CrossRef]
- Zhou, Y.; Chang, F.J.; Chang, L.C.; Lee, W.D.; Huang, A.; Xu, C.Y.; Guo, S. An Advanced Complementary Scheme of Floating Photovoltaic and Hydropower Generation Flourishing Water-Food-Energy Nexus Synergies. Appl. Energy 2020, 275, 115389. [Google Scholar] [CrossRef]
- Lee, N.; Grunwald, U.; Rosenlieb, E.; Mirletz, H.; Aznar, A.; Spencer, R.; Cox, S. Hybrid Floating Solar Photovoltaics-Hydropower Systems Benefits and Global Assessment of Technical Potential. Renew. Energy 2020, 162, 1415–1427. [Google Scholar] [CrossRef]
- Verma, S.; Verma, H.K.; Mohiddin, M.K. Modeling & Analysis of Standalone Photovoltaic System. Int. J. Res. Eng. Technol. 2013, 2, 259–265. [Google Scholar]
- Rizvi, T.; Dubey, S.P.; Tripathi, N. A Comparative Analysis of FSPV-Grid and Grid-Only Systems for an Industrial Subsection. In Proceedings of the IEEE Sponsored Second International Conference on Advances in Electrical, Computing, Communications and Sustainable Technologies (ICAECT 2022), Bhilai, India, 21–22 April 2022. [Google Scholar]
- Rizvi, T.; Dubey, S.P.; Tripathi, N. Reconceptualizing the Application of Renewable Energy Sources in Industry: A Review. Int. Res. J. Eng. Technol. 2022, 9, 514–518. [Google Scholar]
- Nirmal, S.; Rizvi, T. A Review of Renewable Energy Systems for Industrial Applications. Int. J. Res. Appl. Sci. Eng. Technol. 2022, 10, 1740–1745. [Google Scholar] [CrossRef]
- Available online: https://www.psuconnect.in/news/sail-bsp-producing-265-tonnes-of-medcal-oxygen-per-day-24-supply-of-2410-metric-tons-to-chhattisgarh/27461 (accessed on 11 April 2022).
- Sharma, A.K.; Kothari, D.P. Floating Solar Pv Potential In Large Reservoirs In India. Int. J. Innov. Res. Sci. Technol. 2016, 2, 5. [Google Scholar]


| Parameter | Maroda Reservoir-1 | Maroda Reservoir-2 |
|---|---|---|
| Surface area | 2 km2 | 6.5 km2 |
| Maximum depth | 4 m | 8 m |
| Average depth | 4 m | 5 m |
| % Coverage | Maroda Reservoir-1 | Maroda Reservoir-2 |
|---|---|---|
| FSPV Rating (MW) | FSPV Rating (MW) | |
| 20 | 20 | 65 |
| 50 | 50 | 162.5 |
| 80 | 80 | 260 |
| 100 | 100 | 325 |
| System | FSPV Price Hike (%) | FSPV (kW) | Converter (kW) | Renewable Fraction (%) | Grid Fraction (%) |
|---|---|---|---|---|---|
| Grid-only | Not Applicable | Not Applicable | Not Applicable | Not Applicable | 100 |
| FSPV–grid | 1 | 4185 | 2754 | 76.6 | 22.3 |
| FSPV–grid | 1.09 | 3930 | 2741 | 75.6 | 23.5 |
| FSPV–grid | 1.18 | 2097 | 1488 | 60.7 | 38.2 |
| System | FSPV Price Hike (%) | Grid Energy Purchased (kWh) | Grid Energy Sold (kWh) | Grid Energy Purchased (%) |
|---|---|---|---|---|
| Grid-only | NA | 3,401,394 | NA | 100 |
| FSPV–grid | 1 | 2,642,883 | 4,616,014 | 22.3 |
| FSPV–grid | 1.09 | 2,602,066 | 4,344,722 | 23.5 |
| FSPV–grid | 1.18 | 2,102,061 | 1,763,246 | 38.2 |
Disclaimer/Publisher’s Note: The statements, opinions and data contained in all publications are solely those of the individual author(s) and contributor(s) and not of MDPI and/or the editor(s). MDPI and/or the editor(s) disclaim responsibility for any injury to people or property resulting from any ideas, methods, instructions or products referred to in the content. |
© 2023 by the authors. Licensee MDPI, Basel, Switzerland. This article is an open access article distributed under the terms and conditions of the Creative Commons Attribution (CC BY) license (https://creativecommons.org/licenses/by/4.0/).
Share and Cite
Rizvi, T.; Dubey, S.P.; Tripathi, N.; Srivastava, G.; Makhija, S.P.; Mohiddin, M.K. FSPV-Grid System for an Industrial Subsection with PV Price Sensitivity Analysis. Sustainability 2023, 15, 2495. https://doi.org/10.3390/su15032495
Rizvi T, Dubey SP, Tripathi N, Srivastava G, Makhija SP, Mohiddin MK. FSPV-Grid System for an Industrial Subsection with PV Price Sensitivity Analysis. Sustainability. 2023; 15(3):2495. https://doi.org/10.3390/su15032495
Chicago/Turabian StyleRizvi, Tanu, Satya Prakash Dubey, Nagendra Tripathi, Gautam Srivastava, Satya Prakash Makhija, and Md. Khaja Mohiddin. 2023. "FSPV-Grid System for an Industrial Subsection with PV Price Sensitivity Analysis" Sustainability 15, no. 3: 2495. https://doi.org/10.3390/su15032495
APA StyleRizvi, T., Dubey, S. P., Tripathi, N., Srivastava, G., Makhija, S. P., & Mohiddin, M. K. (2023). FSPV-Grid System for an Industrial Subsection with PV Price Sensitivity Analysis. Sustainability, 15(3), 2495. https://doi.org/10.3390/su15032495