1. Introduction
Agriculture has a major role in the overall growth of a country. The losses in the agriculture sector affect the GDP (Gross Domestic Product) of the country [
1]. These losses can be caused by various infections, parasitic and non-parasitic. These infections degrade the growth of the plant and lead to a reduction in the yield. The exponential increase in population pressures the agriculture sector to increase production for the fulfillment of the constantly increasing demand. This mandates the development of a system that detects disease early and predicts the severity of the disease. This helps farmers to decide on the treatment of the infection that ultimately diminishes the losses in the yield of the crop.
Rice is a primary food for around half of the world [
2]. It fulfills 20–30% of the daily calorie needs. There are various categories of illness in rice plants. Based on the cause of the illness, it can be categorized as biotic or abiotic. Biotic infections are caused by pathogens such as fungi, weeds, pests, viruses, and bacteria [
3] whereas abiotic illnesses are caused by environmental conditions. Rice blast [
4] is a fungal disease that affects the leaves of the rice plant. It is considered the most devastating disease of rice because of its extensive distribution and destructiveness. Early prediction of its severity with a precise knowledge of the level of severity is a crucial task with numerous consequences, including reduced losses caused by the infection, estimating treatment resources, and supporting farmers’ policymaking. During this critical period, with the increase in losses due to various plant diseases around the world and increasing dependency of the country’s GDP on the agriculture sector, there is a need for an efficient and precise severity categorization model [
5].
Deep learning is a field of machine learning in which the machine is trained to gain certain knowledge, modelled on human learning [
6]. The concept used in deep learning is similar to how a human brain works. Training in deep learning can be supervised or unsupervised. In supervised learning, the model is trained based on the input with corresponding outputs. There are various approaches based on supervised learning. CNN [
7] and SVM [
8] also use supervised learning. Deep learning has grown in popularity in recent years and has been vitally used for solving various classification problems. Extensive enhancement of computational technology makes it feasible to create a classification model working on high-performance metrics [
9]. Here, in this paper, a combined approach of CNN–SVM is applied to the cataloging of various severity stages of rice blast disease.
1.1. Contribution
This paper investigates the efficiency of the CNN–SVM ensemble classification model for categorizing four levels of severity of rice blast disease. The dataset considered in this work is taken from primary and secondary resources. The secondary resources are the standard online repositories Mendeley [
10] and GitHub [
11]. Four severity levels are finalized after discussion with rice experts. This paper also compares the accuracy of the hybrid model with the existing CNN and SVM approaches used for classification.
1.2. Outline of the Paper
The remainder of the study is organized so that the related work in the field of plant disease classification is completed in
Section 2. The methodology of the proposed novel model is discussed in
Section 3.
Section 4 describes the experimental setup.
Section 5 discusses the experiment’s findings and an assessment of the proposed model for the prevailing system.
1.3. Objectives
The objectives of the anticipated CNN–SVM fusion model are:
To use a deep learning crossbreed approach for the recognition and classification of rice blast severity.
To classify the severity levels with high accuracy.
To use a CNN and SVM hybrid model to provide a combined algorithm with product-accelerating performance.
To deliver a corpus for rice blast disease based on the level of severity.
2. Related Work
Rice leaf disease severity detection and classification has long been a problem. Many different forms of research have been conducted in this field, with positive results. This section discusses a few of these discoveries. In reference [
12], the authors proposed a hybrid classifier using CNN and LSTM (Long Short Term Memory) for the classification of three rice leaf diseases, bacterial blight, blast, and leaf smut. GAN (Generative Adversarial Networks) was used for data augmentation. The dataset was a collection of both primary and secondary data. The accuracy achieved by the classifier was 98%. In ref. [
13], the efficiency of the CNN classifier was increased by augmentation of the dataset with a GAN augmentation approach. Rice leaf infections were classified in this paper. The accuracy achieved by the classifier was 98.23%. A hybrid approach of CNN–SVM was used in [
14] for the detection of depression. The authors used the DAIC-WOZ dataset and an accuracy of 68% was achieved using the CNN–SVM hybrid model. The dataset consisted of 189 audio-video recordings. The size of the training and testing sets were 2480 and 560, respectively. Another study used CNN–SVM fusion for the recognition and cataloging of brain tumors using brain magnetic resonance imaging (MRI) [
15]. The experimental results gave a 98.49% accuracy in classifying brain tumors. The hybrid model was further compared with various classification approaches such as deep convolutional neural network (DCNN), regularized extreme learning machine (RELM), deep wavelet auto-encoder (DWA), k-nearest neighbor (KNN), and CNN.
A novel hybrid classifier [
16] was proposed for the classification of functional MRI. The authors used CNN and SVM as feature extractors and classifiers in this paper. The proposed model attained 99.5% accuracy. The data used by the authors were Haxby’s 2001 fMRI dataset. Handwritten digits were classified in ref. [
17]. A hybrid model of CNN and SVM was used with the MNIST dataset. An accuracy of 99.28% was achieved using this approach. The authors of ref. [
18] used a CNN–SVM hybrid approach for the classification of hyperspectral images. A handwritten digit classifier was implemented in ref. [
19] combining the benefits of CNN and SVM. The dataset used for model training was MNIST and an accuracy of 99.81% was achieved in classifying the digits.
Table 1 gives a summary of the literature studied with a description of the classification approach used, categories of classifier, accuracy, dataset information, and year of publication.
Reference [
24] implements a hybrid approach of CNN–SVM as a classifier. The the dataset contained 8911 images of four rice diseases: rice blast, root blight, sheath blight, and stripe blight. All diseases were plant leaf diseases. An accuracy of 96.8% was achieved using the hybrid approach of CNN and SVM. The authors of ref. [
25] utilized the qualities of both CNN and SVM for the classification of nine rice leaf diseases. The dataset was composed of 1080 images of contaminated plants. The model correctly classified the diseases with 97.5% accuracy. The authors of ref. [
26] detected rice blast with 99.2% accuracy. The dataset consisted of 3010 diseased and healthy plant leaf images.
3. Methodology
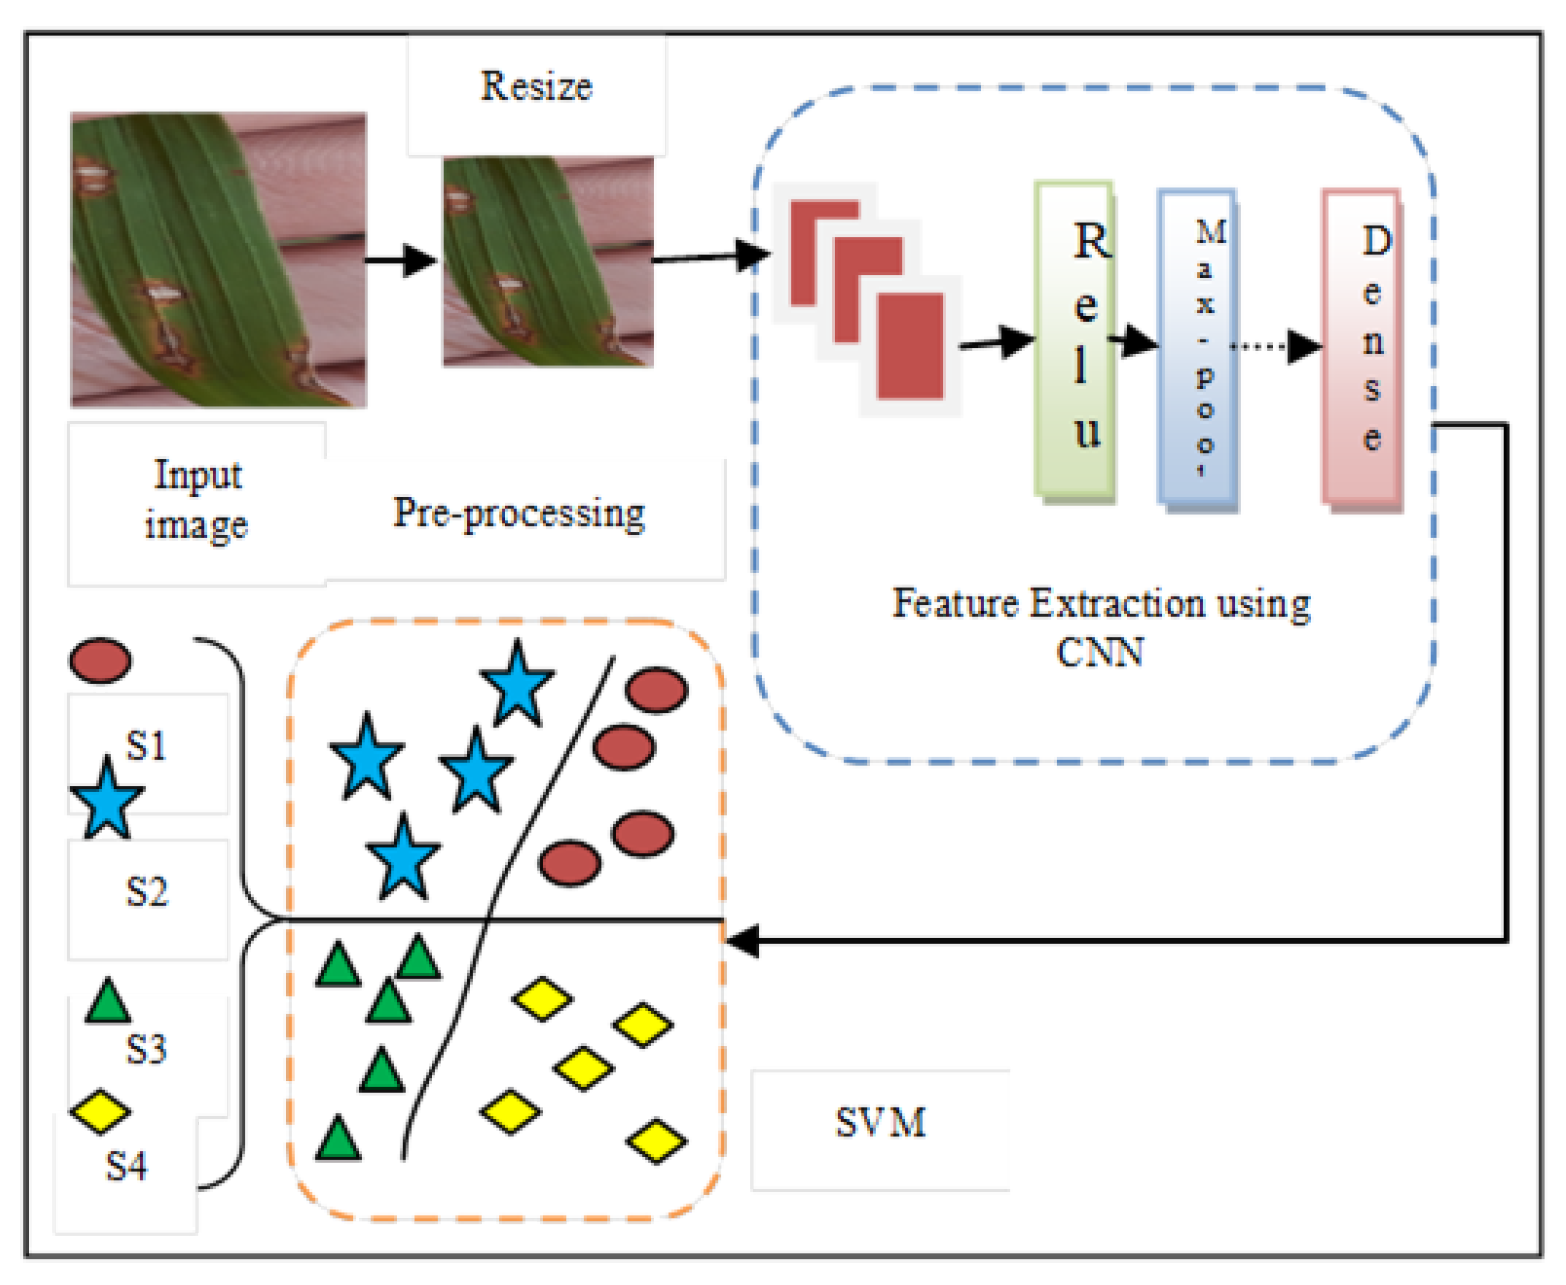
The proposed classifier for the severity levels detection of rice blast disease consists of four components, as displayed in
Figure 1. The first component aims at the assemblage and distribution of datasets based on different levels of severity of blast disease using expert knowledge. The second component comprises pre-processing and labeling of the images according to the level of severity. The dataset is then divided into testing and training datasets. The third module extracts the features from the images using the CNN approach and classifies the images using the SVM approach. The last module comprises training and then testing of the model so created.
Algorithm used for Severity Level Detection of Rice Blast Disease
Input to the model is a color image (img)
Collect data from primary and secondary resources. Data collected from primary sources are and the data collected from secondary sources are .
Distribute + among four severity levels, , , , and .
Create an entity for each class (i.e., mild, average, severe, and profound).
Replicate steps 5 to 7 for each class.
Normalize the images of the object = intensity(img).
Standardize the images of the object = resize(img) rescale(img).
Annotate all the images of the object = Label(img).
All images are in the format Stdimg =
Dataset is then split into
The model is created using 2 pairs of convolutional layers (Conv) and a max-pooling layer (max_pool), followed by a flattening layer F, and two dense layers D, where the second dense layer is the SVM layer. Proposed model:
Then the model is trained = ƒ( M, Train(+ ++ ))
Model is tested using = ƒ( , Test(+ ++ ))
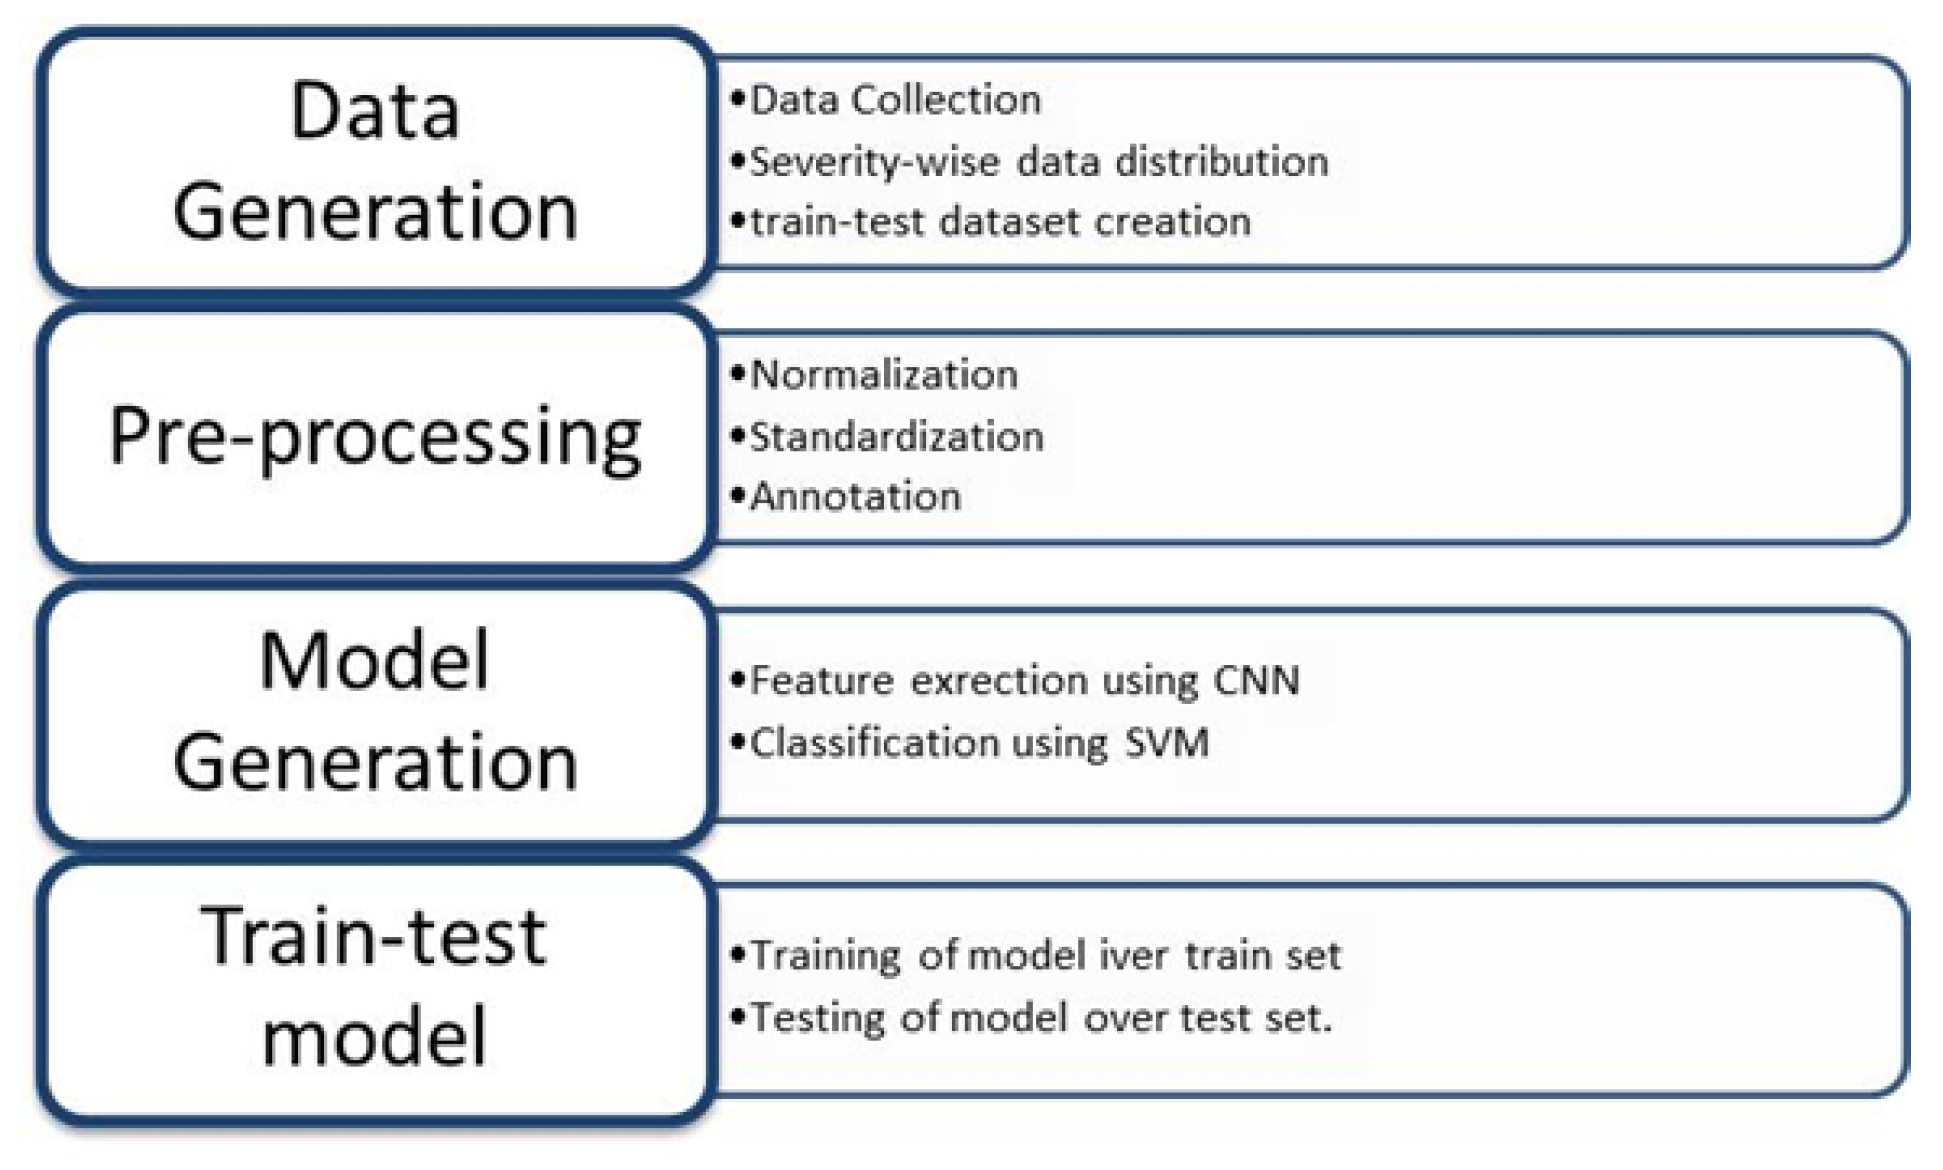
3.1. Dataset Generation
The dataset used to evaluate the proposed hybrid model consists of images from both primary and secondary resources. Primary resources are the data resources in which the data are themselves collected by the user from the field. The dataset thus generated is accurate, entirely belongs to the problem statement, and is reliable and authentic. In contrast, secondary sources are the resources in which data are collected by someone else and then published. This type of data is economic, easily available, but less reliable.
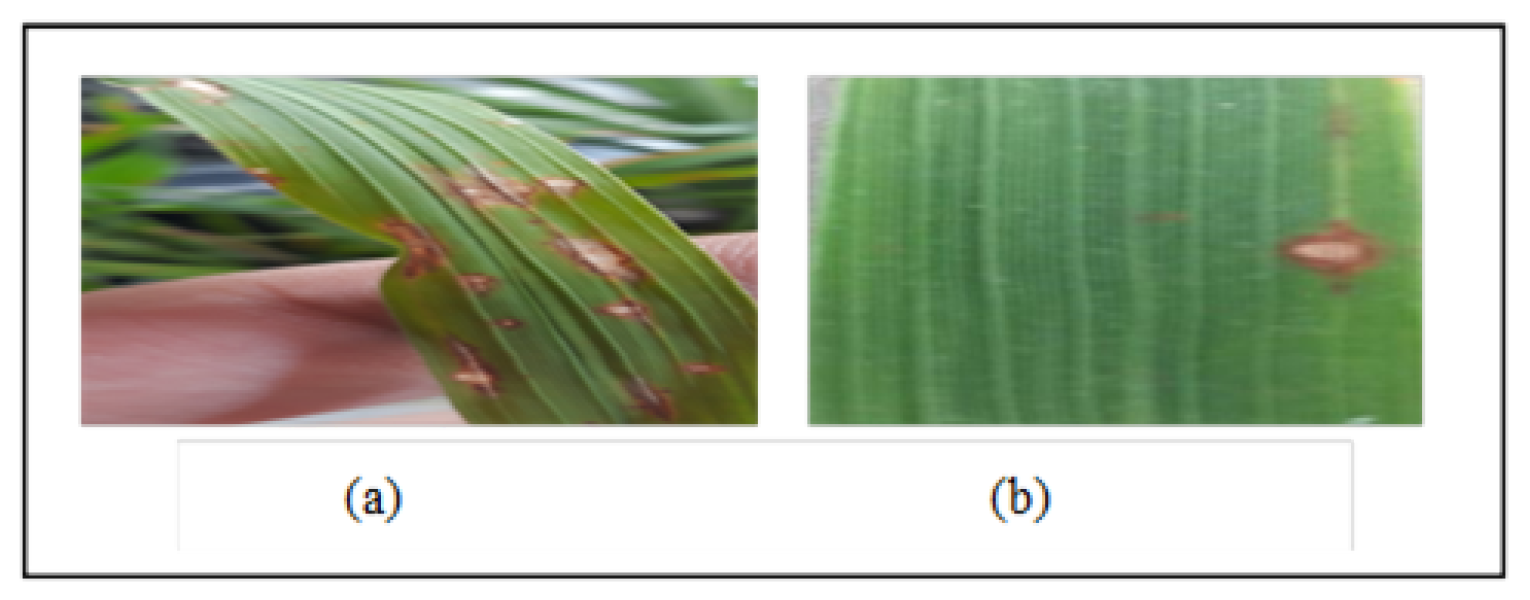
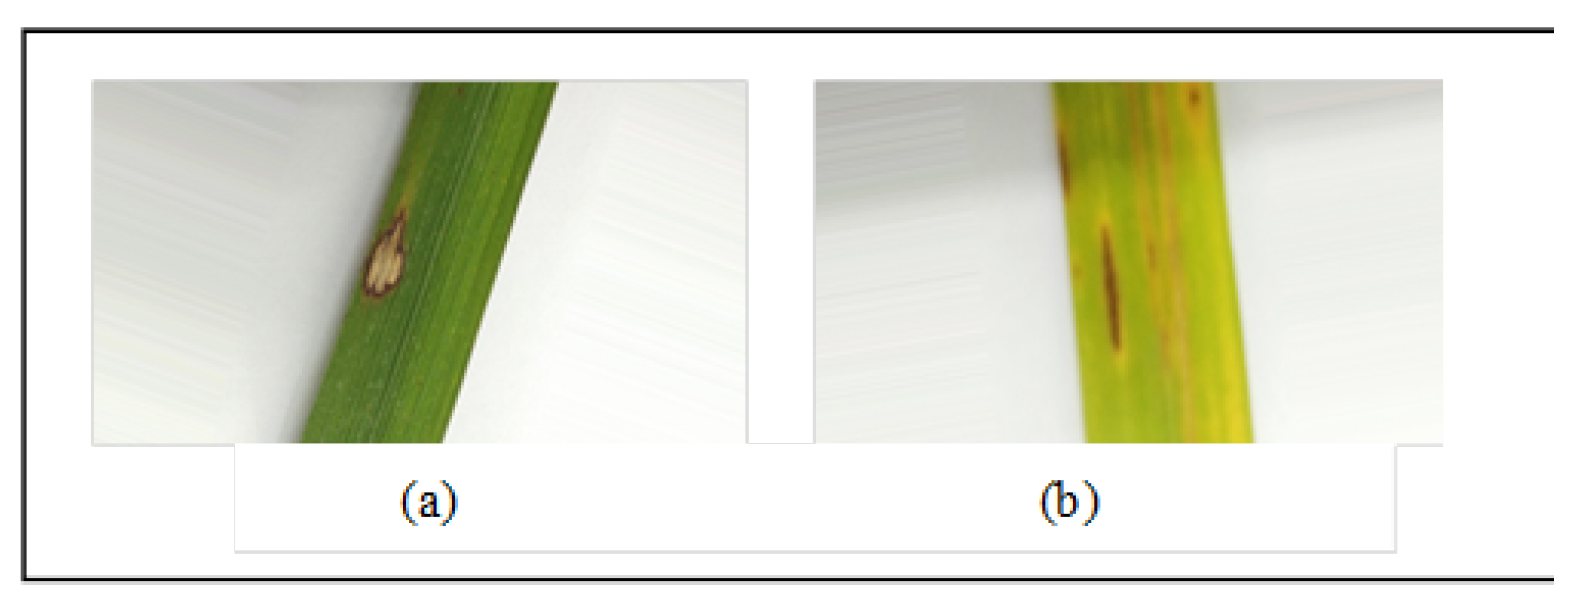
Rice blast images were captured from a field in Patiala, Punjab State, India (30.3398° N, 76.3869° E). The data were collected between July and September 2021 using a mobile camera with 12 MP (megapixels), f/2.2 aperture, and 1.25 µm (micro pixel) pixel sizes. The initial size of the images was 3008 × 4016 pixels. There were 152 images collected from primary resources.
Figure 2 provides sample images of blast disease collected from primary resources. There were two secondary resources considered for blast disease data collection, Mendeley [
10] and GitHub [
11]. A total of 1679 images was collected from secondary resources, with 1440 and 159 images from Mendeley and GitHub, respectively.
Figure 3 provides sample images of blast disease collected from secondary resources.
Table 2 gives a detailed description of the dataset. The images were of different dimensions and in JPG or PNG format. After data collection, the images from various resources were divided based on the disease severity level.
The severity levels were defined after discussions with experts. There were four levels of severity considered in this paper, mild, average, severe, and profound, represented as S1, S2, S3, and S4, respectively. These levels of severity were based on the area of the diseased plant leaf affected by the disease.
An image of a leaf was considered mildly affected by blast disease when the region of the leaf affected by disease ranged from 1% to 25%, of the overall area of the leaf. Similarly, it was classified as average when the area was between 26 and 50%, severe between 51 and 75%, and profound between 76 and 100% of the total area of the leaf.
Table 3 provides descriptions of the severity levels with the required percentage of the leaf affected for each level of severity.
3.2. Pre-Processing
Before training the model, the images need to be normalized and standardized to ensure all the images in the dataset have the same format. As the images are from a variety of sources, the size, quality, and dimensions of all the images are different. Normalization is the process of altering the intensity level of the pixels of the image to obtain better contrast. Standardization rescales the image to give standard dimensions [
29]. After this step, each image was annotated with a proper label of the level of disease severity observed. During the training phase, a model learns the labeled features, and the precision of the annotation provided to the images has a strong influence on the model’s quality. After pre-processing, the whole dataset was divided into test sets and training sets in the ratio of 20:80. The hybrid model was trained using the training set, and tested using the testing set.
3.3. Model Generation
Model generation consists of feature extraction followed by categorization. Feature extraction was conducted using CNN and classification was carried out using SVM. The model consisted of six layers. Two consecutive pairs of convolutional layer and max-pooling layer extracted the features, taking an image of size (64 × 64), neuron size of (96 × 96), ReLU activation function, and stride of 2.
The first convolutional layer worked on 7296 parameters whereas the second convolutional layer worked on 55,360 parameters. The parameter
was calculated using the best estimation with the given training set, Train(
+
+
+
), using the formula:
The output image dimensions from the first convolutional layer were (32 × 32) whereas the output shape of the first max-pooling layer was (16 × 16). In the second convolutional layer, the kernel size was (3 3) and the output shape was (16 16). For the second max-pooling layer the stride was 2, the kernel size was (2 × 2), and the output shape was (8 × 8). After that, the flattened layer reduced the dimensions of the feature matrix which was then passed through the dense layer. The output layer, finally, was the SVM layer which classifies the blast disease based on the severity level. The first dense layer worked on 1,179,936 parameters. The output layer used softmax as an activation function.
In the proposed hybrid model, the extracted features from CNN were fed into the SVM as an input. SVM, being a binary classifier, categorizes the images into only two categories. However, here the exact level of severity of the infection was identified which involved multiple categories. For that, a regularizer was used. A comprehensive narrative of the layers of the model is provided in
Table 4.
Figure 4 gives an overview of the proposed hybrid model. It consists of image pre-processing, feature extraction, and SVM classification in which 2 hyper-planes are created to classify four categories of rice blast disease severity.
3.4. Training and Testing of the Proposed Model
The hybrid model was trained on the images from the training set by compiling the final model. The model was trained with 50 epochs. The trained model was then tested with the images present in the test set. The CNN layers would automatically extract the feature vector. The feature vector was then fed to the fully connected dense layer. Then the SVM classifier trained the model on the extracted feature vector. In the testing phase, an input map was sent to CNN to generate a test feature vector, which was then classified by the SVM classifier.
4. Experimental Results and Findings
The rice blast disease severity detection and classification testing were carried out in a Jupyter Notebook environment using Python programming. A confusion matrix was built to demonstrate the performance of the proposed model. The model’s efficiency and performance were depicted in a confusion matrix using the tabular outline. The proposed model’s confusion matrix is shown in
Table 5. The confusion matrix has four parameters: true positive (TP), true negative (TN), false positive (FP), false negative (FN), and false positive (FP).
Table 6 displays the values of the proposed model’s four parameters.
The metrics used to estimate the performance of the proposed classification model are precision, recall, accuracy, and F1 score. These can be calculated using the four parameters of the confusion matrix. Accuracy (
acc) is the overall correct predictions made by the proposed classification model, recall (
r) denotes the number of positive predictions that were misclassified as negatives, precision (
p) is the number of negative predictions made by the proposed model that were misclassified as positives, and F1 is the harmonic mean of precision and recall.
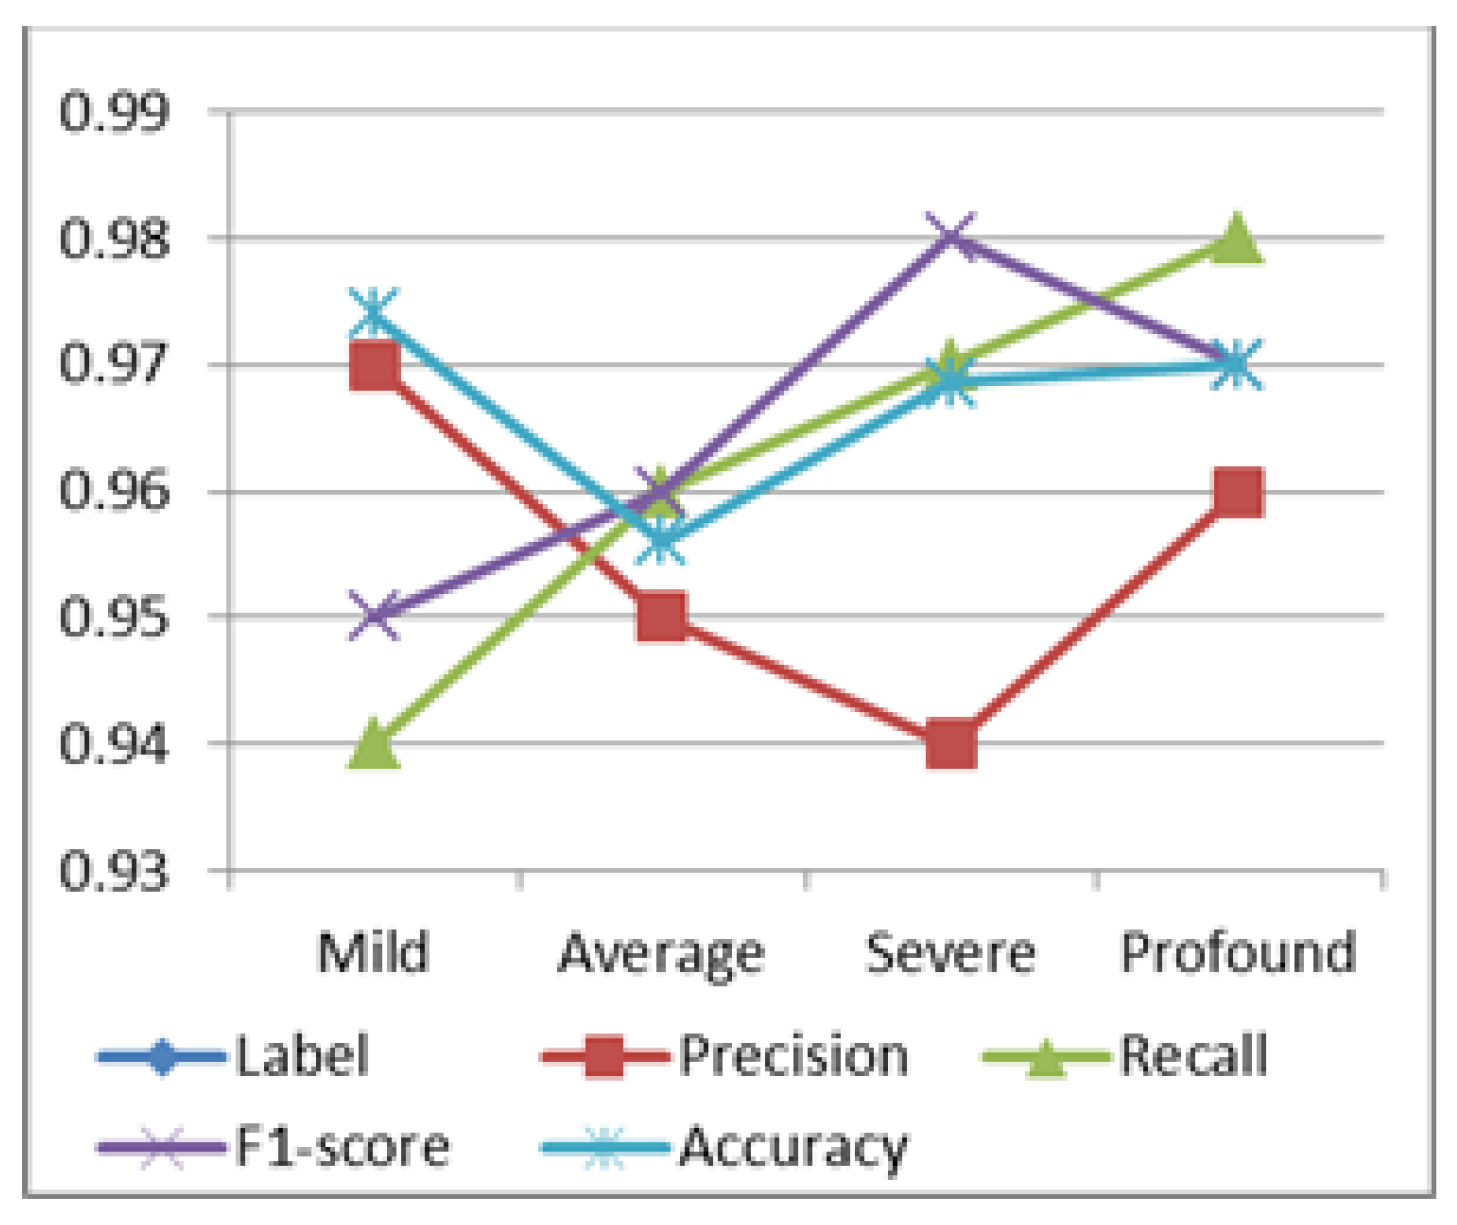
Table 6 gives the values of the performance metrics for the proposed model. The model’s overall accuracy is 97%.
The accuracy in the prediction of mild, average, severe, and profound severity levels is 97%, 95%, 96%, and 97%, respectively. The precision for all four levels is 97%, 95%, 94%, and 96%, respectively. The recall for S1, S2, S3, and S4 categories is 94%, 96%, 98%, and 97%, respectively. The F1 score is 95%, 96%, 98%, and 97% for S1, S2, S3, and S4, respectively.
Figure 5 depicts the accuracy, precision, recall, and F1 score for the S1, S2, S3, and S4 severity levels of rice blast disease.
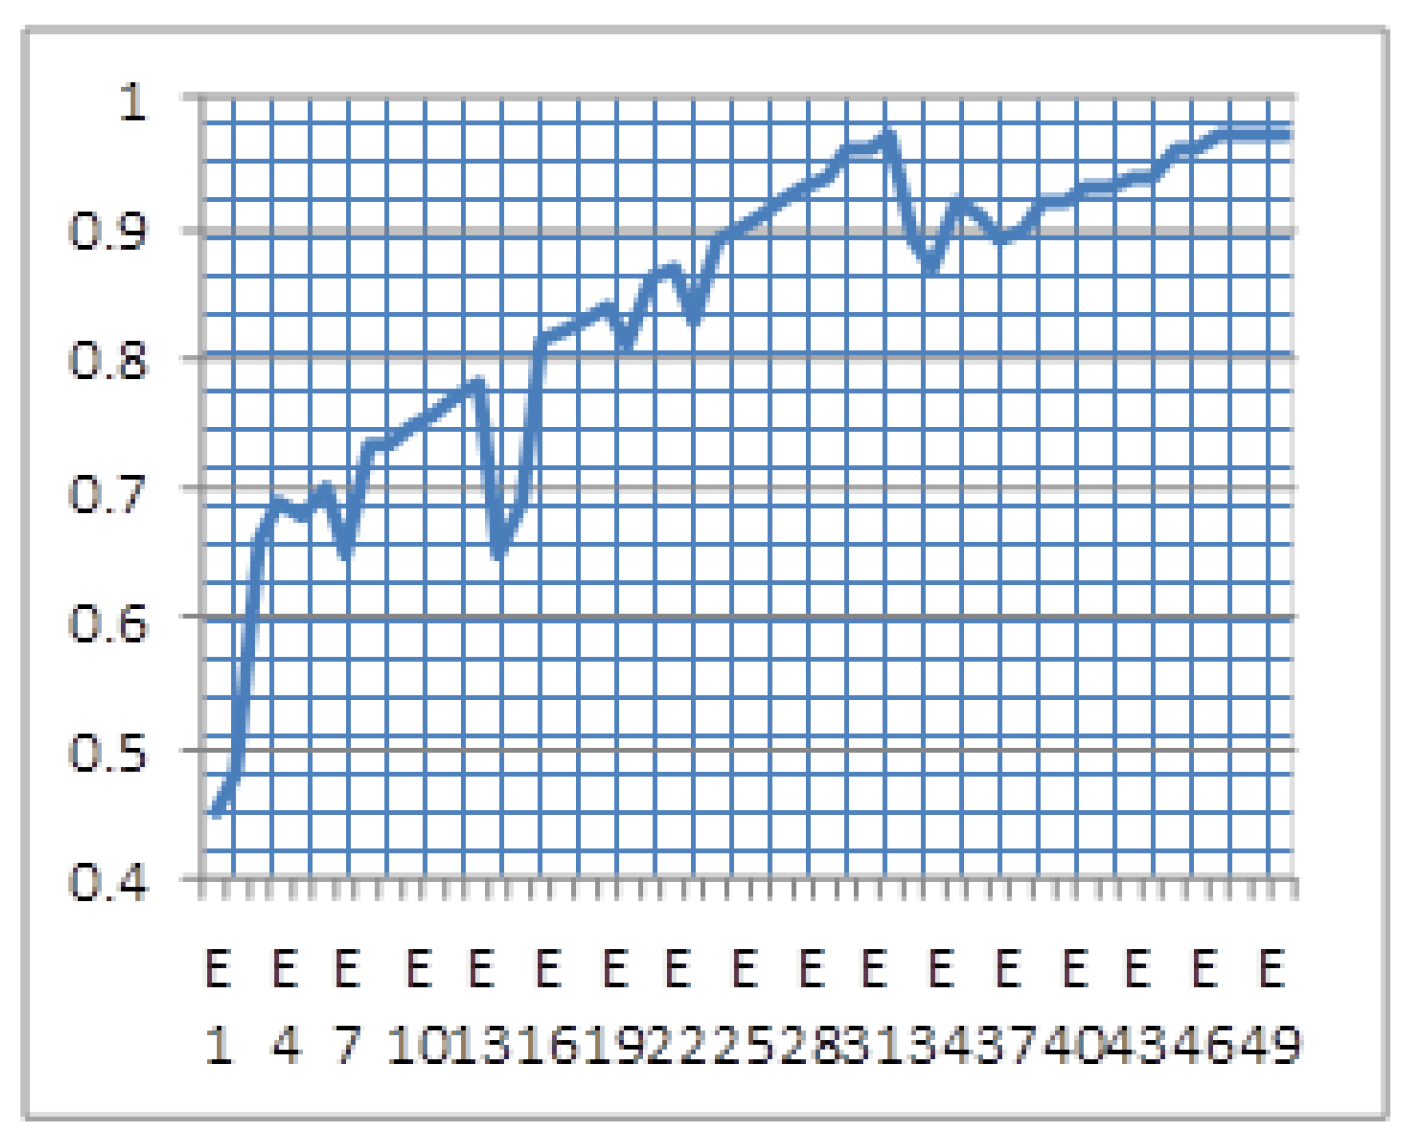
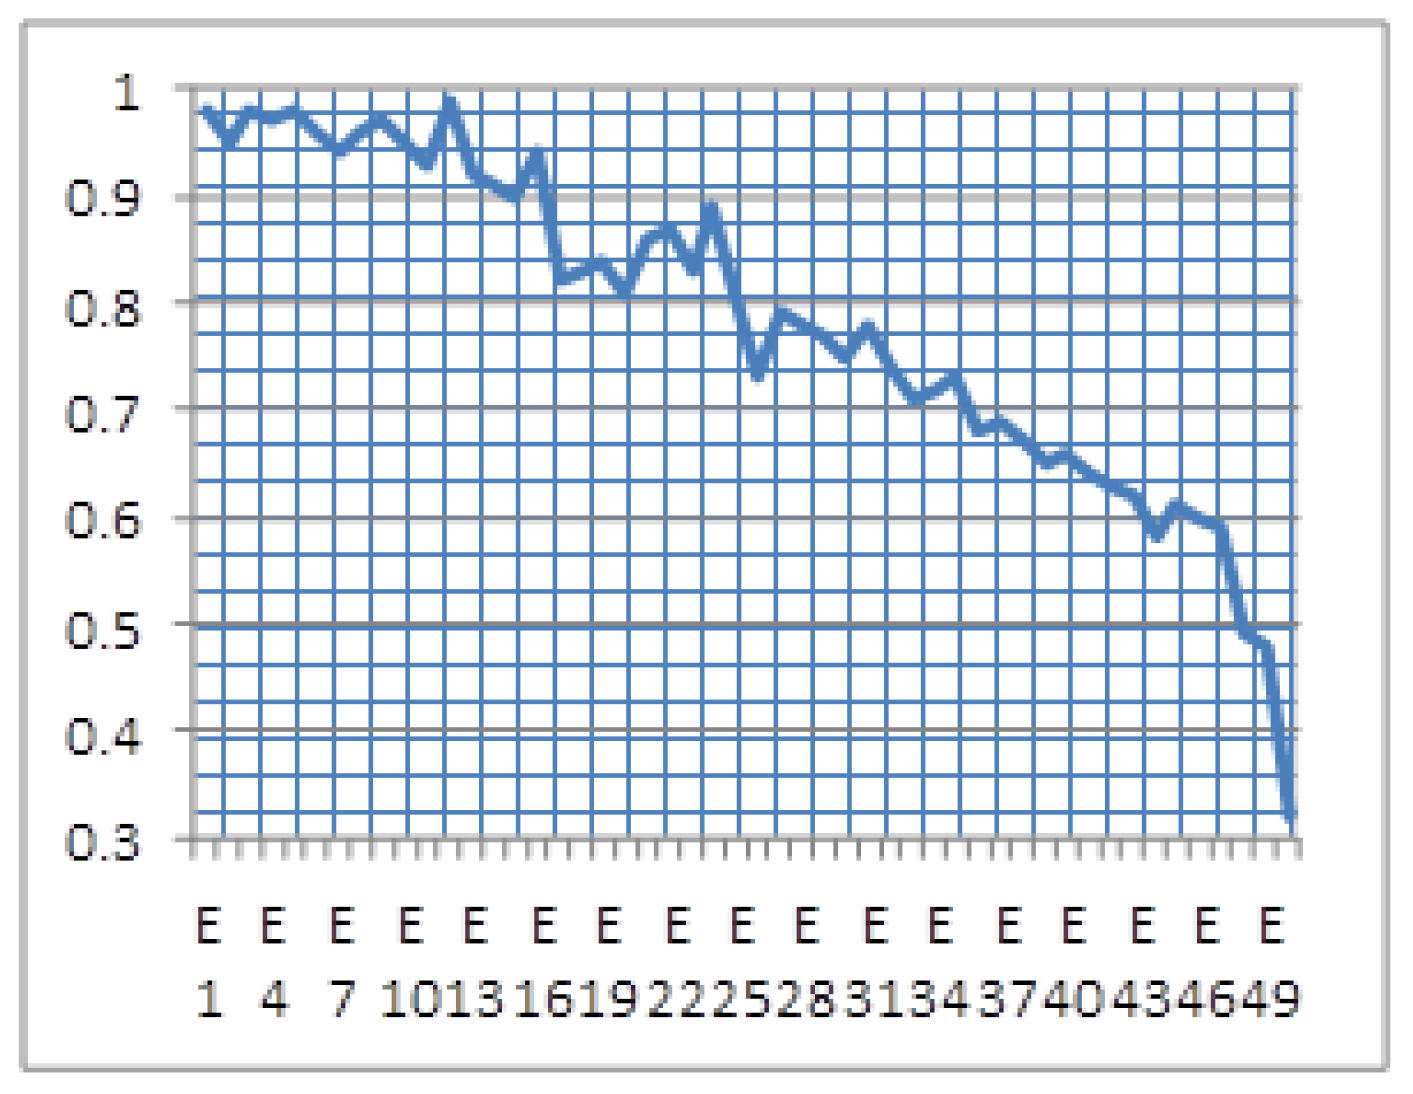
The epoch-wise accuracy curve is displayed in
Figure 6.
Figure 7 shows the epoch-wise loss function value for the proposed hybrid model. They show that as the training of the model proceeds over epochs the accuracy of the model also increases, whereas the loss function falls.
The performance of the proposed hybrid model is compared to the existing approaches to classification.
Figure 8 illustrates the comparison based on the attained accuracy for various classification approaches. It shows that the maximum accuracy achieved by a classifier is 99.81%, obtained using a hybrid approach of CNN and SVM over the MNIST dataset for the classification of skin lesions. The proposed hybrid model gives the best results when compared with existing approaches for the classification of rice diseases.
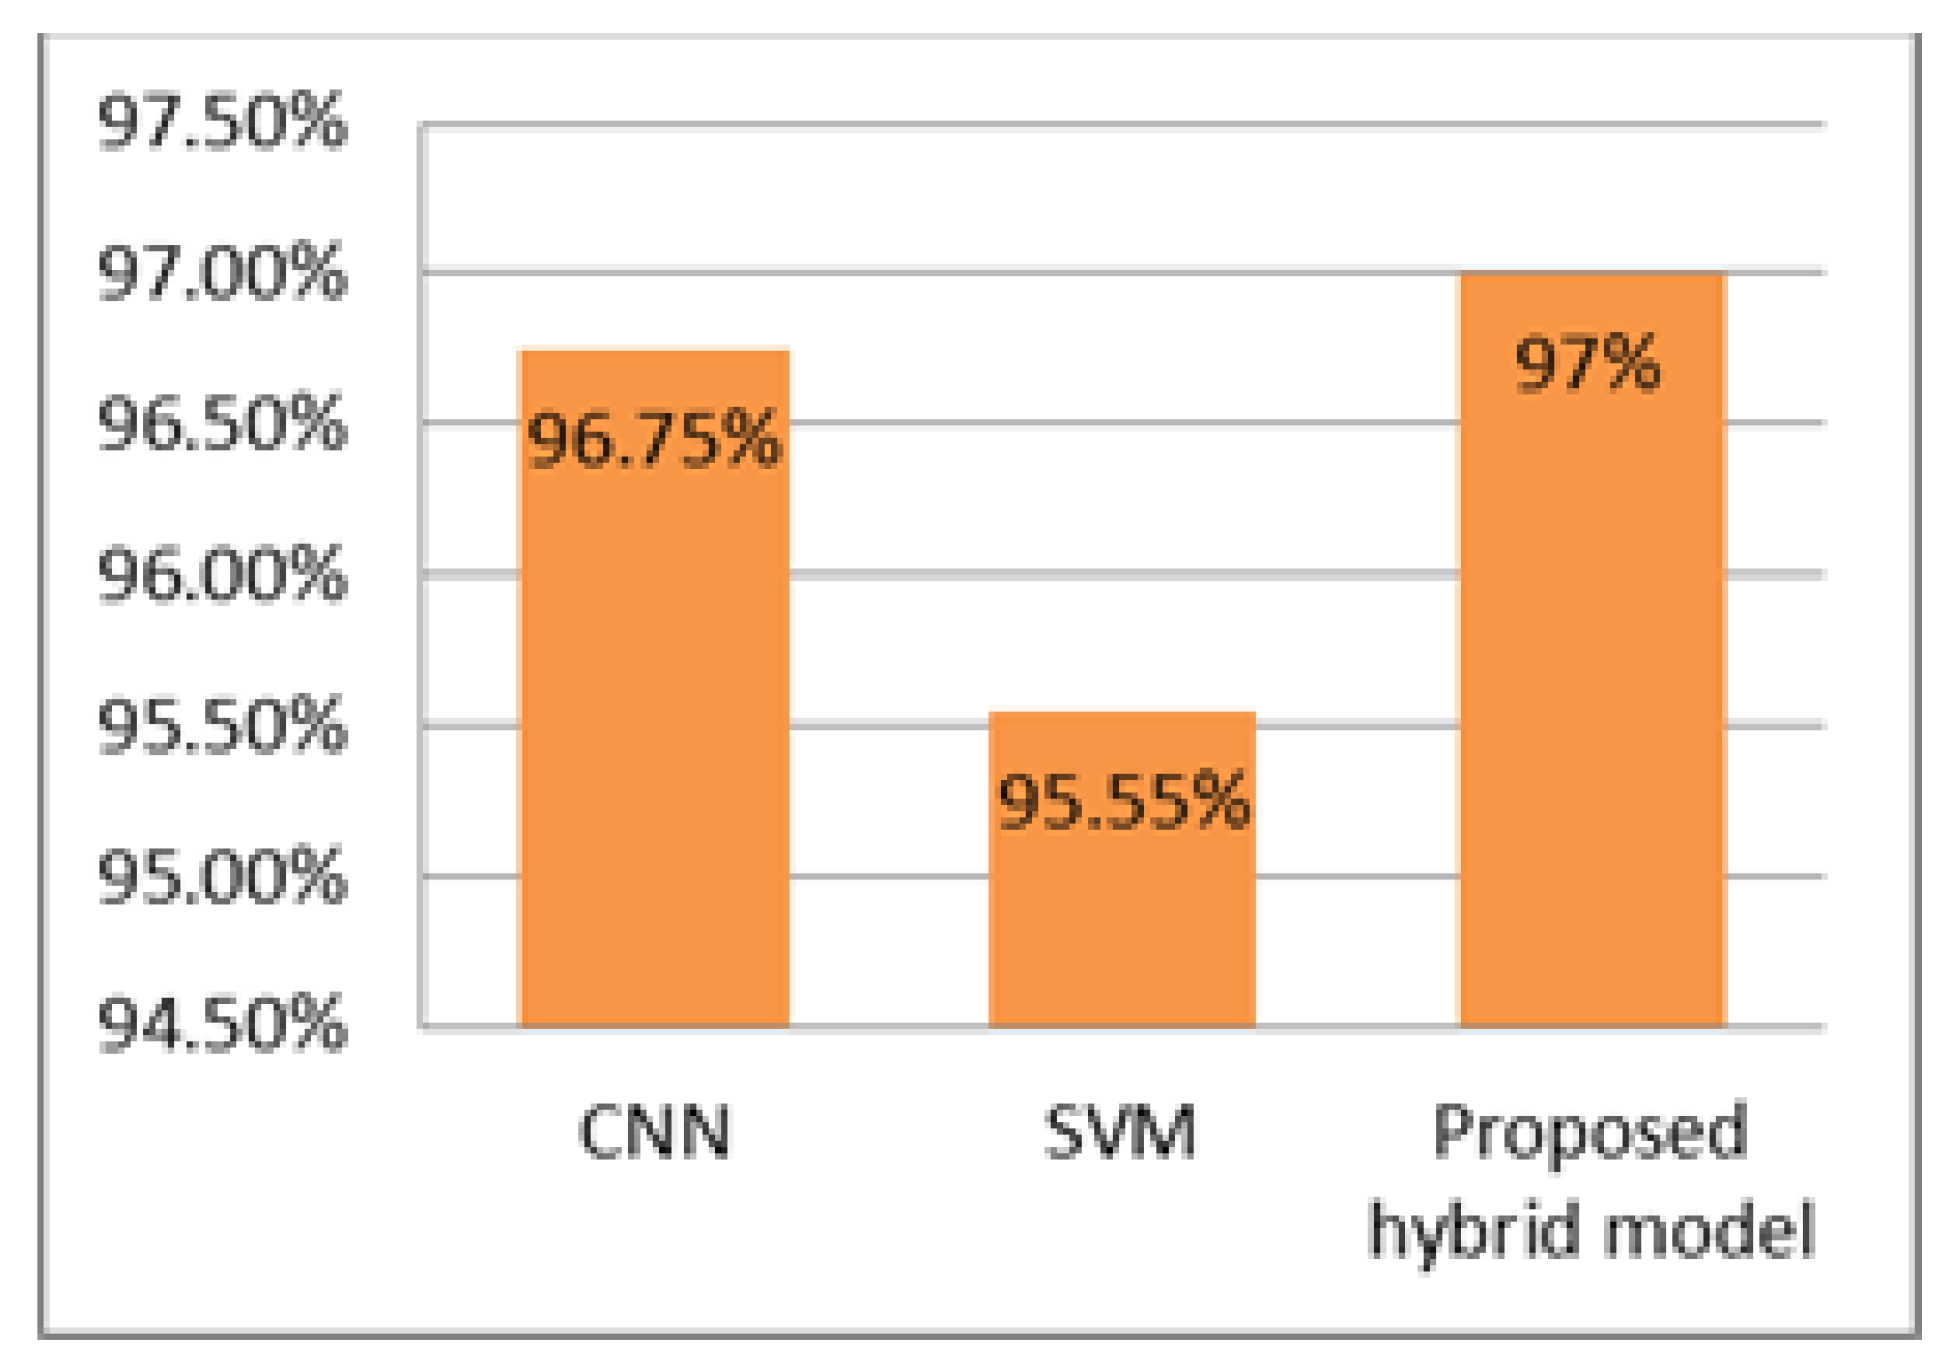
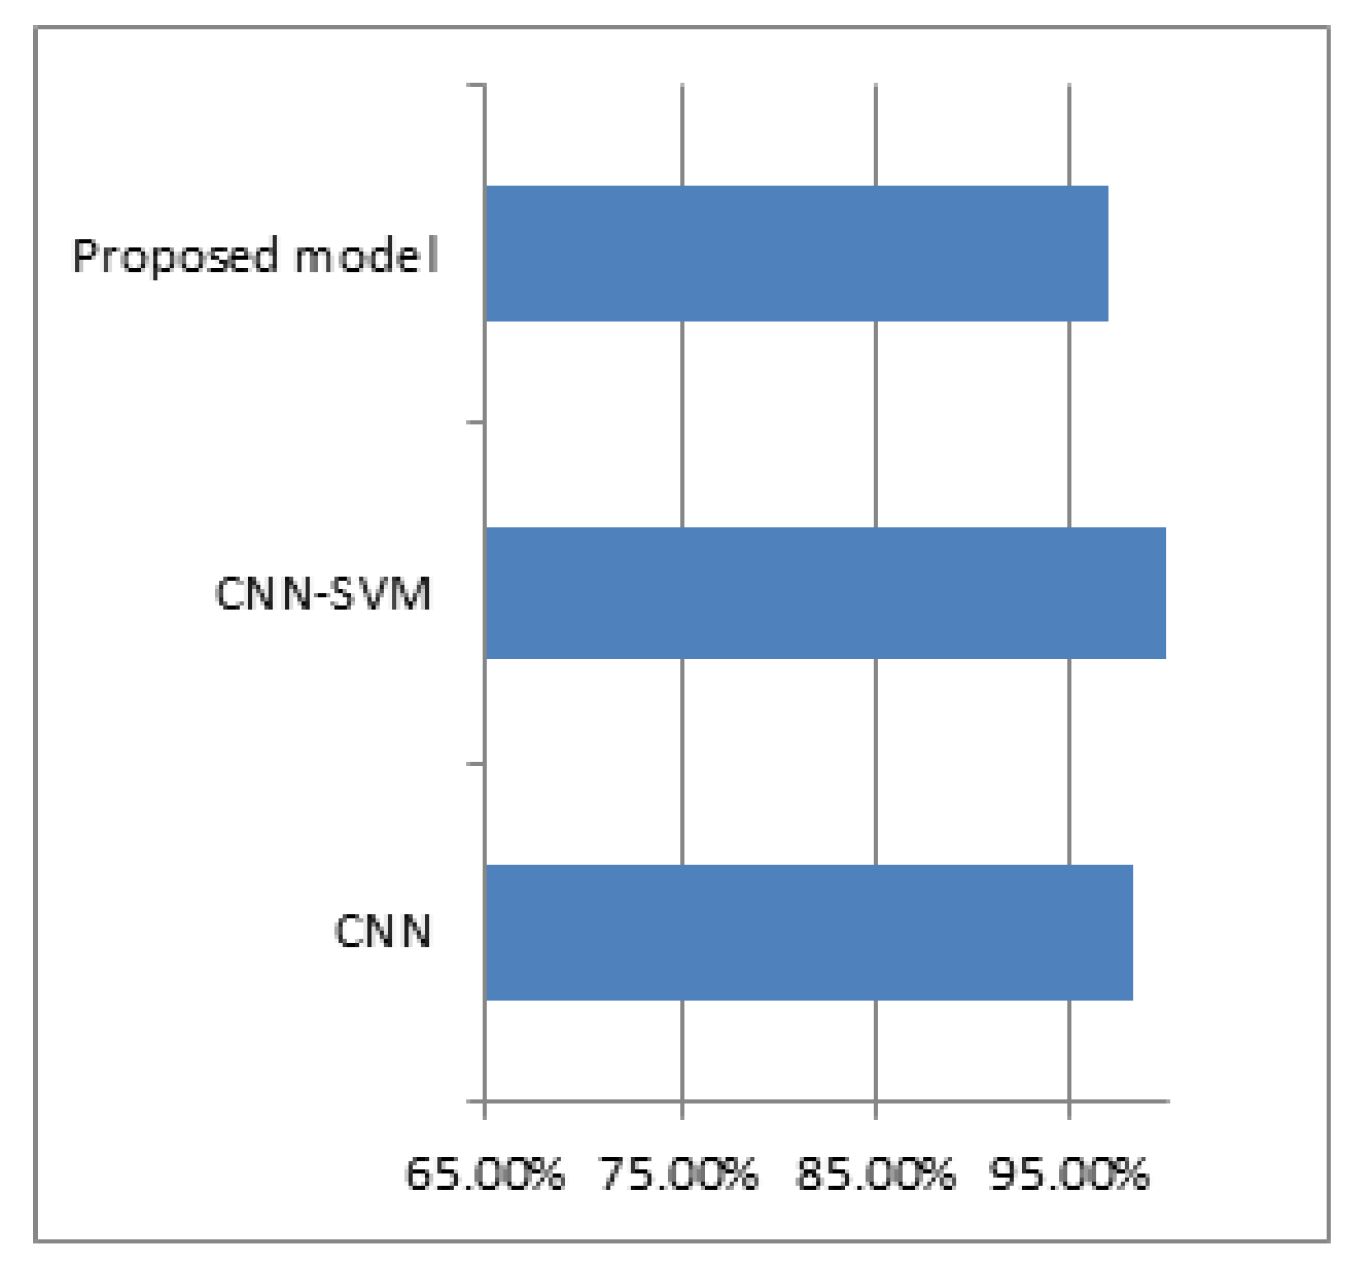
The hybrid model is further verified and equated with the numerous methods applied to the same dataset for the four-fold severity level classification of rice blast disease.
Figure 9 gives an accurate evaluation of the hybrid model with various supplementary methodologies over the same dataset.
Figure 9 shows that the hybrid model gives the best accuracy in the classification of four severity levels of rice blast leaf disease. The CNN and SVM achieved 96.75% and 95.55% accuracy, respectively, over the same dataset used in the experiment of the proposed hybrid model. The proposed model gives 97% accuracy, which is greater than those of the other approaches used.
5. Conclusions and Future Scope
In this study, a hybrid classification model was built, and it was then used to gauge the severity of rice blast leaf disease. The suggested approach combined CNN and SVM, with CNN serving as an automatic feature extractor and SVM as a classifier or predictor of blast illness severity. Based on the area of the diseased plant impacted by the illness, there were four severity levels taken into consideration. The four categories are moderate, average, severe, and profound, with percent ranges of 0–25%, 26–50%, 51–75%, and 76–100%, respectively.
Images from both primary and secondary sources were included in the dataset. Mendeley and GitHub, two online standard repositories, were taken into consideration for collection from secondary resources. In total, 1679 photos from secondary sources and 152 images from original sources made up the collection.
For the detection of blast illness severity levels, the suggested model had a 97 percent accuracy rate. The performance matrices of the proposed model wre then contrasted with those of the existing methodologies for classification, and it was discovered that the suggested model yields more compelling findings for the classification of four severity levels. Based on the experimental findings, the suggested hybrid model is a potential classifier for the severity prediction application for a number of reasons. The prominent traits are automatically extracted by the suggested model. On the other hand, the bulk of other conventional classifiers largely rely on retrieving suitable human-designed features, necessitating time-consuming and hard activities. In addition, the suggested model combines the benefits of SVMs and CNNs, two of the most well-liked and commonly applied image recognition classifiers. Ultimately, following consultation with specialists, all four categories taken into consideration were decided.
Future studies will employ this approach to gauge the severity of additional paddy illnesses. A similar approach can be used to examine plant diseases in other species. With knowledge of the appropriate severity level for each illness, the proposed approach can be utilised to classify plant diseases.
Author Contributions
Conceptualization, S.L. and V.K.; methodology, S.L. and V.K.; software, S.L., S.R., S.H.A. and A.B. All authors have read and agreed to the published version of the manuscript.
Funding
This research received no external funding.
Informed Consent Statement
Not applicable.
Data Availability Statement
The data used in this research are taken from the online standard repositories, Mendeley and GitHub. Part of the data is also collected from primary sources.
Conflicts of Interest
The authors declare no conflict of interest.
Abbreviations
The following abbreviations are used in this manuscript:
| CNN | Convolutional Neural Network |
| SVM | Support Vector Machine |
| GDP | Gross Domestic Product |
| LSTM | Long Short Term Memory |
| GAN | Generative Adversarial Networks |
| MRI | Magnetic Resonance Imaging |
| DCNN | Deep Convolutional Neural Network |
| RELM | Regularized Extreme Learning Machine |
| DWA | Deep Wavelet Auto-encoder |
| KNN | k-Nearest Neighbor |
| JPG | Joint Photographic Experts Group |
| PNG | Portable Network Graphics |
| TN | True Negative |
| TP | True Positive |
| FP | False Positive |
| FN | False Negative |
References
- Economy Survey. Business Standard News. 2021. Available online: https://www.business-standard.com/budget/article/economy-survey-resilient-agriculture-sector-growth-at-3-9-in-2021-22-122013100918_1.html (accessed on 19 June 2022).
- Annual Yield of Rice India FY 1991–2021. Available online: https://www.statista.com/statistics/764299/india-yield-of-rice/#:~:text=In%20financial%20year%202021%2C%20the,the%20yield%20competing%20with%20China’s (accessed on 19 February 2022).
- India: Yield of Rice 1991–2021|Statista. Available online: https://www.statista.com/statistics/764299/india-yield-of-rice/ (accessed on 19 February 2022).
- Blast (Leaf and Collar). Available online: http://www.knowledgebank.irri.org/training/fact-sheets/pest-management/diseases/item/blast-leaf-collar (accessed on 19 February 2022).
- Saini, P.; Kaur, J.; Lamba, S. A Review on Pattern Recognition Using Machine Learning. Adv. Mech. Eng. 2021, 619–627. [Google Scholar] [CrossRef]
- Alzubi, O.A.; Alzubi, J.A.A.; Tedmori, S.; Rashaideh, H.; Almomani, O. Consensus-based combining method for classifier ensembles. Int. Arab J. Inf. Technol. 2018, 15, 76–86. [Google Scholar]
- Joshi, P.; Das, D.; Udutalapally, V.; Pradhan, M.K.; Misra, S. Ricebios: Identification of biotic stress in rice crops using edge-as-a-service. IEEE Sens. J. 2022, 22, 4616–4624. [Google Scholar] [CrossRef]
- Anami, B.S.; Malvade, N.N.; Palaiah, S. Classification of yield affecting biotic and abiotic paddy crop stresses using field images. Inf. Process. Agric. 2020, 7, 272–285. [Google Scholar] [CrossRef]
- Lamba, S.; Saini, P.; Kukreja, V.; Sharma, B. Role of Mathematics in Machine Learning. In Proceedings of the International Conference on Innovative Computing & Communication (ICICC), Delhi, India, 20–21 February 2021. [Google Scholar]
- Rice Leaf Disease Image Samples. Available online: https://data.mendeley.com/datasets/fwcj7stb8r/1 (accessed on 19 February 2022).
- aldrin233a∖RiceDiseases-DataSet. Available online: https://github.com/aldrin233/RiceDiseases-DataSet (accessed on 19 February 2022).
- Lamba, S.; Baliyan, A.; Kukreja, V. A novel GCL hybrid classification model for paddy diseases. Int. J. Inf. Technol. 2022, 1–10. [Google Scholar] [CrossRef]
- Lamba, S.; Baliyan, A.; Kukreja, V. GAN based image augmentation for increased CNN performance in Paddy leaf disease classification. In Proceedings of the 2022 2nd International Conference on Advance Computing and Innovative Technologies in Engineering (ICACITE), Greater Noida, India, 28–29 April 2022; IEEE: Piscataway, NJ, USA, 2022; pp. 2054–2059. [Google Scholar]
- Saidi, A.; Othman, S.B.; Saoud, S.B. Hybrid CNN-SVM classifier for efficient depression detection system. In Proceedings of the 2020 4th International Conference on Advanced Systems and Emergent Technologies (IC_ASET), Hammamet, Tunisia, 15–18 December 2020; IEEE: Piscataway, NJ, USA, 2020; pp. 229–234. [Google Scholar]
- Khairandish, M.; Sharma, M.; Jain, V.; Chatterjee, J.; Jhanjhi, N. A hybrid CNN-SVM threshold segmentation approach for tumor detection and classification of MRI brain images. Intermed.-Range Ballist. Missile IRBM 2021, 43, 290–299. [Google Scholar] [CrossRef]
- Sun, X.; Park, J.; Kang, K.; Hur, J. Novel hybrid CNN-SVM model for recognition of functional magnetic resonance images. In Proceedings of the 2017 IEEE International Conference on Systems, Man, and Cybernetics (SMC), Banff, AB, Canada, 5–8 October 2017; IEEE: Piscataway, NJ, USA, 2017; pp. 1001–1006. [Google Scholar]
- Ahlawat, S.; Choudhary, A. Hybrid CNN-SVM classifier for handwritten digit recognition. Procedia Comput. Sci. 2020, 167, 2554–2560. [Google Scholar] [CrossRef]
- Leng, J.; Li, T.; Bai, G.; Dong, Q.; Dong, H. Cube-CNN-SVM: A novel hyperspectral image classification method. In Proceedings of the 2016 IEEE 28th International Conference on Tools with Artificial Intelligence (ICTAI), San Jose, CA, USA, 6–8 November 2016; IEEE: Piscataway, NJ, USA, 2016; pp. 1027–1034. [Google Scholar]
- Niu, X.X.; Suen, C.Y. A novel hybrid CNN–SVM classifier for recognizing handwritten digits. Pattern Recognit. 2012, 45, 1318–1325. [Google Scholar] [CrossRef]
- Lamba, S.; Saini, P.; Kaur, J.; Kukreja, V. Optimized classification model for plant diseases using generative adversarial networks. Innov. Syst. Softw. Eng. 2022, 1–13. [Google Scholar] [CrossRef]
- Lamba, S.; Baliyan, A.; Kukreja, V. Generative Adversarial Networks based Data Augmentation for Paddy Disease Detection using Support Vector Machine. In Proceedings of the 2022 10th International Conference on Reliability, Infocom Technologies and Optimization (Trends and Future Directions) (ICRITO), Noida, India, 13–14 October 2022; IEEE: Piscataway, NJ, USA, 2022; pp. 1–5. [Google Scholar]
- Rice Disease Dataset. Available online: https://www.kaggle.com/tedisetiady/leaf-rice-disease-indonesia (accessed on 19 February 2022).
- Rice Disease Data Set. Available online: https://archive.ics.uci.edu/ml/datasets/Rice+Leaf+Diseases (accessed on 19 February 2022).
- Jiang, F.; Lu, Y.; Chen, Y.; Cai, D.; Li, G. Image recognition of four rice leaf diseases based on deep learning and support vector machine. Comput. Electron. Agric. 2020, 179, 105824. [Google Scholar] [CrossRef]
- Hasan, M.J.; Mahbub, S.; Alom, M.S.; Nasim, M.A. Rice disease identification and classification by integrating support vector machine with deep convolutional neural network. In Proceedings of the 2019 1st International Conference on Advances in Science, Engineering and Robotics Technology (ICASERT), Dhaka, Bangladesh, 3–5 May 2019; IEEE: Piscataway, NJ, USA, 2019; pp. 1–6. [Google Scholar]
- Liang, W.j.; Zhang, H.; Zhang, G.f.; Cao, H.x. Rice blast disease recognition using a deep convolutional neural network. Sci. Rep. 2019, 9, 1–10. [Google Scholar]
- Kukreja, V.; Baliyan, A.; Salonki, V.; Kaushal, R.K. Potato Blight: Deep Learning Model for Binary and Multi-Classification. In Proceedings of the 2021 8th International Conference on Signal Processing and Integrated Networks (SPIN), Delhi, India, 26–27 August 2021; IEEE: Piscataway, NJ, USA, 2021; pp. 672–967. [Google Scholar]
- Salonki, V.; Baliyan, A.; Kukreja, V.; Siddiqui, K.M. Tomato Spotted Wilt Disease Severity Levels Detection: A Deep Learning Methodology. In Proceedings of the 2021 8th International Conference on Signal Processing and Integrated Networks (SPIN), Delhi, India, 26–27 August 2018; IEEE: Piscataway, NJ, USA, 2021; pp. 361–366. [Google Scholar]
- Baliyan, A.; Kukreja, V.; Salonki, V.; Kaswan, K.S. Detection of Corn Gray Leaf Spot Severity Levels using Deep Learning Approach. In Proceedings of the 2021 9th International Conference on Reliability, Infocom Technologies and Optimization (Trends and Future Directions) (ICRITO), Noida, India, 3–4 September 2021; IEEE: Piscataway, NJ, USA, 2021; pp. 1–5. [Google Scholar]
| Disclaimer/Publisher’s Note: The statements, opinions and data contained in all publications are solely those of the individual author(s) and contributor(s) and not of MDPI and/or the editor(s). MDPI and/or the editor(s) disclaim responsibility for any injury to people or property resulting from any ideas, methods, instructions or products referred to in the content. |
© 2023 by the authors. Licensee MDPI, Basel, Switzerland. This article is an open access article distributed under the terms and conditions of the Creative Commons Attribution (CC BY) license (https://creativecommons.org/licenses/by/4.0/).


