Article

Analysis of Runoff Variation and Future Trends in a Changing Environment: Case Study for Shiyanghe River Basin, Northwest China

1
College of Hydrology and Water Resources, Hohai University, Nanjing 210098, China
2
Jiangsu Province Hydrology and Water Resources Investigation Bureau, Nanjing 210029, China
*
Author to whom correspondence should be addressed.
Sustainability 2023, 15(3), 2173; https://doi.org/10.3390/su15032173
Submission received: 7 December 2022 / Revised: 8 January 2023 / Accepted: 23 January 2023 / Published: 24 January 2023
(This article belongs to the Special Issue Sustainable Planning, Management and Utilization of Water Resources)

Abstract

:
Changes in the hydrological cycle and water resources are inevitable consequences of environmental change, and runoff is an important element of the hydrological cycle. Therefore, the assessment of runoff changes is crucial for water resources management and socio-economic development. As an inland river basin in the arid zone of northwest China, the Shiyang River Basin is very vulnerable to environmental changes. Consequently, this study evaluated the past runoff evolution of the Shiyang River basin using a variety of statistical tools. In addition, the improved Soil and Water Assessment Tool (SWAT) was used to predict runoff trends from 2019 to 2050 under potential future climate change and land use projection scenarios in the future for the Shiyang River Basin. In the inland river basins, water resources mainly come from headwaters of the rivers in the upper mountainous regions, where they are more sensitive. Therefore, this study not only examined the mainstream of the Shiyang River, but also the six tributaries in the upper stream. The results indicate that the mainstream of the Shiyang River Basin and its six upstream tributaries all showed declining trends from the 1950s to 2019, and most of the rivers will continue to insignificantly decrease until 2050. Furthermore, there are two main timescales for runoff in the past as well as future: one is around 40 years and another is 20–30 years. In the meantime, the Shiyang River and its tributaries have relatively consistent change characteristics. The results of this study will provide assistance to basin management agencies in developing more appropriate water resource management plans.

1. Introduction

Climate and land use are the two main factors affecting the water cycle in the watershed [1,2,3]. With climate change, elements such as precipitation and evapotranspiration change. As a result, water resources will increase or decrease [4,5]. Moreover, the impact of land use change caused by human activities on water resources should not be ignored [6,7]. What is known with certainty is that climate and land use changes will have significant influence on the watershed hydrological process [8,9]. Runoff is one of the essential components of the hydrological cycle, as well as the major utilization form of hydraulic engineering. Its evolution characteristics and trends are important factors affecting the variations of ecological environment and the development of the social economy [10]. Therefore, it is a crucial topic to study how runoff changes under the influence of climate change and land use change [11,12,13].
In general, water resources in arid areas are relatively more vulnerable to environmental variations [14,15]. These regions are characterised by water scarcity and fragile ecosystems. A large amount of research has been carried out on changes in runoff in arid and semi-arid regions around the world [16,17]. There are many dry inland river basins in northwest China [18]. These basins are located in the interior of Asia and far from the sea, which form closed water circulation systems. The northwest arid zone accounts for one-third of China’s total land mass, but has only 5% of the country’s water resources. In recent years, the rapid population growth in these areas has led to an increased demand for water resources, exacerbating the tension between socio-economic and ecosystems [19]. As a result, there are widespread problems of over-exploitation and a high reuse of water resources in inland river basins [20]. Shiyang River Basin, an important inland river basin in the arid area of northwest China, was taken as the research area in this study. Due to the drought climate, large evaporation, low precipitation, large population and unscientific water use structure, groundwater was seriously overexploited, and the groundwater level was constantly falling in this area. Therefore, vegetation degradation, desertification, salinization and other ecological problems were apparent. Overall, water shortage seriously threatens the sustainable development of the river basin [21]. A series of key management programs in the Shiyang River Basin have been initiated by the government since 2006. Through years of effort, the total amount of water consumption in the basin has been reduced and the industrial structure has been gradually optimized. Meanwhile, the ecological environment has been improved. However, owing to its special geographical location, natural conditions and long-term comparatively backward level of socio-economic development, the Shiyang River Basin is still the most vulnerable inland rivers area in terms of ecological environment [22]. This is why it is significant to examine the changes in runoff from the Shiyang River Basin. Previous studies have also been undertaken on the effects of climate change and land use change on water resources in the region [23,24,25,26,27].
The purpose of this study is to examine the trends of runoff evolution in the Shiyang River Basin in the past 60 years, which is of great significance for understanding the response of a hydrological regime to environmental change in this area. The study also aims to determine how runoff will change under the continuing climate and land use changes before 2050. This study is helpful to guide high-quality water resources management, scientific and rational planning, and the utilization of water resources in the Shiyang River Basin, thus promoting the social and economic harmonious development of Shiyang River Basin.
In the arid inland river basin, water resources mainly come from the source mountains, which only account for a small part of the whole river basin [28]. Consequently, there is a strong need to focus on the changes in runoff that occur in these water source areas in response to environmental changes, in order to better research and plan water resources better across the basin [29]. In addition, hydrological conditions in these source areas are more sensitive to environmental changes [30,31]. Hence, not only the mainstream, but also the six upstream tributaries that feed into the mainstream were studied in this study. Furthermore, improvements were made to the SWAT model to allow adjusting the snowfall parameters for each sub watershed separately by modifying the source code.
The structure of this article is as follows. After the introduction, Section 2 describes the study area and the dataset available for use in this study, as well as discusses the model used for the runoff prediction analysis and the modelling approaches. Then, in Section 3, the variation characteristics of past runoff and the prediction results of model runoff are given. Moreover, this section provides a discussion of the results related to the changes of runoff that have occurred and might happen in the context of climate change and land use change. Finally, Section 4 summarizes this study.

2. Materials and Methods

2.1. Study Area

The Shiyang River Basin, which has a total area of 41,600 km2, is situated in Gansu Province’s eastern Hexi Corridor, west of the Wushaoling Mountains. It located at the northern foot of the Qilian Mountains in China (Figure 1), between 36°29′ and 39°27′ N, and 101°41′ and 104°16′ E. With a slope from the southwest to the northeast, the Shiyang River basin is high in the south and low in the north. The four geomorphological units of the basin are the Qilian Mountains in the south, the plains in the middle, the low hills in the north, and the desert region. The Shiyang River Basin has a continental temperate arid climate with high solar radiation, plentiful sunlight, huge temperature fluctuations, minimal precipitation, high evaporation and dry air. From south to north, the watershed is separated into three climate zones. The southern Qilian Mountains’ alpine semi-arid and semi-humid zone is between 2000 and 5000 metres above sea level, with annual precipitation of 300 to 600 millimetres and annual evaporation of 700 to 1200 millimetres; the middle plain’s warm and cool arid zone is between 1500 and 2000 metres above sea level, with annual precipitation of 150 to 300 millimetres and yearly evaporation of 1300 to 2000 millimetres; and the northern warm and dry zone lies between 1300 and 1500 metres above sea level, with annual precipitation of less than 150 mm and annual evaporation of 2000–2600 mm. Influenced by natural conditions such as climate, soil, hydrology and topography, the distribution of vegetation types in the Shiyang River Basin is zonally divided into three distinct natural landscapes, forming a clear vertical spectrum of vegetation. With the exception of the oasis agro-ecosystems, the plain portions of the Hexi Corridor and the vast regions south of the Badain Jaran Desert and Tengger Deserts have a desert vegetation landscape. Low mountainous hills regions are covered with desertified grassland and steppe flora. The southern Qilian mountain range progressively transitions from grasslands and bushes at the base to alpine forests and meadows at the top.
The Shiyang River basin mainly includes eight rivers from east to west: the Dajing River, the Gulang River, the Huangyang River, the Zamu River, the Jinta River, the Xiying River, the Dongda River, the Xida River and many small ditches and rivers, with an area of 11,100 km2 and an average annual runoff of 1.572 billion m3. The Shiyang River basin can be divided into three separate river systems according to hydrogeological units: the Dajing River Basin, the Six River Basin and the Xida River Basin. The Dajing River Basin mainly consists of the Dajing River, which is a part of the Dajing Basin, and its river water is transformed and utilised within the basin. The upper reaches of the Six River Basin contain the Gulang River, the Huangyang River, the Zamu River, the Jinta River, the Xiying River and the Dongda River. They all originate in in the South Basin of Wuwei, and the runoff from the six rivers converges at the edge of the South Basin to form the mainstream of the Shiyang River, which then flows into the Minqin Basin. The runoff from the Shiyang River is entirely consumed in the Minqin Basin. The Xida River system mainly consists of the Xida River, which produces flow in the Yongchang Basin and converges into the Jinchuanxia Reservoir.

2.2. Data

In this study, the Shiyang River Basin’s topography, land use, soil and hydrometeorological data were all meticulously collected and collated, and the necessary data were processed in accordance with the requirements of the model running. Topographic data were adopted from ASTER GDEM data with 30 m resolution downloaded from the Geospatial Data Cloud website (http://www.gscloud.cn accessed on 22 January 2023). Land use data for this study were obtained from the global geo-information public product Globeland30 provided by China (http://www.globallandcover.com accessed on 22 January 2023), and the 1 km land use remote sensing monitoring data of Gansu Province provided by Data Center for Resources and Environmental Sciences, Chinese Academy of Sciences (https://www.resdc.cn accessed on 22 January 2023). Soil data used 1:1 million Chinese soil data from the Harmonized World Soil Database version 1.1. Data of daily rainfall, maximum and minimum temperature, wind speed, relative humidity and sunshine hours for three meteorological stations from 1960 to 2019 were downloaded from China Meteorological Data Service Centre (http://data.cma.cn accessed on 22 January 2023). The observed runoff dataset of each hydrological station are from the Hydrological Yearbook. In order to analyse changes in runoff under the influence of climate change and land use change, the measured data were collected from nine hydrological stations on the Shiyang River basin and reverted socio-economic water withdrawal and reservoir storage based on relevant data.
The unified coordinate system WGS_1984_UTM_Zone_48N was used for this study and all spatial data were transformed to it, since the SWAT model demands that all spatial data have the same coordinate system.

2.3. Runoff Variation Analysis

2.3.1. Dispersion Analysis by the Coefficient of Variation

The dispersion of the series can be analysed using the coefficient of variation, usually expressed as Cv. A large value of Cv is associated with strong inter-annual variability in annual runoff, while the opposite is associated with low inter-annual variability in annual runoff.
The most commonly used coefficient of variation is the coefficient of variation which is in the form of the standard deviation removed from the mean and converted into a percentage [32]. The formula is:
C V = s X ¯ × 100 %
where S represents the standard deviation and X ¯ is the mean.

2.3.2. Trend Analysis by Mann–Kendall Trend Test

The Mann–Kendall trend test [33,34] is a widely used non-parametric statistical method that can handle missing results and values that are below a detection threshold.
For a time series of n sample sizes x1, x2,…, xn, construct an index column [35]:
S k = i = 1 k r i , k = 2 , 3 , n
where ri is calculated as follows [36].
r i = { + 1 , x i > x j 1 , x i x j , j = 1 , 2 , , i
The statistical value Sk in the above equation is the cumulative sum of the number of values greater than the i-th moment and the j-th moment. When the sample size n > 107, the statistic is close to a normal distribution [37]. The formula for calculating the variance is:
V a r ( S k ) = n ( n 1 ) ( 2 n + 5 ) 18
The standardised statistics are calculated as follows.
Z = { S 1 V a r ( S k ) , S > 0 0 , S = 0 S + 1 V a r ( S k ) , S < 0
The Mann–Kendall trend test discriminates trends by the statistic Z. If the absolute value of Z is greater than Z(1−α/2), then there is an increasing or decreasing trend in the series. Otherwise, the hypothesis that there is no trend in the series should be accepted. Z(1−α/2) is the value of the standard normal distribution when the probability exceeds 1 − α/2 [38].

2.3.3. Periodicity Analysis by Morlet Continuous Wavelet Transform

The wavelet transform is a time-frequency analysis of signals with multi-resolution, which extract the original signal from a signal mixed with strong noise easily. The wavelet transform progressively refines the signal on multiple scales by means of a telescoping translation operation, eventually achieving time subdivision at high frequencies and frequency subdivision at low frequencies. It automatically adapts to the requirements of time-frequency signal analysis. The variation of runoff over time is often influenced by a combination of factors. Runoff is not only characterised by trends and periodicity, but also by abrupt changes and a multi-scale structure, which has a multi-level evolution [39]. The wavelet transform can clearly reveal the multiple cycles of runoff hidden in the time series.
ψ a , b ( t ) = | a | 1 2 ψ ( t b a )                     b R , a R , a 0
where ψ a , b ( t ) is called continuous wavelet, a is the scale factor or frequency factor, and b is the time factor.
If ψ a , b ( t ) satisfies Equation (6), for an energy finite signal or time series f ( t ) L 2 ( R ) , its continuous wavelet transform [40] is defined as:
W f ( a , b ) = | a | 1 2 R f ( t ) ψ ( t b a ) d t
where ψ ( t ) is the complex common choke function of ψ ( t ) . It can be shown using Equation (7) that the wavelet transform is the decomposition process of f ( t ) at different scales, which essentially filter f ( t ) with different filters. Otherwise, | a | 1 2 ψ ( t b a )   is the impulse response of the filter.
In this study, Morlet was chosen as the mother wavelet to analyse the runoff dataset. The Morlet wavelet is non-orthogonal and gives smooth continuous wavelet amplitudes [41]. It is also an exponential complex-valued wavelet regulated by Gaussian, which allows a good representation of the phase to obtain information on both the amplitude and phase of the time series [42].
ψ 0 ( t ) = π 1 4 e i ω 0 t e t 2 2
where t is time and ω 0 is the dimensionless frequency. It satisfies the wavelet tolerance condition of Equation (6).

2.4. SWAT Model

2.4.1. Hydrology Model Setup

The SWAT model is a continuous time and scale based distributed hydrological model developed by USDA-ARS. The SWAT model can successfully replicate processes such as surface runoff, groundwater, soil temperature, soil moisture, sand generation and transport, nutrient loss and other agricultural management approaches.
Land surface simulation and water surface simulation are the two components of the SWAT model’s hydrological simulation. The land surface simulation includes the production and slope confluence processes, while the water surface simulation includes the confluence processes in the main river channel.
Surface runoff has a significant impact on the hydrological cycle, and its generation is strongly linked to changes in climatic factors such as atmospheric precipitation, air temperature and evaporation. Human activity and climate change are important to runoff hydrological processes. A key part of the hydrological cycle is surface runoff. The water balance equation for the SWAT model [43] is as follows:
S W t = S W o + i = 1 t ( R d a y Q s u r f E a W s e e p Q g w )
where S W t is the final moisture content of the soil, mm; S W o is the initial moisture content of the soil, mm; R d a y , Q s u r f , E a , W s e e p ,   Q g w are the precipitation, surface runoff, evaporation, water entering the envelope from the soil profile and water in the return flow on day i, mm, respectively; t represents time, day.
The SWAT model provides two calculation methods to estimate surface runoff, the SCS curve method and the Green and Ampt infiltration method [44]. As the input meteorological data for this study are daily average information, the model chose the SCS curve method to calculate surface runoff. The equation for calculating the SCS curve [45] is:
Q s u r f = ( R d a y I a ) 2 ( R d a y I a + S )
where Q s u r f is the cumulative runoff or hyperinfiltration of precipitation, mm; R d a y is the daily precipitation, mm; I a indicates the initial loss, including puddle filling, plant retention and infiltration, etc., generally approximated as 0.2 s; S is the retention parameter.
In this study, Penman–Monteith was used as the basis for the model evapotranspiration calculations, requiring the input of maximum and minimum air temperature, wind speed, relative humidity and solar radiation.
Snowmelt runoff is calculated as a linear function of air temperature based on the snow cover and the temperature threshold for generating snowmelt runoff in the SWAT model, which is equivalent to calculating snowmelt runoff using the degree-day factor method. The SWAT model calculates that snowmelt production is mainly influenced by snowpack temperature, snow cover area and snowmelt rate. Glaciers were found in the higher portions of the Shiyang River basin’s tributaries, the Dongda, Xiying, Jinta and Zamu river basins. Through modifying the source code, SWAT was enhanced by enabling the snowfall variations for each sub-basin separately.
Data on land use types for different years were entered according to different simulation needs. A soil database was constructed. The soil property database contains a total of 20 parameters such as soil hydrological grouping, maximum root depth in the soil profile, soil wet density and effective water holding capacity of the soil layer.
The weather generator database was constructed using daily observations of temperature, precipitation, relative humidity and wind speed from 1960 to 2019 at meteorological stations in the study area, which contained 14 types of meteorological parameters, including monthly average daily maximum temperature, monthly average daily maximum temperature standard deviation, monthly average daily rainfall and monthly average daily rainfall standard deviation.
Based on the established soil and meteorological database, subbasins and hydrologic response units (HRUs) were divided, and the SWAT projects of the Shiyang River basin were established. First, the DEM map of the study area was loaded into the SWAT model and the appropriate area thresholds were selected to create the stream networks. After this, the subbasins could be delineated. Next, the soil map, soil index table, land use map and land use index tables of the study area were imported, and the number of slope classes of the watershed was set. Following this, the multiple HRUs definition method was adopted to set the threshold of land use and soil area, and the threshold percentage was set as 10%. Finally, the definition of hydrologic response units was completed. Further, SWAT models were constructed for each of the six major tributaries of the Six River system.

2.4.2. Model Calibration and Validation

SWAT-CUP is a software developed by the Swiss Federal Institute of Aquatic Science and Technology (Dübendorf, Switzerland) for the automatic calibration and uncertainty analysis of SWAT models. In this study, the SUFI-2 algorithm of the SWAT-CUP tool was chosen to perform the sensitivity analysis and rate determination of the model parameters.
In this study, the correlation coefficient (r2) [46], relative error (Re) [47] and Nash–Sutcliffe efficiency coefficient (NSE) [48] were used to analyse the accuracy of the calculation results and to comprehensively evaluate the simulation results of the SWAT model. The calculation methods are shown in Equations (11)–(13).
r 2 = [ i = 1 n ( Q m , i Q m ¯ ) ( Q s , i Q s ¯ ) ] 2 i = 1 n ( Q m , i Q m ¯ ) 2 i = 1 n ( Q s , i Q s ¯ ) 2
Re = Q s , i Q m , i Q m , i
N S E = 1 i = 1 n ( Q m , i Q s , i ) 2 i = 1 n ( Q m , i Q s ¯ ) 2
where Q m , i is the measured data, Q s , i is the simulated discharge output, Q m ¯ is the average of the measured discharge and Q i ¯ is the average of the discharge simulation. r 2 indicates the consistency of the trend between simulated and measured values. The closer the value of r 2 is to 1, the better the simulated results match the measured data. The smaller the absolute value of Re, the greater the simulation result, and the opposite, the worse the result. NSE represents the degree of deviation of the measured value from the simulated value. The closer NSE is to 1, the closer the simulation is to the measured data [49].

2.4.3. Climate and Land Use Change Projection for Model Inputs

This study selected the stabilization scenario RCP 4.5 from the four RCP scenarios of CMIP5. In this study, the GCM models were downscaled and evaluated for their ability to simulate precipitation in the study area; five models were selected and bias correction, and then Multi-Model Ensemble (MME) was developed.
Precipitation simulations output by 47 GCMs for 1960–2018 were evaluated against contemporaneous observations at three stations in the study area. Six evaluation indicators, including the mean value, coefficient of variation, ZC statistic in Mann–Kendall analysis, inhomogeneity coefficient, normalized root mean square error, and Pearson correlation coefficient between the precipitation simulation series and the measured series, were calculated for each model output, and the weighting coefficients of each indicator were obtained using the entropy weighting method. The set of indicators of the measured precipitation series was taken as the ideal solution, and the set of indicators furthest from the measured precipitation series was taken as the negative ideal solution. The distance (Da+ and Da) of each GCM to the ideal solution and the negative ideal solution was calculated by Equation (14), and the relative proximity of different GCMs to the ideal solution was derived.
{ Da + = Σ j = 1 n ( z j z j ) 2 τ Da = Σ j = 1 n ( z j z j ) 2 τ   ( j = 1 , 2 n )
Five GCM models with high adaptability in the Shiyang River were finally selected for this study: CSIRO-Mk3.6.0, CanESM2, MRI-CGCM3, CCSM4 and CNRM-CM5. An equal-weighted averaging method was used to aggregate the simulated values of the precipitation output from the five GCMs in the Shiyang River Basin to form the dataset CMIP5-MME model.
After CMIP-MME was selected, the GCMs data needed to be corrected. The multi-year monthly mean value of historical measured data and historical GCMS data was calculated to construct the mean correction factor, so as to carry out daily mean value correction for future meteorological data, and the variance correction factor was constructed to carry out variance correction for future meteorological data after the mean value correction. A new future meteorological sequence was obtained with the corrected variance as the constraint condition.
The land use projection dataset of China’s future land use under the RCP4.5 scenario from the National Earth System Science Data Sharing Infrastructure, National Science & Technology Infrastructure of China (http://www.geodata.cn accessed on 22 January 2023) was used to predict the land use change. The land use dataset was based on the 30m resolution global land cover product FROM-GLC, which used 2010 as the baseline year. Then, a logistic regression cellular automata model was developed by adjusting the socioeconomic and climate factors under the RCP4.5 scenario for 2050 [50]. The new future maps produced for the years 2010–2050 and 2030 were used in this study. The raster data of land use were embedded and trimmed according to Shiyang River Basin to obtain the raster map of land use types of the basin in 2030.

3. Results and Discussion

3.1. Runoff Variation

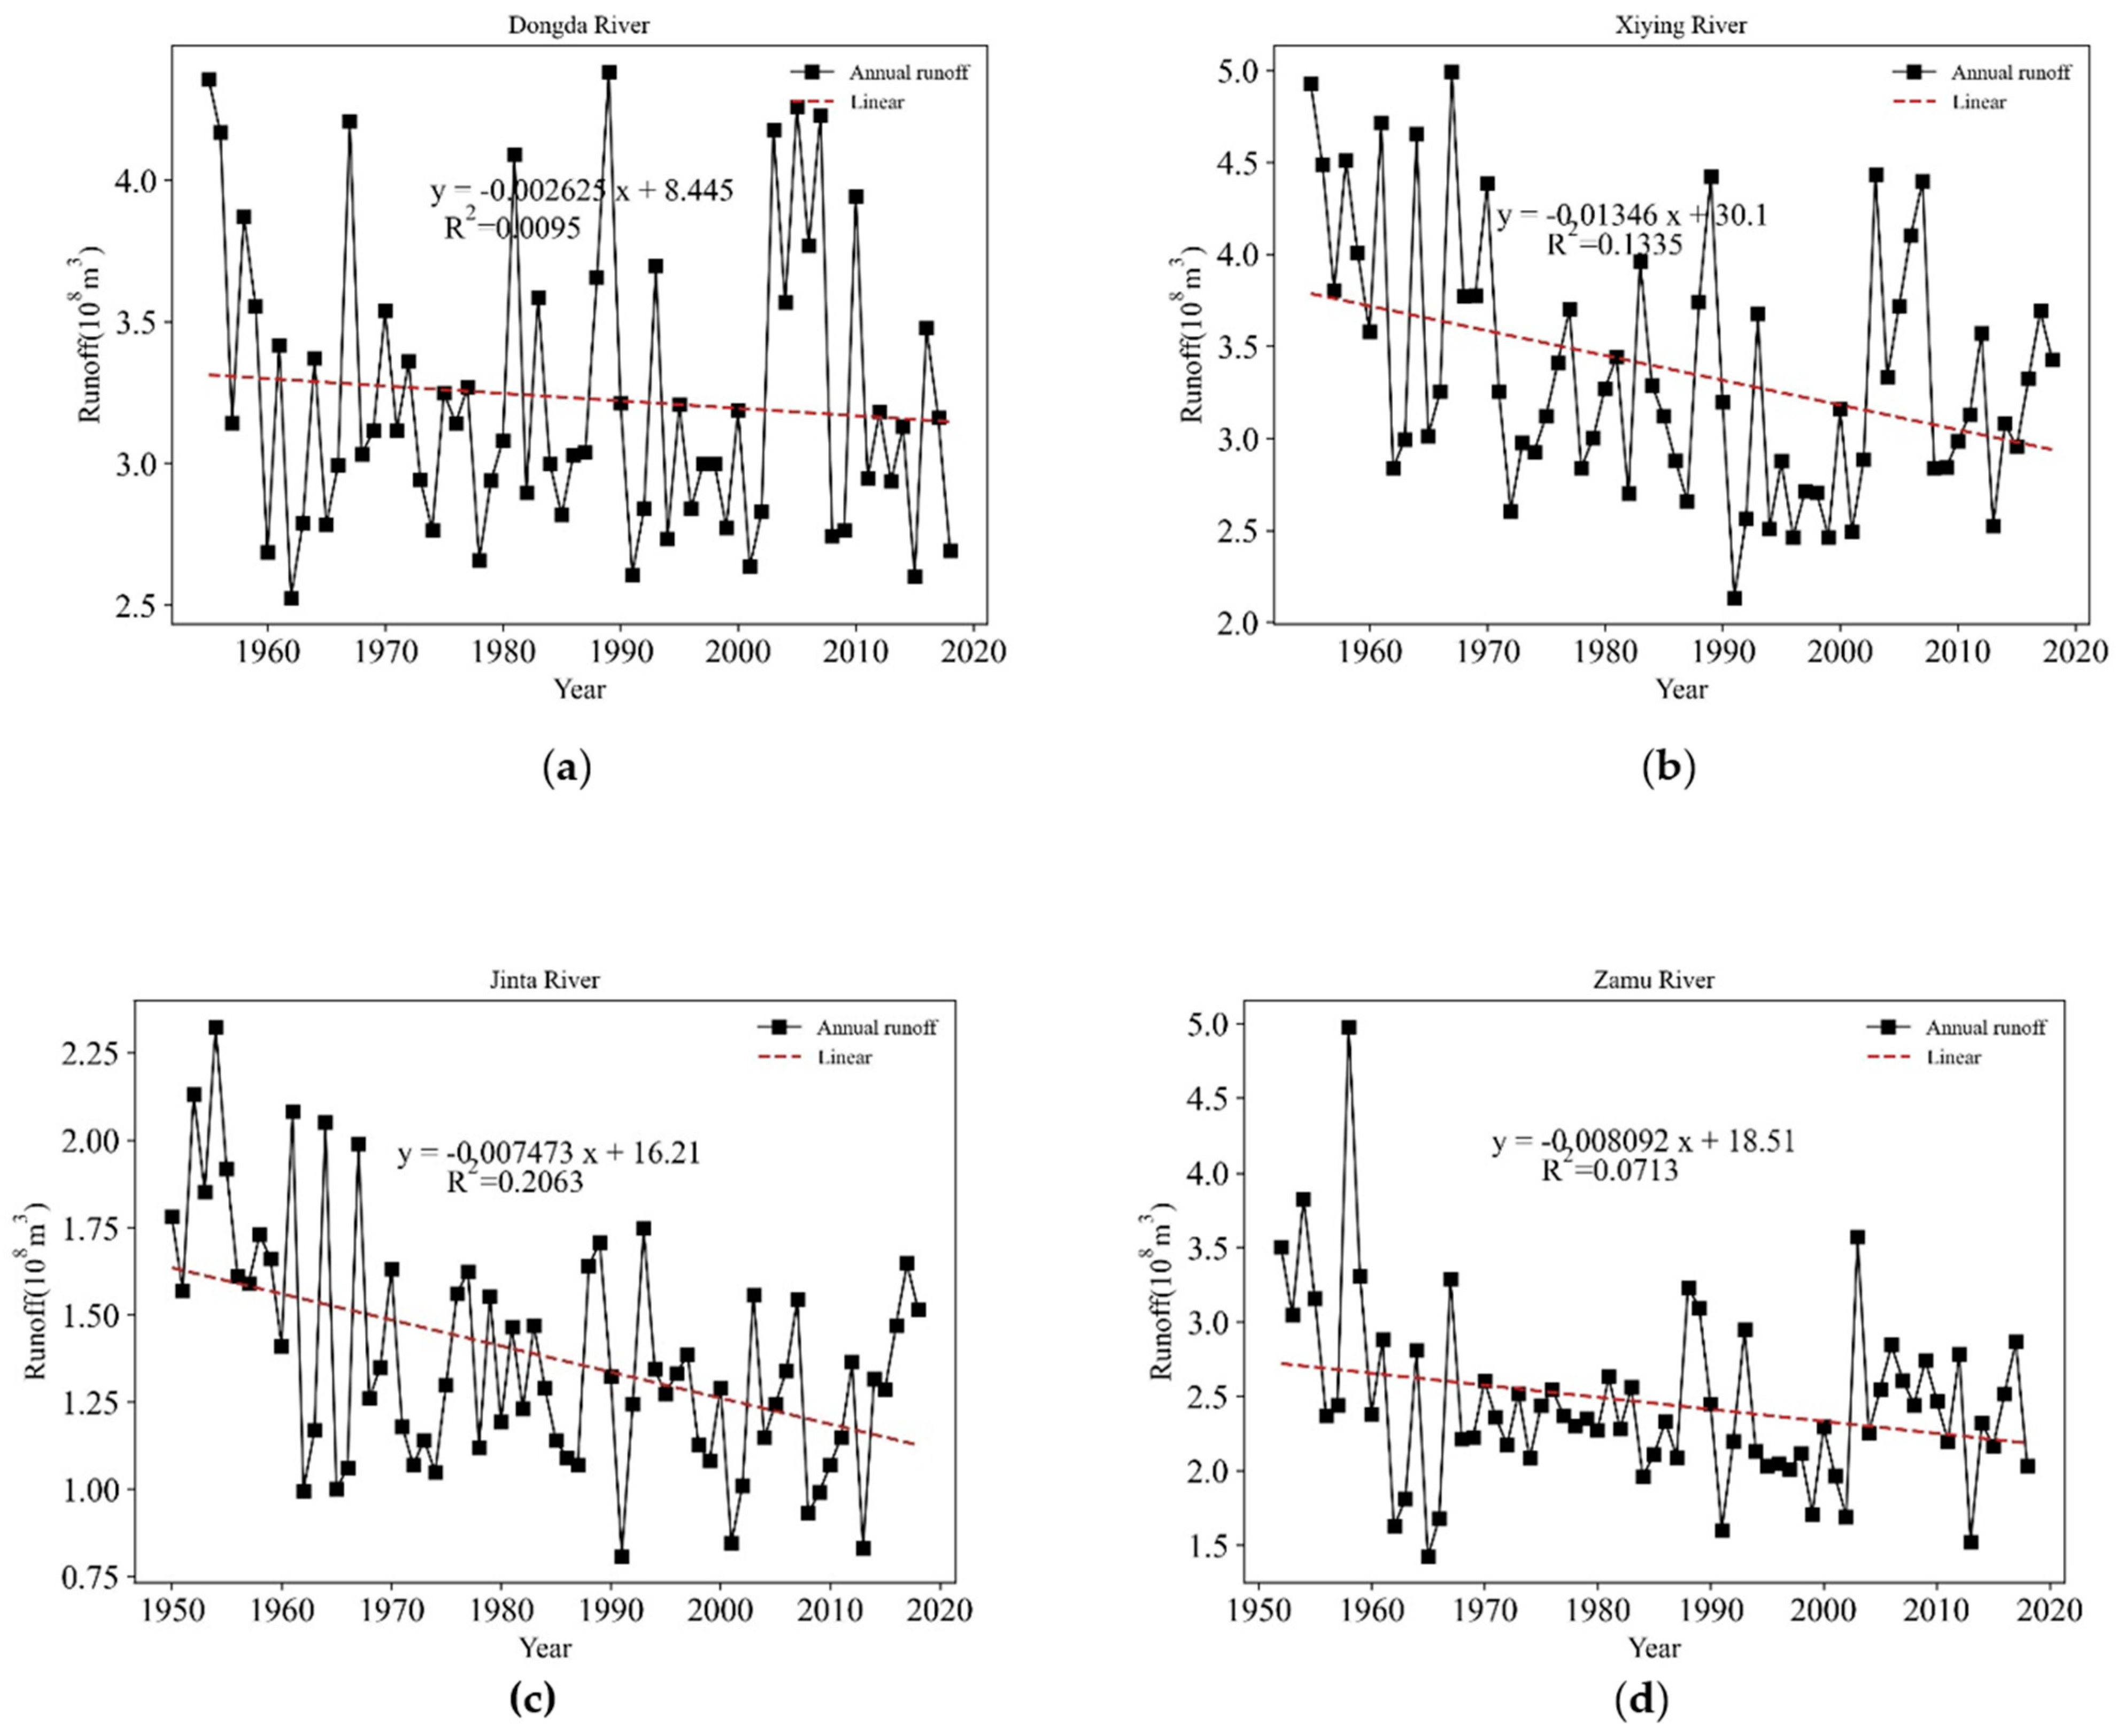
The interannual variation curve (Figure 2) was drawn from the existing annual runoff data from Caiqi station on the mainstream and six stations on the upper tributaries to reflect the change in runoff over the years and the trend of change. It can be found that the mainstream and the six upstream tributaries all show decreasing trends in runoff, especially in the Xiying River where the rate of decline is the greatest.
The multi-year average values of Dongda River from 1955 to 2018, Xiying River from 1955 to 2018, Jinta River from 1950 to 2018, Zamu River from 1952 to 2018, Huang Yang River from 1950 to 2018 and Gulang River from 1956 to 2018 are 322 million m3, 336 million m3, 138 million m3, 245 million m3, 143 million m3 and 0.69 billion m3, respectively. Their Cv values are 0.15, 0.20, 0.24, 0.24, 0.23 and 0.33, respectively. The highest Cv value of Gulang River indicates that the inter-annual fluctuation of Gulang River is largest, while Dongda River is the smallest and the inter-annual fluctuation is the most moderate.
There is a strong correlation between the intensity of inter-annual fluctuations and the volume of water in the tributaries. The larger the volume of water in the tributaries, the smoother the inter-annual fluctuations.
The average multi-year runoff from 1956 to 2018 was 1.393 billion m3 in the mainstream. The maximum value of annual mean runoff is 2.042 billion m3 in 1958 and the lowest mean runoff of 954 million m3 in 1991. The inter-annual fluctuations in the runoff of the Shiyang River are relatively gentle.
The results of the MK trend test for runoff series changes are shown in Table 1. The long time series of water volumes in the upper tributaries and mainstream all showed reducing trends, with the Xiyang, Jinta, Huangyang and Gulang rivers showing significant declining trends and passing 0.05 significance, while the Dongda, Zamu and mainstream did not pass the 0.05 significance test.
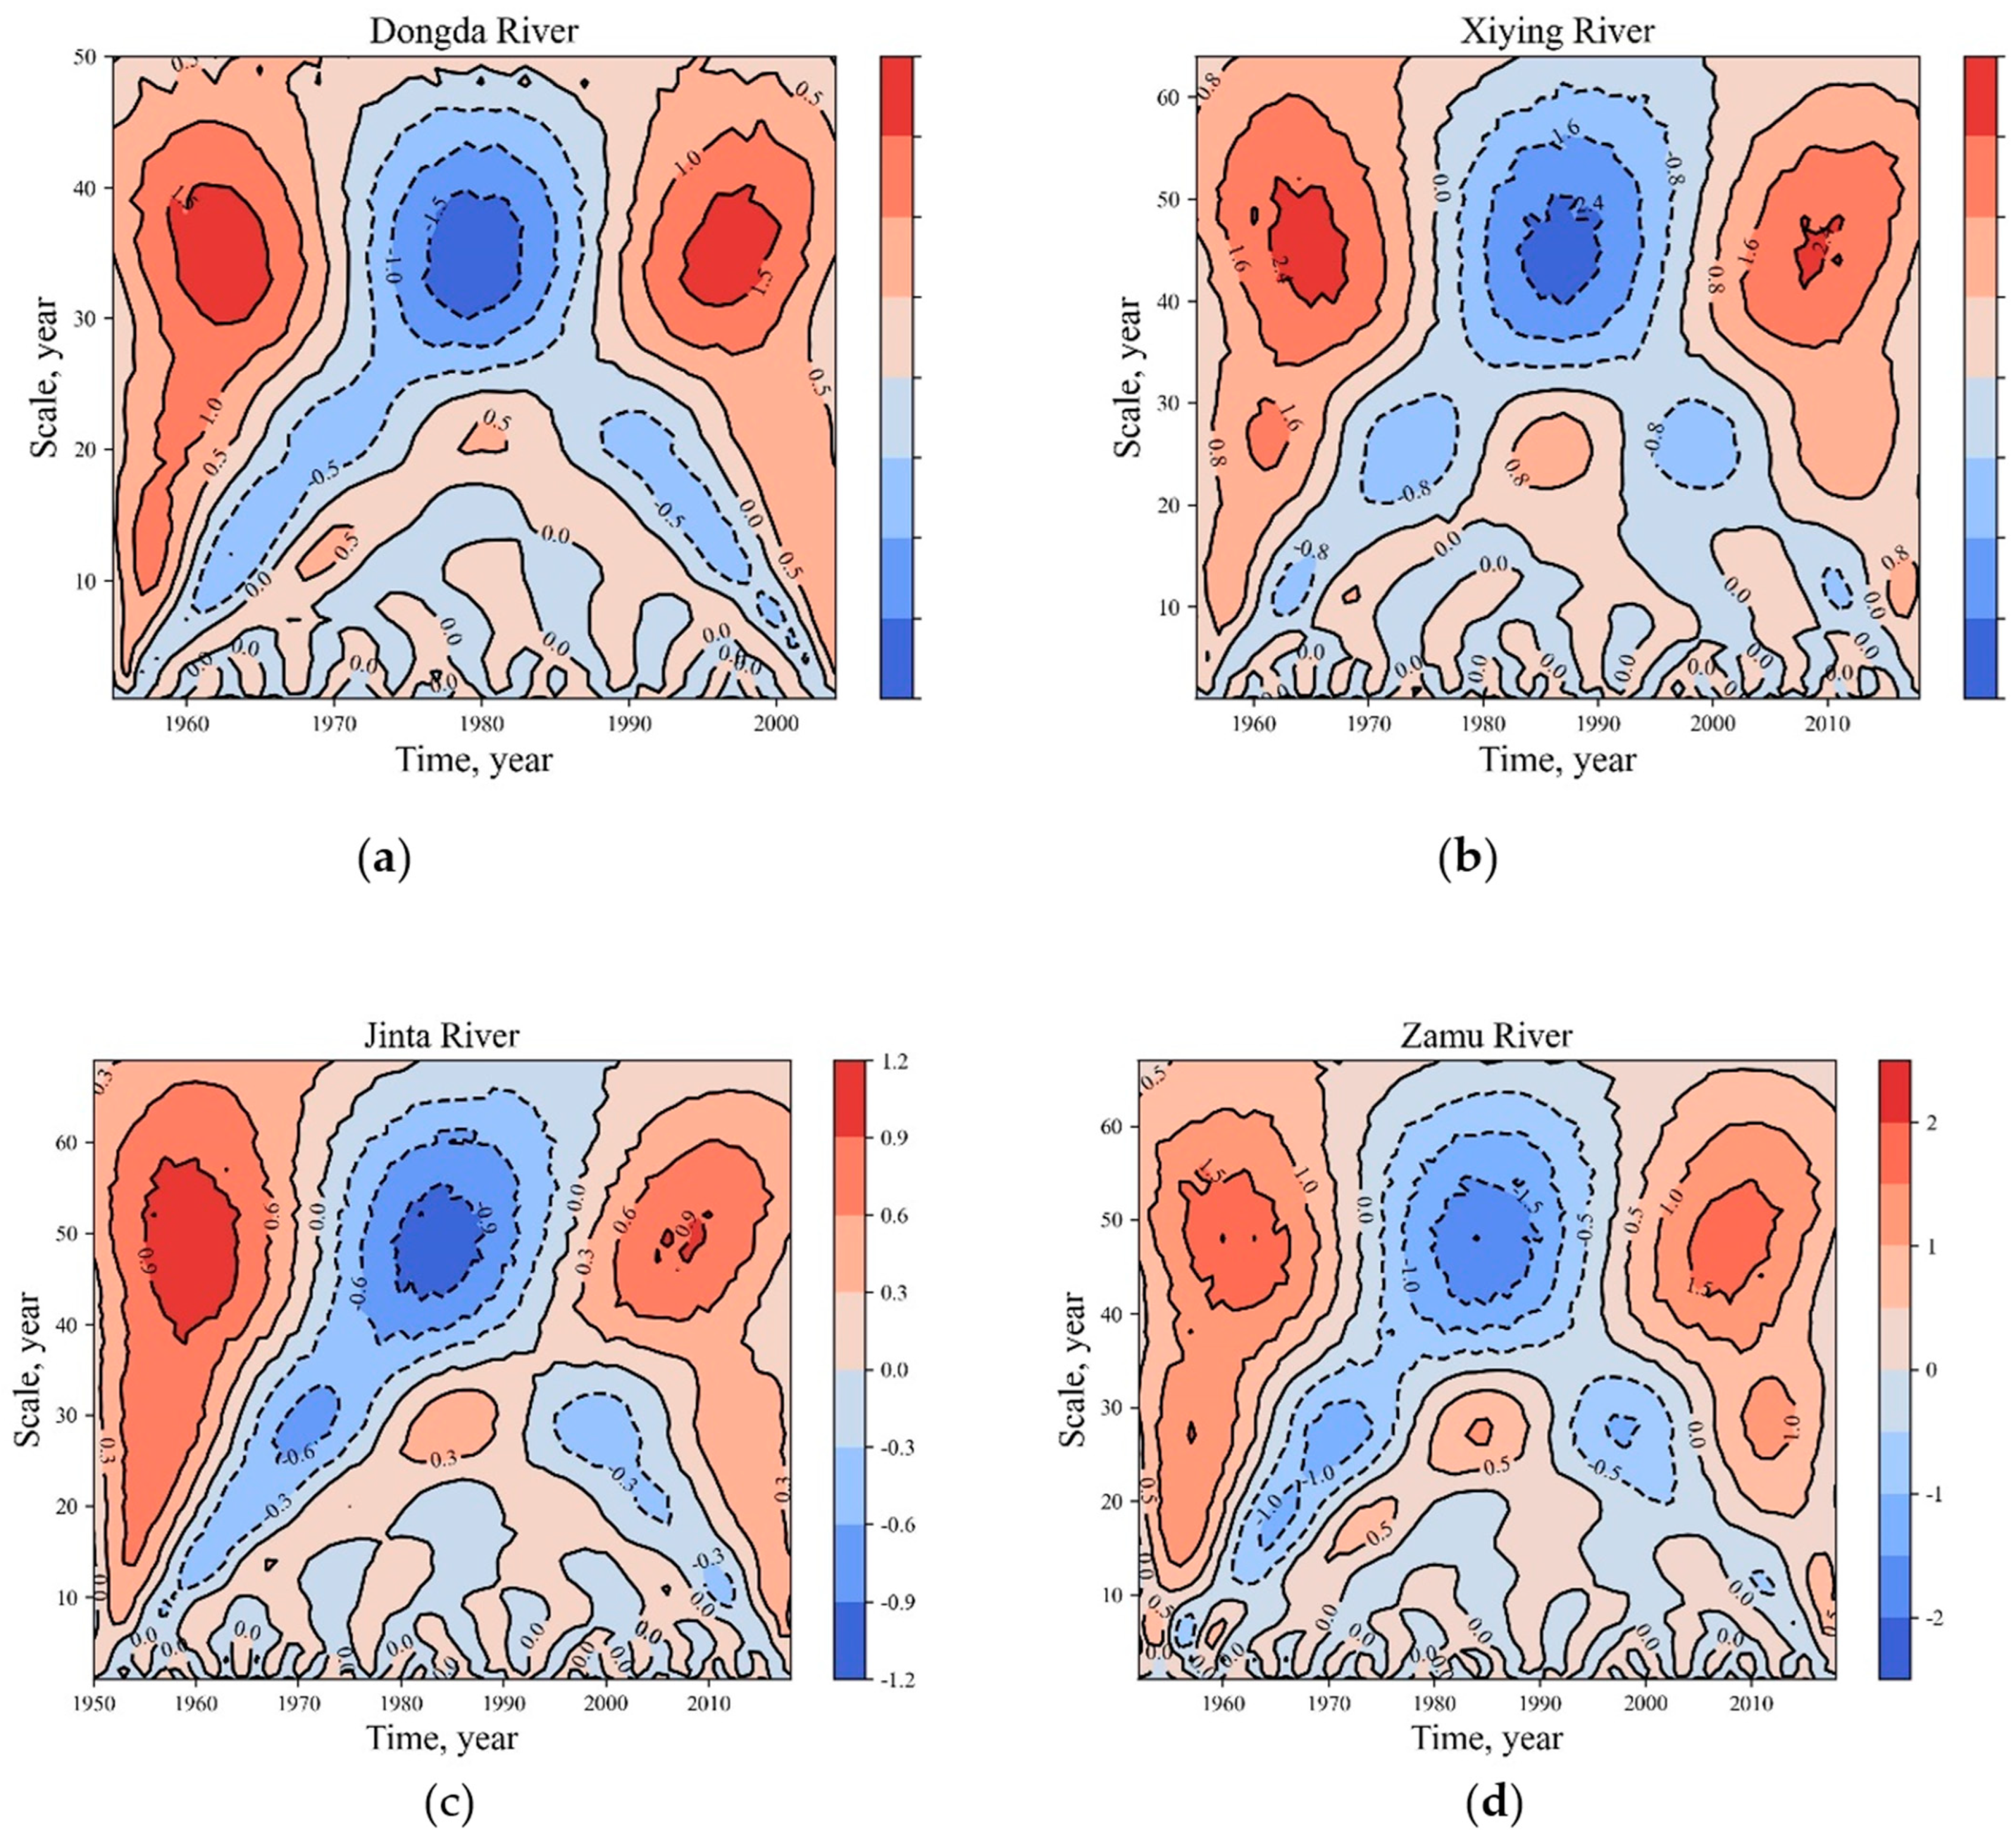
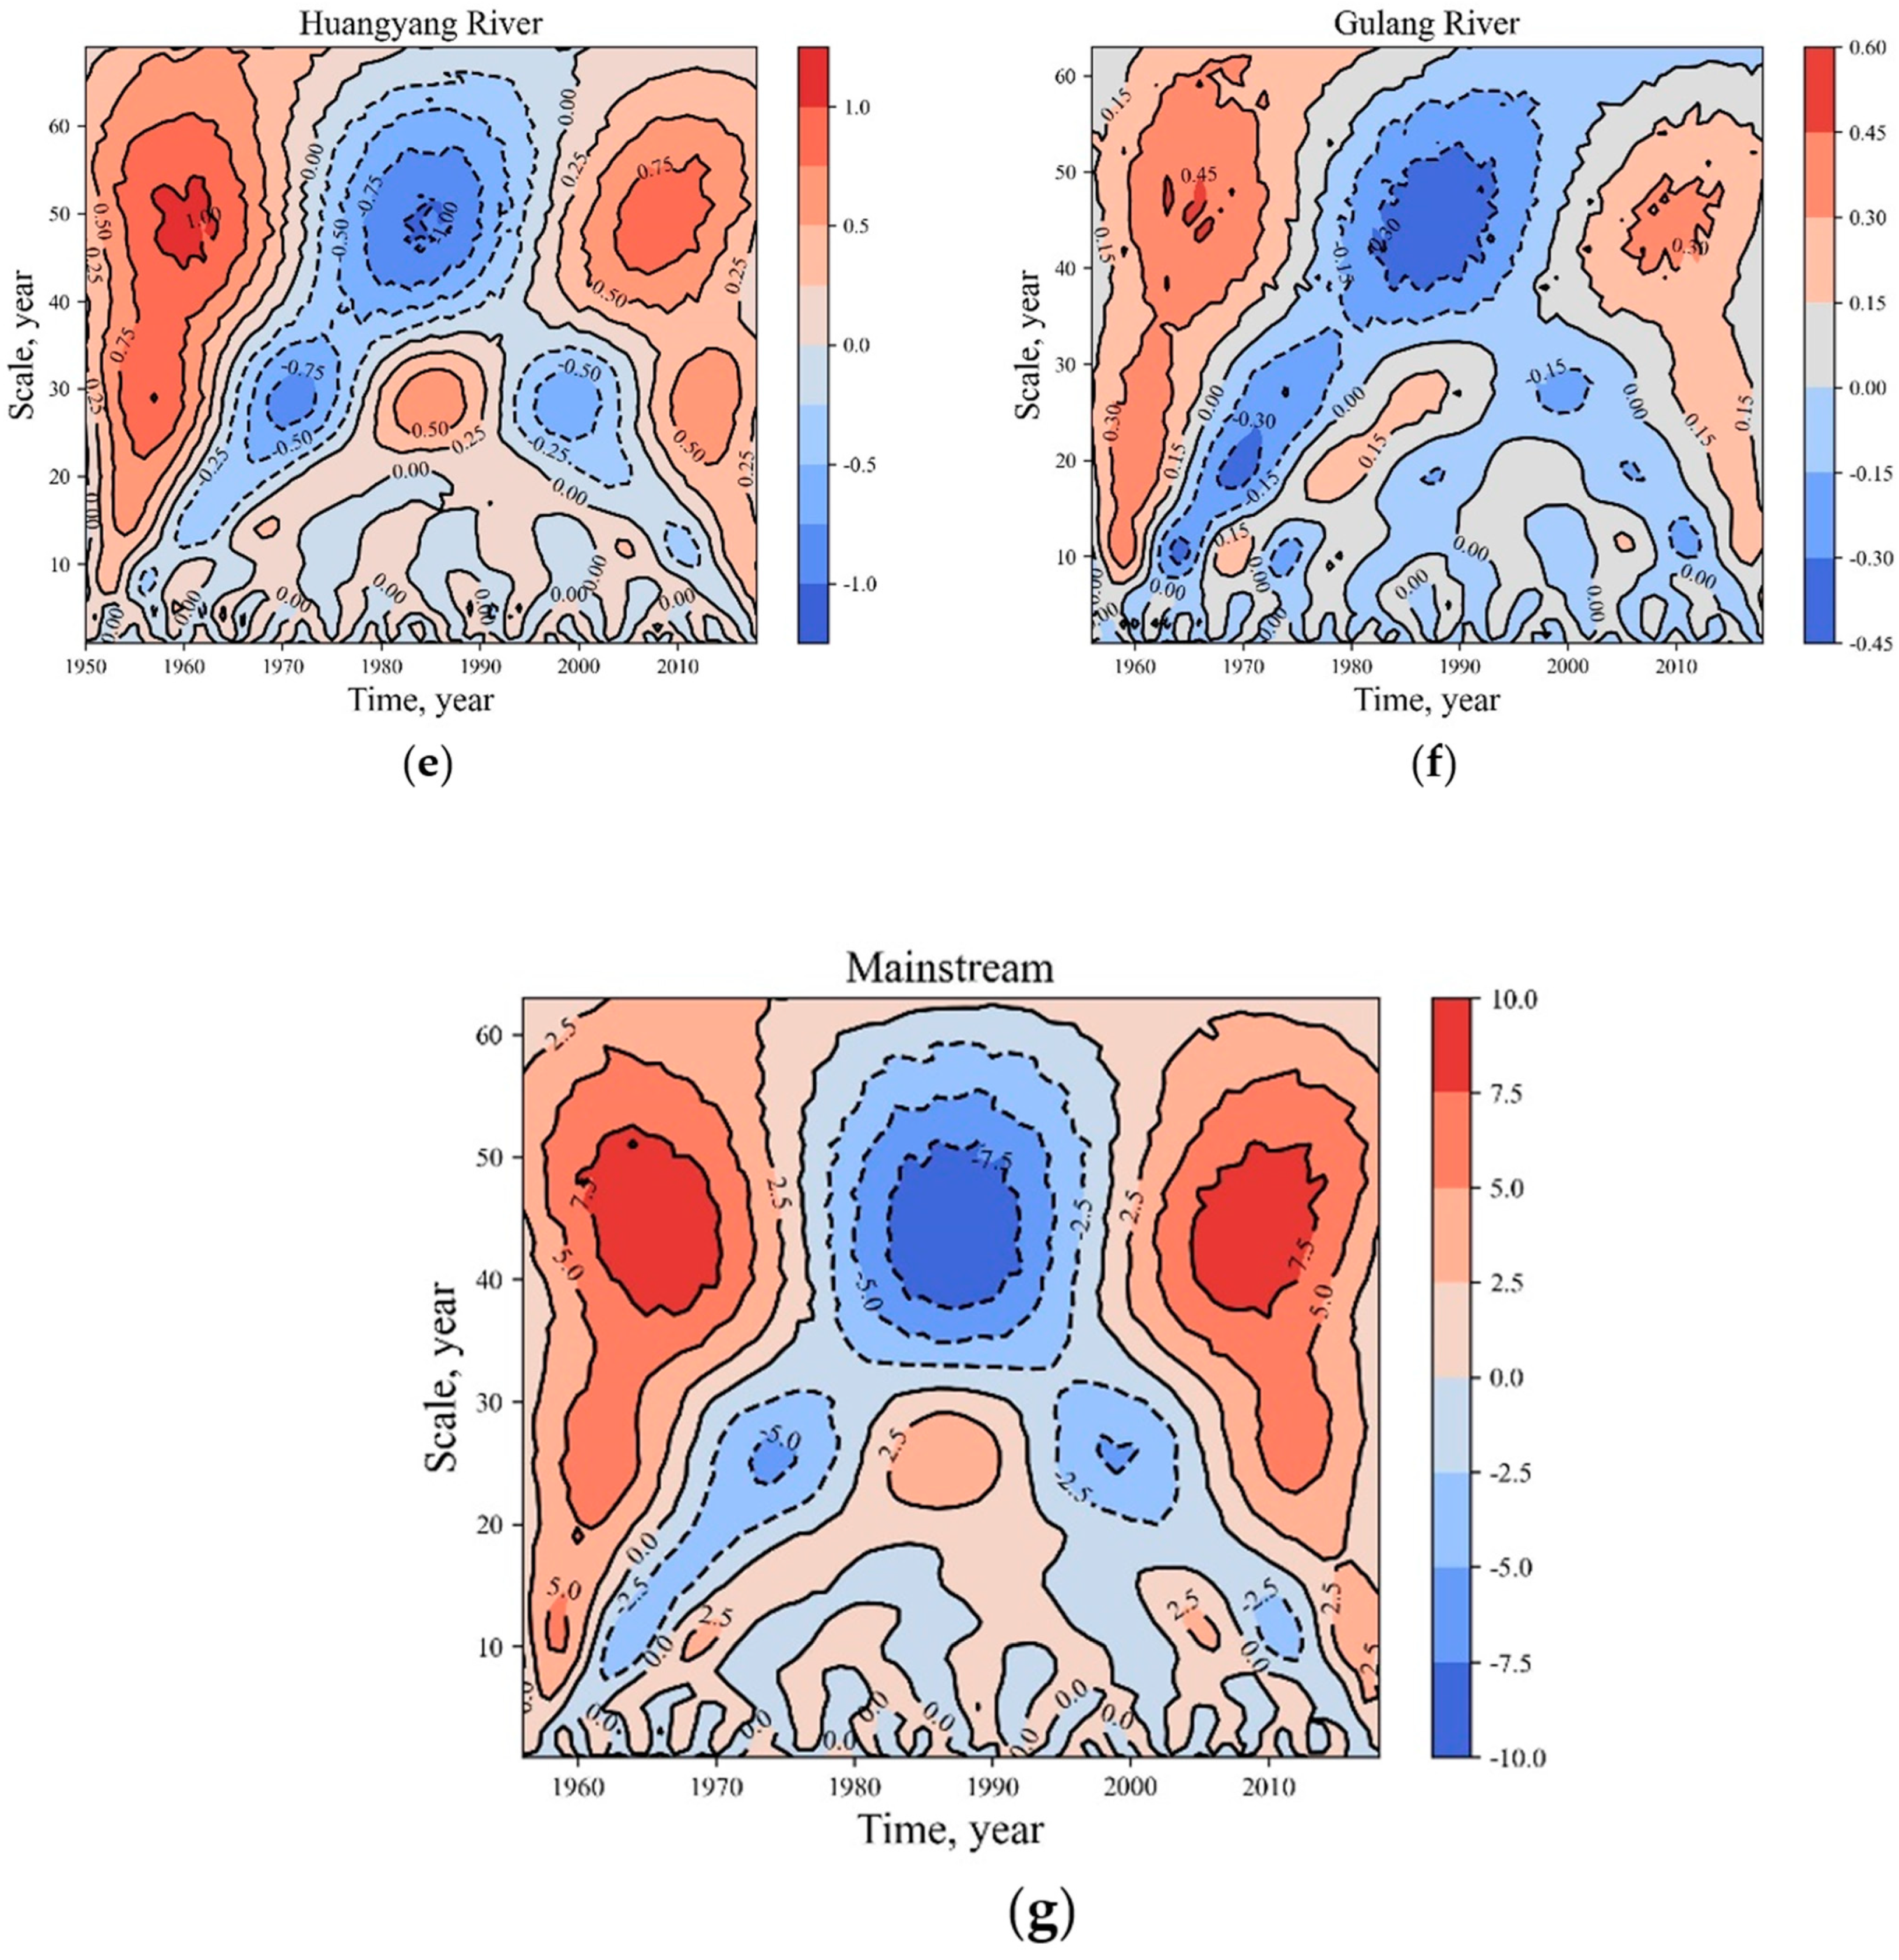
Figure 3 shows the contour plots of the real wavelet coefficients and the wavelet variance curves of the runoff series for the seven characteristic stations. In the real wavelet contour plots of the runoff series, positive values (red) indicate that it is a high flow period and negative values (blue) represent periods of low flow.
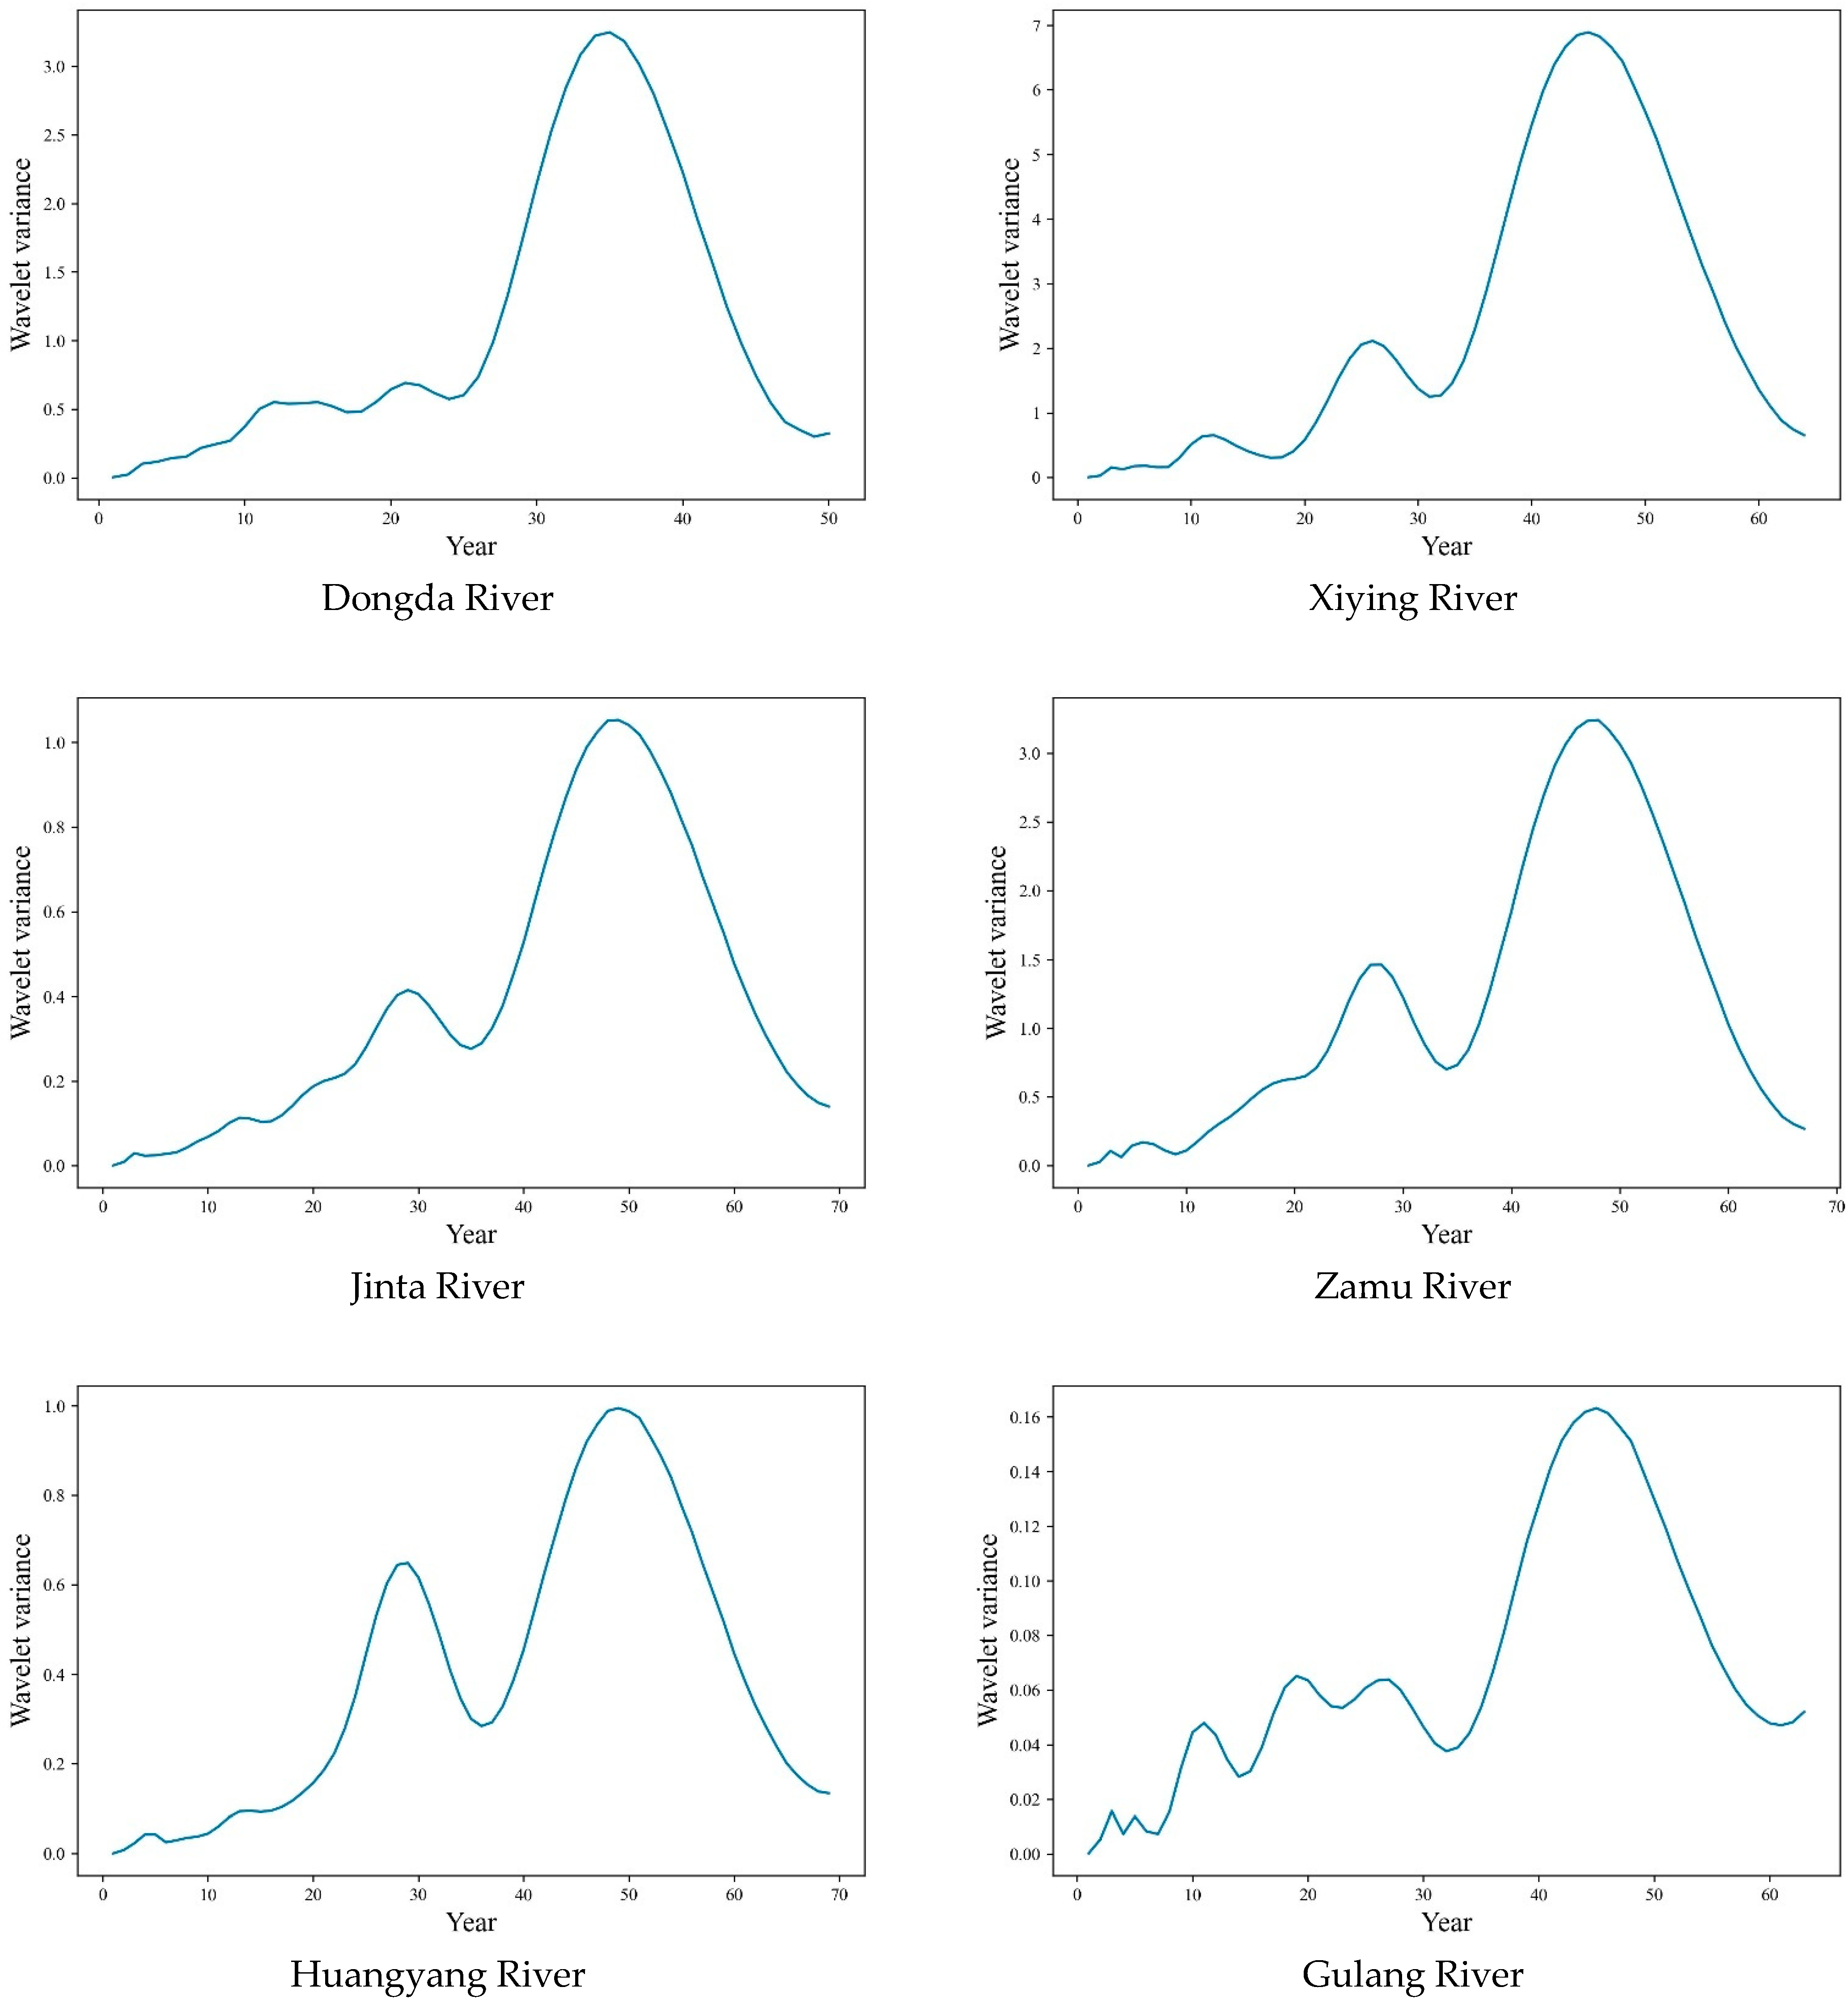
From the wavelet coefficient plots (Figure 3), we can find that the morphology of each tributary and mainstream in the Shiyang River basin is relatively consistent, indicating that the periodicities of each tributary and mainstream in the Shiyang River basin are relatively similar. Several strong multi-timescale characteristics can be found from annual runoff time series. In order to obtain more accurate periods, the wavelet variances (Figure 4) of these rivers were calculated and plotted as follows.
According to the wavelet variance plots in Figure 4, the largest peak corresponds to the first main period and the second largest peak corresponds to the second main period. The first and second main periods of each station are shown in Table 2.
Overall, there are two main types of cyclical patterns in the 40–50-year and 20–30-year timescales in the evolution of all runoffs over about 60 years. It can be seen that there is one alternating high–low flow period oscillation in the 40–50-year timescale and two alternating high–low flow periods in the 20–30-year timescale.

3.2. Calibration, Validation and Sensitivity Analysis of the SWAT Model

Combined with the data of each sub-watershed and mainstream, the model warm-up periods of 1 or 2 years were set, and calibration period and the validation period were chosen. Then, the land use types of the corresponding years were input to drive the SWAT model, and the parameters of the six tributaries and the main stream were determined, respectively.
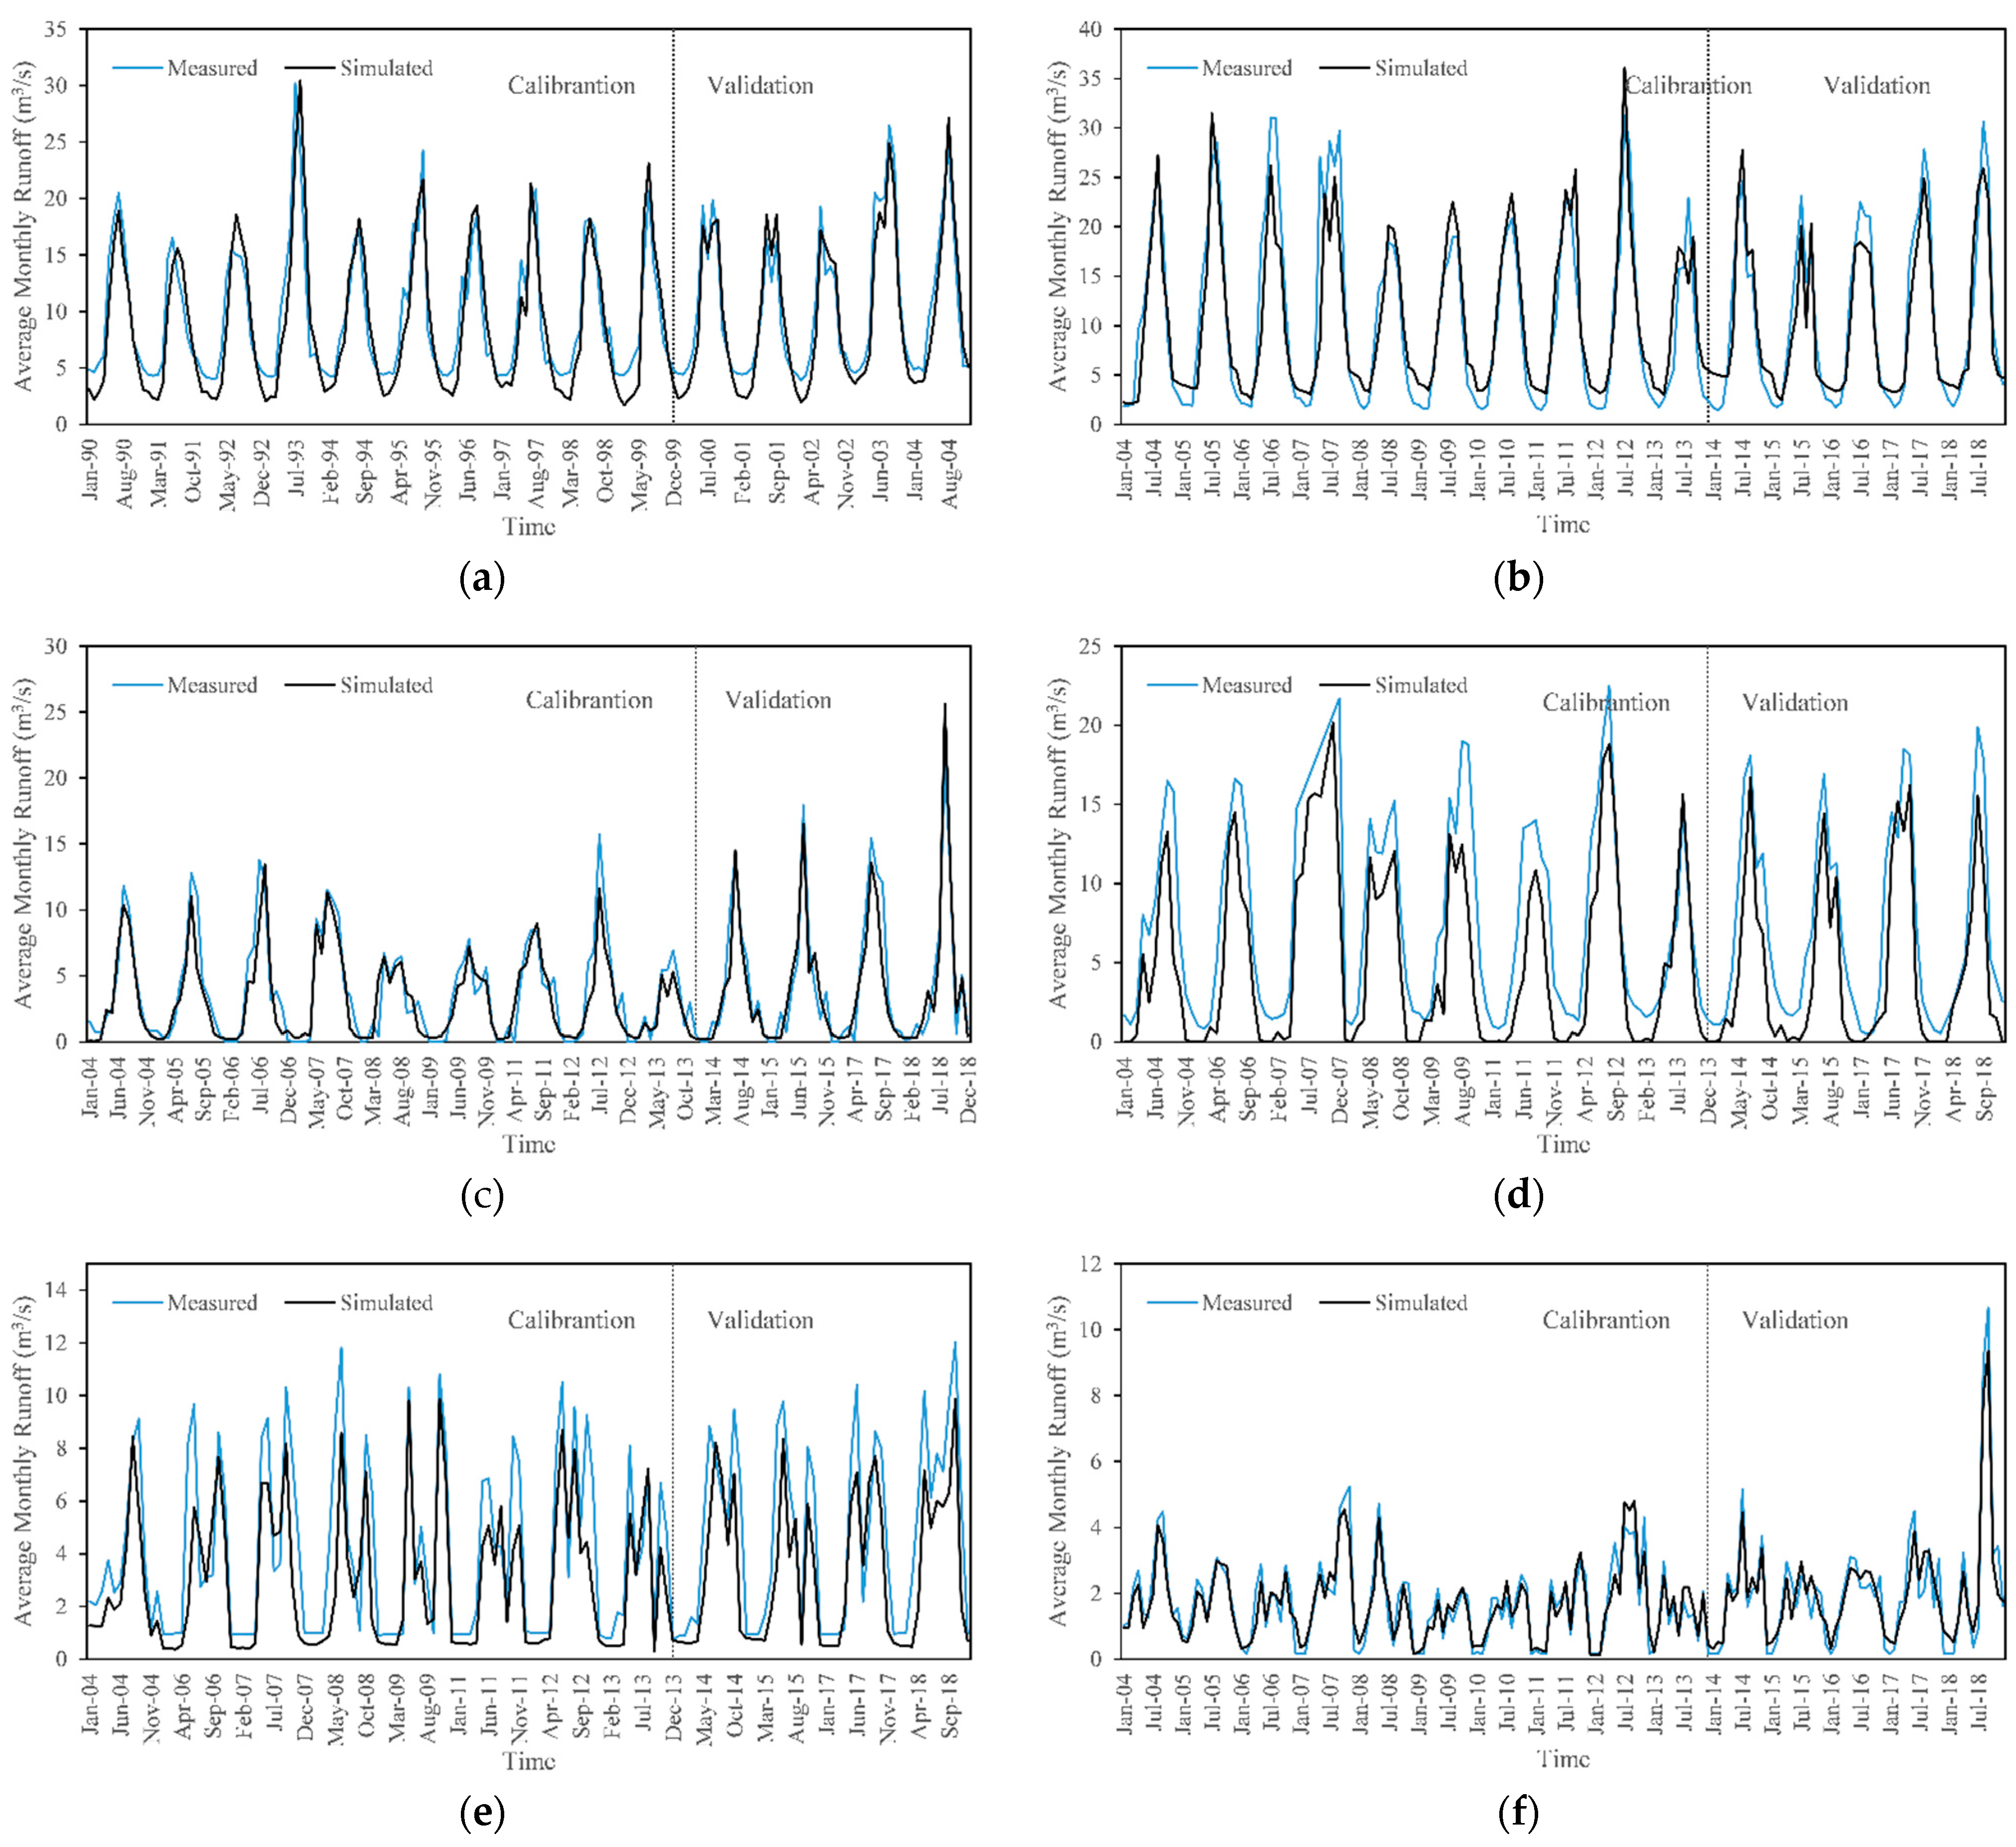
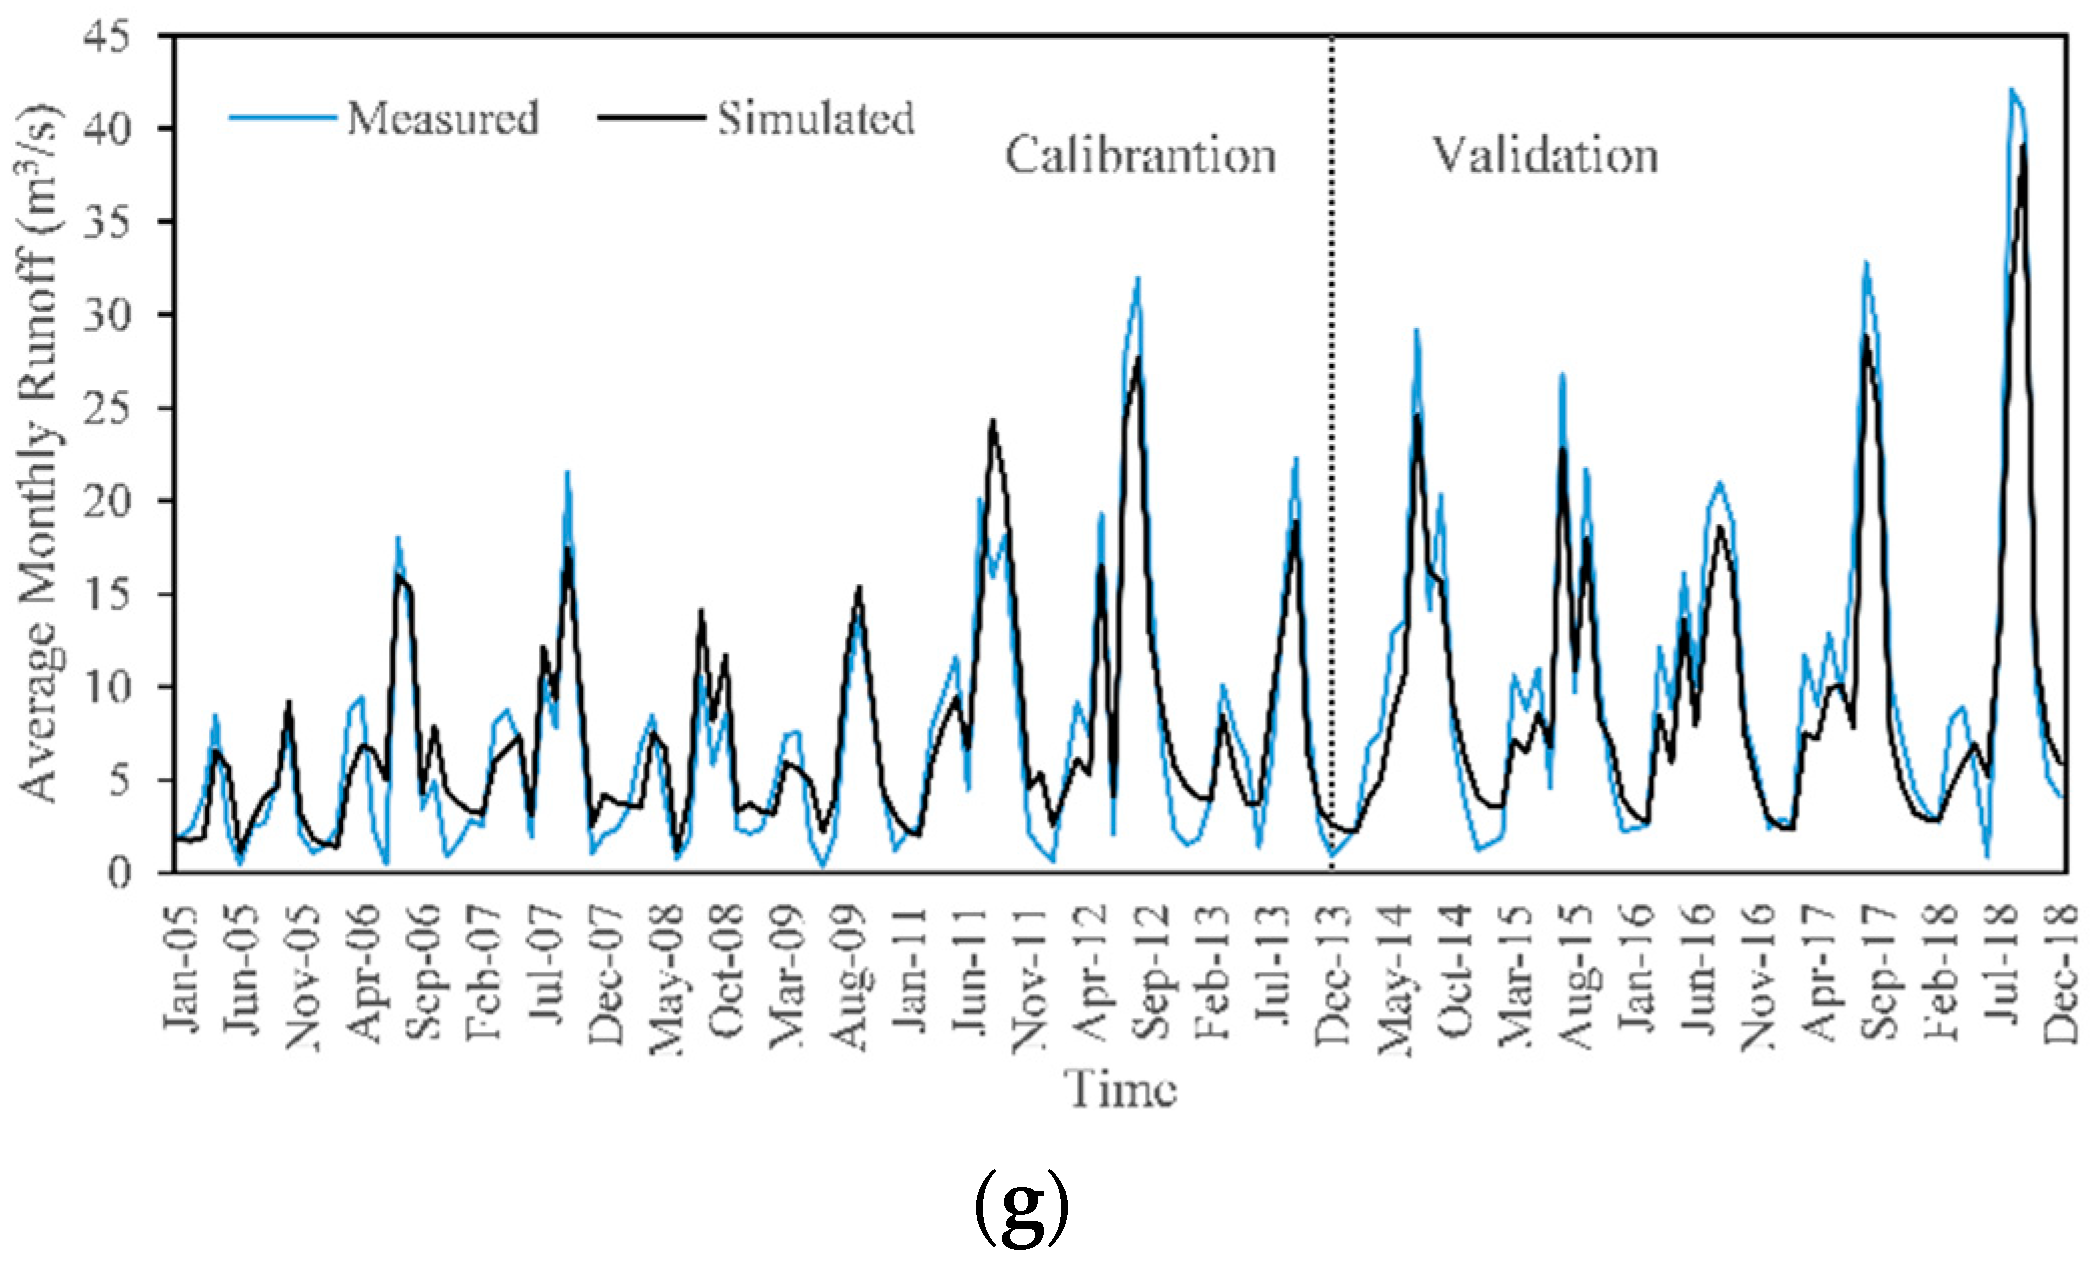
The relative errors Re, coefficients of determination R2, NSE and the values of P-factor and R-factor for the calibration and validation periods of the monthly mean runoff for each basin are shown in Table 3. A strong connection was discovered between measured and simulated discharge, which indicates that the SWAT model has strong applicability in the Shiyang River basin.
By this time, the simulated and measured monthly runoff of the calibration period and the validation period was plotted in Figure 5. It can be intuitively seen that in the upper sub-watershed and mainstream, the simulated results of the monthly runoff of the SWAT model in the calibration period and the validation period are in good agreement with the measured runoff process.
At the same time, it can be observed in Figure 5 that the model was incapable of simulating some extreme values. This can be attributed to uncertainty in the input dataset, such as observed precipitation and flow data, or uncertainty in the model itself.

3.3. Modelling Hydrological Responses to Possible Climate and Land Use Changes in the Future

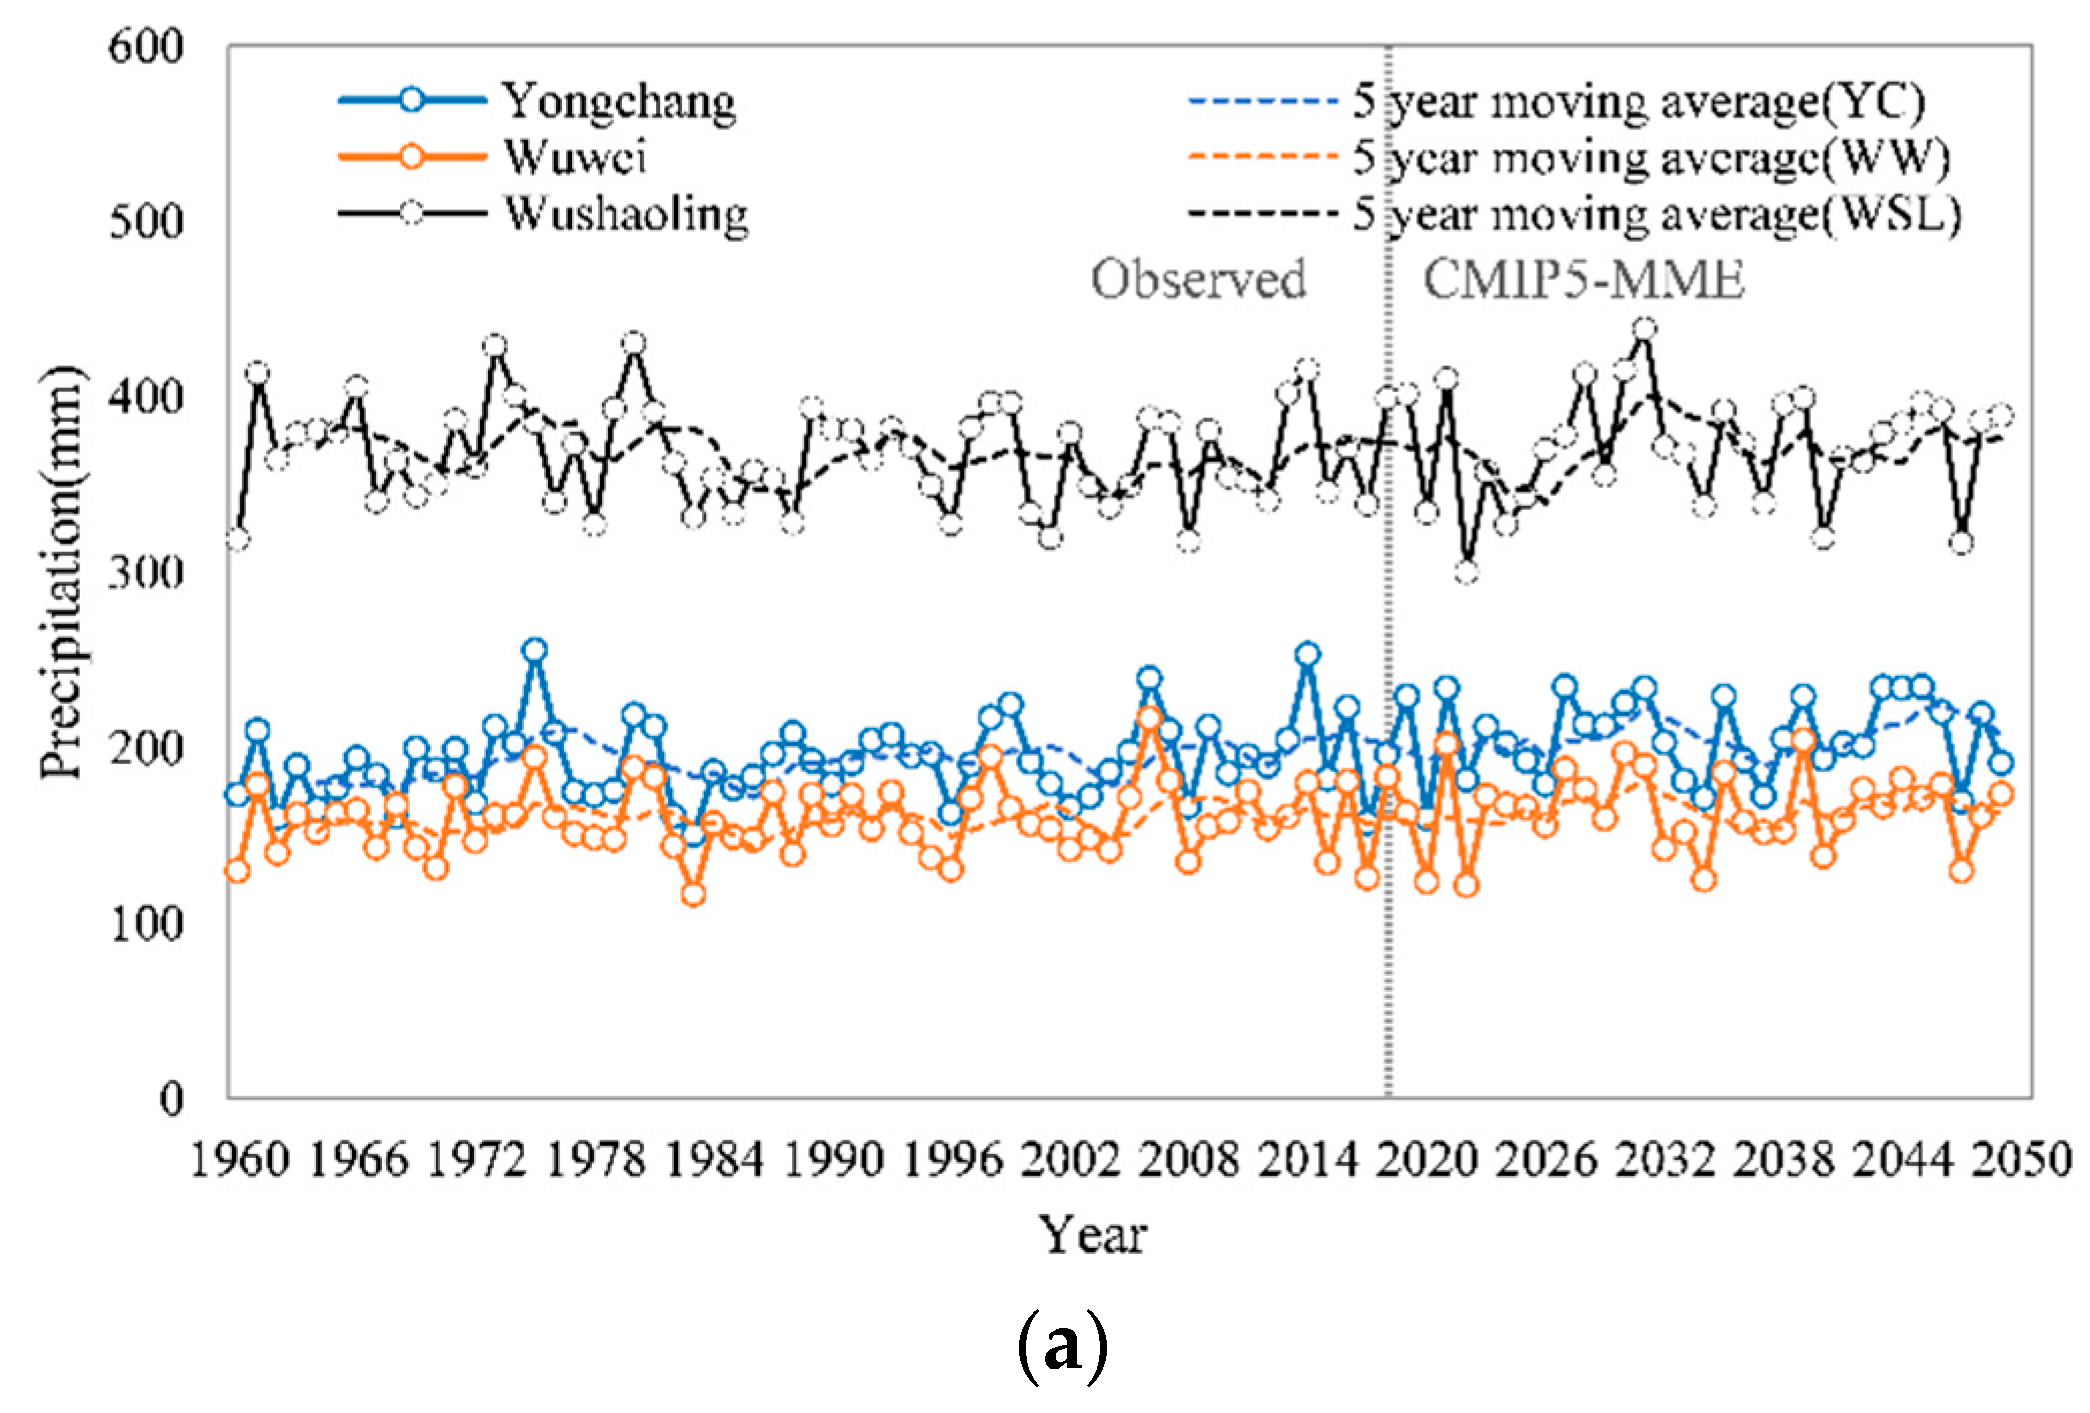
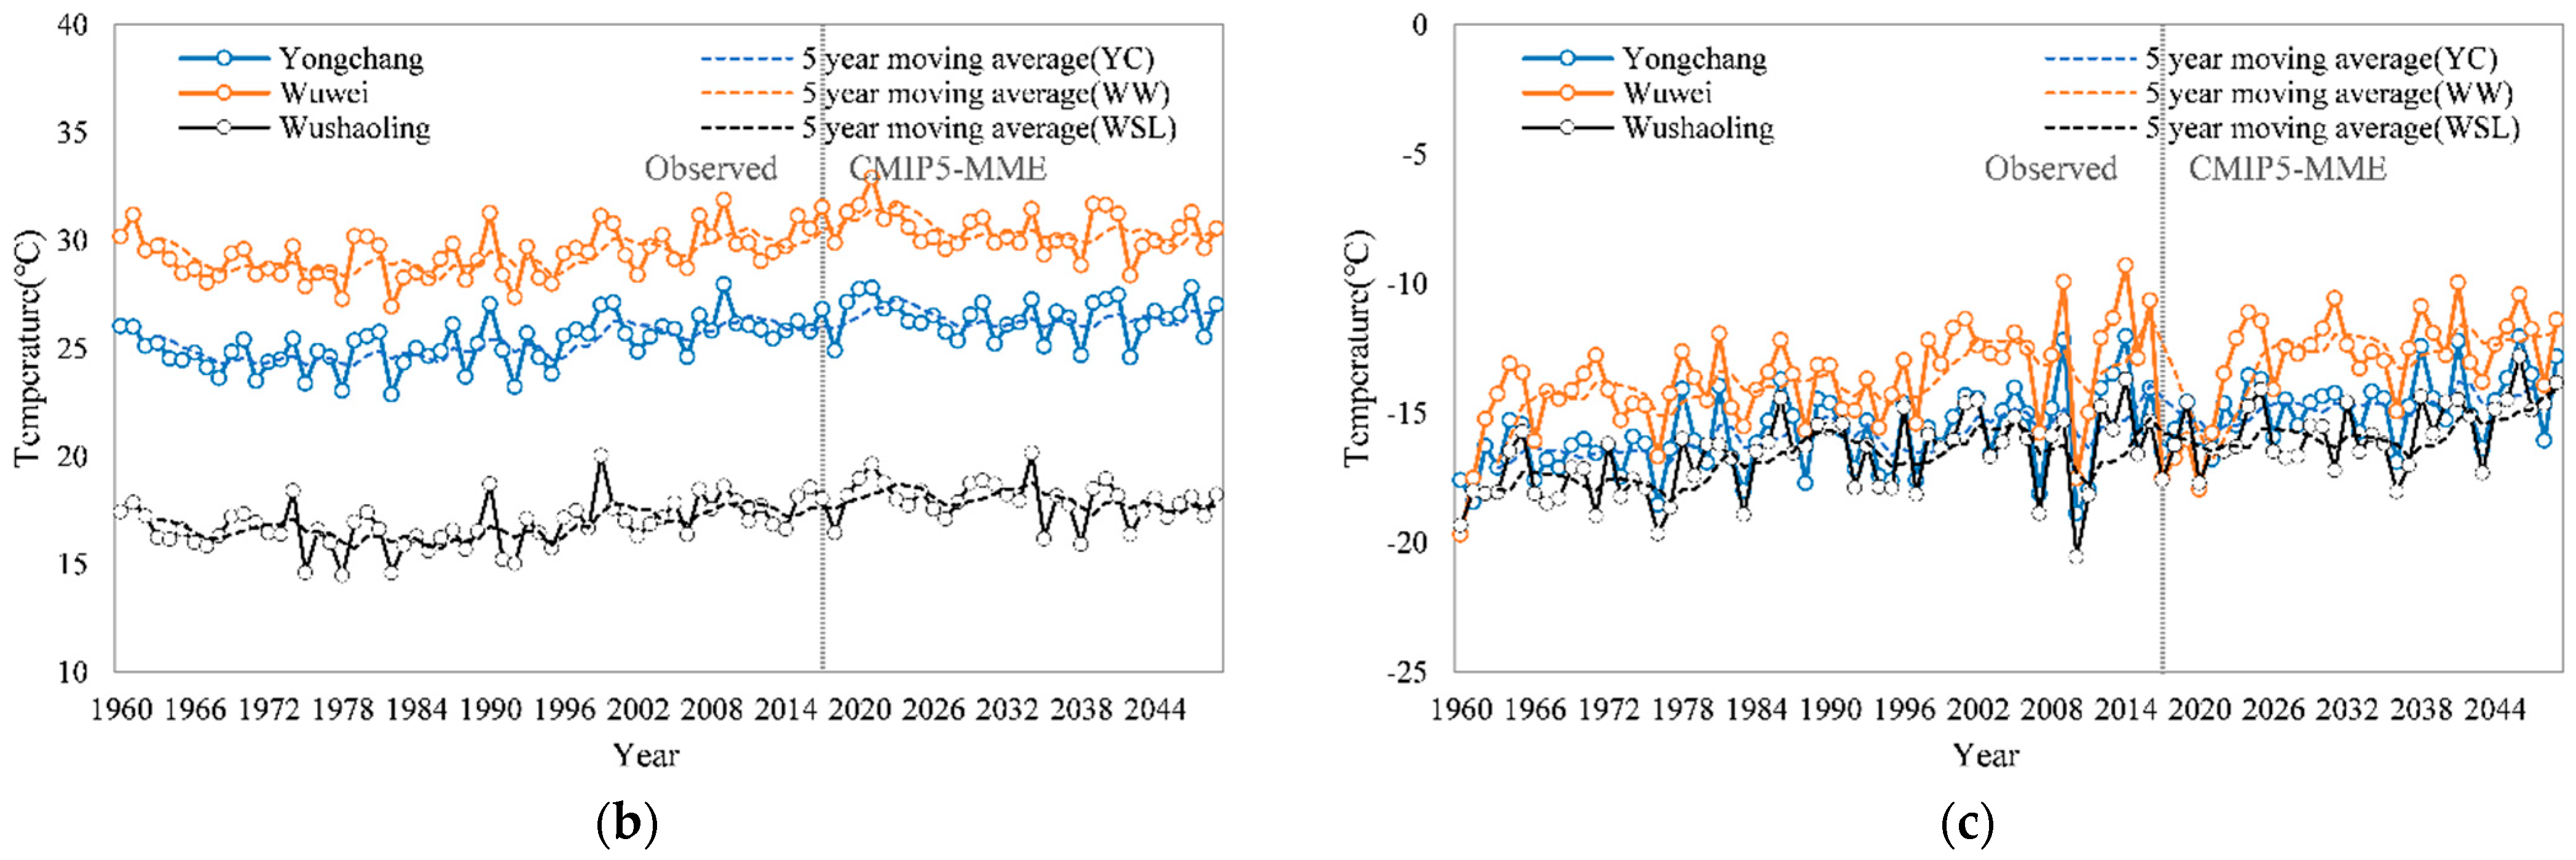
According to the CMIP5-MME prediction results, the annual rainfall of Yongchang and Wuwei stations from 2019 to 2050 has an insignificant increasing trend compared with the historical series, while Wushaoling has an insignificant decreasing trend. In addition, the maximum and minimum temperatures of Yongchang, Wuwei and Wushaoling stations will increase in the future compared with 1960–2018. The variations of annual precipitation, annual maximum temperature and annual minimum temperature can be found in Figure 6.
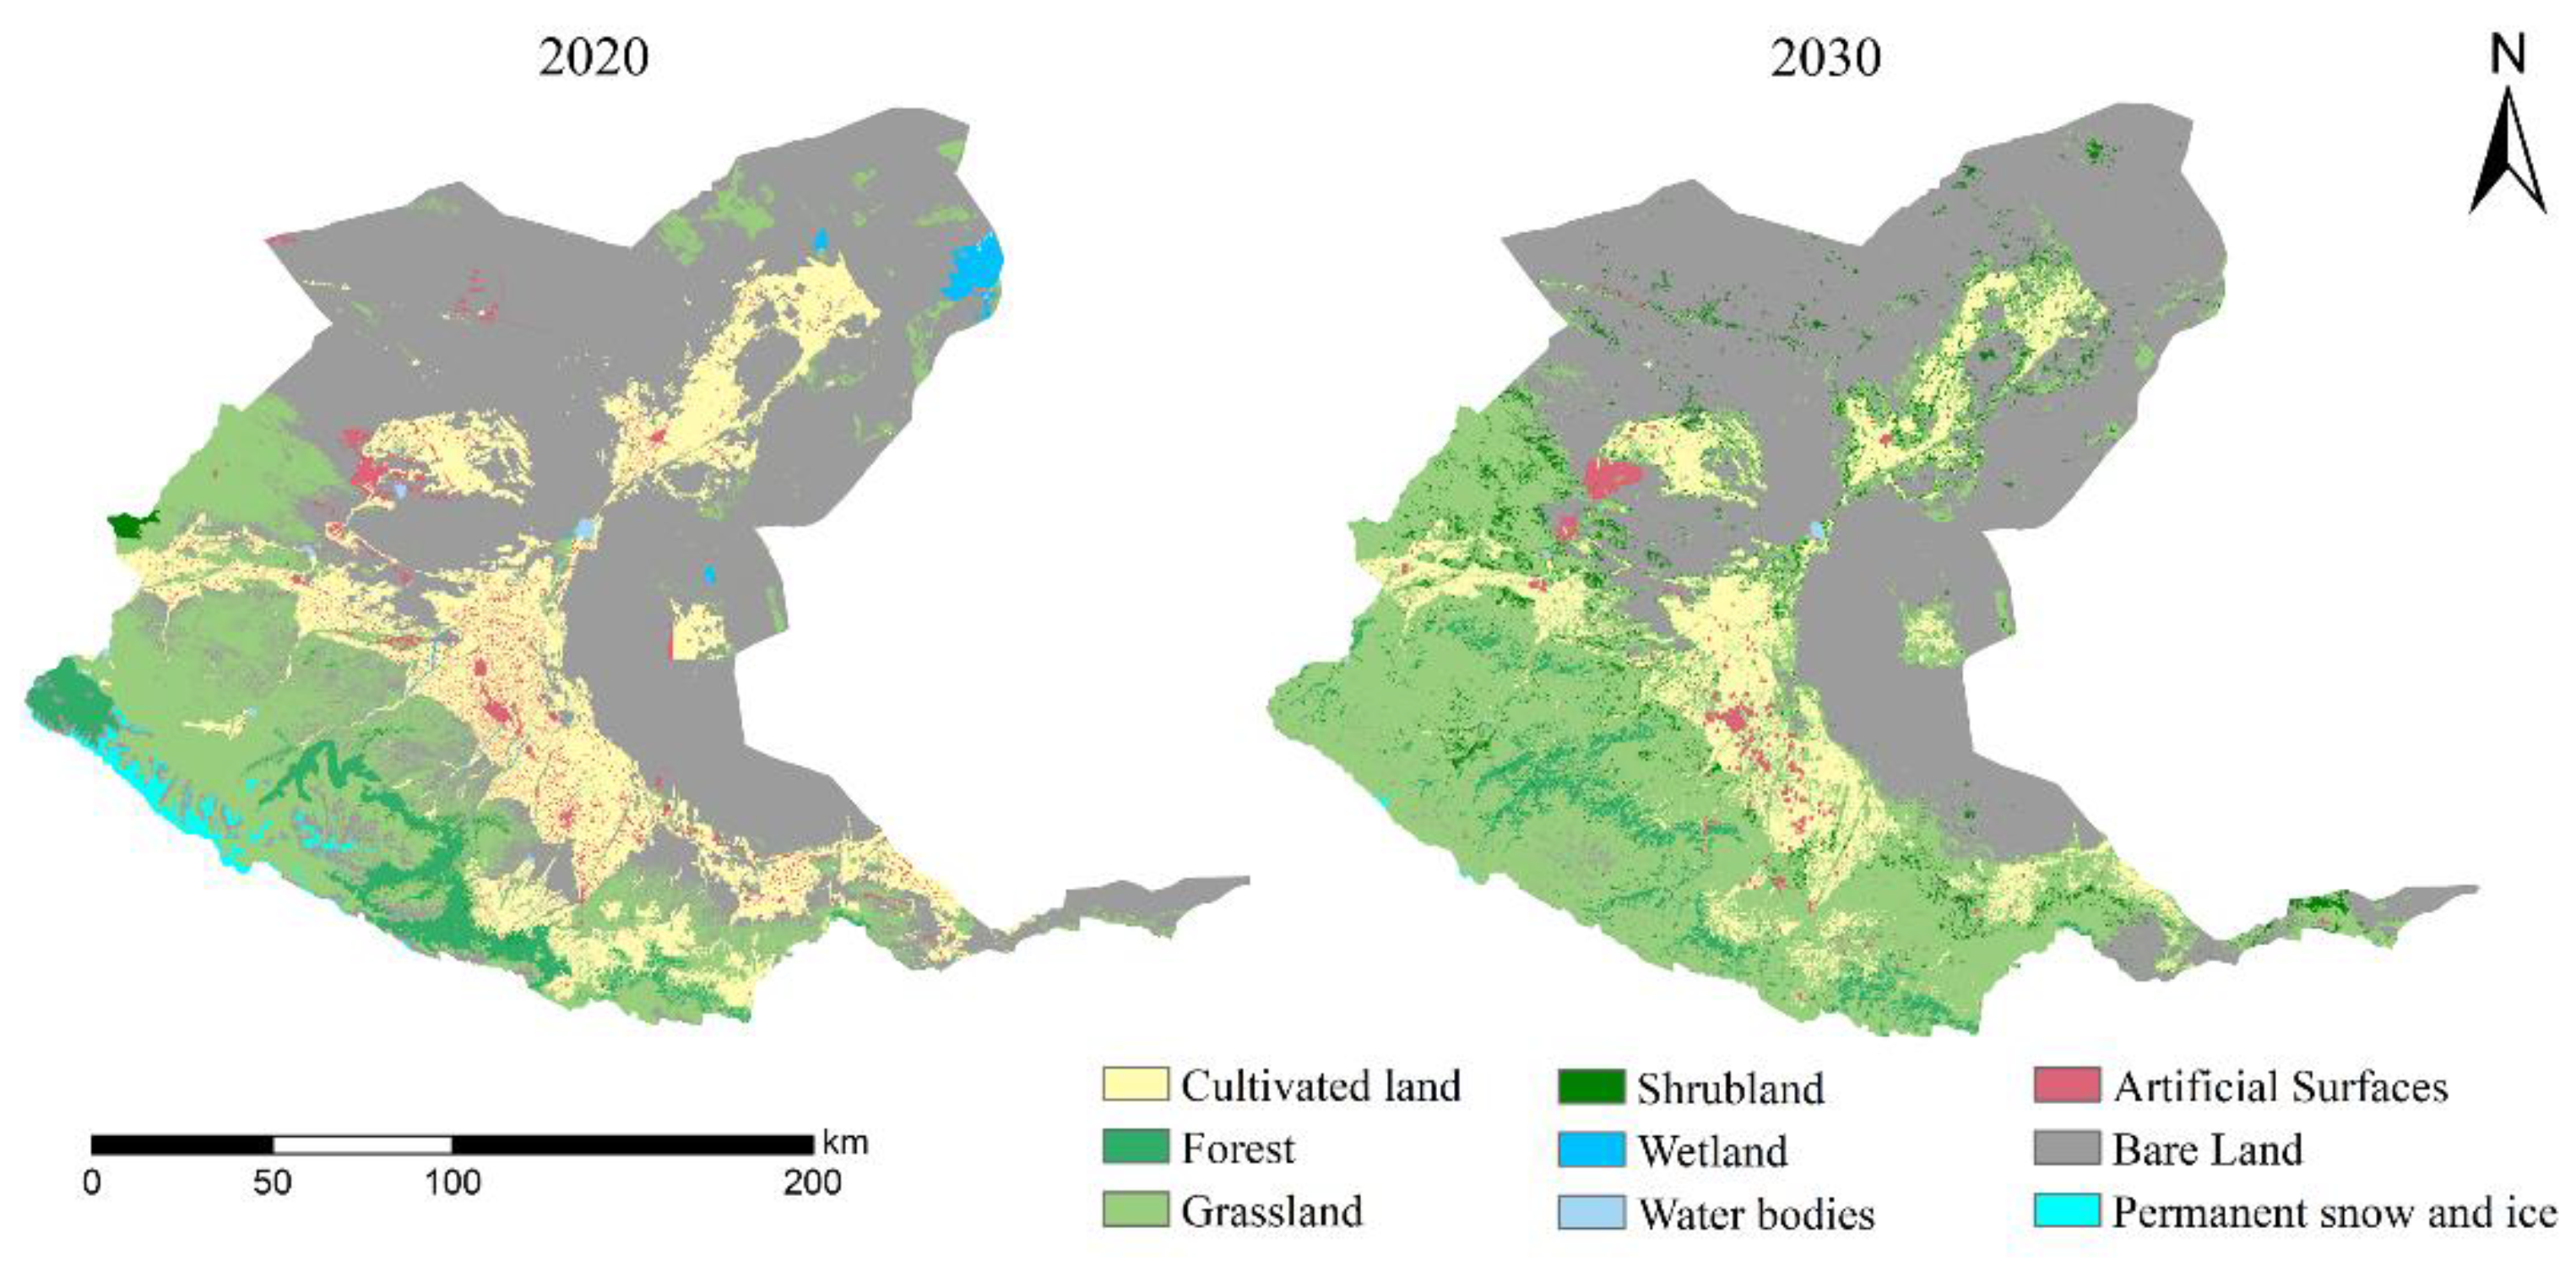
Compared to 2020, there is a clear change in the type of land use in 2030, as seen in Figure 7.
The area of cultivated land, bare land and water bodies decrease by 28.9%, 13.1% and 76.4%, respectively, while the area of forest land and artificial surfaces remains largely unchanged and the area of grassland increases by 43.3%. This could be attributed to a combination of climate warming and human activity. At the same time, it can be seen that the permanent snow and ice have almost disappeared, which is consistent with previous studies demonstrating that the rate of icebergs melting in the Shiyang River basin is accelerating and will peak around 2030 [51,52,53].
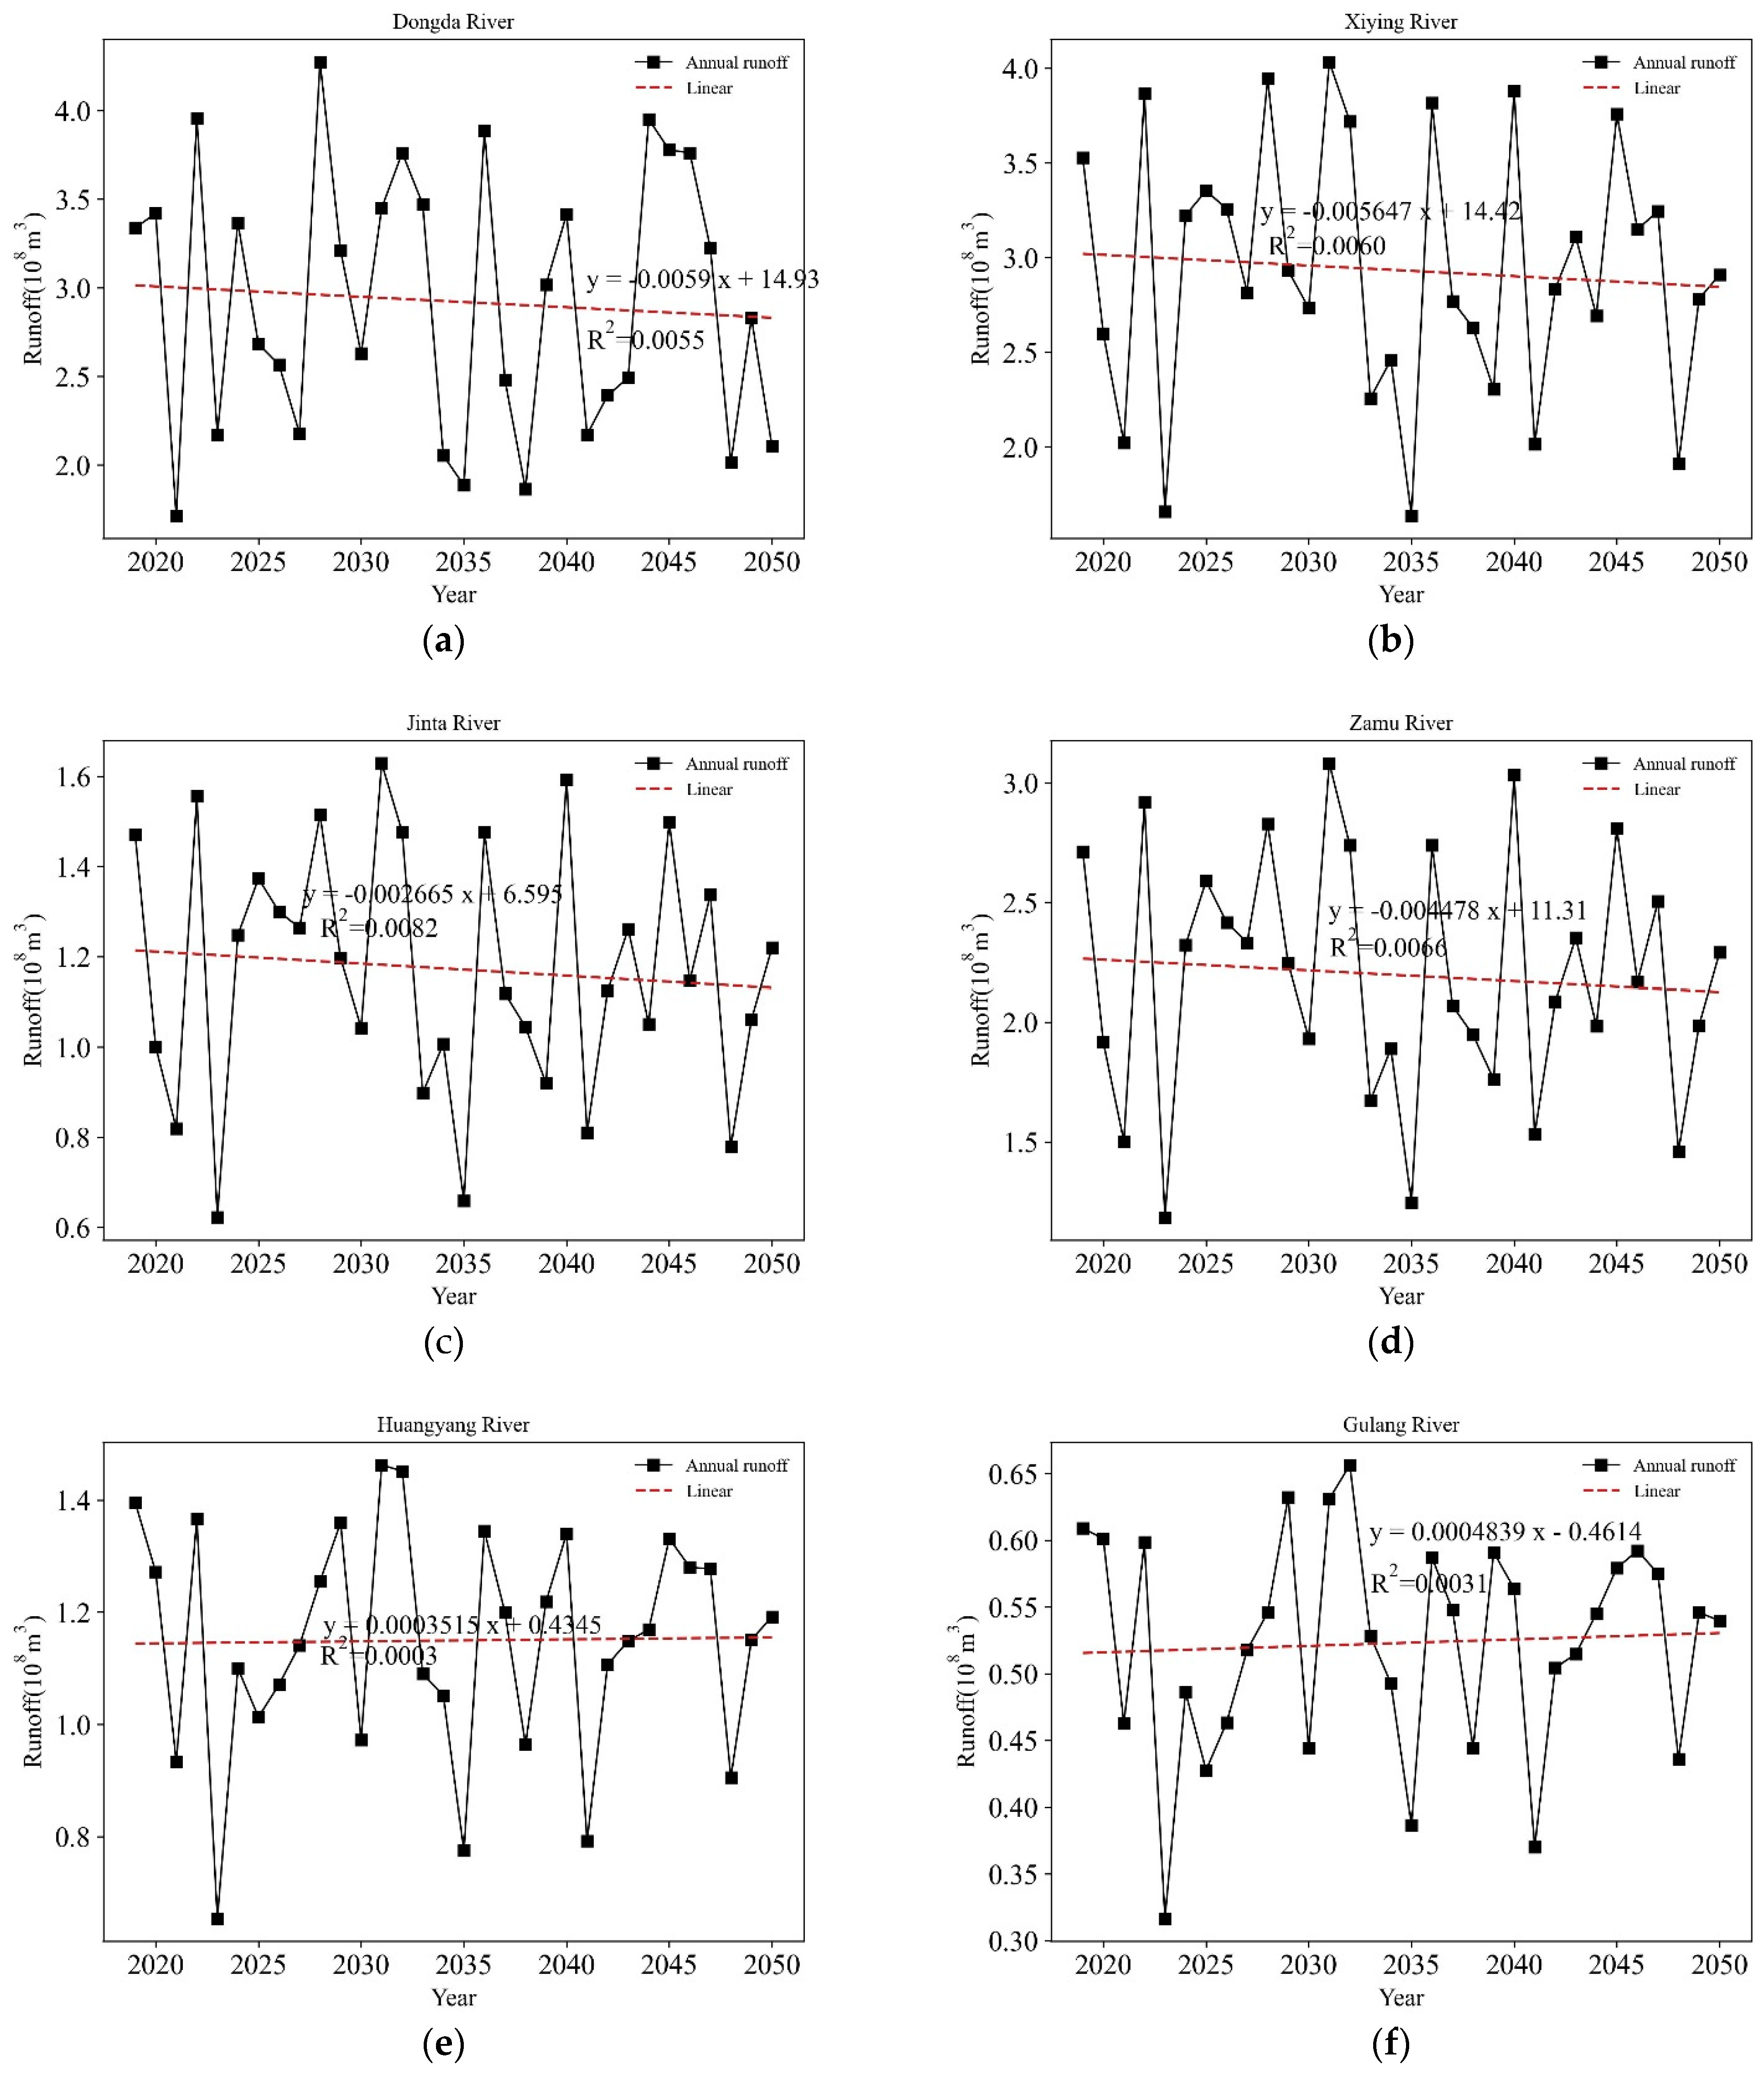
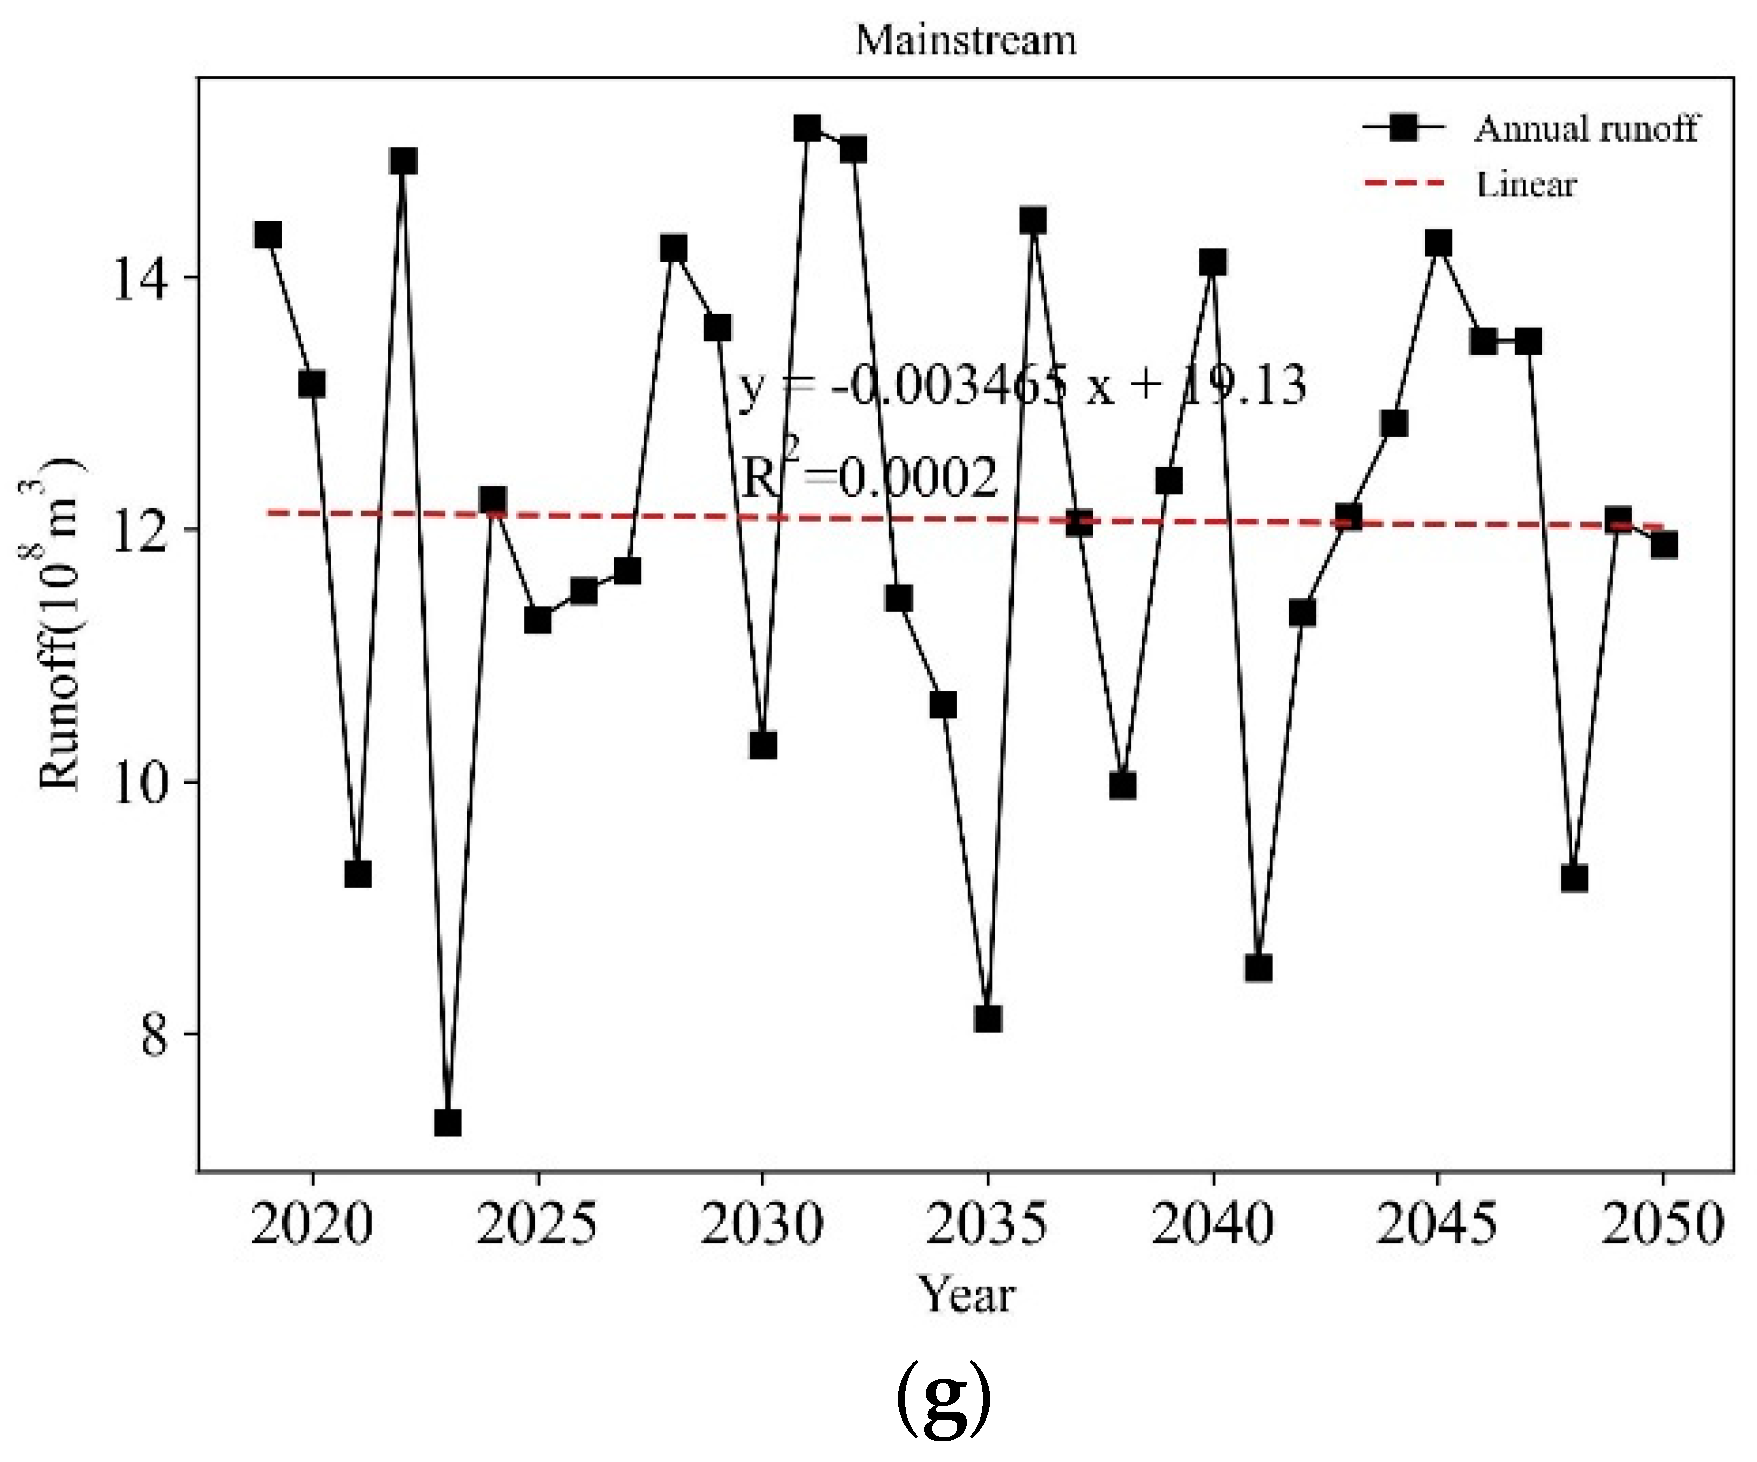
In the meantime, the predicted runoff from Shiyang River Basin mainstream and six tributaries from 2019 to 2050 is shown in Figure 8.
As evident from Figure 8, the mainstream, Dongda River, Xiying River, Jinta River and Zamu River will continue to decline in the future. On the contrary, the Huangyang River and Gulang River switched to insignificant upward trends.
The reason for this may be that the climate type of the Shiyang River Basin will not change under the global warming environment, which will be still warm and dry [54]. Another reason for this is the altered water holding capacity of the watershed due to land use change. The reduction in arable land but the significant increase in grassland reduces the damage to the natural vegetation, but there is a relatively large increase in evapotranspiration due to the high evapotranspiration from grassland. In addition, the dense, weakly permeable layer formed by the root system of grassland is not conducive to increasing soil moisture and baseflow [55]. The precipitation is retained and consumed by the grass vegetation on the one hand, and it is stored in the unsaturated zone of the soil and consumed by evapotranspiration and vegetation on the other, resulting in a certain reduction in the runoff volume of the basin. Nevertheless, the Huangyang River and the Gulang River have small volume of water in their channels, and their runoff will be more influenced by the increasing precipitation in the future. In addition, both of these two rivers are located in the south-eastern part of the Shiyang River Basin, and it is thought that the combined effects of regional topography and climate may cause their future runoff to not show a decreasing trend.
As the climate has warmed, the glacial snowmelt has not increased runoff considerably. The results of runoff splitting report that the annual average contribution of snow and ice melt water to the runoff of Dongda River, Xiyang River, Jinta River and Zamu River is about 9.7%, 5.6%, 4.4% and 1.6%, respectively. The reason for the small contribution is the limited snow and ice resources. Although the basin is characterised by strong ablation, the glaciers in the Shiyang River basin are located on the northern slopes of Lenglongling mountain, the eastern end of the Qilian Mountains. The snowline elevations range from 4400 to 5100 m. The glaciers in the tributaries cover an area of less than 40 km2 and are all small in size [56]. In the future, due to climate warming and glacier retreat changes, although the snow melt rate will be accelerated, the glacier area will also continue to accelerate, which will cause a reduction in glacier meltwater runoff [57]. Precipitation is the most important source of recharge for runoff out of the Shiyang River [58], with glacial meltwater as a partial source of recharge having less impact on future runoff trends.
The results of the average runoff calculations, coefficient of variations, and Mann–Kendall trend tests are listed in Table 4.
Based on the statistical assessment of simulated runoff, it can be known that seven rivers all have reductions in average runoff compared with historical time series. At the same time, there is no significant trend in Shiyang River Basin from 2019 to 2050; in fact, all the Z values of the MK test did not pass the 0.05 confidence level. The overall runoff of Shiyang River Basin would be a non-significant downward trend.
The coefficient of variation of the streamflow series indicates a relatively more considerable variability with the highest Cv at Dongda River > Jinta River > Xiying River and > Zamu River > Mainstream > Huangyang River > Gulang River in their order of variability. Thus, the relationship between Cv and water volume would no longer exist. This is because the runoff simulated by SWAT is largely based on assumed future rainfall data. Cv is influenced by the magnitude of variation in rainfall data. In addition, the simulation of extreme values is insufficient.
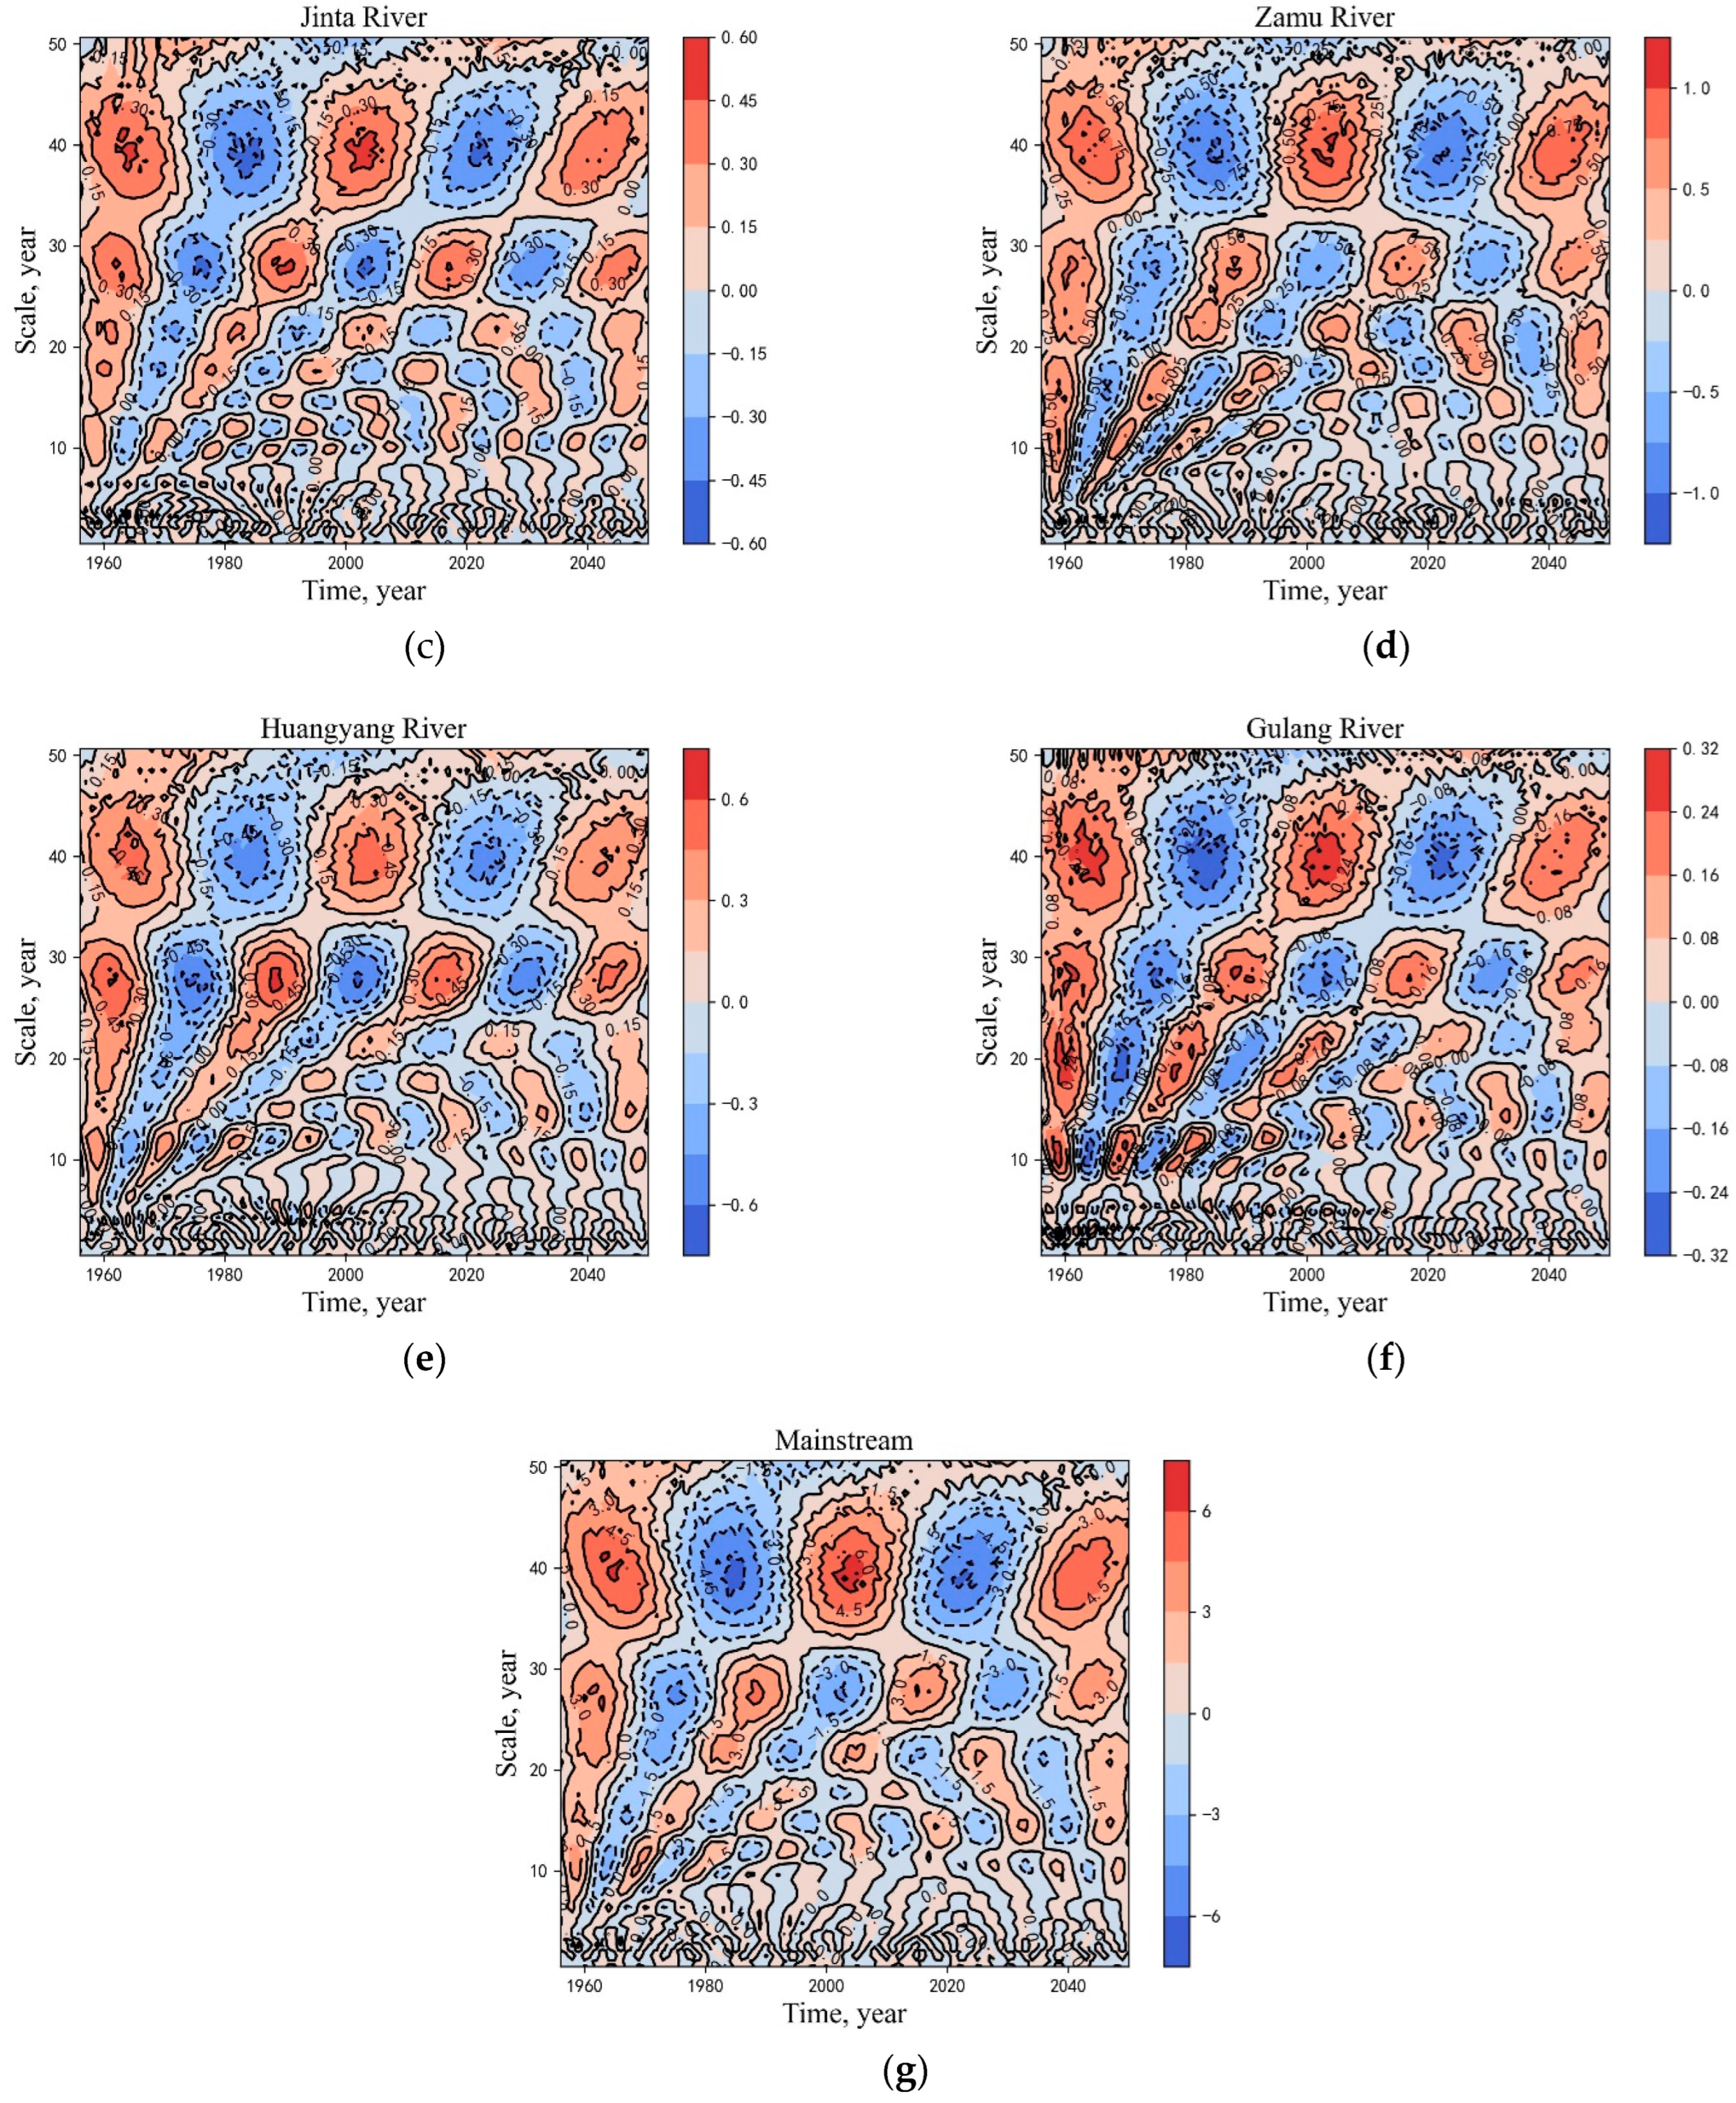
In terms of future runoff cycle changes, the runoff from 1956 to 2050 at seven stations was analysed through a wavelet analysis. The results are shown in Figure 9.
Displayed in Figure 9 are common periods; the first main time scale is about 40 years and the second main time scale is around 20–30 years, except for the Huangyang River. With the addition of the predicted series, the original second main cycle of the Huangyang River runoff becomes the first main cycle. The reason for this may be the greater frequency of change in the predicted time series.

3.4. Uncertainties and Limitations

The uncertainties in future runoff projections for this study are derived from the hydrological model inputs, model structure and parameters. The uncertainties of the model inputs may come from the GCMs, downscaling methods and discharge scenarios, etc. [59,60] Assessing the uncertainties is challenging work that can be completed in the following study.
There are two major limitations in this study that could be resolved in the future. First, the assumed emissions scenario in the future is only one scenario RCP4.5. The addition of comparative simulations of other emission scenarios would provide more reliable assistance to future water management. Second, there is only one land use projection of 2030 under RCP4.5 used in future simulations because of time and data constraints. Indeed, the prediction based on more land use projections will be more convincing. Therefore, further research that considers more climate change scenarios and land use maps is considered to be enhanced.

4. Conclusions

From the 1950s to 2019, the tributaries of the Six River system and the mainstream of Shiyang River all showed descending trends, with the Xiying River, Jinta River, Huangyang River and Gulang River showing significant decreasing trends. It can be inferred that the evapotranspiration continued to increase as a reflection of a warming climate, while rainfall remained low. With the exception of the Gulang river, the inter-annual fluctuations of all the tributaries in the Shiyang River basin are relatively gentle, with the Dongda River being the most gentle.
There are two main types of cyclical patterns in the 40–50-year and 20–30-year timescales in the evolution of runoff of all rivers over a period of about 60 years. There is one alternating abundance–depletion oscillation at the 40–50-year scale, whereas two alternating abundance–depletion oscillations occur at the 20–30-year timescale.
In the future, until 2050, there will be non-significant declining trends in the main stream, Dongda River, Xiying River, Jinta River and Zamu River. In terms of periods, the periodicitis exhibited by the mainstream and most of the tributaries from 1956 to 2050 are similar to the periods of 1956 to 2018, with minor differences only in the Huangyang River.
In general, the mainstream of the Shiyang River and its upstream tributaries have relatively consistent characteristics of change. It can be confirmed that the mainstream of the Shiyang River Basin originates mainly from the upstream sources of the mountains.

Author Contributions

Conceptualization, Z.D.; Methodology, Y.S. and Z.D.; Software, Y.S. and J.M.; Model setup, Y.S. and Y.L.; Calibration and Validation, Y.S., Y.L., S.Z. and Q.Z.; Mathematics analysis, Y.S. and J.M.; resources, Y.S. and S.W.; Data curation, Y.S., Y.L. and J.M.; Writing—original draft preparation, Y.S. and J.M.; Writing—review and editing, Y.S.; Visualization, Y.S., S.W. and Z.Z.; supervision, Z.D. All authors have read and agreed to the published version of the manuscript.

Funding

This research received no external funding.

Institutional Review Board Statement

Not applicable.

Informed Consent Statement

Not applicable.

Data Availability Statement

Not applicable.

Conflicts of Interest

The authors declare no conflict of interest.

References

  1. Wu, Y.P.; Liu, S.G.; Gallant, A.L. Predicting impacts of increased CO2 and climate change on the water cycle and water quality in the semiarid James River Basin of the Midwestern USA. Sci. Total Environ. 2012, 430, 150–160. [Google Scholar] [CrossRef] [Green Version]
  2. Miller, J.D.; Hutchins, M. The impacts of urbanisation and climate change on urban flooding and urban water quality: A review of the evidence concerning the United Kingdom. J. Hydrol. Reg. Stud. 2017, 12, 345–362. [Google Scholar] [CrossRef] [Green Version]
  3. Costa, M.H.; Botta, A.; Cardille, J.A. Effects of large-scale changes in land cover on the discharge of the Tocantins River, Southeastern Amazonia. J. Hydrol. 2003, 283, 206–217. [Google Scholar] [CrossRef]
  4. Singh, P.; Kumar, N. Impact assessment of climate change on the hydrological response of a snow and glacier melt runoff dominated Himalayan river. J. Hydrol. 1997, 193, 316–350. [Google Scholar] [CrossRef]
  5. Albek, M.; Ögütveren, L.B.; Albek, E. Hydrological modeling of Seydi Suyu watershed (Turkey) with HSPF. J. Hydrol. 2004, 285, 260–271. [Google Scholar] [CrossRef]
  6. Wijesekara, G.N.; Gupta, A.; Valeo, C.; Hasbani, J.G.; Qiao, Y.; Delaney, P.; Marceau, D.J. Assessing the impact of future land-use changes on hydrological processes in the Elbow River watershed in southern Alberta, Canada. J. Hydrol. 2012, 412, 220–232. [Google Scholar] [CrossRef]
  7. Mango, L.M.; Melesse, A.M.; McClain, M.E.; Gann, D.; Setegn, S.G. Land use and climate change impacts on the hydrology of the upper Mara River Basin, Kenya: Results of a modeling study to support better resource management. Hydrol. Earth Syst. Sci. 2011, 15, 2245–2258. [Google Scholar] [CrossRef] [Green Version]
  8. Niemann, J.D.; Eltahir, E.A.B. Sensitivity of regional hydrology to climate changes, with application to the Illinois River basin. Water Resour. Res. 2005, 41. [Google Scholar] [CrossRef]
  9. Chanapathi, T.; Thatikonda, S.; Keesara, V.R.; Ponguru, N.S. Assessment of water resources and crop yield under future climate scenarios: A case study in a Warangal district of Telangana, India. J. Earth Syst. Sci. 2019, 129, s12040-019. [Google Scholar] [CrossRef]
  10. Zuo, D.; Xu, Z.; Peng, D.; Song, J.; Cheng, L.; Wei, S.; Abbaspour, K.C.; Yang, H. Simulating spatiotemporal variability of blue and green water resources availability with uncertainty analysis. Hydrol. Process. 2015, 29, 1942–1955. [Google Scholar] [CrossRef]
  11. Scanlon, B.R.; Jolly, I.; Sophocleous, M.; Zhang, L. Global impacts of conversions from natural to agricultural ecosystems on water resources: Quantity versus quality. Water Resour. Res. 2007, 43. [Google Scholar] [CrossRef] [Green Version]
  12. Loukika, K.N.; Keesara, V.R.; Sridhar, V. Analysis of Land Use and Land Cover Using Machine Learning Algorithms on Google Earth Engine for Munneru River Basin, India. Sustainability 2021, 13, 13758. [Google Scholar] [CrossRef]
  13. Gong, X.; Bian, J.; Wang, Y.; Jia, Z.; Wan, H. Evaluating and Predicting the Effects of Land Use Changes on Water Quality Using SWAT and CA-Markov Models. Water Resour. Manag. 2019, 33, 4923–4938. [Google Scholar] [CrossRef]
  14. Chen, Y.; Takeuchi, K.; Xu, C.; Chen, Y.; Xu, Z. Regional climate change and its effects on river runoff in the Tarim Basin, China. Hydrol. Process. 2006, 20, 2207–2216. [Google Scholar] [CrossRef]
  15. Liu, C.X.; Chen, Y.N.; Fang, G.H.; Zhou, H.H.; Huang, W.J.; Liu, Y.C.; Wang, X.X.; Li, Z. Hydrological Connectivity Improves the Water-Related Environment in a Typical Arid Inland River Basin in Xinjiang, China. Remote Sens. 2022, 14, 4977. [Google Scholar] [CrossRef]
  16. Ficklin, D.L.; Luo, Y.; Luedeling, E.; Zhang, M. Climate change sensitivity assessment of a highly agricultural watershed using SWAT. J. Hydrol. 2009, 374, 16–29. [Google Scholar] [CrossRef]
  17. Li, L.; Wang, Z.Y.; Wang, Q.C. Inflence of Climatic Change on Flow over the Upper Reaches of Heihe River. Sci. Geogr. Sin. 2006, 26, 40–46. [Google Scholar]
  18. Zhang, A.; Zheng, C.; Wang, S.; Yao, Y. Analysis of streamflow variations in the Heihe River Basin, northwest China: Trends, abrupt changes, driving factors and ecological influences. J. Hydrol. Reg. Stud. 2015, 3, 106–124. [Google Scholar] [CrossRef] [Green Version]
  19. Sun, Z.; Zheng, Y.; Li, X.; Tian, Y.; Han, F.; Zhong, Y.; Liu, J.; Zheng, C. The Nexus of Water, Ecosystems, and Agriculture in Endorheic River Basins: A System Analysis Based on Integrated Ecohydrological Modeling. Water Resour. Res. 2018, 54, 7534–7556. [Google Scholar] [CrossRef]
  20. Xie, C.; Zhao, L.J.; Eastoe, C.J.; Wang, N.L.; Dong, X.Y. An isotope study of the Shule River Basin, Northwest China: Sources and groundwater residence time, sulfate sources and climate change. J. Hydrol. 2022, 612. [Google Scholar] [CrossRef]
  21. Kang, S.; Su, X.; Yang, X.; Shen, Q.; Shi, P. Research frame for reasonable allocation of water resources and water-saving in ecology and agriculture in Shiyanghe river basin. J. Water Resour. Water Eng. 2005, 16, 1–9. [Google Scholar]
  22. Zhu, G.F.; Liu, Y.W.; Shi, P.J.; Jia, W.X.; Zhou, J.J.; Liu, Y.F.; Ma, X.G.; Pan, H.X.; Zhang, Y.; Zhang, Z.Y.; et al. Stable water isotope monitoring network of different water bodies in Shiyang River basin, a typical arid river in China. Earth Syst. Sci. Data 2022, 14, 3773–3789. [Google Scholar] [CrossRef]
  23. Li, Z.L.; Xu, Z.X.; Li, J.Y.; Li, Z.J. Shift trend and step changes for runoff time series in the Shiyang River basin, northwest China. Hydrol. Process. 2008, 22, 4639–4646. [Google Scholar] [CrossRef]
  24. Huo, Z.; Feng, S.; Kang, S.; Li, W.; Chen, S. Effect of climate changes and water-related human activities on annual stream flows of the Shiyang river basin in and north-west China. Hydrol. Process. 2008, 22, 3155–3167. [Google Scholar] [CrossRef]
  25. Chen, M.; Pollard, D.; Barron, E.J. Hydrologic processes in China and their association with summer precipitation anomalies. J. Hydrol. 2005, 301, 14–28. [Google Scholar] [CrossRef]
  26. Guo, J.; Su, X.; Singh, V.P.; Jin, J. Impacts of Climate and Land Use/Cover Change on Streamflow Using SWAT and a Separation Method for the Xiying River Basin in Northwestern China. Water 2016, 8, 192. [Google Scholar] [CrossRef] [Green Version]
  27. Li, Z.; Li, X.Y.; Sun, J. Impact of Climate Change on Water Resources in the Shiyang River Basin and the Adaptive Measures for Energy Conservation and Emission Reduction. In Proceedings of the Progress in Industrial and Civil Engineering II: Selected, Peer Reviewed Papers from the 2013 2nd International Conference on Civil, Architectural and Hydraulic Engineering (ICCAHE 2013), Zhuhai, China, 27–28 July 2013; Trans Tech Publications: Stafa-Zurich, Switzerland, 2013; pp. 2143–2147. [Google Scholar]
  28. Bales, R.C.; Molotch, N.P.; Painter, T.H.; Dettinger, M.D.; Rice, R.; Dozier, J. Mountain hydrology of the western United States. Water Resour. Res. 2006, 42. [Google Scholar] [CrossRef]
  29. Rumbaur, C.; Thevs, N.; Disse, M.; Ahlheim, M.; Brieden, A.; Cyffka, B.; Duethmann, D.; Feike, T.; Froer, O.; Gaertner, P.; et al. Sustainable management of river oases along the Tarim River (SuMaRiO) in Northwest China under conditions of climate change. Earth Syst. Dyn. 2015, 6, 83–107. [Google Scholar] [CrossRef] [Green Version]
  30. Im, E.-S.; Eltahir, E.A.B. Enhancement of rainfall and runoff upstream from irrigation location in a climate model of West Africa. Water Resour. Res. 2014, 50, 8651–8674. [Google Scholar] [CrossRef] [Green Version]
  31. Guo, Q.; Feng, Q.; Li, J. Environmental changes after ecological water conveyance in the lower reaches of Heihe River, Northwest China. Environ. Geol. 2009, 58, 1387–1396. [Google Scholar] [CrossRef]
  32. Wang, D.; Formica, M.K.; Liu, S. Nonparametric Interval Estimators for the Coefficient of Variation. Int. J. Biostat. 2018, 14. [Google Scholar] [CrossRef]
  33. Mann, H.B. Non-parametric tests against trend. Econometrica 1945, 13, 245–259. [Google Scholar] [CrossRef]
  34. Kendall, M.G. Rank Correlation Methods, 2nd ed.; Griffin: London, UK, 1955. [Google Scholar]
  35. Yu, S.-J.; Son, J.-Y.; Kang, H.-Y.; Cho, Y.-C.; Im, J.-K. Effects of Long-Term Increases in Water Temperature and Stratification on Large Artificial Water-Source Lakes in South Korea. Water 2021, 13, 2341. [Google Scholar] [CrossRef]
  36. Shangguan, S.; Lin, H.; Wei, Y.; Tang, C. Spatiotemporal Modes Characteristics and SARIMA Prediction of Total Column Water Vapor over China during 2002–2022 Based on AIRS Dataset. Atmosphere 2022, 13, 885. [Google Scholar] [CrossRef]
  37. Munthali, G.; Gumindoga, W.; Chidya, R.C.G.; Malota, M.; Muhoyi, H. Spatial and temporal variation in rainfall and streamflow—Dzalanyama catchment, Malawi. Water Pract. Technol. 2022, 17, 1035–1045. [Google Scholar] [CrossRef]
  38. Tali, P.A.; Bhat, M.M.; Lone, F.A. Seasonal Spatio-Temporal Variability in Temperature over North Kashmir Himalayas Using Sen Slope and Mann-Kendall Test. Longdom Publ. SL 2021, 9, 1–11. [Google Scholar]
  39. Olfatmiri, Y.; Bahreinimotlagh, M.; Jabbari, E.; Kawanisi, K.; Hasanabadi, A.; Al Sawaf, M.B. Application of Acoustic tomographic data to the short-term streamflow forecasting using data-driven methods and discrete wavelet transform. J. Hydrol. 2022, 609. [Google Scholar] [CrossRef]
  40. Manikanta, V.; Vema, V.K. Formulation of Wavelet Based Multi-Scale Multi-Objective Performance Evaluation (WMMPE) Metric for Improved Calibration of Hydrological Models. Water Resour. Res. 2022, 58. [Google Scholar] [CrossRef]
  41. Corso, G.; Kuhn, P.S.; Lucena, L.S.; Thome, Z.D. Seismic ground roll time-frequency filtering using the gaussian wavelet transform. Phys. A Stat. Mech. Appl. 2003, 318, 551–561. [Google Scholar] [CrossRef]
  42. Torrence, C.; Compo, G.P. A practical guide to wavelet analysis. Bull. Am. Meteorol. Soc. 1998, 79, 61–78. [Google Scholar] [CrossRef]
  43. Shigute, M.; Alamirew, T.; Abebe, A.; Ndehedehe, C.E.; Kassahun, H.T. Understanding Hydrological Processes under Land Use Land Cover Change in the Upper Genale River Basin, Ethiopia. Water 2022, 14, 3881. [Google Scholar] [CrossRef]
  44. Fentaw, F. Assessment of Climate Change Impacts on the Hydrology of Upper Guder Catchment, Upper Blue Nile. In Proceedings of the ICSWRM 2014: 16th International Conference on Sustainable Water Resources Manageme, London, UK, 24 December 2014. [Google Scholar]
  45. Cronshey, R. Urban Hydrology for Small Watersheds, 2nd ed.; US Dept. of Agriculture, Soil Conservation Service, Engineering Division: Davis, CA, USA, 1986.
  46. Asuero, A.G.; Sayago, A.; Gonzalez, A.G. The correlation coefficient: An overview. Crit. Rev. Anal. Chem. 2006, 36, 41–59. [Google Scholar] [CrossRef]
  47. Kabolizadeh, M.; Rangzan, K.; Zareie, S.; Rashidian, M.; Delfan, H. Evaluating quality of surface water resources by ANN and ANFIS networks using Sentinel-2 satellite data. Earth Sci. Inform. 2022, 15, 523–540. [Google Scholar] [CrossRef]
  48. Nash, J.E.; Sutcliffe, J.V. River flow forecasting through conceptual models part I—A discussion of principles. J. Hydrol. 1970. [Google Scholar] [CrossRef]
  49. Gupta, H.V.; Kling, H. On typical range, sensitivity, and normalization of Mean Squared Error and Nash-Sutcliffe Efficiency type metrics. Water Resour. Res. 2011, 47. [Google Scholar] [CrossRef]
  50. Li, X.; Yu, L.; Sohl, T.; Clinton, N.; Li, W.; Zhu, Z.; Liu, X.; Gong, P. A cellular automata downscaling based 1 km global land use datasets (2010–2100). Sci. Bull. 2016, 61, 1651–1661. [Google Scholar] [CrossRef] [Green Version]
  51. Cao, B.; Pan, B.; Wen, Z.; Guan, W.; Li, K. Changes in glacier mass in the Lenglongling Mountains from 1972 to 2016 based on remote sensing data and modeling. J. Hydrol. 2019, 578. [Google Scholar] [CrossRef]
  52. Liu, Y.S.; Qin, X.; Chen, J.Z.; Li, Z.L.; Wang, J.; Du, W.T.; Guo, W.Q. Variations of Laohugou Glacier No. 12 in the western Qilian Mountains, China, from 1957 to 2015. J. Mt. Sci. 2018, 15, 25–32. [Google Scholar] [CrossRef]
  53. Zichu, X.I.E.; Xin, W.; Ersi, K.; Qinghua, F.; Qiaoyuan, L.I.; Lei, C. Glacial Runoff in China: An Evaluation and Prediction for the Future 50 Years. J. Glaciol. Geocryol. 2006, 28, 457–466. [Google Scholar]
  54. Lan, Y.; Ding, Y.; Shen, Y.; Kangersi; Zhang, J. Responding of River Streamflow to the Climate Shift in the Hexi Inland Region. J. Glaciol. Geocryol. 2003, 25, 188–192. [Google Scholar]
  55. Zhang, L.; Dawes, W.R.; Walker, G.R. Response of mean annual evapotranspiration to vegetation changes at catchment scale. Water Resour. Res. 2001, 37, 701–708. [Google Scholar] [CrossRef]
  56. Zhang, S.-Q.; Gao, X.; Zhang, X.-W. Glacial runoff likely reached peak in the mountainous areas of the Shiyang River Basin, China. J. Mt. Sci. 2015, 12, 382–395. [Google Scholar] [CrossRef]
  57. Shi, Y.; Shen, Y.; Kang, E.; Li, D.; Ding, Y.; Zhang, G.; Hu, R. Recent and future climate change in northwest china. Clim. Change 2007, 80, 379–393. [Google Scholar] [CrossRef]
  58. Li, Z.; Feng, Q.; Wang, Q.J.; Yong, S.; Cheng, A.; Li, J. Contribution from frozen soil meltwater to runoff in an in-land river basin under water scarcity by isotopic tracing in northwestern China. Glob. Planet. Change 2016, 136, 41–51. [Google Scholar] [CrossRef]
  59. Chiew, F.H.S.; Kirono, D.G.C.; Kent, D.M.; Frost, A.J.; Charles, S.P.; Timbal, B.; Nguyen, K.C.; Fu, G. Comparison of runoff modelled using rainfall from different downscaling methods for historical and future climates. J. Hydrol. 2010, 387, 10–23. [Google Scholar] [CrossRef]
  60. Wilby, R.L.; Harris, I. A framework for assessing uncertainties in climate change impacts: Low-flow scenarios for the River Thames, UK. Water Resour. Res. 2006, 42. [Google Scholar] [CrossRef]
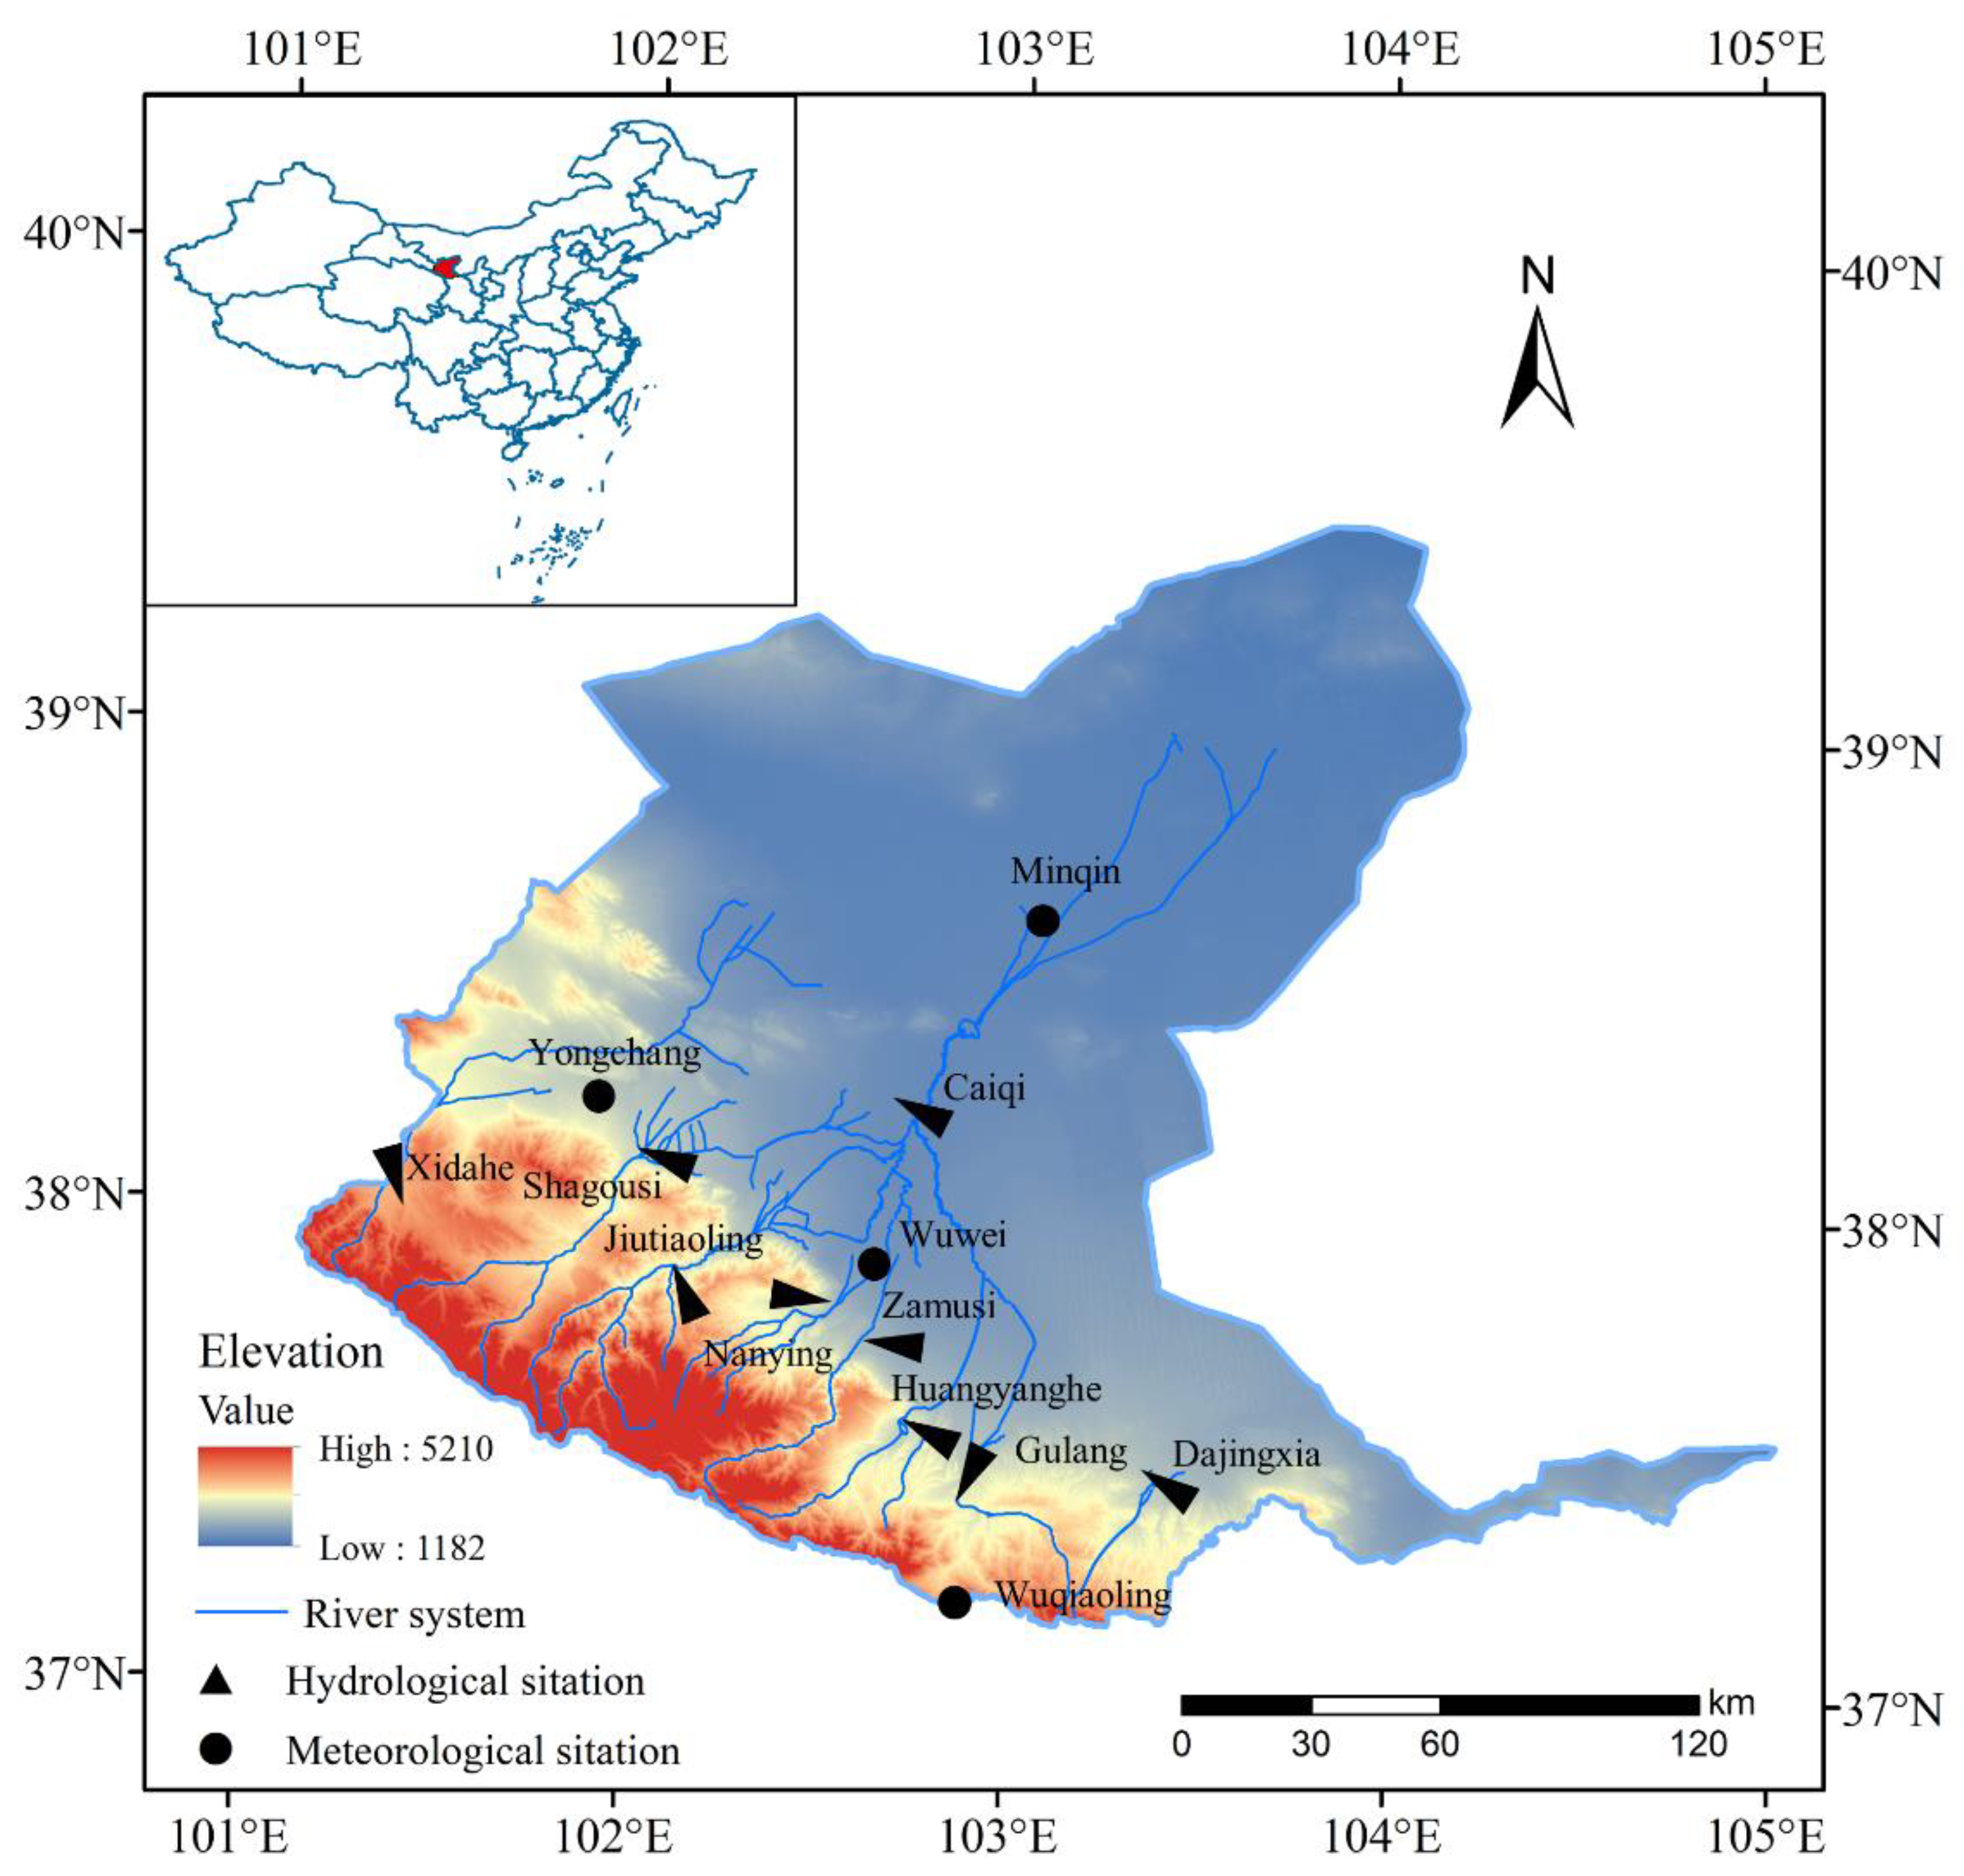
Figure 1. Location of the Shiyang River Basin and the hydro-meteorological stations used in the study.
Sustainability 15 02173 g001
Figure 2. Analysis of annual runoff variation trends at 7 hydrological stations of Shiyang River Basin. (a) Shagousi Station at Dongda River; (b) Jiutiaoling Station at Xiying River; (c) Nanying Station at Jinta River; (d) Zamusi Station at Zamu River; (e) Huangyanghe station at Huangyang River; (f) Gulang station at Gulang River; (g) Caiqi station at mainstream of Shiyang River Basin.
Sustainability 15 02173 g002aSustainability 15 02173 g002b
Figure 3. Wavelet coefficient plots of streamflow in Shiyang River Basin and Six River Basin and their wavelet spectrum. (a) Shagousi Station at Dongda River; (b) Jiutiaoling Station at Xiying River; (c) Nanying Station at Jinta River; (d) Zamusi Station at Zamu River; (e) Huangyanghe station at Huangyang River; (f) Gulang station at Gulang River; (g) Caiqi station at mainstream of Shiyang River Basin.
Sustainability 15 02173 g003aSustainability 15 02173 g003b
Figure 4. The wavelet variance curves of annual runoff in 7 stations.
Sustainability 15 02173 g004aSustainability 15 02173 g004b
Figure 5. Simulated and measured monthly runoff for the calibration and validation periods. (a) Shagousi Station at Dongda River; (b) Jiutiaoling Station at Xiying River; (c) Nanying Station at Jinta River; (d) Zamusi Station at Zamu River; (e) Huangyanghe station at Huangyang River; (f) Gulang station at Gulang River; (g) Caiqi station at mainstream of Shiyang River Basin.
Sustainability 15 02173 g005aSustainability 15 02173 g005b
Figure 6. Variations of climate elements for the Yongchang, Wuwei and Wushaoling stations from 1960 to 2050. (a) Annual precipitation; (b) annual maximum temperature; (c) annual minimum temperature.
Sustainability 15 02173 g006aSustainability 15 02173 g006b
Figure 7. The land use change types in 2020 and 2030 (used in SWAT prediction).
Sustainability 15 02173 g007
Figure 8. Trends of estimated annual runoff series at 7 hydrological stations in the Shiyang River Basin from 2019 to 2050. (a) Shagousi Station at Dongda River; (b) Jiutiaoling Station at Xiying River; (c) Nanying Station at Jinta River; (d) Zamusi Station at Zamu River; (e) Huangyanghe station at Huangyang River; (f) Gulang station at Gulang River; (g) Caiqi station at mainstream of Shiyang River Basin.
Sustainability 15 02173 g008aSustainability 15 02173 g008b
Figure 9. Wavelet coefficient plots of runoff of 7 rivers and their wavelet spectrum. (a) Shagousi Station at Dongda River; (b) Jiutiaoling Station at Xiying River; (c) Nanying Station at Jinta River; (d) Zamusi Station at Zamu River; (e) Huangyanghe station at Huangyang River; (f) Gulang station at Gulang River; (g) Caiqi station at mainstream of Shiyang River Basin.
Sustainability 15 02173 g009aSustainability 15 02173 g009b
Table 1. Results of Mann–Kendall trend test for runoff of 7 rivers.
Time, YearNameZTrendsConfidence LevelSignificance
1955 to 2018Dongda River−0.80decrease95%non-significant
1955 to 2018Xiying River−2.56decrease95%significant
1950 to 2018Jinta River−3.05decrease95%significant
1952 to 2018Zamu River−1.77decrease95%non-significant
1950 to 2018Huangyang River−2.90decrease95%significant
1956 to 2018Gulang River−3.12decrease95%significant
1956 to 2018Shiyang Mainstream−1.12decrease95%non-significant
Table 2. Main periods in time series of 7 rivers.
NameMain Period 1Main Period 2
Dongda River3521
Xiying River4526
Jinta River4929
Zamu River4828
Huangyang River4829
Gulang River4919
Shiyang Mainstream4426
Table 3. Model performance assessment for calibration and validation periods.
NamePre-CalibrationCalibrationValidation
TimeTimeRe (%)R2NSETimeRe (%)R2NSE
Dongda River19891990–199925.50.8640.822000–200420.70.9230.90
Xiying River20032004–201342.80.8140.812014–201838.30.9040.89
Jinta River20032004–201350.40.8570.832014–201847.00.8800.88
Zamu River20032004–201353.30.9170.772014–201854.70.9140.74
Huangyang River20032004–201338.40.8500.782014–201833.10.8640.77
Gulang River20032004–201340.20.8690.862014–201862.20.9080.89
Shiyang River Basin20042005–201373.00.8540.852014–201838.80.9290.89
Table 4. The statistical assessment of runoff variation from 2019 to 2050.
NameAverage Runoff (108 m3)CvZSignificance
Dongda River2.92 (−0.06 *)0.25−0.37non-significant
Xiying River3.17 (−0.19 *)0.23−0.28non-significant
Jinta River1.17 (−0.15 *)0.24−0.41non-significant
Zamu River2.21 (−0.15 *)0.23−0.54non-significant
Huangyang River1.15 (−0.12 *)0.170.003non-significant
Gulang River0.52 (−0.12 *)0.160.004non-significant
Mainstream11.95 (−1.98 *)0.18−0.08non-significant
* means the value of average runoff compared with historical average runoff.
Disclaimer/Publisher’s Note: The statements, opinions and data contained in all publications are solely those of the individual author(s) and contributor(s) and not of MDPI and/or the editor(s). MDPI and/or the editor(s) disclaim responsibility for any injury to people or property resulting from any ideas, methods, instructions or products referred to in the content.