Article

Regional Differences in the Quality of Rural Development in Guangdong Province and Influencing Factors

1
School of Geography and Remote Sensing, Guangzhou University, Guangzhou 510006, China
2
School of Public Administration, Guangdong University of Finance and Economics, Guangzhou 510320, China
*
Author to whom correspondence should be addressed.
Sustainability 2023, 15(3), 1855; https://doi.org/10.3390/su15031855
Submission received: 13 December 2022 / Revised: 11 January 2023 / Accepted: 16 January 2023 / Published: 18 January 2023
(This article belongs to the Special Issue Sustainable Land Resource Management and Urban and Rural Development)

Abstract

:
Achieving rural revitalization is the aim of building a strong modern socialist country. However, regional heterogeneity exists in rural development in general, and studying regional differences in rural development quality is an important prerequisite for developing specific policies for rural revitalization. This paper takes 20 prefecture-level cities in Guangdong Province as the research objects and constructs a rural-development-quality-evaluation system based on four dimensions: industrial revitalization, rural affluence, social development, and environmental livability; combines the entropy value method, hierarchical analysis method, and TOPSIS to complete the evaluation process; uses a spatial autocorrelation model and cold–hot spot analysis to explore the characteristics of regional heterogeneity of rural development in Guangdong Province; and relies on stepwise regression analysis to clarify the main influencing factors. The results show the following: (1) The average value of rural development quality in the province is 0.342, with “high in the middle and low in the surrounding area” as the main spatial characteristic. (2) The average value of environmental livability dimension is 0.580, and the high-value area is found in the northeastern part of the province. There is an outer circle distribution structure with Dongguan City as the core of the high-value area, and the score gradually decreases outward, while the average value of all other dimensions is less than 0.350. The mean value of all other dimensions is less than 0.350. (3) The social development dimension shows a cold–hot spot distribution of “hot in the northeast and low in the middle”, the rural development quality and other development dimensions show a cold–hot spot spatial pattern of “high value gathering in the middle and low value gathering in the northeast”, and there is no cold spot gathering in the environmental livability dimension. (4) The average collective assets and the construction rate of science-based communities are the main driving factors of rural development, while the coverage rate of service institutions and the Engel coefficient are the main hindering factors. This paper enriches the rural development level measurement system, clarifies the spatial differentiation and main influencing factors of rural development in Guangdong Province, and helps to provide scientific support and a theoretical basis for the differentiated promotion of rural revitalization.

1. Introduction

The 19th National Congress of the Communist Party of China formally raised rural revitalization to a national strategic height, which reflects the further rise in the importance and recognition of the Communist Party of China Central Committee in rural construction, and highlights the importance of rural revitalization [1]. Against the background of a rampant epidemic, slow economic recovery, and turbulent balance of peace, the State Council again issued the Opinions on Doing a Good Job in Overall Promoting the Key Work of Rural Revitalization in January 2022, emphasizing the need to stabilize the agricultural base, stabilize the rural rear area, and continue to promote rural revitalization. Promoting the implementation of the rural revitalization strategy is an inevitable requirement for building a socialist modern power in the new era and is related to the success or failure of realizing the great rejuvenation dream of the Chinese nation [2]. However, due to the heterogeneity of rural resource endowments among regions, the current situation of rural development has spatial differentiation, and it is difficult to determine a unified standard for promoting a rural-revitalization strategy. Therefore, based on the evaluation results of rural development quality, analyzing the regional differentiation pattern and clarifying the main influencing factors of rural development will help to provide a theoretical basis and scientific support for determining the development policy and promoting the rural-revitalization strategy through differentiation according to local conditions [3].
The quality of rural development has always been a popular international research topic. Scholars at home and abroad mainly study the connotation of rural development, development quality evaluation, and factors influencing development [4,5,6]. The connotation of rural development mainly analyzes the interaction and internal differences between social, industrial, and land elements in the rural system. For example, Zhang Jun and Guo Yuanzhi et al. summarized the connotation of rural revitalization from five aspects: economy, culture, industry, politics, and welfare [7,8]. In terms of rural development quality evaluation, studies have focused on the construction of the evaluation process, and some scholars have focused on exploring the spatial differentiation of the development level, with research scales including provincial, municipal, county, or comprehensive regions [9,10,11]. The academic divergence of evaluation process construction research focuses on the selection of evaluation methods and indicator elements, among which evaluation methods are diversified, including the TOPSIS model, analytic hierarchy process, multiple linear weighting, fuzzy evaluation method, and weighted principal component analysis [12,13,14,15]. In terms of the selection of indicator elements, there are obvious differences between domestic and foreign choices. Most foreign scholars, based on the study area, select evaluation indicators from the three dimensions of economy, society, and nature. Cloke et al. built their own indicator system and used principal component analysis to measure the quality of rural development in Europe [16]; Gulumse and others explored the rural evolution in England through comparative analysis based on the rural development index optimization evaluation system [17]. Most domestic scholars, based on the policy background, have focused on building an indicator layer using the general requirements of “20 characters” of rural revitalization. Guo Xiangyu et al. built an evaluation system based on the five criteria of “industrial prosperity”, “rural style civilization”, “ecological livability”, “effective governance”, and “affluent life” and analyzed the meaning and connotation of indicators based on the actual situation of the countryside [18]. Mao Jinhuang et al. also built an evaluation system based on the connotation of “20 characters” of rural revitalization, studying rural development in the whole country at the provincial level [19]. While the evaluation process is becoming more and more normalized, some scholars have proposed that the research area and research perspective do not have the same character, and the 20-character policy should be modified and integrated based on practical situations to complete the indicator layer’s construction. Zhang Rongtian et al. measured the rural development level of 41 prefecture-level cities in the Yangtze River Delta region by combining the three dimensions of “population development”, “industrial development”, and “land use” [20]; Zhang Qi et al. built a nationwide rural development measurement framework based on the goal of common prosperity with three logics of “theory”, “history”, and “practice” [21]. In terms of research on the spatial differentiation of rural development, Lv Chengchao et al. used the spatial range model to explore the spatial difference of rural development quality in 34 provinces of China [22], while Zhang Wang et al. used the spatial autocorrelation model to measure the spatial pattern of rural development from the provincial perspective [23], and some scholars have used hot and cold point analysis or cluster analysis to study local clustering [24]. In terms of research on influencing factors of rural development, Zhang Haipeng, He Renwei, and Guan Ziling explored the implementation path of rural revitalization from the perspective of theory and practice [25,26,27], Liu Yansui tried to analyze the driving mechanism of rural revitalization from the perspective of a rural system [28], and some scholars completed analyses using measurement models such as the intermediary effect model and multiple linear regression [29,30].
In summary, existing studies have achieved rich results in all aspects of rural development evaluation; however, there are still some problems. Existing research focuses on the overall development quality but lacks the focused analysis of various development dimensions; in terms of research content, most of the existing studies focus on the construction of a development quality evaluation system, lacking the analysis of spatial differentiation characteristics of development quality; in terms of influencing factor analysis, theoretical, qualitative research comprises the majority of studies, while quantitative influencing factor analysis can be scarcely found. Guangdong Province is the development gateway of China; however, the main driving center of development is the Pearl River Delta region, and the rapid urbanization of Guangdong Province has led to the solidification of the urban–rural dyad. There is a certain spatial heterogeneity in rural development. Taking Guangdong Province as the research area to analyze the spatial distribution characteristics of rural development quality and its influencing factors has certain guiding significance for clarifying the path of differentiated rural development.
Given this, this study takes 20 prefecture-level cities in Guangdong Province as the research object; builds a comprehensive rural-development-quality-evaluation system based on four dimensions of industrial revitalization, rural affluence, social development, and environmental livability; and completes the evaluation process by combining the analytic hierarchy process, entropy method, and the superior–inferior distance method. Then, it uses the spatial autocorrelation model and hot and cold point analysis to explore the spatial differentiation characteristics of rural development quality in Guangdong Province. Finally, the main influencing factors of rural development are clarified by the stepwise regression model, and corresponding development countermeasures are given according to the actual situation. This study is expected to integrate the results with practice and provide a theoretical basis and scientific support for promoting rural differential development and realizing a rural-revitalization strategy.

2. Study Area, Data, and Methodology

2.1. Study Area

Guangdong Province (20°13′–25°31′ N, 109°39′–117°19′ E) governs 21 prefecture-level cities, which can be divided into 4 regions: the Pearl River Delta (Guangzhou, Shenzhen, Zhuhai, Foshan, Dongguan, Zhongshan, Jiangmen, Huizhou, and Zhaoqing), Eastern Guangdong (Chaozhou, Shantou, Jieyang, and Shanwei), Western Guangdong (Maoming, Zhanjiang, and Yangjiang), and Northern Guangdong (Qingyuan, Shaoguan, Yunfu, Meizhou, and Heyuan) (See Figure 1 for details). The terrain of Guangdong Province is complex and diverse. Mountains and hills are mostly distributed in the north-central part of Guangdong Province, accounting for about 60% of the provincial area. Plains are mainly distributed in the Pearl River Delta and Eastern Guangdong. In 2021, the provincial area will total 179,700 km2, including 2.594 million hm2 of cultivated land; the permanent population is 126.84 million, of which the rural population accounts for 25.73%; GDP was USD 1.817 trillion, of which the gross output value of the primary industry accounts for 6.7%. The number of administrative villages is 19,800, with a concentration distribution of “high in the east and west wings, low in the middle”; in terms of rural production, the central region is dominated by secondary and tertiary industries, the eastern and western wings are dominated by fishery and planting, and the northern mountain areas are dominated by forestry and animal husbandry. The diversity of rural areas in Guangdong Province reveals the necessity of rural non-paradigm development.

2.2. Data Sources and Pre-Processing

The administrative boundary data of Guangdong Province at the prefecture level come from the National Basic Geographic Information Center (http://www.ngcc.cn/ngcc/ accessed on 1 July 2022). The data time node is 2021. It should be noted that in 2021, there will be a total of 21 prefecture-level cities in Guangdong Province. Since Shenzhen has been fully urbanized, this paper only takes 20 prefecture-level cities (except for Shenzhen) as the research object.
The evaluation index data are mainly from the 2021 China Statistical Yearbook, China Rural Statistical Yearbook, Guangdong Provincial Statistical Yearbook, Guangdong Provincial Rural Statistical Yearbook, and the Rural Statistical Yearbook of each prefecture-level city. Some data are calculated and collated through the China Civilization Website, the official website of the China Statistics Bureau, the Statistical Bulletin of Social Development, the official website of the Guangdong Provincial Statistics Bureau, and the official website of the municipal statistics bureaus at each prefecture level.
Since there are inverse indicators within the evaluation system, which cannot be calculated uniformly, the positivization of inverse indicators needs to be completed, and the most common method in practice is to take the inverse [31]. Due to the practical significance of the indicators and the comprehensive consideration of the commonly used methods, the urban–rural comparison coefficient was treated with (1/Xi) forwarding, the Engel coefficient and the amount of fertilizer used on farmland were treated with (1/Xi) forwarding, and the remaining 20 indicators were all positive indicators.

2.3. Research Methods

Research methodology is an important basis for ensuring the reliability and credibility of the results of scientific work. This paper adopts traditional econometric analysis methods (hierarchical analysis, entropy method, and TPOSIS) to complete the specific calculation of rural development quality and applies spatial analysis methods (spatial autocorrelation model and cold–hot spot analysis model) to explore the spatial heterogeneity of rural development quality in Guangdong Province, and finally applies a stepwise regression model to analyze the main influencing factors to ensure that the success of the study is true and reliable.

2.3.1. Evaluation System of Rural Development Quality in Guangdong Province

The evaluation dimensions of rural development quality are determined based on the situation of the study area and the scientific connotation of rural revitalization. Under various constraints such as capital, environment, and policies, rural villages in Guangdong Province have decaying commonalities such as low production vitality, one-way labor force loss, backward facilities, and accumulated poverty. This paper synthesizes the connotation of rural revitalization and common characteristics of villages; combines the National Strategic Plan for Rural Revitalization (2018–2022) and existing research results [32,33,34]; and clarifies industrial revitalization, rural affluence, social development, and environmental livability as the four guideline layers of the evaluation system, under which are the production level, production structure, production conditions, collective economic level, residents’ living standard, villagers’ civilization level, infrastructure construction level, natural ecological level, and quality of the living environment. The quality of rural development in Guangdong Province comprises 23 3-level indicators (Table 1).
Industrial revitalization and rural prosperity are important indicators of rural economic development and villagers’ living standards. The achievement of industrial revitalization depends on the interaction of the production level, structure, and conditions. Labor productivity and land productivity reflect the comprehensive rural production efficiency; the proportion of non-agricultural labor force, the dual contrast coefficient between urban and rural areas, and the construction rate of collective property rights are the basic indicators of the status quo and development potential of the industrial structure. Both the mechanization rate and the effective irrigation rate are important indicators of rural production conditions. Rural prosperity includes two definitions of collective prosperity and residents’ prosperity. The rate of building a strong collective village and the average total value of collective assets of the village can reasonably reflect the degree of regional collective prosperity. The higher the ratio of residents’ income to expenditure, the greater the disposable income of residents. The lower the Engel coefficient, the more perfect the residents’ living structure and the higher the residents’ prosperity.
The level of social development reflects the actual situation of villagers’ sharing of developmental achievements and participation in social activities under long-term development, including the explicit elements of infrastructure construction level and the implicit elements of the villagers’ civilization. The popularization rate of tap water, electricity guarantee, and service institution construction rate comprehensively reflect the guarantee of rural residents’ daily life needs; the proportion of civilized villages, the construction rate of popular science communities, and the proportion of high-quality labor can be used to calculate the cultural literacy level of rural residents and indirectly measure the construction of rural education and cultural projects. Among them, it is worth mentioning that civilized villages are recognized by the relevant state departments according to the degree of rural civilization project construction, and a higher proportion of civilized regional villages represents a higher degree of rural civilization project construction in the region. Environmental livability is a binary combination of natural livability and living livability. The forest coverage and environmental relative index are positively correlated with air quality and natural environment quality, respectively, while average fertilizer use is negatively correlated with soil quality; the higher the ratio of rural greening rate, sewage treatment rate, and garbage treatment rate, the higher the living environment level.

2.3.2. Quality Measurement of Rural Development in Guangdong Province

(1)
Data standardization. The raw data need to be dimensionless because the units and magnitudes of each tertiary indicator measured are different. Here, the extreme value processing method with the best processing effect is chosen, drawing on the research results of Zhu Xi’an et al. [35]. To avoid the meaninglessness of logarithm calculation when seeking the entropy value, the data were non-negatively processed by adding 0.01 uniformly; the formula for achieving this is as follows:
X ij = X ij X min X max X min + 0.01
In this formula, Xij represents the value of index j of the i-th evaluation unit and Xij represents the value of index j of the i-th evaluation unit after treatment; Xmax and Xmin represent the maximum and minimum values of the j-th index, respectively.
(2)
Index weight assignment. Reasonably assigning indicators is a necessity for completing scientific research. In this paper, SPSS (Statistical Product and Service Solutions) 26.0 software (IBM, Armonk, NY, USA) was used to determine the subjective weights of the first-level indicators and the third-level indicators by using the analytic hierarchy process, and then the entropy method was used to determine the objective weights of the third-level indicators in each criterion layer one by one. Finally, the weighted average was used to obtain the comprehensive weights of the third-level indicators [36]. It is worth noting that the three levels of indicators among the criteria layers are independent of each other, and the sum of the three levels of indicators within the criteria layers is 1.
First, the Delphi method was used to solicit the professional opinions of ten rural geography researchers in Guangdong Province, and the expert researchers established a 4 × 4 matrix of first-tier indicator weights to determine the importance level relationship among first-tier indicators, and they obtained the weights of A1, A2, A3, and A4. Then, the experts compared the importance levels of each three-level indicator within the approved layer based on the first-level indicator layer, respectively, and established four three-level indicator judgment matrices of 7 × 7, 4 × 4, 6 × 6, and 6 × 6 to obtain the subjective weight AuOj of the j-th indicator of the u-th standard layer. The judgment matrices all passed the consistency test, indicating that the expert opinions were consistent.
Then, based on the dimensionless data, the objective weights of the three indicators in each criterion layer were calculated individually, taking the criterion layer as a whole. Finally, the weighted average was used to calculate the comprehensive weight of each indicator.
A u K j = 1 + 1 ln m i = 1 m x ij i = 1 m x ij ln x ij i = 1 m x ij j = 1 n ( 1 + 1 ln m i = 1 m x ij i = 1 m x ij ln x ij i = 1 m x ij )
A u Q j = ( A u K j + A u O j ) 2
In the formula, AuKj is the objective weight (u = 1,2,3,4) of the j index of the u criteria layer and m is the total number of evaluation units, m = 20. n is the total number of indicators. When u is 1, 2, 3, and 4, n is 7, 4, 6, and 6, respectively. AuQj represents the comprehensive weight of the j-th index of the u-th criterion layer.
(3)
We can calculate the scores of each dimension and the quality of rural development. The TOPSIS method, namely, the “distance method of good and bad solutions”, is a comprehensive evaluation method based on an objective perspective and uses distance as the evaluation standard. Since the indicator data were processed positively and standardized, the scores of each dimension were calculated according to the three-level indicator weights, and then the total scores of the rural development quality of each research unit were obtained according to the subjective weight of the criteria layer [37,38].
Y u = [ y 11 y 1 n y m 1 y mn ] = [ x 11 A u Q 1 x 1 n A u Q n x m 1 A u Q 1 x mn A u Q n ]
C i = u = 1 r C ui × T u
In the above formula, Yu is the evaluation matrix of the u-th dimension based on standardized data and the comprehensive weight of indicators. Zuj+ is the maximum value of the j-th index in the u-th criterion layer. Zuj is the minimum value of the j-th index in the u-th criterion layer. Cui represents the development score of the i-th evaluation unit and the u-th dimension. The value range is [0, 1]. The larger the value, the closer the dimension score is to the optimal level. Ci refers to the quality of rural development of the i-th research unit; r is the total number of primary indicators, r = 4; and Tu is the subjective weight of the u dimension.
(4)
Dividing threshold area boundary. The natural breakpoint classification can maximize the internal similarity of each group after classification, while the difference between external groups is the largest. According to the classification results and the actual situation of the region, the threshold interval can be formulated (Table 2).

2.3.3. Spatial Differentiation Measure of Rural Development Quality and Exploration of Influencing Factors

(1)
Global distribution status analysis. Global spatial autocorrelation measures the degree of spatial agglomeration or dispersion of a certain attribute as a whole. Global Moran’s I can be used to judge whether the quality of rural development in Guangdong Province and the development level of each dimension have overall spatial dispersion or aggregation. The value range of the global Moran index is [−1, 1]. Positive values represent concentrated distribution, negative values represent discrete distribution, and zero values represent random distribution.
(2)
Local aggregation state analysis. Cold–hot spot analysis was used to explore the local spatial clustering characteristics of geographical attributes and judge whether there is high or low value aggregation. Cold–hot spot analysis can be used to judge the quality of rural development and the spatial distribution differences of various dimensions of development levels and clarify their spatial characteristics [39].
(3)
Exploration of influencing factors.
Stepwise regression analysis is often used to establish the optimal or appropriate regression model to further study the dependence between variables and can be used to explore the main influencing factors of rural development. Based on the evaluation indicators of rural development quality in Guangdong Province, the stepwise regression model will automatically identify nonsignificant independent variables, automatically remove them from the model, and then screen out the main influencing factors based on the interpretation of the independent variables [40].

3. Analysis of Results

According to the development quality evaluation model, the total score of rural development quality and the sub-scores of four dimensions of rural development in 20 prefecture-level cities in Guangdong Province were calculated (Table 3).

3.1. Overall Quality of Rural Development

In 2021, the total score of rural development quality in Guangdong Province was between 0.230 and 0.630, and the provincial average was 0.342. Except for the average of 0.422 in the Pearl River Delta, the average value of rural development quality in other regions was less than 0.310. The scores of each unit of the industrial revitalization dimension and the social development dimension were [0.177, 0.736] and [0.091, 0.643], respectively. The results show that the average value of each region is approaching, and there is a large difference between the maximum and minimum values. However, the scores of the industrial revitalization dimension are mainly low, and those of the social development dimension are mainly median. The average provincial score of the rural affluence dimension is 0.248, and the number of research units with the lowest and low development quality accounts for 60%. The average in the Pearl River Delta region is 0.445, higher than the provincial average. The average value of each region in the dimension of environmental livability is relatively high, with the unit score ranging from 0.422 to 0.751. The average value of Northern Guangdong is 0.710, much higher than the provincial average of 0.580 (Figure 2).

3.2. Global Spatial Differentiation

According to the measurement results and grading, the quality data of rural development are spatially connected with the vectorized geographical unit based on Arcgis10.2 software, and the regional distribution map of the quality of rural development and the scores of each dimension were obtained (Figure 3).

3.2.1. Quality of Rural Development

The Moran’s I value of rural development quality in Guangdong Province is 0.385, with a p-value of 0.001, indicating a significant aggregation of rural development quality in Guangdong Province in a spatial sense. The overall pattern of “high-higher-lower-lower” development quality was formed with Dongguan as the core (Figure 3a). As a multifactor integrated hub of culture, economy, and transportation in Guangdong Province, the Pearl River Delta region has an obvious aggregation effect, and with Dongguan City as a typical example, rural development benefits from the radiation of urbanization construction and can effectively undertake the transfer of industries and extension of infrastructure in urban areas, and the degree of rural development is higher. In contrast, the western region of East Guangdong is far from the central part of the country, and multiple factors, such as location disadvantage and weak primitive accumulation, drive the one-way outflow of rural labor, resulting in a lack of rural development momentum.

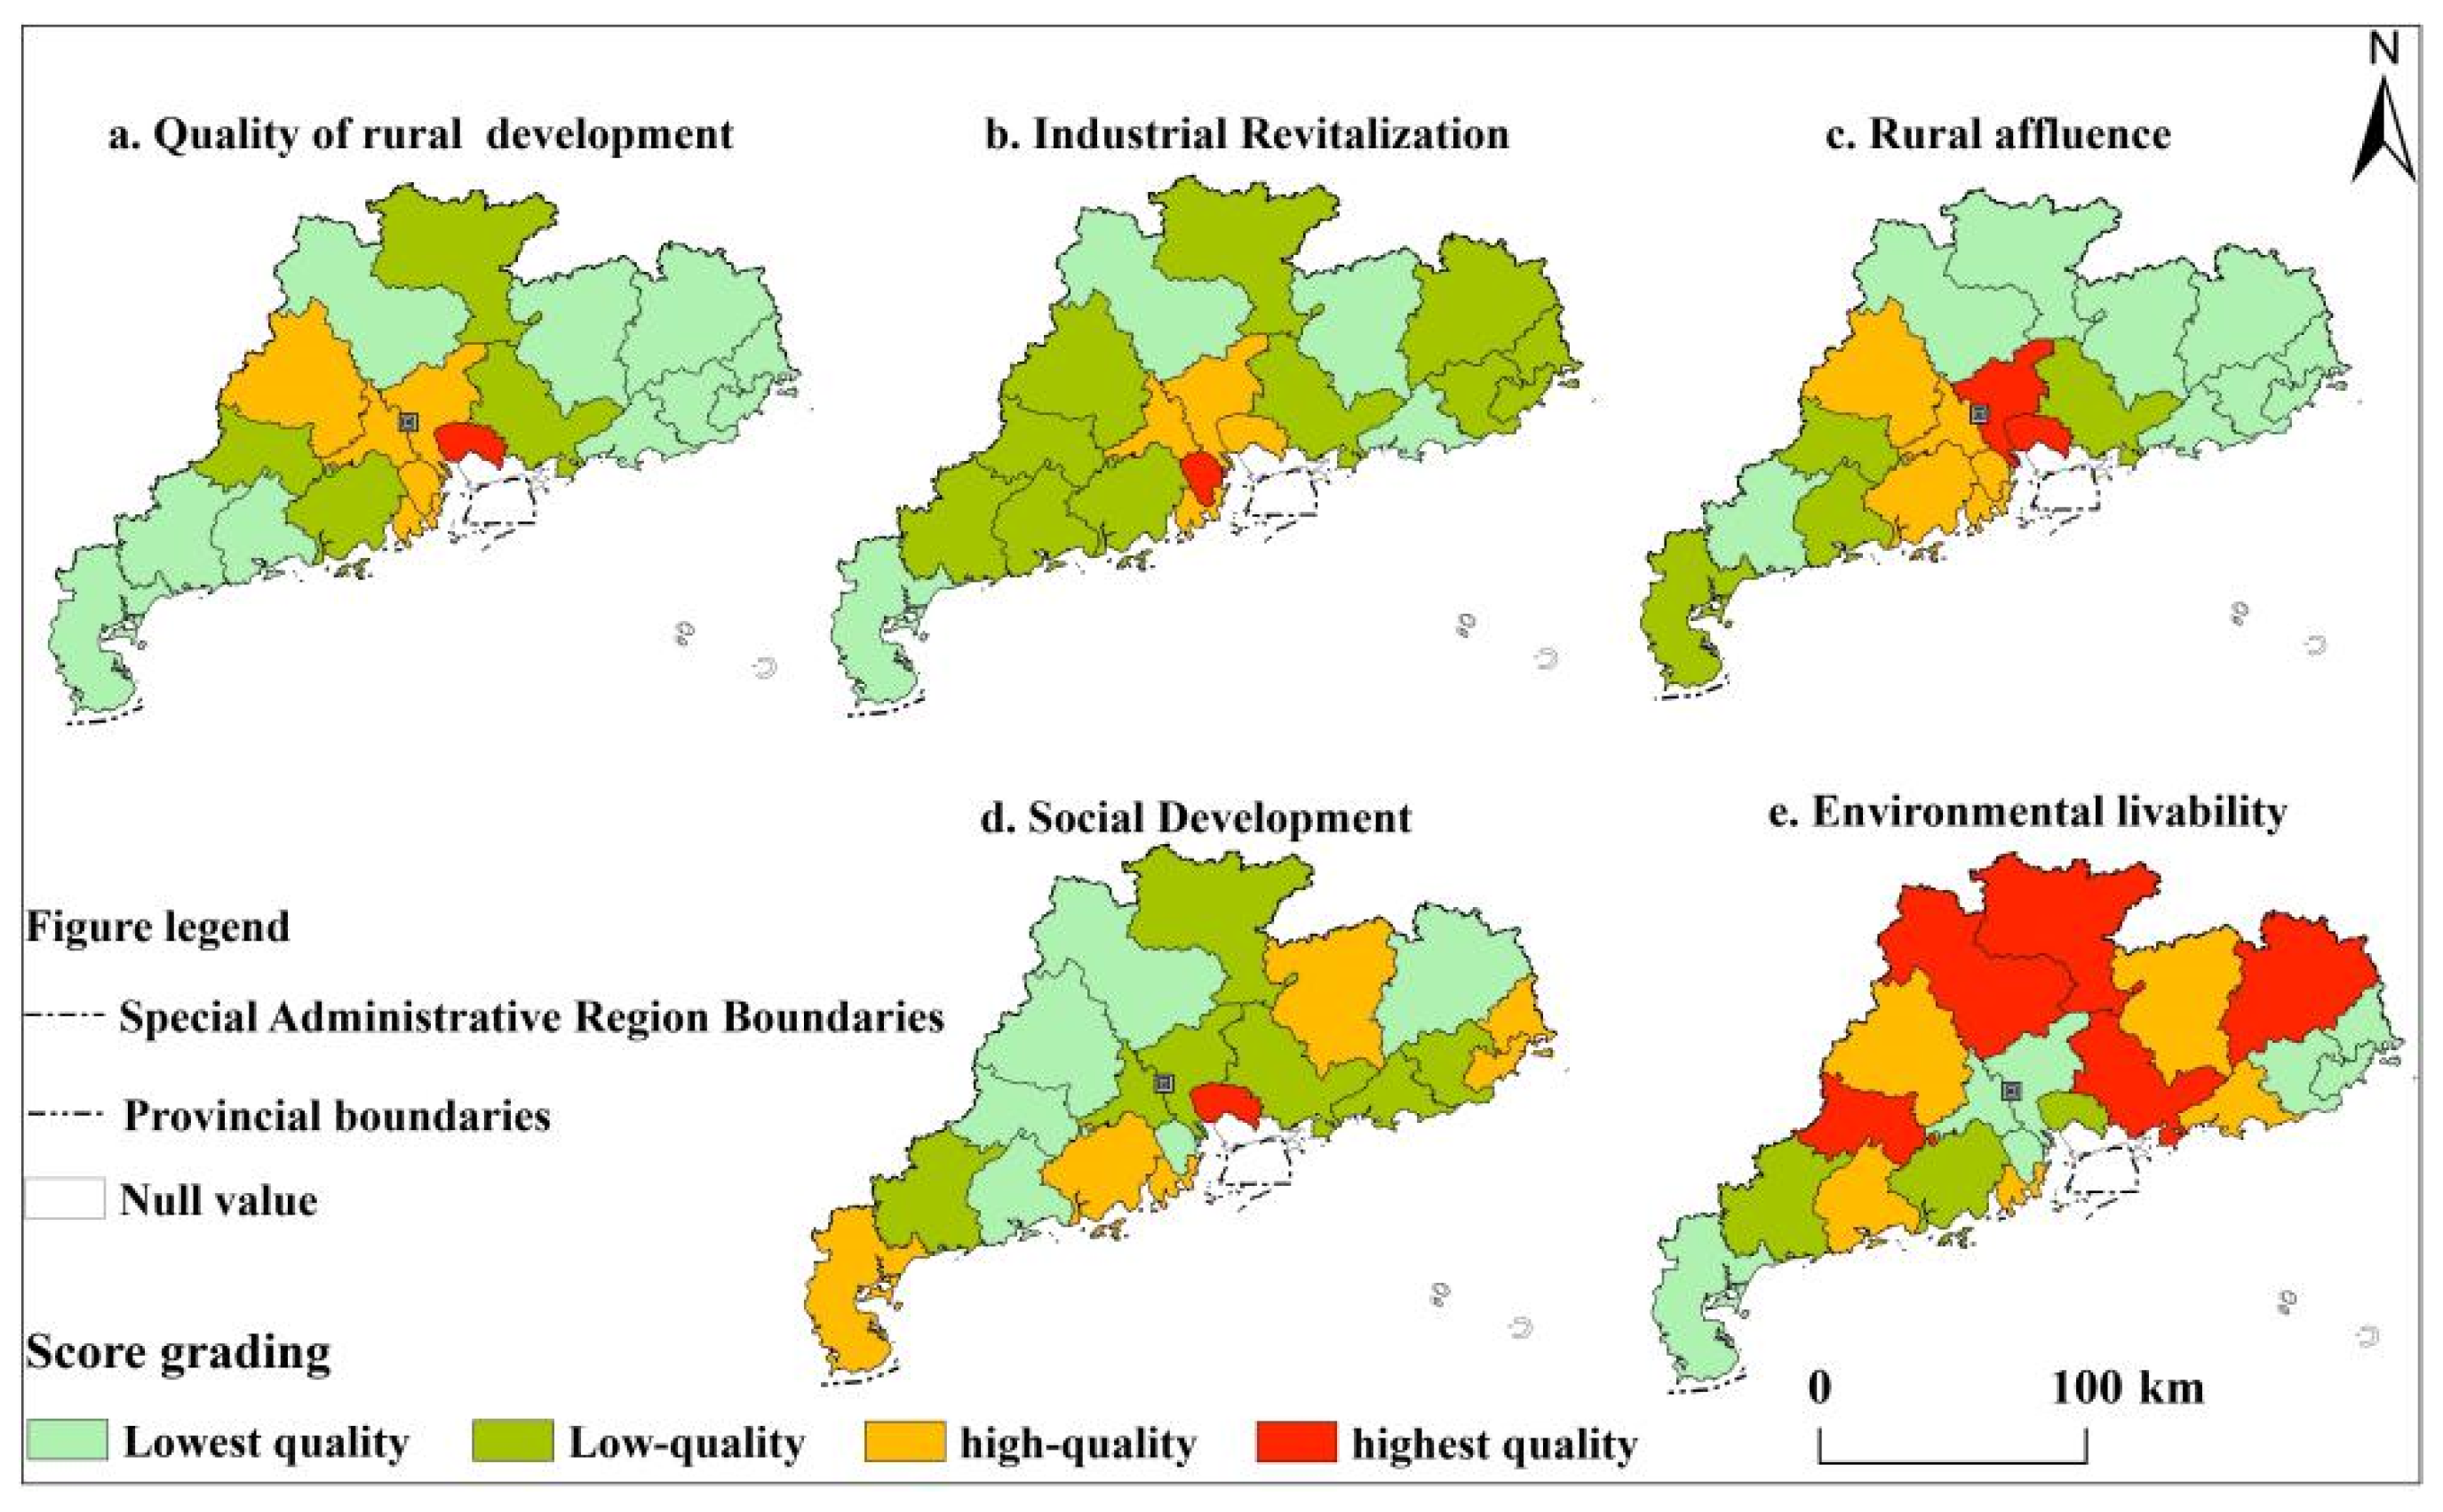
3.2.2. Development Level of Each Dimension

The Moran’s I of industrial revitalization level in Guangdong Province is 0.155; with a p-value of 0.11; indicating that the overall spatial distribution is random. The spatial pattern shows the phenomenon of “single core and multiple facets”, with the high and highest development quality units clustered around Zhongshan City and the low and lowest development units randomly distributed everywhere (Figure 3b). With Zhongshan as the representative of the central Pearl River Delta in the transition period of industrial upgrading; the rural areas in the region take over a large number of processing and agricultural industries and handicraft industries from Guangzhou and Shenzhen; and urban areas with the advantage of low land cost; and the industries develop rapidly. The discrete distribution of low-value units results from the differences in resource endowment and development background of villages with the commonality that each region does not enjoy the radiation of Pearl River Delta development.
The Moran’s I value of the rural affluence dimension is 0.427, with a p-value of 0.001, indicating that spatially, Guangdong Province exhibits a global aggregation of rural affluence dimensions and shows a spatial pattern of high values concentrated in the central part and low values concentrated in the northeast (Figure 3c). The phenomenon of industrial prosperity in the central region has, to a certain extent, driven the development of the collective economy and improved the living standard and structure of rural people, while in the northeastern region of Guangdong, due to the tradition of migrating to work and the compression of agricultural space, there is a large outflow of the labor force and the subsequent phenomenon of hollow villages. Thus, the employment opportunities and quality of the villagers left behind are relatively low, and the income level is not high.
The level of social development is dominated by low and high qualities of development. The global Moran’s I value −0.075 with a p-value of 0.858 indicates the existence of stochasticity under negative spatial correlation. Although the elements of culture and infrastructure construction in the process of social development are influenced by economic development to a certain extent, they are influenced more by the cultural heritage and policy context. Guangdong Province is a vast region, and there are certain cultural differences among villages in different regions, and because rural development is a top-down dominated system, there are inevitable regional differences in the process of infrastructure work and education construction due to different regional development goals and task tendencies. Under the combined effect of multiple factors, the social development dimension forms a discrete spatial pattern.
The high scores of each study unit in the environmental livability dimension are mainly due to the comprehensive implementation of residential environment-improvement projects and ecological-restoration projects under the guidance of policies. Its Moran’s I value is 0.196, with a p-value of 0.124, indicating that the spatial pattern shows a random distribution, but there is a positive spatial correlation. As can be seen in Figure 3e, the classes are interspersed with each other, with the high and highest development quality units clustered in Northern Guangdong and the southwestern Pearl River Delta, the central Pearl River Delta featuring a low value score, and the lowest and low development quality study units being relatively discrete. This is because the mountainous villages in Northern Guangdong have greatly preserved their ecological resource background without overdevelopment, and their forest cover and water resource environment are relatively high quality. In contrast, other regions have been roughly developed during urbanization, and the neatness and ecological suitability of the human living environment have been destroyed.

3.3. Local Spatial Aggregation Features

The random distribution in the global view cannot exclude the aggregation or dispersion in the local view. To further explore the spatial characteristics of rural development quality and development levels in various dimensions in Guangdong Province, the research was completed using Arcgis10.2 to run the cold–hot spot analysis. The specific results are shown in Figure 4.
In terms of regional hotspots, except for the social-development dimension, the rural development quality is highly consistent with the development level of the other dimensions in terms of local distribution, and the hotspot areas are all in the central Pearl River Delta. There is no significant “high–high” or “low–low” clustering in the local space of the environmental livability dimension. The hotspot area of the social development dimension is Heyuan City in Northern Guangdong, which is consistent with the expectation of the Heyuan Municipal Government in 2020 to “establish a rural cadre assessment mechanism, improve the rural public service system, shape a civilized village, and reduce the gap between urban and rural education”, under which the construction of rural public facilities in Heyuan City is in full swing. The level of social development has been improved.
Regarding regional cold spots, the distribution of cold spots in the dimensions of rural development quality and rural affluence have a regional commonality and are clustered in Northeastern Guangdong Province. The cold spots in the social development dimension show a spanning distribution pattern, with Chaozhou City in the east of Guangdong Province and Zhongshan City in the south of the Pearl River Delta being the cold spots. Moreover, Chaozhou City has a higher Z-value and is more closely clustered, while Zhongshan City is in the Pearl River Delta region, with relatively more regional infrastructure construction and cultural and scientific elements flowing, and the low value of clustering is less significant. The analysis results for the two dimensions of industrial revitalization and environmental livability do not show cold spots, indicating no low-value aggregation in the local space for both dimensions.

3.4. Analysis of the Main Influencing Factors of Rural Development

3.4.1. Main Influencing Factors

The analysis of the main influencing factors of rural development is a prerequisite for “localized and specific policies” in the process of rural development. Using the stepwise regression model, the 23 indicators in the evaluation system of rural development quality of Guangdong Province were used as independent variables, and the scores of rural development quality of Guangdong Province were used as dependent variables to filter out the main influencing factors of rural development based on the degree of explanation of the indicators (Table 4).
To verify the accuracy of the analysis results, the P-P scatter plot of residual values was drawn, and the distribution state of residual values can be approximately regarded as a diagonal straight line, which indicates that the model construction quality is good (Figure 5). The model passed the F-test (F = 157.852, P = 0.000 < 0.05), and the D-W value was 1.489, which is in the interval of 1.7~2.3, which proves that the model and the applied data are valid and the results are highly credible.
After automatic identification by the model, four indicators, namely, average collective assets, the Engel coefficient, the construction rate of the science community, and the community service agency coverage, were screened out with an R2 of 0.977, implying that these four indicators can explain 97.7% of the changes in the quality of rural development in Guangdong Province and are the main influencing factors of rural development in the study area.

3.4.2. Positive Impact Factor

The regression coefficients of the average collective assets and the construction rate of the science communities were 0.226 and 0.044, both positive, and the p-values are less than 0.005, indicating that these two factors belong to the driving factors of rural development and have significant positive impact on the quality of rural development in Guangdong Province. The higher the value of average collective assets in villages, the higher the degree of accumulation of regional rural assets and the more sufficient economic motivation for rural construction; moreover, the degree of construction of rural science communities is related to cultural literacy, economic level, and infrastructure construction of the villages in the region, and the higher the penetration rate of popular science facilities, the greater the number of facilities for knowledge learning, quality education, and rural style shaping of rural talents, which can positively influence the talent reserve of future rural development.

3.4.3. Negative Impact Factor

The regression index of the community service agency coverage was −0.093, with a p-value less than 0.001, indicating that this factor is a hindering factor and can have a significant negative impact on the quality of rural development in Guangdong Province. This phenomenon contradicts the traditional sense of the positive impact of infrastructure construction. However, due to the imperfect development of rural industries, the lack of employment opportunities, and the inadequate livelihood security of the people, the combination of multiple factors has led to the intensification of the one-way flow of urban and rural labor factors and the massive loss of rural labor force, and thus the phenomenon of hollow villages is extremely common. In this context, the construction of community service institutions to benefit the people fails to solve the essential problem of rural development, and the construction of a large number of community service institutions not only consumes rural construction funds but also causes the waste of “no people to benefit” facilities due to the one-way outflow of the population, which is not conducive to rural development.

4. Discussion

4.1. Spatial Differentiation of Development Levels in Various Dimensions of Rural Development

The research path of this study is similar to that of Mao and Li et al. [41,42], in which the results were obtained by constructing a rural-development-quality-evaluation system and exploring the regional differences in the development quality of the study area based on the results of the measurement. The results of this study are similar to those of Wan et al. [43], indicating that there is a certain degree of inadequacy and imbalance in the rural development of Guangdong Province, and the phenomenon of “the Pearl River Delta is the core of high values, and the rest of the regions are clustered with low values” is common in all dimensions. The development level of rural areas in the Pearl River Delta is good in all dimensions, mainly due to the economic accumulation of regional urbanization, which has enabled the rural areas to effectively take over the industrial transfer from the cities and improve the rural industrial structure, as well as the growth of villagers’ income and collective economy. The accumulation of large amounts of capital has also contributed to improving infrastructure construction and scientific and educational facilities, which has enhanced villagers’ happiness [44]. Early urbanization did not consider regional ecological safety guarantees, resulting in a relatively low development level of the environmental livability dimension in economically developed areas, while mountainous areas in Northern Guangdong scored higher in the environmental livability dimension due to natural resource advantages and regional policy support [45].

4.2. Recommendations

4.2.1. Differentiation and Integration of the Overall Situation, the Pursuit of Maximum Comprehensive Benefits

There are obvious spatial differences in rural development in Guangdong Province, and it is necessary to seek differentiated development paths. The comprehensive revitalization of the countryside in the future needs to adjust the structure of regional resources from a global perspective to maximize the comprehensive benefits. For example, Guangzhou and Zhuhai are developing rural rental housing projects with the advantage of rich local population resources and many urban cultural and tourism project resources. Their rural stock of land has been revitalized, and the rural rental housing system has been improved through land remediation, which enhances land-use efficiency and reasonably promotes rural economic development. Additionally, while promoting the income generation of collective assets, the local area feeds ecological engineering construction in a timely fashion, retaining the resource background with a high-quality natural environment and reaching sustainable rural revitalization. Villages in other regions should reasonably coordinate resource utilization and protection according to their own resource endowments to promote the joint prosperity of the collective economy, rural ecology, and rural social environment.

4.2.2. Grow Collective Assets and Enhance the Civilization of the Countryside

According to the main driving factors, future rural development should pay attention to the accumulation of collective assets; support major industries with “one village, one product”; optimize industrial structure and workflow; increase rural employment opportunities and improve employment quality; and strengthen labor force attraction and increase rural development capital accumulation. At the same time, rural culture and science construction should receive attention by constructing educational facilities to improve the knowledge of human resources and consolidate the human resource base for future development.

4.2.3. Steady Development Rate and Emphasis on Improving People’s Livelihood

Based on the main impeding factors, in the construction of public service facilities, the future development of rural areas in Guangdong Province should be integrated with the regional economy, culture, population, and other factors and abandon “quantitativeism” to complete the coverage of public service facilities based on the suitability of construction to avoid the phenomenon of “built but not used”. The phenomenon of “building but not using” is a waste of public resources. At the same time, we should pay attention to improving the living structure of the residents, increasing the employment opportunities in the countryside through industrial construction, increasing the income of the villagers, and improving the living and recreational environment of the countryside residents through propaganda, popularization, introduction, and other forms to improve the quality of life of the villagers and retain talent to develop the countryside.

4.3. Deficiencies and Prospects

This paper constructs an evaluation system based on the actual situation of Guangdong Province and existing research results; clarifies the spatial differentiation and influencing factors of each dimension of rural development; broadens the research ideas of rural development quality evaluation; explores the spatial characteristics of rural development in Guangdong Province using a global spatial autocorrelation model and cold–hot spot model; and explores the main influencing factors of rural development using a stepwise regression model, which is useful for assessing the current situation of rural development. Moreover, it has certain guiding significance for assessing the current situation of rural development and implementing a rural-revitalization strategy in a differentiated manner. However, rural development is a complex scientific issue. There are still certain limitations to this study that need to be discussed further.
The selection of indicators for the evaluation system of rural development quality needs further exploration. Based on the actual situation of the study area and the rural-revitalization strategy, this paper constructs an evaluation system using four dimensions: “industrial revitalization, rural affluence, social development and environmental livability”, and completes the evaluation by combining the advantages of the entropy value and hierarchical analysis methods. However, due to the availability of data and the difficulty of quantifying some indicators, political governance was not considered in the index system of this study. The quality of rural development is the result of the integration of demographic, ecological, social, and economic factors [46], and it is important for future research to objectively consider the quantitative criteria of each factor and improve the index system.
The study of spatial differentiation of rural development needs to be further explored. This paper used the spatial autocorrelation model and cold–hot spot analysis to explore the regional differences in the development level of each dimension of rural areas in Guangdong Province in 2020, which is of guiding significance for clarifying the spatial distribution of the rural development level and the different policies that can be utilized for rural development. However, this paper failed to complete a spatial and temporal evolution analysis based on a certain time series to explore the spatial and temporal differences of its rural-development distribution. The rural-development system is a multi-factor complex, and a certain degree of variation is bound to exist under a certain time series [47]. Using spatiotemporal evolution analysis to study the regional differences in the quality of rural development within a certain period is the next research task.
Research on the influencing factors of rural development needs to be deepened further. This paper uses a stepwise regression model to explore the main influencing factors of rural development in Guangdong Province, which is of guiding significance for the smooth implementation of a rural-revitalization strategy. However, while the current study is only a processing analysis of the measurement data and does not connect the spatial attributes of the study units, the geographical attributes of the influencing factors are important objects for consideration in spatialized research [48], and future research should deeply explore the spatial differences of the influencing factors and explore which differences exist in the main influencing factors in different regions.

5. Conclusions

The quality of rural development and the development level of each dimension in Guangdong Province have obvious regional differences. Spatially, the development quality of rural areas in Guangdong Province has formed a circle-like outward diffusion pattern of “highest-high-low-lowest” development quality with Dongguan City as the core, and the high-value units of environmental livability dimension are distributed in the east and north of Guangdong Province, while the high-value units of the remaining dimensions are concentrated in the central region of Guangdong Province.
In terms of spatial aggregation, except for the social development dimension, the hotspots of spatial aggregation of rural development quality and each dimension are located in the central part of the province, and the cold spots are located in the northeastern part of the province, among which the environmental livability dimension does not have low-value aggregation in a spatial sense, while the social development dimension forms a cold–hot spot distribution pattern of “hot spot in the northeast and cold spot in the central part”.
The results of the dominant factor analysis show that the average collective assets, the construction rate of science popularization community, the Engel coefficient, and the community service agency coverage are the main influencing factors of rural development, with R2 = 0.977, and their explanatory degrees for the regional differences in the quality of rural development in Guangdong Province are 0.226, 0.044, 0.119, and −0.093, respectively. The first two are the main driving factors, and the latter two are the main hindering factors.
Future research work should focus on increasing the number of research years, forming a certain time series of research results, and improving the evaluation system to better obtain the change patterns of provincial rural development quality. Research should also pay attention to the geographical attributes of the influencing factors and increase the spatial heterogeneity analysis of the influencing factors to further broaden the research horizon and enhance the research significance.

Author Contributions

Conceptualization, Z.-J.W. and D.-F.W.; methodology, Z.-J.W. and D.-F.W.; software, Z.-J.W. and M.-J.Z.; validation, M.-J.Z., P.-F.M., Z.-C.L. and Y.-X.L.; formal analysis, Z.-J.W.; resources, Z.-J.W., M.-J.Z. and P.-F.M.; data curation, Z.-J.W., M.-J.Z., P.-F.M., Z.-C.L. and Y.-X.L.; writing—original draft preparation, Z.-J.W.; writing—review and editing, D.-F.W., M.-J.Z., P.-F.M., Z.-C.L. and Y.-X.L.; visualization, Z.-J.W.; supervision, D.-F.W.; project administration, D.-F.W. All authors have read and agreed to the published version of the manuscript.

Funding

The 13th Five-Year Plan of Guangdong Province (GD20XYJ32); Guangdong Provincial Education Science “13th Five-Year Plan” Research Project (2020GXJK199); Youth Foundation for Humanities and Social Sciences Research, Ministry of Education (19YJCZH279); Funding by the Tertiary Education Scientific research project of Guangzhou Municipal Education Bureau in 2022 (202235269); 2022 Guangdong Province Ordinary University characteristic innovation category Project (Humanities and Social Sciences category) (2022WTSCX087); 2022 Guangzhou Higher Education teaching quality and teaching reform project (No. 2022JXTD001); 2021 Curriculum Ideological and political education construction project “land use planning” of Guangdong Institute of teaching management of colleges and universities (No. x-kcsz2021158); Guangzhou University Project “On-campus research projects (research category)” (No. YJ2021007); 2022 Guangdong province undergraduate university on-line open course steering committee research (No. 2022ZXKC367).

Institutional Review Board Statement

Not applicable.

Informed Consent Statement

Not applicable.

Data Availability Statement

Not applicable.

Acknowledgments

The authors would like to acknowledge Wu Dafang, Guangzhou University, for valuable discussion and assistance in interpreting the significance of the results of this study. We also thank the editor and reviewers for their valuable comments and suggestions.

Conflicts of Interest

The authors declare no conflict of interest.

References

  1. Ye, X. The General Principles of the China’s Rural Vitalization Strategy in the New Era. Reform 2018, 31, 65–73. [Google Scholar]
  2. Zhang, H.; Guo, Y. Integrated Development Paths of Agriculture, Rural Areas and Farmers During Evolution of Ecological-Social-Environmental System in Shaanxi Province. Bull. Soil Water Conserv. 2018, 38, 221–228. [Google Scholar]
  3. Wang, X.; Li, F.; Wang, X. Exploration on the Path of Rural Revitalization in Shanxi from the Perspective of Urban-Rural Integration Development. Hum. Geogr. 2022, 37, 131–139. [Google Scholar]
  4. Long, H.; Tu, S. Rural Restructuring: Theory, Approach and Research Prospect. Acta Geogr. Sin. 2017, 72, 563–576. [Google Scholar]
  5. Liu, J.; Zhang, Q.; Zeng, X. Research on the Development of City Financial Systems under the Rural Revitalization Strategy. J. Contemp. Educ. Res. 2021, 5, 14–19. [Google Scholar] [CrossRef]
  6. Zhou, D.; Qi, J.; Zhong, W. Review of Urban-Rural Integration Evaluation: Connotation Identification, Theoretical Analysis, and System Reconstruction. J. Nat. Resour. 2021, 36, 2634–2651. [Google Scholar] [CrossRef]
  7. Zhang, J. Village Value Orientation and Rural Revitalization. Chin. Rural Econ. 2018, 34, 2–10. [Google Scholar]
  8. Guo, Y.; Liu, Y. The Process of Rural Development and Paths for Rural Revitalization in China. Acta Geogr. Sin. 2021, 76, 1408–1421. [Google Scholar]
  9. Zhang, Y.; Shao, X. Measure Evaluation and Development Path of Urban-Rural Integration in Jilin Province. Agric. Econ. 2022, 418, 96–98. [Google Scholar]
  10. Ma, L.; Li, H.; Dou, H.; Bai, J.; Fang, F.; Che, X. Spatial Differentiation Characteristics of Influencing Factors of Quality of Rural Life in Gansu Province. J. Ecol. Rural Environ. 2020, 36, 1251–1259. [Google Scholar]
  11. Yi, X.; Chen, Y.; Xiang, Y.; Wang, H. Construction and Evaluation of Index System for County Rural Revitalization the Case of Deqing County of Guangdong Province. Chin. J. Agric. Res. Reg. Plan. 2020, 41, 187–195. [Google Scholar]
  12. Georgios, C.; Nikolaos, N.; Michalis, P. Neo-Endogenous Rural Development: A Path toward Reviving Rural Europe. Rural Sociol. 2021, 86, 911–937. [Google Scholar] [CrossRef]
  13. Ebrahim, K.; Omid, A.; Nasser, T. Application of TOPSIS method in evaluation and prioritization of social stability in rural areas (Case Study: Zidasht Basin). J. Appl. Sci. Environ. Manag. 2017, 21, 49. [Google Scholar] [CrossRef] [Green Version]
  14. Hoang, L.K. Fuzzy-AHP Application in Analyzing the Factors Affecting Quality of Rural Labor. J. Asian Financ. Econ. Bus. 2020, 7, 715–721. [Google Scholar] [CrossRef]
  15. Foroozesh, F.; Monavari, S.; Salmanmahiny, A.; Robati, M.; Rahimi, R. Assessment of Sustainable Urban Development Based on A Hybrid Decision-Making Approach: Group Fuzzy BWM, AHP, and TOPSIS–GIS. Sustain. Cities Soc. 2022, 11, 76. [Google Scholar] [CrossRef]
  16. Cloke, P.; Edwards, G. Rurality in England and Wales 1981: A Replication of the 1971 Index. Reg. Stud. 1986, 20, 289–306. [Google Scholar] [CrossRef]
  17. Gulumser, A.; Baycan, L.; Nijkamp, P. Mapping Rurality: Analysis of Rural Structure in Turkey. Int. J. Agric. Res. Gov. Ecol. 2009, 8, 130–157. [Google Scholar] [CrossRef]
  18. Guo, Y.; Hu, Y. Construction of Evaluation Index System of Rural Revitalization Level. Agric. Econ. Manag. 2020, 11, 5–15. [Google Scholar]
  19. Mao, J.; Wang, L. Construction of Evaluation Index System of Rural Revitalization—Based on the Demonstration of Province Level. Stat. Decis. 2020, 36, 181–184. [Google Scholar]
  20. Zhang, R.; Zhang, X.; Lu, J. Evaluation and Spatiotemporal Differentiation of Rural Development in the Yangtze River Delta, China. J. Ecol. Rural Environ. 2021, 37, 698–705. [Google Scholar]
  21. Zhang, Q.; Li, S. The Construction of Evaluation System of China’s Rural Revitalization with Common Prosperity as the Goal. Gansu Soc. Sci. 2022, 44, 25–34. [Google Scholar]
  22. Lv, C.; Cui, Y. Rural Vitalization and Development: Evaluation Index System, Regional Disparity and Spatial Polarization. Issue. Agric. Econ. 2021, 42, 20–32. [Google Scholar]
  23. Zhang, W.; Bai, Y. Research on Regional Difference, Distribution Dynamic Evolution and Spatial Correlation of China’s Rural Revitalization Level. J. Quant. Technol. 2022, 39, 84–102. [Google Scholar]
  24. Lu, F.; Pang, Z.; Deng, G. Measurement and Formation Mechanism of Regional Differences in Rural Revitalization in China. Inq. Econ. Issues 2022, 43, 19–36. [Google Scholar]
  25. Zhang, H.; Hao, L.; Yan, K. Strategic Thinking on Rural Revitalization Strategy: Theoretical Origin, Main Innovation and Realization Path. Chin. Rural Econ. 2018, 34, 2–16. [Google Scholar]
  26. He, R. Urban-Rural Integration and Rural Revitalization: Theory, Mechanism and Implementation. Geogr. Res. 2018, 37, 2127–2140. [Google Scholar]
  27. Guan, Z.; Chen, S.; Zhao, T. Development Strategy of County Construction Land Based on Landscape Ecological Security Pattern: A Case Study of Rural Revitalization in Yongtai County, Fujian Province. Bull. Soil Water Conserv. 2019, 39, 199–204+322. [Google Scholar]
  28. Liu, Y.; Zhou, Y.; Li, Y. Rural Regional System and Rural Revitalization Strategy in China. Acta Geogr. Sin. 2019, 74, 2511–2528. [Google Scholar]
  29. Zhao, P.; Hu, Y. The Influence of New Urbanization on the Rural Economic Development: A Case Study of Xinjiang. Res. Agric. Mod. 2020, 41, 385–395. [Google Scholar]
  30. Gao, X. Empirical Study on Internal Influencing Factors of Farmer Households’ Green Production Behavior in Rural Revitalization Strategy. Econ. Surv. 2019, 36, 41–48. [Google Scholar]
  31. Chen, P. Comparison of Linear Normalization Methods and the Conversion Method of Reverse Indicators. Oper. Res. Manag. Sci. 2021, 30, 95–101. [Google Scholar]
  32. Yan, Z.; Wu, F. From Binary Segmentation to Convergence Development—A Study on the Evaluation Index System of Rural Revitalization. Economies 2019, 31, 90–103. [Google Scholar]
  33. Chen, J.; Shi, H.; Lin, Y. Research on Evaluation System and Method of Rural Revitalization Level: A Case Study of 6 Provinces in East China. East China Econ. Manag. 2021, 35, 91–99. [Google Scholar]
  34. Du, G.; Xue, R.; Wang, J. Rural Revitalization Evaluation and Promotion Path Based on Village Level: Taking Baiquan, Heilongjiang, China as a Case Study. Econ. Geogr. 2021, 41, 19–27. [Google Scholar]
  35. Zhu, X.; Li, L. Study on the Excellent Criteria of Comprehensive Evaluation and Weighting. Stat. Decis. 2016, 32, 23–26. [Google Scholar]
  36. Zhang, Y.; Zhao, Y.; Zhou, L.; Wang, Q.; Feng, L. Rural Revitalization Evalution and Regional Comparision Based on the Improved Topsis Method. Chin. J. Agric. Res. Reg. Plan. 2021, 42, 207–217. [Google Scholar]
  37. Barman, J.; Biswas, B. Application of e-TOPSIS for Ground Water Potentiality Zonation using Morphometric Parameters and Geospatial Technology of Vanvate Lui Basin, Mizoram, NE India. J. Geol. Soc. India 2022, 98, 1385–1394. [Google Scholar] [CrossRef]
  38. Miceikienė, A.; Skauronė, L.; Krikštolaitis, R. Assessment of the Financial Autonomy of Rural Municipalities. Economies 2021, 9, 105. [Google Scholar] [CrossRef]
  39. Lechowski, L.; Jasion, A. Spatial Accessibility of Primary Health Care in Rural Areas in Poland. Int. J. Environ. Res. Public Health 2021, 18, 9282. [Google Scholar] [CrossRef]
  40. Kendra, L.; Deborah, E. Psychosocial predictors of rural psychological help seeking. J. Rural Ment. Health 2020, 44, 232–242. [Google Scholar]
  41. Mao, J. The Improvement and Empirical Research of the Methods of Constructing Rural Revitalization Evaluation Index System. J. Lanzhou Univ. Soc. Sci. 2021, 49, 47–58. [Google Scholar]
  42. Li, H.; Guo, T.; Peter, N.; Xie, X.; Liu, J. Farmers’ Livelihood Adaptability in Rural Tourism Destinations: An Evaluation Study of Rural Revitalization in China. Sustainability 2020, 12, 9544. [Google Scholar] [CrossRef]
  43. Wan, Z.; Fang, S. A Study on Imbalance and Inadequacy of Guangdong Province from the Perspective of Rural Vitalization. Issue Agric. Econ. 2019, 40, 117–124. [Google Scholar]
  44. Zhao, W.; Liang, Z.; Li, B. Realizing a Rural Sustainable Development through a Digital Village Construction: Experiences from China. Sustainability 2022, 14, 14199. [Google Scholar] [CrossRef]
  45. Wang, Y. Institutional Interaction and Decision Making in China’s Rural Development. J. Rural Stud. 2020, 76, 111–119. [Google Scholar] [CrossRef]
  46. Zhou, Y.; Liu, J.; Kang, X. Market-Driven Rural Construction—A Case Study of Fuhong Town, Chengdu. Sustainability 2022, 14, 6014. [Google Scholar] [CrossRef]
  47. Wang, X.; Qi, W.; Liu, S.; Liu, Z.; Gao, P.; Jin, H. The Settlement Intention of Urban-to-Urban Migrants in China: Spatial Differences and Driving Factors. J. Geogr. Sci. 2022, 32, 2503–2524. [Google Scholar] [CrossRef]
  48. Feng, W.; Liu, Y.; Qu, L. Effect of Land-Centered Urbanization on Rural Development: A Regional Analysis in China. Land Use Policy 2019, 87, 104072. [Google Scholar] [CrossRef]
Figure 1. Division of administrative regions in Guangdong Province and their locations in China.
Sustainability 15 01855 g001
Figure 2. Mean value of each dimension in the province and four regions.
Sustainability 15 01855 g002
Figure 3. Spatial distribution of the dimensions of rural development.
Sustainability 15 01855 g003
Figure 4. Local distribution of each dimension of rural development quality.
Sustainability 15 01855 g004
Figure 5. Stepwise regressions to normal fit of residual values.
Sustainability 15 01855 g005
Table 1. Design table of evaluation index of rural development quality in Guangdong Province.
Criterion LayerWeights of Primary IndicatorsSecondary IndicatorsThird-Level IndicatorsWeights
SubjectiveObjectiveComprehensive
Industrial revitalization (A1)0.23Production levelLabor productivity (X1)0.140.100.12
Land productivity (X2)0.170.170.17
Production structureProportion of non-agricultural personnel (X3)0.150.150.15
Urban–rural coefficient (X4)0.090.060.08
Construction rate of collective property rights (X5)0.110.080.09
Production conditionsProduction mechanization rate (X6)0.220.300.26
Effective irrigation rate of farmland (X7)0.130.130.13
Rural affluence
(A2)
0.29Collective economic levelProportion of economically strong villages (X8)0.190.170.18
Average collective assets (X9)0.400.510.45
Residents’ living standardEngel coefficient (X10)0.180.150.17
Income expenditure ratio (X11)0.230.170.20
Social development
(A3)
0.22Civilization of villagersPercentage of civilized villages (X12)0.140.120.13
Construction rate of science popularization community (X13)0.170.180.17
Proportion of highly educated workforce (X14)0.170.080.12
Infrastructure construction levelTap water coverage (X15)0.170.180.18
Power coverage (X16)0.220.390.31
Community service agency coverage (X17)0.130.050.09
Environmental livability
(A4)
0.26Natural ecological levelEnvironmental relative index (X18)0.170.230.20
Forest coverage (X19)0.150.220.19
Amount of fertilizer used in farmland (X20)0.140.190.16
Quality of living environmentVegetation greening rate (X21)0.170.140.15
Domestic sewage treatment rate (X22)0.180.090.14
Domestic waste disposal rate (X23)0.190.130.16
Table 2. Hierarchical assignment of rural development quality in Guangdong Province.
DimensionThreshold Boundary
Lowest QualityLow-QualityHigh-QualityHighest Quality
Quality of rural development<0.304(0.304, 0.367)(0.367, 0.415)(0.415, 0.631)
Industrial revitalization<0.220(0.220, 0.334)(0.334, 0.487)(0.487, 0.736)
Rural affluence<0.120(0.120, 0.234)(0.234, 0.448)(0.448, 0.831)
Social development<0.145(0.145, 0.231)(0.231, 0.334)(0.334, 0.644)
Environmental livability<0.478(0.478, 0.529)(0.529,0.684)(0.684, 0.751)
Table 3. Regional scores of various dimensions of rural development in Guangdong Province.
CityQuality of Rural DevelopmentIndustrial RevitalizationRural AffluenceSocial DevelopmentEnvironmental Livability
FractionRankFractionRankFractionRankFractionRankFractionRank
Guangzhou0.40940.35140.59320.181110.44917
Foshan0.40450.45330.44830.20790.47714
Dongguan0.63010.48620.83010.64310.52312
Zhuhai0.41520.35150.34470.33420.6199
Zhongshan0.41430.73610.38150.091200.43918
Huizhou0.35080.247150.216100.170130.7443
Jiangmen0.36770.253130.39140.26460.52911
Zhaoqing0.38960.32770.36060.145150.6846
Shantou0.282150.31980.115130.29540.42220
Chaozhou0.275170.33360.115140.24070.43219
Shanwei0.274180.220170.068170.193100.61810
Jieyang0.230200.263120.056190.154140.46016
Shaoguan0.327100.271110.114150.23180.6955
Qingyuan0.291130.177200.099160.122170.7482
Meizhou0.281160.277100.030200.103180.7164
Heyuan0.289140.196180.068180.26550.6388
Yunfu0.33690.249140.21790.096190.7511
Yangjiang0.304110.241160.156110.131160.6707
Zhanjiang0.299120.188190.23480.30230.46915
Maoming0.272190.28090.120120.177120.51413
Table 4. Stepwise regression analysis results.
Sub-ItemNon-Standard CoefficientsStandard CoefficientTPVIFR2After Adjustment
R2
F
BErrorBeta
Factor0.2950.010-28.4390.000 **-0.9770.971F (4,15) = 157.852
P = 0.000
D-W: 1.489
X90.2260.0180.66412.3560.000 **1.869
X100.1190.0120.4049.5770.000 **1.150
X130.0440.0180.1312.4870.025 **1.782
X17−0.0930.016−0.256−5.9260.000 **1.210
Note: ** means that the subsequent numbers do not affect the study process and subsequent numbers are omitted.
Disclaimer/Publisher’s Note: The statements, opinions and data contained in all publications are solely those of the individual author(s) and contributor(s) and not of MDPI and/or the editor(s). MDPI and/or the editor(s) disclaim responsibility for any injury to people or property resulting from any ideas, methods, instructions or products referred to in the content.

