Abstract
The energy balance differences between urban and rural areas give rise to a representative phenomenon of urban climate change called the urban heat island (UHI). The UHI phenomenon, which is exacerbated by global warming effects and urban expansion, exposes urban areas and populations to thermal stress and overheating. Therefore, measuring the intensity of UHI vulnerability is needed to mitigate its effects on health, comfort, energy consumption and infrastructure. Additionally, urban decision makers are looking for methodologies to identify the most vulnerable areas in urban planning. This research aims to investigate areas prone to urban overheating in Montpellier Mediterranean metropolitan area as a representative case study of the French urban planning context. The objective is to develop a methodology for assessing UHI vulnerability based on the interaction of exposure and sensitivity to urban planning policies. Accordingly, a set of fifteen indicators is developed to visualize urban planning policies, exposure and sensitivity to urban overheating. A statistical-based method is applied to determine the individual weights based on the indicators’ variance, which is calculated using principal component analysis (PCA). The spatial and urban planning distribution of vulnerability is then analyzed. The results indicate that the areas with the highest urban planning challenges are most vulnerable to UHI. In fact, the results reveal that these areas have urban planning characteristics likely to aggravate urban overheating. Therefore, this research proposes a methodology for integrating mitigation solutions into urban planning: increase in permeable and green areas; improvement of urban ventilation and heat exchange and decrease in anthropogenic heat generation. It demonstrates that combining urban planning policies with exposure and sensitivity is a new perspective for vulnerability studies. The findings of this study can be utilized by decision makers to better visualize areas susceptible to UHI and plan appropriate mitigation strategies.
1. Introduction
The concentration of the world’s population and human activities within urban environments has an impact on the urban microclimate [1]. Urban areas are subject to urban overheating, characterized by higher temperatures compared to surrounding rural areas [2]. This phenomenon, described since the 19th century [3] and known as the urban heat island (UHI), is a consequence of the modification of the environment by human occupation and urban planning [4,5]. Indeed, this phenomenon is reinforced by a set of urban parameters such as urban morphology which disrupts air circulation, leading to the trapping of heat and pollutants [6]. They are composed of few vegetated spaces, which limit the cooling power of plants through evapotranspiration [7]. The materials used in construction and public spaces disrupt the absorption and reflection of solar radiation, resulting in the trapping during the day and the release at night of the accumulated heat [8]. Finally, the presence of human activities and the energy used in urban areas are at the origin of the generation of anthropogenic heat in the ambient air [9]. In recent decades, more and more territories are confronted with the UHI phenomenon. According to Santamouris [10,11], this phenomenon is well documented in more than 400 cities in Europe and around the world, and the intensity of overheating is currently close to 10 °C. This increase in urban temperatures is not without consequences. Indeed, combined with global warming and urban densification, UHI’s effects are particularly visible in cities which are confronted by heat waves, leading to health risks and discomfort for the most fragile inhabitants and over-consumption of energy linked to cooling [12,13].
Within the scientific community, these concerns have led to improved knowledge in urban climatology of the UHI phenomenon [14]. Intensive research has, therefore, been carried out to develop and test measures to combat the effects of UHI at the micro and macro level [15,16,17]. One of the major advances in this field has highlighted solutions linked to urban forms and adaptation, such as increasing green spaces and the installation of reflective or green materials and evaporative systems. Hulley in 2012 [18], Akbari in 2016 [19] and Santamouris in 2017 [20] carried out state-of-the-art studies of mitigation solutions and their cooling potential. More recently, Bernard and al. [21] proposed a classification of solutions into three main categories, namely: green solutions which are based on the systemic services of nature (i.e., water and vegetation) which enables to cool urban temperatures; gray solutions based on engineering systems using water, materials, urban form or the regulation of energy consumption and soft solutions based on political strategies and uses.
Interest in the UHI phenomenon has also enabled the development of research aimed at identifying and locating areas most prone to overheating. Numerous studies have been conducted to determine the vulnerability to the effects of UHI of several international cities and metropolitan areas [22]. Vulnerability is described by Turner as the susceptibility to experience and resist harm due to exposure to hazard, disturbance or stress [23]. Thus, studies of vulnerability to the effects of UHI combine the scientific knowledge acquired in several fields such as urban climatology and social sciences, which impact and exacerbate the vulnerability of a territory [24]. On the one hand, by considering exposure to urban overheating, these studies report parameters that intensify vulnerability [25]. On the other hand, sensitivity and adaptive capacity refer to the population and reflect their fragility and degree of resistance to overheating [26,27]. These studies use various indicators, which can be classified into two groups. The first group includes the socioeconomic characteristics that allow to identify populations based on the conditions that heighten their risk exposure such as age, gender, health conditions and financial resources [24,26,27]. The second group concerns the environmental characteristics which include climatic, urban, architectural and landscape conditions of risk exposure [24,25].
The urban microclimate and its impacts on populations are at the heart of reflections for urban decision makers and constitute a challenge for the sustainable development of their territory. However, until recently, within urban planning, the consequences of town planning and urbanization on the urban climate are less integrated [28]. Indeed, the prioritization of these questions within the territories is still recent, as a result, the integration of knowledge acquired in urban climatology into employable methodologies and solutions is complex for urban decision makers [29]. However, there are advances in trying to better integrate this knowledge into urban planning [30,31,32]. This concerns the integration, within studies of vulnerability to UHI effects, of parameters making it possible to identify the effects of urban form on UHIs to create a link between urban planning and exposure to urban overheating. Weber et al. [33] carried out an analysis of Philadelphia to propose a grid of reproducible indicators in the United States that can be integrated into urban planning. In France, urban planners are wondering the scale of their territory about strategies and mitigation measures to adopt to reduce urban overheating vulnerability. This is the case in the Ile-de-France region [34], which carried out a UHI vulnerability study based on Locale Climate Zone classification [35] and used cross-referencing with socio-economic data. The results of this work enabled stakeholders to define adaptation solutions and to integrate new tools into the urban planning practice. The French Environment Agency, ADEME, has also released a report of French territorial applications for urban overheating diagnostics [36]. This report enables local authorities to integrate this issue by proposing replicable methodologies according to the needs of the territory. These different studies and methodologies are promising and should be considered as a major asset for urban planning to help reduce UHI effects and determine vulnerable areas, in the context of global warming and urban densification. There is a need to integrate this issue into the urban planning process and urban projects [28,29,30,31,32]. In the long term, approaches for urban climate remain limited and have little impact, while there is a need to transfer knowledge from urban climatology into urban planning.
Based on several vulnerability studies of the effects of UHIs, this research attempts to develop a methodology for integrating urban climatology and urban planning for better consideration of UHI within urban environments in a French context. Our hypothesis is that the integration of urban planning rules into the calculation of UHI effects will provide decision makers with a vulnerability index that can be interpreted and utilized in the mitigation of UHI and maintaining the thermal comfort of urban dwellers. Actually, the use of the indicators derived from the regulations will provide planners with data which are adapted to their practices and on which they can act to reduce the effects of the UHI.
Accordingly, the objective of this work is to carry out a spatial mapping of UHI vulnerability at the territory level using urban planning policies, exposure to UHIs and sensitivity of populations to urban overheating. The combination of these three components permits us to identify the most vulnerable sectors of the territory which make the link between urban planning and knowledge of urban climatology.
To operate the articulation between climatology science and urban planning policies, the article proceeds in two stages. On the one hand, the components and their indicators are described, as well as their known behaviors on UHI vulnerability from the scientific literature. On the other hand, the calculation of the vulnerability is carried out from the superposition of all the indicators and components, leading to the generation of a global map of day and night vulnerability. We will be dealing with demonstrating that, from the location of vulnerable areas and knowledge of their characteristics, urban decision makers are owning the means to mitigate the effects of UHI within urban planning documents. Specifically, the analysis of the urban planning component will let them define appropriate adaptation solutions that can be integrated into urban planning plans and documents. This paper is organized into five sections. The first section analyzes the results of the existing research studies that begin to make a link between UHI vulnerability and urban planning policies. The second section presents the study area and materials. In this section, we expose our method development; whereas, the impact of each indicator on UHI is discussed according to the scientific literature review. The third section highlights the main results including an investigation of the regulatory characteristics of the different zones, land uses and urban planning documents. These results are then discussed in the fourth section which, also, outlines the different regulatory solutions that are proposed in order to mitigate urban heat island effects. The main conclusions and future work are addressed in the last section.
2. Materials and Methods
The study methodology consists of two stages. First, fifteen indicators are integrated as input data. Urban planning policies and the impacts of exposure and sensitivity to overheating are all considered, and their effects compiled to generate a UHI vulnerability map of the territory (Figure 1). The second step is to analyze and highlight vulnerable areas characteristics. Finally, the scientific literature, rich in solutions for mitigating UHI, enables us to develop recommendations for French urban planning.
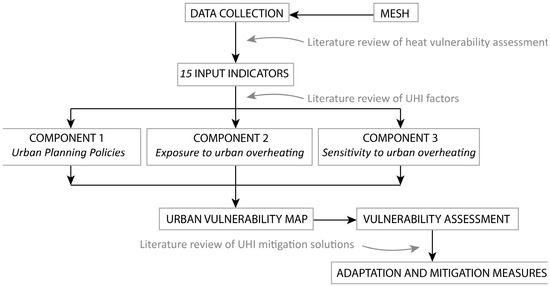
Figure 1.
Conceptual framework of UHI vulnerability assessment scheme.
2.1. Study Area
The territory of Montpellier Méditerranée metropolitan area is in the southeast of France; it is bordered by the Mediterranean Sea (Figure 2). With a land area of approximately 49,000 ha, it contains 31 municipalities which hosted 481,276 inhabitants in 2018 [37]. According to the Köppen–Geiger classification [38], the climate is typically Mediterranean with hot, dry summers, with a mean annual temperature of 20.9 °C in 2015 and soft winters with a mean annual temperature of 11.3 °C in 2015 [39].
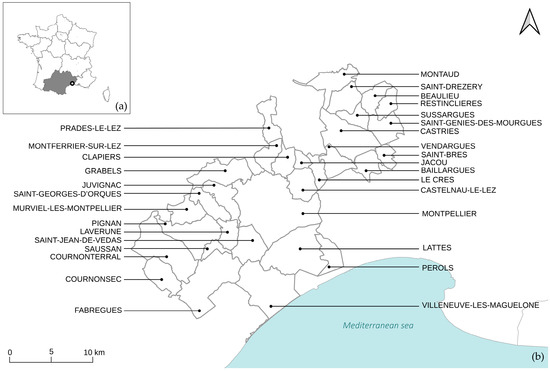
Figure 2.
(a) Location of Montpellier Méditerranée Metropolitan area in France; (b) 31 municipalities of Montpellier Méditerranée Metropolitan area.
This territory has experienced urban sprawl in recent years caused by its attractiveness, with an annual population growth of 1.85% from 2010 to 2015, i.e., nearly 8000 new inhabitants per year [33]. As a result, UHI affects urban areas of the territory, causing discomfort and health problems. Indeed, according to Météo France, in Figure 3 the annual mean temperature of the territory and number of heat waves day have been increasing for several decades [40]. This work focuses on an urban vulnerability assessment of the metropolitan area by using various urban indicators to elaborate urban planning measures.
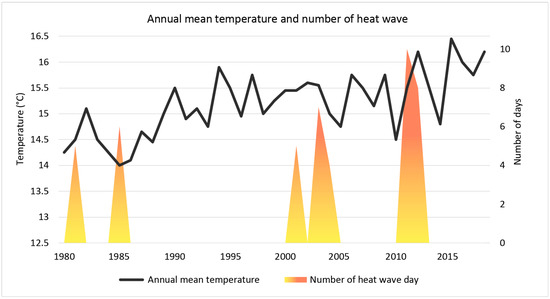
Figure 3.
Annual mean temperature and number of heat wave days (temperature 5 °C higher than normal for at least 5 consecutive days) from 1980 to 2018.
2.2. Data Acquisition
A geographic information system (GIS) is used as a data processing and generation tool (QGIS software, version 3.22). Its use in this work may allow later use of output data produced [41]. The data are acquired from the following climatic, urban, environmental, demographic and socio-economic databases. Table 1 summarizes the data sources and spatial resolution. Data relating to urban planning are taken from Local Urban Plans, which are urban planning documents operating at the municipal or inter-municipal scale. Urban planning regulations of each municipality in the Montpellier metropolitan area have been integrated into the GIS. Land surface temperatures were calculated from satellite observation data and remote sensing. Daytime data are derived from the LANDSAT-8 satellite image (22 July 2019) and the daytime land surface temperature is calculated using algorithms developed by Avdan and Jovanovska [42]. Nighttime data are acquired by the Advanced Space-Borne Thermal Emission and Reflection Radiometer (ASTER) satellite image (6 July 2015) and the nighttime land surface temperature is calculated thanks to the single-channel algorithm presented by Jimenez-Munoz and Sobrino [43]. Demographic and socio-economic data of the metropolis of Montpellier come from the National Institute of Statistics and Economic Studies (INSEE). These are census data collected in 2015 [44]. The data provided are represented by a mesh that can have a spatial resolution varying from 200 m to 1 km. Data relating to the categorization of land uses come from the open data of the Montpellier Mediterranean metropolis, which provides the public with updated territory data, and from aerial view interpretation (2019–2020). Characterization of building age was extracted from land files produced by CEREMA in 2020 [45].

Table 1.
Source, spatial resolution, years of collection and method to assign a value to The cells.
2.3. Identification of Areas Subject to Urban Heat Island Effect
From data obtained previously which constitute the input layers of each component, indicators of urban planning policies, exposure and sensitivity to the risks of urban overheating are developed. Collected data are unified, cut and divided in pixels of 200 m × 200 m size. Table 1 presents the processes that allow us to assign a value to each cell of the study area based on the various data collected upstream. The socio-economic indicators, namely population density, sensitive population and low-income households were available on INSEE database at 200 m spatial resolution. There was no adaptation of these data. For indicators with higher spatial resolution, a cell-based clipping was performed and the value (class) of the spatial entity representing the largest area was assigned to the entire cell. A class was assigned to a cell as soon as this class was predominant over the others. Land surface temperatures were calculated by averaging the land surface temperature of 30 m spatial resolutions of each entity contained in each cell. Finally, the urban regulation was assigned from the superposition of the zone where each rule applies with each cell. A rule value is assigned to the cell if it overlaps a zone with the same rule value.
This identification provides users with a simple but detailed cutting of a similar size to the district and block scale. Additionally, this mesh allows better representation of the results and subsequent analysis by urban decision makers. Due to the large number of indicators that enter the calculation of urban vulnerability, two methods are becoming widespread for assigning weights in a relevant way: explicit weights and statistical methods [24]. For this study, the method of explicit weights was used, assigning an equal weight to each of the components and indicators involved in the calculation of urban vulnerability. For this study, a statistical and sensitive analysis method for multivariate outputs-was used based on principal component analysis (PCA). A PCA-based approach is commonly applied in vulnerability studies because they allow correlated variables to be converted into uncorrelated variables and reduce the number of dimensions to be considered. The method implemented by Wolf et al. [46] for the development of a heat wave vulnerability index for London (UK) was applied [47]. It was also implemented by Alonso [48] in the calculation of socio-economic vulnerability to high heat in Lyon (France) and Tokyo (Japan).
A principal component analysis with Varimax rotation was performed. Thus, PCA allows to retain the three vulnerability’s components: urban planning policies, urban overheating exposure and urban overheating sensitivity, which are retained because their eigenvalues are greater than 1. The components are then weighted by the value of the variance calculated by the PCA. Each of the indicators included in the components is weighted by the value of correlation coefficient obtained by the Varimax rotation. This method was chosen because all the indicators do not have the same behavior on the vulnerability’s component. Finally, each component is integrated into the following equation (Equation (1)) to calculate the UHI vulnerability (V):
where P corresponds to urban planning policies; E is the urban overheating exposure and S is the urban overheating sensitivity.
V = 0.26 P + 0.39 E + 0.33 S
2.3.1. Component 1: Urban Planning Policies
Local Urban Plans are the urban planning documents which define territory development [49]. These documents are of capital importance because they determine urban morphology and aesthetics. By orientations taken during their elaboration, urban planning documents have an impact on socio-economic development but also on climatic behavior of territories. Local Urban Plans are made up of an urban planning regulation, which defines for each plot of the territory architectural, urban and landscape rules [50]. Plots are cadastral land located in the same municipality, subject to a set of urban regulation rules. Regulation defines the form and appearance of each construction on the plots. Consisting of 16 articles (Table 2), it is a document that can be opposed to any construction project or extension.
Table 2.
Articles of urban regulation of Local Urban Plan.
As part of this study, five articles of urban planning regulation are considered to define the challenges represented by urban planning policies (P) according to the following equation (Equation (2)):
where CES is the building footprint coefficient (%); Vg is the proportion of green and planted spaces (%); H is the building height (m); A corresponds to the installation of air conditioning systems and I represents the construction’s location to parcel boundaries.
P = 0.43CES + 0.64Vg + 0.54H + 0.20A + 0.20I
These indicators (Table 3) are known throughout the scientific literature to have impacts on the UHI intensification (Figure 4). On the one hand, the increase in planted spaces and vegetation within the urban environment has a positive impact because it leads to a decrease in urban temperatures. It is negatively correlated with the surface urban heat island (SUHI) [47]. Indeed, a 10% increase in green spaces leads to a reduction of 1 °C in land surface temperature [48] and a tree cover of at least 16% achieves a 1 °C drop in air temperature [49]. According to the literature, the lower the percentage of green/planted space, the higher the risk of overheating [51,52,53,54,55]. The proportion of planted space is described in Article 13 of the Local Urbanism Plan and is determined by a coefficient ranging from 0 to 1 for each plot, from the lowest proportion to the highest.
Table 3.
Urban planning policies indicators and values for each cell.
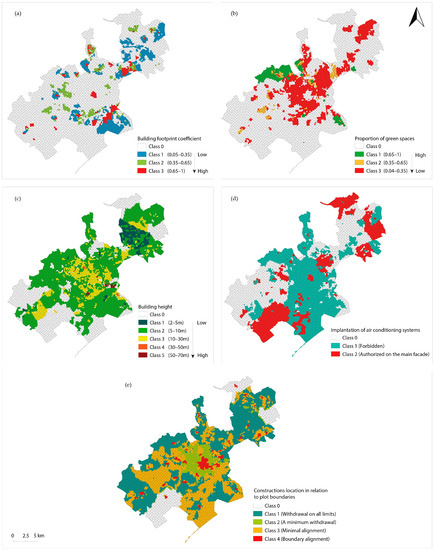
Figure 4.
(a) Building footprint coefficient; (b) proportion of green spaces; (c) building height; (d) implantation of air-conditioning systems; (e) construction’s location to plot boundaries.
On the other hand, the other indicators retained seem to have a negative impact on the intensification of the urban heat island. Thus, a study revealed that densely built environments, characterized by their high proportion of impermeable spaces, undergo greater urban overheating [56,57]. Indeed, it also concludes that the increase in built density and urban height lead to an intensification of UHI [58,59]. Within Local Urban Plans, the built area is described in Article 9 while the height of the constructions appears in Article 10 of the Local Urban Plans. Determined by a coefficient ranging from 0 to 1, the built area and the maximum height of constructions are indicators of urban density and disturb sunshine, shade and heat exchange. Similarly, the location of buildings on the plot also has a negative impact on urban heat islands by altering air circulation [60]. Indeed, the implantation can lead to a change in the speed, turbulence and direction of the winds, and, therefore, lead to the trapping of heat and increasing the UHI’s effects [61]. This indicator is defined in Articles 6 and 7 of the Local Urban Plans, which determines, concerning the location of the construction, either an alignment or a withdrawal from the parcel boundaries. Finally, the last indicator considered in this work accounts for the contribution of anthropogenic heat to the intensification of UHIs. An example of this is the installation of air conditioners on the buildings, resulting in cooling the interior and a generation of heat which heats the outside air and the unequipped surrounding buildings [62]. A study has shown that the urban temperature is 1 °C warmer near buildings equipped with air conditioners, thus increasing the effects of the UHI [63]. For this work, all the areas whose urban regulations, within Article 11, authorize the installation of air conditioners on the main facades are more likely to be vulnerable to urban overheating than those which are prohibited from installing them.
2.3.2. Component 2: Exposure to Urban Overheating
This component considers the exposure of the territory (E) to urban overheating. It is interested in characterizing the extent of the UHI phenomenon and the probabilities of aggravation of the phenomenon linked to the particularities of the territory. For this, more specifically, this work determines the SUHI, impacted by its topography, proximity to natural areas and the presence of population and activities according to the following equation (Equation (3)):
where T is the topography (m); D is the population density (number of people per cell); U corresponds to land uses; ΔT is the SUHI intensity (°C); Pg is the proximity to green areas and Pw, the proximity to water areas (m).
E = 0.22T + 0.79D + 0.83U + 0.73ΔT + 0.90Pg + 0.90Pw
Among the indicators selected to characterize exposure to UHI effects (Table 4), topography and proximity to natural areas show a positive impact by reducing UHI intensity (Figure 5). On the one hand, when the altitude increases, the air temperature decreases under the effects of changes in atmospheric pressure. It is estimated that the average air temperature decreases by 0.6 °C every 100 m of elevation [14]. The topography of the metropolitan area of Montpellier is obtained from the DTM (Digital Terrain Model) and is relatively flat, except for certain areas at the limits of the territory. It, therefore, appears that the impact of the topography on the temperature will be minimal on the majority of the study area, given that the 0–150 m class is largely in the majority.
Table 4.
Urban overheating exposure indicators and values for each cell.
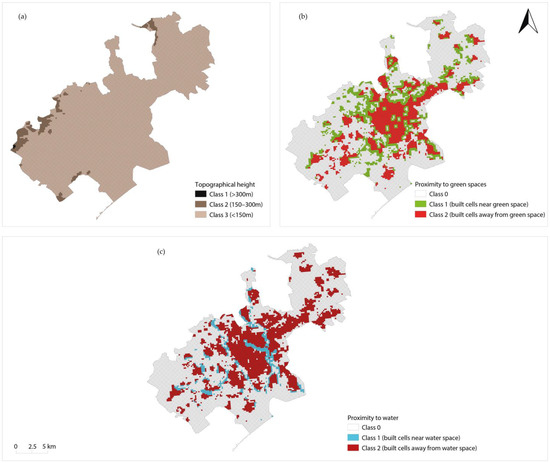
Figure 5.
(a) Topographical map; (b) proximity to green spaces; (c) proximity to water spaces.
On the other hand, it has been shown that proximity to natural spaces allows an air-cooling effect, thus reducing UHI intensity. It appears that green spaces allow, by providing shade, the reduction in the heating of materials [51], and by evapotranspiration, the cooling of the air, especially at night [64]. Similarly, water spaces, especially the larger ones, can absorb heat, cool the atmosphere and, thus, reduce overheating [65]. Like Yiannakou and Salata [66] concerning Park Cool Island’s effect, which defines an area within which the cooling effect of a natural space is perceived, the indicators selected represent the proximity of urban spaces to natural spaces. This is to highlight the proximity or distance of built cells to green or blue cells and the possibility of benefiting from their cooling effects. For green spaces, it is considered that beyond 300 m distance for spaces of more than 20 ha, the cooling effect no longer has an impact. Concerning the aquatic spaces, the metropolis is crossed by two major rivers, and is bordered by the Mediterranean Sea and by ponds, so beyond 200 m of distance with these spaces, the effects of freshness are no longer perceived. Cells far from these natural spaces are, therefore, likely to be less cooled and, furthermore, to suffer more from urban overheating.
The UHI phenomenon presents a temperature difference between the urban environment and the rural environment. It is a function of three types of phenomena: surface UHI, the canopy layer and the boundary layer [67,68]. Thus, the intensity of the surface urban heat island (ΔT) is a good indicator for studying the UHI phenomenon in a territory (Figure 6). Calculated from obtaining the ground surface temperatures (LST) for day and night [41,42]. For this work, it is the thermal gradient which is the difference at time t between average temperature of natural areas N listed in the Local Urban Plans and average temperatures recorded for each cell. Natural areas (N) considered characterize restricted or prohibited urbanization to protect the green areas of the territory. These are natural areas, as notified in urban planning documents, which circle urban areas. It excluded urban green spots whose cells are classified as urban or to be urbanized. The following equation (Equation (4)) was used to calculate the thermal gradient:
where T (cell n) is the average land surface temperature of cell n (°C) and T (N) is the average land surface temperature of natural areas (N) listed in urban planning regulations, which serves as a reference (°C).
ΔT (cell n) = T (cell n) − T (N)
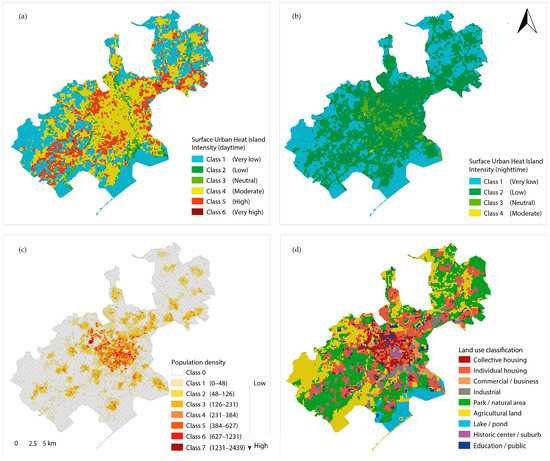
Figure 6.
(a) SUHI intensity (daytime); (b) SUHI intensity (nighttime); (c) population density; (d) land use classification.
One of the main causes of the UHI formation is the modification of the urban environment by human presence. Therefore, population density and land use are suitable indicators for studying UHIs (Figure 6). On the one hand, the more densely populated an area is, the higher the generation of anthropogenic heat is, which increases population exposure to urban overheating [24,25,26,27,28,29,34]. On the other hand, the uses of the ground influence the UHI, because of forms, density and energy consumption characteristics which are distinct and dependent on the moment of the day [14,69,70]. During the day, occupied uses such as employment areas will be more exposed because they generate heat, while at night, the most exposed uses will be more residential.
2.3.3. Component 3: Sensitivity to Urban Overheating
This component, which is systematically integrated into urban vulnerability studies, is particularly interested in humans and the constructions present on the territory. It allows us to analyze the fragility of populations, their habitat and their resources in coping with heat waves and urban overheating. It results from an analysis of indicators of sensitivity to the effects of climate change cited in the scientific literature [24,25,26,27,33,34] and the data available in the case of the metropolis of Montpellier. The sensitivity component (S) is calculated from the following equation (Equation (5)):
where PA is the proportion of sensitive populations by age (%); R is the proportion of low-income households (%); HC is the presence of health and care facilities and CA corresponds to average building age (year).
S = 0.66PA + 0.16R + 0.40HC + 0.73CA
The sensitivity indicators (Table 5 and Figure 7) used in this study have an impact on the increase in urban vulnerability to urban heat islands. Indeed, the proportion of fragile population, the presence of retirement and health establishments and household income are indicators of the presence of a population vulnerable due to their state of health, their age or their resources.
Table 5.
Urban overheating sensitivity indicators and values for each cell.
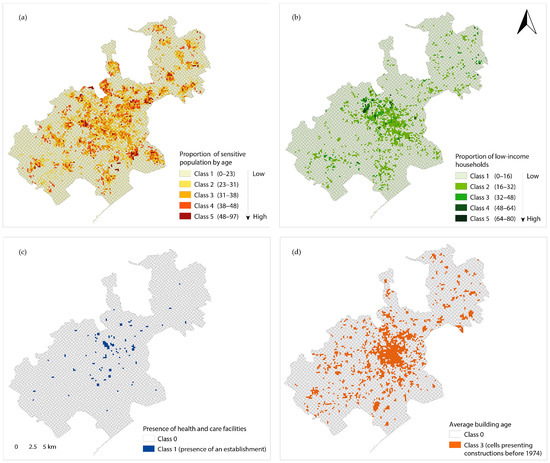
Figure 7.
(a) Proportion of sensitive population by age; (b) proportion of low-income households; (c) presence of health and care facilities; (d) building age.
On the one hand, the age of the population reflects the fragile persons that require more assistance and/or often find themselves isolated during heat waves [13,71]. It appears that the youngest and oldest populations show greater difficulty in regulating their metabolism to evacuate their body heat and, therefore, suffer more from the effects of urban overheating. The location of retirement homes and health establishments reflect the concentration of frail and elderly populations at one point. On the other hand, the economic income of the populations is considered because low economic resources impact their vulnerability by reducing their possibilities of adapting as well as possible to face urban overheating. Indeed, many studies have shown a difficulty in developing housing (ventilation, insulation) for the most economically fragile populations [26,72].
Finally, the age of buildings (Figure 7) is also included in the study because it can also exacerbate urban vulnerability to urban heat island effects. Indeed, the construction period of the buildings is an indicator of their potential discomfort. Indeed, in France, studies have revealed that buildings built before the first thermal regulations of 1974 are likely to have insulation problems making them thermal sieves [24,34]. This lack of insulation can lead to difficulties in adapting populations and to energy overconsumption linked to heating in winter and air conditioning in summer.
3. Results
This section may be divided by subheadings. It should provide a concise and precise description of the experimental results, their interpretation, as well as the experimental conclusions that can be drawn.
3.1. Vulnerability Assessment to UHI Effects
The vulnerability to UHI effects is analyzed with regards to the selected drivers set. These fifteen input parameters are related to urban planning policies, exposure and sensitivity to urban overheating. The final map of urban vulnerability to UHI effects is generated at the Montpellier metropolitan area scale based on a geographic cross-check of the different scores assigned to each cell. The daytime, nighttime and global vulnerability maps reflect the climatic issues and challenges facing the Montpellier metropolitan area (Figure 8). The analysis of the spatial variations of the vulnerability intensity during the day, at night and globally is carried out according to the number of cells, the associated surface area and the most affected areas of the territory.
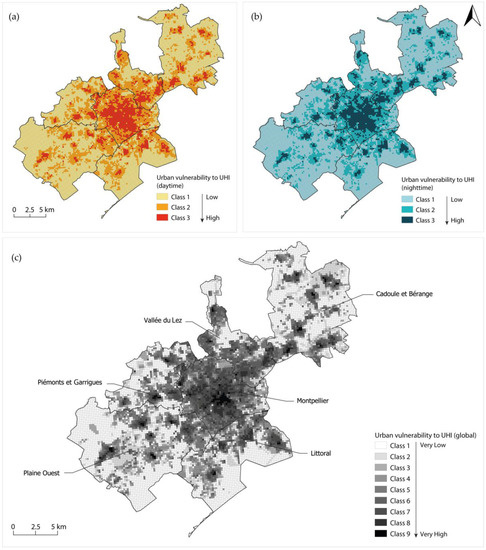
Figure 8.
(a) Map of daytime UHI vulnerability; (b) map of nighttime UHI vulnerability; (c) map of global UHI vulnerability.
During the day, the low-vulnerability class is dominant for half of the study area. In fact, it accounts for 57.9% of the total number of cells and 56.6% of the total cell surface area. The results also show that 42.1% of cells present a medium level of vulnerability and account for 43.4% of the cell surface area. Actually, this proportion corresponds to more than 4800 cells and 19,000 ha of the territory. Conversely, the proportion of high level of vulnerability does not exceed 12% of cells and 12.4% of surfaces, which corresponds to 1367 cells and 5456 ha of the study area compared to the high nighttime vulnerability surfaces which account for 11.9%. Such a difference is explained by the surface UHI which is derived based on land surface temperature that generates higher thermal gradients during the day. In addition to that, the zones of high daytime vulnerability are found to be more located around urban centers.
At night, the low-vulnerability class is also dominant. It represents 60.5% of the number of cells and 59.2% of the surface area. Actually, the number of cells affected by low vulnerability at night increased by 2.6% compared to the daytime ones. Therefore, the proportion of cells associated with medium-to-high vulnerability levels decreased compared to the daytime score. Both medium-to-high vulnerability levels together account for 39.5% of the number of cells and 40.8% of the surface area, which corresponds to 4500 cells and nearly 18,000 ha.
Globally, the same observation can be made. Very low-to-low vulnerability levels are dominant. They represent 59.1% of the cells and 57.8% of the total surface area. The surface affected by medium-to-very high vulnerability corresponds to 48.8% of the cells and 42.2% of the total surface area. Those levels concern 4700 cells and 18,500 ha.
The spatial patterns of the vulnerability intensity exhibit significant variations among sectors and between the city center and the surrounding suburban areas. The results show that 66.2% of the core of the metropolitan area is exposed to medium and high levels of vulnerability, with 67.5% during the day and 64.8% at night. Actually, 10,500 ha of the total surface area are affected by urban overheating during the day. In contrast, the first and second suburban sectors exhibit a lower level of vulnerability, probably due to lower density of buildings, higher vegetation coverage and abundant water bodies. In fact, 34.2% and 25.7% of these areas are, respectively, concerned by medium-to-high levels of vulnerability globally. Furthermore, Montpellier municipality is the most affected sector followed by “Vallée du Lez”. In fact, 87.5% of Montpellier municipality is vulnerable and 44.6% is exposed to a high level of vulnerability. The results indicate that 63% of the “Vallée du Lez” sector is exposed to medium and high levels of vulnerability, where 17% is affected by high-level intensity. The sectors “Cadoule et Bérange” and “Plaine Ouest” are the least affected areas with, respectively, 27.7% and 28.8% of their surface classified with medium-to-very high vulnerability levels. Particularly, their surface affected by high-to-very high vulnerability concerned, respectively, 5.8% and 4.7%.
3.2. Vulnerability Assessment Concerning “Urban Planning Policies” Component
3.2.1. Vulnerability Assessment of Global Component
The vulnerability intensity is assessed according to the level of urban planning challenges by quantifying the area of the associated surface. The results reveal that areas, which present the highest level of urban planning challenges, represent one third of the total cells affected by the highest vulnerability score. Actually, these areas account for 35.2% and 33.7% of the total surface affected by the highest daytime and nighttime vulnerability intensity, respectively. These areas, which amount to more than 3800 cells, cover 15,000 ha. Furthermore, areas with medium-to-high planning challenges characterized by a high level of vulnerability account for 12.1% of the total surface during the day, 11.6% at night and 11.8% globally. These affected surfaces correspond, respectively, to 5308 ha, 5109 ha and 5168 ha. Additionally, areas with medium-to-high planning challenges characterized by a medium level of vulnerability represent 23.2% of the surface during the day, 22% at night and 22.8 globally. Their total area reaches more than 10,000 ha. Moreover, areas with medium-to-high planning challenges represent 19.9% and 21.5% of the total zones concerned by low daytime and nighttime vulnerability, respectively. These areas cover more than 8700 ha during the day and 9400 ha at night.
3.2.2. Vulnerability Assessment of “Urban Planning Policies” Indicators
The results of the vulnerability assessment based on urban planning regulation indicators are presented in Figure 9. Cells with a medium-to-high building footprint coefficient refer to a footprint greater than or equal to 0.35 (classes 2 and 3). Actually, their area accounts for 9.18% of the metropolitan area of Montpellier. The results show that 96.6% of these affected cells show a medium–high vulnerability score, which corresponds to 4000 ha. In addition to that, 36.9% of these medium-to-high building footprint cells are found to be highly vulnerable during the day compared to 34.8% at night.
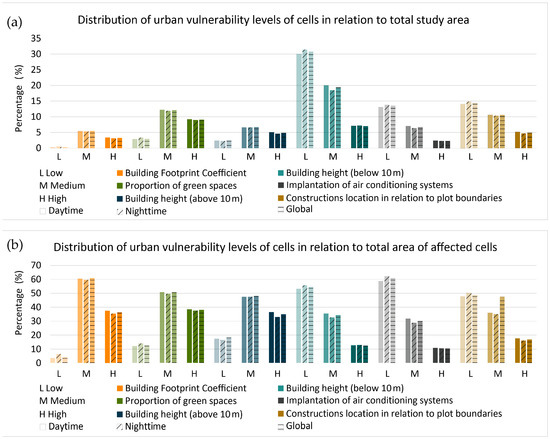
Figure 9.
(a) Distribution of urban vulnerability levels of cells affected by medium-to-high classes of “urban planning policies” indicators to total study area; (b) Distribution of urban vulnerability levels of cells affected by medium-to-high classes of “urban planning policies” indicators to the total area of affected cells.
Moreover, cells with low-to-medium percentage of planted space refer to a percentage less than or equal to 65% (classes 2 and 3). Actually, these areas account for 24.39% of the total surface of the territory. The results indicate that 88.1%, 85.9% and 87.60% of the affected cells have a medium-to-high vulnerability score during the day, at night and globally, respectively. In fact, 37.9% of these cells show a high score of vulnerability for the daytime compared to 37% for the nighttime.
Cells with a construction height of more than 10 m (classes 3, 4 and 5) represent 13.84% of the study area. However, cells associated with buildings less than 10 m in height (classes 1 and 2) account for 57.46% of the total area. In addition to that, cells concerned with high heights are more confronted with a medium-to-high level of vulnerability than cells concerned by low heights. Actually, these cells refer to 82.9% and 47.5% of the total affected cells, respectively. Such a difference is more pronounced when the analysis is based on the high level of vulnerability. In fact, the results indicate that cells with more than 10 m in height account for an average of 36% of the total affected cells compared to cells less than 10 m which represent 12.2%. Moreover, cells concerned by the minimum alignment restriction on one of the parcel boundaries (classes 3 and 4) constitute 35.99% of the total metropolitan area. An average of 51.4% of this proportion is affected by a medium-to-high level of vulnerability. Indeed, 16.5% of these cells face a high level of vulnerability, which represents 2200 ha. Additionally, cells concerned by the regulation which authorizes the installation of air conditioners on the main facade (class 2) account for 22.69% of the territory. The results show that 39.6% of these cells are affected by medium–high vulnerability, whereas 10.3% are exposed to high vulnerability.
3.3. Vulnerability Analysis of Local Urban Plans
3.3.1. Vulnerability Assessment of Urban Planning Zoning
The UHI vulnerability is analyzed according to the zoning of Local Urban Plans (Figure 10). Local Urban Plans are composed, as well as urban regulation, of urban zoning on which the regulation is applied. Zoning plans are cartographic documents representing a sectoral division of each territory [50]. They are composed of four types of zones which have specific land uses: urbanized zones (U); areas to be urbanized (AU); natural areas (N) and agricultural areas (A). Actually, U and AU zones account for 32% of the entire territory compared to A and N zones, which represent 67.3%. The results exhibit that 93.6% (daytime), 90.9% (nighttime) and 92.6% (global) of these zones, which refer to areas where urbanization is likely to occur, are affected by medium-to-high vulnerability. Their total area accounts for more than 3500 cells and 13,000 ha. However, 22.5%, 19.3% and 21% of medium-to-high vulnerability cells during daytime, nighttime and globally, respectively, are located in agricultural areas. Moreover, only 14.6% (daytime), 12.4% (nighttime) and 13.5% (global) of natural areas are affected by medium-to-high vulnerability levels. The total amount of these affected cells is 5200 ha during the day, 4400 ha at night and 4800 ha globally.
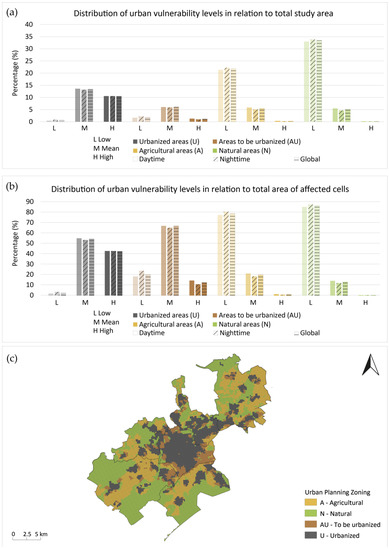
Figure 10.
(a) Distribution of urban vulnerability levels of urban planning zoning to total study area; (b) distribution of urban vulnerability levels of urban planning zoning to the total area of affected cells; (c) urban planning zoning of Montpellier Metropolitan area representing the 4 regulatory land uses.
3.3.2. Vulnerability Assessment of Authorized Land Use
The results of the vulnerability assessment according to land use type are shown in Figure 11. Actually, authorized land use within each zone is regulated by the Local Urban Plan through the two articles, 1 and 2 [50]. These articles define the type of permitted use: economic activities, housing, mixed zones, services and equipment, agricultural, natural, without construction or prohibited. The analysis of their vulnerability highlights that the areas that can accommodate housing (housing + mixed areas) amount approximately to 24% of the territory’s cells. The results indicate that 96.2% (daytime), 95.2% (nighttime) and 95.9% (global) of these areas are affected by medium-to-high vulnerability. Their total area accounts for more than 10,000 ha of the territory. Areas that can accommodate activities and employment represent 20.3% of the territory. Indeed, the results show that 93.9% (daytime), 90.3% (nighttime) and 92.4% (global) of these areas are affected by medium-to-high vulnerability, which corresponds to more than 8500 ha. In addition to that, Figure 11 shows that slight variation in medium and high vulnerability between daytime and nighttime is observed.
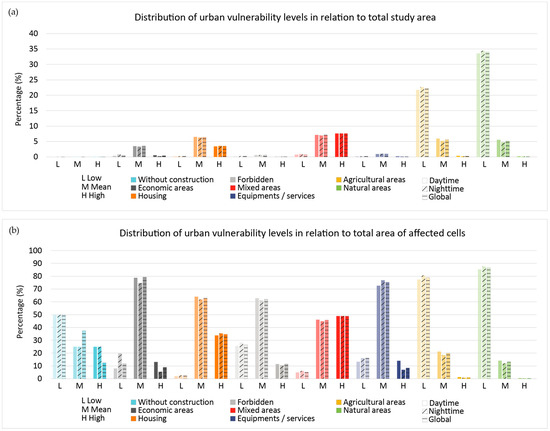
Figure 11.
(a) Distribution of urban vulnerability levels of authorized land use to total study area; (b) distribution of urban vulnerability levels of authorized land use to the total area of affected cells.
3.3.3. Vulnerability Assessment According to the Date of Approval of Local Urban Plans
The Local Urban Plan (PLU) must be approved before it can be adopted. In fact, it has to be subject to a local public enquiry after the preparation and consultation processes. The publication date refers to the date from which the Local Urban Plan document is applied. Once adopted, the PLU has a legal and binding force. The Local Urban Plans of Montpellier metropolitan area were approved from 2013 to 2020 (Figure 12). In fact, the majority of these 31 urban planning documents were approved in 2018 and 2019, with a rate of 6 and 7 documents per year, respectively. However, the approved documents in 2013 and 2019 covered the largest cumulative surface area which accounted for 41% of the total metropolitan area.
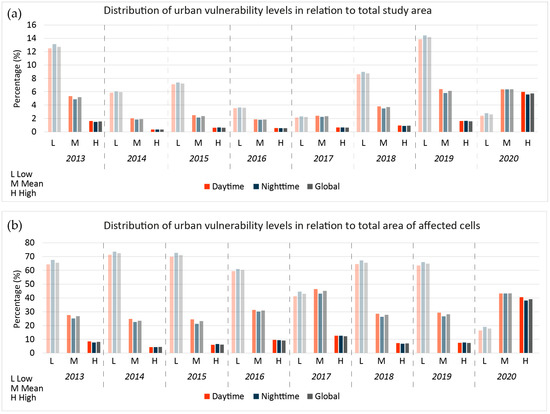
Figure 12.
(a) Distribution of urban vulnerability levels of the date of approval of Local Urban Plans to total study area; (b) distribution of urban vulnerability levels of the date of approval of Local Urban Plans to total area of affected cells.
The correlation between the vulnerability gradient and the different approval dates of the 31 urban planning documents is carried out. The results reveal that the territories, whose planning documents were approved in 2013, 2019 and 2020, are composed of approximately half of the cells affected by medium-to-high vulnerability with 48.7% (daytime), 46% (nighttime) and 47.4% (global).
Moreover, medium-to-high vulnerability, which is associated with the approved urban planning documents in 2017, accounted for 58.8% of the total affected cells during the day, 55.5% at night and 57.1% globally. In 2020, it reached more than 83.6% and 81.1%, respectively during the day and the night.
4. Discussion
4.1. Mitigation and Adaptation Measures
The results of the vulnerability analysis enable the localization and the quantification of the areas that are most vulnerable to UHI effects. Additionally, this research adopted an innovative approach which permits the integration of urban planning indicators in the analysis of climatic behavior. These indicators are derived from the regulation rules that are specifically used in the urban planning of Montpellier Metropolitan. Therefore, this study is the first known attempt of integrating urban planning in mapping and analyzing the vulnerability intensity and patterns at the Montpellier Metropolitan scale.
A set of 15 indicators is derived from regulatory, climatic, environmental and socio-economic databases. These input drivers are organized into urban planning policy, exposure and sensitivity to urban overheating components. These three components are combined in order to generate a map of urban vulnerability at the territory scale. The results indicate that areas most vulnerable to UHI have various characteristics which impact urban overheating in several ways. Actually, these affected areas present high urban planning challenges which consist of the planning regulations that impose few planted areas, most construction, a medium-to-large height (over 10 m), minimal alignment and planning permission for installing air conditioning on the main facade. These results are consistent with those of other published studies that deal with the impact of urban form parameters on UHI [4,5,6,7,53,54,55,58,59,62,63,66,73,74]. They permit us to define measures and to assist planners in drawing up urban planning documents. Therefore, a series of mitigation and adaptation solutions is suggested based on the findings of the current study and the literature which has grown over the past few years (Table 6).
Table 6.
Mitigation and adaptation solutions from French urban regulation.
4.1.1. Solutions to Increase Permeable and Natural Spaces
The literature review and the current study reveal that increasing permeable and natural spaces in vulnerable areas can mitigate the UHI phenomenon [15,16,17,18,19,20,21,66]. In fact, trees and green areas refresh urban air and improve its quality. In French urban planning, increasing the percentage of minimal planted spaces within urban planning regulations could bring more freshness in the summer heat. Additionally, green roofs and green facades are also beneficial for improving the thermal comfort during the day [62]. Accordingly, urban planners could focus on more authorization of this material within urban planning regulations. For instance, the ALUR law of 2014 encourages urban decision makers to set a biotope coefficient in urban planning regulation. The biotope coefficient consists of introducing or maintaining eco-friendly and non-waterproofed surfaces in the plot (floor, wall, roof, etc.) [50].
Moreover, the current study suggests that further research should study relationships between urban form, the coefficient of building footprint and the objectives of decision makers in terms of urban morphology and density. The implicit solution, which consists of going up in height, cannot be applied everywhere. Therefore, an optimal solution, which permits to restrict the building footprint while respecting the density and morphology objectives, must be found. This solution consists of developing a compromise between all the density parameters, including the height and the building footprint
4.1.2. Solutions to Improve Urban Ventilation and Heat Exchanges
The urban form characterizes all the elements that compose the urban environment, such as roads, plots, buildings and vacant spaces. The urban form has an impact on urban overheating because it affects the circulation of the winds, the trapping of heat and the creation of shading [73,74]. Open islands of controlled density (height, prospect, etc.) allow better ventilation and promote urban cooling [60,61]. Urban planners should focus on the regulation of the buildings’ height and the road width in order to optimize the wind circulation and the contribution of solar radiation. Moreover, it is known that increasing the albedo of materials is a cooling solution [15,16,17,18,19,20,21]. In fact, it permits to reduce the absorption of solar radiation from surfaces and, therefore, helps to fight against their heating [54]. However, this solution must be handled with care because of the risk of increasing energy consumption during winter in temperate climates or creating dazzling for pedestrians. Consequently, urban decision makers should impose materials with characteristics that cool the outdoor temperature without creating discomfort.
4.1.3. Solutions to Reduce Anthropogenic Heat Generation
This last solution is based on strategies that refer to the uses present in urban environment [19,20,21]. Actually, human activities are responsible for the heat generation, particularly through the use of air conditioning which contributes to the increase in outside temperatures [63]. Accordingly, one of the solutions that help reduce energy consumption consists of encouraging bioclimatic buildings by supporting construction projects. In addition to that, inhabitants should have the ability to create conditions for adapting to heat waves actively. The challenge in urban planning is to continue this effort by restricting the use of air conditioning in buildings.
4.2. Research Highlights and Limitations
This research reveals that areas mostly vulnerable are located within the sectors which are associated with the most urban planning challenges, and the most factors of exposure and sensitivity to urban overheating. These results are in accordance with several case studies carried out in France [26,34,36] and in other countries [24,25,27,33,75,76,77]. In fact, previous studies have demonstrated that the higher the concentration of factors, the higher the vulnerability and the damage caused by hazards [78].
This research demonstrates that integrating urban planning regulation in assessing vulnerability to overheating is promising to better control UHI impacts and climate change adaptation. The results will allow drawing the first solutions to fight against the main causes of a UHI: decrease in permeable and natural spaces, disruption of ventilation and radiative exchanges and overheating due to human activity. It may provide considerable support to policy makers, designers and city planners to address the urban heat issue for maintaining urban thermal comfort, especially in the French urban context. Actually, it provides them with practical solutions and measures to identify vulnerable areas, to prepare strategies and where to concentrate mitigation and adaptation actions. In addition to that, taking into consideration urban planning policies through the integration of regulatory indicators enables them to target the morphological and architectural characteristics of each specific urban zone. Thus, specific and adapted regulatory solutions can be proposed locally to limit the formation and exacerbation of UHI impacts in future urban planning documents.
The use of a GIS tool leads urban planners to perform geospatial data analysis, mapping and visualization of vulnerability and different indicators. Nevertheless, urban planners are still looking for suitable tools that can permit them to integrate knowledge from urban climatology in urban planning.
However, a number of limitations needs to be considered. First, a limitation of this study is that the number of the selected indicators was limited. Particularly, only five indicators are derived from the local urban planning policy. Secondly, the current investigation is limited by data availability. Actually, certain factors are not examined due to the lack of information, even though they have been already addressed in previous studies [33,34,79]. Therefore, the results suggest that future investigations on the UHI effect should consider the climatic and meteorological conditions. For example, further climatic data collection related to air temperatures or humidity parameters is required to exactly determine the exposure to UHI intensity. Thirdly, this work is limited by the fact that the calculation of the UHI vulnerability developed in his study uses a statistical approach by a principal component analysis to weight by the variance the impact of the various components. This approach has been applied many times in urban overheating studies and allows us to make the results more reliable. However, it can affect the importance of certain variables, which increase the UHI vulnerability as the SUHI intensity is characterized by the thermal gradient. Consequently, a search will have to be undertaken in order to answer the questions concerned with the weight attributed to all indicators. Future developments should compare vulnerability maps from several calculation methods (equal explicit weighting, weighting by several groups of experts, etc.). Finally, the most important limitation lies in the division of the study area. The cells that represent the basic unit of this work measure 200 m × 200 m, and by their size do not allow the integration of phenomena occurring at the microclimatic scale in the vulnerability analysis. Indeed, phenomena such as cool areas offered by natural spaces of small sizes in urban sectors are not taken into account precisely. Therefore, future developments of this work could improve the spatial resolution by the use of a finer division of the territory and the integration of more precise indicators.
Despite the limitations described above, this research has several positive aspects. In fact, this work is one of the few studies that is interested in characterizing UHI vulnerability and its connection with urban planning regulation in France. This research, which will serve as a base for future studies, has several practical applications. The methods used for the vulnerability analysis may be applied to other cities elsewhere in France, as well as in the world. In fact, the application of the current research methodology to other French territories, which are controlled by Local Urban Plan, is possible thanks to the integration of data from national public databases (IGN, INSEE, etc.) and urban planning documents. Indeed, one of the key strengths of this study is its use of remote sensing and geographic information systems which are commonly used in urban planning [41]. In addition to that, the spatial distribution of vulnerability could be improved by increasing the number and nature of input data.
5. Conclusions
The purpose of this study is to contribute to the existing knowledge and practices that attempt to cope with the problem of increasing urban heat vulnerability of cities. By selecting the Mediterranean city of Montpellier as the case study of the French urban planning context, this research aims to develop a methodology for assessing UHI vulnerability based on the integration of urban planning policy. Actually, the vulnerability index is developed by including various variables and input data related to urban planning regulation, exposure and sensitivity to urban overheating based on an extensive review of the existing literature. Fifteen indicators are weighted by a statistical approach and combined to calculate the global map of UHI vulnerability, which is ranked from very low to very high intensity levels. Indeed, regulation articles from the Local Urban Plans of Montpellier metropolitan area are integrated.
The analysis of the spatial patterns of the vulnerability intensity reveals that the most vulnerable zones are located close to the urban centers of the metropolitan area. In fact, the amount of these zones accounts for 42.2% of the total surface area of the territory. The results also indicate that these affected zones are mainly composed of residential and employment areas. In addition to that, approximately 34.6% of the most vulnerable areas present a medium-to-high level of urban planning challenges. They are also associated to high footprint coefficient, low planted space, alignments at the limits and authorization of installing air conditioning.
At the same time, this research reveals many questions in need of further investigation. In fact, a comprehensive analysis should be conducted by considering more input data associated with LULC databases, transportation, climate and socio-economic dimensions. However, the availability and spatial resolution of data, especially climatic, social vulnerability and economic information at the whole territory level, are often a serious constraint. Additionally, more data from urban regulations could also be incorporated. For example, regulation articles that refer to approved or alternative building materials, which vary in terms of energy efficiency and environmental impact, could be considered.
Author Contributions
Conceptualization, M.T., H.A.H. and R.A.; methodology, M.T., H.A.H. and R.A.; software, M.T.; validation, M.T., H.A.H. and R.A.; formal analysis, M.T.; investigation, M.T.; resources, M.T. and R.A.; data curation, M.T.; writing—original draft preparation, M.T.; writing—review and editing, H.A.H. and R.A.; visualization, M.T.; supervision, H.A.H. and R.A. All authors have read and agreed to the published version of the manuscript.
Funding
This research was supported by ADEME, the Ecological Transition Agency and the French Ministry of Culture.
Institutional Review Board Statement
Not applicable.
Informed Consent Statement
Not applicable.
Data Availability Statement
Publicly available datasets were analyzed in this study. This data can be found here: https://data.montpellier3m.fr/; https://www.insee.fr; https://datafoncier.cerema.fr; https://www.usgs.gov; https://search.earthdata.nasa.gov and Local Urban Plans on request from the municipalities of Montpellier metropolitan area.
Acknowledgments
The authors gratefully acknowledge the support provided by the funders of this research which has enabled and encouraged the production of this article and thank the anonymous reviewers for their helpful suggestions.
Conflicts of Interest
The authors declare no conflict of interest.
References
- Lowry, W.P. Empirical Estimation of Urban Effects on Climate: A Problem Analysis. J. Appl. Meteorol. Climatol. 1977, 16, 129–135. [Google Scholar] [CrossRef]
- Oke, T.R. The energetic basis of the urban heat island. Q. J. R. Meteorol. Soc. 1982, 108, 1–24. [Google Scholar] [CrossRef]
- Howard, L. The Climate of London, Volume 1: Deduced from Meteorological Observations; Cambridge University Press, Reissue édition: Cambridge, UK, 2012; 376p. [Google Scholar]
- Yin, C.; Yuan, M.; Lu, Y.; Huang, Y.; Liu, Y. Effects of urban form on the urban heat island effect based on spatial regression model. Sci. Total Environ. 2018, 2018, 696–704. [Google Scholar] [CrossRef] [PubMed]
- Lin, P.; Lau, S.S.Y.; Qin, S.; Gou, Z. Effects of urban planning indicators on urban heat island: A case study of pocket parks in high-rise high-density environment. Landsc. Urban Plan. 2017, 2017, 48–60. [Google Scholar] [CrossRef]
- Liao, W.; Hong, T.; Heo, Y. The effect of spatial heterogeneity in urban morphology on surface urban heat islands. Energy Build. 2021, 244, 111027. [Google Scholar] [CrossRef]
- Tan, Z.; Lau, K.K.L.; Ng, E. Urban tree design approaches for mitigating daytime urban heat island effects in a high-density urban environment. Energy Build. 2016, 114, 265–274. [Google Scholar] [CrossRef]
- Jandaghian, Z.; Akbari, H. Increasing urban albedo to reduce heat-related mortality in Toronto and Montreal, Canada. Energy Build. 2021, 2037, 110697. [Google Scholar] [CrossRef]
- Shahmohamadi, P.; Che-Ani, A.I.; Maulud, K.N.A.; Tawil, N.M.; Abdullah, N.A.G. The Impact of Anthropogenic Heat on Formation of Urban Heat Island and Energy Consumption Balance. Urban Stud. Res. 2011, 2011, 9. [Google Scholar] [CrossRef]
- Santamouris, M. Recent progress on urban overheating and heat island research. Integrated assessment of the energy, environmental, vulnerability and health impact. Synergies with the global climate change. Energy Build. 2020, 207, 109482. [Google Scholar] [CrossRef]
- Santamouris, M. Innovating to Zero the Building Sector in Europe: Minimising the Energy Consumption, Eradication of the Energy Poverty and Mitigating the Local Climate Change. Sol. Energy 2016, 128, 61–94. [Google Scholar] [CrossRef]
- Buchin, O.; Hoelscher, M.T.; Meier, F.; Nehls, T.; Ziegler, F. Evaluation of the health-risk reduction potential of countermeasures to urban heat islands. Energy Build. 2016, 114, 27–37. [Google Scholar] [CrossRef]
- Fouillet, A.; Rey, G.; Laurent, F.; Pavillon, G.; Bellec, S.; Guihenneuc-Jouyaux, C.; Clavel, J.; Jougla, E.; Hémon, D. Excess Mortality Related to the August 2003 Heat Wave in France. Int. Arch. Occup. Environ. Health 2006, 80, 16–24. [Google Scholar] [CrossRef] [PubMed]
- Ren, C.; Lau, K.L.; Yiu, K.P.; Ng, E. The Application of Urban Climatic Mapping to the Urban Planning of High-Density Cities: The Case of Kaohsiung, Taiwan. Cities 2013, 31, 16. [Google Scholar] [CrossRef]
- Rosenfeld, A.H.; Akbari, H.; Bretz, S.; Beth, L.F.; Kurn, D.M.; Sailor, D.; Taha, H. Mitigation of urban heat island: Material, utility, programs, updates. Energy Build. 1995, 22, 255–265. [Google Scholar] [CrossRef]
- Tsoka, S.; Tsikaloudaki, K.; Theodosiou, T.; Bikas, D. Urban warming and cities’ microclimates: Investigation methods and mitigation strategies—A review. Energies 2020, 13, 25. [Google Scholar] [CrossRef]
- Szalińska, W.; Otop, I.; Tokarczyk, T. Local Urban Risk Assessment of Dry and Hot Hazards for Planning Mitigation Measures. Clim. Risk Manag. 2021, 34, 100371. [Google Scholar] [CrossRef]
- Hulley, M.E. The Urban Heat Island Effect: Causes and Potential Solutions. In Metropolitan Sustainability; Zeman, F., Ed.; Woodhead Publishing Series in Energy: Sawston, UK, 2012; pp. 79–98. [Google Scholar]
- Akbari, H.; Kolokotsa, D. Three decades of urban heat island and mitigation technologies research. Energy Build. 2016, 133, 834–842. [Google Scholar] [CrossRef]
- Santamouris, M.; Ding, M.L.; Fiorito, F.; Oldfield, P.; Osmond, P.; Paolini, R.; Prasad, D.; Synnefa, A. Passive and Active Cooling for the Outdoor Built Environment—Analysis and Assessment of the Cooling Potential of Mitigation Technologies Using Performance Data from 220 Large Scale Projects. Sol. Energy Sol. Therm. Heat. Cool. 2017, 154, 14–33. [Google Scholar] [CrossRef]
- Bernard, J.; Musy, M.; Marie, H. Rafraîchissement des Villes: Solutions Existantes et Pistes de Recherche; Éditions Paranthèses: Marseille, France, 2020; p. 16. [Google Scholar]
- Gonzalez-Trevizo, M.E.; Martinez-Torres, K.E.; Armendariz-Lopez, J.F.; Santamouris, M.; Bojorquez-Morales, G.; Luna-Leon, A. Research Trends on Environmental, Energy and Vulnerability Impacts of Urban Heat Islands: An Overview. Energy Build. 2021, 246, 111051. [Google Scholar] [CrossRef]
- Turner, B.L., II; Kasperson, R.; Matson, P.; Mccarthy, J.; Corell, R.; Christensen, L.; Selin, N.; Kasperson, J.; Luers, A.; Martello, M.; et al. A framework for vulnerability analysis in sustainability science. Proc. Natl. Acad. Sci. USA 2003, 100, 8074–8079. [Google Scholar] [CrossRef]
- Cheng, W.; Li, D.; Liu, Z.; Brown, R.D. Approaches for Identifying Heat-Vulnerable Populations and Locations: A Systematic Review. Sci. Total Environ. 2021, 799, 149417. [Google Scholar] [CrossRef] [PubMed]
- Apreda, C.; D’Ambrosio, V.; Di Martino, F. A Climate Vulnerability and Impact Assessment Model for Complex Urban Systems. Environ. Sci. Policy 2019, 93, 11–26. [Google Scholar] [CrossRef]
- Alonso, L.; Renard, F. A Comparative Study of the Physiological and Socio-Economic Vulnerabilities to Heat Waves of the Population of the Metropolis of Lyon (France) in a Climate Change Context. Int. J. Environ. Res. Public Health 2020, 17, 1004. [Google Scholar] [CrossRef] [PubMed]
- Sabrin, S.; Karimi, M.; Golam Rabbani, F.; Nazari, R. Quantifying Environmental and Social Vulnerability: Role of Urban Heat Island and Air Quality, a Case Study of Camden, NJ. Urban Clim. 2020, 34, 100699. [Google Scholar] [CrossRef]
- Mills, G. Progress toward sustainable settlements: A role for urban climatology. Theor. Appl. Climatol. 2006, 84, 69–76. [Google Scholar]
- Ng, E.; Ren, C. The Urban Climatic Map for Sustainable Urban Planning; Routldege by Taylor & Francis Group: Oxon, ON, USA, 2015; p. 543. [Google Scholar]
- Hurlimann, A.; Moosavi, S.; Browne, G. Urban Planning Policy Must Do More to Integrate Climate Change Adaptation and Mitigation Actions. Land Use Policy 2020, 2020, 105188. [Google Scholar] [CrossRef]
- Bitan, A. The methodology of applied climatology in planning and building. Energy Build. 1988, 11, 110935. [Google Scholar] [CrossRef]
- IPCC. Climate Change 2014: Impacts, Adaptation and Vulnerability. Part B: Regional Aspects; Contribution of Working Group II to the Fifth Assessment Report of the Intergovernmental Panel on Climate Change; Cambridge University Press: Cambridge, UK, 2014; p. 688. [Google Scholar]
- Weber, S.; Sadoff, N.; Zell, E.; de Sherbinin, A. Policy-Relevant Indicators for Mapping the Vulnerability of Urban Populations to Extreme Heat Events: A Case Study of Philadelphia. Appl. Geogr. 2015, 63, 231–243. [Google Scholar] [CrossRef]
- IAU Ile-de-France. Adapter l’Ile de France à la Chaleur Urbaine: Identifier les Zones à Effet D’îlot de Chaleur Urbain (ICU) et Etablir Leur Degré de Vulnérabilité Afin de Mieux Anticiper; IAU Ile-de-France: Paris, France, 2017; p. 155. [Google Scholar]
- Stewart, I.D.; Oke, T.R. Local Climate Zones for Urban Temperature Studies. Bull. Am. Meteorol. Soc. 2012, 93, 1879–1900. [Google Scholar] [CrossRef]
- ADEME. Diagnostic de la Surchauffe Urbaine—Méthodes et Applications Territoriales; ADEME: Angers, France, 2017; p. 64. [Google Scholar]
- INSEE. Populations Légales 2018—Recensement de la Population—Regions, Départements, Arrondissements, Cantons et Communes; INSEE: Paris, France, 2018. [Google Scholar]
- Peel, M.C.; Finlayson, B.L.; McMahon, T.A. Updated World Map of the Köppen-Geiger Climate Classification. Hydrol. Earth Syst. Sci. 2007, 11, 1633–1644. [Google Scholar] [CrossRef]
- Audric, S.; Canonero, B.; Tasqué, O. Montpellier Méditerranée Métropole: Diagnostic de Territoire; INSEE: Paris, France, 2016. [Google Scholar]
- Montpellier Méditerranée Métropole. Plan Climat Air Énergie Territorial—Diagnostic Énergie-Climat Territorial; Montpellier Méditerranée Métropole: Montpellier, France, 2020; p. 136. [Google Scholar]
- Mineau, D. L’apport des SIG en urbanisme (The contribution of GIS to town planning). Bull. De L’assoc. De Géogr. Fr. 2003, 80, 443–453. [Google Scholar] [CrossRef]
- Avdan, U.; Jovanovska, G. Algorithm for Automated Mapping of Land Surface Temperature using LANDSAT 8 Satellite Data. J. Sens. 2016, 2016, 1–8. [Google Scholar] [CrossRef]
- Jimenez-Munoz, J.C.; Sobrino, J.A. A Single-Channel Algorithm for Land-Surface Temperature Retrieval from ASTER Data. Geosci. Remote Sens. Lett. 2010, 7, 176–179. [Google Scholar] [CrossRef]
- INSEE. Documentation—Données Carroyées FILOSOFI 2015; INSEE: Paris, France, 2019; p. 19. [Google Scholar]
- Cerema Données Foncières Retraitées par le Cerema—DGALN DGFIP. 2020. Available online: https://datafoncier.cerema.fr/donnees/fichiers-fonciers (accessed on 9 January 2023).
- Wolf, T. Integrated Assessment of Vulnerability to Heat Stress in Urban Areas. Ph.D. Thesis, King’s College London, London, UK, 2009; p. 298. [Google Scholar]
- Wolf, T.; McGregor, G. The development of a heat wave vulnerability index for London, United Kingdom. Weather Clim. Extrem. 2013, 1, 59–68. [Google Scholar] [CrossRef]
- Alonso, L. Intérêt de la Modélisation de la Température de l’air Associé à la Nécessité de la Caractérisation des Vulnérabilités Territoriales pour une Compréhension Systémique du Risque aux Fortes Chaleurs en Milieu Urbain sur Lyon et Tokyo. Ph.D. Thesis, Jean Moulin Lyon III University, Lyon, France, 2021; p. 384. [Google Scholar]
- Ministère de la Cohésion des Territoires. PLUI-Un Outil pour L’avenir des Territoires Guide; Ministère de la Cohésion des Territoires: La Défense, France, 2017; p. 4. [Google Scholar]
- GRIDAUH. Ecriture du PLU, Le Règlement, Caractéristiques Urbaine, Architecturale, Environnementale Paysagère—Fiche 2.1.3.2. GRIDAUH. 2018. Available online: https://www.gridauh.fr/fr/node/13446 (accessed on 25 November 2022).
- Suzán-Azpiri, Humberto. The role of urban vegetation in temperature and heat island effects in Querétaro city, Mexico. Atmosfera 2015, 28, 205–215. [Google Scholar] [CrossRef]
- Li, H.; Harvey, J.T.; Holland, T.J.; Kayhanian, M. The Use of Reflective and Permeable Pavements as a Potential Practice for Heat Island Mitigation and Stormwater Management. Environ. Res. Lett. 2013, 8, 15023. [Google Scholar] [CrossRef]
- Marando, F.H.M.P.; Zulian, G.; Udías, A.; Mentaschi, L. Chrysoulakis, N.; Parastatidis, D.; Maes, J. Urban Heat Island Mitigation by Green Infrastructure in European Functional Urban Areas. Sustain. Cities Soc. 2022, 77, 103564. [Google Scholar] [CrossRef]
- De Abreu-Harbich, L.V.; Labaki, L.C.; Matzarakis, A. Effect of Tree Planting Design and Tree Species on Human Thermal Comfort in the Tropics. Landsc. Urban Plan. 2015, 138, 99–109. [Google Scholar] [CrossRef]
- Dimoudi, A.; Nikolopoulou, M. Vegetation in the Urban Environment: Microclimatic Analysis and Benefits. Energy Build. Spec. Issue Urban Res. 2003, 35, 69–76. [Google Scholar] [CrossRef]
- Escourrou, G. Le Climat et la Ville; Nathan University Editions: Paris, France, 1991. [Google Scholar]
- Arnfield, A.J. Two Decades of Urban Climate Research: A Review of Turbulence, Exchanges of Energy and Water, and the Urban Heat Island. Int. J. Climatol. 2003, 23, 26. [Google Scholar] [CrossRef]
- Li, Y.; Schubert, S.; Kropp, J.P.; Rybski, D. On the Influence of Density and Morphology on the Urban Heat Island Intensity. Nat. Commun. 2020, 11, 2647. [Google Scholar] [CrossRef] [PubMed]
- Goncalves, J.; Umakoshi, E.M. The Environmental Performance of Tall Buildings, 1st ed.; Routldege: London, UK, 2010; pp. 1–368. [Google Scholar]
- Nakamura, Y.; Oke, T.R. Wind, Temperature and Stability Conditions in an East-West Oriented Urban Canyon. Atmos. Environ. 1988, 22, 2691–2700. [Google Scholar] [CrossRef]
- Athamena, K.; Musy, M.; Bouyer, J. Proposal of indicators dedicated to the analysis of contribution of urban projects to urban Heat Island. In Proceedings of the PLEA26—26th Conference on Passive and Low Energy Architecture, Quebec, QC, Canada, 22–24 June 2009; pp. 1–6. [Google Scholar]
- De Munck, C. Modélisation de la Végétation Urbaine et des Stratégies D’adaptation au Changement Climatique pour L’amélioration du Confort Climatique et de la Demande Energétique en Ville. Ph.D. Thesis, Atmosphere and Continental Surface, Toulouse University, Toulouse, France, 2013; p. 119. [Google Scholar]
- Salamanca, F.; Georgescu, M.; Mahalov, A.; Moustaoui, M.; Wang, M. Anthropogenic Heating of the Urban Environment Due to Air Conditioning. J. Geophys. Res. Atmos. 2014, 119, 5949–5965. [Google Scholar] [CrossRef]
- Doick, K.J.; Peace, A.; Hutchings, T.R. The Role of One Large Greenspace in Mitigating London’s Nocturnal Urban Heat Island. Sci. Total Environ. 2014, 493, 662–667. [Google Scholar] [CrossRef] [PubMed]
- Revaud, C.E.; Bernard, J.; Touili, K.; Salomon, A.; Gantois, M.; Musy, M.; Inard, C. Thermoregulatory effect of green spaces and wetlands in Paris. In Proceedings of the ICUC9—9th International Conference on Urban Climate Jointly with 12th Symposium on the Urban Environment, Toulouse, France, 20–24 July 2015; pp. 1–6. [Google Scholar]
- Yiannakou, A.; Salata, K.-D. Adaptation to climate change through spatial planning in compact urban areas: A case study in the city of Thessaloniki. Sustainability 2017, 9, 18. [Google Scholar] [CrossRef]
- Bahi, H.; Mastouri, H.; Radoine, R. Review of Methods for Retrieving Urban Heat Islands. Mater. Today Proc. 2020, 27, 3004–3009. [Google Scholar] [CrossRef]
- Veena, K.; Parammasivam, K.M.; Venkatesh, T.N. Urban heat island studies: Current status in india and comparison with the international studies. J. Earth Syst. Sci. 2020, 129, 15. [Google Scholar] [CrossRef]
- Zhang, H.; Li, T.T.; Han, J.J. Quantifying the Relationship between Land Use Features and Intra-Surface Urban Heat Island Effect: Study on Downtown Shanghai. Appl. Geogr. 2020, 125, 102305. [Google Scholar] [CrossRef]
- Giridharan, R.; Ganesan, S.; Lau, S.S.Y. Daytime urban heat island effect in high-rise and high-density residential developments in Hong Kong. Energy Build. 2004, 36, 525–534. [Google Scholar] [CrossRef]
- Li, M.; Gu, S.; Bi, P.; Yang, J.; Liu, Q. Heat Waves and Morbidity: Current Knowledge and Further Direction—A Comprehensive Literature Review. Int. J. Environ. Res. Public Health 2015, 12, 5256–5283. [Google Scholar] [CrossRef]
- Alizadeh, M.R.; Abatzoglou, J.T.; Adamowski, J.F.; Prestemon, J.P.; Chittoori, B.; Asanjan, A.A.; Sadegh, M. Increasing Heat-Stress Inequality in a Warming Climate. Earth Future 2022, 10, 11. [Google Scholar] [CrossRef]
- Agathangelidis, I.; Cartalis, C.; Santamouris, M. Integrating Urban Form, Function, and Energy Fluxes in a Heat Exposure Indicator in View of Intra-Urban Heat Island Assessment and Climate Change Adaptation. Climate 2019, 7, 75. [Google Scholar] [CrossRef]
- Erdem, U.; Cubukcu, K.M.; Sharifi, A. An Analysis of Urban Form Factors Driving Urban Heat Island: The Case of Izmir. Environ. Dev. Sustain. 2021, 23, 7835–7859. [Google Scholar] [CrossRef]
- Sabrin, S.; Karimi, M.; Nazari, R. Developing Vulnerability Index to Quantify Urban Heat Islands Effects Coupled with Air Pollution: A Case Study of Camden, NJ. ISPRS Int. J. Geo. Inf. 2020, 9, 349. [Google Scholar] [CrossRef]
- Leal Filho, W.; Echevarria Icaza, L.; Neht, A.; Klavins, M.; Morgan, E.A. Coping with the Impacts of Urban Heat Islands. A Literature Based Study on Understanding Urban Heat Vulnerability and the Need for Resilience in Cities in a Global Climate 927 Change Context. J. Clean. Prod. 2018, 171, 1140–1149. [Google Scholar] [CrossRef]
- Bhattacharjee, S.; Gerasimova, E.; Imbert, C.; Tencar, J.; Rotondo, F. Assessment of Different Methodologies for Mapping Urban Heat Vulnerability for Milan, Italy. IOP Conf. Ser. Earth Environ. Sci. 2019, 290, 012162. [Google Scholar] [CrossRef]
- Yang, H. Geomatics, natural hazards and risk: Spatial assessment of urban heatwave vulnerability of coupling adaptability based on BPNN model: A case study of Xiamen City, China. Geomat. Nat. Hazards Risk 2021, 12, 2654–2675. [Google Scholar] [CrossRef]
- Sandholz, S.; Sett, D.; Greco, A.; Wannewitz, M.; Garschagen, M. Rethinking Urban Heat Stress: Assessing Risk and Adaptation Options across Socioeconomic Groups in Bonn, Germany. Urban Clim. 2021, 37, 100857. [Google Scholar] [CrossRef]


Disclaimer/Publisher’s Note: The statements, opinions and data contained in all publications are solely those of the individual author(s) and contributor(s) and not of MDPI and/or the editor(s). MDPI and/or the editor(s) disclaim responsibility for any injury to people or property resulting from any ideas, methods, instructions or products referred to in the content. |
© 2023 by the authors. Licensee MDPI, Basel, Switzerland. This article is an open access article distributed under the terms and conditions of the Creative Commons Attribution (CC BY) license (https://creativecommons.org/licenses/by/4.0/).