Article

An Integrated Decision-Making Framework for Mitigating the Impact of Urban Heat Islands on Energy Consumption and Thermal Comfort of Residential Buildings

by
Cihan Turhan
1,
Ali Serdar Atalay
2 and
Gulden Gokcen Akkurt
3,*
1
Department of Energy Systems Engineering, Faculty of Engineering, Atılım University, 06830 Ankara, Türkiye
2
BitNet Corporation, 34782 Istanbul, Türkiye
3
Department of Energy Systems Engineering, Faculty of Engineering, Izmir Institute of Technology, 35430 Izmir, Türkiye
*
Author to whom correspondence should be addressed.
Sustainability 2023, 15(12), 9674; https://doi.org/10.3390/su15129674
Submission received: 8 May 2023 / Revised: 2 June 2023 / Accepted: 12 June 2023 / Published: 16 June 2023

Abstract

:
Urban heat island (UHI) is a zone that is significantly warmer than its surrounding rural zones as a result of human activities and rapid and dense urbanization. Excessive air temperature due to the UHI phenomenon affects the energy performance of buildings and human health and contributes to global warming. Knowing that most of the building energy is consumed by residential buildings, therefore, developing a framework to mitigate the impact of the UHI on residential building energy performance is vital. This study develops an integrated framework that combines hybrid micro-climate and building energy performance simulations and multi-criteria decision-making techniques. As a case study, an urban area is analyzed under the Urban GreenUP project funded by the European Union’s Horizon 2020 Programme. Four different strategies to mitigate the UHI effect, including the current situation, changing the low-albedo materials with high-albedo ones, nature-based solutions, and changing building façade materials, are investigated with a micro-climatic simulation tool. Then, the output of the strategies, which is potential air temperature, is used in a dynamic building energy simulation software to obtain energy consumption and thermal comfort data of the residential buildings in the case area. Finally, a multi-criteria decision-making model, using real-life criteria, such as total energy consumption, thermal comfort, capital cost, lifetime and installation flexibility, is used to make a decision for decreasing the UHI effect on residential energy performance of buildings. The results showed that applying NBSs, such as green roofs and changing existing trees with high leaf area density ones, have the highest ranking among all mitigation strategies. The output of this study may help urban planners, architects, and engineers in the decision-making processes during the design phase of urban planning.

1. Introduction

Urban heat island (UHI) is defined as an urban zone with higher temperature than rural areas due to human activities [1,2]. The United States Environmental Protection Agency (US EPA) reported that the main effects of the UHI are boosted energy consumption, greenhouse gases, air pollution, harmful impact on human health, and poor thermal comfort [3]. Considering that urban zones are responsible for almost 66% of total energy consumption [4], decreasing the effect of the UHI on energy consumption is significant to achieve sustainability goals. Likewise, buildings accounted for 35% of total energy consumption from the world’s perspective [5]; thereby, the effect of the UHI on the energy performance of buildings should be investigated in detail [6].
Associated with the UHI, increased cooling load and decreased heating load in buildings are generally expected, which results in increased energy consumption of buildings [7,8]. On the other hand, urban zones and buildings have a huge potential in terms of energy saving since several energy-saving strategies to mitigate the impact of the UHI are proposed in the literature, i.e., changing pavement materials [9], nature-based solutions (NBSs), such as planting vegetation [10], using highly reflective materials [11] with a combination of green roof application, and using high-albedo materials in urban surfaces [12]. NBSs are actions inspired by nature and are widely used to mitigate UHI effects. Planting trees in urban zones, using renewable energy sources, such as wind, wave, or solar power, and green actions, which are modelled on biological processes, are some good frames of NBSs [10]. Particularly, researchers use micro-climate simulations [10,11] in order to obtain the effect of UHI on urban scale and integrate these simulation results with dynamic building energy simulation tools to examine residential building energy consumption change due to the UHI [9,12]. However, strategies on decreasing building energy consumption consist of multi-criteria tasks, such as the potential for decreasing air temperature, installation flexibility, and lifetime, initial, and operational costs [13,14,15]. Moreover, thermal comfort is another vital criterion for the decisions and is defined as “the condition of mind that expresses satisfaction with the thermal environment and is assessed by subjective evaluation” [16]. The Fanger’s predicted mean vote (PMV) / predicted percentage of dissatisfied (PPD) method predicts thermal comfort according to 7-point thermal sensation scale; thereby, the PMV values between −0.5 and +0.5 are accepted as comfortable zones [16]. Including thermal comfort as another criterion, decision-making between various single/combined strategies becomes more problematic in the design phases.
Multi-criteria decision-making (MCDM) models target exhibiting possible strategies to support decision-making for a specific goal when many alternatives and complex criteria are available [17]. There are several MCDM models in the literature, such as Analytical Hierarchy Process (AHP) [18], Analytic Network Process (ANP) [19], Technique for Order of Preference by Similarity to Ideal Solution (TOPSIS) [20], Complex Proportional Assessment (COPRAS) [21], VIekriterijumsko Kompromisno Rangiranje (VIKOR) [22], Preference Ranking Organisation Method for Enrichment Evaluation (PROMETHEE) [23], Elimination Et Chroix Traduisant la Realite or Elimination and Choice Expressing Reality (ELECTRE) [24], Case-based Reasoning (CBR) [25], Additive Ratio Assessment (ARAS) [26], Decision Making Trial and Evaluation Laboratory (DEMATEL) [27], Stepwise Weight Assessment Ratio Analysis (SWARA) [28], and Weighted Additive Sum Product Assessment (WASPAS) [29]. The Kemeny Median Indicator Ranks Accordance-Modified (KEMIRA-M) model [30] is one of the efficient MCDM models, which allows simultaneous identification of the weights of criteria on separate groups of criteria. The model is easy to use since the model generalizes expert opinions in order to set priorities of criteria in the decision-making problem [31]. Furthermore, the integration of the expert opinions with the quantitative values, such as real-time measurements and/or simulation results, also makes the model more efficient over the other MCDM models.
According to the recommendation of the U.S. Department of Energy, the decisions regarding the design of both urban zone and building scales must include some characteristics, such as providing many equal alternatives, a comprehensive set of reviews, and interdisciplinary studies, at many levels of management [32]. Therefore, researchers utilize the MCDM models in energy-related fields to select a solution for a specific goal. For instance, Baç et al. [17] used a novel hybrid model of building energy simulation (BES) integrated modified SWARA and WASPAS framework to select the best heating, ventilating and air-conditioning (HVAC) system for an industrial building. The authors used twenty-seven criteria to select the best option among eleven different HVAC systems. Elkhayat et al. [33] utilized the AHP model to find a solution for the best high-performance glazing system for an office building. Beltrán and Martínez-Gómez [34] integrated building energy simulations with the TOPSIS to obtain alternative phase change materials for building wallboards and roofs. However, according to the author’s knowledge, there are very limited studies that use the KEMIRA-M model in energy-related fields. As an example application, Kış et al. [35] used the KEMIRA-M model in order to determine a warehouse location for an electricity distribution company in Turkey. On the other hand, integration of the KEMIRA-M model with the simulation results has not yet been studied in design problems for urban and building relationships.
Existing frameworks in the literature for the UHI mitigation include correlations between the UHI and environmental parameters, i.e., in [36], data-driven methods, such as machine learning methods, i.e., in [37], combined artificial intelligence (AI) and sensitivity analysis of the environmental, social, and economic performance, i.e., in [38] and planning and design variables, i.e., in [39]. However, integration of the urban micro-climate and building energy performance simulations with the MCDM tools is needed in order to evaluate the effect of UHI on building energy performance. Therefore, the purpose of this study is to develop an integrated decision-making framework for mitigating the UHI impact on the energy performance of residential buildings. The model integrates urban micro-climate and building energy performance simulations with an MCDM model. The study uses real-time measurement data, which are collected from one of the case study areas in İzmir/Türkiye for the Urban GreenUP project [40]. The project develops a methodology to support the development of renaturing urban plans targeting climate change mitigation and adaptation by NBSs in urban areas.

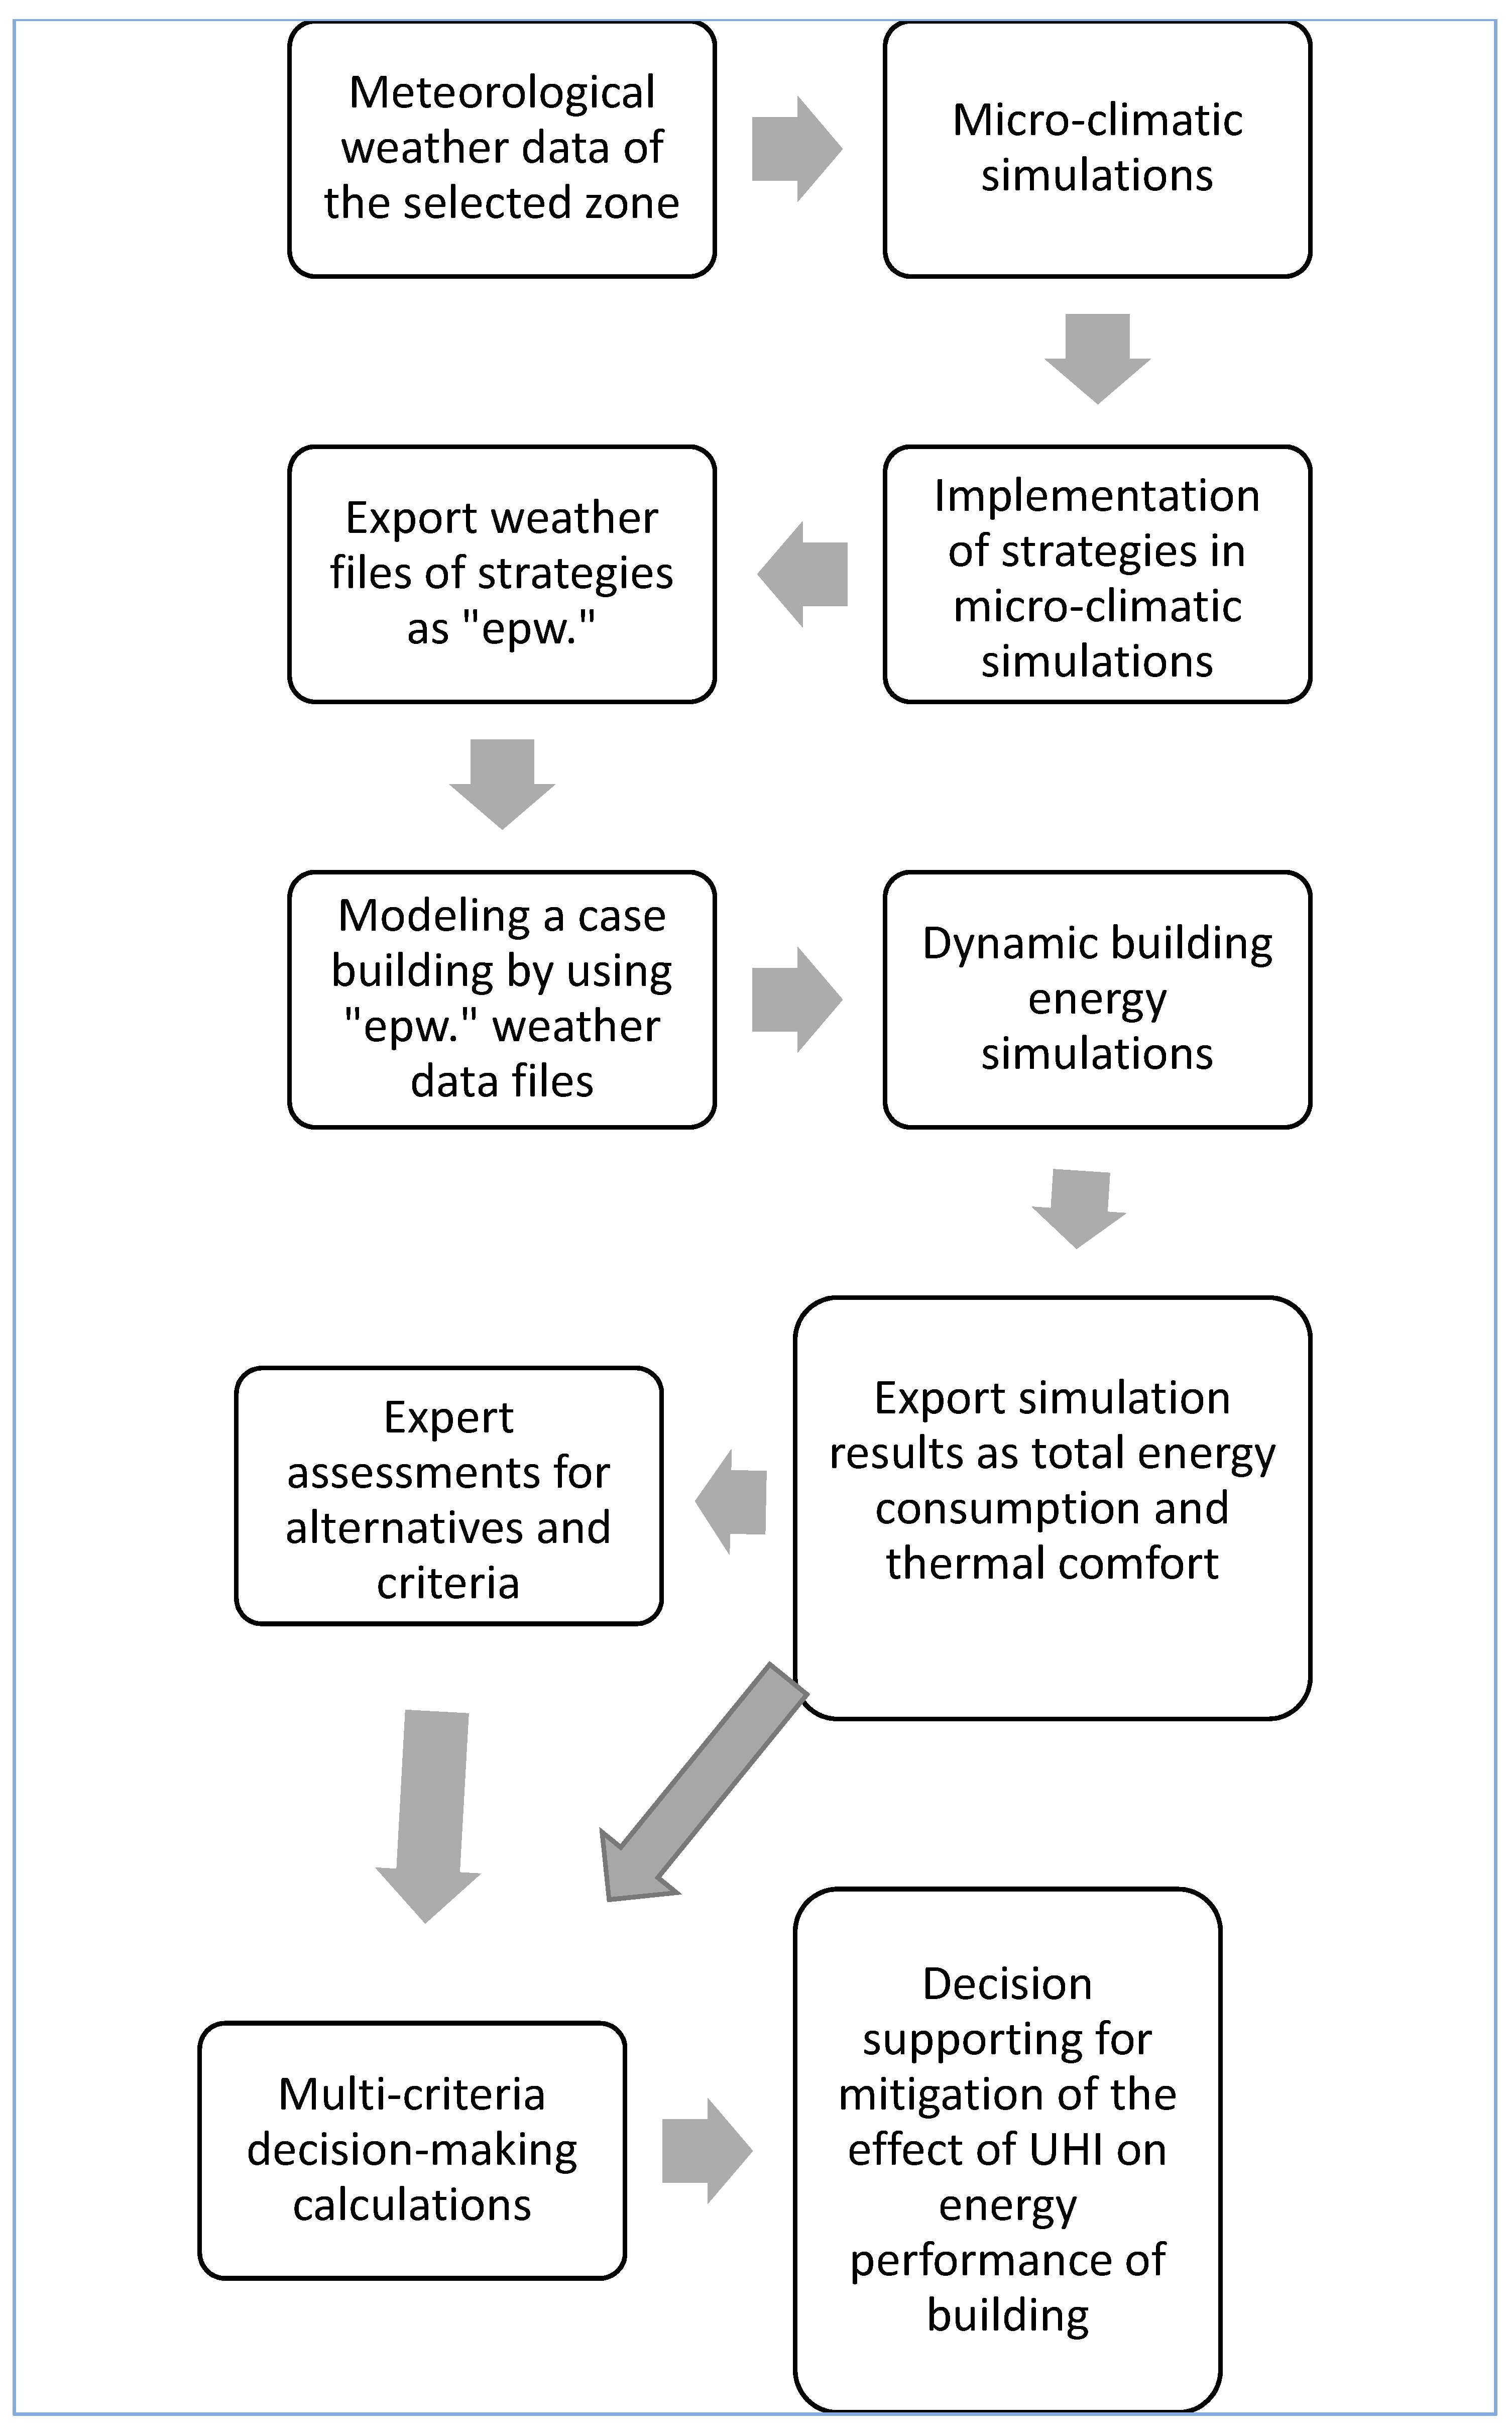
2. Materials and Methods
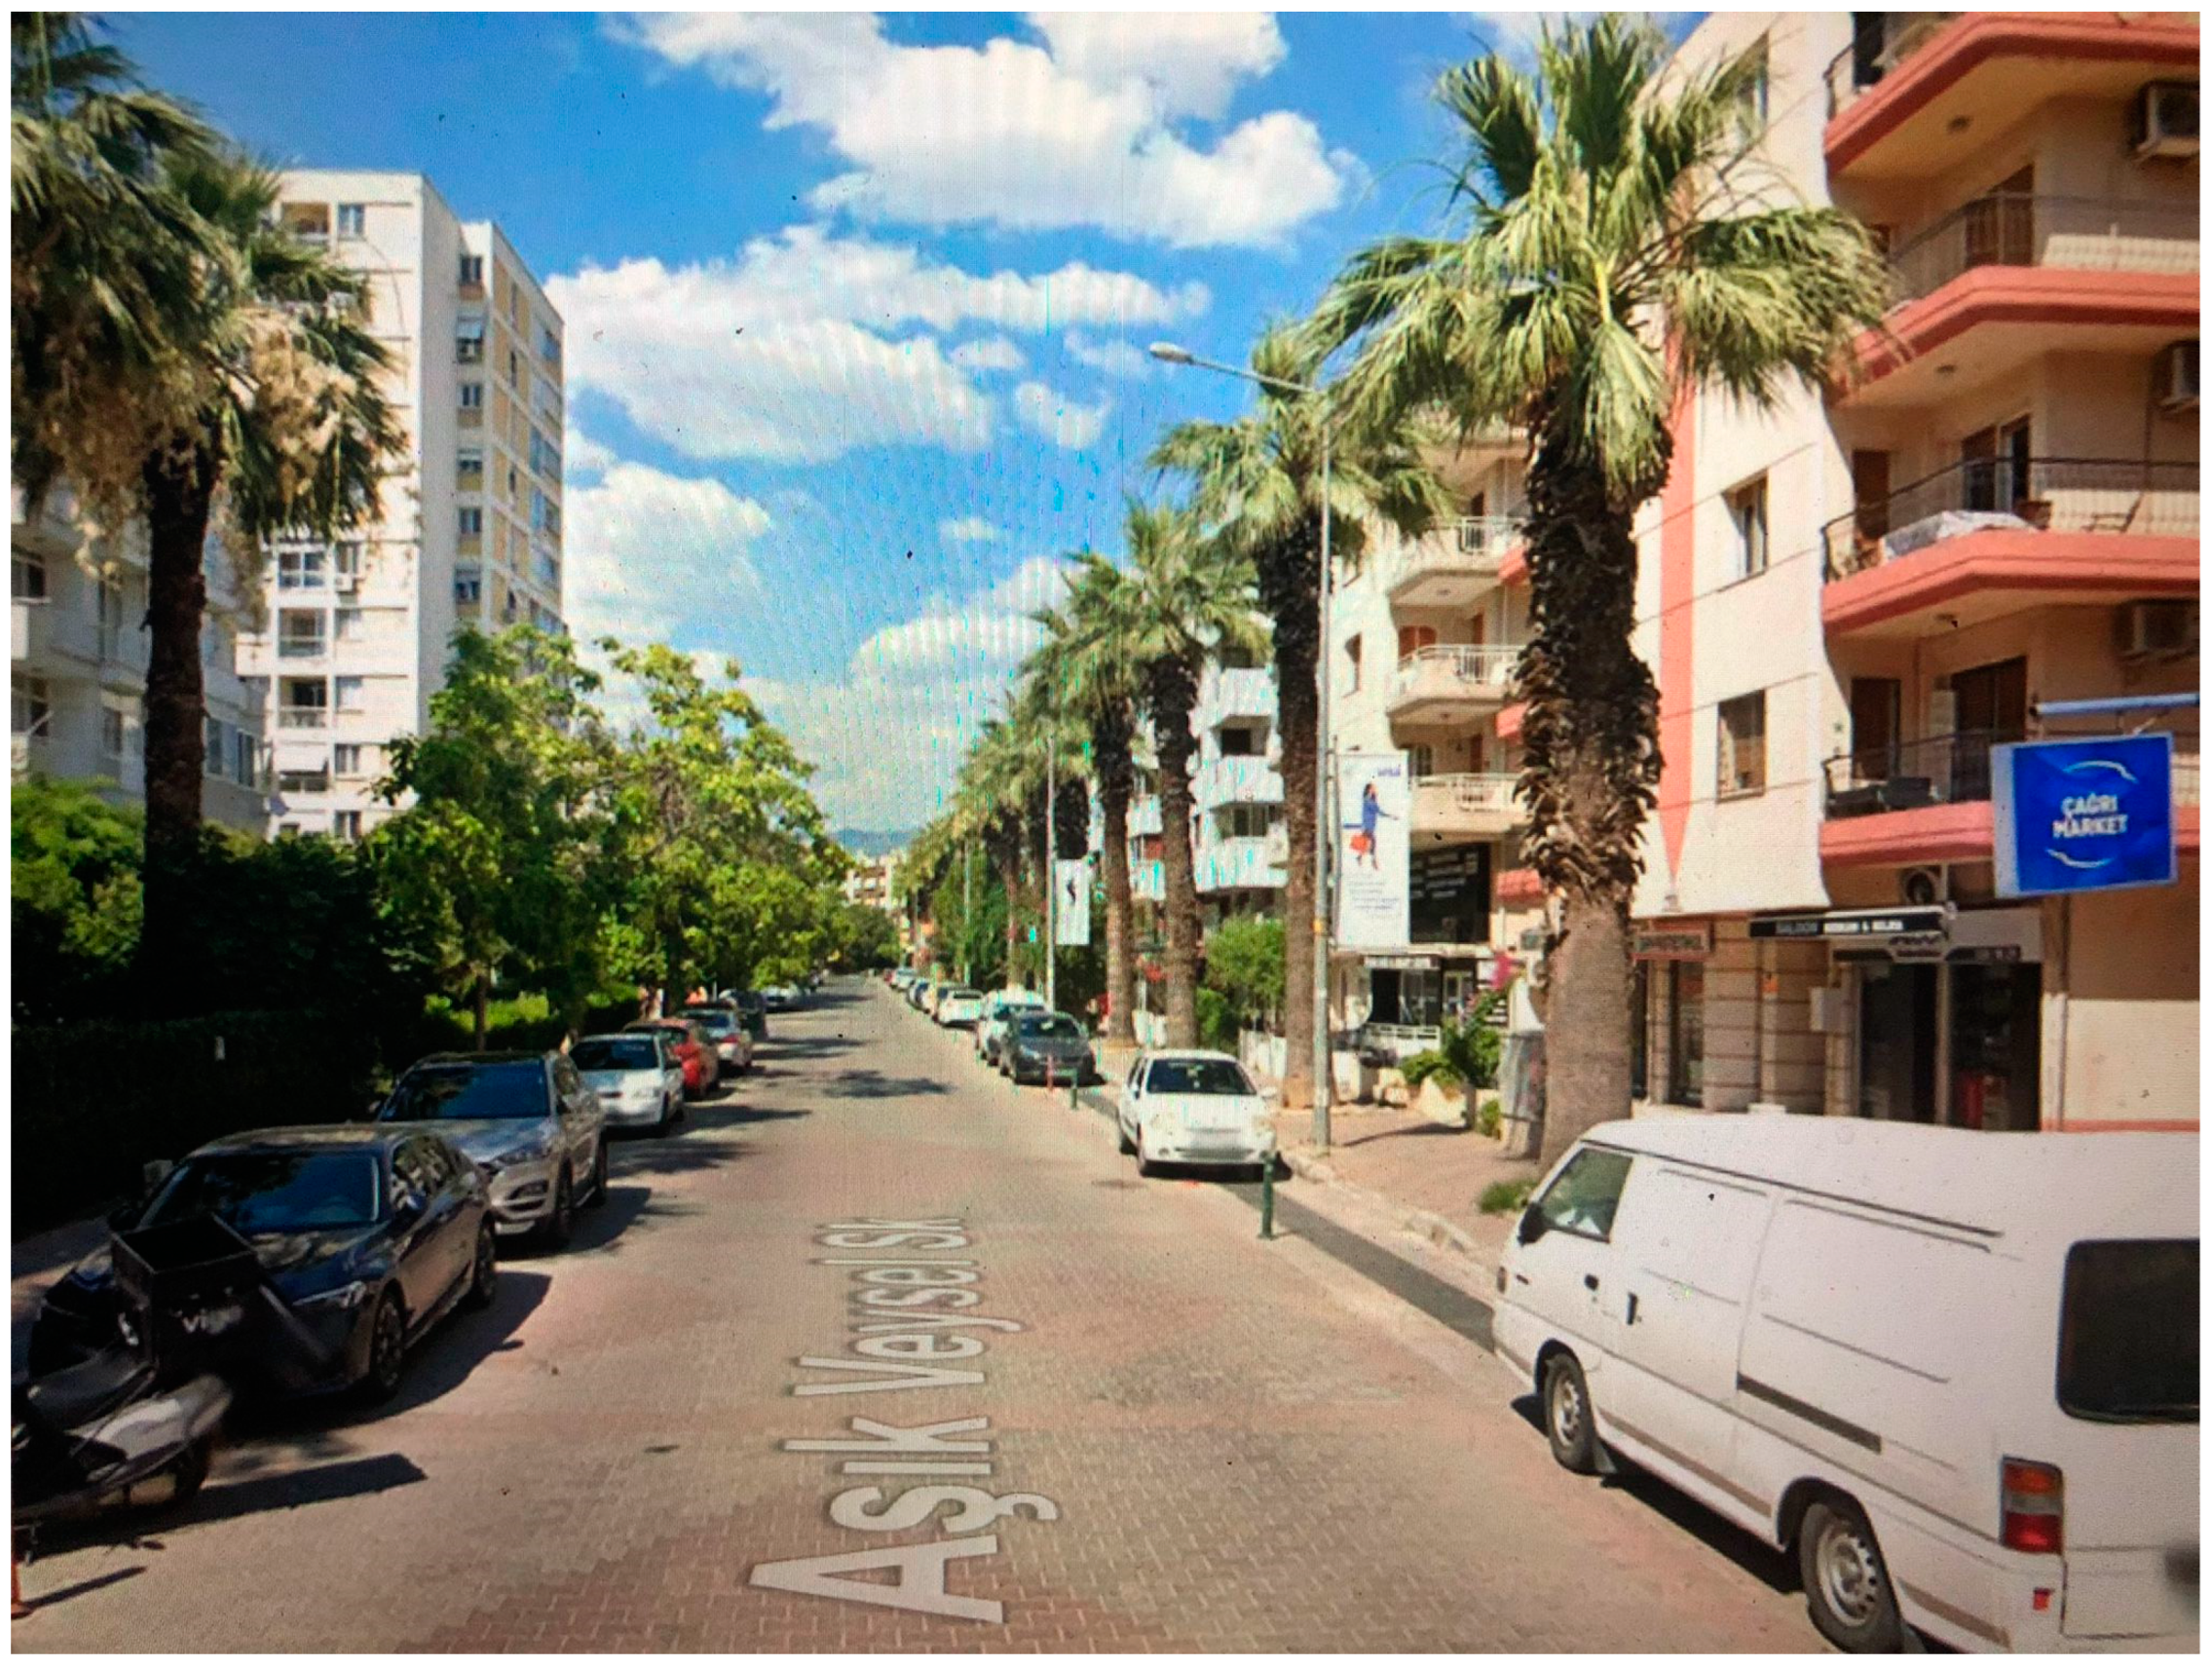
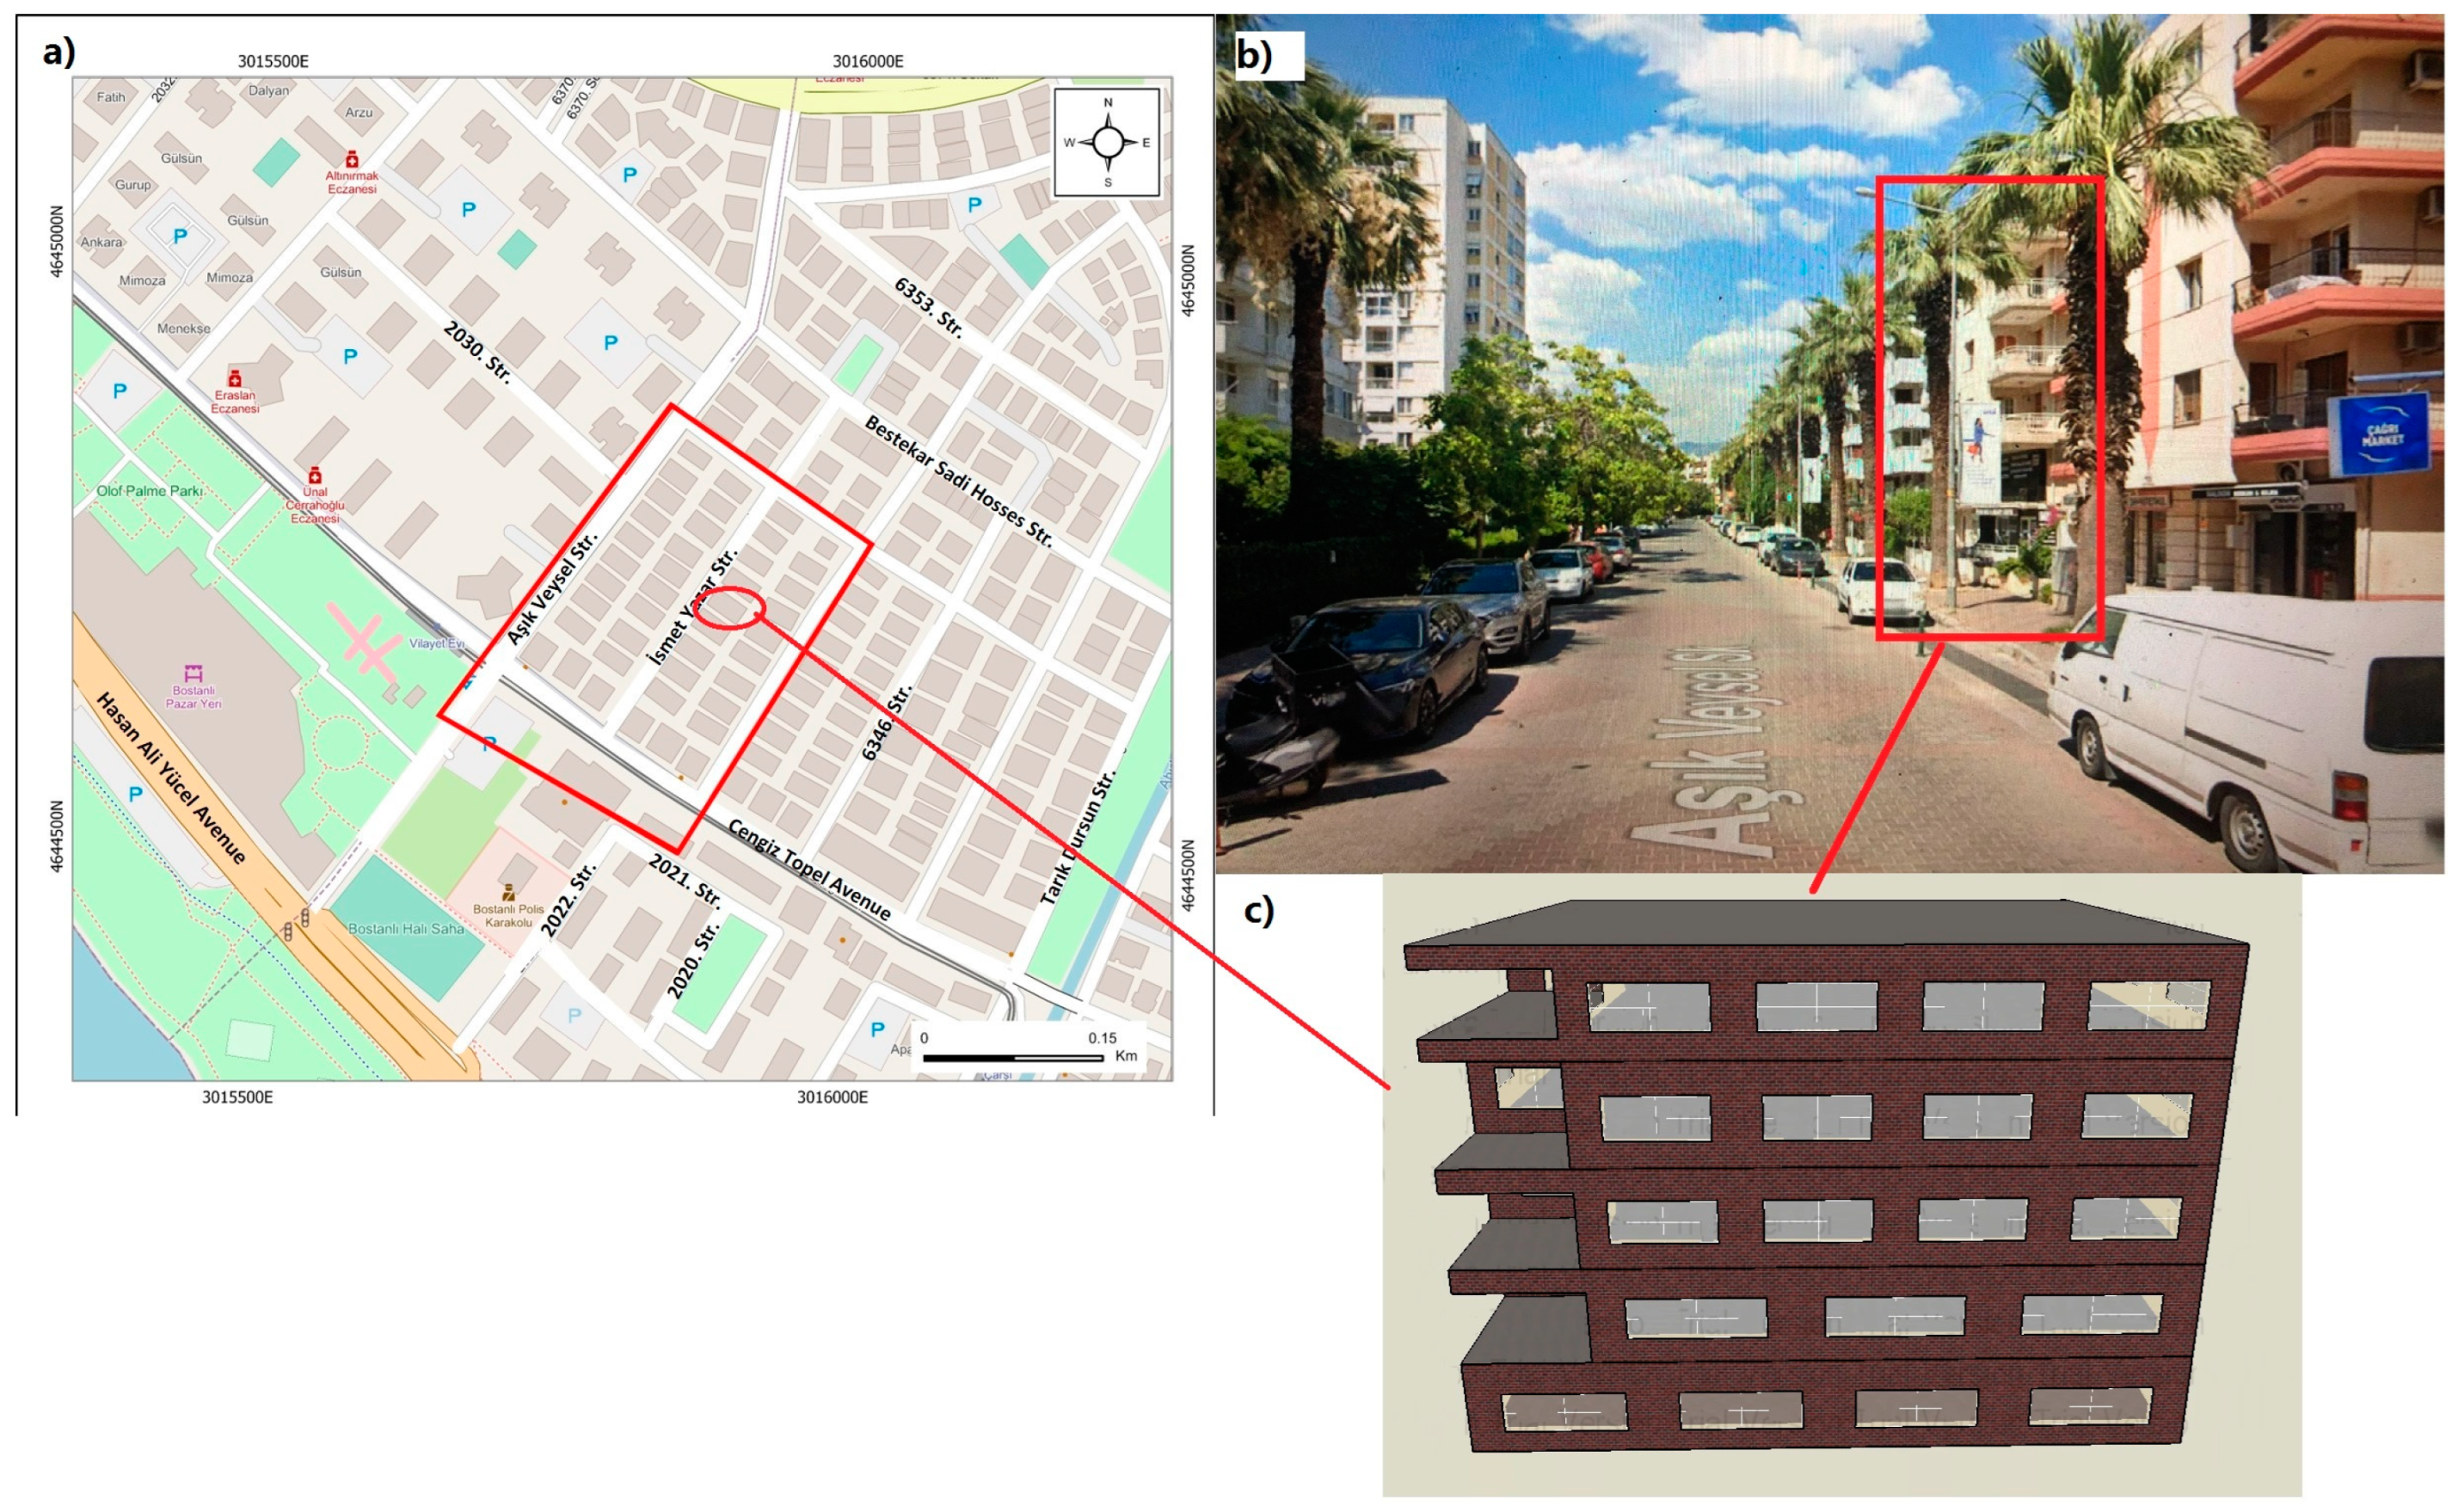
The proposed framework integrates a micro-climatic simulation, a dynamic energy performance simulation, and an MCDM tool (Figure 1).
The framework uses collected meteorological weather data to simulate potential air temperature in a micro-climatic simulation tool in order to determine the current effect of the UHI on building energy performance. Different strategies, including changing the low-albedo materials with high-albedo ones, NBSs, and changing building façade materials, are applied in a micro-climatic simulation software. For each strategy, an “epw.” file is used as input of the dynamic building energy performance simulation. Then, the output of the micro-climatic simulation software, which is the potential air temperature, is used as input meteorological weather data for dynamic building energy simulation software. Afterwards, total energy consumption and thermal comfort data are obtained from the dynamic building energy simulation software for each scenario. At the same time, expert assessments are used as the input of the MCDM model. Finally, the model presents the outcomes of the proposed strategies based on each criterion to support decision-makers.
The proposed integrated framework is used in a case study by incorporating both qualitative and quantitative data to facilitate the multi-level decision-making process.

2.1. Case Study

The case study utilizes the proposed framework with a micro-climatic simulation via Envi-Met software V5 [41], a dynamic energy performance simulation by DesignBuilder software v7.0.2.006 [42] and a multi-criteria decision-making tool called KEMIRA-M model [30].

2.2. Characteristics of the Study Zone

An urban area, Vilayetler Evi Zone (VEZ) in Izmir/Türkiye is selected for the case study (Figure 2). The VEZ is one of the case study areas of Urban GreenUP project [40] since the zone has high-heat wave risk and faces UHI problems originating from dense urbanization and construction operations and heavy traffic [2].
Izmir is the third most populous city in Turkey with a population of 4,425,789 inhabitants in 2021 [43]. The Köppen-Geiger Climate Classification of İzmir is Csa has a temperate climate zone [44]. The average monthly temperature is 22 °C in July (the warmest month in İzmir), while the average in the coldest month (January) is measured as 10 °C [45].

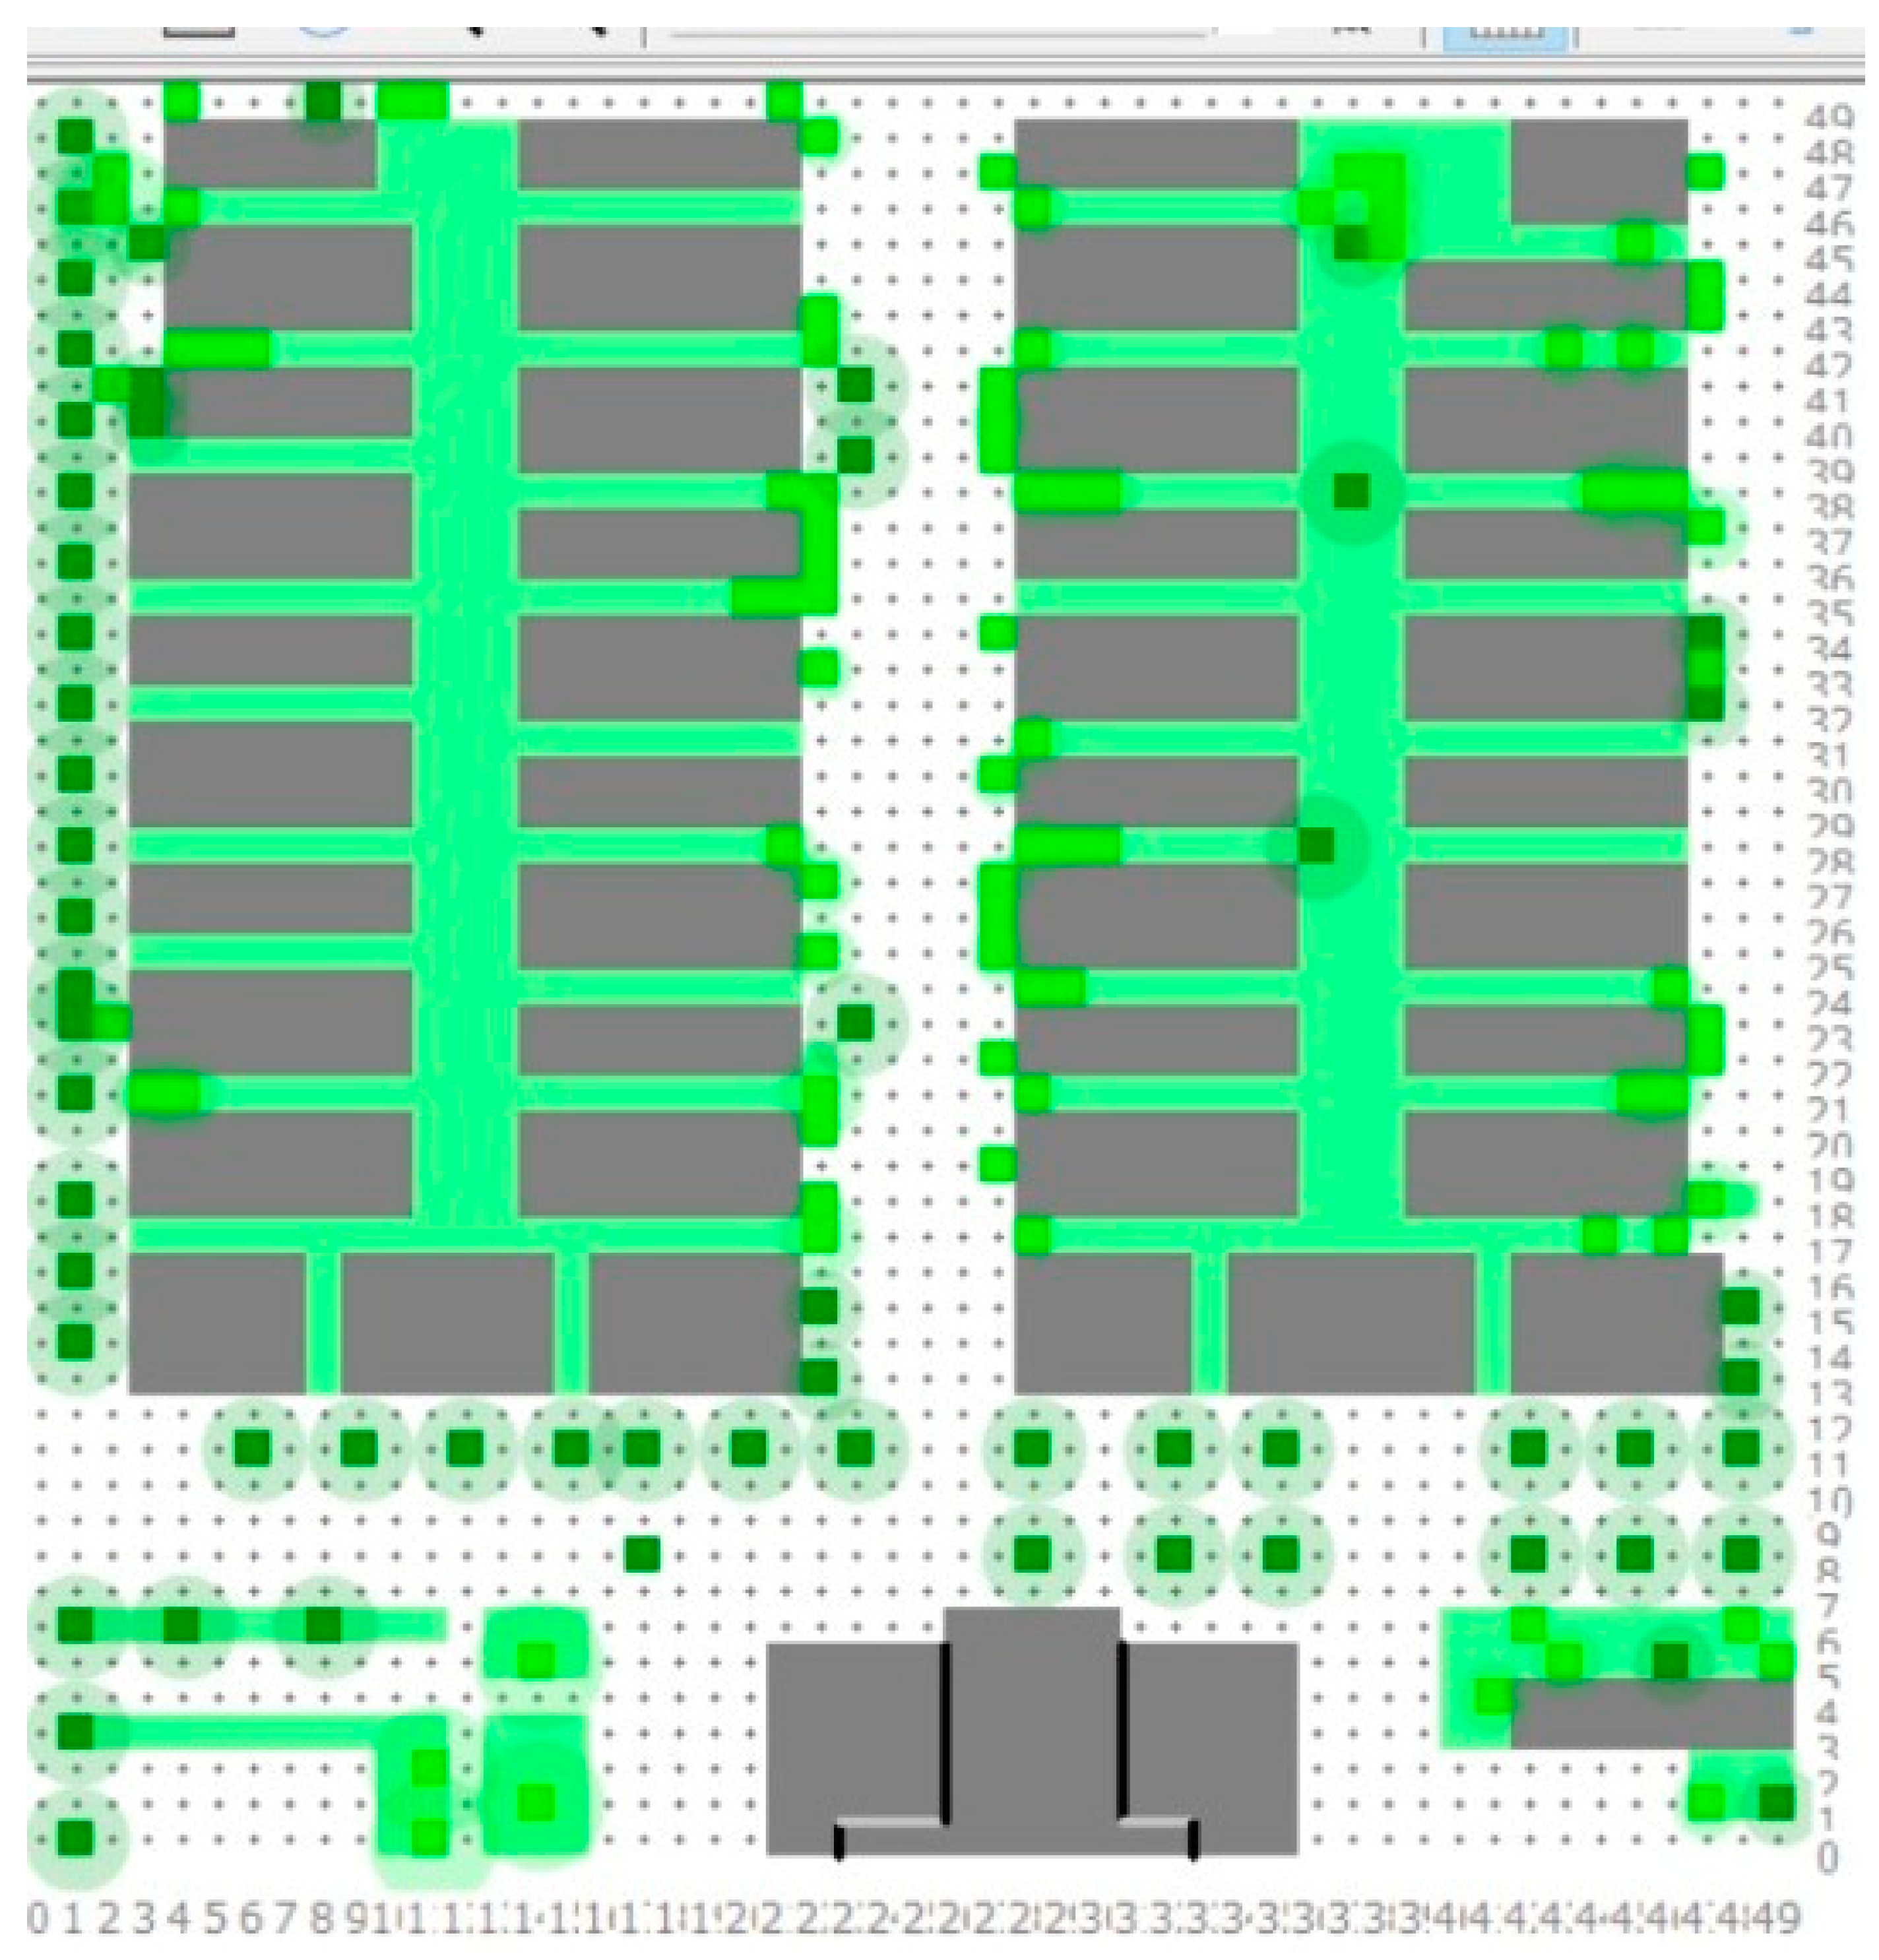
2.3. Micro-Climatic Simulations

The micro-climatic simulations are conducted in a 3D urban-climate-modeling tool: Envi-Met software V5 [41]. The software simulates the microclimatic effects of buildings, vegetation, and other objects in the fields of urban design. For the study, a 37,500 m2 area in the VEZ is modeled with a resolution of 5 × 5 × 5 m (Figure 3). Firstly, current soil properties, building mass data, road properties, and current vegetation qualities are integrated in the software. The input data are generated using outdoor temperature (Tair), relative humidity (RH), wind direction (WD), and speed (WS) from the meteorological station in the VEZ, which was installed for the Urban GreenUP project [40]. Table 1 depicts the sensor specification of the meteorological station [46].
1 July 2022 is chosen for the micro-climate simulations since July is the month of intensive heat waves in Izmir/Türkiye according to data collected for the Urban GreenUP project [47]. The “epw.” file of this date is uploaded to the Envi-Met software V5 for the simulations. Additionally, physical data, such as buildings, pavement materials, sizes, and species of the trees, as well as geographical and meteorological data are modelled for the study. The effect of the UHI on building energy performance and thermal comfort is selected based on the change of the potential air temperature during simulations similar to past studies in the literature, i.e., in [12]. All the strategies to mitigate the UHI effect are simulated in the Envi-Met software V5 by changing the physical properties of the urban zone and buildings. The features of all strategies are given in Section 2.3. It is worth noting that all simulations are started at 6:00 am and last 24 h for the date of 1 July 2022.
Finally, it is worth reminding that the model simulation results should be validated with actual measurement data in order to obtain accurate results. Therefore, the model is validated with actual data, and the results are statistically evaluated by using criteria called mean squared error (MSE) and mean absolute percentage error (MAPE) in Equations (1) and (2), respectively [48,49].
M S E = 1 1 n ( T a T m ) 2
M A P E = 100 n 1 n T a T m T a
where n is the sample number, and Ta is the actual temperature, while Tm is the simulated temperature by the model.

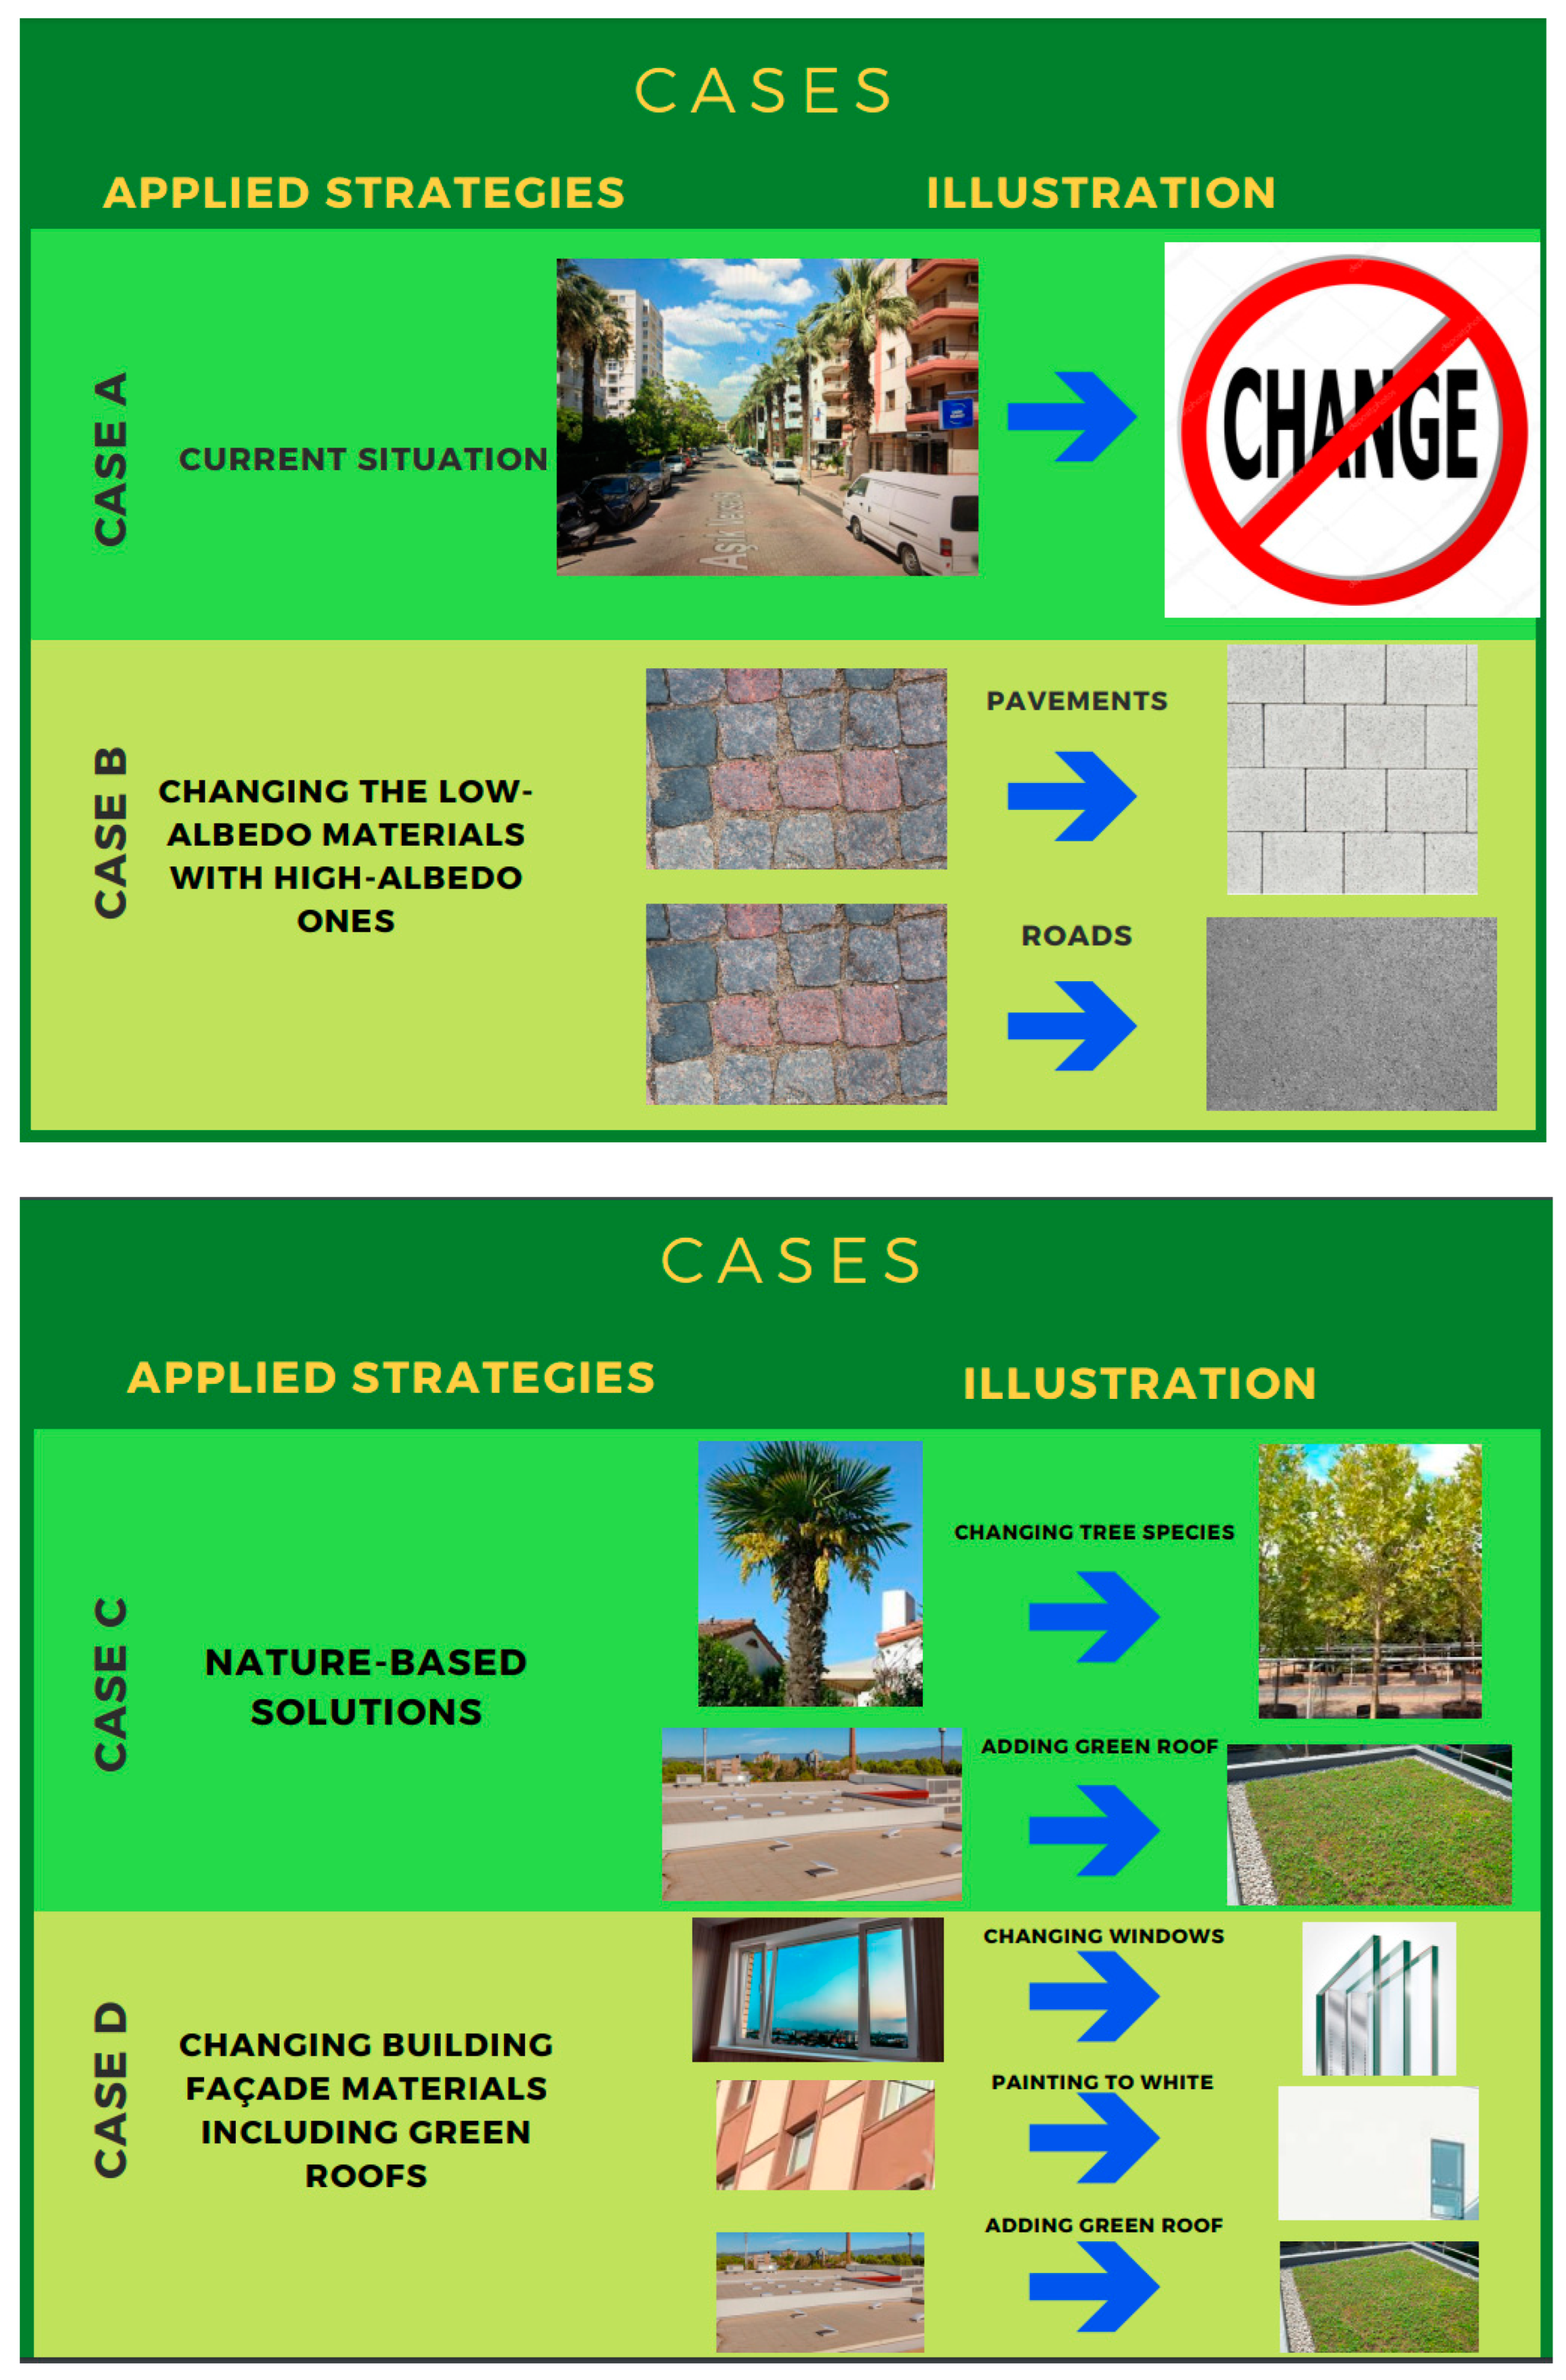
2.4. Proposed Strategies

Four strategies, including the current situation (Case A), changing the low-albedo materials with high-albedo ones (Case B), nature-based solutions (Case C), and changing building façade materials, including green roofs (Case D), are investigated in micro-climate simulations. These strategies are designed based on the feasibility, ease-to-use, and high efficiency of mitigating the UHI in the urban zone. The startup parameters for the Envi-Met tool are given in Table 2.
  • Case A—Current situation
The current situation is based on the current physical properties of the selected urban zone (Figure 4). The buildings have no roof greening and consist of brick walls with insulation. The roads are dark grey and red cobblestone with an albedo value of 0.19 [50]. The pavements consist of the combination of concrete and dark grey and red cobblestone with albedo of 0.2. The selected urban zone does not have much soil since the area is a dense urbanized zone. Therefore, the properties of the soil are neglected for the simulations. The amount of the vegetation is medium, and the streets mostly host “Chamaerops excelsa”, which is planted for the purpose of vegetation during the Urban GreenUP project [40]; hence, this type of tree is modelled in the simulations. The roof of the buildings is concrete with an albedo value of 0.4.
  • Case B—Changing the low-albedo materials with high-albedo ones
Pavements and roads are generally exposed to solar radiation, which increases the potential air temperature in urban zones [51]. Considering that almost 40% of the urban zones consist of pavements and roads [52], the first solution in order to mitigate the UHI is, therefore, changing the materials of these components. In this strategy, dark grey and red cobblestone roads (albedo of 0.19) are changed to bright asphalt with an albedo value of 0.5. In addition, pavements are changed from a combination of concrete and dark grey and red cobblestone (albedo of 0.19) to white granite with an albedo of 0.6. The other properties are kept the same as the current situation.
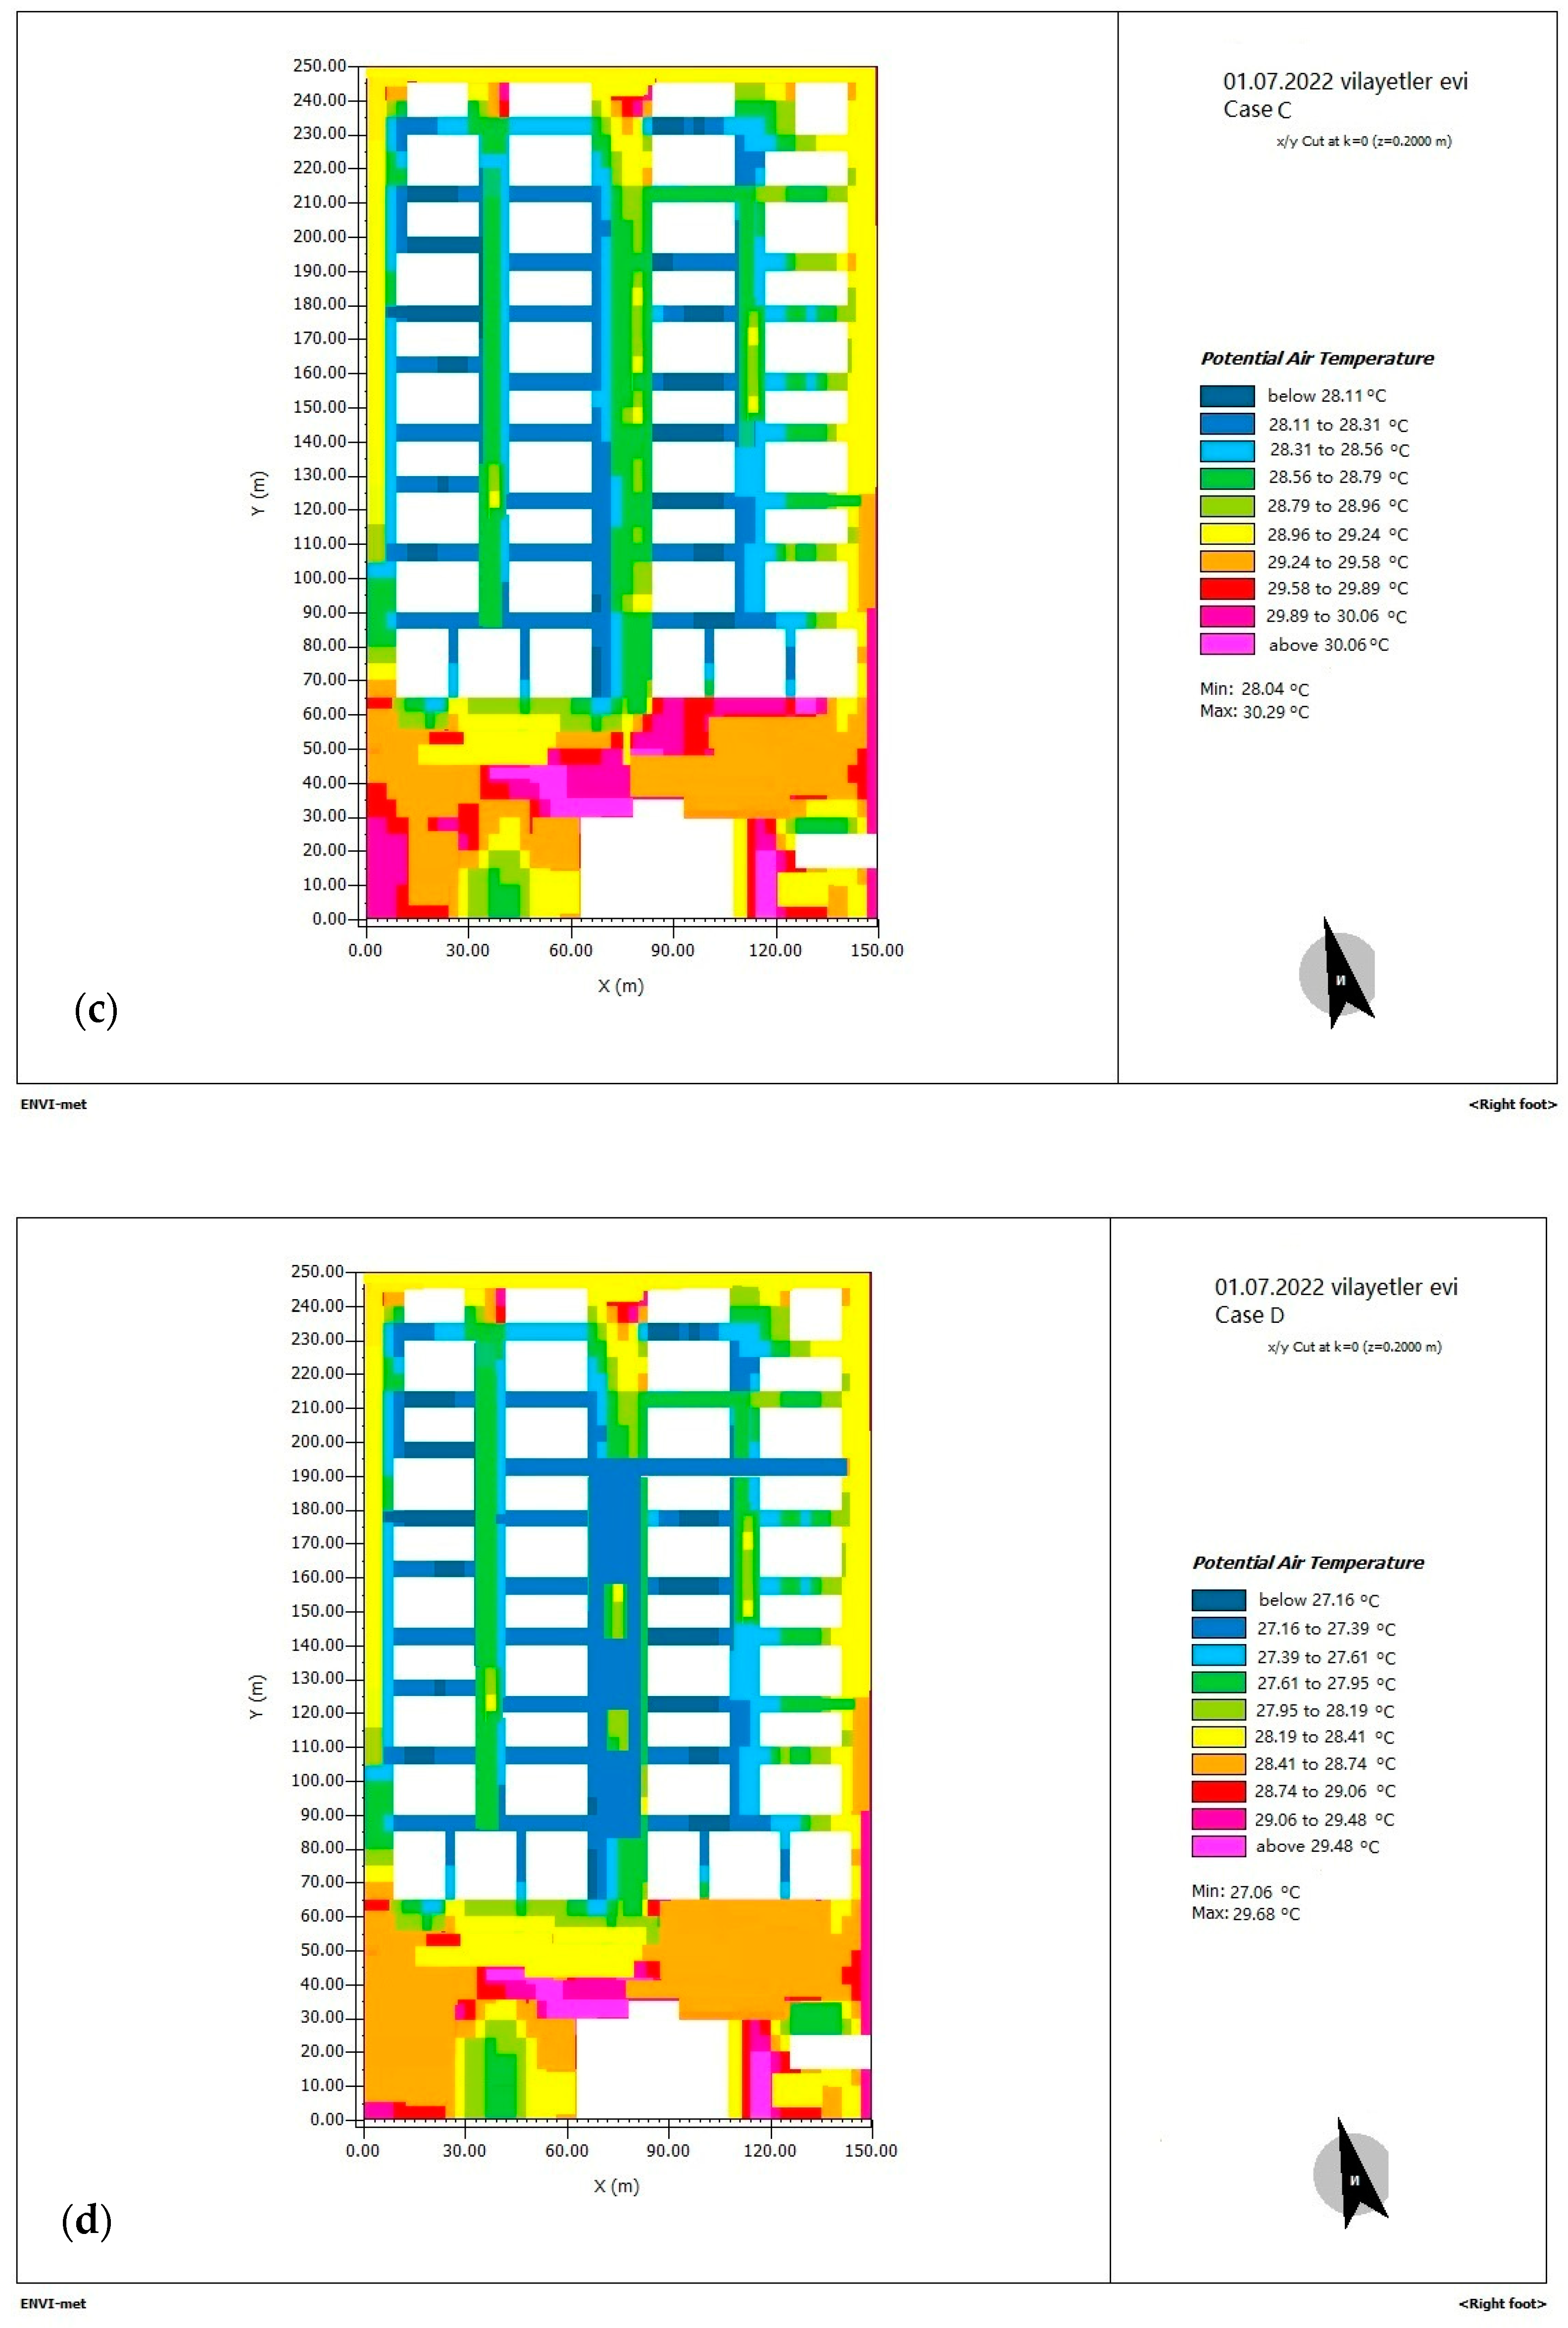
  • Case C—Nature-based solutions (NBSs)
Vegetation helps to cool the urban zones by decreasing the heat gain of the surface [53]. Therefore, in this strategy, NBSs, including changing tree species and adding a green roof, are integrated into the current situation. The current “Chamaerops excelsa” trees are changed to “Platanus orientalis” with high leaf area density (LAD) in order to create a dense shading effect on the roads, buildings, and pavements.
The LAD incorporates the height of the crown (H), the diameter of the crown (D), the condition of the crown (CF), and a shading coefficient (Sh) that reflected the inherent crown density of particular species. This relationship represents an estimate of the leaf area of a single healthy tree. In micro-climate simulations, the Envi-Met considers three different values for LAD: high LAD (1.1), medium LAD (0.6), and low LAD (0.3). Therefore, the LAD value of Platanus orientalis is calculated by using Equation (3).
Leaf area density (LAD) = one-sided leaf area (m2)/reference volume (m3)
In Equation (3), the reference volume is selected as 1 m3 [41]. By using Equation (3), the LAD value of 0.6 is calculated for the “Platanus orientalis” and is used for the simulations. Moreover, the grass is integrated on some parts of the pavements with an albedo value of 0.8. The green roof is also applied to all buildings (with an albedo value of 0.93).
  • Case D—Changing building façade materials, including green roofs
The effect of the UHI on building energy consumption and thermal comfort is highly associated with building characteristics and material properties [12]. To this aim, the insulations of the buildings are changed from poor insulation to moderate insulation (U-value: 0.35 W/m2-K with an albedo of 0.2), and double-glazed windows are changed from light transmittance (39%) and no solar protection to semi-opaque white heat protection glass (4 mm) in micro-climate simulations. Furthermore, the paint of the buildings is changed to white color. It is worth reminding that the green roof application of Case C is also valid for this strategy.
Figure 5 illustrates the proposed strategies used for this study.

2.5. Building Energy Performance Simulations

The building energy performance simulations include the total energy consumption of the case building on the date of 1 July 2022 and thermal comfort hours in a day. Thermal comfort hours are the hours a day that the thermal comfort range of −0.5 < PMV < +0.5 is met. To this aim, a case building in the VEZ is selected to simulate energy consumption and thermal comfort according to the mean potential air temperature results of the strategies obtained by Envi-Met simulations in micro-climate simulations. The case building is a five-story apartment building that has a total area of 2489 m2 (Figure 6). Two flats with the same architectural configuration exist on each floor. The properties of the case building are presented in Table 3. In the case of buildings, the heating is satisfied with radiators using natural gas as an energy source. The building has a boiler in order to provide heating and domestic hot water. The set temperature of the radiators is constant at 22 °C during the winter. On the other hand, in summer, a split air-conditioner is used in each flat with a set temperature of 22 °C. The building has no mechanical ventilation, and the airtightness of the building is assumed as 0.5 air changes per hour, which is a moderate rate for naturally ventilated residential buildings [54]. The lighting activity is selected as between 18:00 and 23:59. Equipment (i.e., laptops, televisions, washing machines, etc.) used in the building are scheduled as a residential activity template.

2.6. KEMIRA-M Calculations

To support decision-making between various strategies, the researchers utilize MCDM tools, i.e., in [17,33,34,35]. The KEMIRA-M model is one of these tools to solve real-life multi-alternative problems [30]. This study uses the KEMIRA-M model to support decision-makers presenting solution alternatives based on various criteria in order to mitigate the UHI effect by decreasing energy consumption while meeting thermal comfort requirements. The reason for selecting the KEMIRA-M model for this study is its advantage of using much less information compared to other MCDM models [30]. A few expert reports are required to combine the quantitative results with the ranking methods. Alternatives are the strategies called Cases A, B, C, and D, as discussed in Section 2.4. Table 4 depicts the internal and external factors which affect the decision of selecting an alternative and the sources of the parameters. Internal factors are selected as total energy consumption and thermal comfort in the building, while external factors are capital cost, installation flexibility, and lifetime. It is worth noting that installation flexibility represents the complexity of the system (number of components) during the installation [17].
Results of the simulations (Envi-Met and DesignBuilder) and expert opinions are required for the KEMIRA-M calculations. The evaluations of three experts, one from energy and two from urban planning fields, are obtained in order to calculate the weights of the criteria.
For the calculations, a decision matrix (DM) is firstly constructed by Equation (4).
D M : x 1 x n y 1 x 1 i x 1 k x n k y 1 k
i is alternatives from 1 to k for the x and y criteria.
Then, priorities of the internal and external factors are determined from the experts by face-to-face interviews with non-quantitative evaluations. Numerical projections of the DM are then constructed as given in Equation (5).
X ( C ) = X i j 4 x 2           Y C = Y i j 4 x 3
After all criteria values are transformed to the factors treated due to their maximization value, the normalized decision matrix formula is calculated from the Equation (6). Hence, the values belong to the range of [0, 1].
n o r m a l i z e d   x j i = x j i x m i n i x m a x i x m i n i   n o r m a l i z e d   y j i = y j i y m i n i y m a x i y m i n i
i is from 1 to 4.
The next step for the calculation is determining median priorities of internal (X) and external (Y) factors via obtaining one or few medians. The weights of X (Wxi) and Y (Wyi) are firstly selected according to the difference of weighted averages and constraints. It is worth noting that the total of the weights is 1. Finally, the alternatives are ranked by Equation (7).
X w i ( C ) + Y w i ( C )
where Xwi (C) = 1 m [ W x j   *   n o r m a l i z e d   X j ( C ) ] and Ywi (C) = 1 m [ W y j   *   n o r m a l i z e d   Y j ( C ) ] . Further details of the KEMIRA-M calculation steps can be found in [30].

3. Results and Discussion

This section includes the micro-climate simulation results of 1 July 2022 for the Envi-Met model, the building energy performance simulation results (DesignBuilder v7.0.2.006) for the case building, and the KEMIRA-M calculation results to provide better solutions to decision-makers for mitigating the UHI impacts on energy performance and thermal comfort of residential buildings.

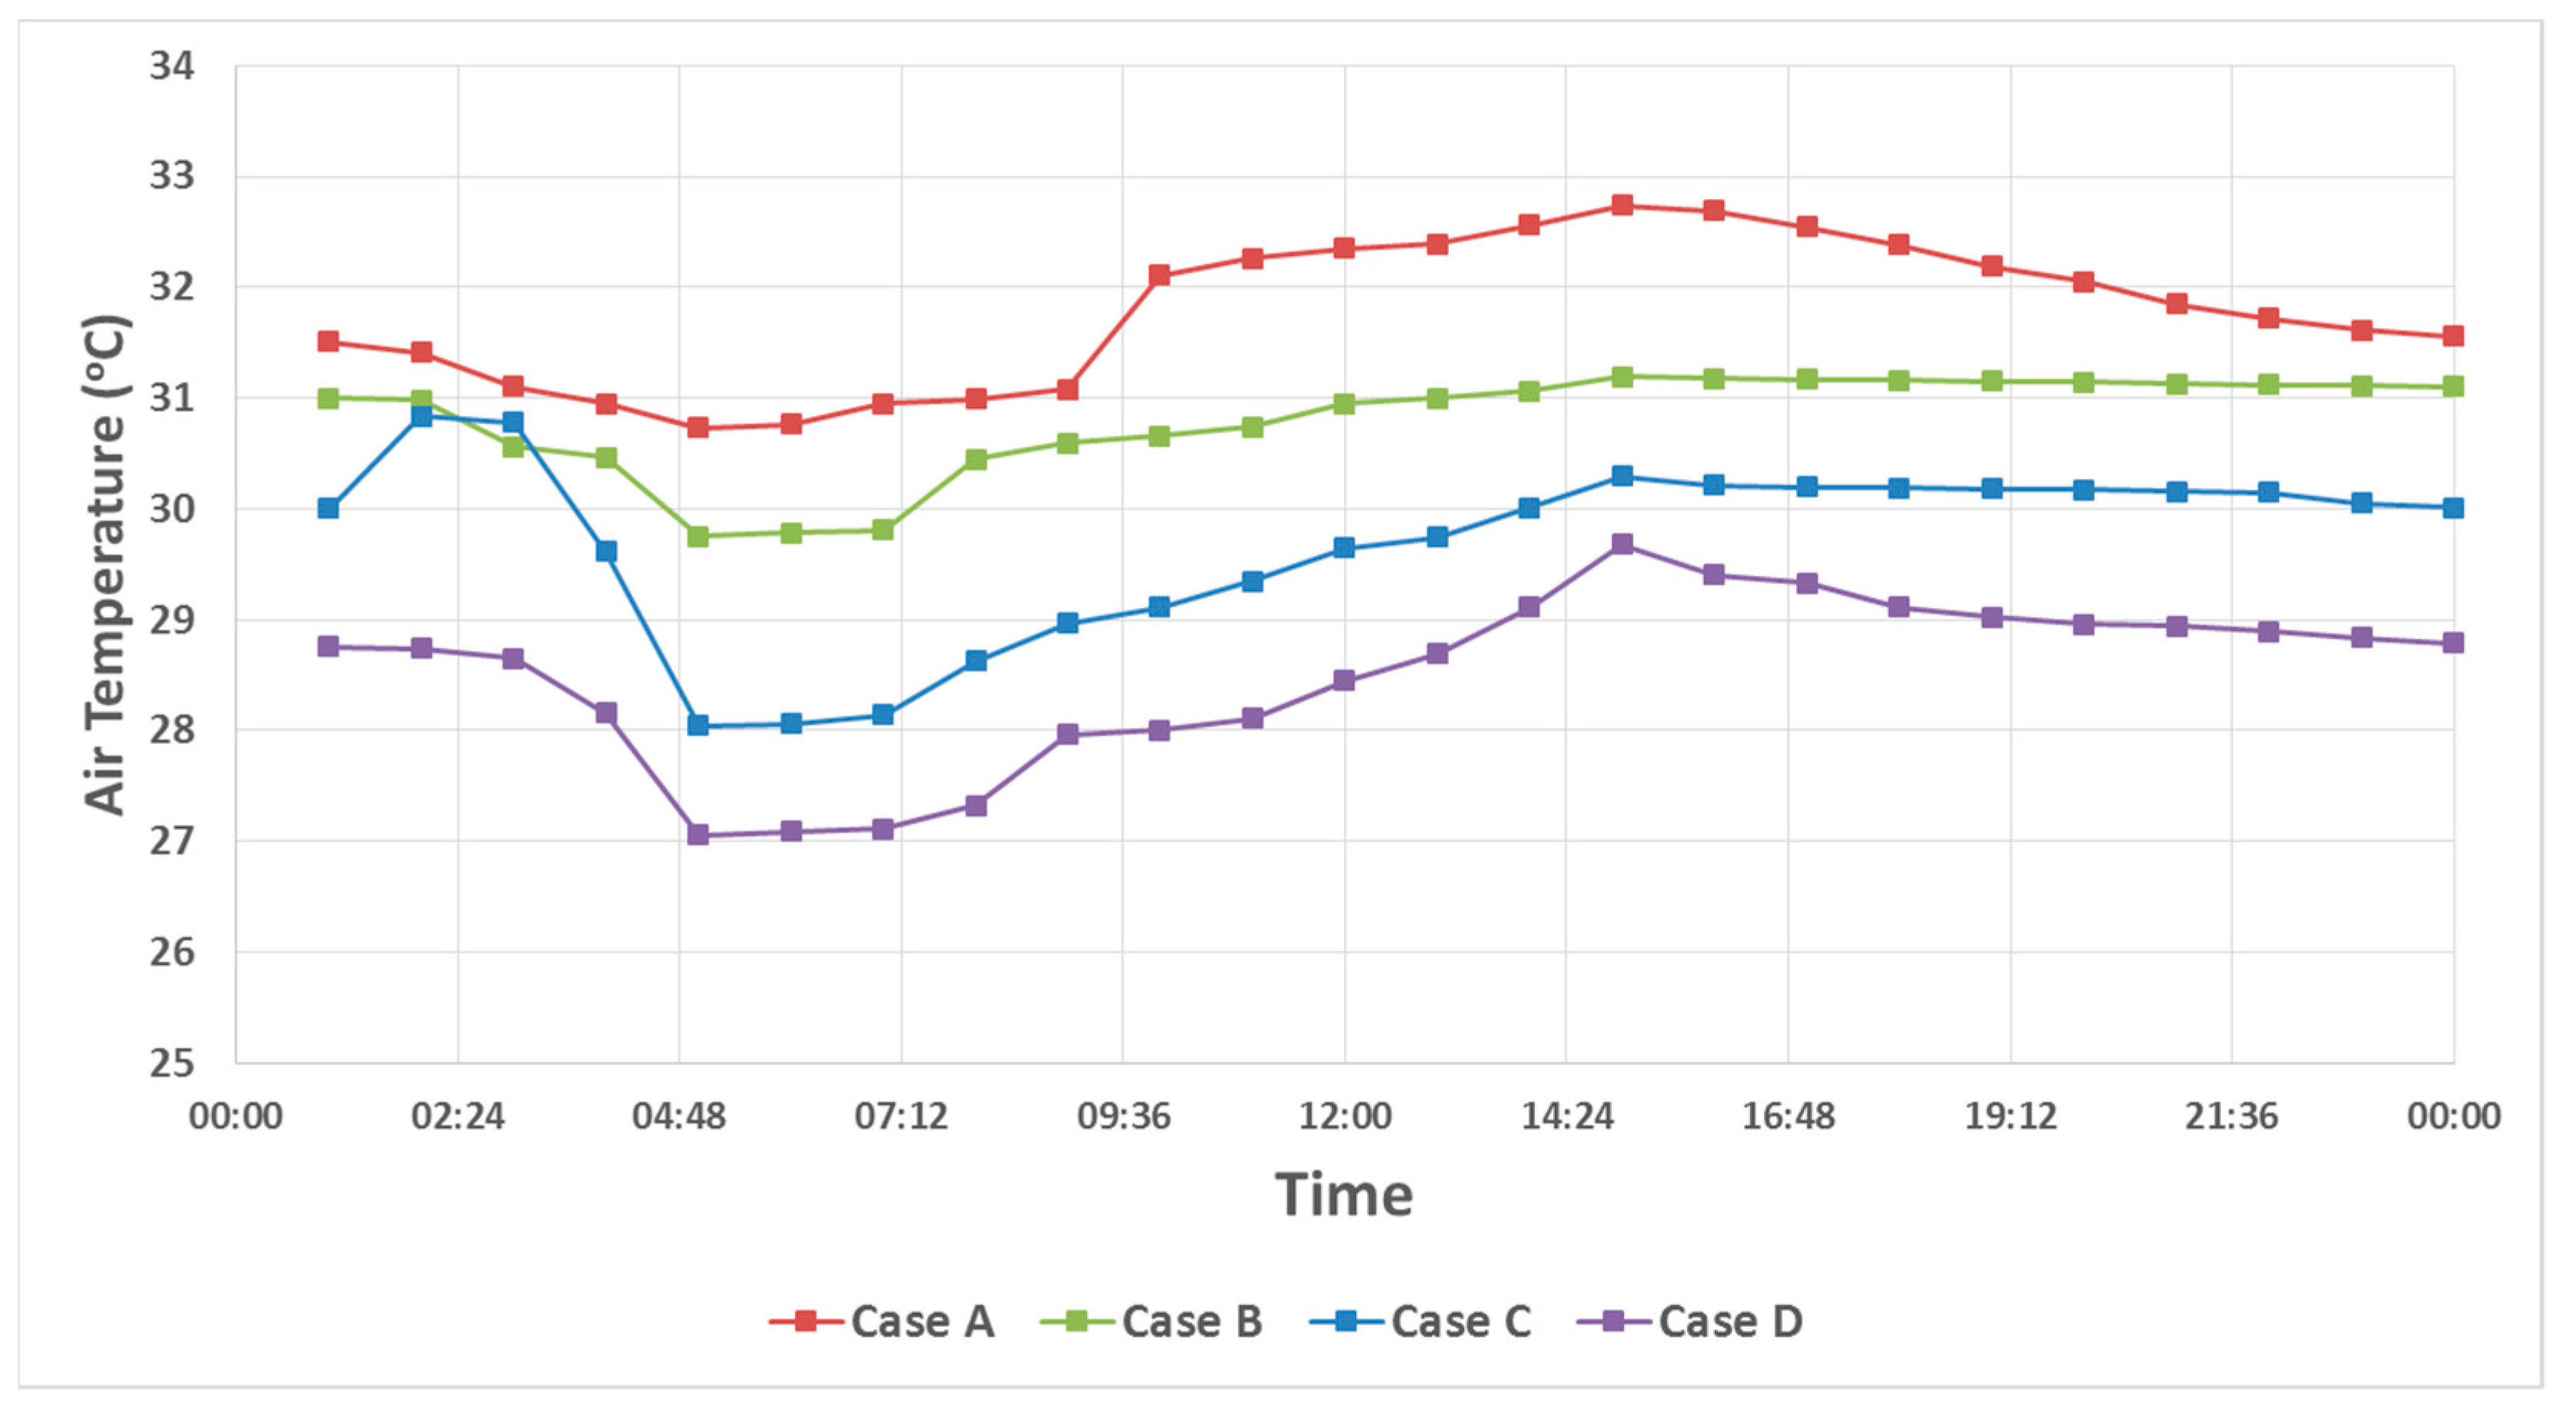
3.1. Micro-Climatic Simulation Results

The selected urban area in the VEZ is modelled in Envi-Met software V5, as shown in Figure 7. For the simulations, the date of 1 July 2022 is selected, and the potential air temperature is obtained as the output.
The simulated potential air temperature results are compared with the actual measurement data for the selected data, and the results showed that the Envi-Met model is successfully validated with values of MSE and MAPE of 0.3 and 2.1%, respectively. Figure 8 and Figure 9 depict the comparison of model results with the actual data. The figures show that the model data match with the actual data with a R2 of 0.99, which means that the existing model can be used for the next simulations for the different strategies.

3.2. Comparison of the Proposed Strategies

Four different strategies, including the current situation (Case A), changing the low-albedo materials with high-albedo ones (Case B), NBSs (Case C), and changing building façade materials, including green roofs (Case D), are compared for the study. Figure 10a–d illustrate the potential air temperature for Cases A, B, C, and D, respectively.
In Case A, which is the current situation, the maximum potential temperature is calculated as 32.74 °C, while the minimum potential temperature is found as 30.73 °C. The temperature in the southern part of the zone (between the range of X [30:120] and Y [40:60]) is higher than the northern part since the southern part exposes more solar radiation. Another reason for this difference could be the existence of denser green areas and “Chamaerops excelsa” trees in the urban zone. Moreover, buildings could cause a reduction in wind movement, which brings horizontal hot air flow from open zones.
The simulation results of the first strategy (Case B) demonstrate that changing the low-albedo materials with high-albedo ones decreases the potential maximum temperature by 4.73%. This result indicates that high-albedo materials have a high impact on the reduction of potential air temperature. The greater albedo surface cover cools the buildings and environments compared to the other part of the zone. On the other hand, in the simulation of Case C, the maximum potential air temperature is decreased by 7.48% compared to the current situation. The result indicated that adding vegetation highly decreased the temperature, particularly in the northern part of the zone. However, on the west part of the zone between the buildings (between the range of X [30–60] and Y [90–230]), the potential air temperature is found as higher than Case B. The low-albedo materials increase the potential air temperature since in the high-density building part enough space to plant vegetation does not exist. In the last strategy (Case D), the maximum potential air temperature is decreased by 9.36% compared to the current situation. The temperature is highly decreased in the high-density building part (between the range of X [60–90] and Y [90–190]) with an average of 1.9 °C. The reason could be the implementation of the green roof and white paint, which reflects the solar radiation.
Table 5 and Figure 11 depict the comparison of the strategies in terms of potential air temperature reduction.
Table 5 and Figure 11 indicate that the maximum temperature could be decreased by 3.06 °C by implementing the strategies. In addition, the peak and lowest temperatures occur at 15:00 P.M. and 05:00 A.M. for all strategies, respectively. The decrease in temperature is higher between 00:00 A.M. and 05:00 A.M. in Case C since the evapotranspiration occurs in the vegetated areas as this situation is discussed in [55]. Moreover, the decrease in potential air temperature at night is sharper in the NBSs (Case C).

3.3. Building Energy Performance Results

The total energy consumption and thermal comfort simulations for the case building are conducted for 1 July 2022. Table 6 depicts the building energy performance results for the case building for all strategies.
The total energy consumption of the case building for Case A (current situation) is calculated as 0.811 kWh/m2day, while comfort hours are 11 h in a day. The second scenario simulated for the high-albedo materials on pavements and roads and total energy consumption of the case building decreased by 2.7% for this strategy. On the other hand, comfortablehours increased by 27.3% due to the decrease of the potential air temperature on the urban environment. The total energy consumption of the case building decreased by 3.7% for Case C, while the comfortable hours increased by 36.3% compared to the current situation (Case A). Lastly, insertion of the green roof along with changing the building façade materials (Case D) decreased the total energy consumption of the case building by 14.4% compared to Case A. Additionally, this strategy increased the comfortable hours by 54.5%. Overall, a reduction in total energy consumption and increase of comfortable hours are conducted in all strategies. Total energy consumption and comfortable-hours data, which are taken from the building energy performance simulations, are then used in the calculation of the KEMIRA-M as internal factors.

3.4. KEMIRA-M Calculation Results

To provide better solutions to decision-makers in order to mitigate the effect of the UHI on energy performance and thermal comfort of the residential building, a multi-criteria decision-making tool, the KEMIRA-M model, is used in this study. The internal factors are selected as total energy consumption and thermal comfort and are taken as quantitative results from the building energy performance simulations. On the other hand, external factors are chosen from the literature, i.e., in [17], as capital cost, installation, flexibility, and lifetime, which are the most influencing factors that affect the decision on implementation of the strategies.
The problem, which will be solved in this study, is an optimization problem; hence, the optimization function is constructed as:
  • x1:“Total energy consumption” is needed to be the lowest one.
  • x2: “Thermal comfort” is needed to be the highest one.
  • y1: “Capital cost” is needed to be the lowest one.
  • y2: “Installation flexibility” is needed to be the lowest one.
  • y3: “Lifetime” is needed to be the highest one.
Table 6 represents the significance of the factors determined by the expert opinion results. The lower number in Table 7 means the higher priority of the corresponding criterion. For instance, the first expert indicates that x1 is the most influencing criteria in internal factors, while y1 is the most vital criteria among external factors.
Table 8 shows the initial decision matrix for four strategies in order to mitigate the effect of the UHI on energy performance of residential buildings. Instead of the capital cost of Case A (y1), which is zero, the one (1) value is taken in the decision matrix since the zero value could make the results zero before starting the calculations in the normalization process.
The normalized decision matrix is constructed using Equation (6) and is shown in Table 9. All criteria values are converted to [0, 1] fuzzy sets.
Weighted coefficients are calculated according to the Modified Indicator Rank Accordance method [30], and the priority of criteria is determined by the Kemeny Median method [30]. Therefore, the 2 and 3 permutations are calculated for internal and external factors, respectively. Table 10 indicates the final rankings of the strategies in the study obtained from the sum of X w i C + Y w i ( C ) . The larger value is calculated as 1.116 for the fourth alternative, while the minimum is found as 0.761 for the second alternative.
Table 9 shows the rankings of the four strategies are Case C > Case D > Case A > Case B. According to the calculation results, Case C, which includes implementation of NBSs, is the most preferable alternative. Although energy performance and micro-climate simulations pointed out that the most effective solution is Case D (changing building façade materials, including green roof implementation), integrating other factors, such as capital cost, lifetime, and installation flexibility, moved Case C to the first place. Changing building materials for the case zone is not cost effective and is quite time consuming for implementation. On the other hand, considering the cooling effect of the vegetation in summer, particularly in temperate climate zone, implementation of the vegetation could be a reasonable solution for mitigating the effect of the UHI on the energy performance of the residential buildings. One of the interesting results of the KEMIRA-M calculation is the ranking of Case A (current situation) as the third alternative. The capital cost of the current situation is zero; thus, this external factor affects the decision-making process. Another reason could be that the reduction in energy consumption is low (2.7% of energy saving) for the fourth alternative (Case B) compared to the current situation (Case A). On the other hand, the expert reports mostly indicate that the total energy consumption is the most influencing internal factor on the ranking of the alternatives, as represented in Table 7. Therefore, the small energy saving potential of Case B can be neglected beside the other factors compared to the current situation on the decision-making processes. On the other hand, combining all strategies may be a better alternative for decreasing energy consumption and maximizing thermal comfort; however, the capital cost will be high. Moreover, the combination of greenery and usage of cool materials would be preferable to reduce potential air temperature in micro-climatic simulations. On the other hand, decision-makers should take other criteria, i.e., lifetime and costs, into account while making the decision to mitigate the UHI effect on building energy performance.
In this study, Envi-Met and DesignBuilder and the KEMIRA-M tool are used as micro-climatic and dynamic building energy simulations and a multi-criteria decision-making tool, respectively. However, one can utilize any other tools behind the framework.
Some limitations can also be drawn in this section. This study only considers the potential air temperature in micro-climate simulations. However, some researchers indicate that some other meteorological factors, such as wind speed, mean radiant temperature, and relative humidity, could affect the energy performance of the buildings [50,51,53]. Further studies will focus on integrating all factors in the decision-making process. The case study is conducted in a temperate climate zone where cooling energy demand could be higher than the heating energy demand [56]. Therefore, summer conditions are concentrated in this study. However, further studies should also focus on the effect of the considered strategies on heating energy consumption. On the other hand, considering that the micro-climate simulations, i.e., Envi-Met, requires straight and perpendicular lines on modelling streets and trees, the model should be integrated in the software in detail. However, modelling detailed components in the software and simulating all the strategies are computational heavy. Therefore, a basic urban zone with straight and perpendicular lines is selected for this study. Finally, the boundary of the simulation is too close to the buildings for this study. Therefore, this may lead to unstable airflow, reducing the accuracy of obtaining potential air temperature.

4. Conclusions

One of the primary targets of this study was to select a strategy by integrating micro-climate and building energy performance simulations and a multi-criteria decision-making tool on mitigating the effect of the UHI on energy performance of residential buildings. To this aim, an urban area in İzmir/Türkiye, which has temperate climate zone characteristics, was studied as a case study. The multi-criteria decision-making tool integrated the results of micro-climate and building energy performance simulations, and the decision of the selection among alternatives was conducted by utilizing the KEMIRA-M model. The criteria were divided into two main groups as internal (total energy consumption and thermal comfort) and external factors (capital cost, installation flexibility, and lifetime).
The integrated decision-making framework that resulted showed that the provided strategy to mitigate the UHI effect on energy performance of the case study was applying NBSs, such as green roofs and changing existing trees with high leaf area density ones (Case C). Moreover, NBSs also improve outdoor thermal comfort with their shading effect. Considering the building energy performance is highly affected by temperature rise caused by the UHI, the result of this study may become a vital issue to develop sustainable urban zones. Furthermore, engineers, architects, and urban planners may use integrated frameworks, such as in this study, in decision-making processes.

Author Contributions

Conceptualization, C.T., A.S.A., and G.G.A.; methodology, C.T. and A.S.A.; software, C.T.; validation, C.T. and G.G.A.; formal analysis, C.T.; investigation, C.T. and A.S.A.; resources, G.G.A.; data curation, C.T., A.S.A., and C.T.; writing—original draft preparation, C.T.; writing—review and editing, C.T. and G.G.A.; visualization, C.T.; supervision, C.T. and G.G.A.; project administration, G.G.A.; funding acquisition, G.G.A. All authors have read and agreed to the published version of the manuscript.

Funding

This research was funded by Urban GreenUP project which has received funding from the European Union’s Horizon 2020 research and innovation programme under grant agreement No 730426. The APC was funded by the same programme.

Institutional Review Board Statement

Not applicable.

Informed Consent Statement

Not applicable.

Data Availability Statement

Not applicable.

Acknowledgments

This publication has received funding from the European Union’s Horizon 2020 research and innovation programme under grant agreement No. 730426 (Urban GreenUP).

Conflicts of Interest

The authors declare no conflict of interest.

References

  1. IEA. Energy Technology Perspectives 2020—Special Report on Clean Energy Innovation. Available online: https://www.iea.org/reports/energy-technology-perspectives-2020 (accessed on 25 April 2023).
  2. Turhan, C.; Atalay, A.S.; Akkurt, G.G. Green Smart Cities: Living Healthily with Every Breath. In Proceedings of the 7th International Istanbul Smart Grids and Cities Congress and Fair (ICSG), İstanbul, Türkiye, 25 April 2019. [Google Scholar]
  3. United States Environmental Protection Agency. Available online: https://www.epa.gov/heatislands#:~:text=Heat%20islands%20are%20urbanized%20areas,as%20forests%20and%20water%20bodies (accessed on 25 April 2023).
  4. Battista, G.; Evangelisti, L.; Guattari, C.; Roncone, M.; Balaras, C.A. Space-time estimation of the urban heat island in Rome (Italy): Overall assessment and effects on the energy performance of buildings. Build Environ. 2023, 228, 109878. [Google Scholar] [CrossRef]
  5. UNEP. Global Status Report for Buildings and Construction: Towards a Zero-Emission, Efficient and Resilient Buildings and Construction Sector. Available online: https://wedocs.unep.org/bitstream/handle/20.500.11822/34572/GSR_ES.pdf?sequence=3&isAllowed=y (accessed on 20 April 2023).
  6. Romano, P.; Prataviera, E.; Carnieletto, L.; Vivian, J.; Zinzi, M.; Zarrella, A. Assessment of the Urban Heat Island Impact on Building Energy Performance at District Level with the EUReCA Platform. Climate 2021, 9, 48. [Google Scholar] [CrossRef]
  7. Li, X.; Zhou, Y.; Yu, S.; Jia, G.; Li, H.; Li, W. Urban heat island impacts on building energy consumption: A review of approaches and findings. Energy 2019, 174, 407–419. [Google Scholar] [CrossRef]
  8. De Santolini, L.; Fraticelli, F.; Fornari, F.; Calice, C. Energy performance assessment and a retrofit strategies in public school buildings in Rome. Energy Build. 2014, 68 Pt A, 196–202. [Google Scholar] [CrossRef]
  9. Jige, S.; Li, C. Urban form and building energy use: A systematic review of measures, mechanisms, and methodologies. Renew. Sustain. Energy Rev. 2021, 139, 110662. [Google Scholar] [CrossRef]
  10. Aleksandrowicz, O.; Vuckovic, M.; Kiesel, K.; Mahdavi, A. Current trends in urban heat island mitigation research: Observations based on a comprehensive research repository. Urban Clim. 2017, 21, 1–26. [Google Scholar] [CrossRef]
  11. Battista, G.; Pastore, E.M. Using cool pavements to mitigate urban temperatures in a case study of Rome (Italy). Energy Procedia 2017, 113, 98–107. [Google Scholar] [CrossRef]
  12. Sedaghat, A.; Sharif, M. Mitigation of the impacts of heat islands on energy consumption in buildings: A case study of the city of Tehran, Iran. Sustain. Cities Soc. 2022, 76, 103435. [Google Scholar] [CrossRef]
  13. Seletković, A.; Kičić, M.; Ančić, M.; Kolić, J.; Pernar, R. The Urban Heat Island Analysis for the City of Zagreb in the Period 2013–2022 Utilizing Landsat 8 Satellite Imagery. Sustainability 2023, 15, 3963. [Google Scholar] [CrossRef]
  14. Makvandi, M.; Li, W.; Ou, X.; Chai, H.; Khodabakhshi, Z.; Fu, J.; Yuan, P.F.; Horimbere, E.D.L.J. Urban Heat Mitigation towards Climate Change Adaptation: An Eco-Sustainable Design Strategy to Improve Environmental Performance under Rapid Urbanization. Atmosphere 2023, 14, 638. [Google Scholar] [CrossRef]
  15. Ullah, N.; Siddique, M.A.; Ding, M.; Grigoryan, S.; Khan, I.A.; Kang, Z.; Tsou, S.; Zhang, T.; Hu, Y.; Zhang, Y. The Impact of Urbanization on Urban Heat Island: Predictive Approach Using Google Earth Engine and CA-Markov Modelling (2005–2050) of Tianjin City, China. Int. J. Environ. Res. Public Health 2023, 20, 2642. [Google Scholar] [CrossRef]
  16. ASHRAE 55-2020; Thermal Environmental Conditions for Human Occupancy. American Society of Heating, Refrigerating and Air-Conditioning Engineers (ASHRAE): Atlanta, GA, USA, 2020.
  17. Baç, U.; Alaloosi, K.A.M.S.D.; Turhan, C. A comprehensive evaluation of the most suitable HVAC system for an industrial building by using a hybrid building energy simulation and multi criteria decision making framework. J. Build. Eng. 2021, 37, 102153. [Google Scholar] [CrossRef]
  18. Moghtadernejad, S.; Chouinard, L.E.; Mirza, M.S. Design strategies using multi criteria decision-making tools to enhance the performance of building façades. J. Build. Eng. 2020, 30, 101274. [Google Scholar] [CrossRef]
  19. Büyüközkan, G.; Güleryüz, S. Evaluation of renewable energy resources in Turkey using an integrated MCDM approach with linguistic interval fuzzy preference relations. Energy 2017, 123, 149–163. [Google Scholar] [CrossRef]
  20. Wibowo, S.; Grandhi, S. Fuzzy multicriteria analysis for performance evaluation of internet-of-things-based supply chains. Symmetry 2018, 10, 603. [Google Scholar] [CrossRef] [Green Version]
  21. Furtado, P.A.X.; Sola, A.V.H. Fuzzy Complex Proportional Assessment Applied in Location Selection for Installation of Photovoltaic Plants. Energies 2020, 13, 6260. [Google Scholar] [CrossRef]
  22. Abdulkareem, K.H.; Al-Mhiqani, M.N.; Dinar, A.M.; Mohammed, M.A.; Al-Imari, M.J.; Al-Waisy, A.S.; Alghawli, A.S.; Al-Qaness, M.A.A. MEF: Multidimensional Examination Framework for Prioritization of COVID-19 Severe Patients and Promote Precision Medicine Based on Hybrid Multi-Criteria Decision-Making Approaches. Bioengineering 2022, 9, 457. [Google Scholar] [CrossRef] [PubMed]
  23. Morfoulaki, M.; Papathanasiou, J. Use of PROMETHEE MCDA Method for Ranking Alternative Measures of Sustainable Urban Mobility Planning. Mathematics 2021, 9, 602. [Google Scholar] [CrossRef]
  24. Kafandaris, S. ELECTRE and Decision Support: Methods and Applications in Engineering and Infrastructure Investment. J. Oper. Res. Soc. 2002, 53, 1396–1397. [Google Scholar] [CrossRef]
  25. Zhao, T.; Lin, J.; Zhang, Z. Case-Based Reasoning and Attribute Features Mining for Posting-Popularity Prediction: A Case Study in the Online Automobile Community. Mathematics 2022, 10, 2868. [Google Scholar] [CrossRef]
  26. Dahooie, J.H.; Zavadskas, E.K.; Abolhasani, M.; Vanaki, A.; Turskis, Z. A Novel Approach for Evaluation of Projects Using an Interval–Valued Fuzzy Additive Ratio Assessment (ARAS) Method: A Case Study of Oil and Gas Well Drilling Projects. Symmetry 2018, 10, 45. [Google Scholar] [CrossRef] [Green Version]
  27. Guo, J.; Xiang, P.; Lee, Y. Analyzing and Controlling Construction Engineering Project Gray Rhino Risks with Innovative MCDM Methods: Interference Fuzzy Analytical Network Process and Decision-Making Trial and Evaluation Laboratory. Appl. Sci. 2022, 12, 5693. [Google Scholar] [CrossRef]
  28. Dinçer, H.; Yüksel, S.; Aksoy, T.; Hacıoğlu, Ü. Application of M-SWARA and TOPSIS Methods in the Evaluation of Investment Alternatives of Microgeneration Energy Technologies. Sustainability 2022, 14, 6271. [Google Scholar] [CrossRef]
  29. de Assis, G.S.; dos Santos, M.; Basilio, M.P. Use of the WASPAS Method to Select Suitable Helicopters for Aerial Activity Carried Out by the Military Police of the State of Rio de Janeiro. Axioms 2023, 12, 77. [Google Scholar] [CrossRef]
  30. Krylovas, A.; Zavadskas, E.K.; Kosareva, N.; Dadelo, S. New KEMIRA Method for Determining Criteria Priority and Weights in Solving MCDM Problem. Int. J. Inf. Technol. Decis. 2014, 13, 1119–1133. [Google Scholar] [CrossRef]
  31. Kosareva, N.; Zavadskas, E.K.; Krylovas, A.; Dadelo, S. Personnel ranking and selection problem solution by application of KEMIRA method. Int. J. Comput. Commun. 2016, 11, 51–66. [Google Scholar] [CrossRef]
  32. Baker, D.; Bridges, D.; Hunter, R.; Johnson, G.; Krupa, J.; Murphy, J.; Sorenson, K. Guidebook to Decision-Making Methods, 1st ed.; Westinghouse Savannah River Company: North Augusta, SC, USA, 2001.
  33. Elkhayat, Y.O.; Ibrahim, M.G.; Tokimatsu, K.; Ali, A.A.M. Multi-criteria selection of high-performance glazing systems: A case study of an office building in New Cairo, Egypt. J. Build. Eng. 2020, 32, 101466. [Google Scholar] [CrossRef]
  34. Beltran, R.D.; Martines-Gomez, J. Analysis of phase change materials (PCM) for building wallboards based on the effect of environment. J. Build. Eng. 2019, 24, 100726. [Google Scholar] [CrossRef]
  35. Kış, Ö.; Can, G.F.; Toktaş, P. Warehouse Location selection for an electricity distribution company by KEMIRA-M method. Pamukkale Univ. J. Eng. Sci. 2020, 26, 227–240. [Google Scholar] [CrossRef] [Green Version]
  36. Pandey, A.K.; Singh, S.; Berwal, S.; Kumar, D.; Pandey, P.; Prakash, A.; Lodhi, N.; Maithani, S.; Jain, V.K.; Kumar, K. Spatio—Temporal variations of urban heat island over Delhi. Urban Clim. 2014, 10, 119–133. [Google Scholar] [CrossRef]
  37. Acosta, M.P.; Vahdattikhaki, F.; Santos, J.; Hammad, A.; Doree, A.G. How to bring UHI to the urban planning table? A data-driven modeling approach. Sustain. Cities Soc. 2021, 71, 102948. [Google Scholar] [CrossRef]
  38. Qui, J.; Ding, L.; Lim, S. A Decision-Making Framework to Support Urban Heat Mitigation by Local Governments. Resour. Conserv. Recycl. 2022, 184, 106420. [Google Scholar] [CrossRef]
  39. Qui, J.; Ding, L.; Lim, S. Application of a decision-making framework for multi-objective optimisation of urban heat mitigation strategies. Urban Clim. 2023, 47, 101372. [Google Scholar] [CrossRef]
  40. Urban GreenUP Project, the European Union’s Horizon 2020 Research and Innovation Programme, Grant Agreement No. 730426. Available online: https://urbangreenup.eu (accessed on 14 February 2023).
  41. Envi-Met: A Holistic Microclimate Model. Available online: https://envi-met.info/doku.php?id=files:start (accessed on 20 March 2022).
  42. DesignBuilder. DesignBuilder-Building Simulation Software. Available online: http://designbuilder.co.uk/ (accessed on 15 March 2022).
  43. Turkish Statistical Institute. Available online: https://data.tuik.gov.tr/Bulten/Index?p=45500 (accessed on 14 February 2023).
  44. Yılmaz, E.; Çiçek, İ. Detailed Köppen-Geiger climate regions of Turkey—Türkiye’nin detaylandırılmış Köppen-Geiger iklim bölgeleri. J. Hum. Sci. 2018, 15, 225–242. [Google Scholar] [CrossRef] [Green Version]
  45. Turkish State Meteorological Service. Available online: https://mgm.gov.tr/tahmin/il-ve-ilceler.aspx?il=IZMIR (accessed on 14 February 2023).
  46. HOBO RX3000—Outdoor Remote Monitoring Station. Available online: https://www.hobodataloggers.com.au/rx3000 (accessed on 15 March 2022).
  47. UrbanGreenUP Izmir. Available online: https://experience.arcgis.com/experience/63d33ec3dc6e435b8699aa30fb95f91a (accessed on 1 June 2023).
  48. Özbey, M.F.; Turhan, C. A Case Study on the Assumption of Mean Radiant Temperature Equals to Indoor Air Temperature in a Free-Running Building. Kocaeli J. Sci. Eng. 2021, 4, 79–85. [Google Scholar] [CrossRef]
  49. Jierula, A.; Wang, S.; OH, T.-M.; Wang, P. Study on Accuracy Metrics for Evaluating the Predictions of Damage Locations in Deep Piles Using Artificial Neural Networks with Acoustic Emission Data. Appl. Sci. 2021, 11, 2314. [Google Scholar] [CrossRef]
  50. Sanjuán, M.Á.; Morales, Á.; Zaragoza, A. Effect of Precast Concrete Pavement Albedo on the Climate Change Mitigation in Spain. Sustainability 2021, 13, 11448. [Google Scholar] [CrossRef]
  51. Sen, S.; Roesler, J.; Ruddell, B.; Middel, A. Cool Pavement Strategies for Urban Heat Island Mitigation in Suburban Phoenix, Arizona. Sustainability 2019, 11, 4452. [Google Scholar] [CrossRef] [Green Version]
  52. MIT News on Campus and Around the World. Available online: https://news.mit.edu/2021/countering-climate-change-cool-pavements-0822 (accessed on 24 April 2023).
  53. Bruse, M.; Fleer, H. Simulating surface–plant–air interactions inside urban environments with a three dimensional numerical model. Environ. Modell. Softw. 1998, 13, 373–384. [Google Scholar] [CrossRef]
  54. Cardoso, V.E.M.; Pereira, P.F.; Ramos, N.M.M.; Almeida, R.M.S.F. The Impacts of Air Leakage Paths and Airtightness Levels on Air Change Rates. Buildings 2020, 10, 55. [Google Scholar] [CrossRef] [Green Version]
  55. Yan, C.; Guo, Q.; Li, H.; Li, L.; Qiu, G.Y. Quantifying the cooling effect of urban vegetation by mobile traverse method: A local-scale urban heat island study in a subtropical megacity. Build. Environ. 2020, 169, 106541. [Google Scholar] [CrossRef]
  56. Remizov, A.; Memon, S.A.; Kim, J.R. Climate Zoning for Buildings: From Basic to Advanced Methods—A Review of the Scientific Literature. Buildings 2023, 13, 694. [Google Scholar] [CrossRef]
Figure 1. The general framework of the proposed model.
Sustainability 15 09674 g001
Figure 2. The location of İzmir/Türkiye (inset) and the case study area (VEZ) (red box).
Sustainability 15 09674 g002
Figure 3. Selected area (red box) for the micro-climate simulations.
Sustainability 15 09674 g003
Figure 4. An example image of the current situation.
Sustainability 15 09674 g004
Figure 5. The illustration of all strategies used in the study.
Sustainability 15 09674 g005
Figure 6. The case building for the simulations: (a) location; (b) view; (c) model.
Sustainability 15 09674 g006
Figure 7. Model of the selected area for micro-climate simulations.
Sustainability 15 09674 g007
Figure 8. Validation results of the micro-climate simulations.
Sustainability 15 09674 g008
Figure 9. Comparison of simulated and actual data for the validation process.
Sustainability 15 09674 g009
Figure 10. Potential temperature differences among all strategies: (a) Case A; (b) Case B; (c) Case C; and (d) Case D.
Sustainability 15 09674 g010aSustainability 15 09674 g010b
Figure 11. Air temperature comparison for all strategies.
Sustainability 15 09674 g011
Table 1. The specifications of the installed meteorological station used for micro-climatic simulations [46].
SpecificationsWind SpeedWind Direction
Measurement Range0 to 76 m/s (0 to 170 mph)0 to 355 degrees, 5-degree dead band
Accuracy±1.1 m/s (2.4 mph) or ±4% of reading, whichever is greater±5 degrees
Resolution0.5 m/s (1.1 mph)1.4 degrees
SpecificationsAir Temperature (Tair)Relative Humidity (RH)
Measurement Range−40 to 70 °C0 to 100% RH, −40 to 70 °C
Accuracy±0.25 °C from −40 to 0 °C±2.5% from 10% to 90% (typical) to a maximum of ±3.5% including hysteresis at 25 °C;
below 10% RH and above 90% RH ±5% typical
Resolution0.02 °C0.01%
Table 2. The startup parameters used in Envi-Met program.
Meteorological DataVegetation DataSoil DataGround Data
Relative humidity in 2 m = 41%
Wind speed in 10 m ab. ground = 2.24 m/s
Wind direction: 220°
Initial potential air temperature = 300 K
61 trees in various directions with 10 m heightImpervious soil = 0.00
Partially impervious soil = 0.30
Semi-impervious soil = 0.50
Green area without connection with natural soil = 0.50
Green area with connection to natural soil = 0.70
Green area on natural soil = 1.00
Loamy soil and pavements
Initial air temperature = 25.85 °C at 21% of relative humidity
Table 3. Building properties for energy performance and thermal comfort simulations.
EnvelopeLayersThickness
(m)
U
(W/m2K)
External wallsPlaster, brick, insulation0.410.238
RoofPlaster, brick, insulation0.240.236
FloorConcrete, gypsum mortar, insulation0.230.34
WindowsDouble glazed12 mm gap2.8
Table 4. The criteria used in the KEMIRA-M calculations.
Internal Factors UnitSource
X1Total energy consumptionkWh/m2dayDesignBuilder
X2Thermal comfortcomfortable- hours/dayDesignBuilder
External factors
Y1Capital costCalculated from current prices, including VAT
Y2Installation flexibility-Experts
Y3LifetimeyearExperts
Table 5. Comparison of different strategies in terms of micro-climate simulation.
StrategyImplementationMaximum-Minimum Potential Air Temperature
(°C)
Reduction
(%)
Reduction
(°C)
Case ACurrent Situation[30.73; 32.74]--
Case BChanging the low-albedo materials with high-albedo ones[29.75; 31.19]4.731.55
Case CNature-based solutions[28.04; 30.29]7.482.45
Case DChanging building façade materials with green roof implementation[27.06; 29.68]9.363.06
Table 6. Comparison of different strategies in terms of building energy performance simulation.
StrategiesTotal Energy Consumption
(kWh/m2day)
Thermal Comfort
(Comfortable-hours/day)
Case A0.81111
Case B0.78914
Case C0.78115
Case D0.69417
Table 7. Significance of the factors.
Expert Numberx1x2y1y2y3
112132
212123
321213
Table 8. Initial decision matrix.
Strategiesx1x2y1y2y3
Case A0.81111111
Case B0.78914351,76433
Case C0.78115210,41024
Case D0.69417658,78842
Table 9. Normalized decision matrix.
Strategiesx1x2y1y2y3
Case A01100
Case B0.1653914170.3928571.32488 × 10−60.6660.333
Case C0.227840.244443.23469 × 10−60.3331
Case D10010.666
Table 10. Final ranking of alternatives.
Strategies X w i ( C ) Y w i ( C ) X w i C + Y w i ( C ) R a n k
Case A0.4500.3650.8153
Case B0.4440.3170.7614
Case C0.4380.6781.1161
Case D0.5130.5411.0542
Disclaimer/Publisher’s Note: The statements, opinions and data contained in all publications are solely those of the individual author(s) and contributor(s) and not of MDPI and/or the editor(s). MDPI and/or the editor(s) disclaim responsibility for any injury to people or property resulting from any ideas, methods, instructions or products referred to in the content.

