


Limited Response of Curve Safety Level to Friction Factor and Superelevation Variation under Repeated Traffic Loads


Abstract
:1. Introduction
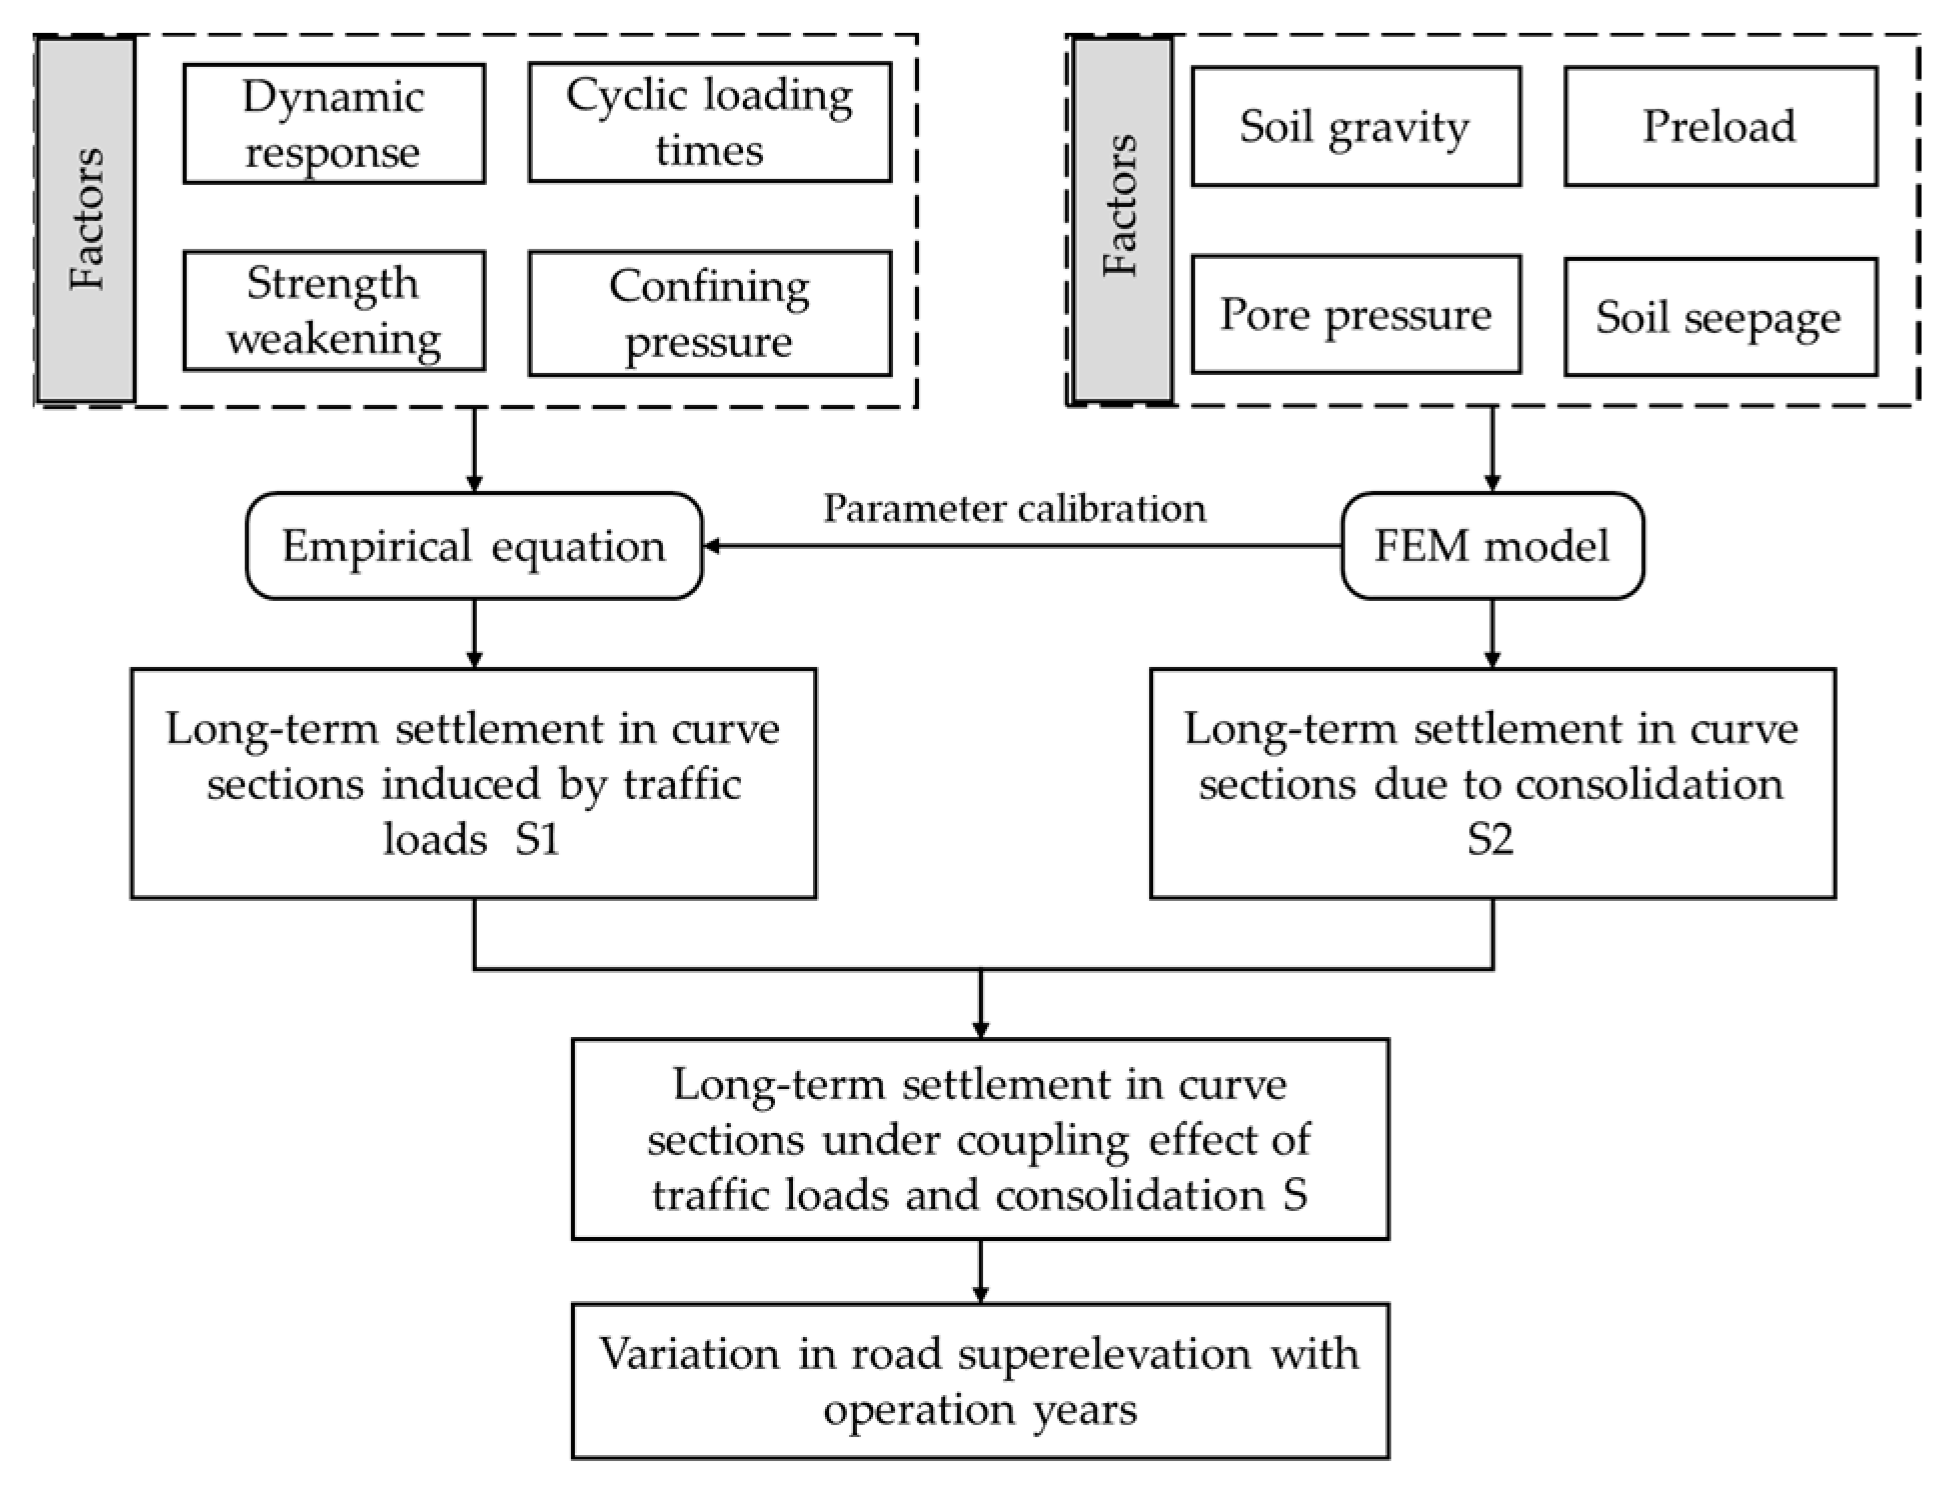
2. Methodology
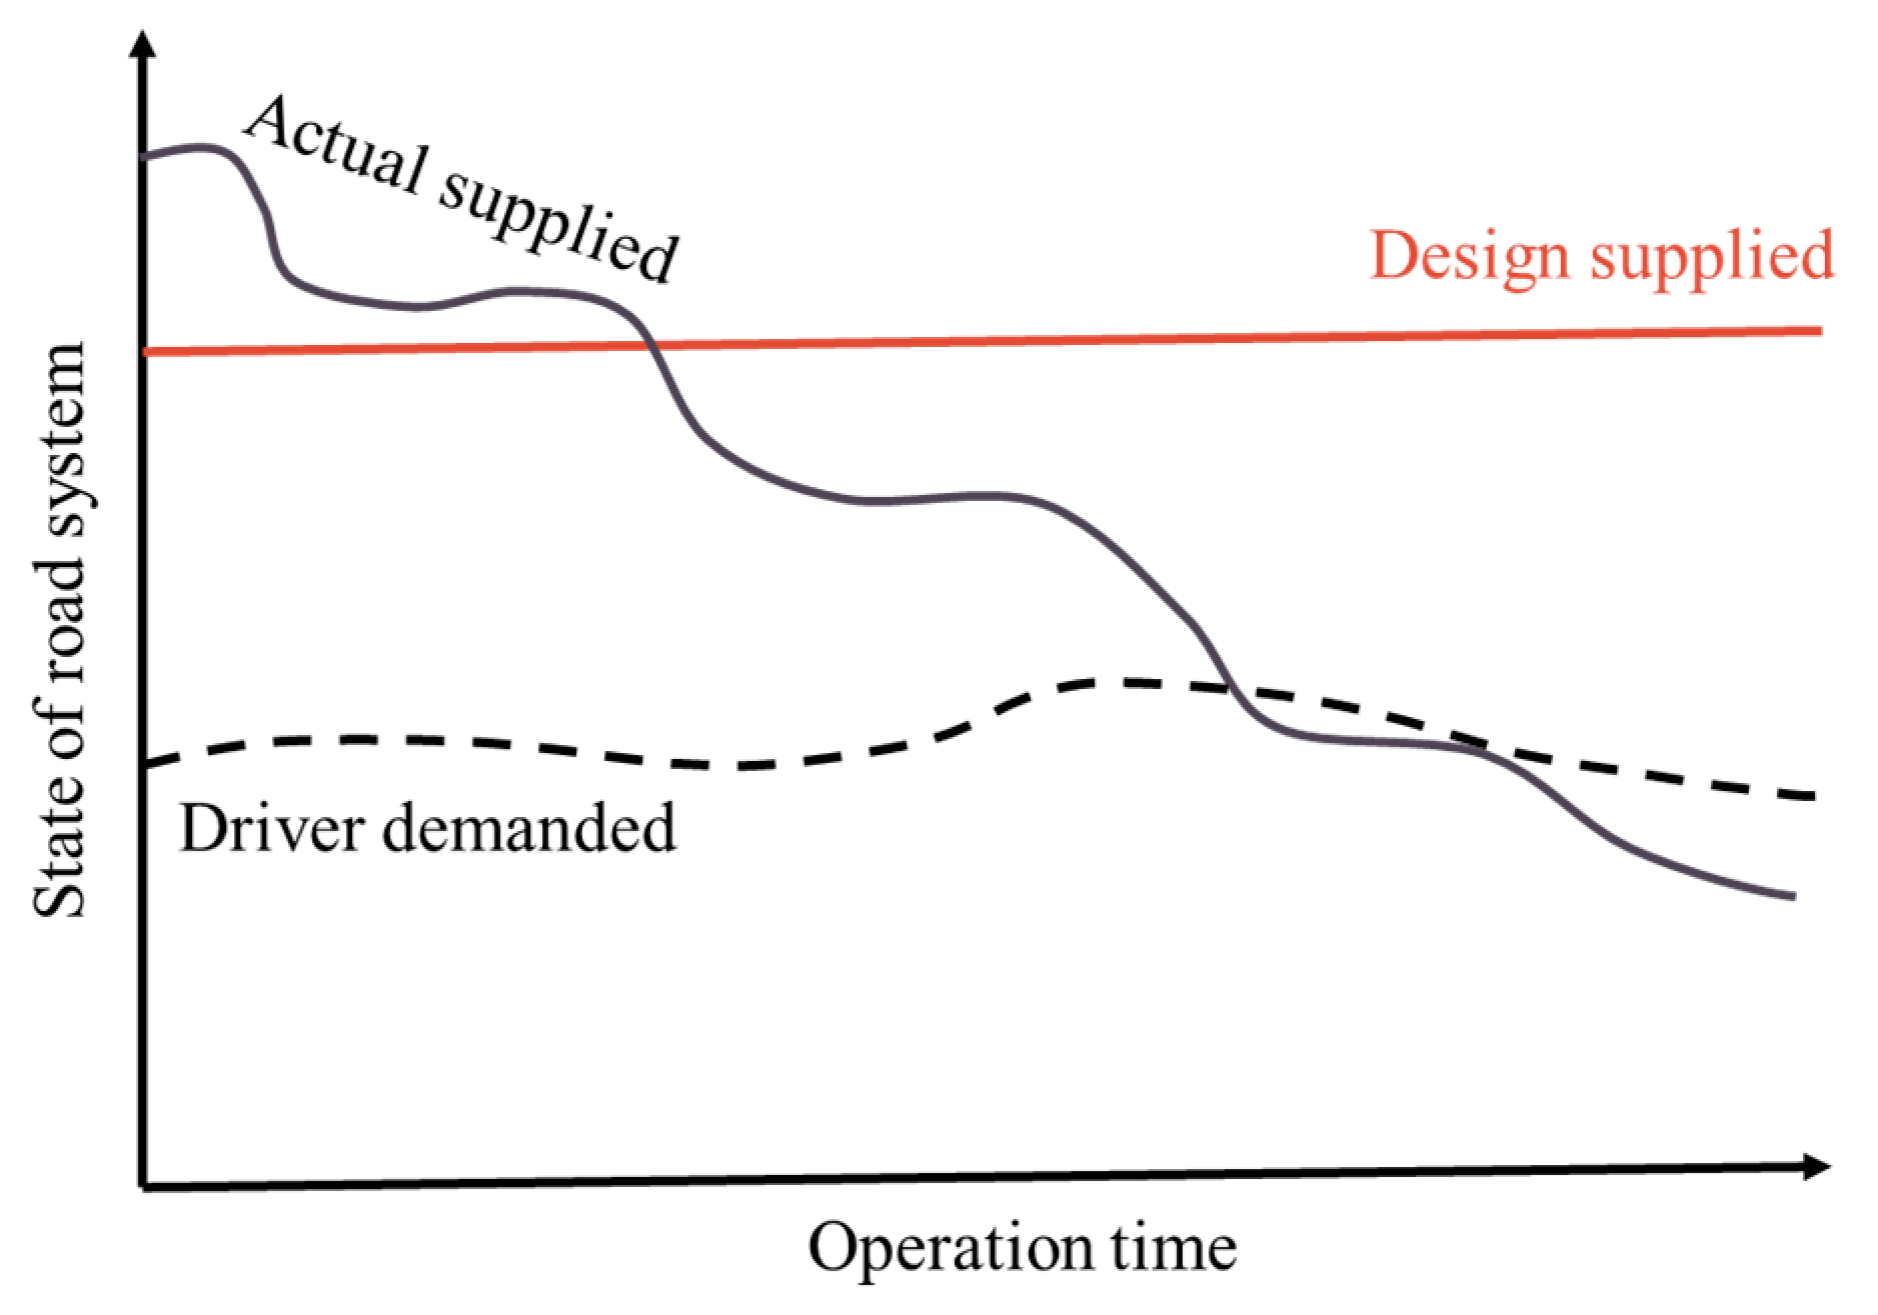
2.1. Curve Safety Level
2.2. Designed Curve Safety Level
2.3. Actual Curve Safety Level
2.3.1. Actual Supply of Lateral Friction Factor under Repeated Vehicle Loads
2.3.2. Variation in Superelevation under Repeated Vehicle Loads
2.3.3. Actual Demand of Lateral Friction Factor for Vehicles
3. Results
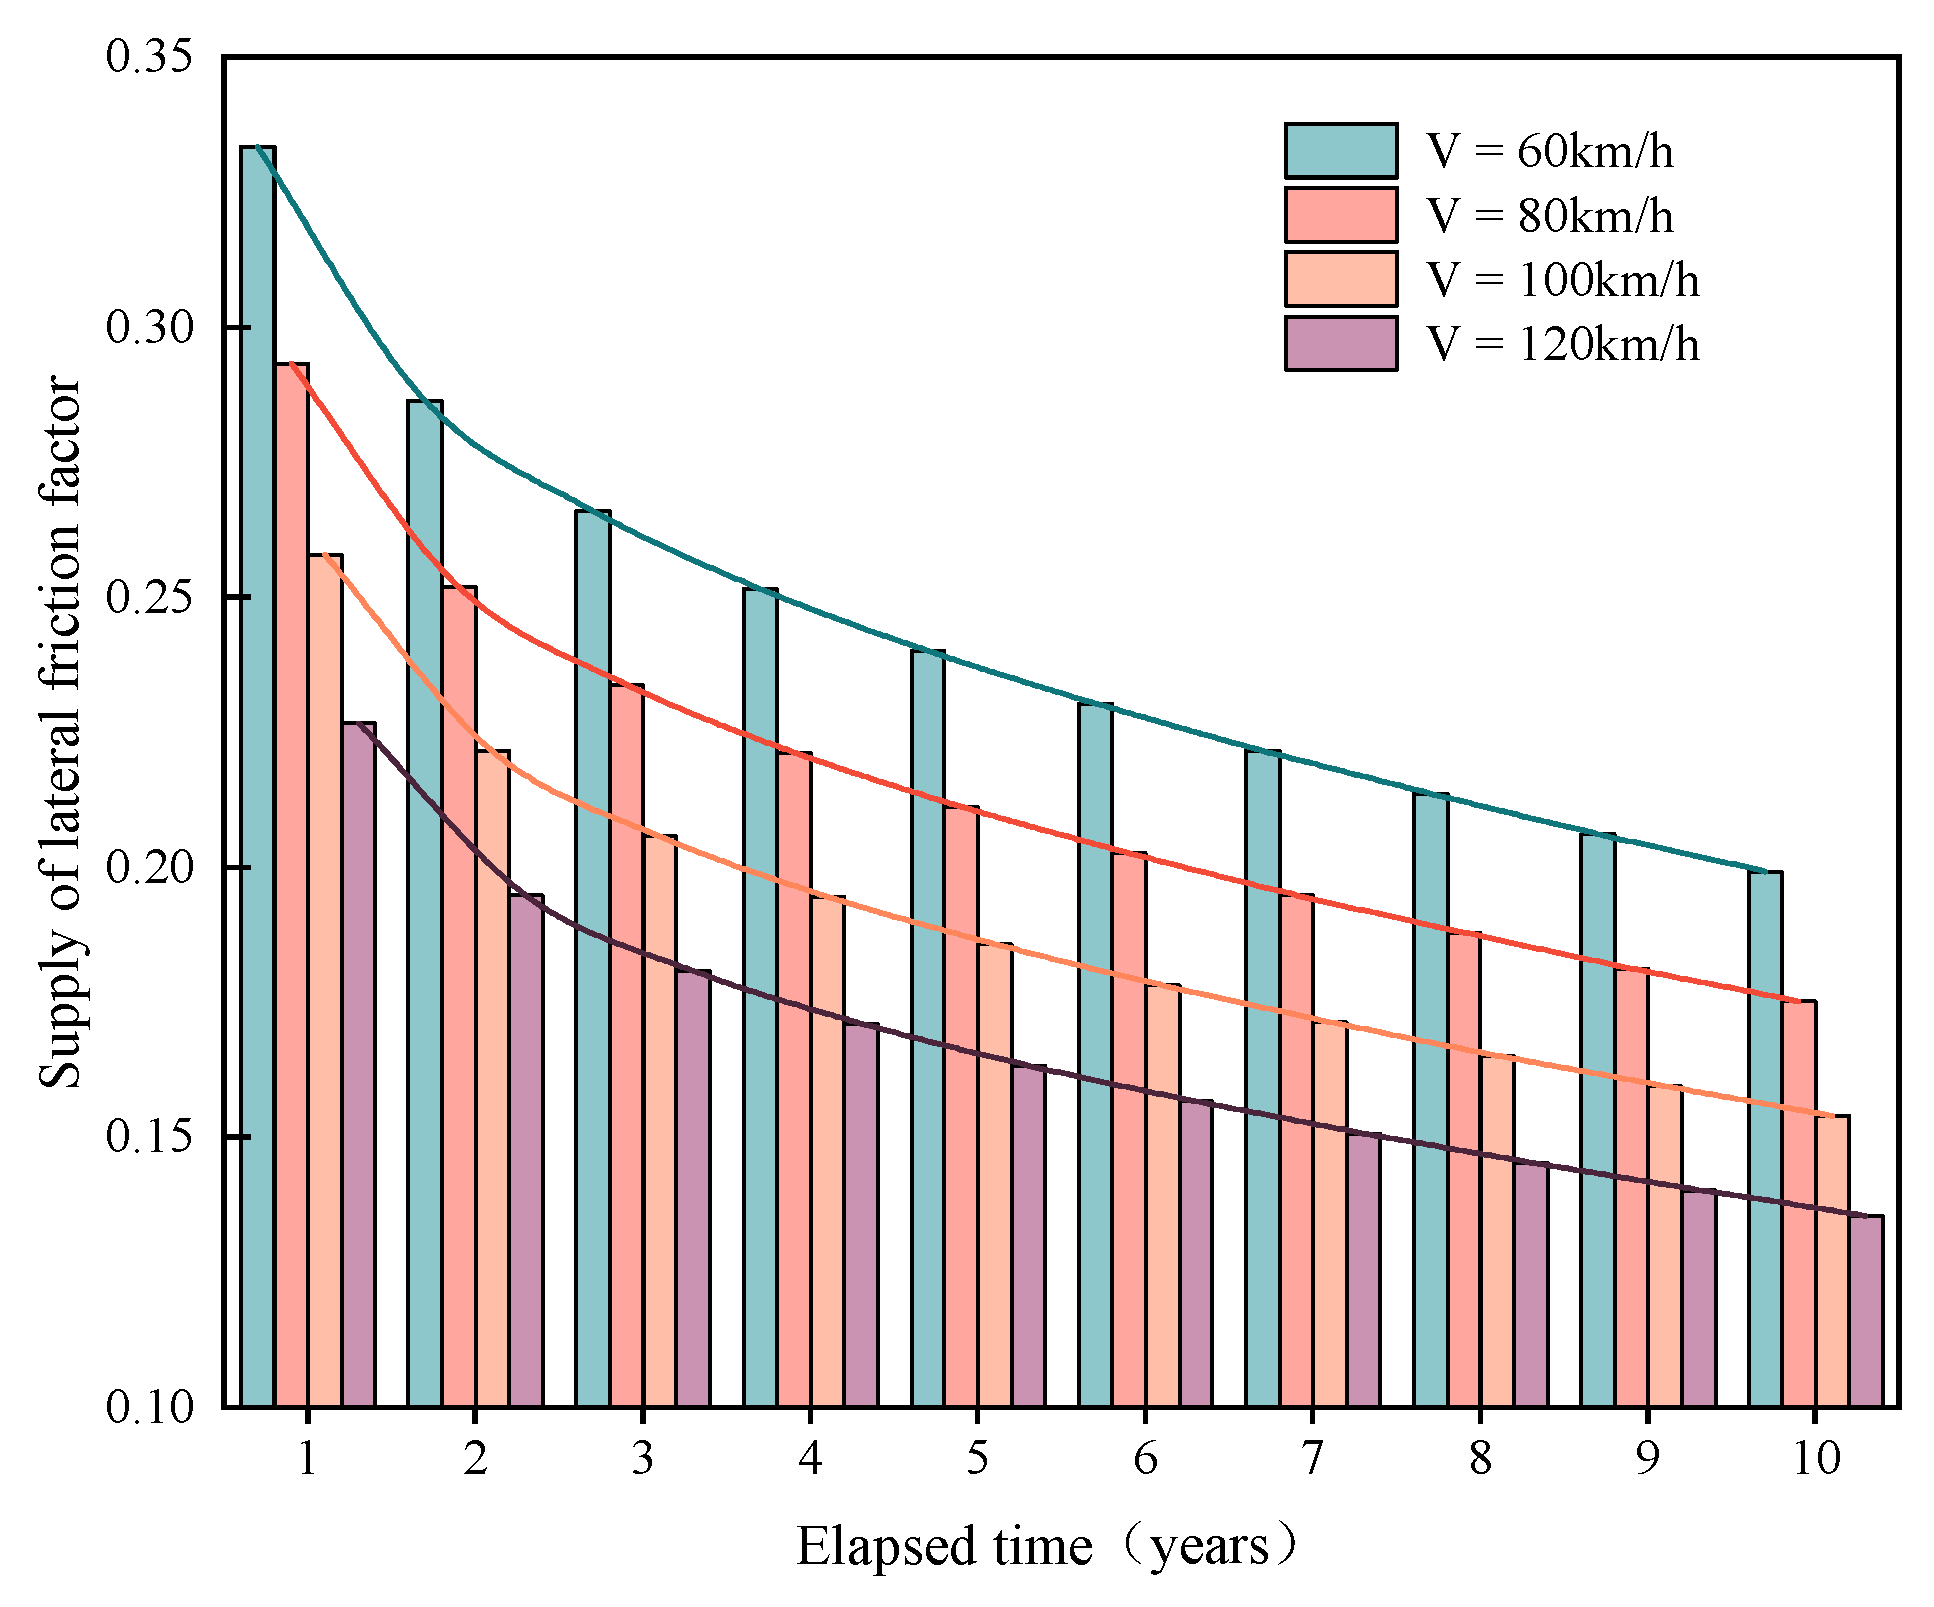
3.1. Supply of Friction Factor and Superelevation Variation Prediction
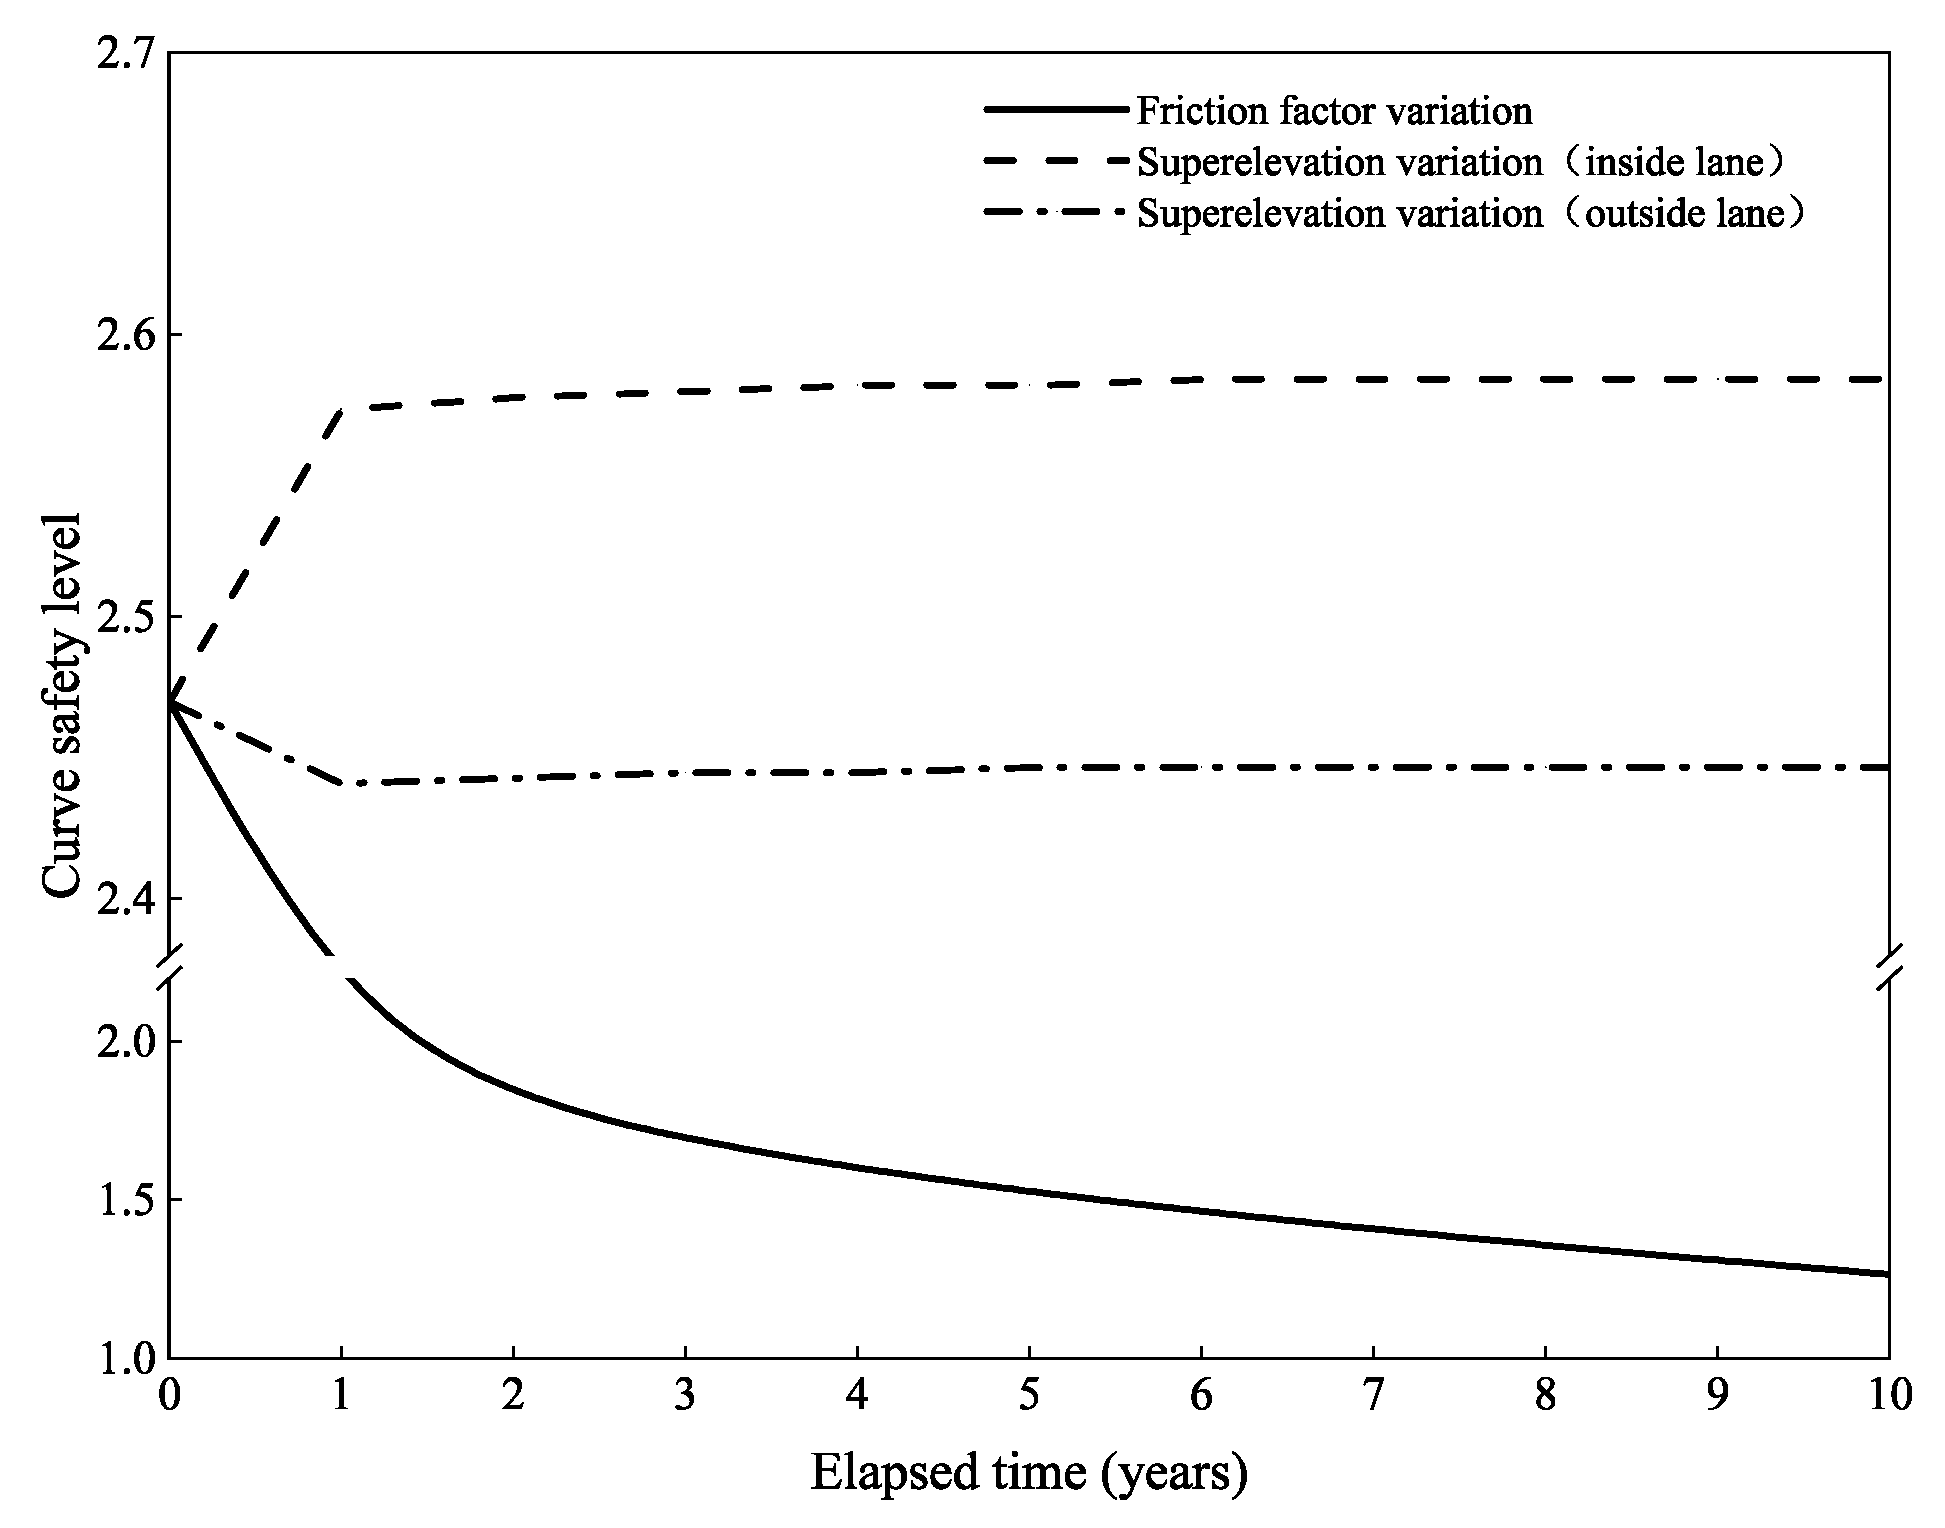
3.2. Impact of Friction Factor and Superelevation on Curve Safety Level
3.3. Impact of Vehicle Speed on Curve Safety Level
4. Discussion
5. Conclusions
- (1)
- Under repeated vehicle loads, the supply of the pavement friction factor, which serves as the primary factor influencing the curve safety level, decreases rapidly in the early stages of road deployment, followed by a deceleration in a declining trend. Meanwhile, the superelevation increases on the inside lane, while that of the outside lane decreases. This variation and its impact on the curve safety level remain significantly limited.
- (2)
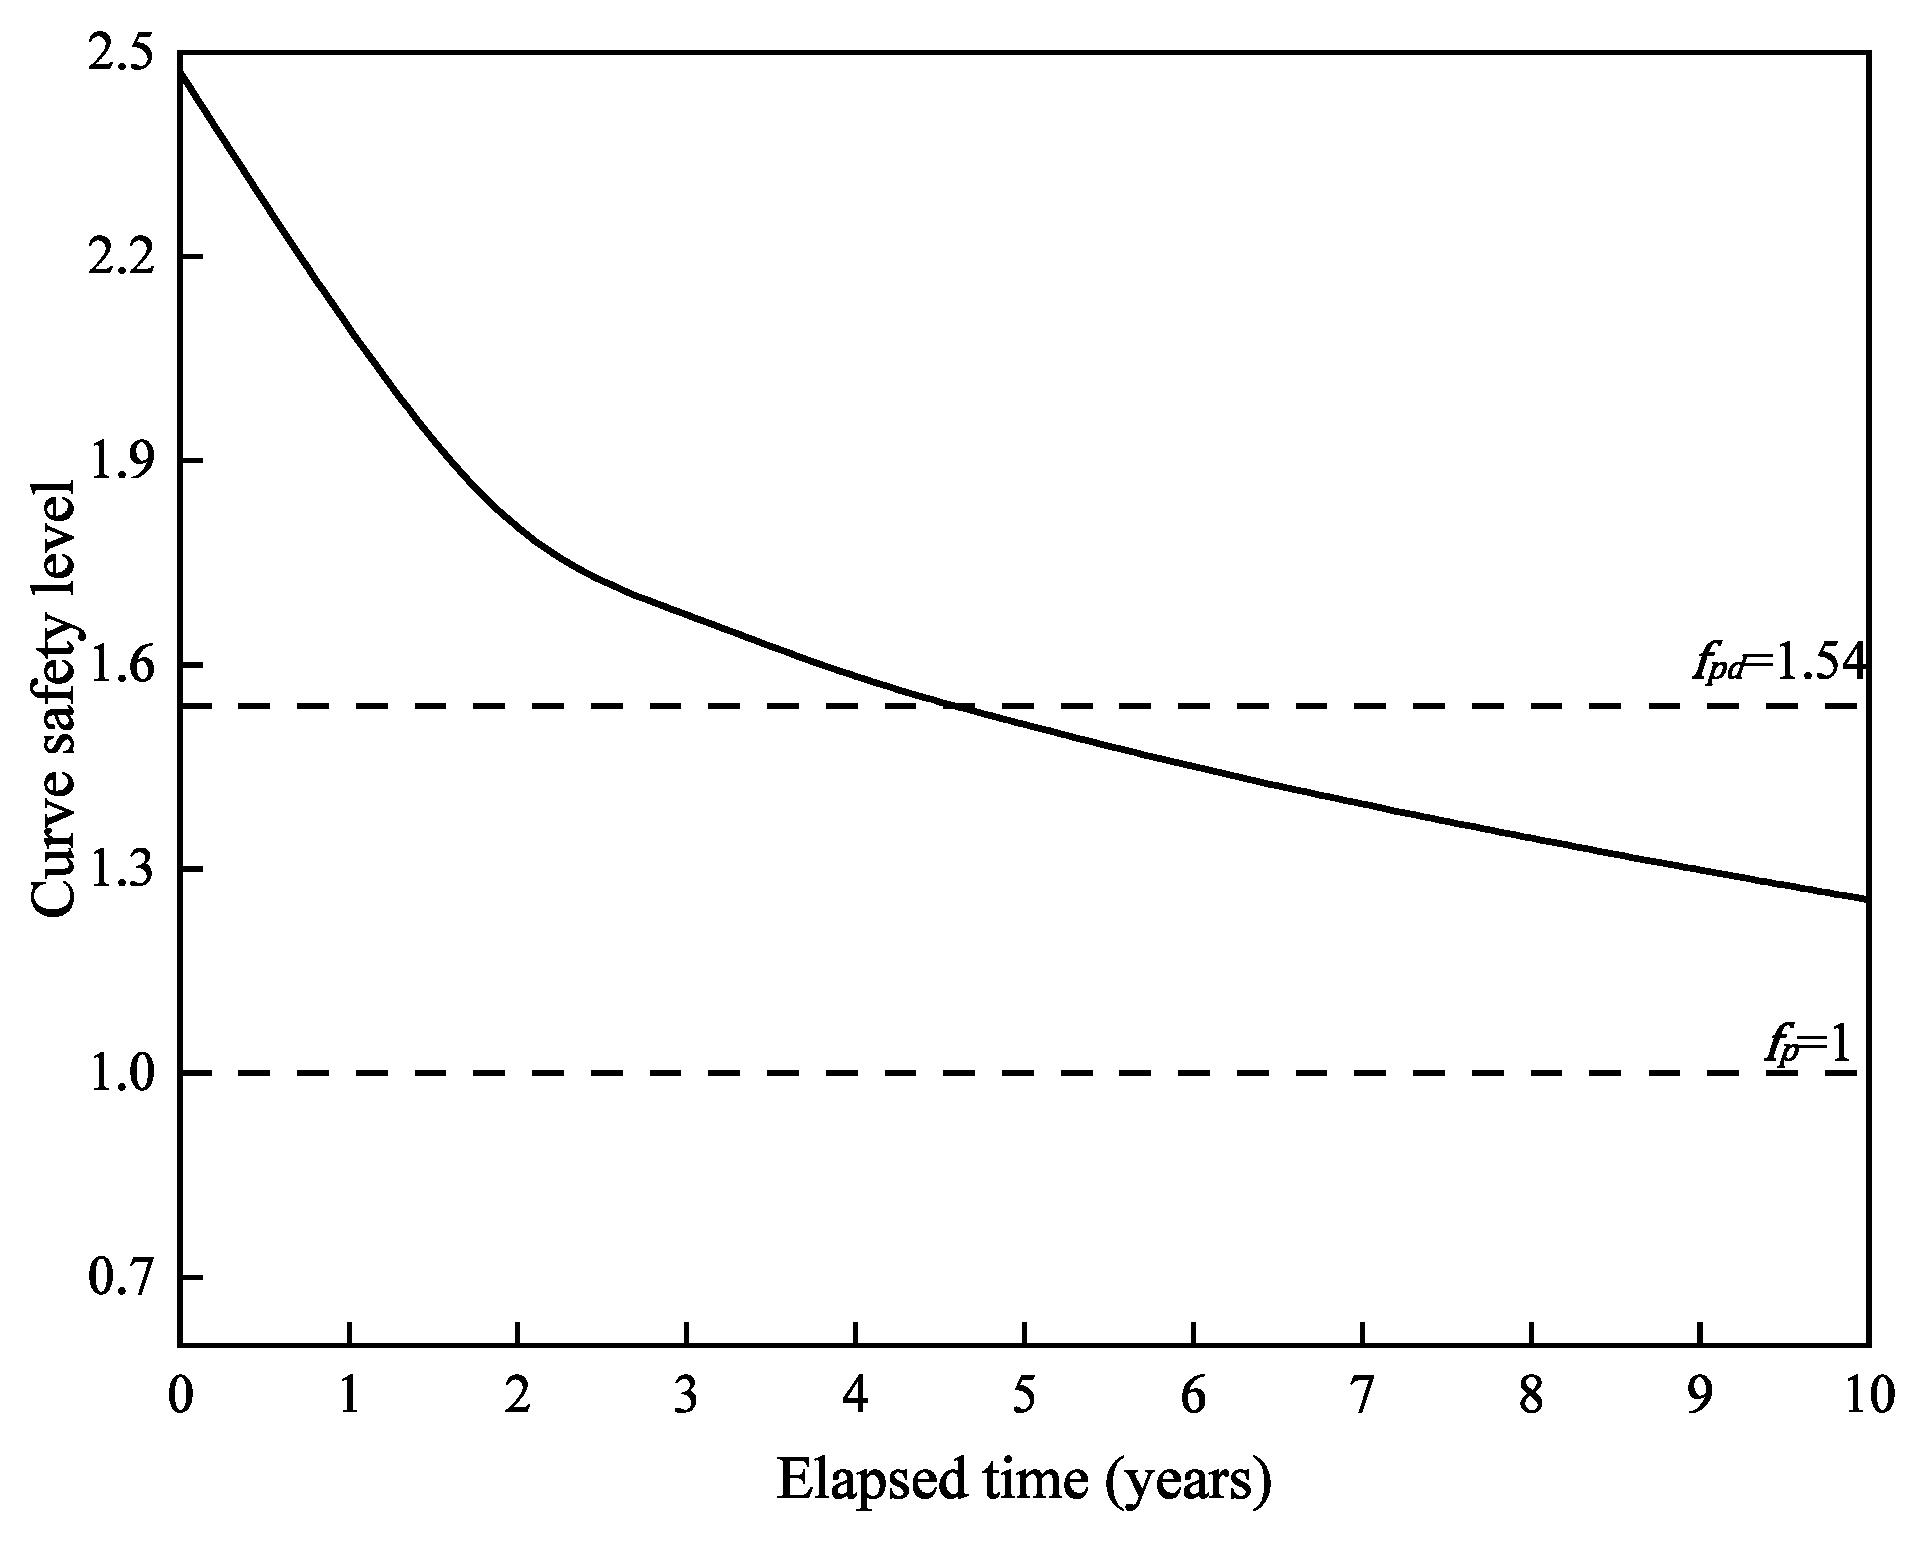
- The influence of pavement friction and superelevation variation on the curve safety level is reflected in the supply of the lateral friction factor. The curve safety level rapidly decreases within the first two years after road deployment, followed by a deceleration in a declining trend. Without any maintenance, the curve safety level will decrease by over 30% after four years of usage.
- (3)
- The impact of vehicle speed on the curve safety level is manifested in the demand for the lateral friction factor. As the vehicle speed increases, the demand for the lateral friction coefficient rises, thus reducing the curve safety level. The road’s overall capability to withstand over-speeding vehicles is compromised because of the pavement friction and superelevation variation caused by repeated vehicle loading. When drivers exceed the speed limit by 10 km/h, the curve safety level drops below 1 by the eighth year of operation. Exceeding the limit by 20 km/h results in the safety level dropping below 1 by the second year since deployment.
- (4)
- Strictly controlling operating speeds is one effective measure to enhancing the curve safety levels. However, the impact of pavement friction and superelevation variation on safety levels accumulates gradually. Under this scenario, drivers have difficulty perceiving these changes. As such, extensive attention should be given to pavement friction to ensure safe driving.
Author Contributions
Funding
Institutional Review Board Statement
Informed Consent Statement
Data Availability Statement
Conflicts of Interest
References
- World Health Organization. Global Status Report on Road Safety 2018; World Health Organization: Geneva, Switzerland, 2018. [Google Scholar]
- Yin, Y.; Wen, H.; Sun, L.; Hou, W. The Influence of Road Geometry on Vehicle Rollover and Skidding. Int. J. Environ. Res. Public Health 2020, 17, 1648. [Google Scholar] [CrossRef] [PubMed]
- Lamm, R.; Psarianos, B.; Mailaender, T. Highway Design and Traffic Safety Engineering Handbook; McGraw-Hill: New York, NY, USA, 1999. [Google Scholar]
- Lord, D.; Mannering, F. The Statistical Analysis of Crash-Frequency Data: A Review and Assessment of Methodological Alternatives. Transp. Res. Part Policy Pract. 2010, 44, 291–305. [Google Scholar] [CrossRef]
- Zhang, Y.; Li, H.; Sze, N.N.; Ren, G. Propensity Score Methods for Road Safety Evaluation: Practical Suggestions from a Simulation Study. Accid. Anal. Prev. 2021, 158, 106200. [Google Scholar] [CrossRef] [PubMed]
- Wang, X.; Liu, Q.; Guo, F.; Xu, X.; Chen, X. Causation Analysis of Crashes and near Crashes Using Naturalistic Driving Data. Accid. Anal. Prev. 2022, 177, 106821. [Google Scholar] [CrossRef] [PubMed]
- Larsson, P.; Dekker, S.W.; Tingvall, C. The Need for a Systems Theory Approach to Road Safety. Saf. Sci. 2010, 48, 1167–1174. [Google Scholar] [CrossRef]
- Shi, C.; Deng, Y.; Lin, Q.; Zhang, Y. Psychological Factors Analysis of Drivers’ Fatigued Driving Behavior Based on the Extended Theory of Planned Behavior. Saf. Environ. Eng. 2018, 25, 94–99. [Google Scholar] [CrossRef]
- Lamm, R.; Wolhuter, K.M.; Beck, A.; Rusher, T. Introduction of a New Approach to Geometric Design and Road Safety. In Proceedings of the SATC 2001, Pretoria, South Africa, 16–20 July 2001. [Google Scholar]
- Polus, A.; Mattar-Habib, C. New Consistency Model for Rural Highways and Its Relationship to Safety. J. Transp. Eng. 2004, 130, 286–293. [Google Scholar] [CrossRef]
- Llopis-Castelló, D.; Findley, D.J.; Camacho-Torregrosa, F.J.; García, A. Calibration of Inertial Consistency Models on North Carolina Two-Lane Rural Roads. Accid. Anal. Prev. 2019, 127, 236–245. [Google Scholar] [CrossRef]
- Zador, P.L.; Stein, H.; Hall, J.; Wright, P. Superelevation and Roadway Geometry: Deficiency at Crash Sites and on Grades. Transp. Res. Rec. 1985, 1026, 43–50. [Google Scholar]
- Pardillo Mayora, J.M.; Jurado Piña, R. An Assessment of the Skid Resistance Effect on Traffic Safety under Wet-Pavement Conditions. Accid. Anal. Prev. 2009, 41, 881–886. [Google Scholar] [CrossRef]
- Montella, A.; Imbriani, L.L.; Marzano, V.; Mauriello, F. Effects on Speed and Safety of Point-to-Point Speed Enforcement Systems: Evaluation on the Urban Motorway A56 Tangenziale Di Napoli. Accid. Anal. Prev. 2015, 75, 164–178. [Google Scholar] [CrossRef] [PubMed]
- Cafiso, S.; Montella, A.; D’Agostino, C.; Mauriello, F.; Galante, F. Crash Modification Functions for Pavement Surface Condition and Geometric Design Indicators. Accid. Anal. Prev. 2021, 149, 105887. [Google Scholar] [CrossRef]
- Torbic, D.J.; O’Laughlin, M.K.; Harwood, D.W.; Bauer, K.M.; Bokenkroger, C.D.; Lucas, L.M.; Ronchetto, J.R.; Brennan, S.; Donnell, E.; Brown, A.; et al. Superelevation Criteria for Sharp Horizontal Curves on Steep Grades; Transportation Research Board: Washington, DC, USA, 2014. [Google Scholar]
- Lamm, R.; Psarianos, B.; Choueiri, E.; Soilemezoglou, G. A Practical Safety Approach to Highway Geometric Design International Case Studies: Germany, Greece, Lebanon, and the United States. Transp. Res. Circ. 1998, 9, 1–14. [Google Scholar]
- Do, M.-T.; Kane, M.; Tang, Z.; de Larrard, F. Physical Model for the Prediction of Pavement Polishing. Wear 2009, 267, 81–85. [Google Scholar] [CrossRef]
- Kane, M.; Zhao, D.; De-Larrard, F.; Do, M.-T. Laboratory Evaluation of Aggregate Polishing as a Function of Load and Velocity. Application to the Prediction of Damages on Skid Resistance of Road Surfaces Due to Trucks and Passenger Cars. Road Mater. Pavement Des. 2012, 13, 312–326. [Google Scholar] [CrossRef]
- Do, M.-T.; Tang, Z.; Kane, M.; de Larrard, F. Pavement Polishing—Development of a Dedicated Laboratory Test and Its Correlation with Road Results. Wear 2007, 263, 36–42. [Google Scholar] [CrossRef]
- Kane, M.; Do, M.T.; Piau, J.M. On the Study of Polishing of Road Surface under Traffic Load. J. Transp. Eng. 2010, 136, 45–51. [Google Scholar] [CrossRef]
- Hofko, B.; Kugler, H.; Chankov, G.; Spielhofer, R. A Laboratory Procedure for Predicting Skid and Polishing Resistance of Road Surfaces. Int. J. Pavement Eng. 2019, 20, 439–447. [Google Scholar] [CrossRef]
- Xu, G.; Xu, J.; Gao, C.; Sun, R.; Shan, H.; Ma, Y.; Ran, J. A Novel Safety Assessment Framework for Pavement Friction Evolution Due to Traffic on Horizontal Curves. Sustainability 2022, 14, 10714. [Google Scholar] [CrossRef]
- Olson, P.L.; Cleveland, D.E.; Fancher, P.S.; Schneider, L.W. Parameters Affecting Stopping Sight Distance; The University of Michigan Transportation Research Institute: Ann Arbor, MI, USA, 1984. [Google Scholar]
- Xu, M.; Chen, L.; Zeng, J.; Huang, X.; Xiao, G. Analysis on Mechanism of Foundation-embankment-pavement Cooperative Deformation Based on FEM. J. Highw. Transp. Res. Dev. 2019, 36, 33–39+74. [Google Scholar] [CrossRef]
- Zhao, L.; Yan, S. Study of uneven settlement and reinforcement measure of a roadbed on reclaimed soil foundation. CHINA Civ. Eng. J. 2012, 45, 176–183. [Google Scholar] [CrossRef]
- Liu, Z.; Zhang, J.; Zheng, Z.; Guan, C. Finite element analysis of two-dimensional Biot’s consolidation with Hansbo’s flow. Rock Soil Mech. 2018, 39, 4617–4626+4650. [Google Scholar] [CrossRef]
- Liu, W.; Shi, Z.; Zhang, D.; Qu, S. Long-term settlement calculation of structured soft clay foundation under traffic loading. J. Southeast Univ. Nat. Sci. Ed. 2018, 48, 726–735. [Google Scholar] [CrossRef]
- Xu, L.; Chen, Y.; Shang, Y.; Feng, D.; Ding, K. Long term settlement calculation of soft soil foundation under traffic load based on mechanical-empirical model. J. Chang. Univ. Nat. Sci. Ed. 2021, 41, 1–10. [Google Scholar] [CrossRef]
- Jia, M.; Xu, J.; Gao, C.; Mu, M.; E, G. Long-Term Cross-Slope Variation in Highways Built on Soft Soil under Coupling Action of Traffic Load and Consolidation. Sustainability 2023, 15, 33. [Google Scholar] [CrossRef]
- Varunjikar, T. Design of Horizontal Curves with Downgrades Using Low-Order Vehicle Dynamics Models. Master’s Thesis, The Pennsylvania State University, State College, PA, USA, 2011. [Google Scholar]
- Maljković, B.; Cvitanić, D. Improved Horizontal Curve Design Consistency Approach Using Steady-State Bicycle Model Combined with Realistic Speeds and Path Radii. J. Transp. Eng. Part Syst. 2022, 148, 04022069. [Google Scholar] [CrossRef]
- Lamm, R.; Choueiri, E.; Mailaender, T. Side Friction Demand Versus Side Friction Assumed for Curve Design on Two-Lane Rural Highways. Transp. Res. Rec. 1991, 1303, 11–21. [Google Scholar]
- Plati, C.; Pomoni, M. Impact of Traffic Volume on Pavement Macrotexture and Skid Resistance Long-Term Performance. Transp. Res. Rec. J. Transp. Res. Board 2019, 2673, 314–322. [Google Scholar] [CrossRef]


| Design Speed (km/h) | Longitudinal Friction Factor | Lateral Friction Factor | Designed Curve Safety |
|---|---|---|---|
| 60 | 0.33 | 0.15 | 1.42 |
| 80 | 0.31 | 0.13 | 1.54 |
| 100 | 0.30 | 0.12 | 1.62 |
| 120 | 0.29 | 0.10 | 1.88 |
| Design Speed (km/h) | Curve Radius (m) | Superelevation (%) | Acceleration Rate (m/s2) | Gradient (%) | Point Mass Model | Steady-State Bicycle Model | |
|---|---|---|---|---|---|---|---|
| Front Axle | Rear Axle | ||||||
| 60 | 135 | 6 | −0.85 | −5 | 0.150 | 0.158 | 0.164 |
| 80 | 270 | 6 | −0.85 | −5 | 0.127 | 0.134 | 0.138 |
| 100 | 440 | 6 | −0.85 | −5 | 0.119 | 0.125 | 0.130 |
| 120 | 710 | 6 | 0.85 | −5 | 0.100 | 0.106 | 0.109 |
| Traffic Volume Type | Road Operation Time (Years) | |||||||||
|---|---|---|---|---|---|---|---|---|---|---|
| 1 | 2 | 3 | 4 | 5 | 6 | 7 | 8 | 9 | 10 | |
| (107 veh) | 5.5 | 11.6 | 17.9 | 24.8 | 32.2 | 40.4 | 49.1 | 58.6 | 68.8 | 79.8 |
| (veh) | 2617 | 2826 | 3052 | 3297 | 3560 | 3845 | 4153 | 4485 | 4844 | 5231 |
| Carriageway | Design Superelevation | Road Operation Time (Years) | ||||||||||
|---|---|---|---|---|---|---|---|---|---|---|---|---|
| 0 | 1 | 2 | 3 | 4 | 5 | 6 | 7 | 8 | 9 | 10 | ||
| Inside lane (%) | 6.00 | 6.51 | 6.53 | 6.54 | 6.55 | 6.55 | 6.56 | 6.56 | 6.56 | 6.56 | 6.56 | 6.51 |
| Outside lane (%) | 6.00 | 5.85 | 5.86 | 5.87 | 5.87 | 5.88 | 5.88 | 5.88 | 5.88 | 5.88 | 5.88 | 5.85 |
Disclaimer/Publisher’s Note: The statements, opinions and data contained in all publications are solely those of the individual author(s) and contributor(s) and not of MDPI and/or the editor(s). MDPI and/or the editor(s) disclaim responsibility for any injury to people or property resulting from any ideas, methods, instructions or products referred to in the content. |
© 2023 by the authors. Licensee MDPI, Basel, Switzerland. This article is an open access article distributed under the terms and conditions of the Creative Commons Attribution (CC BY) license (https://creativecommons.org/licenses/by/4.0/).
Share and Cite
Xu, J.; Jia, M.; Gao, C.; Lv, W. Limited Response of Curve Safety Level to Friction Factor and Superelevation Variation under Repeated Traffic Loads. Sustainability 2023, 15, 16923. https://doi.org/10.3390/su152416923
Xu J, Jia M, Gao C, Lv W. Limited Response of Curve Safety Level to Friction Factor and Superelevation Variation under Repeated Traffic Loads. Sustainability. 2023; 15(24):16923. https://doi.org/10.3390/su152416923
Chicago/Turabian StyleXu, Jinliang, Miao Jia, Chao Gao, and Wenzhen Lv. 2023. "Limited Response of Curve Safety Level to Friction Factor and Superelevation Variation under Repeated Traffic Loads" Sustainability 15, no. 24: 16923. https://doi.org/10.3390/su152416923
APA StyleXu, J., Jia, M., Gao, C., & Lv, W. (2023). Limited Response of Curve Safety Level to Friction Factor and Superelevation Variation under Repeated Traffic Loads. Sustainability, 15(24), 16923. https://doi.org/10.3390/su152416923