

Comparison of the Techno-Economic and Environmental Assessment of Hydrodynamic Cavitation and Mechanical Stirring Reactors for the Production of Sustainable Hevea brasiliensis Ethyl Ester

 ,
,  ,
, 
 , ,
, ,  , and
, and
Abstract
:1. Introduction
2. Materials and Methods
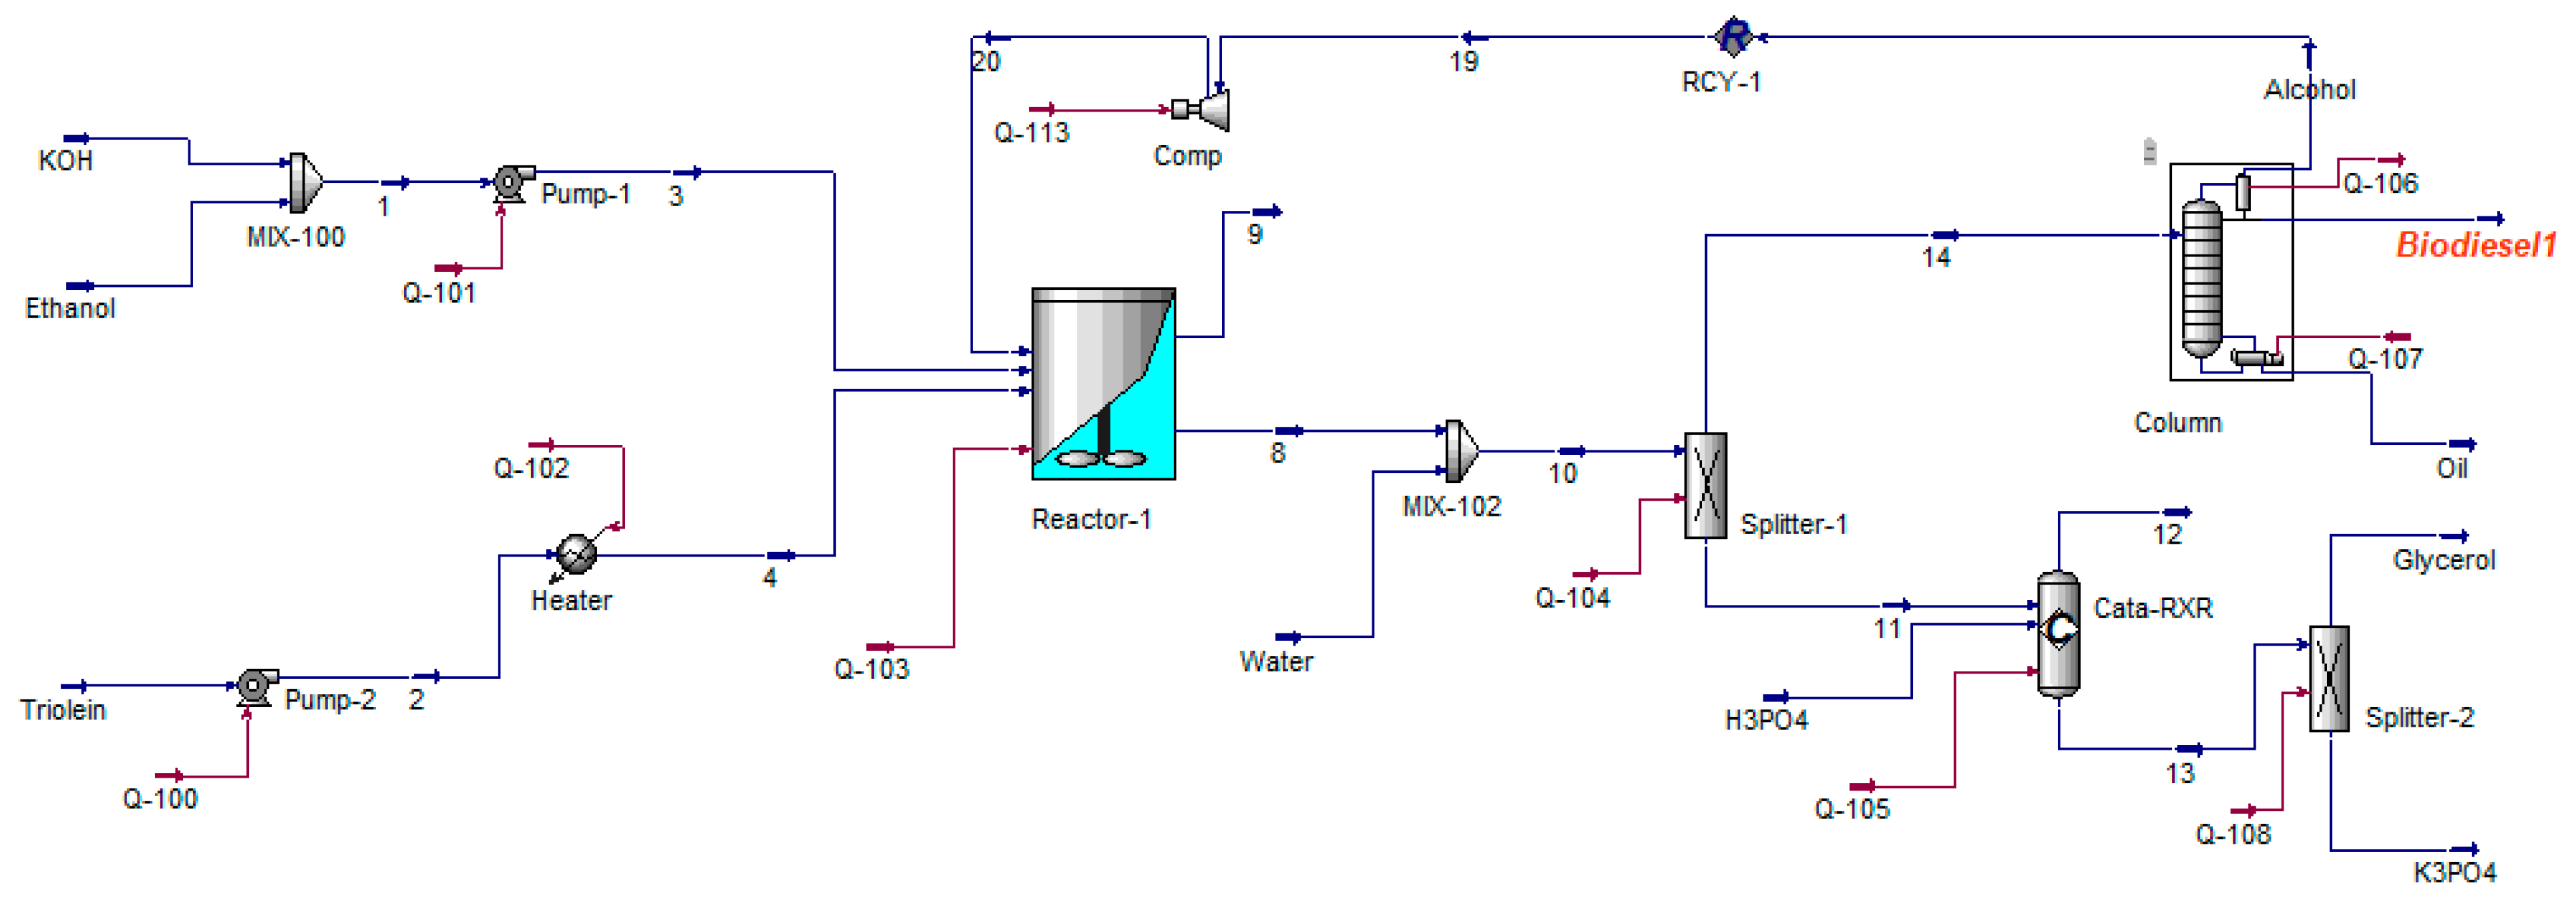
Process Description and Assumption
- The atmospheric temperature and pressure are fixed at 25 °C and 1 bar, respectively.
- Pressure drops in pipelines and heat exchangers are disregarded.
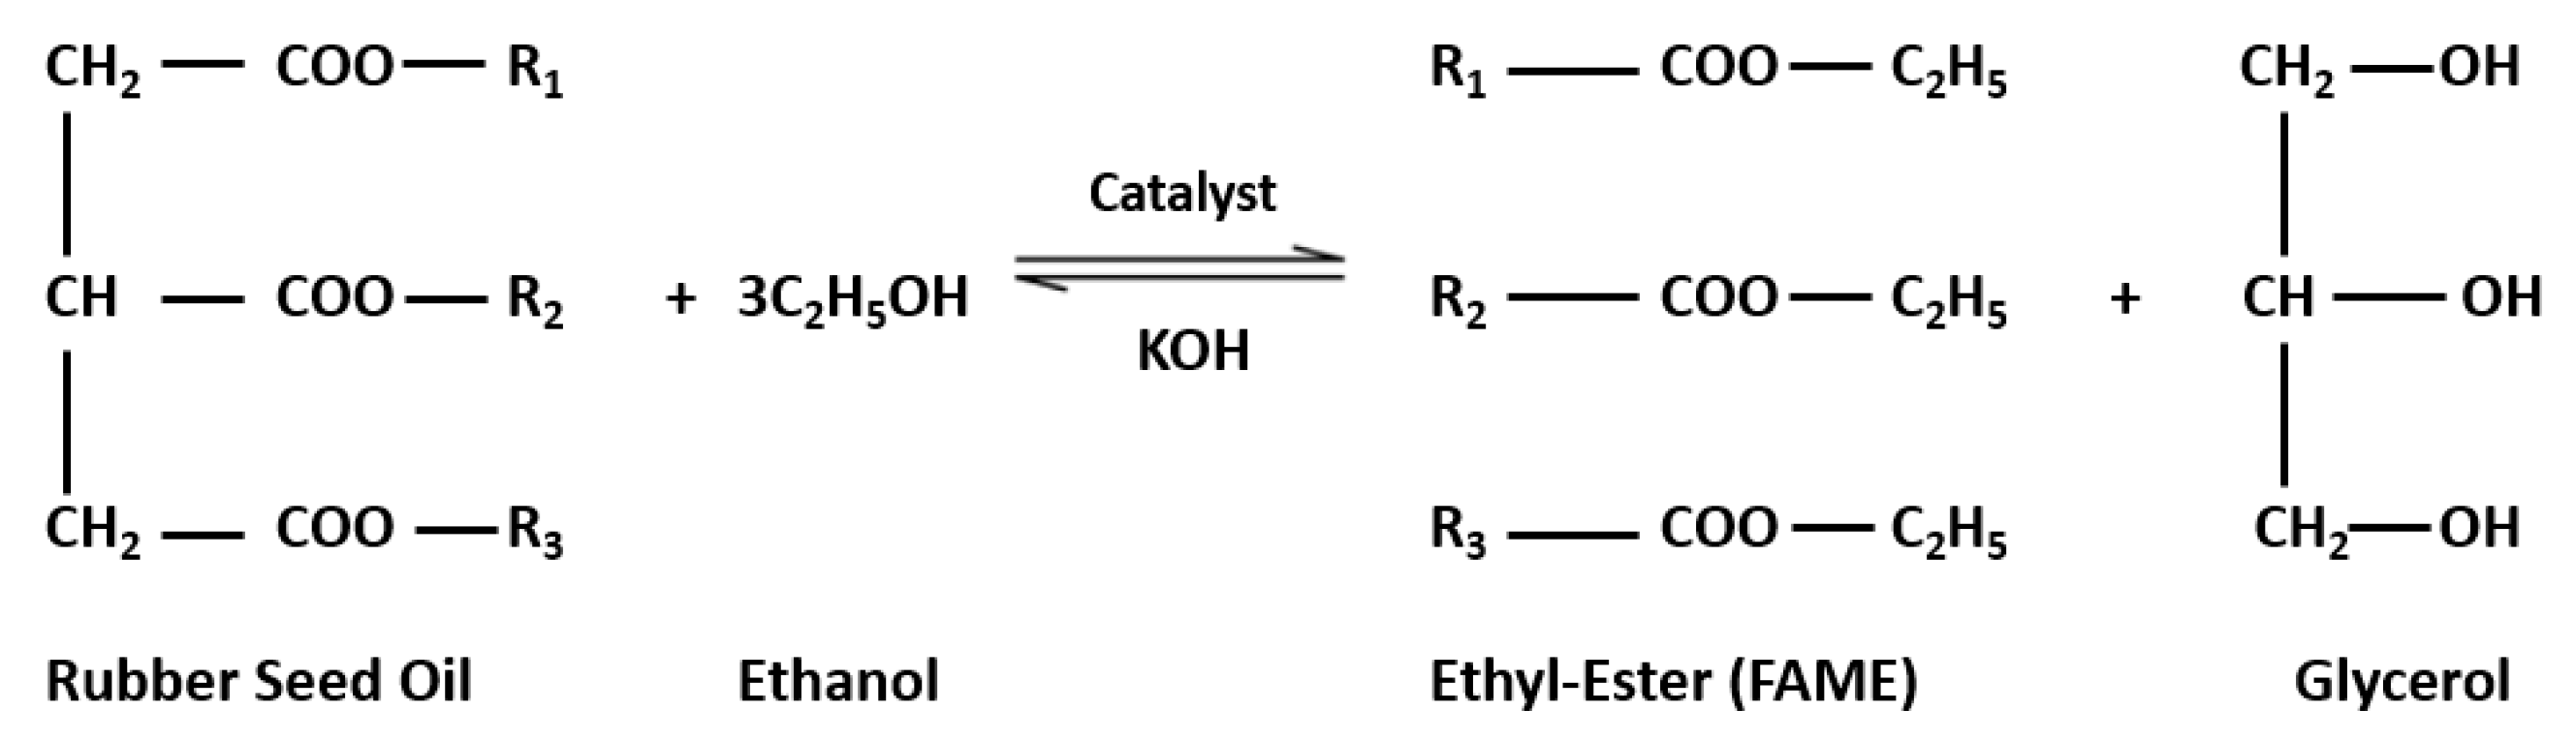
- The RSO is modelled using triolein, with an assumed conversion rate of 95% [27].
- Every process is assumed to be in a steady-state, adiabatic condition.
- Any changes to the fluid’s kinetic and potential energy are regarded as negligible.
- Pumps and compressors are supposed to have an adiabatic efficiency of 85%, the distillation tray tower to have an efficiency of 65%, and the electrical generator (motor) to have an efficiency of 96%.
- The transesterification process operates continuously in a steady-state mode.
- The MS process consists of a transesterification unit, glycerine purification unit, and biodiesel distillation unit. The glycerine purification unit involves washing the biodiesel with water to remove glycerine, potassium hydroxide removal through phosphoric acid addition, and the subsequent removal of potassium phosphate.
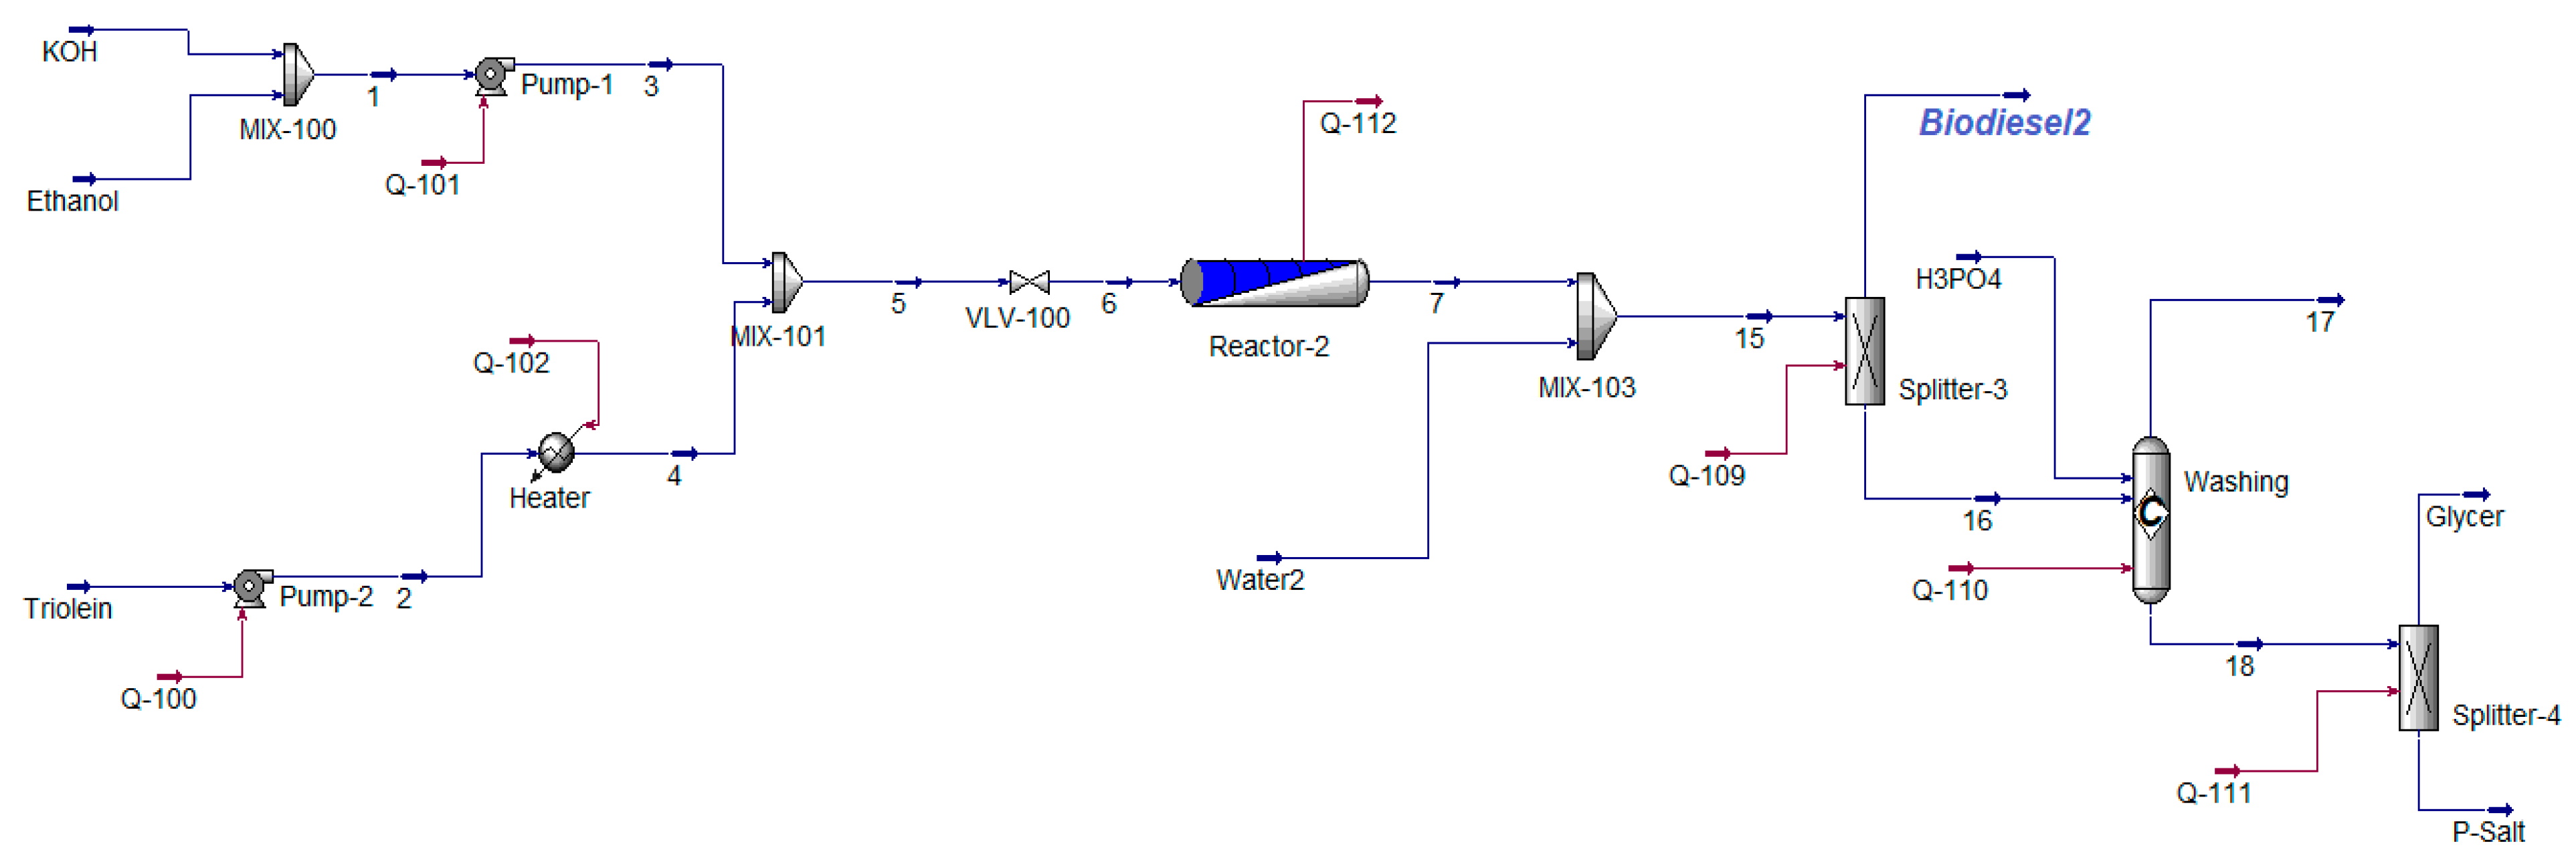
- A glycerine purification unit and a transesterification unit make up the HC process.
- Ethanol recovery is considered only in the MS process, while it is disregarded in the HC process due to the high conversion rate of over 99%.
3. Modelling and Analysis
3.1. Energy Analysis
3.2. Exergy Analysis
4. Economic Model Analysis
4.1. Summary of Total Capital Investment
4.2. Operating Cost Expenses
4.3. Economic Viability Indicators
4.4. Environmental Analysis
5. Results and Discussion
5.1. Production Process of Hevea brasiliensis Ethyl Ester
5.2. Energy and Exergy Discussion
5.2.1. Exergy Destruction
5.2.2. Exergy Efficiency
6. Economic Assessment
7. Environmental Assessment
8. Conclusions
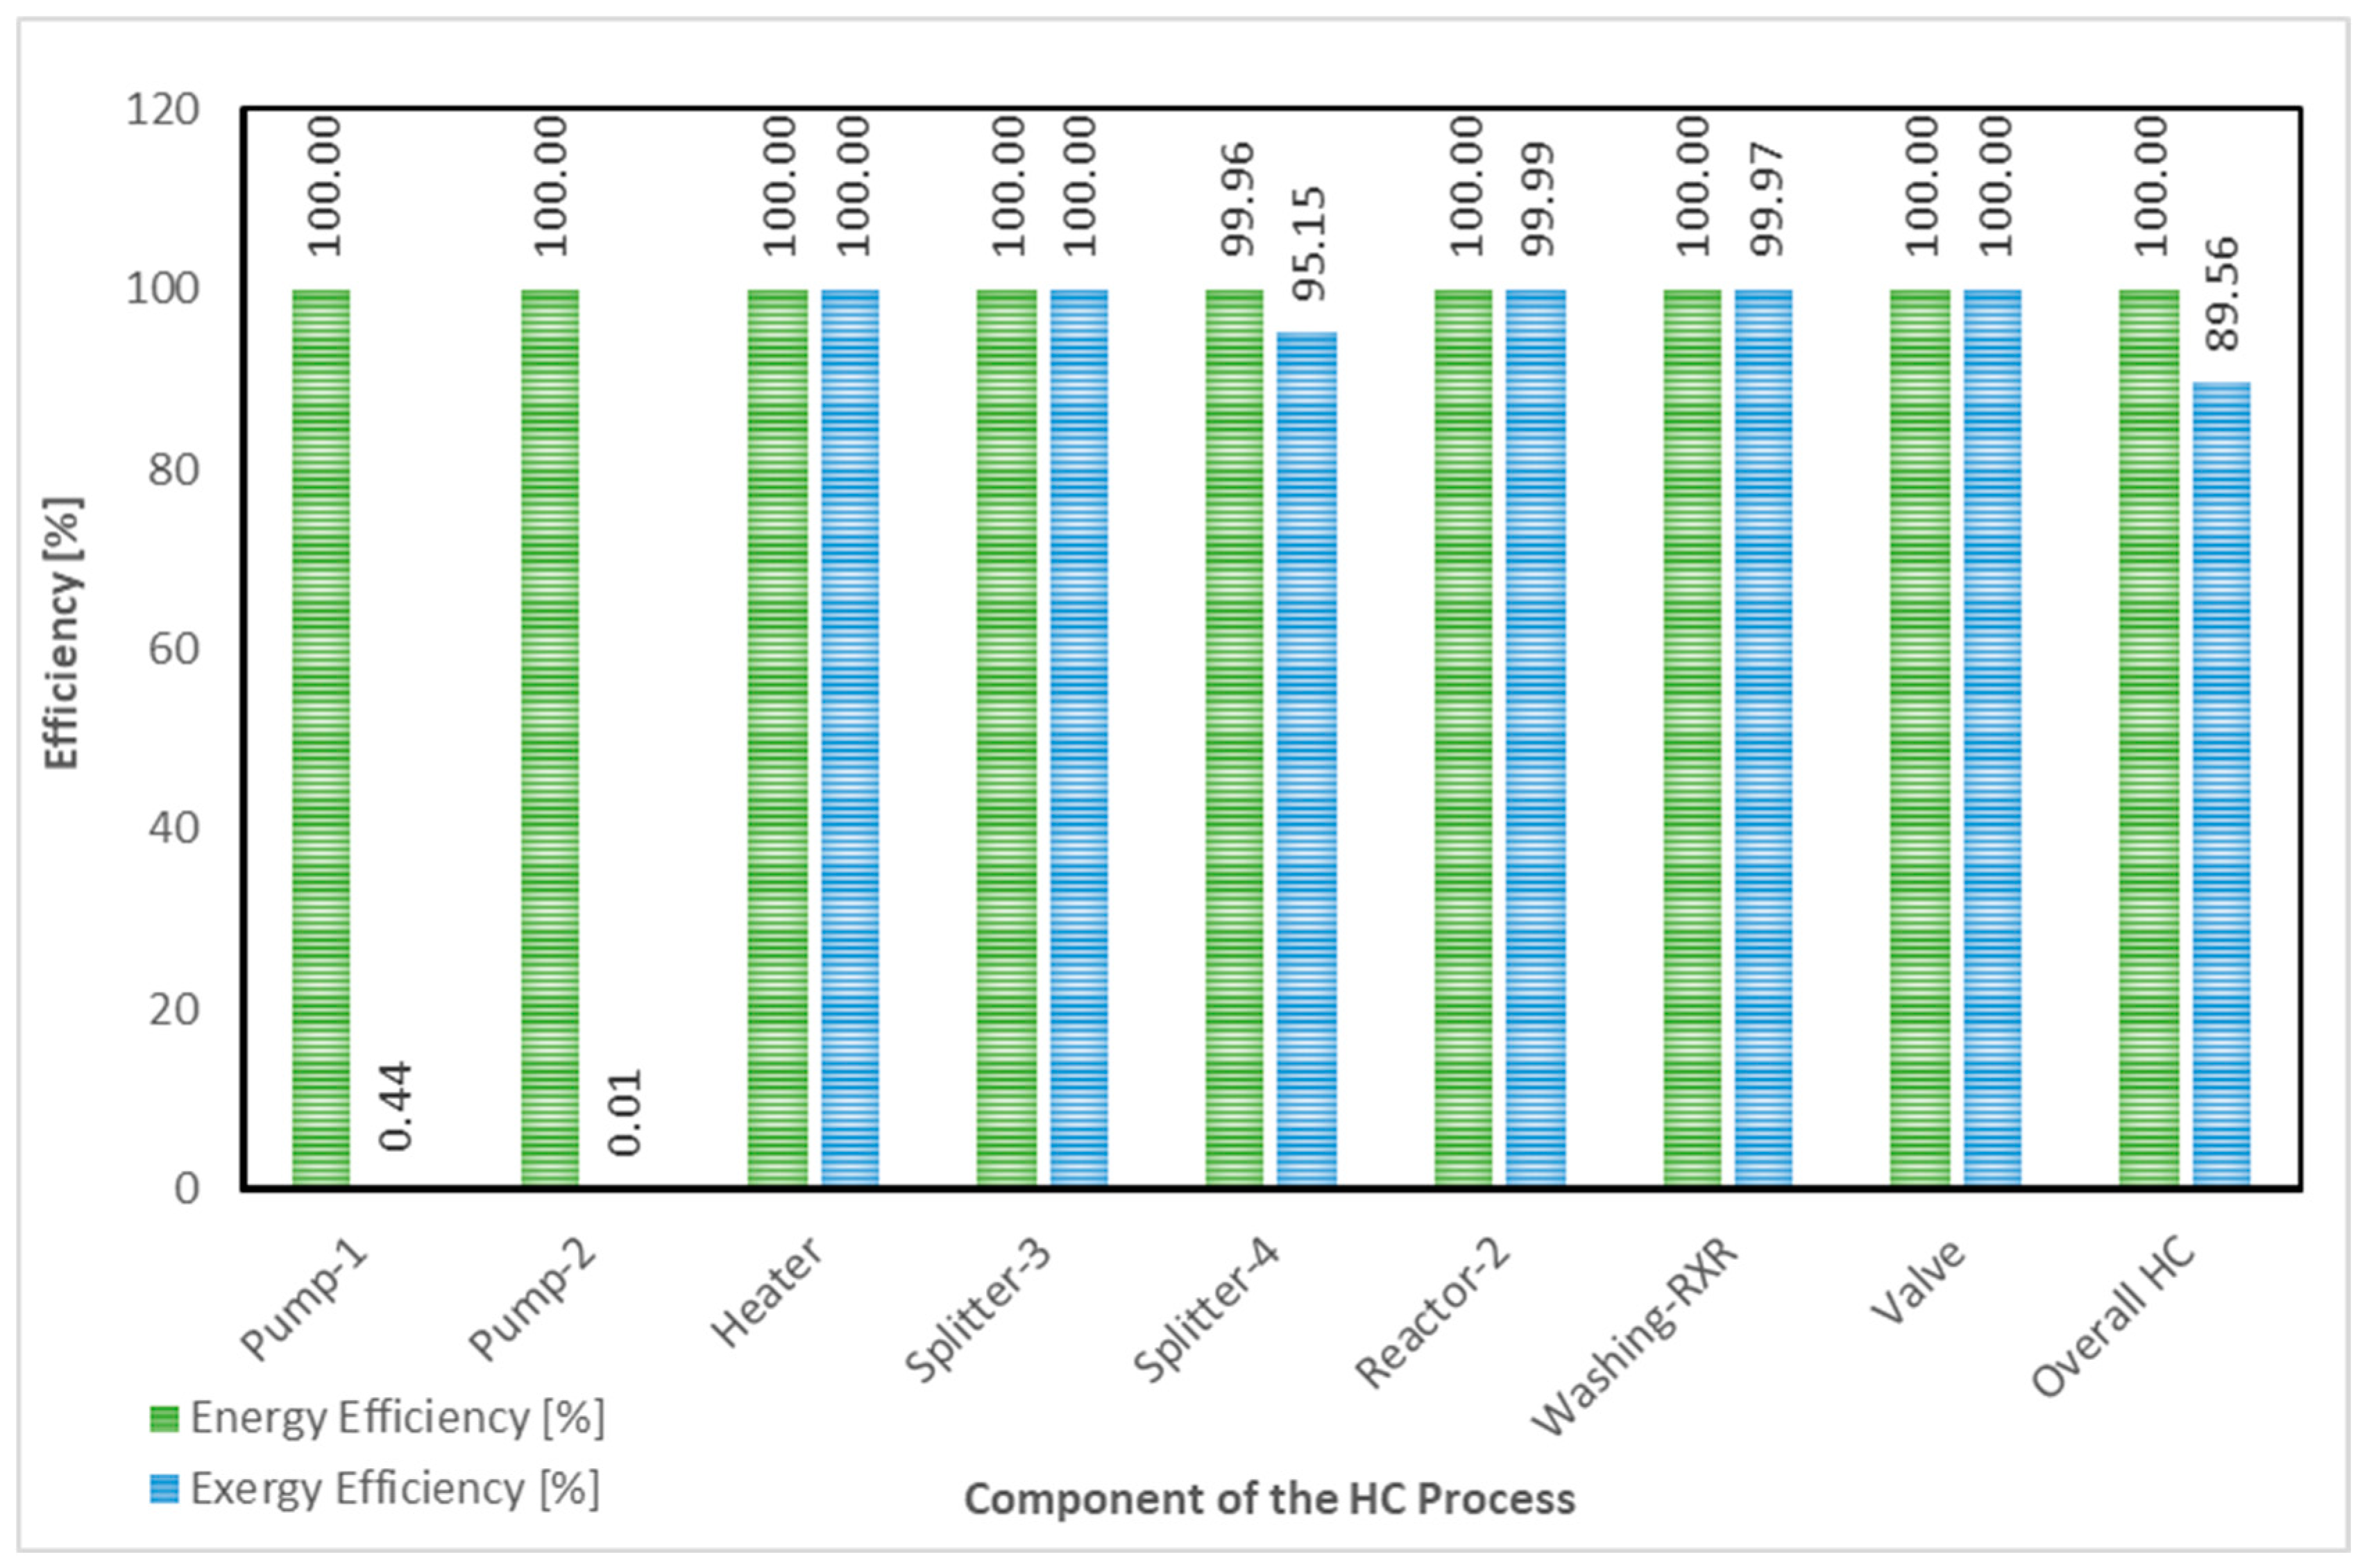
- Biodiesel production processes showed energy efficiencies of 98.54% for MS and 100% for HC, with exergy efficiencies of 54.92% and 89.56%, respectively.
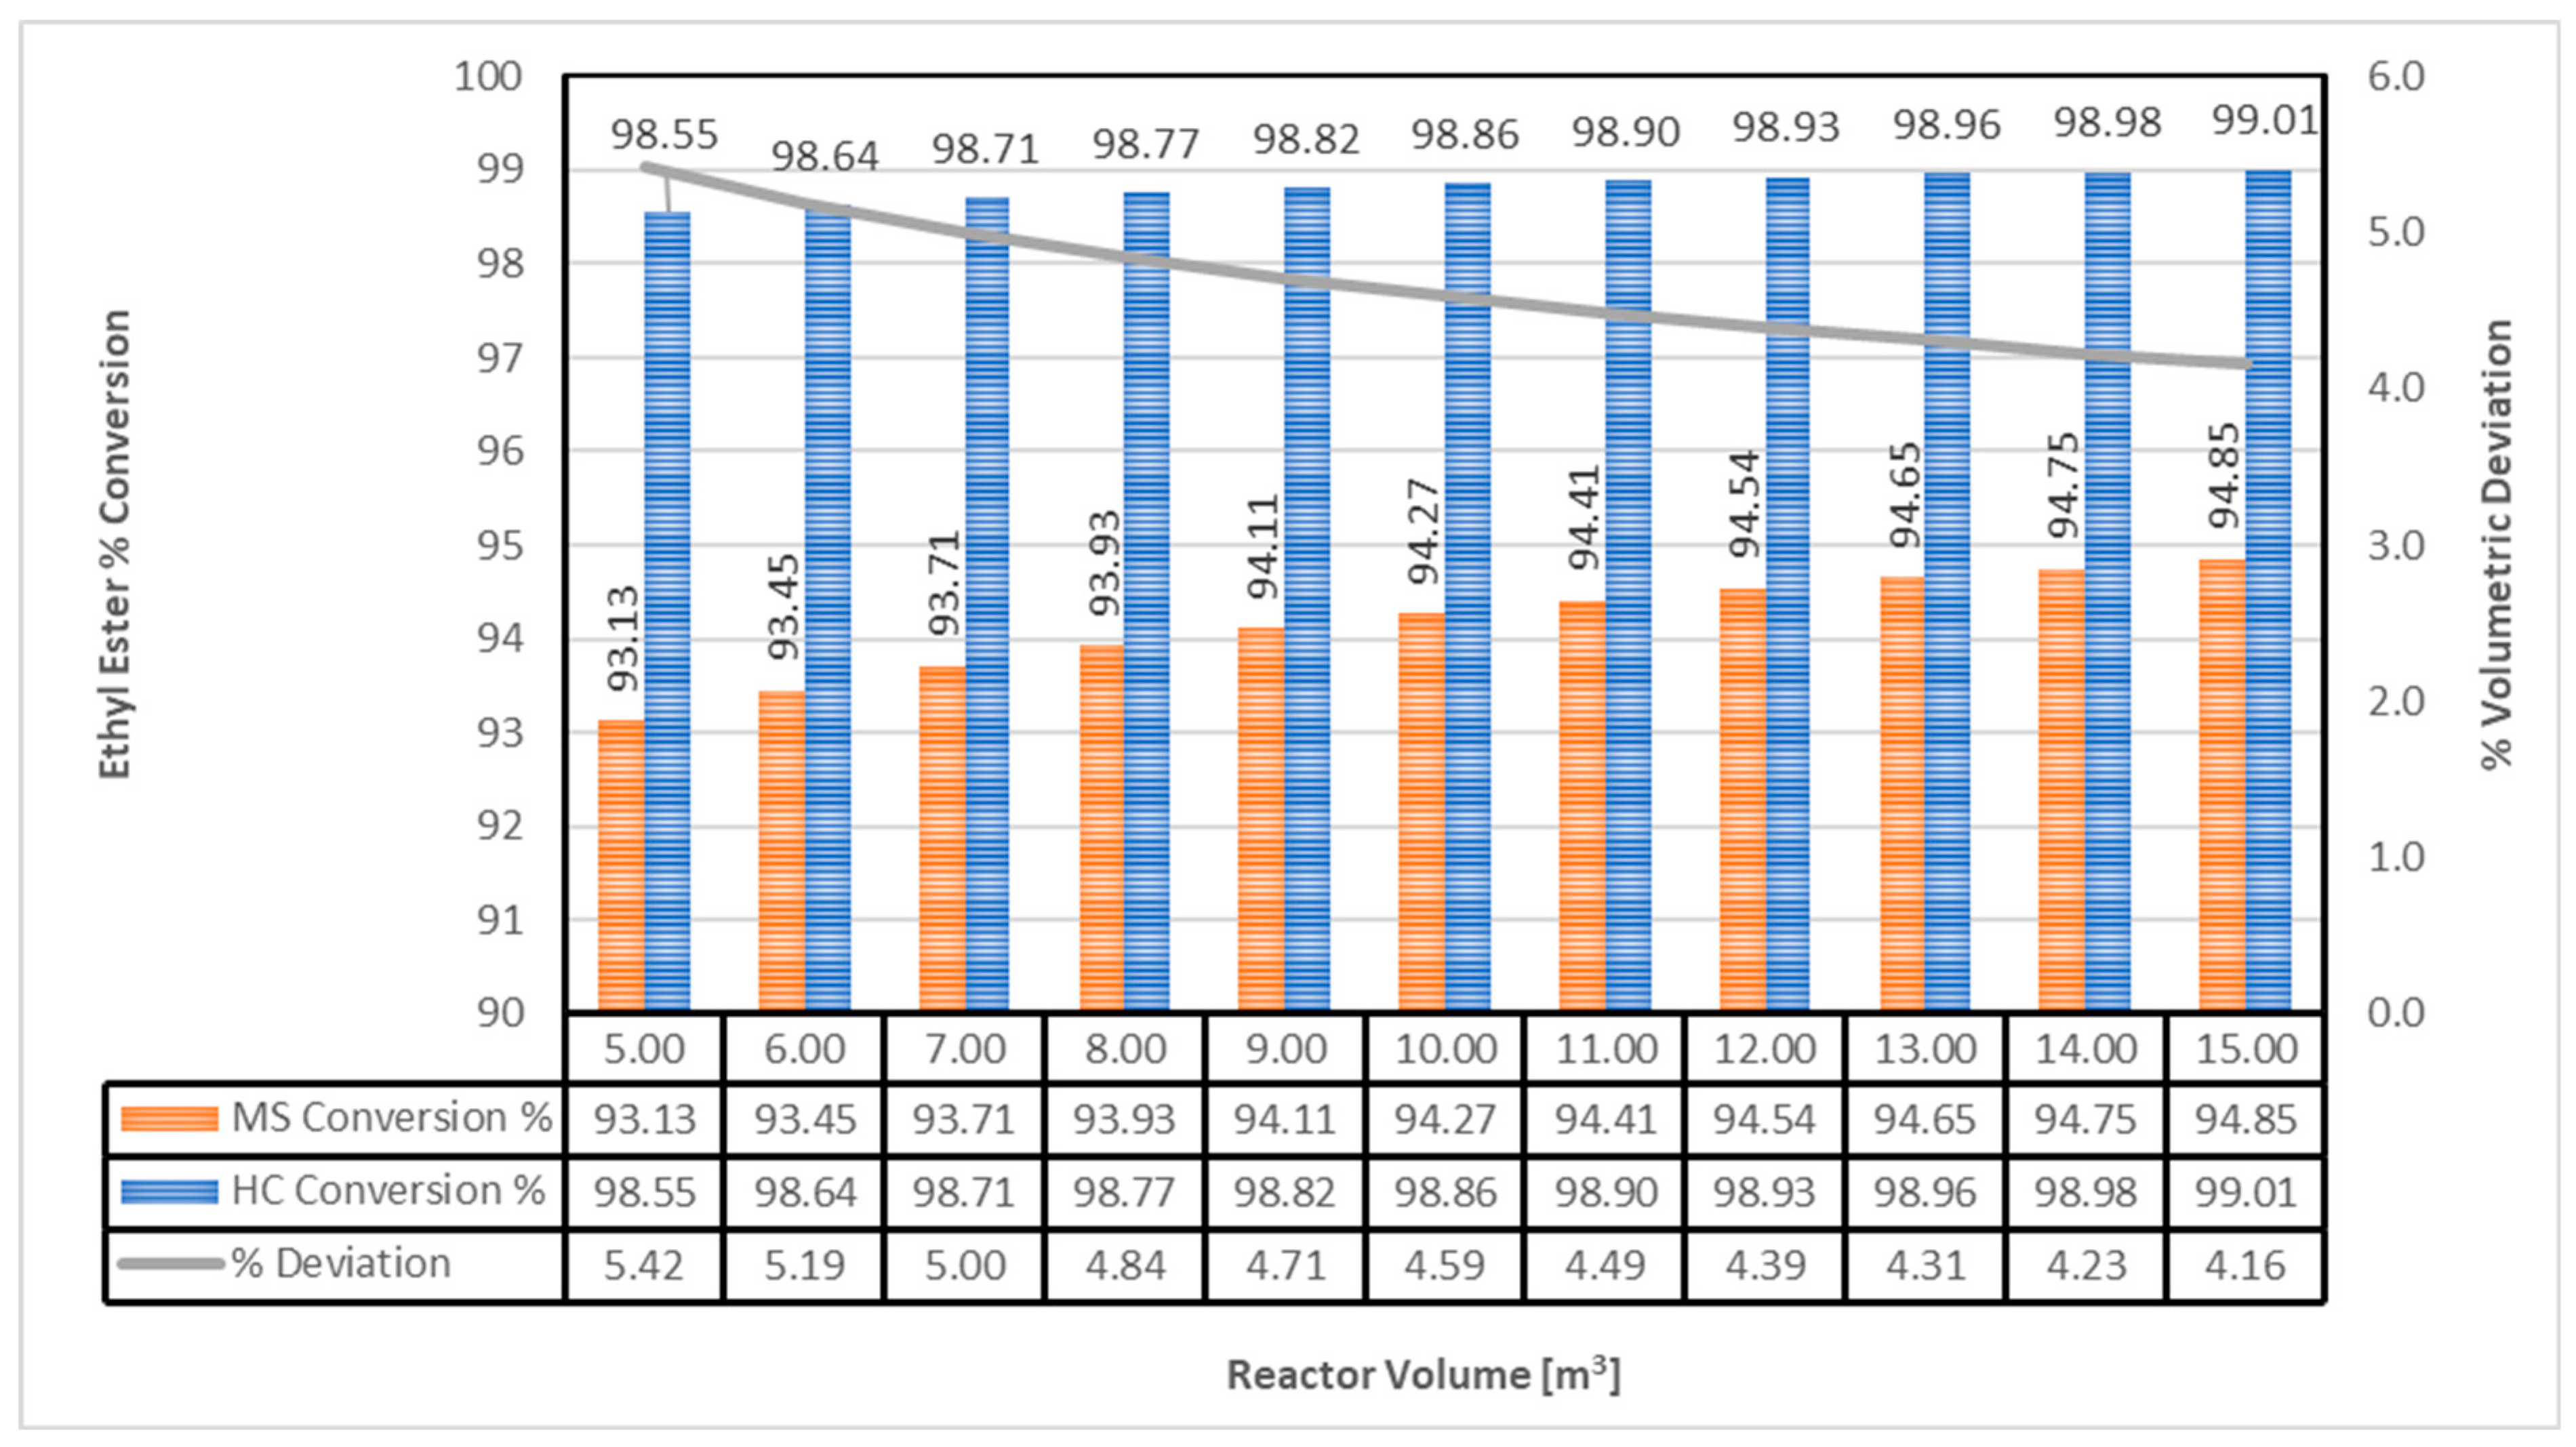
- Exergy analysis is vital for understanding energy use in biodiesel production. MS used 88.24 kW energy for a 94.85% conversion rate, whereas HC used 2.274 kW for 99.01% conversion at the same volumetric reactor rate.
- The study quantifies inefficiencies, helping to assess component performance and develop sustainable biodiesel production. MS’s exergetic destruction is six times higher than HC’s.
- Chemical exergy from RBO and ethanol is the major input, while glycerol and water cause significant exergy losses in the biodiesel production process.
Future Research Areas
- Developing efficient and eco-friendly catalysts, exploring options like enzyme catalysts and nanocatalysts.
- Addressing the issue of waste utilization is crucial. Research should investigate methods to utilize waste materials, such as finding uses for glycerol by-products and developing more efficient purification techniques to reduce overall waste.
- Lastly, comprehensive life cycle assessments (LCAs) can evaluate the environmental impact of biodiesel production, guiding decision making toward more sustainable practices.
Author Contributions
Funding
Institutional Review Board Statement
Informed Consent Statement
Data Availability Statement
Conflicts of Interest
Nomenclature
| BD | Biodiesel |
| CC | Contingency cost |
| CCPP | Combined cycle power plant |
| CV | Control volume |
| CSTR | Continuously stirred tank reactor |
| EC | Engineering cost |
| ER | Ethylic routes |
| FAME | Fatty acid methyl ester |
| FCI | Fixed capital investment |
| GLC | Glycerol |
| GWP | Global warming potential |
| HC(R) | Hydrodynamic cavitation reactor |
| HEP | Hydroelectric power |
| HHV | Higher heating value (MJ/kg) |
| IR | Interest rate |
| IRR | Internal rate of return |
| ISBL | Inside battery limit |
| MACRS | Modified accelerated cost recovery system |
| ME | Methylic route |
| MS(R) | Mechanical stirring reactor |
| NCGOs | Non-competitive generational oils |
| NPV | Net present value |
| NRTL | Nonrandom two liquid |
| OPEX | Operating expenditure |
| OSBL | Outside battery limit |
| PCE | Purchase cost of equipment |
| PFR | Plug flow reactor |
| PPC | Physical plant cost |
| ROI | Return on investment |
| RSO | Rubber seed oil |
| SDG | Sustainable development goal |
| TC | Total production cost |
| TCI | Total capital investment |
| TEA | Techno-economic analysis |
| TFC | Total fixed cost |
| TG | Triglyceride |
| TPC | Total production cost |
| TVC | Total variable cost |
| UNFCC | United Nations Framework Convention on Climate Change |
| WCI | Working capital investment |
| Greek letters | |
| φ | coefficient from the liquid fuel expression |
| ηĖ | energy efficiency |
| ηex | exergy efficiency |
| ηPump | pump efficiency |
| ηth | thermal efficiency |
| Abbrevations | |
| Ė | energy rate [kW] |
| Ex | exergy rate [kW] |
| ex | specific exergy rate of material streams (kJ/kmol) |
| ExD | exergy destruction rate |
| ExL | exergy loss rate |
| WNet | net power (kW) |
| WP | pump power (kW) |
| yD | exergy destruction rate ratio |
| hi | specific enthalpy at initial state (kJ/kmol) |
| ho | specific enthalpy at reference state (kJ/kmol) |
| KE | kinetic energy |
| LHV | lower heating value (MJ/kg) |
| ṁ | mass flow rate [kg/sec] |
| ṁFuel | mass flow rate of Fuel [kg/sec] |
| P | power output [kW] |
| Po | pressure at reference state (atm) |
| PE | potential energy |
| Q | heat flow rate |
| Si | specific entropy at initial state (kJ/kmol) |
| So | specific enthalpy at reference state (kJ/kmol) |
| To | temperature of reference state (K) |
| Subscripts | |
| CHM | Chemical |
| D | Destruction |
| F | Fuel |
| In | Inlet streams |
| K | kth component of system |
| O | Reference state |
| O | Ambient |
| Out | Outlet stream |
| P | Product |
| PHY | Physical |
| Th | Thermal |
| Tot | Total |
Appendix A

| Reactor Technology | Source | Types of Alcohol | Ethanol | Ea | TEa | Technological Challenges | Remarks | Refs. |
|---|---|---|---|---|---|---|---|---|
| Methanol | ||||||||
| LSC | Rice bran oil (RBAO) |  |  | | | The cost of lipase catalyst influenced the recovery and re-usage | The adoption of TEAs into rice bran oil refinery led to profit and a reduction in toxic chemicals and energy | Usaku et al. [54] |
| Sonication | Acidic oil | | | | | NS | The production cost (0.776 USD/liter), total CO2 emissions (0.08 kg of CO2/kg of BD), and return of investment (∼330%) obtained for the medium-sized production unit | Naeem et al. [16] |
| Meso-OBR | Refined and low-grade vegetable oils (RLVOs) | | | | | NR | TEAs for a single step for BD derived from RLVO established. | Al-Saadi et al. [55] |
| LSR | Algal biomass (AB) | | | | | The economic viability of the production of the recycle of the process | Feasibility of AB biodiesel on a large scale guaranteed | Mustapha et al. [42] |
| HCR | | | | | NR | Feasibility of techno-economics via Aspen version 10 software established | Oke et al. [56] | |
| LSR | Marine macroalgae Codium tomentosum | | | | | NR | The payback period (8.59 yrs.) and +ve NPV (1.38 M USD/yr.) from biodiesel production (20 MT/batch) process) recorded | Gengiah et al. [57] |
| LSR | Palm and Jatropha biomass (PJB) | | | | | Attractions of TEA of hybrid of PJB for bio-refinery established | Technological bottleneck in obtaining valuable products from PJB | Niño-Villalobos et al. [58] |
| CSTR | Calophyllum inophyllum oil (CaO) | | | | | Low feedstock cost and high biodiesel conversion | Value of TEA, annual biodiesel revenue, and payback period for CaO documented | Naveenkumar and Baskar [59] |
| Alkali-cat, C-SCM and L-SCM | Palm oil | | | | | High amount of methanol during C-SCM process makes financial profitability realistic in the recycling loop | Financial aspect of L-SCM process ranked the best, followed by the Alkali-cat process, then the C-SCM | Sakdasri et al. [60] |
| Supercritical process | Jatropha curcas oil | | | | | NS | The cost of capital investment (9.41 million USD/yr.), manufacturing (25.39 million USD/yr), and total production (31.20 million USD/yr) reported | Yusuf, and Kamarudin [8] |
| Continuous stirred tank reactor (CSTR) | Canola oil | | | | | Inadequate mixing, elongated reaction period, high energy utilization | Economic sustainability of biodiesel production = f Plant capacity and prices of feedstock oils | Zhang et al. [61] |
| Batch Reactor | Microalgal biomass | | | | | Unsatisfactory mixing, long reaction period, high energy expended, low capability, and inflexibility | Cost-effectiveness was not checked | Lee et al. [62] |
| Name | Vapour Fraction | Temperature [C] | Pressure [bar] | Mass Flow [kg/s] | Molar Flow [kgmole/s] | Mass Enthalpy [kJ/kg] | Mass Entropy [kJ/kg-C] | Heat Flow [MW] | Specific Exergy [kJ/kg] | Physical Exergy [kW] | Chemical Exergy [kW] | Exergy Total [MW] |
|---|---|---|---|---|---|---|---|---|---|---|---|---|
| Ethanol | 0.00 | 25.00 | 1.00 | 0.38 | 0.01 | 6023.85 | 7.52 | 2.31 | 0.00 | 0.00 | 11,316.92 | 11.32 |
| 0.00 | 25.00 | 1.00 | 0.12 | 0.00 | 8085.31 | 2.02 | 0.99 | 0.00 | 0.00 | 235.46 | 0.24 | |
| Triolein | 0.00 | 25.00 | 1.00 | 2.46 | 0.00 | 2330.70 | 6.26 | 5.73 | 0.00 | 0.00 | 97,090.33 | 97.09 |
| Water2 | 0.00 | 50.00 | 1.00 | 0.01 | 0.00 | 15,760.05 | 8.72 | 0.08 | 4.57 | 0.02 | 11.39 | 0.01 |
| H3PO4 | 0.00 | 60.00 | 1.00 | 0.00 | 0.00 | 2104.98 | 31.37 | 0.00 | 39.66 | 0.09 | 1.99 | 0.00 |
| 1 | 0.00 | 25.00 | 1.00 | 0.51 | 0.01 | 6523.37 | 6.10 | 3.31 | 0.00 | 0.00 | 11,316.92 | 11.32 |
| 2 | 0.00 | 25.22 | 4.00 | 2.46 | 0.00 | 2330.31 | 6.26 | 5.73 | 0.00 | 0.00 | 97,090.33 | 97.09 |
| 3 | 0.00 | 25.19 | 4.00 | 0.51 | 0.01 | 6522.95 | 6.10 | 3.31 | 0.00 | 0.00 | 11,316.92 | 11.32 |
| 4 | 0.00 | 70.00 | 4.00 | 2.46 | 0.00 | 2248.96 | 6.00 | 5.53 | 5.68 | 13.98 | 97,090.33 | 97.10 |
| 5 | 0.00 | 61.06 | 4.00 | 2.97 | 0.01 | 2979.03 | 6.00 | 8.84 | 3.96 | 11.73 | 108,407.25 | 108.42 |
| 6 | 0.09 | 52.83 | 0.20 | 2.97 | 0.01 | 2979.03 | 6.00 | 8.84 | 3.71 | 10.99 | 108,407.25 | 108.42 |
| 7 | 0.00 | 70.69 | 0.20 | 2.97 | 0.01 | 2979.78 | 5.91 | 8.84 | 6.00 | 17.80 | 108,385.26 | 108.40 |
| 8 | 0.00 | 60.00 | 2.00 | 3.01 | 0.01 | 3032.75 | 5.98 | 9.12 | 3.59 | 10.81 | 109,668.60 | 109.68 |
| 9 | 1.00 | 60.00 | 2.00 | 0.00 | 0.00 | 5047.86 | 4.51 | 0.00 | 76.76 | 0.00 | 0.00 | 0.00 |
| 10 | 0.00 | 59.95 | 1.00 | 3.01 | 0.01 | 3045.67 | 5.98 | 9.17 | 3.59 | 10.80 | 109,675.56 | 109.69 |
| 11 | 0.00 | 60.00 | 1.00 | 0.38 | 0.01 | 7526.60 | 4.88 | 2.86 | 3.29 | 1.25 | 4531.92 | 4.53 |
| 12 | 1.00 | 60.00 | 1.00 | 0.00 | 0.00 | 13,318.17 | 11.48 | 0.00 | 3227.44 | 0.00 | 0.00 | 0.00 |
| 13 | 0.00 | 60.00 | 1.00 | 0.38 | 0.01 | 7494.28 | 5.04 | 2.86 | 3.50 | 1.34 | 5437.91 | 5.44 |
| 14 | 0.00 | 60.00 | 1.00 | 2.63 | 0.01 | 2398.73 | 6.17 | 6.31 | 3.64 | 9.58 | 105,143.64 | 105.15 |
| 15 | 0.00 | 70.57 | 0.20 | 2.97 | 0.01 | 3001.31 | 5.91 | 8.92 | 5.99 | 17.78 | 108,396.65 | 108.41 |
| 16 | 0.00 | 60.00 | 0.20 | 0.38 | 0.01 | 7568.48 | 4.89 | 2.88 | 3.31 | 1.26 | 4524.51 | 4.53 |
| 17 | 1.00 | 60.00 | 0.20 | 0.00 | 0.00 | 9866.16 | 0.00 | 0.00 | 374.54 | 0.00 | 0.00 | 0.00 |
| 18 | 0.00 | 60.00 | 0.20 | 0.38 | 0.01 | 7583.30 | 4.89 | 2.91 | 3.16 | 1.21 | 4527.25 | 4.53 |
| 19 | 1.00 | 166.29 | 0.10 | 0.04 | 0.00 | 4401.74 | 4.00 | 0.18 | 73.80 | 3.04 | 1283.49 | 1.29 |
| 20 | 1.00 | 326.19 | 4.00 | 0.04 | 0.00 | 4056.65 | 3.92 | 0.17 | 392.66 | 16.19 | 1283.49 | 1.30 |
| Biodiesel2 | 0.00 | 60.00 | 0.20 | 2.59 | 0.01 | 2352.54 | 6.16 | 6.09 | 3.61 | 9.34 | 103,872.13 | 103.88 |
| P-Salt | 0.00 | 60.00 | 0.09 | 0.12 | 0.00 | 8025.29 | 1.95 | 0.99 | 0.29 | 0.04 | 230.68 | 0.23 |
| Glycer | 0.00 | 60.00 | 0.09 | 0.26 | 0.00 | 7370.51 | 6.40 | 1.91 | 4.53 | 1.18 | 4527.25 | 4.53 |
| Water | 0.00 | 50.00 | 1.00 | 0.00 | 0.00 | 15,760.05 | 8.72 | 0.05 | 4.57 | 0.01 | 6.96 | 0.01 |
| P-Acid | 0.00 | 60.00 | 1.00 | 0.00 | 0.00 | 2104.98 | 31.37 | 0.00 | 39.66 | 0.09 | 2.08 | 0.00 |
| Alcohol | 1.00 | 166.31 | 0.10 | 0.04 | 0.00 | 4401.36 | 4.00 | 0.18 | 73.83 | 3.07 | 1292.65 | 1.30 |
| Oil | 0.00 | 369.58 | 0.20 | 0.02 | 0.00 | 1530.01 | 4.52 | 0.03 | 286.51 | 5.46 | 752.80 | 0.76 |
| Biodiesel1 | 0.00 | 166.31 | 0.10 | 2.57 | 0.01 | 2125.64 | 5.58 | 5.46 | 54.85 | 140.99 | 103,098.18 | 103.24 |
| Glycerol | 0.00 | 60.00 | 0.09 | 0.26 | 0.00 | 7270.11 | 6.39 | 1.87 | 4.47 | 1.15 | 4531.92 | 4.53 |
| K3PO4 | 0.00 | 60.00 | 0.09 | 0.13 | 0.00 | 7952.68 | 2.47 | 0.99 | 1.51 | 0.19 | 230.70 | 0.23 |
| Project Year | Cap Ex | Revenue | CCOP | Gr. Profit | Deprcn | Taxbl Inc | Tax Paid | Cash Flow | PV of CF | NPV |
|---|---|---|---|---|---|---|---|---|---|---|
| 1 | 3,688,704.43 | - | - | - | - | - | - | (3,688,704.43) | (3,207,569.07) | (3,207,569.07) |
| 2 | 8,606,977.01 | - | - | - | - | - | - | (8,606,977.01) | (6,508,111.16) | (9,715,680.23) |
| 3 | 2,084,919.90 | 52,933,833.00 | 58,954,213.37 | (6,020,380.37) | 208,491.99 | (6,228,872.36) | - | (8,105,300.27) | (5,329,366.50) | (15,045,046.73) |
| 4 | - | 105,867,666.00 | 95,213,903.79 | 10,653,762.21 | 208,491.99 | 10,445,270.22 | - | 10,653,762.21 | 6,091,323.12 | (8,953,723.60) |
| 5 | - | 105,867,666.00 | 95,213,903.79 | 10,653,762.21 | 208,491.99 | 10,445,270.22 | 2,350,185.80 | 8,303,576.41 | 4,128,345.01 | (4,825,378.59) |
| 6 | - | 105,867,666.00 | 95,213,903.79 | 10,653,762.21 | 208,491.99 | 10,445,270.22 | 2,350,185.80 | 8,303,576.41 | 3,589,865.23 | (1,235,513.36) |
| 7 | - | 105,867,666.00 | 95,213,903.79 | 10,653,762.21 | 208,491.99 | 10,445,270.22 | 2,350,185.80 | 8,303,576.41 | 3,121,621.94 | 1,886,108.57 |
| 8 | - | 105,867,666.00 | 95,213,903.79 | 10,653,762.21 | 208,491.99 | 10,445,270.22 | 2,350,185.80 | 8,303,576.41 | 2,714,453.86 | 4,600,562.43 |
| 9 | - | 105,867,666.00 | 95,213,903.79 | 10,653,762.21 | 208,491.99 | 10,445,270.22 | 2,350,185.80 | 8,303,576.41 | 2,360,394.66 | 6,960,957.09 |
| 10 | - | 105,867,666.00 | 95,213,903.79 | 10,653,762.21 | 208,491.99 | 10,445,270.22 | 2,350,185.80 | 8,303,576.41 | 2,052,517.10 | 9,013,474.19 |
| 11 | - | 105,867,666.00 | 95,213,903.79 | 10,653,762.21 | 208,491.99 | 10,445,270.22 | 2,350,185.80 | 8,303,576.41 | 1,784,797.47 | 10,798,271.66 |
| 12 | - | 105,867,666.00 | 95,213,903.79 | 10,653,762.21 | 208,491.99 | 10,445,270.22 | 2,350,185.80 | 8,303,576.41 | 1,551,997.80 | 12,350,269.46 |
| 13 | - | 105,867,666.00 | 95,213,903.79 | 10,653,762.21 | - | 10,653,762.21 | 2,350,185.80 | 8,303,576.41 | 1,349,563.31 | 13,699,832.77 |
| 14 | - | 105,867,666.00 | 95,213,903.79 | 10,653,762.21 | - | 10,653,762.21 | 2,397,096.50 | 8,256,665.71 | 1,166,903.48 | 14,866,736.26 |
| 15 | - | 105,867,666.00 | 95,213,903.79 | 10,653,762.21 | - | 10,653,762.21 | 2,397,096.50 | 8,256,665.71 | 1,014,698.68 | 15,881,434.94 |
| 16 | - | 105,867,666.00 | 95,213,903.79 | 10,653,762.21 | - | 10,653,762.21 | 2,397,096.50 | 8,256,665.71 | 882,346.68 | 16,763,781.62 |
| 17 | - | 105,867,666.00 | 95,213,903.79 | 10,653,762.21 | - | 10,653,762.21 | 2,397,096.50 | 8,256,665.71 | 767,257.98 | 17,531,039.60 |
| 18 | - | 105,867,666.00 | 95,213,903.79 | 10,653,762.21 | - | 10,653,762.21 | 2,397,096.50 | 8,256,665.71 | 667,180.85 | 18,198,220.46 |
| 19 | - | 105,867,666.00 | 95,213,903.79 | 10,653,762.21 | - | 10,653,762.21 | 2,397,096.50 | 8,256,665.71 | 580,157.26 | 18,778,377.72 |
| 20 | (2,084,919.90) | 105,867,666.00 | 95,213,903.79 | 10,653,762.21 | - | 10,653,762.21 | 2,397,096.50 | 10,341,585.61 | 631,873.77 | 19,410,251.49 |
| Project Year | Cap Ex | Revenue | CCOP | Gr. Profit | Deprcn | Taxbl Inc | Tax Paid | Cash Flow | PV of CF | NPV |
|---|---|---|---|---|---|---|---|---|---|---|
| 1 | 2,592,873.13 | - | - | - | - | - | - | (2,592,873.13) | (2,254,672.29) | (2,254,672.29) |
| 2 | 6,050,037.30 | - | - | - | - | - | - | (6,050,037.30) | (4,574,697.39) | (6,829,369.68) |
| 3 | 1,458,491.14 | 57,281,056.00 | 57,369,802.87 | (88,746.87) | 145,849.11 | (234,595.98) | - | (1,547,238.00) | (1,017,334.10) | (7,846,703.78) |
| 4 | - | 114,562,112.00 | 92,104,313.07 | 22,457,798.93 | 145,849.11 | 22,311,949.81 | - | 22,457,798.93 | 12,840,319.42 | 4,993,615.64 |
| 5 | - | 114,562,112.00 | 92,104,313.07 | 22,457,798.93 | 145,849.11 | 22,311,949.81 | 5,020,188.71 | 17,437,610.22 | 8,669,574.12 | 13,663,189.76 |
| 6 | - | 114,562,112.00 | 92,104,313.07 | 22,457,798.93 | 145,849.11 | 22,311,949.81 | 5,020,188.71 | 17,437,610.22 | 7,538,760.10 | 21,201,949.87 |
| 7 | - | 114,562,112.00 | 92,104,313.07 | 22,457,798.93 | 145,849.11 | 22,311,949.81 | 5,020,188.71 | 17,437,610.22 | 6,555,443.57 | 27,757,393.44 |
| 8 | - | 114,562,112.00 | 92,104,313.07 | 22,457,798.93 | 145,849.11 | 22,311,949.81 | 5,020,188.71 | 17,437,610.22 | 5,700,385.71 | 33,457,779.15 |
| 9 | - | 114,562,112.00 | 92,104,313.07 | 22,457,798.93 | 145,849.11 | 22,311,949.81 | 5,020,188.71 | 17,437,610.22 | 4,956,857.14 | 38,414,636.29 |
| 10 | - | 114,562,112.00 | 92,104,313.07 | 22,457,798.93 | 145,849.11 | 22,311,949.81 | 5,020,188.71 | 17,437,610.22 | 4,310,310.56 | 42,724,946.85 |
| 11 | - | 114,562,112.00 | 92,104,313.07 | 22,457,798.93 | 145,849.11 | 22,311,949.81 | 5,020,188.71 | 17,437,610.22 | 3,748,096.14 | 46,473,042.98 |
| 12 | - | 114,562,112.00 | 92,104,313.07 | 22,457,798.93 | 145,849.11 | 22,311,949.81 | 5,020,188.71 | 17,437,610.22 | 3,259,214.03 | 49,732,257.02 |
| 13 | - | 114,562,112.00 | 92,104,313.07 | 22,457,798.93 | - | 22,457,798.93 | 5,020,188.71 | 17,437,610.22 | 2,834,099.16 | 52,566,356.17 |
| 14 | - | 114,562,112.00 | 92,104,313.07 | 22,457,798.93 | - | 22,457,798.93 | 5,053,004.76 | 17,404,794.17 | 2,459,796.20 | 55,026,152.38 |
| 15 | - | 114,562,112.00 | 92,104,313.07 | 22,457,798.93 | - | 22,457,798.93 | 5,053,004.76 | 17,404,794.17 | 2,138,953.22 | 57,165,105.59 |
| 16 | - | 114,562,112.00 | 92,104,313.07 | 22,457,798.93 | - | 22,457,798.93 | 5,053,004.76 | 17,404,794.17 | 1,859,959.32 | 59,025,064.92 |
| 17 | - | 114,562,112.00 | 92,104,313.07 | 22,457,798.93 | - | 22,457,798.93 | 5,053,004.76 | 17,404,794.17 | 1,617,355.93 | 60,642,420.85 |
| 18 | - | 114,562,112.00 | 92,104,313.07 | 22,457,798.93 | - | 22,457,798.93 | 5,053,004.76 | 17,404,794.17 | 1,406,396.46 | 62,048,817.31 |
| 19 | - | 114,562,112.00 | 92,104,313.07 | 22,457,798.93 | - | 22,457,798.93 | 5,053,004.76 | 17,404,794.17 | 1,222,953.45 | 63,271,770.75 |
| 20 | (1,458,491.14) | 114,562,112.00 | 92,104,313.07 | 22,457,798.93 | - | 22,457,798.93 | 5,053,004.76 | 18,863,285.30 | 1,152,551.99 | 64,424,322.75 |


References
- Sajid, Z.; Khan, F.; Zhang, Y. Process simulation and life cycle analysis of biodiesel production. Renew. Energy 2016, 85, 945–952. [Google Scholar] [CrossRef]
- IEA; IRENA; UNSD; WB; WHO. Tracking SDG 7: The Energy Progress Report 2021; United Nations: Washington, DC, USA, 2021. [Google Scholar]
- Nhamo, G.; Nhemachena, C.; Nhamo, S.; Mjimba, V.; Savić, I. SDG7–Ensure Access to Affordable, Reliable, Sustainable and Modern Energy; Emerald Publishing: Bingley, UK, 2020; pp. 233–262. [Google Scholar]
- Sun, X.; Liu, S.; Manickam, S.; Tao, Y.; Yoon, J.Y.; Xuan, X. Intensification of biodiesel production by hydrodynamic cavitation: A critical review. Renew. Sustain. Energy Rev. 2023, 179, 113277. [Google Scholar] [CrossRef]
- Brahma, S.; Nath, B.; Basumatary, B.; Das, B.; Saikia, P.; Patir, K.; Basumatary, S. Biodiesel production from mixed oils: A sustainable approach towards industrial biofuel production. Chem. Eng. J. Adv. 2022, 10, 100284. [Google Scholar] [CrossRef]
- Yang, L.; Takase, M.; Zhang, M.; Zhao, T.; Wu, X. Potential non-edible oil feedstock for biodiesel production in Africa: A survey. Renew. Sustain. Energy Rev. 2014, 38, 461–477. [Google Scholar] [CrossRef]
- Samuel, O.D.; Okwu, M.O.; Amosun, S.T.; Verma, T.N.; Afolalu, S.A. Production of fatty acid ethyl esters from rubber seed oil in hydrodynamic cavitation reactor: Study of reaction parameters and some fuel properties. Ind. Crops Prod. 2019, 141, 111658. [Google Scholar] [CrossRef]
- Yusuff, A.S.; Dada, T.; Olateju, I.I.; Azeez, T.M.; Azeez, S.O. Experimental investigation of influence of methyl, ethyl and methyl-ethyl ester blends of used cooking oil on engine performances and emissions. Energy Convers. Manag. X 2023, 17, 100346. [Google Scholar] [CrossRef]
- Altamirano, C.A.A.; Yokoyama, L.; de Medeiros, J.L.; Araújo, O.D.Q.F. Ethylic or methylic route to soybean biodiesel? Tracking environmental answers through life cycle assessment. Appl. Energy 2016, 184, 1246–1263. [Google Scholar] [CrossRef]
- Mandari, V.; Devarai, S. Biodiesel production using homogeneous, heterogeneous, and enzyme catalysts via transesterification and esterification reactions: A critical review. BioEnergy Res. 2022, 15, 935–961. [Google Scholar] [CrossRef]
- Likozar, B.; Levec, J. Effect of process conditions on equilibrium, reaction kinetics and mass transfer for triglyceride transesterification to biodiesel: Experimental and modeling based on fatty acid composition. Fuel Process. Technol. 2014, 122, 30–41. [Google Scholar] [CrossRef]
- Choedkiatsakul, I.; Ngaosuwan, K.; Cravotto, G.; Assabumrungrat, S. Biodiesel production from palm oil using combined mechanical stirred and ultrasonic reactor. Ultrason. Sonochem. 2014, 21, 1585–1591. [Google Scholar] [CrossRef]
- Gholami, A.; Pourfayaz, F.; Maleki, A. Techno-economic assessment of biodiesel production from canola oil through ultrasonic cavitation. Energy Rep. 2021, 7, 266–277. [Google Scholar] [CrossRef]
- Tabatabaei, M.; Aghbashlo, M.; Dehhaghi, M.; Panahi, H.K.S.; Mollahosseini, A.; Hosseini, M.; Soufiyan, M.M. Reactor technologies for biodiesel production and processing: A review. Prog. Energy Combust. Sci. 2019, 74, 239–303. [Google Scholar] [CrossRef]
- Naeem, M.; Al-Sakkari, E.; Boffito, D.; Rene, E.; Gadalla, M.; Ashour, F. Single-stage waste oil conversion into biodiesel via sonication over bio-based bifunctional catalyst: Optimization, preliminary techno-economic and environmental analysis. Fuel 2023, 341, 127587. [Google Scholar] [CrossRef]
- Zheng, H.; Zheng, Y.; Zhu, J. Recent developments in hydrodynamic cavitation reactors: Cavitation mechanism, reactor design, and applications. Engineering 2022, 19, 180–198. [Google Scholar] [CrossRef]
- Farvardin, M.; Samani, B.H.; Rostami, S.; Abbaszadeh-Mayvan, A.; Najafi, G.; Fayyazi, E. Enhancement of biodiesel production from waste cooking oil: Ultrasonic- hydrodynamic combined cavitation system. Energy Sources Part A Recover. Util. Environ. Eff. 2019, 44, 5065–5079. [Google Scholar] [CrossRef]
- Maddikeri, G.L.; Gogate, P.R.; Pandit, A.B. Intensified synthesis of biodiesel using hydrodynamic cavitation reactors based on the interesterification of waste cooking oil. Fuel 2014, 137, 285–292. [Google Scholar] [CrossRef]
- Chuah, L.F.; Yusup, S.; Aziz, A.R.A.; Bokhari, A.; Klemeš, J.J.; Abdullah, M.Z. Intensification of biodiesel synthesis from waste cooking oil (Palm Olein) in a Hydrodynamic Cavitation Reactor: Effect of operating parameters on methyl ester conversion. Chem. Eng. Process. Process. Intensif. 2015, 95, 235–240. [Google Scholar] [CrossRef]
- Laosuttiwong, T.; Ngaosuwan, K.; Kiatkittipong, W.; Wongsawaeng, D.; Kim-Lohsoontorn, P.; Assabumrungrat, S. Performance comparison of different cavitation reactors for biodiesel production via transesterification of palm oil. J. Clean. Prod. 2018, 205, 1094–1101. [Google Scholar] [CrossRef]
- Gholami, A.; Pourfayaz, F.; Saifoddin, A. Techno-economic assessment and sensitivity analysis of biodiesel production intensified through hydrodynamic cavitation. Energy Sci. Eng. 2021, 9, 1997–2018. [Google Scholar] [CrossRef]
- Mahmud, R.; Moni, S.M.; High, K.; Carbajales-Dale, M. Integration of techno-economic analysis and life cycle assessment for sustainable process design—A review. J. Clean. Prod. 2021, 317, 128247. [Google Scholar] [CrossRef]
- Thoppil, Y.; Zein, S.H. Techno-economic analysis and feasibility of industrial-scale biodiesel production from spent coffee grounds. J. Clean. Prod. 2021, 307, 127113. [Google Scholar] [CrossRef]
- Lee, J.-C.; Lee, B.; Heo, J.; Kim, H.-W.; Lim, H. Techno-economic assessment of conventional and direct-transesterification processes for microalgal biomass to biodiesel conversion. Bioresour. Technol. 2019, 294, 122173. [Google Scholar] [CrossRef]
- Gordon, R.; Gorodnitsky, I.; Grichko, V. Process for Producing Biodiesel through Lower Molecular Weight Alcohol-Targeted Cavitation. U.S. Patent 8,981,135, 17 March 2015. [Google Scholar]
- Ihoeghian, N.A.; Usman, M.A. Exergetic evaluation of biodiesel production from rice bran oil using heterogeneous catalyst. J. King Saud Univ. Eng. Sci. 2018, 32, 101–107. [Google Scholar] [CrossRef]
- Al-Saadi, L.S.; Eze, V.C.; Harvey, A.P. Techno-economic analysis of processes for biodiesel production with integrated co-production of higher added value products from glycerol. Biofuels 2020, 13, 489–496. [Google Scholar] [CrossRef]
- Santori, G.; Di Nicola, G.; Moglie, M.; Polonara, F. A review analyzing the industrial biodiesel production practice starting from vegetable oil refining. Appl. Energy 2012, 92, 109–132. [Google Scholar] [CrossRef]
- Chuah, L.F.; Klemeš, J.J.; Yusup, S.; Bokhari, A.; Akbar, M.M.; Chong, Z.K. Kinetic studies on waste cooking oil into biodiesel via hydrodynamic cavitation. J. Clean. Prod. 2017, 146, 47–56. [Google Scholar] [CrossRef]
- Trejo-Zárraga, F.; de Jesús Hernández-Loyo, F.; Chavarría-Hernández, J.C.; Sotelo-Boyás, R. Kinetics of Transesterification Processes for Biodiesel Production. In Biofuels—State of Development; IntechOpen: London, UK, 2018; pp. 149–179. [Google Scholar]
- Brennen, C.E. Cavitation and Bubble Dynamics; Oxford University Press: Oxford, UK, 1995. [Google Scholar]
- Omelyanyuk, M.; Ukolov, A.; Pakhlyan, I.; Bukharin, N.; El Hassan, M. Experimental and Numerical Study of Cavitation Number Limitations for Hydrodynamic Cavitation Inception Prediction. Fluids 2022, 7, 198. [Google Scholar] [CrossRef]
- Winterbone, D.E.; Turan, A. Chapter 15—Combustion and Flames. In Advanced Thermodynamics for Engineers, 2nd ed.; Elsevier: Amsterdam, The Netherlands, 2015. [Google Scholar] [CrossRef]
- Aigba, P.A.; Emovon, I.; Samuel, O.D.; Enweremadu, C.C.; Abdeljawad, T.; Al-Mdallal, Q.M.; Afzal, A. Exergetic Assessment of Waste Gas to Energy in a Novel Integrated NGL Recovery and Power Generation Plant. Front. Energy Res. 2022, 9, 798896. [Google Scholar] [CrossRef]
- Szargut, J. Chemical exergies of the elements. Appl. Energy 1989, 32, 269–286. [Google Scholar] [CrossRef]
- Szargut, J.; Styrylska, T. Approximate Evaluation of the Exergy of Fuels. Brennst. Waerme Kraft 1964, 16, 589–596. [Google Scholar]
- Tsatsaronis, G.; Lazzaretto, A. SPECO: A systematic and general methodology for calculating efficiencies and costs in thermal systems. Energy 2006, 31, 1257–1289. [Google Scholar]
- Boyano, A.; Blanco-Marigorta, A.; Morosuk, T.; Tsatsaronis, G. Exergoenvironmental analysis of a steam methane reforming process for hydrogen production. Energy 2011, 36, 2202–2214. [Google Scholar] [CrossRef]
- Li, Q.; Lin, Y. Exergy analysis of the LFC process. Energy Convers. Manag. 2016, 108, 348–354. [Google Scholar] [CrossRef]
- Michalakakis, C.; Fouillou, J.; Lupton, R.C.; Gonzalez Hernandez, A.; Cullen, J.M. Calculating the chemical exergy of materials. J. Ind. Ecol. 2021, 25, 274–287. [Google Scholar] [CrossRef]
- Mustapha, S.I.; Bux, F.; Isa, Y.M. Techno-economic analysis of biodiesel production over lipid extracted algae derived catalyst. Biofuels 2021, 13, 663–674. [Google Scholar] [CrossRef]
- Sinnott, R.; Towler, G. Chemical Engineering Design: Principles, Practice and Economics of Plant and Process Design; Butterworth-Heinemann: Boston, MA, USA, 2019. [Google Scholar]
- Tsagkari, M.; Couturier, J.; Kokossis, A.; Dubois, J. Early-Stage Capital Cost Estimation of Biorefinery Processes: A Comparative Study of Heuristic Techniques. ChemSusChem 2016, 9, 2284–2297. [Google Scholar] [CrossRef]
- Mata, T.M.; Pinto, F.; Caetano, N.; Martins, A.A. Economic and environmental analysis of animal fats acidity reduction by enzymatic esterification. J. Clean. Prod. 2018, 184, 481–489. [Google Scholar] [CrossRef]
- Houghton, J.T.; Meira Filho, L.G.; Lim, B.; Treanton, K.; Mamaty, I.; Bonduki, Y. Revised 1996 IPCC Guidelines for National Greenhouse Gas Inventories: Workbook; IPCC: Geneva, Swilzerland, 1996. [Google Scholar]
- Chuah, L.F.; Yusup, S.; Aziz, A.R.A.; Bokhari, A.; Abdullah, M.Z. Cleaner production of methyl ester using waste cooking oil derived from palm olein using a hydrodynamic cavitation reactor. J. Clean. Prod. 2016, 112, 4505–4514. [Google Scholar] [CrossRef]
- Ahmad, J.; Yusup, S.; Bokhari, A.; Kamil, R.N.M. Study of fuel properties of rubber seed oil based biodiesel. Energy Convers. Manag. 2014, 78, 266–275. [Google Scholar] [CrossRef]
- Blanco-Marigorta, A.; Suárez-Medina, J.; Vera-Castellano, A. Exergetic analysis of a biodiesel production process from Jatropha curcas. Appl. Energy 2013, 101, 218–225. [Google Scholar] [CrossRef]
- Velásquez, H.; De Oliveira, S.; Benjumea, P.; Pellegrini, L. Exergo-environmental evaluation of liquid biofuel production processes. Energy 2013, 54, 97–103. [Google Scholar] [CrossRef]
- Innocenzi, V.; Prisciandaro, M. Technical feasibility of biodiesel production from virgin oil and waste cooking oil: Comparison between traditional and innovative process based on hydrodynamic cavitation. Waste Manag. 2021, 122, 15–25. [Google Scholar] [CrossRef]
- Mahler, D.G.; Dominikus, B. Responsible use of natural resources: Essential for sustainable growth. In Atlas of Sustainable Development Goals 2023; World Bank: Washington, DC, USA, 2023. [Google Scholar]
- Sachs, D. From millennium development goals to sustainable development goals. Lancet 2012, 379, 2206–2211. [Google Scholar] [CrossRef]
- Usaku, C.; Yahya, A.B.; Daisuk, P.; Shotipruk, A. Enzymatic esterification/transesterification of rice bran acid oil for subsequent γ-oryzanol recovery. Biofuel Res. J. 2023, 10, 1830–1843. [Google Scholar] [CrossRef]
- Al-Saadi, L.S.; Eze, V.C.; Harvey, A.P. A techno-economic analysis based upon a parametric study of alkali-catalysed biodiesel production from feedstocks with high free fatty acid and water contents. Biofuels 2022, 13, 401–413. [Google Scholar] [CrossRef]
- Oke, E.O.; Okolo, B.I.; Adeyi, O.; Adeyi, J.A.; Ude, C.J.; Osoh, K.; Otolorin, J.; Nzeribe, I.; Darlinton, N.; Oladunni, S. Process Design, Techno-Economic Modelling, and Uncertainty Analysis of Biodiesel Production from Palm Kernel Oil. BioEnergy Res. 2021, 15, 1355–1369. [Google Scholar] [CrossRef]
- Gengiah, K.; Gurunathan, B.; Rajendran, N.; Han, J. Process evaluation and techno-economic analysis of biodiesel production from marine macroalgae Codium tomentosum. Bioresour. Technol. 2022, 351, 126969. [Google Scholar] [CrossRef]
- Niño-Villalobos, A.; Puello-Yarce, J.; González-Delgado, Á.D.; Ojeda, K.A.; Sánchez-Tuirán, E. Biodiesel and hydrogen production in a combined palm and jatropha biomass biorefinery: Simulation, techno-economic, and environmental evaluation. ACS Omega 2020, 5, 7074–7084. [Google Scholar] [CrossRef]
- Naveenkumar, R.; Baskar, G. Optimization and techno-economic analysis of biodiesel production from Calophyllum inophyllum oil using heterogeneous nanocatalyst. Bioresour. Technol. 2020, 315, 123852. [Google Scholar] [CrossRef]
- Sakdasri, W.; Sawangkeaw, R.; Ngamprasertsith, S. Techno-economic analysis of biodiesel production from palm oil with supercritical methanol at a low molar ratio. Energy 2018, 152, 144–153. [Google Scholar] [CrossRef]
- Yusuf, N.; Kamarudin, S. Techno-economic analysis of biodiesel production from Jatropha curcas via a supercritical methanol process. Energy Convers. Manag. 2013, 75, 710–717. [Google Scholar] [CrossRef]
- Zhang, Y.; Dube, M.; McLean, D.; Kates, M. Biodiesel production from waste cooking oil: 1. Process design and technological assessment. Bioresour. Technol. 2003, 89, 1–16. [Google Scholar] [CrossRef]
- Lee, S.; Posarac, D.; Ellis, N. Process simulation and economic analysis of biodiesel production processes using fresh and waste vegetable oil and supercritical methanol. Chem. Eng. Res. Des. 2011, 89, 2626–2642. [Google Scholar] [CrossRef]


| Processes | Techniques | Exergy Balance Equation |
|---|---|---|
| Transesterification | MS | |
| HC | ||
| Neutralization (catalyst removal) | MS | |
| HC | ||
| Ethanol recovery | MS | |
| Glycerol purification | MS | |
| HC | ||
| SPLITTER-1 | MS | |
| MIX-100 | MS/HC | |
| MIX-102 | MS | |
| PUMP-1 | MS/HC | |
| COMPRESSOR | MS | |
| VLV-100 | HC | |
| MIX-101 | HC | |
| MIX-103 | HC | |
| HEATER | MS/HC | |
| PUMP-2 | MC/HC |
| Economic Assumptions | Parameters |
|---|---|
| Cost of equity | 25% |
| Cost of debt | 5% |
| Cost of capital | 15% |
| Debt ratio | 0.5 |
| Discount rate | 11% |
| Tax rate | 22.50% |
| Depreciation method | Straight-line |
| Depreciation period | 10 years |
| Depreciation rate | 10% |
| 1st year direct fixed capital (DFC) | 30% |
| 2nd year direct fixed capital (DFC) | 70% |
| Project life | 15 years |
| Component | Fuel Exergy ExFUEL [MW] | Product Exergy ExPROD. MW] | Destroyed Exergy ExDESTROYED [MW] | Exergy Destruction [%] | Exergetic Fuel Depletion Ratio, yD | Irreversibility Ratio, y*D [%] | Exergy Efficiency [%] | Improvement Potential [MW] |
|---|---|---|---|---|---|---|---|---|
| Pump-1 | 0.00 | 0.00 | 0.00 | 99.56 | 0.00 | 0.08 | 0.44 | 0.00 |
| Pump-2 | 0.00 | 0.00 | 0.00 | 99.99 | 0.00 | 0.38 | 0.01 | 0.00 |
| Heater | 97.10 | 97.10 | 0.00 | 0.00 | 0.00 | 0.05 | 100.00 | 0.00 |
| Splitter-3 | 108.41 | 108.41 | 0.00 | 0.00 | 0.00 | 0.02 | 100.00 | 0.00 |
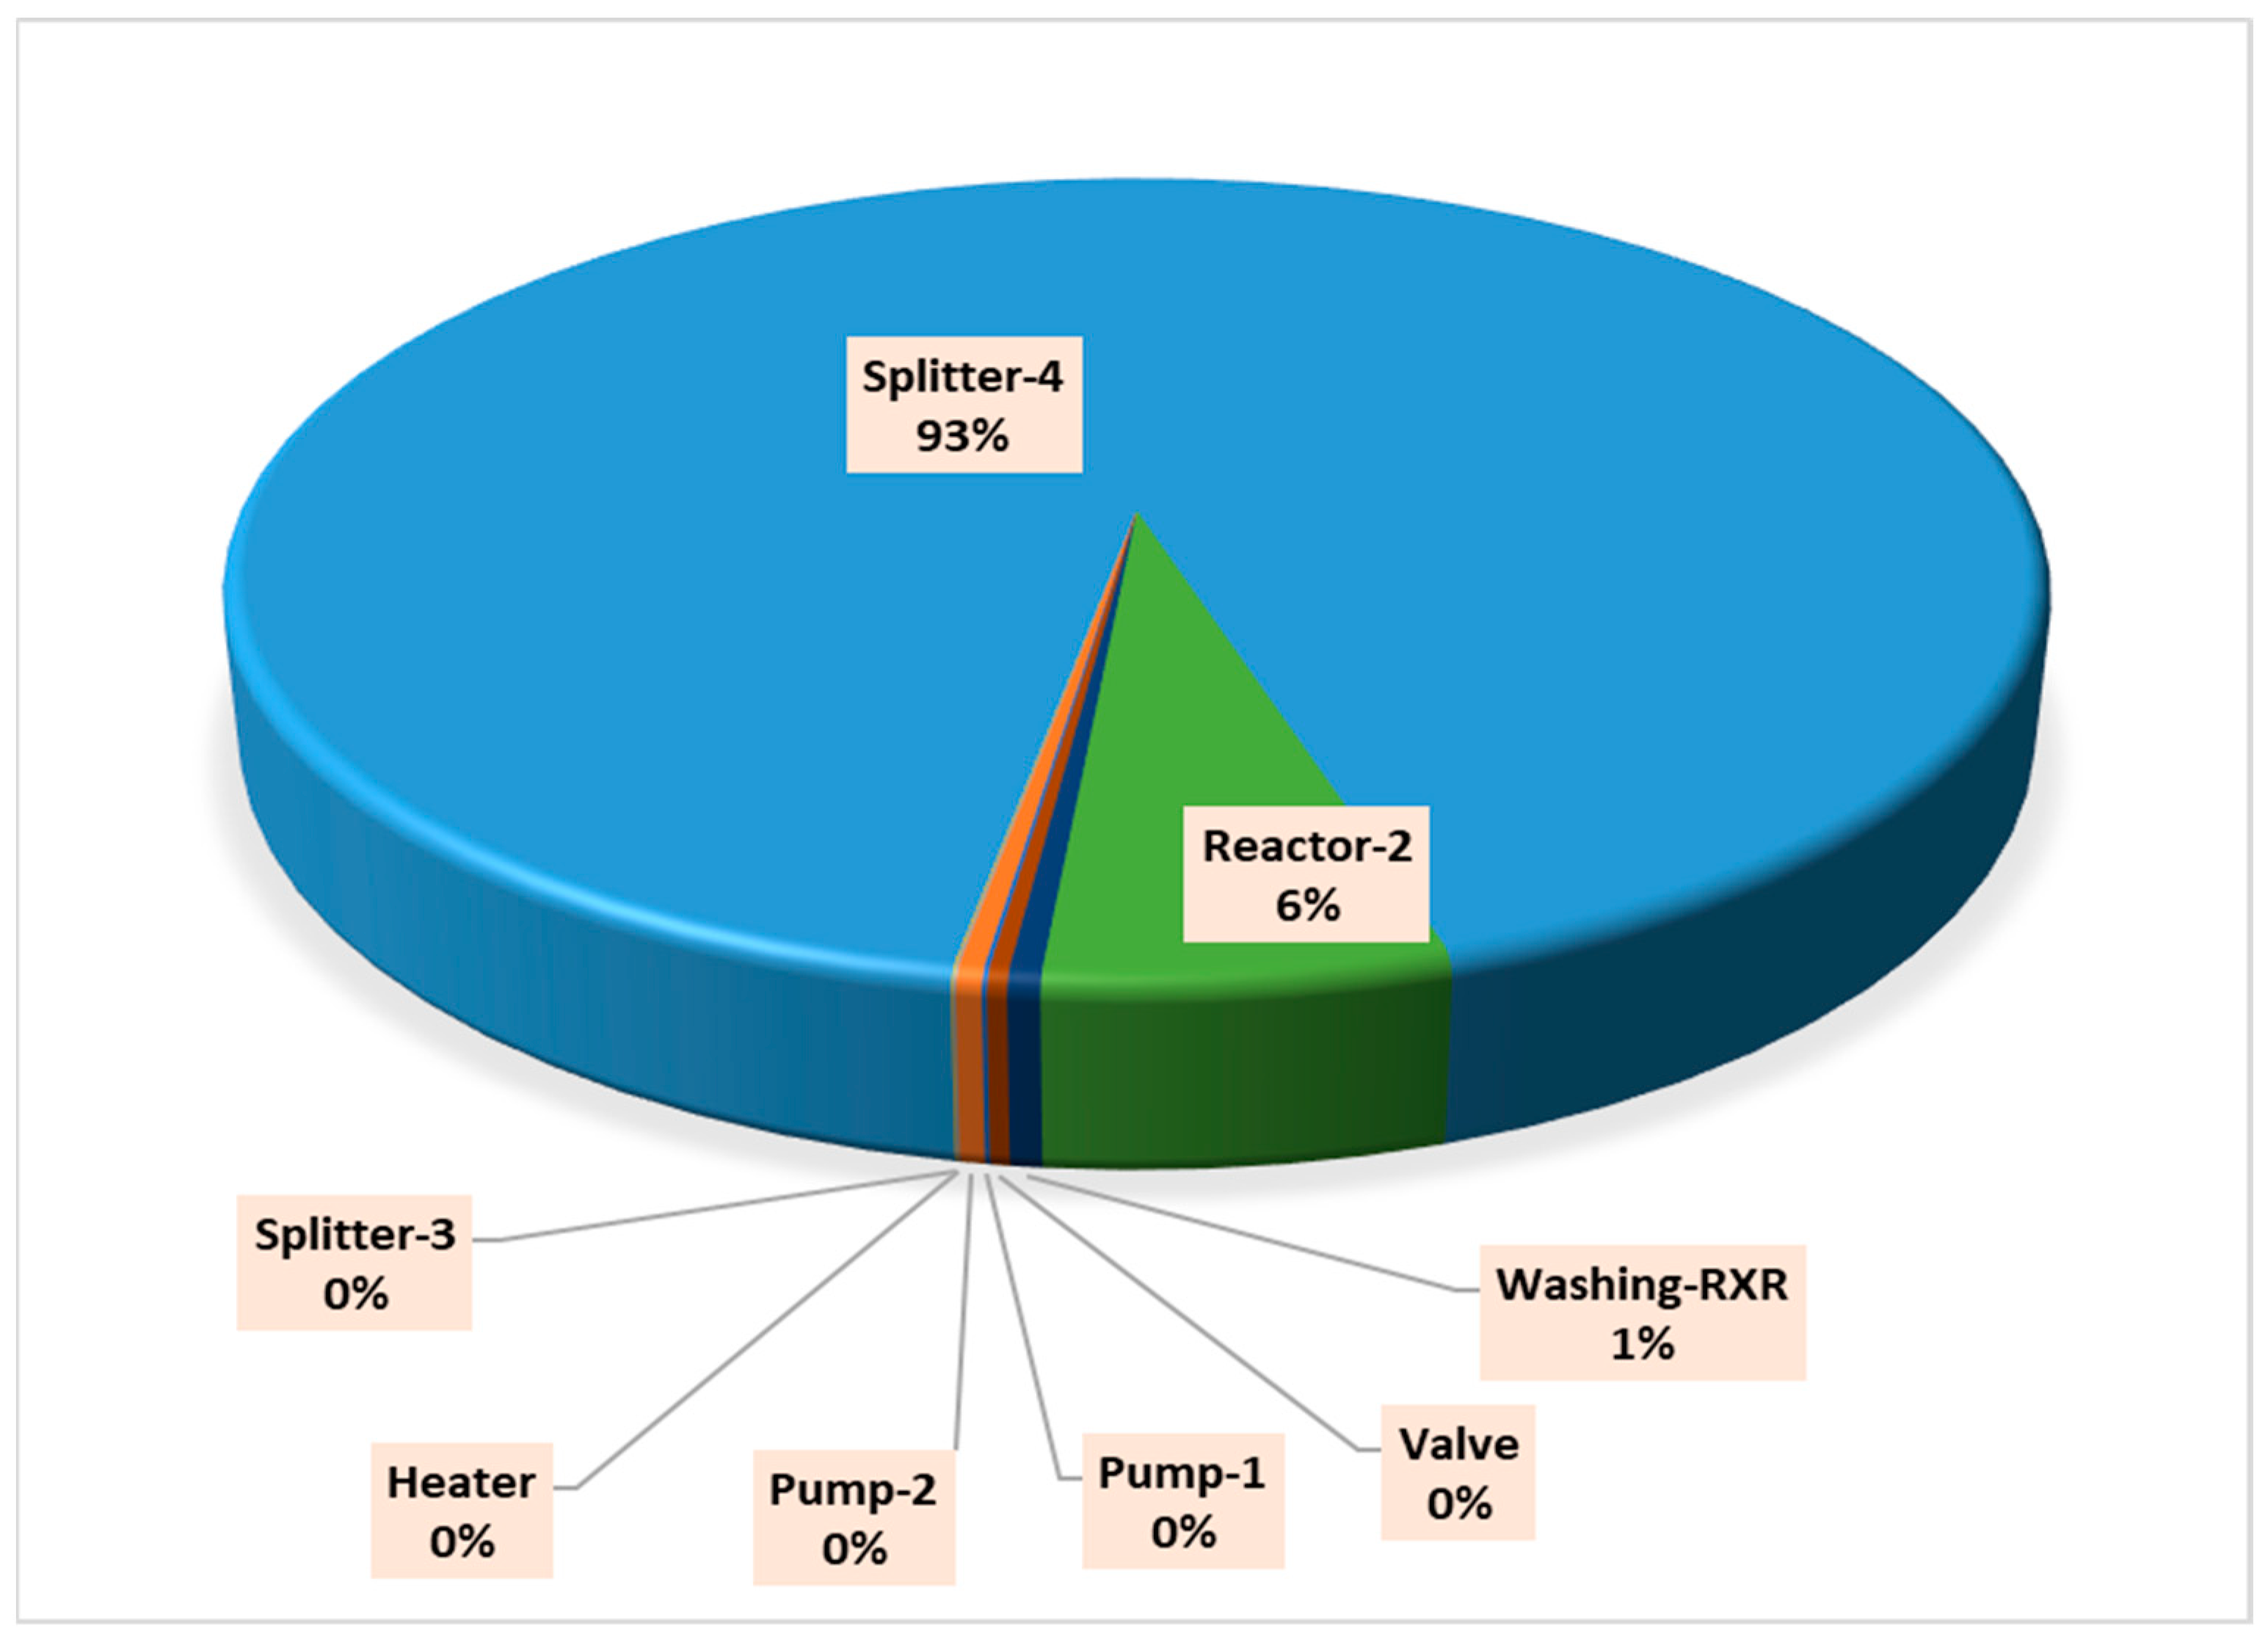
| Splitter-4 | 4.76 | 4.53 | 0.23 | 5.09 | 0.21 | 92.48 | 95.15 | 0.01 |
| Reactor-2 | 108.42 | 108.40 | 0.02 | 0.01 | 0.01 | 6.19 | 99.99 | 0.00 |
| Washing-RXR | 4.53 | 4.53 | 0.00 | 0.03 | 0.00 | 0.50 | 99.97 | 0.00 |
| Valve | 108.42 | 108.42 | 0.00 | 0.00 | 0.00 | 0.30 | 100.00 | 0.00 |
| Total | 108.42 | 97.10 | 0.25 | 0.23 | 0.23 | 100.00 | 89.56 | 0.03 |
| Component | Fuel Exergy ExFUEL [MW] | Product Exergy ExPROD. [MW] | Destroyed Exergy ExDESTROYED [MW] | Exergy Destruction [%] | Exergetic Fuel Depletion Ratio, yD | Irreversibility Ratio, y*D [%] | Exergy Efficiency [%] | Improvement Potential [MW] |
|---|---|---|---|---|---|---|---|---|
| Pump-1 | 0.00 | 0.00 | 0.00 | 99.56 | 0.00 | 0.01 | 0.44 | 0.00 |
| Pump-2 | 0.00 | 0.00 | 0.00 | 99.99 | 0.00 | 0.05 | 0.01 | 0.00 |
| Comp | 0.01 | 0.01 | 0.00 | 7.60 | 0.00 | 0.06 | 92.40 | 0.00 |
| Heater | 97.10 | 97.10 | 0.00 | 0.00 | 0.00 | 0.01 | 100.00 | 0.00 |
| Splitter-1 | 109.69 | 109.69 | 0.00 | 0.00 | 0.00 | 0.00 | 100.00 | 0.00 |
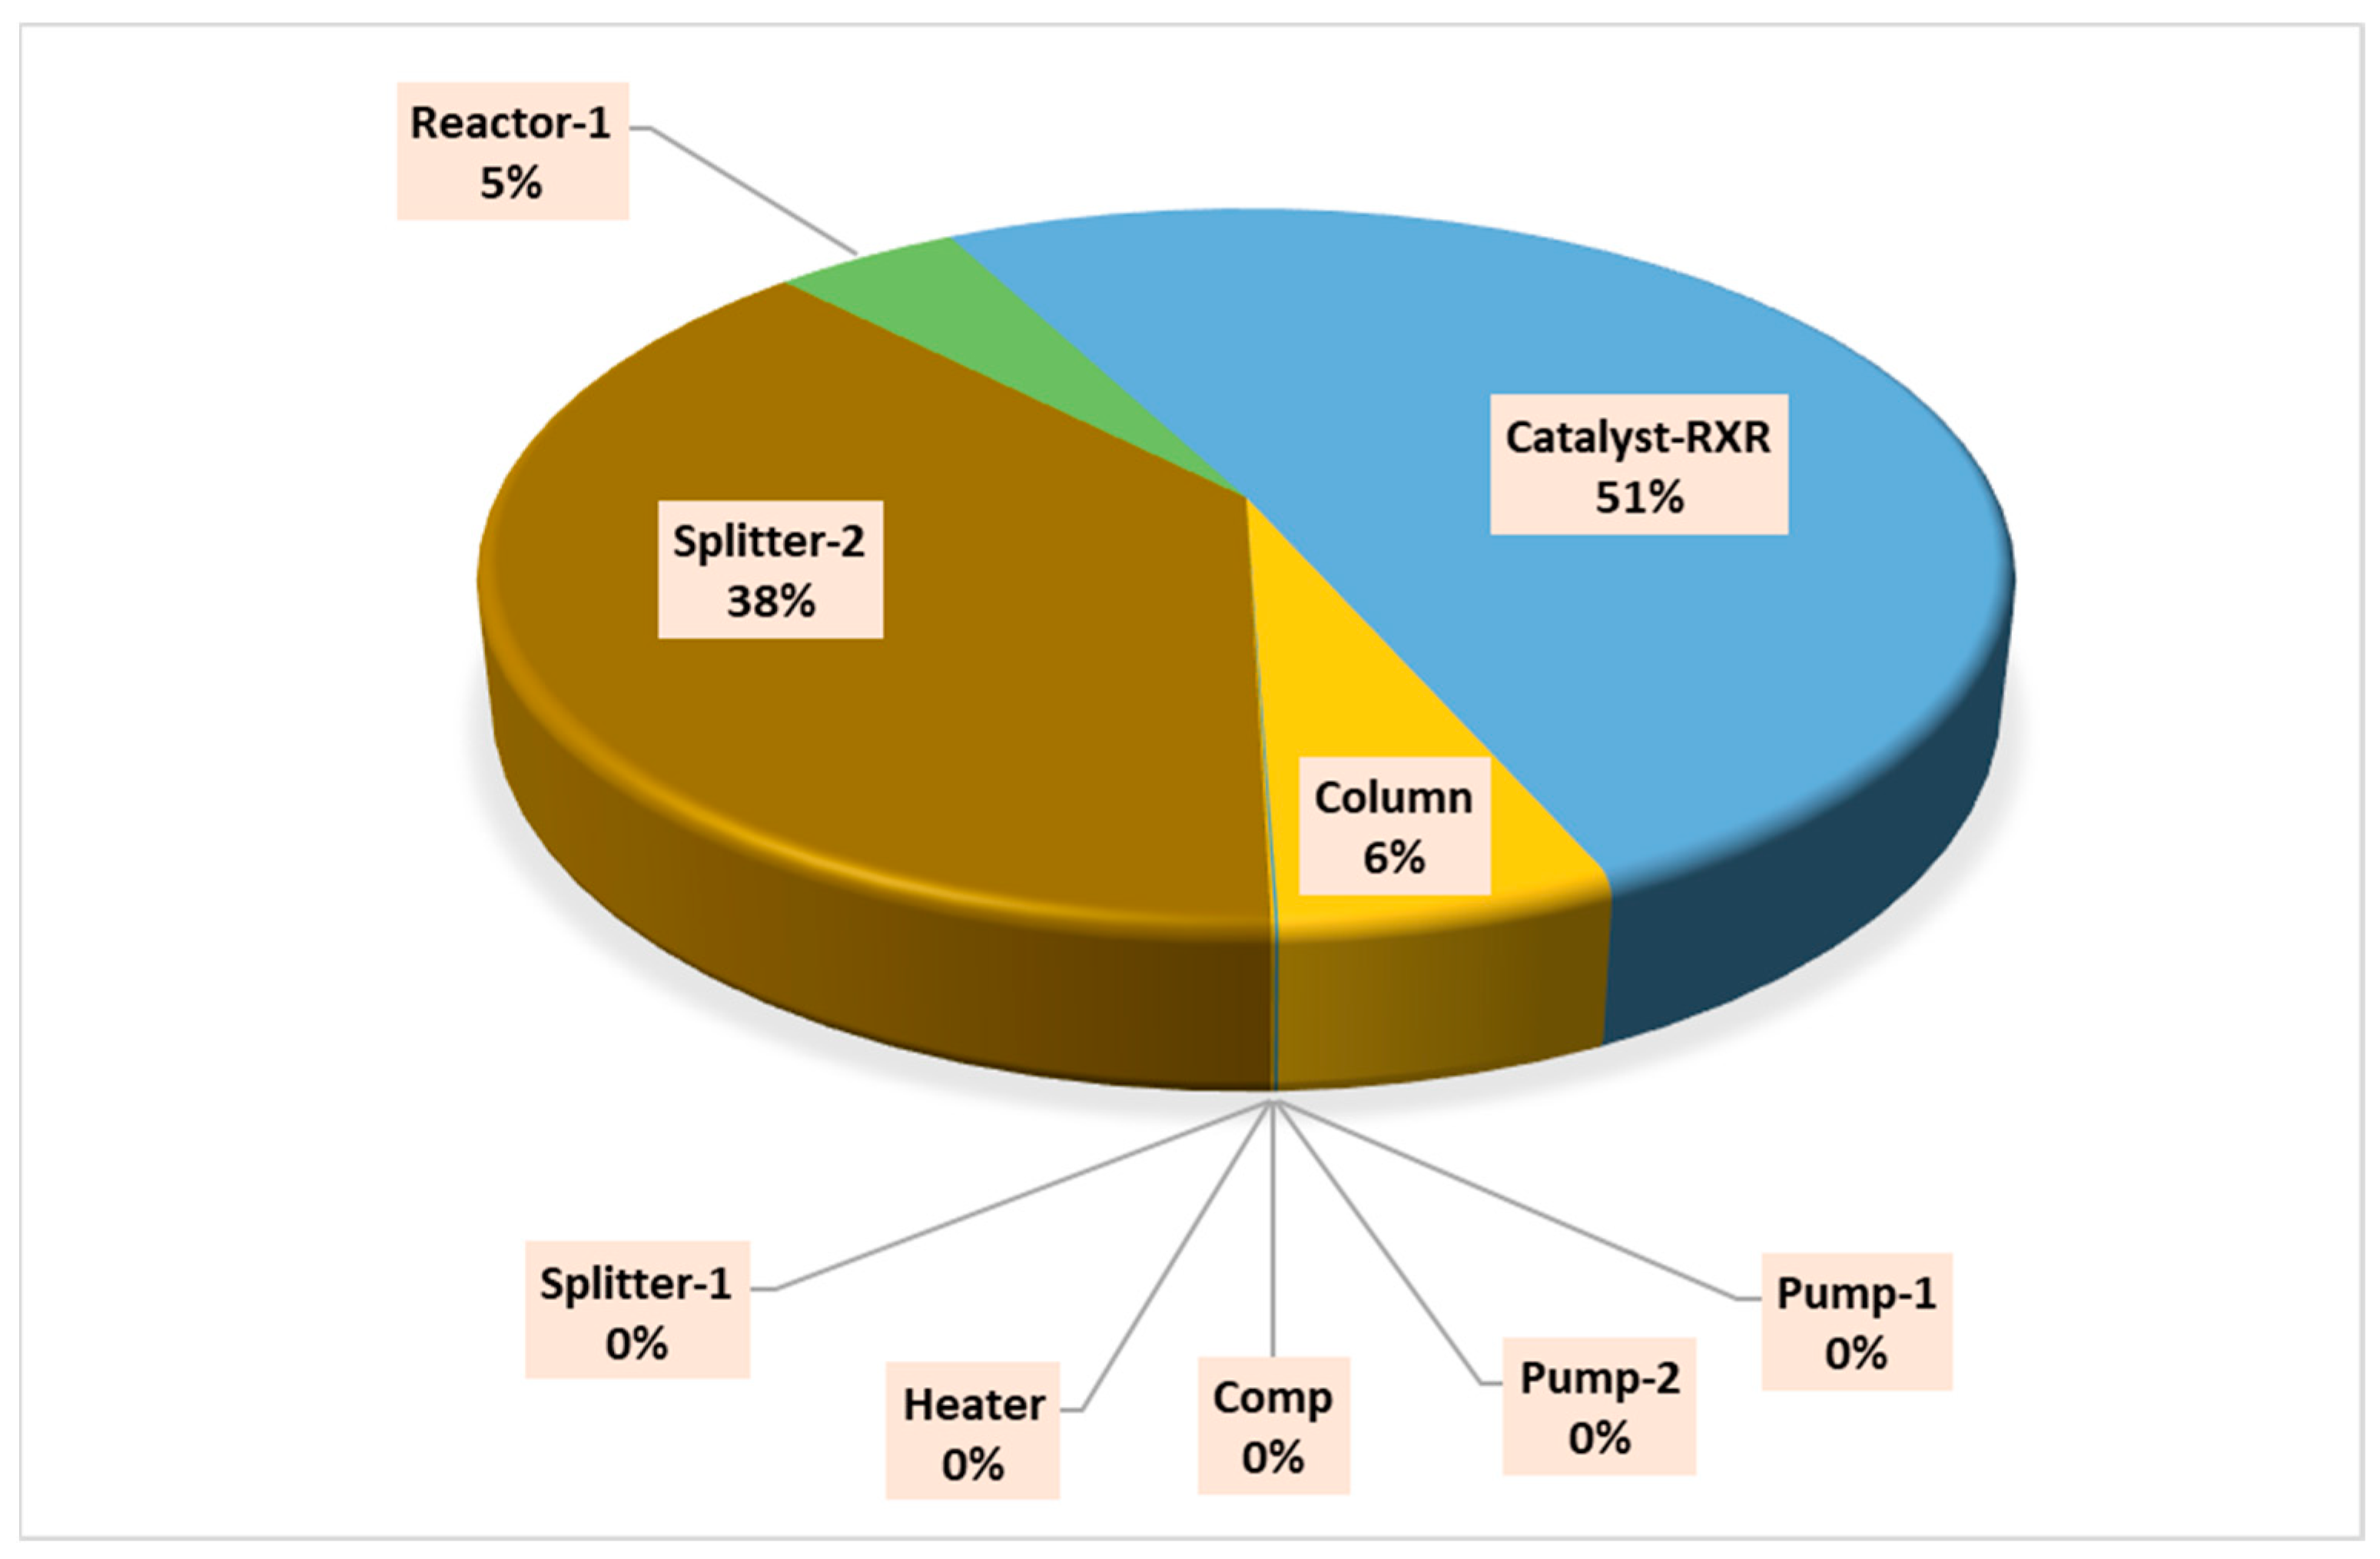
| Splitter-2 | 5.44 | 4.76 | 0.68 | 12.42 | 0.31 | 38.05 | 87.58 | 0.08 |
| Reactor-1 | 109.76 | 109.68 | 0.08 | 0.08 | 0.04 | 4.72 | 99.92 | 0.00 |
| Catalyst-RXR | 5.44 | 4.53 | 0.91 | 16.66 | 0.42 | 51.05 | 83.34 | 0.15 |
| Column | 106.86 | 106.76 | 0.11 | 0.10 | 0.05 | 6.04 | 99.90 | 0.00 |
| Total | 216.64 | 118.98 | 1.77 | 0.82 | 0.82 | 100.00 | 54.92 | 0.80 |
| Cost Parameter | Cost of MS Plant (USD) | Cost of HC Plant (USD) |
|---|---|---|
| I. Fixed Capital Investment (DC + IC) | 12,295,681.44 | 8,642,910.43 |
| A. Direct costs (DC) | 10,691,896.90 | 7,202,425.36 |
| 1. Onsite (ISBL) cost | 8,224,536.08 | 5,540,327.20 |
| 2. Offsite (OSBL) cost (30% of ISBL) | 2,467,360.82 | 1,662,098.16 |
| B. Indirect costs (IC) | 1,603,784.54 | 1,440,485.07 |
| 1. Engineering and supervision (5% of DC) | 534,594.85 | 360,121.27 |
| 2. Contingencies (10% & 15% of DC) | 1,069,189.69 | 1,080,363.80 |
| II. Other Outlays (OO) | ||
| A. Startup costs (10% of DC) | 1,069,189.69 | 720,242.54 |
| B. Working capital (15% of DC) | 2,084,919.90 | 1,458,491.14 |
| Total capital investment | 14,380,601.34 | 10,101,401.57 |
| Raw materials Cost | ||
| Rubber seed oil (86.5 ton) | 196,787.50 | 196,787.50 |
| Ethanol (13.5) | 6750.00 | 6750.00 |
| Potassium hydroxide (0.53 ton) | 307.40 | 307.40 |
| Phosphoric acid (0.2 ton) | 167.45 | 167.45 |
| Utilities | ||
| Steam (0.0227/MJ) | 9368.56 | 393.19 |
| Variable production cost/day | 213,380.91 | 204,405.54 |
| A. Direct production costs | ||
| 1. Labour (%) | 64,512.00 | 64,512.00 |
| a. Number of Labour (8) | 30,720.00 | 30,720.00 |
| b. Supervision (25% of operating labour). | 15,360.00 | 15,360.00 |
| c. Direct salary overhead (40% of (a+b)) | 18,432.00 | 18,432.00 |
| 2. Repair and maintenance (2%) | 4267.62 | 4088.11 |
| 3. Packing (2%) | 4267.62 | 4088.11 |
| 4. Waste stream disposal (1%) | 2133.81 | 2044.06 |
| B. Fixed charges | ||
| 1. Depreciation (10%) | 21,338.09 | 20,440.55 |
| Annual Production Summary | ||
| Total Fuel produced/day | 207.00 | 224.00 |
| Total production cost/day | 288,561.96 | 279,137.81 |
| Plant uptime for 7920 Hrs (90.4%) | ||
| Total production cost/yr at Uptime | 95,213,903.67 | 92,104,312.95 |
| Gross Profit/d | 320,850.00 | 347,200.00 |
| Gross Profit/yr @ uptime | 105,867,666.00 | 114,562,112.00 |
| Net Profit Per year | 10,653,762.33 | 22,457,799.05 |
| Revenues and Production Costs | HC Process | MS Process |
|---|---|---|
| Product revenue [USD] | 114,562,112.00 | 105,867,666.00 |
| Variable cost of production (VCOP) [USD] | 69,469,020.42 | 72,519,380.83 |
| Fixed cost of Production (FCOP) [USD] | 22,635,292.66 | 22,694,522.96 |
| Economic analysis | ||
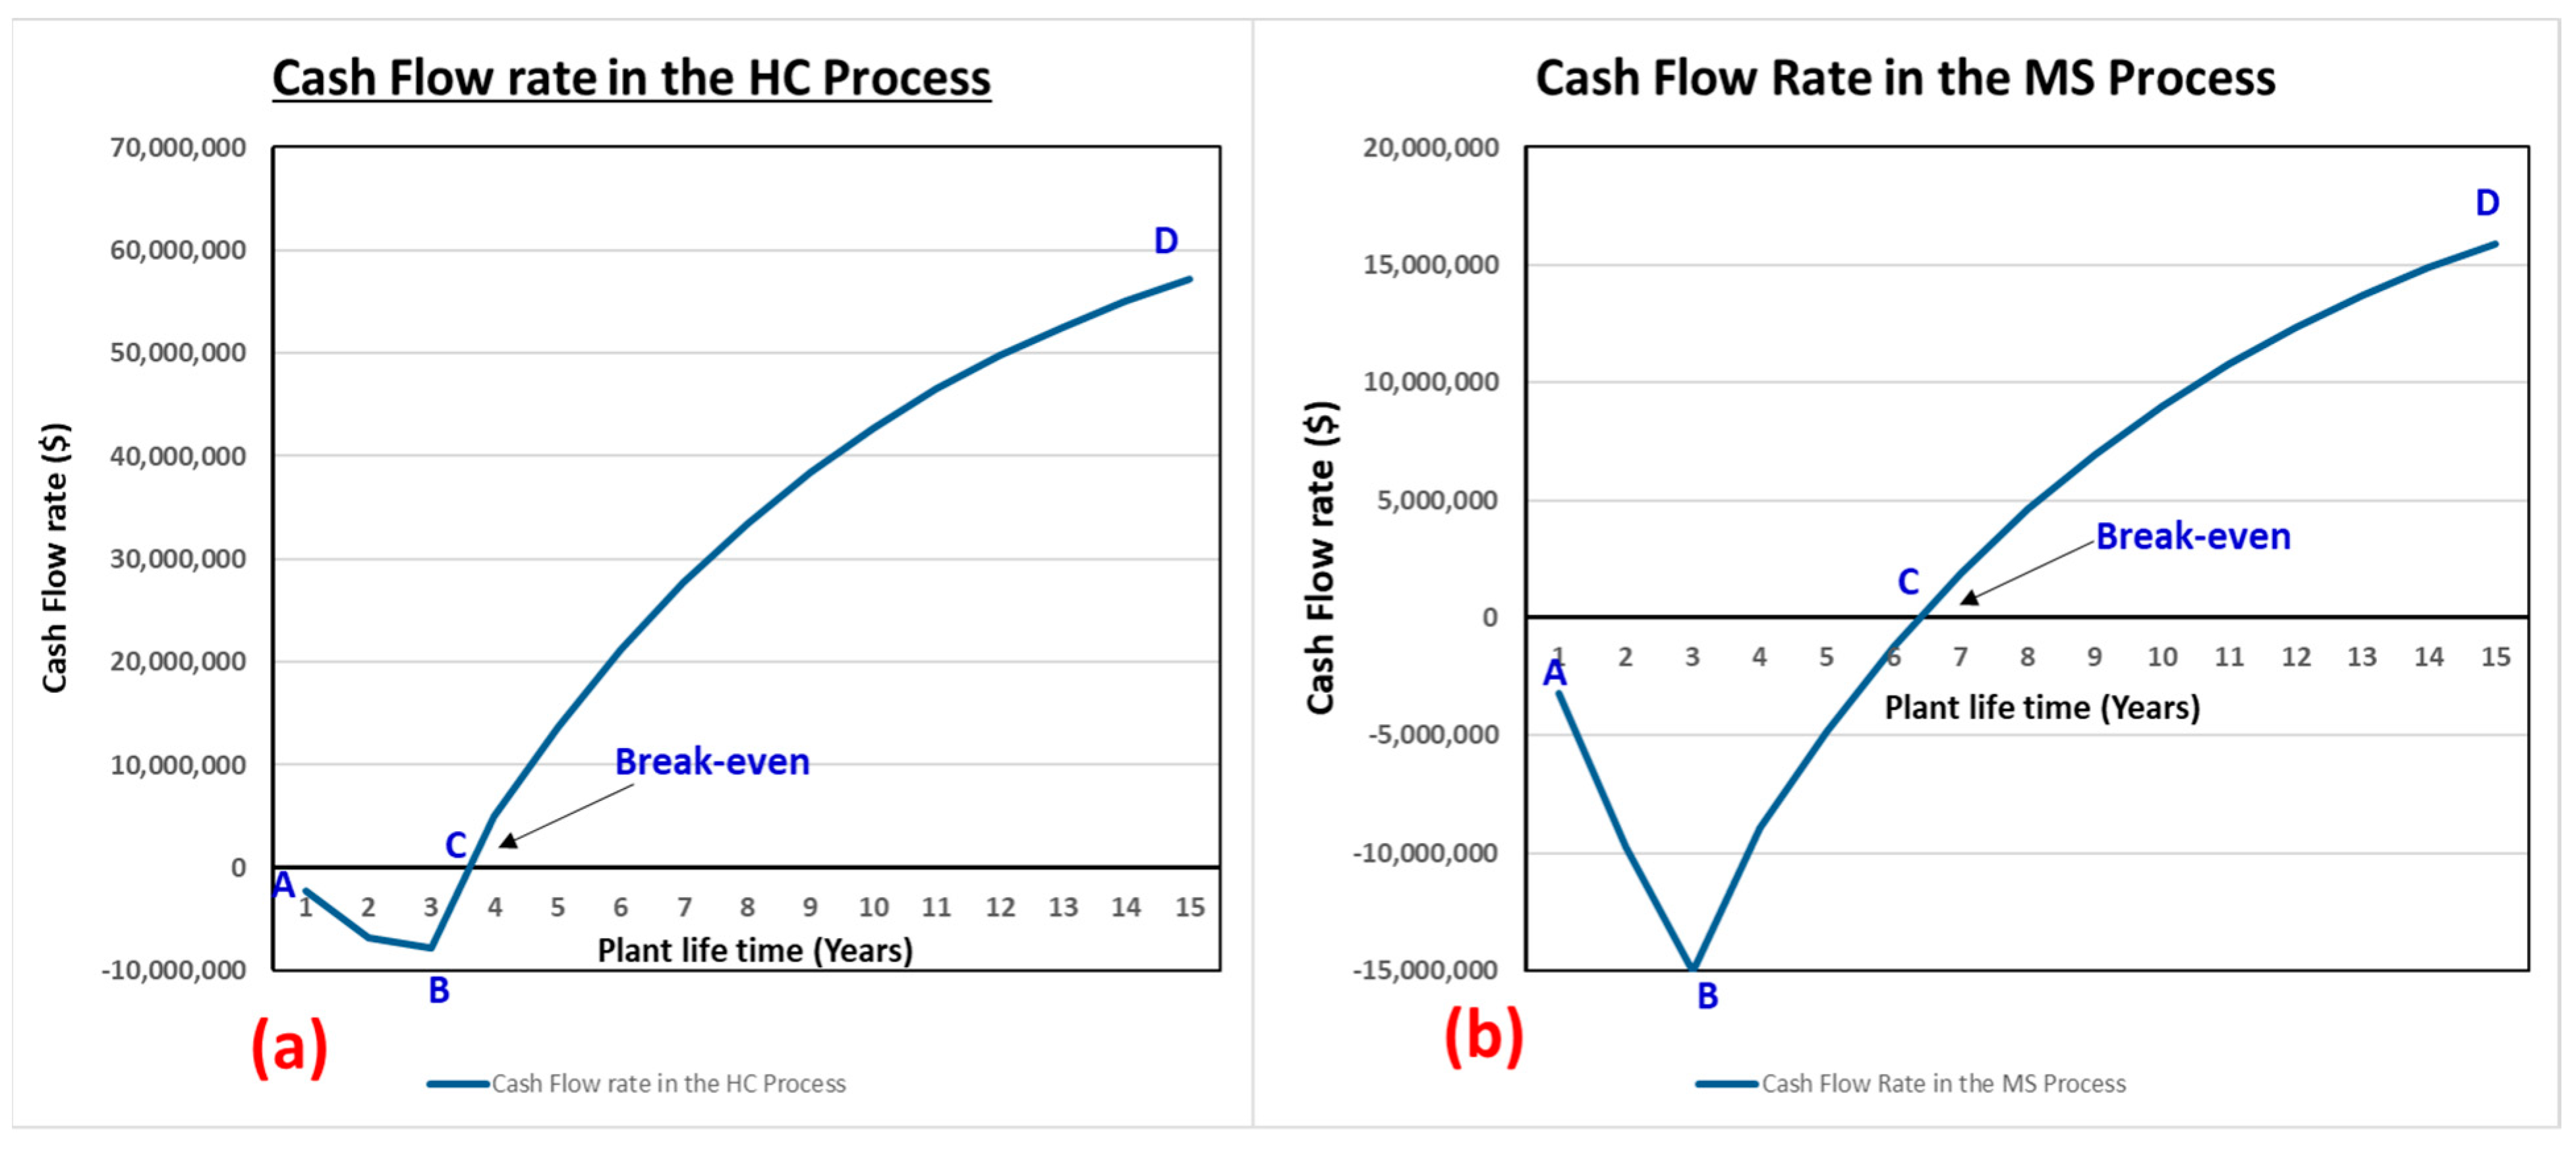
| Average cash flow/year [USD] | 17,805,196.54 | 8,545,148.81 |
| Simple pay-back period [years] | 0.57 | 1.68 |
| Return on investment (15 yrs) | 176.84% | 55.51% |
| NPV (@ 15 years) [USD] | 57,165,105.59 | 15,881,434.94 |
| NPV to year [yrs] | 4 | 7 |
| IRR [%] | 88.99 | 33.03 |
| CO2 Emissions (t CO2 eq./year) | MS Process | HC Process |
|---|---|---|
| Steam | 172.7 | 7.24 |
Disclaimer/Publisher’s Note: The statements, opinions and data contained in all publications are solely those of the individual author(s) and contributor(s) and not of MDPI and/or the editor(s). MDPI and/or the editor(s) disclaim responsibility for any injury to people or property resulting from any ideas, methods, instructions or products referred to in the content. |
© 2023 by the authors. Licensee MDPI, Basel, Switzerland. This article is an open access article distributed under the terms and conditions of the Creative Commons Attribution (CC BY) license (https://creativecommons.org/licenses/by/4.0/).
Share and Cite
Samuel, O.D.; Aigba, P.A.; Tran, T.K.; Fayaz, H.; Pastore, C.; Der, O.; Erçetin, A.; Enweremadu, C.C.; Mustafa, A. Comparison of the Techno-Economic and Environmental Assessment of Hydrodynamic Cavitation and Mechanical Stirring Reactors for the Production of Sustainable Hevea brasiliensis Ethyl Ester. Sustainability 2023, 15, 16287. https://doi.org/10.3390/su152316287
Samuel OD, Aigba PA, Tran TK, Fayaz H, Pastore C, Der O, Erçetin A, Enweremadu CC, Mustafa A. Comparison of the Techno-Economic and Environmental Assessment of Hydrodynamic Cavitation and Mechanical Stirring Reactors for the Production of Sustainable Hevea brasiliensis Ethyl Ester. Sustainability. 2023; 15(23):16287. https://doi.org/10.3390/su152316287
Chicago/Turabian StyleSamuel, Olusegun David, Peter A. Aigba, Thien Khanh Tran, H. Fayaz, Carlo Pastore, Oguzhan Der, Ali Erçetin, Christopher C. Enweremadu, and Ahmad Mustafa. 2023. "Comparison of the Techno-Economic and Environmental Assessment of Hydrodynamic Cavitation and Mechanical Stirring Reactors for the Production of Sustainable Hevea brasiliensis Ethyl Ester" Sustainability 15, no. 23: 16287. https://doi.org/10.3390/su152316287
APA StyleSamuel, O. D., Aigba, P. A., Tran, T. K., Fayaz, H., Pastore, C., Der, O., Erçetin, A., Enweremadu, C. C., & Mustafa, A. (2023). Comparison of the Techno-Economic and Environmental Assessment of Hydrodynamic Cavitation and Mechanical Stirring Reactors for the Production of Sustainable Hevea brasiliensis Ethyl Ester. Sustainability, 15(23), 16287. https://doi.org/10.3390/su152316287