Review

Company-Level Factors of Non-Financial Reporting Quality under a Mandatory Regime: A Systematic Review of Empirical Evidence in the European Union

by
Oana Marina Radu
,
Voicu D. Dragomir
* and
Ningshan Hao
Faculty of Accounting and Management Information Systems, Bucharest University of Economic Studies, 010374 Bucharest, Romania
*
Author to whom correspondence should be addressed.
Sustainability 2023, 15(23), 16265; https://doi.org/10.3390/su152316265
Submission received: 22 October 2023 / Revised: 19 November 2023 / Accepted: 22 November 2023 / Published: 24 November 2023
(This article belongs to the Special Issue ESG Impact Management and Corporate Social Responsibility)

Abstract

:
The relationship between non-financial reporting quality (NFRQ) and various company-level factors has been studied extensively, considering the mandatory requirements applicable under the Non-Financial Reporting Directive 2014/95/EU (NFRD) of the European Union. The purpose of this research is to systematize the results of previous published studies on the relationship between NFRQ and company size, financial performance, corporate governance, market performance, and sustainability performance, under a mandatory regime. Our study contributes to the literature by proposing a taxonomy of company-level factors grouped into five categories. We analyze the post-2017 period, focusing on the application of NFRD in the European Union. By applying systematic inclusion and exclusion criteria to a population of 618 articles from Scopus, we obtain a sample of fifteen articles that are subject to an in-depth analysis of correlation matrices. The systematic review resorts to the vote counting methodology to assess the existence and strength of relationships between the NFRQ and company-level factors, based on correlation coefficients. The summarized results indicate that company size, corporate governance, and sustainability performance are positive factors of NFRQ. Regarding corporate governance, we find that board independence, board size, foreign ownership, gender diversity, corporate governance quality, the existence of a sustainability committee, and sustainability-linked remuneration positively influence NFRQ. Our findings emphasize the need to explicitly consider the role of corporate governance and sustainability performance in improving NFRQ while transitioning to improved corporate sustainability reporting under the new Corporate Sustainability Reporting Directive 2022/2464 (CSRD). Our study has implications for academics who seek to engage in empirical research on various factors with positive or negative influence on sustainability reporting, throughout the transition from the NFRD to the CSRD. Policymakers may find our study useful in addressing specific areas of sustainability reporting that have a negative impact on corporate transparency, while practitioners may obtain valuable information on the challenges of transitioning to sustainability reporting and the implementation of mandatory assurance.

1. Introduction

It is crucial for companies to have the ability to identify threats in advance, as this may reduce bankruptcy risks. Kaczmarek et al. [1] proposed quantitative models in which prosperity is evaluated based on predefined selected financial indicators. These models are expected to evolve by including non-financial indicators and sustainability considerations [2]. The integration of sustainability issues into the operational activities of a company becomes key to its survival on the market. This is communicated in a structured manner and covers environmental, social, and governance (ESG) aspects, defined as non-financial information (NFI). In the past two decades, the online disclosure of NFI has become a generalized practice [3]. Knowledge and technical resources are needed to prepare a report that is reliable and useful to external constituents [4]. Moreover, the social fabric of each country includes cultural expectations and values that would shape social expectations about organizational behaviors [5].
Non-financial reporting topics contribute to understanding the overall organizational performance of a company, along with financial and operational matters. There is institutional pressure on businesses to comply with regulatory requirements and standards on ESG disclosures [6]. However, due to the lack of reporting frameworks and methodologies on this matter, the quality of NFI is often debated. Various stakeholders, including investors and regulators are concerned about the ability of NFI to accurately describe the “sustainability” of business strategies [7]. Moreover, companies have a responsibility to disclose NFI that is relevant, reliable, comparable, and useful to stakeholders while avoiding greenwashing [8].
For the past ten years, the European Union (EU) has committed to implementing mandatory sustainability reporting [9,10]. In its initial phase, it was called “non-financial reporting” and was mandated through the Non-Financial Reporting Directive 2014/95/EU (abbreviated NFRD). This directive was adopted in 2014 and entered into force in 2017. The reporting requirements outlined in the NFRD pertain to disclosing non-financial information for large public-interest entities. Companies can use various frameworks, and assurance by an auditor was not required. However, the NFRD lacked reference to applicable reporting standards, so that some of the target companies resorted to the Global Reporting Initiative (GRI) standards [10].
In the present article, we conducted a systematic review of the literature [11] with the aim of exploring the impact of company-level factors on the quality of non-financial reporting in a mandatory setting (i.e., under the NFRD). We identified all relevant papers using combined keywords, defined inclusion and exclusion criteria, and obtained our final sample for further analysis. The second screening layer was defined at the level of individual variables that are correlated with non-financial reporting quality (NFRQ). All relevant variables were mapped into five thematic categories, discussed in the context of appropriate theories. Compared to the most important reviews in the domain [12,13,14,15], this is the first study that uses the NFRD criterion for the purpose of a systematic review.
As Samani et al. [16] pointed out, the NFRD and its reporting requirements were not capable of harmonizing non-financial reporting and achieving NFI comparability in Europe. Recognizing this gap, the European Union deemed it necessary to expand sustainability reporting requirements through the new Corporate Sustainability Reporting Directive 2022/2464 (abbreviated CSRD), effective from 5 January 2023. The CSRD widens the scope of reporting obligations, encompassing a more diverse set of companies, while also streamlining the reporting process through standardization. This EU initiative represents a key step in the harmonization of sustainability reporting in the post-2024 period. This is similar to the harmonization of accounting rules in the past, which were the prerequisites for strengthening corporate reporting in Europe [17].
There is a lack of specific literature regarding the effect of relevant legislation in the European Union. Several systematic reviews of the literature [12,13,14,15] provided important summaries of empirical evidence on the link between corporate governance and non-financial reporting but failed to contribute a detailed analysis of the relationship between company-level factors and the quality of non-financial reporting in the European Union after the NFRD adoption. Few studies in the literature have analyzed the relationships between NFRQ and financial performance [14], market performance, or sustainability performance in the context of the European Union. The relationship between NFRQ, on the one hand, and company size, corporate governance variables, and profitability, on the other hand, was previously investigated in the dedicated literature but not with a focus on the European Union [12,13,15,18].
To address the research gap, correlations between NFRQ and company-level factors were collected and summarized in the present review. The company-level factors were grouped into five thematic categories: company size, financial performance, corporate governance, market performance, and sustainability performance. Variables pertaining to financial performance and corporate governance were the most prominent and numerous. The results show that company size, corporate governance, and sustainability performance are positive factors of non-financial reporting quality. Also, there is a mixed relationship between market performance and NFRQ. Conversely, inconclusive results are identified in respect to the relationship between financial performance and NFRQ.
The structure of the present article is as follows. To define the research questions of the study, previous review articles were screened for the link between various company-level variables and non-financial reporting quality. The methodology section includes details regarding sample selection, data collection, and analysis. The results summarize the relationship between NFRQ and variables collected in five thematic categories. The final section discusses our findings in relation to the research questions, implications, limitations, and future research.

2. Literature Review

Non-financial information (NFI) helps companies, investors, and other stakeholders in the decision-making process, so that the value of NFI increases over time. Some businesses may be considered more attractive investment opportunities if the market and stakeholders assess a strong commitment to sustainability [19]. The NFI is disclosed through corporate annual reports, social media, discussions at various events, and other corporate communications. In this sense, NFI represents the basis of non-financial reporting (NFR), which determines sustainable changes within the companies. However, the relationship between NFR and sustainable change within and beyond the organization is fraught with difficulties [20]. Furthermore, the advertised “sustainable change” is meaningless if it does not materialize into beneficial impacts on society and the natural environment [20].
The non-financial statement (or the integrated report) offers a comprehensive picture of organizational performance [4]. This supports the stakeholders’ evaluation of a company’s commitment to sustainable practices [21]. The quality of non-financial reporting refers to “a calculation of scores that can serve as an indication of the level of information quality when aggregated” [22]. Non-financial reports must address environmental, social, employee, human rights, and anti-corruption aspects, including business models, policies, outcomes, risks, and key performance indicators [23]. Managers can create a picture of a more attractive company for investors from the perspective of financing costs. Furthermore, through sustainability reporting, corporate transparency increases proportionally to investors’ trust [24]. Thus, non-financial disclosures can improve investor confidence, strengthen communication with stakeholders, and reduce information asymmetry [25]. In many research articles, the focus has been on integrated reporting, which is mandatory in Australia, South Africa, and other African countries [18], just as the NFRD and CSRD in the European Union.
Before CSRD, there was a lack of standardization regarding non-financial information [26]. This has been one of the most significant challenges in the process of external assurance of non-financial statements [19,27]. In some cases, companies would report long narratives that are not relevant to stakeholders. To overcome these challenges, companies should disclose their NFI in a more structured format (for example, by applying the Global Reporting Initiative—GRI Standards) and obtain external assurance for their reports. Auditing firms have adapted their services to provide limited assurance in a variety of fields that are outside the scope of the statutory financial audit [28]. For an EU sample, Krasodomska et al. [29] found that larger companies tend to assure their sustainability reports more often, while those operating in environmentally sensitive industries are more reluctant in this regard. The CSRD imposes mandatory limited assurance on sustainability reports, starting with 2024.
In the European Union, NFI is disclosed under a mandatory regime. Before 2024, sustainability reporting standards such as the GRI Standards have helped companies fulfill their obligations, with respect to environmental, social, and governance (ESG) factors [25]. If the ESG reporting framework is too extensive and complex, it can trigger confusion among stakeholders [7]. Furthermore, it may become difficult for managers in charge of NFR to cope with the increased pressures from various groups of stakeholders. Aluchna et al. [30] observed that companies tend to disclose only favorable information about their environmental or social performance, highlighting an excessively good public image and potential greenwashing. For this reason, the CSRD introduced the concept of “double materiality” to balance positive and negative sustainability disclosures [31].
Various characteristics of the firm can influence the decision-making process within an organization. Company size, industry, and profitability, as well as corporate governance structures (e.g., board size, board diversity) and the external economic and legal environment may have a significant impact on NFR. These relationships have been systematically explored in several literature reviews and meta-analyses. For example, the relationship between profitability and sustainability reporting is characterized by inconclusive results [14]. Another important finding is that the quality of overall ESG management is a positive factor of the quality of non-financial reporting [12]. From another perspective, companies in environmentally sensitive industries tend to issue higher-quality external reports [32]. However, the focus on integrated reporting and various other frameworks (such as the GRI Standards) is marginally relevant to the effects of mandatory non-financial reporting under the NFRD in the European Union.
Among company-level factors, corporate governance was explored most prominently in relation to sustainability reporting [18]. Corporate governance indicators include board independence, director expertise, board diversity, and frequency of board meetings. More specifically, sustainable board governance is operationalized through gender diversity, expertise, and sustainability-related executive compensation, and was found to positively influence corporate social responsibility [15]. Similarly, the existence of the sustainability committee is a positive factor of sustainability reporting and performance [13]. Furthermore, the level of risk disclosure included in sustainability reports is positively influenced by the independence and size of the board [33]. However, we still lack an understanding of how the quality of NFR in the European Union is affected by other variables such as foreign or state ownership, and sustainability strategies. The impact of other factors, including company size and market performance, was not part of the analysis in previous reviews [12,13,15].
In systematic reviews, company-level factors were analyzed in relation to non-financial reporting formats and quality. The focal variables included ESG management [12], environmentally sensitive industries [32], company size [14], profitability as a measure of financial performance [14], governance structures [15,18], the existence of the sustainability committee [13], board independence [14], directors’ expertise, board diversity, and frequency of board meetings [14]. These studies reflected various periods, pre-NFRD or during-NFRD applicability (starting with the financial year 2017). However, no study exclusively addressed the period when the NFRD entered into force. Moreover, the samples used in these reviews covered the European Union together with other countries and continents, and these samples were not focused on European Union countries. These are the research gaps that we have chosen to address in the present study.
We summarize the existing systematic literature reviews in Table 1, to provide more clarity on the identified research gaps. Thus, we contribute to the literature through the novelty of our study, which is reflected in the following aspects:
  • We specifically analyze the impact of Directive 2014/95/EU (NFRD) because this represents the mandatory regime in the EU regarding non-financial reporting;
  • We address non-financial reporting quality in relation to company-level factors in a mandatory setting, starting with 2017 as the year when the NFRD entered into force;
  • Our proposed thematic categories refer to company size, financial performance, corporate governance, market performance, and sustainability performance;
  • The research objective is novel, as we focus on the relationship between company-level factors and non-financial reporting quality. Based on the results highlighted in Table 1, there are no previous studies that aim to address the same research objective as our study;
  • We focus on European Union countries, under a mandatory and uniform regime. This approach ensures maximum comparability of the reviewed aspects. This is because reporting frameworks and regulatory requirements may differ significantly between countries on different continents;
  • We used a consistent mapping of company-level variables to ensure the comparability of the reviewed studies.
Therefore, we propose a systematic review of company-level factors of NFR quality under a mandatory regime (European Union Directive 2014/95/EU, abbreviated as NFRD). We address the research gaps identified in the literature by cumulatively assessing the influence of five categories of indicators summarized in the following research questions.
RQ1: Is company size significantly related to the quality of non-financial reporting under the NFRD?
RQ2: Is financial performance significantly related to the quality of non-financial reporting under the NFRD?
RQ3: Does corporate governance have significant influence on the quality of non-financial reporting under the NFRD?
RQ4: Is market performance significantly related to the quality of non-financial reporting under the NFRD?
RQ5: Is overall sustainability performance significantly related to the quality of non-financial reporting under the NFRD?
Table 1. Research gap on company-level factors and their association with non-financial reporting quality.
StudyResearch ObjectiveReview MethodCountries/ContinentsYears Used in SampleNon-Financial Reporting Frameworks AnalyzedJournal (IF 2022)
Benvenuto et al. (2023) [14]Developing a unitary and compact understanding of the concept of Sustainability Reporting in the multi-theory contextSystematic literature review (qualitative)Not mentionedNot mentioned. The focus is on corporate sustainability since 2010.Not mentioned. Some studies included in the sample are based on the Global Reporting Initiative StandardsHeliyon (IF = 4)
Crous et al. (2022) [32]Comparison between the impact of the different types of reporting and financial sustainabilitySystematic literature review (qualitative), thematic analysis, inter-textual coherence process, synthesized coherenceNot mentioned2015–2020Integrated Reporting Framework,
Global Reporting Initiative Standards
ESG reporting—not mentioning the specific frameworks
EuroMed Journal of Business (IF = 5.2)
Di Vaio et al. (2020) [34]Investigation of the role of human resources in non-financial reportingSystematic literature review, bibliometric analysis, content analysisNot mentioned2013–2019EU Directive 2014/95/EU,
Sustainable Development Goals
Journal of Cleaner Production (IF = 11.1)
Dragomir and Dumitru (2023) [18]Systematize the results of studies on the relationship between corporate governance and integrated reporting qualityMeta-analysisNot mentioned2015–2022Integrated Reporting FrameworkMeditari Accountancy Research (IF = 3.5)
Fiandrino et al. (2022) [23]Analyze, classify, and interpret different insights that emerged during the consultation process of NFRD, on the disclosure quality of non-financial informationIntegrative literature review, content analysis, critical analysis (qualitative)Not mentioned2016–2021EU Directive 2014/95/EUJournal of Applied Accounting Research (IF = 3)
Manes-Rossi et al. (2020) [35]Understanding of different reporting formats that public sector organizations adopt to report different dimensions of performance to internal and external stakeholdersStructured literature review, comprehensive review, manual coding, critical analysisOceania, North America, South America, Africa, Asia,
UK, and other European countries included but not specified
2002–2019GRI Standards,
Integrated Reporting Framework
Journal of Public Budgeting, Accounting & Financial Management (IF = 3.1)
Opferkuch et al. (2021) [36]Exploring how companies could include circular economy within their corporate sustainability reportsSystematic literature review, content analysis, cross-referencing methodologyNot mentioned2012–2020Guidelines on non-financial reporting (2017/C215/01)—linked to EU Directive 2014/95/EU,
CDP, Climate Disclosure Standards Board (CDSB),
GRI Standards,
Integrated Reporting Framework
Business Strategy and the Environment (IF = 13.4)
Velte and Stawinoga (2017) [12]Determining the factors that contribute to integrated reporting implementation and qualitySystematic literature review (qualitative)South Africa, Australia, USA, Denmark, Netherlands, Italy, Malawi, New Zealand, UK2012–2016GRI Standards,
Integrated Reporting framework
Journal of Management Control (IF = 3.3)
Velte and Stawinoga (2020) [13]Influence of corporate social responsibility (CSR) and chief sustainability officer on CSR reporting, CSR assurance and CSR performanceSystematic analysis, vote counting, content analysis, comprehensive analysisAustralia, USA, Canada, China, Malaysia, India, Pakistan, Turkey, UK, Spain, France, Germany, Italy, Netherlands, and other European countries included but not specifiedPre-2017—with 47 out of 48 studies (one starts with 1997) and 2017 (only one study out of 48)Not mentionedJournal of Management Control (IF = 3.3)
Velte (2023) [15]Analysis of the impact of sustainable board governance on corporate social responsibility in the European capital marketStructured and integrative literature review, vote counting, content-analysis, comprehensive analysisFrance, Germany, Italy, Poland, Spain, Sweden, UK, and other European countries included but not specified2009, 2011, 2013, 2015–2021EU Green Deal
Journal of Global Responsibility (IF = 1.6)

3. Methodology

The systematic literature review regarding non-financial reporting quality is an established methodology in the field. Velte and Stawinoga [12] identified relevant studies through a comparison of international databases, using a targeted search based on primary keywords along with other inclusion criteria, such as study periods and methods described in research methodologies. Similarly, a subsequent study by Velte and Stawinoga [13] was a systematic literature review on the symbolic versus substantive effects of sustainability-related board composition, based on selected quantitative peer-reviewed empirical studies. Velte [15] conducted a structured literature review on board gender diversity, sustainability board expertise, and sustainability-related executive compensation and their impact on corporate social responsibility. The present methodological choices were inspired by the cited literature in this domain.

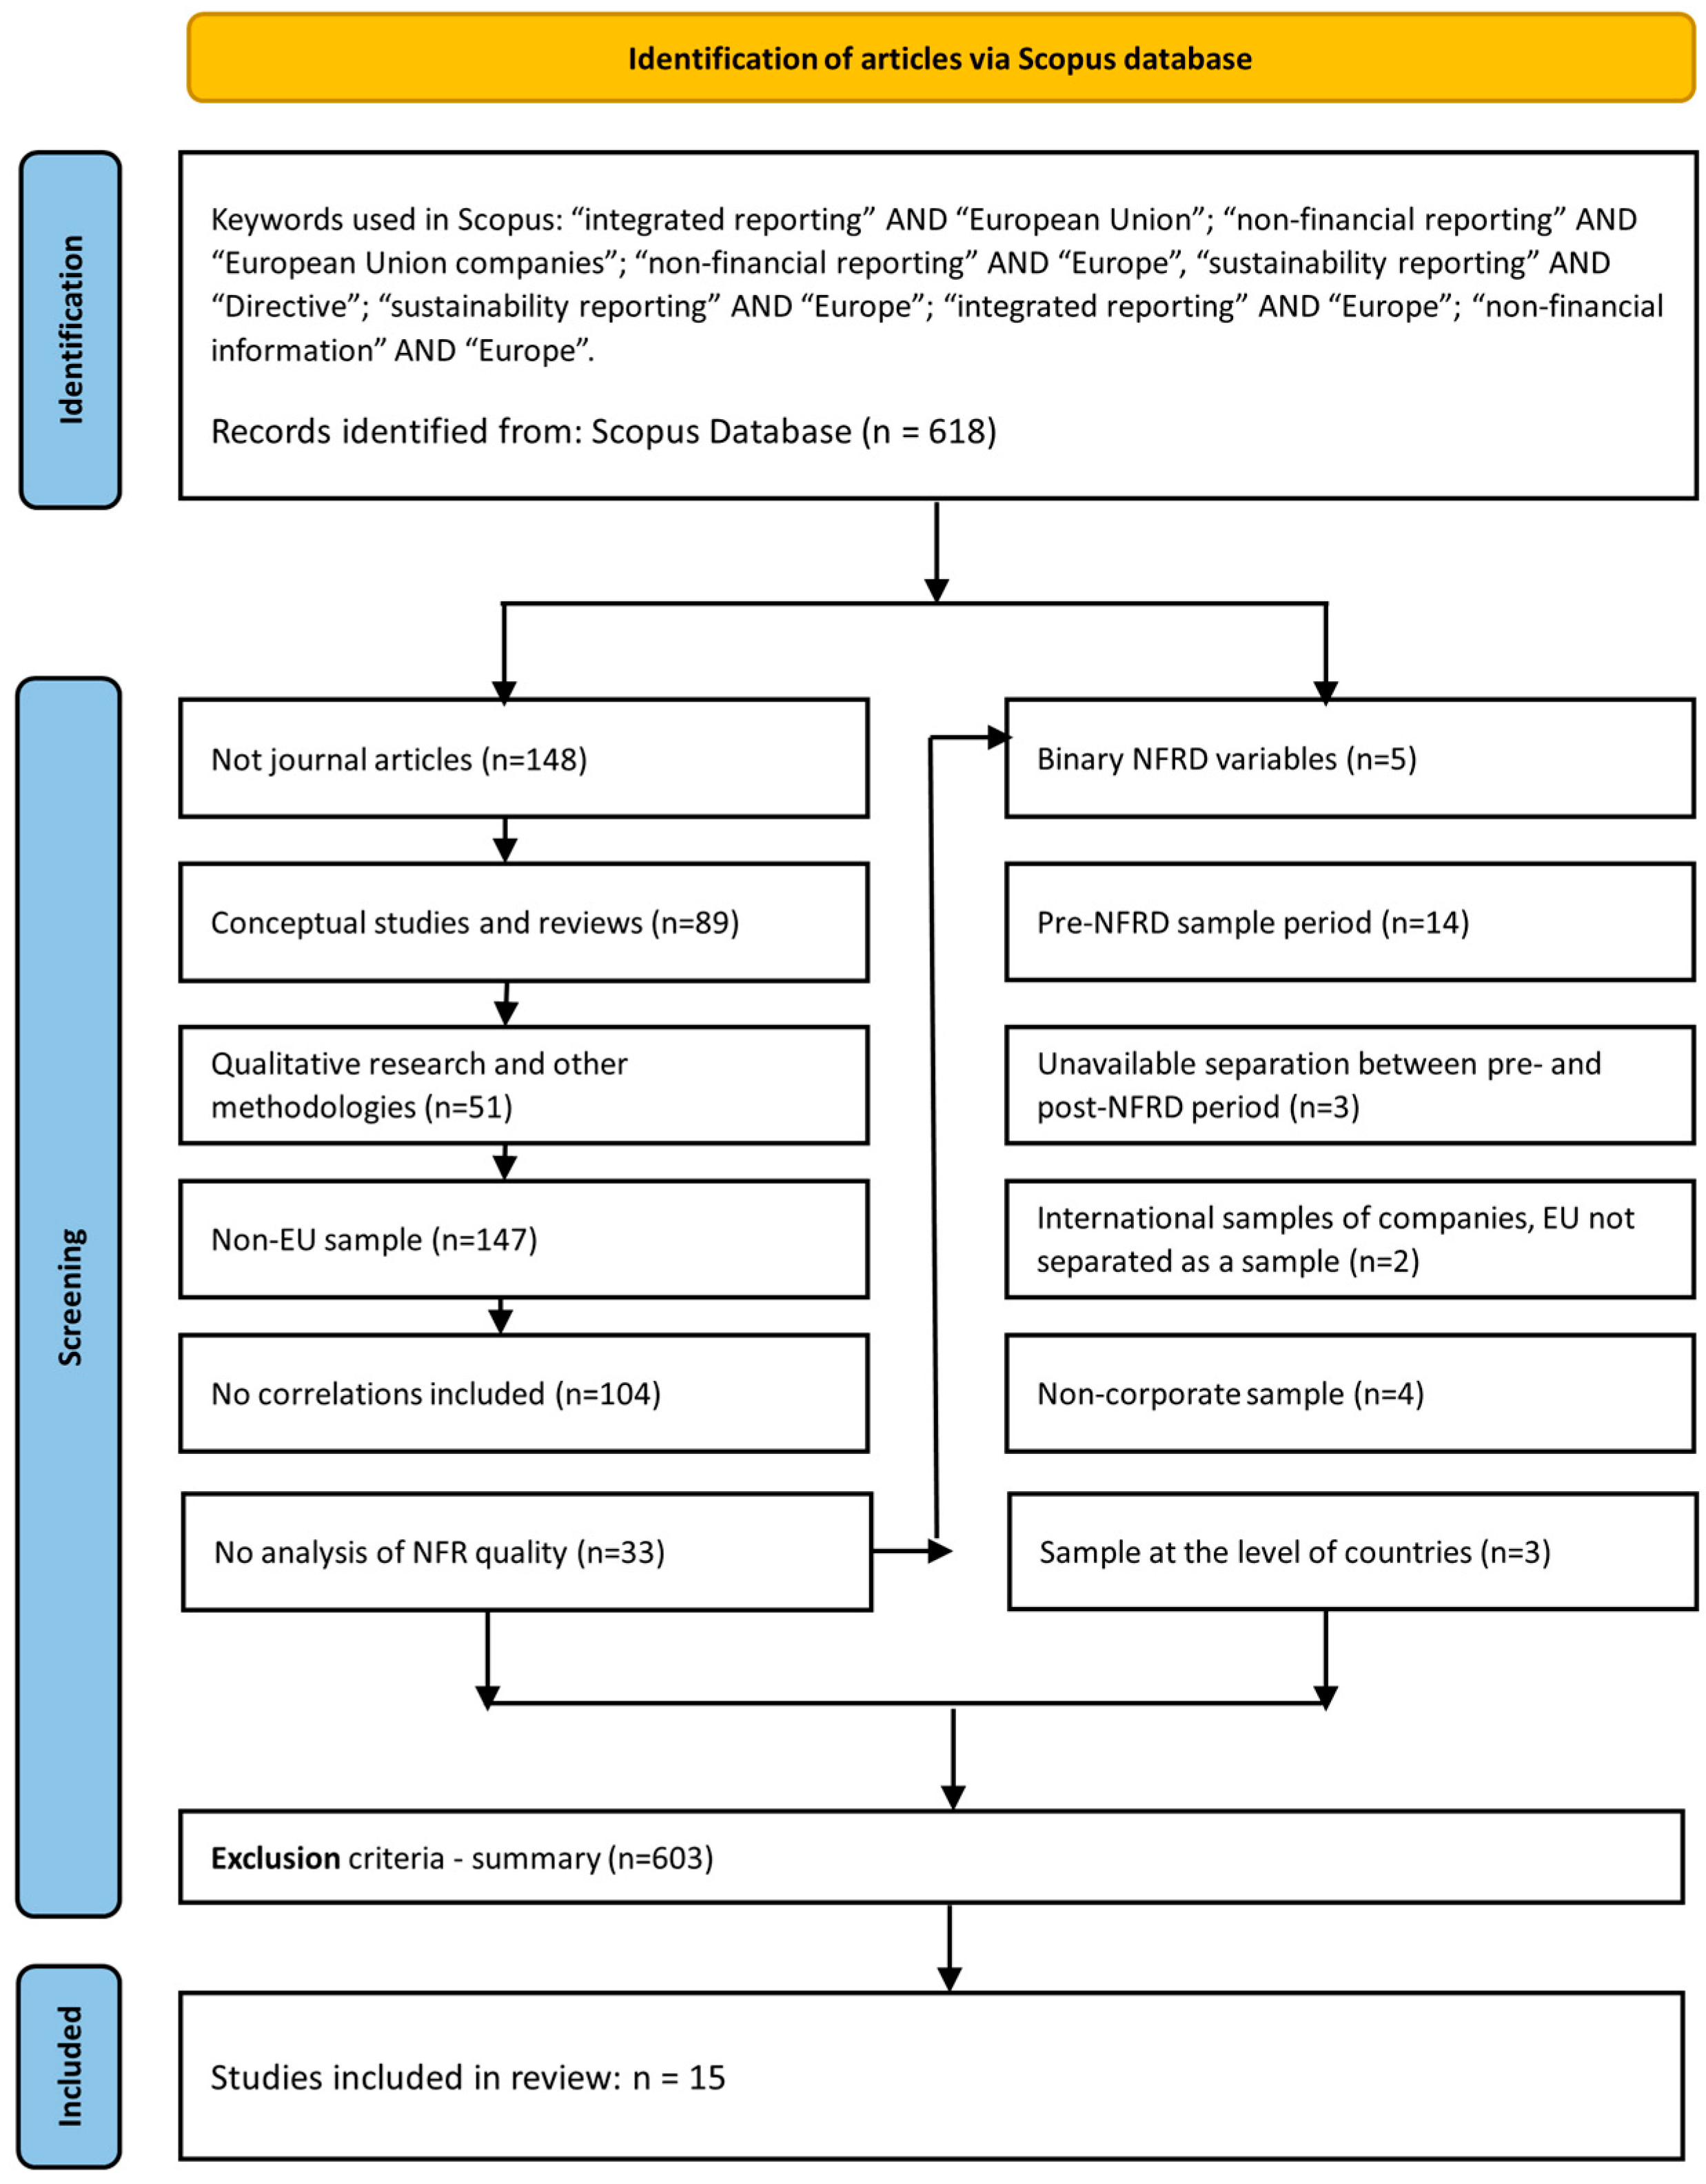
3.1. Sample Selection

We focus on empirical quantitative research regarding company-level factors of non-financial reporting quality (NFRQ). This type of archival research based on content analysis was used in other studies in the same domain [15].
The first stage of conducting the systematic review involves the extraction and selection of articles from the Scopus database. To identify relevant articles, we use the following combined keywords in successive searches: “integrated reporting” AND “European Union”; “non-financial reporting” AND “European Union companies”; “non-financial reporting” AND “Europe”, “sustainability reporting” AND “Directive”; “sustainability reporting” AND “Europe”; “integrated reporting” AND “Europe”; “non-financial information” AND “Europe”. Articles in languages other than English were also excluded using the automated filters in Scopus. All identified records, for 2016–2023, were downloaded in Excel files, the unique field being the digital object identifier (DOI). The date of database access and download was 12 April 2023. Duplicates were removed using Excel functions. The results comprise 618 articles (published between 2017 and 2023) that are subject to further screening.
The systematic review deals with empirical research on companies in the European Union that apply NFRD, starting from 2017 onward. According to Directive 2014/95/EU, Member States shall bring into force the laws, regulations, and administrative provisions necessary to comply with this directive, which entered into force starting on 1 January 2017 or during the calendar year 2017. Thus, we content-analyzed each record of the database to include articles that meet the following criteria:
  • Articles investigating the variable “non-financial reporting quality” (NFRQ) in correlation with other variables, also including a correlation matrix;
  • Articles describing the NFRQ variable used in the analysis, ensuring alignment with our research objectives;
  • Articles relying on content analysis of annual reports to measure NFRQ as a scale variable (not a binary variable);
  • The sample referring exclusively to EU countries.
For the inclusion criteria, we focused on articles with the NFRQ variable that refer to ESG disclosure scores; non-financial information indexes; climate change scores based on TCFD guidelines; mandatory reporting items (i.e., the business model, materiality analysis); transparency measures; overall disclosure indexes based on the GRI guidelines; SDG reporting scores (such as those provided by Refinitiv Eikon); other indexes related to environmental, social, employment human, anti-corruption, and anti-bribery matters. One article [37] analyzed “omissions” of non-financial information in the annual reports; therefore, it was not included in our sample because it would affect the integrity of the analysis.
Second, we applied a set of criteria to determine the exclusion of articles during in-depth analysis. Each abstract was carefully reviewed, and the following articles were excluded:
  • Articles discussing countries that are not part of the EU;
  • Articles categorized as critical reviews, systematic reviews, conceptual frameworks, grounded theories, theoretical explorations;
  • Articles with qualitative methodologies such as case studies, comparative studies, exploratory studies, legal studies, interpretative approaches, historical analysis, interviews, regulatory analysis;
  • Samples that do not focus on companies located in EU countries. For the UK, we accounted for its EU membership until 2019, considering the three-year application period of the directive (2017–2019);
  • Sample periods before 2017 (the date of entering into force of the NFRD) or sample period not clearly divided;
  • Samples of universities or governmental organizations.
Articles with abstracts containing terms such as “sample”, “companies”, “correlations”, “content analysis”, “empirical analysis”, “company value”, and “regression” were evaluated by reading their full text. Through this rigorous selection process, we ensured that the articles included in our study align with the specific objectives of investigating the relationship between non-financial reporting quality and company-level factors in EU countries. We prepared a mapping of twelve unique exclusion categories, with results shown in Figure 1. After the screening process, 603 articles were excluded from the analysis.
The outcome of the systematic procedure contains 15 articles, described in Table 2. This table includes the following: the first column is represented by each study that is part of our sample and its abbreviation used in Section 4; the second column includes theories used in each article; the third column includes the number of companies analyzed in each study and the firm-year observations; the fourth column includes the EU countries in which the companies are located; the fifth column includes the period analyzed by our articles; the sixth column describes in detail the NFRQ variable; the seventh column comprises the source of the NFRQ variable; and the last column lists the variables that are in correlation with the NFRQ variable and are not excluded based on the criteria highlighted in the next section. The abbreviations of the variables correlated with NFRQ are listed in Table 3.

3.2. Data Selection and Analysis

After drawing our sample that contains fifteen articles, we could not apply any statistical data processing method, because the number of studies is too low, and it is not reasonable for such methods to lead to accurate results. Therefore, we resolved this limitation through a comprehensive analysis and vote counting. Thus, the presentation of results involves synthesizing the findings related to the NFRQ variables and their correlations within the context of EU countries.
To operationalize NFRQ, content analysis was part of the research methodology of all articles included in our sample. In several articles, Thomson Reuters Refinitiv scores were also based on content analysis. Content analysis is a qualitative research method, widely adopted in codifying written texts that are part of non-financial reports. It contains various steps such as determining the text unit to be analyzed (usually a sentence or paragraph or table), establishing keywords to be included in the coding process, applying the keywords on text units, defining coding guidelines, coding the data, applying the four-eyes principle on coded data through the use of multiple coders to avoid any potential issue that may affect the reliability of self-constructed indexes, discussing and reconciling any potential discrepancies among the coders, and summarizing the results. For example, Cosma et al. [38] used content analysis to assess completeness, risks, opportunities, forward-looking orientation of non-financial disclosure. Moreover, Schröder [22] asserts that content analysis is the preferred method in non-financial reporting research.
Table 2. List of analyzed studies with correlation matrices involving NFRQ.
StudyTheoriesCompanies/Firm-Year Obs.CountriesYears Used in SampleNFRQ Variable with Min–Max Range in BracketsNFRQ SourceIn Correlation with (Abbrev. in Table 3)
A1. Beretta et al. (2023) [39]IMT, IIT29/116Italy2017–2020ESG disclosure Score (0–0.2987): percentage of the number of text units dedicated to ESG issues over the total number of text unitsCompanies’ websitesABOD, BSZ, FBOD, SZTA
A2. Carmo and Ribeiro (2022) [40]IT34/34Portugal2016–2018NFII2018 (6–33): non-Financial Information Index in 2018Sustainability
Reports and Integrated Reports
SZTA
A3. Cosma et al. (2022) [38]LT, ST101/not availableAustria, Belgium, Denmark, Estonia, Finland, France, Germany, Greece, Ireland, Italy, Luxembourg, Netherlands, Hungary, Portugal, Spain, Sweden, United Kingdom2018CC score (1–11): Climate Change score based on the TCFD document with 11 areas relating to the topic that companies should make public as described in the AppendixWebsitesBIND, BSZ, EPI, FBOD, ROE, SCO, SZE
A4. Dragomir et al. (2022) [41]AT, ST63/63Romania2018NFRQ (8–114): non-financial reporting qualityAnnual reportsBCR, CRR, DTER, GOV, QCR, SO, SZE, TOVR
A5. Gerwing et al. (2022) [42]AT220/540Germany2017MSRQ (26–65): mandatory sustainability reporting quality which includes: reporting format, cross-references, framework, business model, non-financial aspects, and materiality analysisStandalone sustainability
reports, annual reports, UNGC, Thomson Reuters DataStream
ASU, FSBD, FXBD, LTA, ROA, SCO, SREM, SZTA, VSE
A6. Hategan et al. (2021) [43]ST758, 751, 754/758, 751, 754Romania2017–2019S (1–5): score that measures the transparency of non-financial information reportslistefirme.ro website,
official website of the Romanian Ministry of Public Finance
FO, LST, PO, ROA, ROE, SZE
A7. Loprevite et al. (2020) [44]ST132/44Italy2016–2018Di 2018 (not available): overall Disclosure Index 2018, examining the sustainability reports based on GRI guidelinesSustainability reportsIES, SZTA
A8. Mihai and Aleca (2023) [45]NI500/96Romania2021T (6–74): sustainability report score, computed only for separate sustainability reports based on the scores given to each specific GRI indexTopfirme.ro platform, sustainability reportsEXP, IES, INC, NP
A9. Mion and Loza Adaui (2019) [46]NI66/132Italy, Germany2017SRQ index (0–20): sustainability reporting quality indexReports published before and after the implementation of the directiveGRI, ROA, SZTA
A10. Moraru et al. (2020) [47]NI34/34Romania2017OHS Global Reporting Index (15–100): Occupational Health and Safety Global Reporting Index computed based on the content of customized standard GRI 403—Occupational Health and Safety, version 2018Websites, non-financial reports, Sustainability reports publicly availableINC, LTA, ROE
A11. Păun et al. (2020) [48]NI35/35Romania2017OHS Global Reporting Index (15–100): Occupational Health and Safety Global Reporting Index computed based on the content of standard GRI 403—Occupational Health and Safety, version 2018.Websites, non-financial reports, Sustainability reports publicly availableMS, SZE
A12. Pizzi et al. (2021) [49]LT210/210Italy2018SRS (0–91): Sustainable Development Goals Reporting Score measuring the degree of adherence to the GRI indicators required by the SDG Compass GuidelinesRecords of the Italian Companies and Exchange CommissionBIND, BMTS, BSZ, ER, EXPT, FBOD, GRI, ROE, SCO, SZTA
A13. Schröder (2022) [22]LT100/300Germany2017–2019NFRQ (0.52–3.45): non-financial reporting qualityCorporate websitesASU, OPT, SZTA
A14. Sierra-Garcia et al. (2018) [50]NI34/34Spain2017NFSC (3.70–10.00): composed of 5 sub-indices with 27 KPIs, linked to environmental, social, employment, human and anti-corruption/bribery mattersSustainability reports, management reports and financial reportsIES, SCO, SZTA
A15. Vander Bauwhede and Van Cauwenberge (2022) [51]LT, SGT660/1832All EU countries2017CSR_info (0–100): Information on corporate sustainability reportingRefinitiv’s ESG databaseASU, BVS, EPS, EPSN, ESGS, IES, LTA, ROA, SP, SZTA
Notes. Theories: agency theory (AT), impression management theory (IMT), incremental information theory (IIT), institutional theory (IT), legitimacy theory (LT), not included (NI), signaling theory (SGT), stakeholder theory (ST). Variables are described in Table 3.
Table 3. List of variables mapped per categories, in correlation with NFRQ.
CategoryAbbrev.Meaning and MeasurementNo. of Papers with NFRQ Corr.
Company sizeEXPTotal expenses1
INCTotal income2
SZECompany size measured through total number of employees4
SZTACompany size measured through total assets9
TOVRNatural logarithm of the equivalent in Euro of sales1
Financial performanceBCRBorrowed capital ratio computed as borrowed capital divided by capital employed1
BVSBook value of equity per share at the end of fiscal year, in EUR1
CRRCurrent ratio computed as current assets divided by current liabilities1
DTERDebt-to-equity ratio computed as total liabilities divided by shareholders’ equity1
LTALeverage measured by total liabilities divided by total assets3
NPNet profit1
OPTBusiness efficiency measured as the ratio of operating profits to operating turnover1
QCRQuick ratio computed as current assets minus inventories, divided by current liabilities1
ROAReturn on assets4
ROEReturn on equity4
Corporate governanceABODAge of the Board of Directors1
ASUAssurance from an external auditor of the non-financial report3
BINDShare of independent directors in total board size2
BMTSBoard meetings during the year1
BSZBoard size3
FBODPercentage of women on the Board of Directors3
FXBDPercentage of female members in the executive board1
FOForeign ownership percentage1
FSBDPercentage of female members in the supervisory board1
GOVCorporate governance score1
POPrivate ownership1
SCOSustainability Committee4
SOThe percentage of state ownership1
SREMSustainability remuneration—takes value 1 if a firm has at least one sustainability component quantified in the executive remuneration1
Market performanceEPSEarnings per share over fiscal year, in EUR1
EPSNNegative earnings per share over fiscal year, in EUR1
LSTListed company1
MSMarket share as the determinant of the company’s market presence1
SPShare price at the end of fiscal year, in EUR1
Sustainability performanceEPIEnvironmental performance index1
ERValue of environmental risks in economic terms1
ESGSScore for environmental, social and governance (ESG) performance1
EXPTNumber of years from the first non-financial report1
GRIGRI Standards included in the non-financial report (1 if included)2
IESIndustry environmental sensitivity—refers to industries with a significant negative impact on the environment (1 = polluting industry, 0 = non-polluting industry)4
VSEVoluntary sustainability experience, takes value of 1 if a firm has at least four years of sustainability experience prior to the mandate1
First, data related to all variables in correlation with NFRQ were collected from correlation matrices.
Second, the articles were reviewed in detail to summarize the explanations of all the variables and define the abbreviations for each variable. This step produced 75 unique variables in correlation with NFRQ. Only company-level variables were considered for systematic analysis.
Third, we define exclusion criteria at the level of individual variables. Below, we selected examples of specific variables supporting the motivation for choosing each exclusion criterion, as follows.
  • Variables that measure financial performance by aggregating more than one financial indicator or that are based on forecasts, not actual or past performance—for example, an indicator aggregating return on assets, return on equity, and operating ratio and earnings before interest and tax to net income;
  • Variables that may be confounded with other constructs—for example, ownership structure that contains both private and state ownership, that were already included, at individual level, in our comprehensive analysis, through FO—Foreign ownership percentage, PO—Private ownership, SO—The percentage of state ownership, as detailed in Table 3;
  • Country-level variables, such as those measuring government effectiveness, in relation to laws and regulations, because these variables do not represent company-level factors of NFRQ;
  • Variables that measure stock market performance—for example, free float measured as a percentage of total traded shares at the end of the fiscal year, as these are not considered factors of NFRQ;
  • Industry variables pointing to non-environmentally sensitive industries—for example, technology and telecommunications, consumer goods, consumer services industries;
  • The company’s age (years of business activity)—for example, the number of years since the company’s inception, because this does not represent a criterion included in the NFRD that distinguishes companies that were required to adopt NFRD from those that did not meet the NFRD criteria;
  • Variables that measure reporting experience without a clear focus on sustainability—for example, a variable that takes the value 1 if a company has a maximum of three years of sustainability reporting experience prior to the NFRD mandate;
  • Variables that refer to periods before 2017 (pre-NFRD adoption)—for example, non-financial information index in 2016, or the existence of a sustainability report in 2016;
  • Variables that describe the reporting format, but not its quality—for example, sustainability report page number, top-management statement about sustainability, or reference to sustainability in top-management statement of integrated report;
  • Variables that describe the textual attributes of the report, such as numerical text units, sustainability report letter number, forward-looking text units;
  • Variables that describe a combined report, where the non-financial report is not clearly distinguished from the financial report—for example, a variable that measures if the non-financial report is combined with the financial report;
  • Variables that measure voluntary sustainability disclosures, as opposed to mandatory reporting under the scope of the NFRD—for example, a variable that takes value 1 if the company presents non-financial information and 0 otherwise, as we focus only on those that take the value 1 under a mandatory regime;
  • Variables that are not clearly defined in the collected studies—for example, if details on calculation are not included.
Fourth, we performed a detailed screening of included variables, and we collected data for a final number of 41 variables, which were mapped to five thematic categories, as described in Table 3.
Fifth, we provide in Table 4 an example that illustrates our rationale in the mapping process of original variables to specific variables that meet our inclusion criteria. For illustrative purposes, we present the mapping process for Beretta et al. [39]. All variables that met the inclusion criteria were analyzed in our study because they are related to company-level factors. Particularly for the example provided in Table 4, the four variables included support two of five research questions, namely RQ1 and RQ3.
In line with previous studies in the literature [12,13,15,18], the structure of our systematic literature review included: the keywords used in the identification process of relevant papers; discussions linked to inclusion and exclusion criteria; applying vote-counting methodologies to code relevant empirical studies with regard to the selected sub-constructs; summarizing methodological results in a table that contains the authors and year of publication, theories, sample size, single and cross-country studies (number of countries), years of observations, NFRQ variable and its source, and variables that are in correlation with NFRQ; evaluating the significant results from correlation matrices in the empirical studies; interpreting the results in the light of applicable theoretical frameworks.

4. Results

The correlation coefficients and significance levels collected from empirical studies are presented in Table 5. We copied the data identically from the original correlation matrices into Table 5, with reference to the original tables in brackets for each article. The mapping of correlation coefficients followed our methodological approach exemplified in Table 4, Section 3.2. When not available in the original studies, significance levels were calculated by the authors based on the sample size reported in the source article. The results presentation by category follows below. For the effect size of correlation coefficients, the following thresholds are used: 0.10–0.30 (small), 0.30–0.50 (medium/moderate), and higher than 0.50 (large).

4.1. The Relationship between Company Size and NFRQ

Company size (EXP, INC, SZE, SZTA, and TOVR). Total expenses (EXP), total income (INC), total number of employees (SZE), total assets (SZTA), and sales (TOVR) are proxies used in measuring how big a company is, mainly from a financial and operational perspective. Company size is expected to be a significant factor in increasing the level of corporate NFR [41]. Of these indicators, the most frequently used is SZTA, identified in nine studies, followed by SZE, in four studies. In contrast, we identified EXP and TOVR, each in a single study [41,45]. Most of the correlations identified between the five variables measuring company size and NFRQ are positive. Of these, we have identified four large correlations, three that are moderate and five that are small. On the contrary, only one very small correlation was identified, which is negative [51]. No correlation was identified between company size measured through INC, SZE, and SZTA, and NFRQ in four studies.
In general, there is an indication that company size is a positive factor of NFRQ, a medium to large correlation being identified. This relationship is based on different explanations. Dragomir et al. [41] mention that large companies are able to absorb the costs associated with NFRQ, and are also more willing to be transparent, responding to the expectations of multiple stakeholders, including governments and regulatory authorities. Also, these companies generally have adequate instruments in place to generate non-financial data, which are further processed into non-financial information [41]. In addition, large (and listed) companies already implemented roles and responsibilities for new or existing teams to monitor the end-to-end process of non-financial reporting, ensuring quality through governance procedures and other internal controls designed. Proxies measuring company size are also introduced by NFRD, an example being the minimum number of 500 employees considered as part of compliance criteria. Thus, company size is a metric considered by European authorities adopting new legislation and directives.

4.2. The Relationship between Financial Performance and NFRQ

Leverage (BCR, DTER, and LTA). These three indicators are financial measures of company leverage. The borrowed capital ratio (BCR) is used by credit analysts to determine the creditworthiness of a company, considering that a higher value points to higher financial risk. According to Crous et al. [32], we expect a positive relationship between leverage and integrated reporting quality, considering that companies under debt pressure will also be incentivized to be more transparent about their sustainability risks. Dragomir et al. [41] identified a moderate positive correlation between BCR and NFRQ. Thus, there is an indication that the BCR is a positive factor for NFRQ, showing that companies with higher leverage tend to increase their transparency towards investors and other stakeholders. The debt-to-equity ratio (DTER) shows how much debt a company has taken on relative to the value of its equity. If its value is high, a higher investment risk is identified, meaning that a company is relying primarily on debt financing, which may affect business continuity when interest rates are high. No significant correlation was identified between DTER and NFRQ in a study in which companies listed on the Bucharest Stock Exchange are less leveraged than non-listed ones [41]. Finally, the liabilities-to-total assets ratio (LTA) evaluates the ability of a company to meet its financial obligations. We have identified one small positive correlation [42] and two negative correlations [47,51]. The strongest negative correlation is −0.54. Overall, the evidence on the relationship between NFRQ and leverage is inconclusive in the context of European Union companies.
Book value of equity per share (BVS). This indicator represents the value of a company’s equity, i.e., the amount the shareholders would receive in the event that the company is liquidated. This indicator is used mainly by investors to evaluate the stock price of a company. An example is when the BVS is higher than the market value per share of a company, suggesting that the stock price is undervalued compared to the historical cost of assets. A very small negative correlation between BVS and NFRQ was identified by Vander Bauwhede and Van Cauwenberge [51]. This indicates that companies with a lower net asset value per share may have a higher quality of NFR, but the evidence is inconclusive.
Liquidity (CRR and QCR). These two indicators represent financial measures of company liquidity. The current ratio (CRR) measures the ability of a company to pay current liabilities with its current assets, including inventory, accounts receivables, plus cash and cash equivalents, at a snapshot date. If the current ratio is lower than the industry average, it may indicate a higher risk of distress. In the opposite case, it may highlight the fact that management does not efficiently use the company’s assets. No significant correlation was identified between CRR and NFRQ [41]. The quick ratio (QCR) is more conservative than the current ratio and reflects the capacity of an entity to pay its current liabilities with its current assets, without selling its inventory or requesting additional debt financing. The higher the QCR, the stronger the company’s financial health. No significant correlation was identified between QCR and NFRQ [41]. These findings imply that liquidity does not have an influence on NFRQ, from the available evidence.
Net profit (NP). It represents an absolute amount of the total revenue earned above any incurred costs. This value is important for stakeholders, measuring a company’s economic performance. Companies compute this indicator for different periods of time, to identify business lines that no longer generate increased revenues and to take adequate management decisions to remediate financial and operational deficiencies. No significant correlation was identified between NP and NFRQ [45].
Operating profit to turnover (OPT). The indicator shows the extent to which a company earns profit from operations; thus, a measure of efficiency. Through OPT, stakeholders are informed about whether a company continues to grow, based on the financial information for the previous year. No significant correlation was identified between OPT and NFRQ [22]. This result may be explained by unobserved variables that intervene in the relationship between OPT and NFRQ or by the fact that NFRQ is less driven by economic pressure than social legitimacy [22].
Return on assets (ROA). This indicator is a financial performance variable that measures a company’s ability to generate profits from its assets. The relationship between ROA and non-financial reporting quality (NFRQ) has been extensively explored in the literature. Several studies have contributed valuable insights into this correlation. The study by Mion and Loza Adaui [46] revealed a significant negative correlation of -0.281, pointing to a small impact of ROA on NFRQ. This finding implies that companies with higher ROA might prioritize financial performance over non-financial reporting quality, leading to a potential trade-off between profitability and transparent non-financial disclosures. The small negative correlation identified by Mion and Loza Adaui [46] further emphasizes the importance of balancing financial success with comprehensive and accurate non-financial reporting for sustainable and ethical business practices.
Return on equity (ROE). ROE is a variable that measures a company’s profitability by assessing its ability to generate earnings relative to shareholders’ equity. Examining the relationship between ROE and NFRQ has been a focal point in various research studies. The correlation indices extracted from these studies provide valuable insights. Notably, Cosma et al. [38] revealed a significant positive correlation of 0.253, suggesting a medium association between higher ROE and improved NFRQ. Moraru et al. [47] reported a small correlation coefficient of 0.197, indicating a positive relationship between ROE and NFRQ. These findings collectively suggest that a higher ROE may generally be associated with better non-financial reporting quality, although the strength of this association varies across studies.

4.3. The Relationship between Corporate Governance and NFRQ

Board independence (BIND). The proportion of independent board members reflects the extent to which the board is independent of the company management. Liao et al. [52] highlight that independent directors are more interested in developing more sustainable and ethical behaviors, while continuously improving company’s relationships with various stakeholders through their oversight role. Several authors [38,49] consider that the relationship between board independence and non-financial reporting quality is expected to be positive, according to agency and stakeholder theories. The summarized evidence provides tentative support for this hypothesis. We have identified two small positive correlations between BIND and NFRQ. Thus, there is an indication that an increase in the number of independent directors represents a positive factor of NFRQ. The findings may imply that companies with more independent directors show greater concern about the reliability of non-financial information [52]. Similarly, Pizzi et al. [49] revealed that independent directors respond to the expectations of external stakeholders, who are typically more interested in sustainability performance, compared to shareholders who are more interested in financial performance.
Board size (BSZ). It consists of the number of members of the Board of Directors. Several authors [38,39,49] consider that board size is expected to be positively associated with non-financial reporting quality, according to stakeholder theory and incremental information theory. A larger board is expected to be more involved in the preparation of non-financial statements, leading to higher reporting quality. The summarized evidence supports this hypothesis. Beretta et al. [39] found a medium positive correlation between BSZ and NFRQ, while the mean for BSZ is ten. This suggests that the higher the number of directors on a board, the higher is the quality of non-financial reporting. This may be explained by the need of board members with adequate experience and background, as well as different viewpoints, in the context of non-financial disclosure complexity and challenges faced by businesses worldwide [14]. In contrast, several authors [38,49] did not find any significant correlation between BSZ and NFRQ.
Age of board members (ABOD). The average age of board members (ABOD) represents a proxy for the experience of board members and their prudent decisions. This indicator is determined as the average age of board members. A small positive correlation between ABOD and NFRQ was identified [39]. Thus, there is an indication that ABOD is a positive factor of non-financial reporting quality. The knowledge and experience of senior directors are valued by companies, but such directors do not appear to dominate company boards [53]. In addition, knowledge and experience are shared from the senior to younger directors, contributing to a robust decision-making process. Younger directors are less experienced, with a modest-to-high risk appetite and are more open to NFR disclosures [54]. On the contrary, older directors benefit from vast business experience and may be more cautious and reluctant to take on higher risk and expand NFR. Thus, a balance is needed for higher NFRQ to be positively associated with the age of board members, combining the vast experience of senior members with the openness to NFR disclosures of the younger generation [54].
Gender diversity of the board (FBOD, FXBD, and FSBD). It describes aspects related to the proportion of women on the board. Considering both one-tier, respectively, two-tier corporate governance systems, gender diversity of the board is analyzed through three indicators.
The percentage of women on the board of directors (FBOD). It describes the percentage of women involved in a company’s governance, through their role as members of the board of directors. Beretta et al. [39] consider that the relationship between board gender diversity and non-financial reporting quality is expected to be positive according to incremental information theory. A similar relationship is expected by Cosma et al. [38], according to legitimacy and stakeholder theories. Thus, a board with a higher percentage of women is expected to exercise an adequate oversight role leading to a higher quality of NFR. This hypothesis is supported by our results. We have identified one very large [38] and one medium [39] positive correlation. Therefore, there is an indication that the presence of a higher number of women on the board leads to higher NFRQ. This may indicate that women are more interested than men in responding to stakeholder expectations, when it comes to the quality of non-financial reporting [38]. Moreover, Byron and Post [55] suggest that this positive correlation is explained by a high degree of gender parity, which improves boardroom decision making, through divergent knowledge and perspectives to be integrated in strategic deliberations.
The percentage of female executives (FXBD). It shows the proportion of women who are members of the executive board, when a two-tier corporate governance system is implemented. No significant correlation was identified between FXBD and NFRQ [42]. These findings imply that the proportion of women who exercise their role as members of the executive board is not associated with NFRQ, from the available evidence.
The percentage of women on the supervisory board (FSBD). It represents a proxy used for the number of women who are members of the supervisory board, in case a two-tier corporate governance system is adopted. Gerwing et al. [42] consider that the relationship between supervisory board gender diversity is positively associated with NFRQ, according to agency theory. A supervisory board with a higher proportion of women is expected to positively influence the preparation of non-financial statements. This hypothesis is supported by our findings. We have identified a moderate positive correlation between FSBD and NFRQ [42]. Thus, there is support for the assumptions of agency theory, since a higher share of women on the supervisory board helps mitigate information asymmetries, while reducing agency costs from potential conflicts between company management and stakeholders [42]. An explanation may be the fact that such boards may be more skeptical and conscientious in reviewing non-financial information, which leads to increased NFRQ [42]. On the other hand, women have a low appetite for reputation risk [56] and are more focused on increasing the quality of non-financial information to avoid potential reputational losses and greenwashing public scandals.
Board meetings (BMTS). The indicator provides an indicative number of meetings held by the board during the financial year. A higher number of meetings supports outside directors to understand how the business operates [52]. Pizzi et al. [49] expected a positive relationship between the number of board meetings and non-financial reporting quality, according to legitimacy theory. A board that meets more frequently is expected to invest more time in supervising non-financial disclosures preparation, leading to an increased reporting quality. However, no significant correlation was identified between BMTS and NFRQ [49]. This indicates that, more often, board meeting frequency is linked to practical arrangements of larger boards rather than transparency motivations [57]. Also, the results may suggest that a higher number of board meetings could lead to high coordination costs, which would dilute the available resources to improve the quality of non-financial reporting [14].
Corporate ownership (FO, PO and SO). It describes various forms of ownership held by foreign and private investors, respectively, by the state. A breakdown of the relevant relationships is provided below.
Foreign ownership (FO). It refers to investments in domestic companies and assets of another country, by a foreign investor. This variable is usually measured on a binary scale (1 = foreign ownership, 0 = domestic ownership) or by the proportion of foreign ownership. We have identified one moderate positive correlation between FO and NFRQ [43]. This result implies that companies with foreign investors are associated with a higher NFRQ, as they respond to stakeholder expectations through more transparent non-financial information [43]. This confirms the assumption of stakeholder theory. Companies with foreign capital are often multinational corporations that already have in place the same non-financial reporting policies and procedures in their country of origin. Thus, they are already used to NFR practicalities [43]. Moreover, the results could be explained by the need for comparable and consistent information at the group level, when multinational companies are preparing their consolidated non-financial management reports, according to the NFRD.
Private ownership (PO). It represents the characteristic of privately owned companies that do not raise capital in the financial market. Private ownership is generally found in family-owned businesses and small and medium-sized companies. This variable is usually measured on a binary scale (1 = ownership is held by private investors, 0 = ownership is held by public shareholders). We identified a very small negative correlation between PO and NFRQ [43]. The results indicate that privately owned companies represent a negative factor for NFRQ, but the evidence is inconclusive. This could be due to the fact that companies owned by private investors, excluding multinationals, usually do not have sophisticated corporate governance systems in place, that would enhance the quality of non-financial reporting [43]. Also, considering the nature of ownership, privately owned companies may not be subject to mandatory disclosures, in accordance with NFRD. Even though these companies might take actions to increase their non-financial performance, their non-financial disclosures may not be part of their strategic objectives and priorities.
State ownership (SO). It represents the percentage of shares owned by the state within a company and may be measured through a proxy for ownership concentration. For example, in wholly state-owned entities (SOEs), the state represents the only party that supervises the activity of executive teams [41]. The quality of non-financial reporting by SOEs is expected to be negatively influenced by the state’s ownership concentration, according to agency theory. Hence, we expect that higher state ownership would negatively affect corporate transparency. This hypothesis is supported by the summarized evidence. One medium negative correlation between SO and NFRQ was identified by Dragomir et al. [41]. Thus, there is an indication that state ownership is a negative factor of NFRQ, in support of agency theory. The results are explained by the low interest of companies with higher state ownership in releasing non-financial information [41]. In a comprehensive review on non-financial reporting quality [35], the results indicated that state-owned companies place a strong emphasis on environmental and social issues, institutional pressures exercised by industry peers, and the legal environment. However, the sample in [35] was not focused on Europe, covering several continents. Furthermore, this study was conducted at the macroeconomic level and does not have a discussion of NFRD topics.
Corporate governance quality (GOV). It is a comprehensive index of measures, procedures, and disclosures related to corporate governance. It comprises multiple items, such as dual-tier board, external consulting on governance matters, proportion of women on the board of directors, audit committee, other board committees, disclosure of board activities or evaluation of the board, recruitment plans for directors and CEO, internal control system, code of ethics, whistleblowing procedures [58]. According to agency and stakeholder theories, Dragomir et al. [41] expected that the quality of non-financial reporting by SOEs was positively influenced by the quality of the corporate governance system. This hypothesis is supported by the literature. We have identified a very strong positive correlation between GOV and NFRQ [41]. Thus, there is a strong indication that the quality of the corporate governance system is a positive factor of NFRQ, in line with agency theory. Furthermore, the results confirm the prediction of stakeholder theory, that a finely tuned system of corporate governance can better respond to stakeholder demands and interests [41].
Remuneration linked to sustainable development (SREM). This indicator reflects the extent to which companies take into account environmental, social, and corporate governance factors when designing remuneration schemes for their boards and executive teams. It is identified as the relevant corporate mechanism that links management remuneration with sustainability indicators [42]. This variable is usually measured on a binary scale (1 = if a company has at least one sustainability component quantified in the executive remuneration, 0 = otherwise). Gerwing et al. [42] consider that sustainability-linked remuneration of the executive board is expected to be positively associated with NFRQ, according to agency theory. Our findings support this hypothesis. We have identified one moderate positive correlation between SREM and NFRQ [42]. The authors mention that sustainability-relevant remuneration components must be linked to non-financial measures, such as customer or employee satisfaction, carbon footprint reduction, and innovation progress. The findings reveal that companies that integrate sustainability indicators into their remuneration schemes also have a higher NFRQ. Executives will be driven to enhance the quality of mandatory non-financial reporting to signal superior sustainability performance to internal and external stakeholders. In a virtuous circle, this is likely to trigger better compensation through sustainable-linked incentives designed and implemented within companies [42].
Sustainability Committee (SCO). It represents a corporate governance mechanism that takes the form of a consultative committee of the board of directors, which is responsible for overseeing the development and implementation of a company’s strategy, objectives, policies, and procedures related to sustainable development. This committee may include external members who are leaders from various disciplines, such as law, science, ethics, and the media [42]. Cosma et al. [38] consider that the sustainability committee is expected to positively influence the forward-looking orientation of non-financial information, according to stakeholder theory. Similarly, Gerwing et al. [42] and Pizzi et al. [49] expect a positive association between the existence of a sustainability committee and the quality of non-financial information, according to agency theory. The summarized evidence provides tentative support for this hypothesis. We have identified three positive correlations between SCO and NFRQ; one is small [49], one is moderate [42], and one is large [38]. Conversely, a non-significant correlation was identified between SCO and NFRQ [50]. Overall, there is strong evidence that the existence of a sustainability committee represents a positive factor of NFRQ, based on the assumptions of stakeholder and agency theories. Therefore, companies would create a sustainability committee to advise executive teams in designing and implementing sustainability standards. This represents an action that characterizes the “tone from the top” given by sustainability committees, whose main role is to supervise the sustainability reporting process [42]. Furthermore, this committee influences NFRQ in aspects such as completeness, balanced tone, and forward-looking orientation [38].
External assurance of non-financial information (ASU). It represents an opinion obtained from an external assurance provider, regarding the information about all non-financial topics, including sustainability policies and implementation mechanisms in place within a company. External assurance plays a key role in enhancing trust and confidence in non-financial reporting [59,60]. Several authors [22,42,51] consider that the relationship between external assurance and non-financial reporting quality is expected to be positive, according to agency theory and signaling theory. Thus, external assurance is expected to increase credibility and trust of various stakeholders in respect to non-financial information, leading to higher reporting quality.
The summarized evidence tentatively supports this hypothesis. We have identified a large positive correlation between ASU and NFRQ [42]. This is explained by the fact that information asymmetries are reduced, and corporate transparency is expected to increase [42]. Conversely, a very small negative correlation was identified between ASU and NFRQ [51]. An explanation could be that market participants, in the case of environmentally sensitive industries, do not believe that the benefits of external assurance on NFR are worth the additional costs associated with purchasing such services. However, the value of environmental reporting may still be strengthened by external assurance [61]. Also, a non-significant correlation was identified between ASU and NFRQ [22]. Overall, there is tentative evidence that external assurance of non-financial information is a positive factor of NFRQ, and there is support for the assumptions of agency, legitimacy and signaling theories. Thus, the assurance of non-financial information enhances credibility and strengthens corporate reputation [62].

4.4. The Relationship between Market Performance and NFRQ

Earnings per share (EPS and EPSN). These two indicators represent financial measures of profitability in relation to common equity. The earnings per share (EPS) represents a company’s net profit divided by the total number of outstanding common shares, being used in the estimation of corporate values. Investors are interested in companies with higher EPS, as this indicates a higher value for which they are willing to pay more. A small negative correlation between EPS and NFRQ was identified by Vander Bauwhede and Van Cauwenberge [51]. Negative earnings per share (EPSN) is an indicator that shows that the company is losing money, while its corporate value continues to decrease. Vander Bauwhede and Van Cauwenberge [51] did not identify any correlation between EPSN and NFRQ. Overall, these findings suggest that companies with lower positive earnings per share may have a higher quality of NFR, but the evidence is inconclusive.
Listed company (LST). It represents a public company whose shares are traded on one or more stock exchanges. This variable is usually measured on a binary scale (1 = listed, 0 = not listed). A small positive correlation between listing status and NFRQ was identified [43]. This finding reveals that listed companies are associated with higher NFRQ, as they are more transparent towards their investors. Hategan et al. [43] highlighted that listed companies publish high-quality non-financial information on their websites. These results are also explained by the fact that large undertakings, which are public-interest entities considering specific quantitative thresholds, are subject to mandatory NFR in the European Union.
Market share (MS). The metric is often used to give an overview of a company’s size, measured by turnover, in relation to the market in which it operates. It is calculated by dividing company sales by total sales of the industry in the same period. Therefore, the market leader is the company with the highest market share. We have identified a moderate positive correlation between MS and NFRQ [48]. This finding implies that there is a tendency for companies with solid market positions to produce high-quality sustainability reports. This is because, within their objectives and targets set, these companies focus on strengthening their successful existing corporate brand among customers, business partners, investors, banks, employees, and other stakeholders. Paun et al. [48] highlighted that the more visible a company is on the market, the higher the public scrutiny, as well as the involvement of employees in organizational culture and operations.
Share price (SP). The stock price reflects the present value of a company’s future cash flows and available profits. We have identified a very small negative correlation between SP and NFRQ [51]. This finding may suggest that, for investors, the costs of NFRQ do not outweigh the associated benefits. However, the evidence is not conclusive.

4.5. The Relationship between Sustainability Performance and NFRQ

The Environmental Performance Index (EPI). This metric is used to assess a company’s sustainability performance, taking into account factors such as emissions, resource use, and sustainable practices. In the study by Cosma et al. [38], a small positive correlation coefficient of 0.206 was found between EPI and NFRQ. This suggests that companies with higher EPI scores, reflecting a commitment to environmental responsibility, tend to exhibit better-quality NFR.
Value of environmental risks in economic terms (ER). This variable refers to the assessment of the economic impact of environmental risks on a company’s financial performance. The correlation between ER and NFRQ represents the extent to which a company’s NFR system is shaped by environmental factors. Pizzi et al. [49] found a small positive correlation coefficient of 0.271 between the environmental value-at-risk and the degree of adherence to the GRI indicators, suggesting that companies with a higher assessment of their environmental risk tend to have a better NFR system. The hypothesis of a positive relationship is therefore supported.
Industry environmental sensitivity (IES). This binary variable signifies the degree to which a sector is affected by environmental concerns, primarily related to emissions and air pollution. Increased environmental sensitivity is expected to lead to increased NFRQ. However, there is no significant correlation in Table 5 between sector environmental sensitivity and NFRQ. Therefore, the hypothesis is not supported.
The Environmental, Social, and Governance performance score (ESGS). This variable is a metric used to assess a company’s performance in terms of its environmental sustainability, social responsibility, and corporate governance practices and outcomes. A higher ESGS typically indicates that a company is more focused on sustainable and ethical business practices. Non-financial reporting quality (NFRQ) is a measure of the quality and transparency of a company’s non-financial reporting, including its disclosure of ESG-related information. A very small negative correlation of -0.072 was observed between the ESG score and NFRQ [51]. This result suggests that there is no conclusive relationship between ESG scores and non-financial reporting quality.
The number of years from the first non-financial report (EXPT) signifies the duration between the company’s first non-financial report and the present time. Analyzing the correlation coefficients extracted from sample articles, it was observed that this variable exhibits a medium correlation (0.383) with the NFRQ, as reported by Pizzi et al. [49]. This indicates that companies with a longer history of non-financial reporting tend to exhibit a higher quality of non-financial reporting practices.
GRI Standards included in the non-financial report (GRI). This variable represents the incorporation of GRI Standards into non-financial reports, promoting transparency and accountability in environmental, social, and governance (ESG) reporting. A positive correlation coefficient suggests a positive relationship between NFRQ and the adoption of the GRI Standards. Notably, the medium positive coefficient reported by Pizzi et al. [49] indicates the existence of a link between the reliance on GRI Standards and improved NFRQ, in a sample of Italian companies.
Voluntary sustainability experience (VSE). This variable shows the company’s commitment to sustainable practices beyond regulatory requirements and plays a pivotal role in corporate sustainability reporting. This metric signifies a commitment to ESG principles, often measured through voluntary initiatives and sustainability performance. As expected, Gerwing et al. [42] identified a medium positive correlation (0.394) between voluntary sustainability experience and NFRQ. This implies that companies actively participating in sustainability efforts tend to exhibit higher quality non-financial reports. These findings highlight the importance of proactive sustainability engagement for enhancing the transparency and credibility of non-financial disclosures, ultimately fostering greater corporate responsibility.

5. Discussion and Conclusions

5.1. Main Contributions

The present systematic literature review combines two of the four goals listed by Snyder [63]. Our contribution is (1) to provide evidence of effect and (2) to guide future research. Regarding the first avenue, our study identifies the influence of company-level factors on NFRQ, according to the available empirical evidence. Second, we aim to guide future research in the sustainability field, by highlighting the strengths and weaknesses in non-financial reporting in relation to company-level factors grouped into five relevant categories.
Our findings, summarized in Table 6, emphasize the role of company size, financial performance, corporate governance, market performance, and sustainability performance in preparing high-quality non-financial reports, under the NFRD, while responding to our research questions. Therefore, our study contributes to the literature by mapping initial variables into five proposed categories of company-level factors, for the period starting with 2017, focusing on the NFRD in the European Union, based on strict inclusion and exclusion criteria.
In line with the results of Dragomir et al. [41], company size positively influences the quality of non-financial reporting. This suggests that the bigger the company (in terms of total assets, total employees, or total income), the higher the quality of its non-financial reports. Large companies have more access to resources required to implement adequate non-financial reporting processes, and they are also actively involved in continuously improving the tools needed to ensure appropriate level of transparency towards their stakeholders. The systematic review offers a positive answer to RQ1.
Inconclusive results are obtained by analyzing the relationship between financial performance and NFRQ. These findings indicate that companies that prioritize profitability are, potentially, less focused on increasing the quality of non-financial reporting. On the other hand, some profitable enterprises strive to improve their corporate transparency through NFR, and to maintain their societal legitimacy. However, the relationship between firm leverage and NFRQ is inconclusive based on conflicting results. In some circumstances, companies will focus on the ability to meet their obligations, while trading off disclosures of non-financial information. In other cases, sustainability risks are relevant to creditors, who demand high-quality sustainability disclosures. Our review does not offer a conclusive answer to RQ2.
Corporate governance quality represents the combined effect of multiple factors, including board size, board competence and expertise, board independence, board committees, gender equality on the board, board meetings, and remuneration schemes. In our study, we expect a positive relationship between corporate governance and non-financial reporting quality, which is supported by empirical evidence. In line with agency and stakeholder theories, a best-practice approach to corporate governance (including the existence of a sustainability committee), represents a positive factor of non-financial reporting quality. According to stakeholder theory, our results reveal that a larger board and an ownership structure that includes foreign investors positively influence NFRQ. In line with agency theory, the fairness and appropriateness of the remuneration schemes associated with sustainable development positively influence NFRQ. Furthermore, our results confirm the stakeholder and legitimacy theories, since the higher the percentage of women on the board of directors, the higher the quality of NFR. Overall, the present review offers a positive answer to RQ3.
Regarding the relationship between market performance and NFRQ, the results are mixed. On the one hand, this is because the results on the relationship between earnings per share, share prices, and NFRQ, are inconclusive. On the other hand, market share and listing status are positive factors for NFRQ. One explanation is the fact that listed companies have mature organizational cultures that support transparency towards stakeholders, based on high-quality non-financial data and reports. Our review does not offer a conclusive answer to RQ4.
Finally, we found that sustainability performance is a significant positive factor of non-financial reporting quality, mainly due to richer management experience in drafting non-financial reports, as well as expertise in adopting GRI standards on a voluntary basis before the application of NFRD [64]. This indicates that proactivity is a key factor in the sustainability journey of companies. However, the positive relationship between NFRQ and environmental performance (as a component of the overall ESG performance) is weak. This suggests that more effort is necessary in conducting environmental risk assessments to improve environmental performance, as disclosed in the non-financial statements. Looking forward to the CSRD, companies are currently implementing processes to meet their climate-transition targets, in line with the net-zero strategy of the European Commission. Smaller organizations are in the planning phase, in which risk assessments are performed to identify the needs for the implementation of a sustainability strategy. Overall, the present review offers a positive answer to RQ5, which is in line with the expectations of the European Commission [65].

5.2. Theoretical and Practical Implications

Similar to financial reporting, non-financial reporting aims to provide a “true and fair view” of corporate non-financial performance (impacts, risks and opportunities), to help various stakeholders make decisions [20]. Previous empirical articles focused on the relationship between NFRQ and company-level factors, grouped into five thematic categories (i.e., company size, financial performance, corporate governance, market performance, and sustainability performance). The results support the assumptions of agency, stakeholder, and legitimacy theories, in that most of corporate governance characteristics are found to positively influence the non-financial reporting quality. According to the mentioned theories, independent and diverse boards supervise the production of high-quality non-financial reports, similar to the results obtained by Dragomir and Dumitru [18]. In addition, remuneration schemes associated with sustainable development positively influence NFRQ. Confirming the assumptions of stakeholder theory, an ownership structure that includes foreign investors is a positive factor of NFRQ. Finally, this article is relevant for academics who aim to engage in empirical research on variables that may have a positive or negative influence on sustainability reporting. When assessing the quality of sustainability information, an international comparative study of non-financial reporting is an important tool that should be used [6].
Considering the reputational effect that non-financial performance may have, NFRQ is a focal point for managers and employees [66]. To enhance advocacy on sustainability issues, NFI is frequently used by civil society organizations, as a monitoring tool for regulators. Our paper enables the identification of future directions for practitioners, regulators, and various other stakeholders in the field of non-financial reporting, currently transitioning to sustainability reporting under the CSRD. Therefore, policymakers may find this paper useful, as they can reassess their key role in facilitating sustainability initiatives, while increasing dialogue between various groups of stakeholders. It is important to acknowledge the positive influence that regulatory governance has on financial stability [67]. Finally, practitioners, including sustainability and risk managers, can benefit from reading this review, as it offers valuable information on factors that may negatively influence the forward-looking quality of sustainability reporting.

5.3. Limitations

Our study has some limitations. It is a systematic literature review; hence, it has an interpretative process that is semi-objective on the matter of article/variable identification. The systematic literature review was chosen over other review methods, as it is the most adequate solution considering the final number of articles included in our sample. Thus, a limitation is represented by our reduced sample on which we could not apply statistical methods, such as meta-analytical review methods. However, the sample analyzed in this review is 2.3% of the population of relevant articles, similar to other systematic reviews (e.g., Mizik and Gyarmati [68] reported an analytical rate of 2.8%).
The empirical articles analyzed were published in English. This triggers a second limitation in the sense that there might be other relevant articles that meet our inclusion criteria, in non-English journals, which have been lost. Likewise, we acknowledge a limitation with respect to potential language bias that may have an impact on the inclusivity of our study. Also, the inclusion and exclusion criteria that we defined in our conceptual framework may have influenced our sample and results. Our approach considers only those articles that investigate non-financial reporting quality (in all types of reports, like integrated reports), in correlation with other company-level variables. Thus, we did not take sample sizes into account, nor regression results. Finally, the analysis focused on company-level factors, excluding macroeconomic and country-level factors. This methodological choice limited the number of variables but provided a more cohesive interpretation of the results.
Furthermore, our conclusions are based on fifteen empirical articles, as this sample represents the outcome of the systematic literature review relying on the inclusion and exclusion criteria described in the research methodology. Our final sample includes different research periods, starting with 2017 onward, and covers various EU countries, restricting the possibility for our findings to be applied to all EU member states. Finally, our study includes a comprehensive analysis of various non-financial reporting quality variables that are collected from various sources. This is a limitation in terms of the generalization of our results.

5.4. Future Research

We expect future studies to investigate managerial incentives to engage in corporate sustainability reporting under the CSRD, even before phased-in mandatory disclosures are applied. An interesting question would be, for example, how users of sustainability reports, such as investors and creditors, react to different characteristics of sustainability information and how such reactions, in turn, affect organizational decisions to improve the quality of corporate sustainability reports. A second question would be how the new sustainability reports (in compliance with the CSRD) improve on previous non-financial reports (under the NFRD), and if the same pillars received extensive new disclosures. Furthermore, future research could focus on the risk of greenwashing in relation to the CSRD and the quality of sustainability reporting, based on the European Sustainability Reporting Standards (ESRS) which provide specific metrics to be disclosed, in line with the principle of double materiality.
We expect to see more research on the quality of corporate sustainability reporting in the European Union, along with systematic reviews on corporate governance, financial performance, and sustainability performance. This will support researchers in synthesizing existing articles and enrich the literature through research results on corporate sustainability and financial performance and the quality of sustainability reporting. We also highlight the need for empirical research activities on corporate sustainability assurance [29], considering the novelty and complexity associated with CSRD requirements, applicable through the European Sustainability Reporting Standards. Therefore, a relevant avenue of future research is analyzing whether corporate sustainability assurance is a positive factor in increasing the quality of corporate disclosures while building investor trust. Likewise, we expect alternative methodologies to be explored in the future, such as meta-analytical reviews, once enough articles exist in the literature in a specific research area. These would provide a more reliable way to quantitatively summarize empirical results. Finally, future research can focus on comparing the quality of non-financial information, in the pre-CSRD period (under NFRD, 2017–2023) and during the CSRD period (post-NFRD, period starting with 2024, for the same sample of companies).

Author Contributions

Conceptualization, V.D.D.; methodology, V.D.D., O.M.R. and N.H.; formal analysis, V.D.D., O.M.R. and N.H.; investigation, O.M.R. and N.H.; resources, V.D.D., O.M.R. and N.H.; data curation, O.M.R. and N.H.; writing—original draft preparation, O.M.R. and N.H.; writing—review and editing, V.D.D.; visualization, V.D.D.; supervision, V.D.D.; project administration, V.D.D. All authors have read and agreed to the published version of the manuscript.

Funding

This research was conducted during postdoctoral research funded by the Bucharest University of Economic Studies. This article is supported by the Doctoral School of Accounting of the Bucharest University of Economic Studies, Romania.

Institutional Review Board Statement

Not applicable.

Informed Consent Statement

Not applicable.

Data Availability Statement

Dragomir, Voicu; Radu, Oana Marina; Hao, NingShan (2023), “Systematic literature review of relationships between non-financial reporting quality and company-level factors”, Mendeley Data, V1, https://doi.org/10.17632/rw7wzch267.1 accessed on 21 October 2023.

Acknowledgments

The authors are grateful to Mădălina Dumitru for comments on a draft version of the paper.

Conflicts of Interest

The authors declare no conflict of interest.

References

  1. Kaczmarek, J.; Alonso, S.L.N.; Sokołowski, A.; Fijorek, K.; Denkowska, S. Financial Threat Profiles of Industrial Enterprises in Poland. Oeconomia Copernic. 2021, 12, 463–498. [Google Scholar] [CrossRef]
  2. Valaskova, K.; Gajdosikova, D.; Belas, J. Bankruptcy Prediction in the Post-Pandemic Period: A Case Study of Visegrad Group Countries. Oeconomia Copernic. 2023, 14, 253–293. [Google Scholar] [CrossRef]
  3. Sarea, A.M. Web-Based Financial Reporting Disclosure: Evidence from Selected Banks in the Kingdom of Saudi Arabia (KSA). J. Cent. Bank. Theory Pract. 2020, 9, 183–197. [Google Scholar] [CrossRef]
  4. Venturelli, A.; Fasan, M.; Pizzi, S. Guest Editorial. Rethinking Non-Financial Reporting in Europe: Challenges and Opportunities in Revising Directive 2014/95/EU. J. Appl. Account. Res. 2022, 23, 1–7. [Google Scholar] [CrossRef]
  5. Zanellato, G.; Tiron-Tudor, A. How Cultural Dimensions Are Shaping Social Expectations: The Case of European State-Owned Enterprises’ Nonfinancial Reporting. J. Appl. Account. Res. 2022, 23, 99–121. [Google Scholar] [CrossRef]
  6. Dumitru, M.; Dyduch, J.; Gușe, R.-G.; Krasodomska, J. Corporate Reporting Practices in Poland and Romania—An Ex-Ante Study to the New Non-Financial Reporting European Directive. Account. Eur. 2017, 14, 279–304. [Google Scholar] [CrossRef]
  7. Aureli, S.; Salvatori, F.; Magnaghi, E. A Country-Comparative Analysis of the Transposition of the EU Non-Financial Directive: An Institutional Approach. Account. Econ. Law Conviv. 2020, 10, 20180047. [Google Scholar] [CrossRef]
  8. Kurpierz, J.R.; Smith, K. The Greenwashing Triangle: Adapting Tools from Fraud to Improve CSR Reporting. Sustain. Account. Manag. Policy J. 2020, 11, 1075–1093. [Google Scholar] [CrossRef]
  9. Doni, F.; Bianchi Martini, S.; Corvino, A.; Mazzoni, M. Voluntary versus Mandatory Non-Financial Disclosure: EU Directive 95/2014 and Sustainability Reporting Practices Based on Empirical Evidence from Italy. Meditari Account. Res. 2020, 28, 781–802. [Google Scholar] [CrossRef]
  10. Veltri, S. The Mandatory Non-Financial Disclosure in the European Union. In Mandatory Non-Financial Risk-Related Disclosure; Springer International Publishing: Cham, Switzerland, 2020; pp. 31–55. ISBN 978-3-030-47920-6. [Google Scholar]
  11. Khan, K.S.; Kunz, R.; Kleijnen, J.; Antes, G. Five Steps to Conducting a Systematic Review. J. R. Soc. Med. 2003, 96, 118–121. [Google Scholar] [CrossRef]
  12. Velte, P.; Stawinoga, M. Integrated Reporting: The Current State of Empirical Research, Limitations and Future Research Implications. J. Manag. Control 2017, 28, 275–320. [Google Scholar] [CrossRef]
  13. Velte, P.; Stawinoga, M. Do Chief Sustainability Officers and CSR Committees Influence CSR-Related Outcomes? A Structured Literature Review Based on Empirical-Quantitative Research Findings. J. Manag. Control 2020, 31, 333–377. [Google Scholar] [CrossRef]
  14. Benvenuto, M.; Aufiero, C.; Viola, C. A Systematic Literature Review on the Determinants of Sustainability Reporting Systems. Heliyon 2023, 9, e14893. [Google Scholar] [CrossRef] [PubMed]
  15. Velte, P. Does Sustainable Board Governance Drive Corporate Social Responsibility? A Structured Literature Review on European Archival Research. J. Glob. Responsib. 2023, 14, 46–88. [Google Scholar] [CrossRef]
  16. Samani, N.; Overland, C.; Sabelfeld, S. The Role of the EU Non-Financial Reporting Directive and Employee Representation in Employee-Related Disclosures. Account. Forum 2023, 47, 278–306. [Google Scholar] [CrossRef]
  17. Ivanović, V. The Key Characteristics of Financial Reporting in the European System of Central Banks. J. Cent. Bank. Theory Pract. 2013, 3, 47–69. [Google Scholar]
  18. Dragomir, V.D.; Dumitru, M. Does Corporate Governance Improve Integrated Reporting Quality? A Meta-Analytical Investigation. Meditari Account. Res. 2023, 31, 1846–1885. [Google Scholar] [CrossRef]
  19. Krištofík, P.; Lament, M.; Musa, H. The Reporting of Non-Financial Information and the Rationale for Its Standardisation. EM Ekon. Manag. 2016, 19, 157–175. [Google Scholar] [CrossRef]
  20. Hahn, R.; Reimsbach, D.; Wickert, C. Nonfinancial Reporting and Real Sustainable Change: Relationship Status—It’s Complicated. Organ. Environ. 2023, 36, 3–16. [Google Scholar] [CrossRef]
  21. Zarzycka, E.; Krasodomska, J. Non-Financial Key Performance Indicators: What Determines the Differences in the Quality and Quantity of the Disclosures? J. Appl. Account. Res. 2022, 23, 139–162. [Google Scholar] [CrossRef]
  22. Schröder, P. Mandatory Non-Financial Reporting in the Banking Industry: Assessing Reporting Quality and Determinants. Cogent Bus. Manag. 2022, 9, 2073628. [Google Scholar] [CrossRef]
  23. Fiandrino, S.; Gromis Di Trana, M.; Tonelli, A.; Lucchese, A. The Multi-Faceted Dimensions for the Disclosure Quality of Non-Financial Information in Revising Directive 2014/95/EU. J. Appl. Account. Res. 2022, 23, 274–300. [Google Scholar] [CrossRef]
  24. Caputo, F.; Leopizzi, R.; Pizzi, S.; Milone, V. The Non-Financial Reporting Harmonization in Europe: Evolutionary Pathways Related to the Transposition of the Directive 95/2014/EU within the Italian Context. Sustainability 2019, 12, 92. [Google Scholar] [CrossRef]
  25. Arif, M.; Gan, C.; Nadeem, M. Regulating Non-Financial Reporting: Evidence from European Firms’ Environmental, Social and Governance Disclosures and Earnings Risk. Meditari Account. Res. 2022, 30, 495–523. [Google Scholar] [CrossRef]
  26. Ştefănescu, C.A. Linking Sustainability and Non-Financial Reporting Directive 2014/95/EU through Isomorphism Lens. Meditari Account. Res. 2022, 30, 1680–1704. [Google Scholar] [CrossRef]
  27. Ştefănescu, C.A.; Tiron-Tudor, A.; Moise, E.M. EU Non-Financial Reporting Research–Insights, Gaps, Patterns and Future Agenda. J. Bus. Econ. Manag. 2020, 22, 257–276. [Google Scholar] [CrossRef]
  28. Krasodomska, J.; Simnett, R.; Street, D.L. Extended External Reporting Assurance: Current Practices and Challenges. J. Int. Financ. Manag. Account. 2021, 32, 104–142. [Google Scholar] [CrossRef]
  29. Krasodomska, J.; Zarzycka, E.; Zieniuk, P. Voluntary Sustainability Reporting Assurance in the European Union before the Advent of the Corporate Sustainability Reporting Directive: The Country and Firm-level Impact of Sustainable Development Goals. Sustain. Dev. 2023, sd.2744. [Google Scholar] [CrossRef]
  30. Aluchna, M.; Roszkowska-Menkes, M.; Kamiński, B. From Talk to Action: The Effects of the Non-Financial Reporting Directive on ESG Performance. Meditari Account. Res. 2022, 31, 1–25. [Google Scholar] [CrossRef]
  31. Baumüller, J.; Sopp, K. Double Materiality and the Shift from Non-Financial to European Sustainability Reporting: Review, Outlook and Implications. J. Appl. Account. Res. 2022, 23, 8–28. [Google Scholar] [CrossRef]
  32. Crous, C.; Battisti, E.; Leonidou, E. Non-Financial Reporting and Company Financial Performance: A Systematic Literature Review and Integrated Framework. EuroMed J. Bus. 2022, 17, 652–676. [Google Scholar] [CrossRef]
  33. Vitolla, F.; Raimo, N.; Campobasso, F.; Giakoumelou, A. Risk Disclosure in Sustainability Reports: Empirical Evidence from the Energy Sector. Util. Policy 2023, 82, 101587. [Google Scholar] [CrossRef]
  34. Di Vaio, A.; Palladino, R.; Hassan, R.; Alvino, F. Human Resources Disclosure in the EU Directive 2014/95/EU Perspective: A Systematic Literature Review. J. Clean. Prod. 2020, 257, 120509. [Google Scholar] [CrossRef]
  35. Manes-Rossi, F.; Nicolò, G.; Argento, D. Non-Financial Reporting Formats in Public Sector Organizations: A Structured Literature Review. J. Public Budg. Account. Financ. Manag. 2020, 32, 639–669. [Google Scholar] [CrossRef]
  36. Opferkuch, K.; Caeiro, S.; Salomone, R.; Ramos, T.B. Circular Economy in Corporate Sustainability Reporting: A Review of Organisational Approaches. Bus. Strategy Environ. 2021, 30, 4015–4036. [Google Scholar] [CrossRef]
  37. Caputo, F.; Pizzi, S.; Ligorio, L.; Leopizzi, R. Enhancing Environmental Information Transparency through Corporate Social Responsibility Reporting Regulation. Bus. Strategy Environ. 2021, 30, 3470–3484. [Google Scholar] [CrossRef]
  38. Cosma, S.; Leopizzi, R.; Nobile, L.; Schwizer, P. Revising the Non-Financial Reporting Directive and the Role of Board of Directors: A Lost Opportunity? J. Appl. Account. Res. 2022, 23, 207–226. [Google Scholar] [CrossRef]
  39. Beretta, V.; Demartini, M.C.; Sotti, F. Board Composition and Textual Attributes of Non-Financial Disclosure in the Banking Sector: Evidence from the Italian Setting after Directive 2014/95/EU. J. Clean. Prod. 2023, 385, 135561. [Google Scholar] [CrossRef]
  40. Carmo, C.; Ribeiro, C. Mandatory Non-Financial Information Disclosure under European Directive 95/2014/EU: Evidence from Portuguese Listed Companies. Sustainability 2022, 14, 4860. [Google Scholar] [CrossRef]
  41. Dragomir, V.D.; Dumitru, M.; Feleaga, L. The Predictors of Non-Financial Reporting Quality in Romanian State-Owned Enterprises. Account. Eur. 2022, 19, 110–151. [Google Scholar] [CrossRef]
  42. Gerwing, T.; Kajüter, P.; Wirth, M. The Role of Sustainable Corporate Governance in Mandatory Sustainability Reporting Quality. J. Bus. Econ. 2022, 92, 517–555. [Google Scholar] [CrossRef]
  43. Hategan, C.-D.; Pitorac, R.-I.; Milu, N.-D. Assessment of the Mandatory Non-Financial Reporting of Romanian Companies in the Circular Economy Context. Int. J. Environ. Res. Public. Health 2021, 18, 12899. [Google Scholar] [CrossRef] [PubMed]
  44. Loprevite, S.; Raucci, D.; Rupo, D. KPIs Reporting and Financial Performance in the Transition to Mandatory Disclosure: The Case of Italy. Sustainability 2020, 12, 5195. [Google Scholar] [CrossRef]
  45. Mihai, F.; Aleca, O.E. Sustainability Reporting Based on GRI Standards within Organizations in Romania. Electronics 2023, 12, 690. [Google Scholar] [CrossRef]
  46. Mion, G.; Loza Adaui, C.R. Mandatory Nonfinancial Disclosure and Its Consequences on the Sustainability Reporting Quality of Italian and German Companies. Sustainability 2019, 11, 4612. [Google Scholar] [CrossRef]
  47. Moraru, R.I.; Păun, A.P.; Dura, C.C.; Dinulescu, R.; Potcovaru, A.-M. Analysis of the Drivers of Occupational Health and Safety Performance Disclosures by Romanian Companies. Econ. Comput. Econ. Cybern. Stud. Res. 2020, 54, 197–214. [Google Scholar] [CrossRef]
  48. Păun, A.P.; Dura, C.C.; Mihăilescu, S.; Moraru, R.I.; Isac, C.A. OHS Disclosures Within Non-Financial Reports: The Romanian Case. Sustainability 2020, 12, 1963. [Google Scholar] [CrossRef]
  49. Pizzi, S.; Rosati, F.; Venturelli, A. The Determinants of Business Contribution to the 2030 Agenda: Introducing the SDG Reporting Score. Bus. Strategy Environ. 2021, 30, 404–421. [Google Scholar] [CrossRef]
  50. Sierra-Garcia, L.; Garcia-Benau, M.; Bollas-Araya, H. Empirical Analysis of Non-Financial Reporting by Spanish Companies. Adm. Sci. 2018, 8, 29. [Google Scholar] [CrossRef]
  51. Vander Bauwhede, H.; Van Cauwenberge, P. Determinants and Value Relevance of Voluntary Assurance of Sustainability Reports in a Mandatory Reporting Context: Evidence from Europe. Sustainability 2022, 14, 9795. [Google Scholar] [CrossRef]
  52. Liao, L.; Lin, T.; Zhang, Y. Corporate Board and Corporate Social Responsibility Assurance: Evidence from China. J. Bus. Ethics 2018, 150, 211–225. [Google Scholar] [CrossRef]
  53. Mahadeo, J.D.; Soobaroyen, T.; Hanuman, V.O. Board Composition and Financial Performance: Uncovering the Effects of Diversity in an Emerging Economy. J. Bus. Ethics 2012, 105, 375–388. [Google Scholar] [CrossRef]
  54. Katmon, N.; Mohamad, Z.Z.; Norwani, N.M.; Farooque, O.A. Comprehensive Board Diversity and Quality of Corporate Social Responsibility Disclosure: Evidence from an Emerging Market. J. Bus. Ethics 2019, 157, 447–481. [Google Scholar] [CrossRef]
  55. Byron, K.; Post, C. Women on Boards of Directors and Corporate Social Performance: A Meta-Analysis. Corp. Gov. Int. Rev. 2016, 24, 428–442. [Google Scholar] [CrossRef]
  56. Srinidhi, B.; Gul, F.A.; Tsui, J. Female Directors and Earnings Quality. Contemp. Account. Res. 2011, 28, 1610–1644. [Google Scholar] [CrossRef]
  57. Dienes, D.; Velte, P. The Impact of Supervisory Board Composition on CSR Reporting. Evidence from the German Two-Tier System. Sustainability 2016, 8, 63. [Google Scholar] [CrossRef]
  58. Mohamed Adnan, S.; Hay, D.; Van Staden, C.J. The Influence of Culture and Corporate Governance on Corporate Social Responsibility Disclosure: A Cross Country Analysis. J. Clean. Prod. 2018, 198, 820–832. [Google Scholar] [CrossRef]
  59. IAASB. A Framework for Audit Quality. Key Elements That Create an Environment for Audit Quality; International Auditing and Assurance Standards Board: New York, NY, USA, 2014. [Google Scholar]
  60. IAASB. Proposed International Standard on Sustainability Assurance 5000, General Requirements for Sustainability Assurance Engagements; The International Federation of Accountants (IFAC): New York, NY, USA, 2023. [Google Scholar]
  61. Radhouane, I.; Nekhili, M.; Nagati, H.; Paché, G. Is Voluntary External Assurance Relevant for the Valuation of Environmental Reporting by Firms in Environmentally Sensitive Industries? Sustain. Account. Manag. Policy J. 2020, 11, 65–98. [Google Scholar] [CrossRef]
  62. Simnett, R.; Huggins, A.L. Integrated Reporting and Assurance: Where Can Research Add Value? Sustain. Account. Manag. Policy J. 2015, 6, 29–53. [Google Scholar] [CrossRef]
  63. Snyder, H. Designing the Literature Review for a Strong Contribution. J. Decis. Syst. 2023, 1–8. [Google Scholar] [CrossRef]
  64. Beleneși, M.; Bogdan, V.; Popa, D.N. Disclosure Dynamics and Non-Financial Reporting Analysis. The Case of Romanian Listed Companies. Sustainability 2021, 13, 4732. [Google Scholar] [CrossRef]
  65. Danila, A.; Horga, M.-G.; Oprisan, O.; Stamule, T. Good Practices on ESG Reporting in the Context of the European Green Deal. Amfiteatru Econ. 2022, 24, 847. [Google Scholar] [CrossRef]
  66. Murè, P.; Spallone, M.; Mango, F.; Marzioni, S.; Bittucci, L. ESG and Reputation: The Case of Sanctioned Italian Banks. Corp. Soc. Responsib. Environ. Manag. 2021, 28, 265–277. [Google Scholar] [CrossRef]
  67. Ullah, S.; Hussain, S.I.; Nabi, A.A.; Mubashir, K.A. Role of Regulatory Governance in Financial Stability: A Comparison of High and Low Income Countries. J. Cent. Bank. Theory Pract. 2022, 11, 207–226. [Google Scholar] [CrossRef]
  68. Mizik, T.; Gyarmati, G. Economic and Sustainability of Biodiesel Production—A Systematic Literature Review. Clean Technol. 2021, 3, 19–36. [Google Scholar] [CrossRef]
Figure 1. Flowchart of the literature review process.
Sustainability 15 16265 g001
Table 4. Mapping of original variables to final variables included in a selected study.
A1. Beretta et al. (2023) [39]
Variables—Original (Abbreviation and Definition)Variables—Own Mapping (Abbreviation, Definition and Category Mapping)
Average_Age: Age of the Board of DirectorsABOD: Age of the Board of Directors, mapped under corporate governance category
Board_Size: Members of the Board of DirectorsBSZ: Board size, mapped under corporate governance category
Female%: Percentage of women on the Board of DirectorsFBOD: Percentage of women on the Board of Directors, mapped under corporate governance category
Total_Assets: SizeSZTA: Company size measured through total assets, mapped under Company size category
Table 5. Results with correlations on Non-Financial Reporting variables (source table indicated in the header).
Variables Correlated with NFRQA1 (T4)A2 (T12)A3 (T6)A4 (T3)A5 (T7)A6 (T5)A7 (T6–2018)A8 (T9)A9 (T7)A10 (T5, 6, 7 and 8)A11 (T6 and 7)A12 (T8)A13 (T7)A14 * (T7)A15 ** (T4)
Company size
EXP 0.254 *
INC 0.249 * −0.071
SZE 0.457 **0.700 ** 0.221 ** 0.357
SZTA0.1390.540 ** 0.608 ** 0.498 ** 0.378 ** 0.217 **0.279 **0.081−0.091 **
TOVR 0.709 **
Financial performance
BCR 0.344 **
BVS −0.049 *
CRR −0.187
DTER 0.049
LTA 0.256 ** −0.544 * −0.056 *
NP 0.131
OPT 0.0027
QCR −0.185
ROA 0.006−0.021 −0.281 * −0.012
ROE 0.253** 0.009 0.197 0.008
Corporate governance
ABOD0.246 **
ASU 0.562 ** 0.0661 −0.072 **
BIND 0.248 ** 0.207 *
BMTS 0.053
BSZ0.379 ** 0.093 0.044
FBOD0.359 ** 0.541 ** 0.115
FXBD 0.067
FO 0.329 **
FSBD 0.382 **
GOV 0.782 **
PO -0.054 *
SCO 0.551 ** 0.498 ** 0.197 * 0.266
SO −0.368 **
SREM 0.431 **
Market performance
EPS −0.102 **
EPSN −0.013
LST 0.212 **
MS 0.364 *
SP −0.091 **
Sustainability performance
EPI 0.206 *
ER 0.271 **
ESGS −0.072 **
EXPT 0.383 **
GRI 0.000 0.336 **
IES −0.0560.093 −0.2460.039
VSE 0.394 **
Note 1 (*): We collected from the article of Sierra-Garcia et al. [50] the value of IES variable as being equal to the correlation identified for the oil and gas industry. Note 2 (**): IES variable takes the value of the original ESI variable from the research paper [51]. Note 3: * p < 0.05; ** p < 0.01.
Table 6. Summarized empirical results.
Variables in Correlation with NFRQExpected RelationshipSignificant CorrelationsEmpirical Support
Company sizePositive+ (large) in 4 studies
+ (medium) in 3 studies
+ (small) in 5 studies
− (very small) in 1 study
Supported (positive)
Financial performance
Book value of equity per shareNot specified− (very small) in 1 studyInconclusive
Leverage (indebtedness)Positive+ (medium) in 1 study
+ (small) in 1 study
− (large) in 1 study
− (very small) in 1 study
Inconclusive
LiquidityNot specifiedNot significantNo relationship
ProfitabilityNot specified− (small) in 1 study (ROA)
Not significant in 4 studies (ROA)
+ (small) in 1 study (ROE)
Not significant in 3 studies (ROE)
Inconclusive
Corporate governance
Board independencePositive+ (small) in 2 studiesSupported (positive)
Number of board meetingsPositiveNot significantNot supported
Board sizePositive+ (medium) in 1 studySupported (positive)
Average age of board membersNot specified+ (small) in 1 studyWeak positive relationship
Foreign ownershipPositive+ (medium) in 1 studySupported (positive)
Gender diversityPositive+ (very large) in 1 study
+ (medium) in 2 studies
Supported (positive)
Corporate governance qualityPositive+ (very large) in 1 studySupported (positive)
Private ownershipNot specified− (very small) in 1 studyInconclusive
Existence of sustainability CommitteePositive+ (large) in 1 study
+ (medium) in 1 study
+ (small) in 1 study
Supported (positive)
State ownershipNegative− (medium) in 1 studySupported (negative)
Remuneration linked to sustainable developmentPositive+ (medium) in 1 studySupported (positive)
External assurance of non-financial informationPositive+ (large) in 1 study
− (very small) in 1 study
Not significant in 2 studies
Inconclusive
Market performance
Earnings per shareNot specified− (small) in 1 study
Not significant in 1 study
Inconclusive
Listed companyNot specified+ (small) in 1 studyWeak positive relationship
Market shareNot specified+ (medium) in 1 studyMedium positive relationship
Share priceNot specified− (very small) in 1 studyInconclusive
Sustainability performance
Environmental performanceNot specified+ (small) in 2 studiesWeak positive relationship
ESG scorePositive− (very small) in 1 studyInconclusive
Number of years from the first non-financial reportNot specified+ (medium) in 1 studyMedium positive relationship
GRI standards included in the non-financial reportPositive+ (medium) in 1 studySupported (positive)
Voluntary sustainability experiencePositive+ (medium) in 1 studySupported (positive)
Disclaimer/Publisher’s Note: The statements, opinions and data contained in all publications are solely those of the individual author(s) and contributor(s) and not of MDPI and/or the editor(s). MDPI and/or the editor(s) disclaim responsibility for any injury to people or property resulting from any ideas, methods, instructions or products referred to in the content.

