Article

Evaluation of Soil Organic Carbon Stability in Different Land Uses in Lithuania

by
Milda Muraškienė
1,*,
Kęstutis Armolaitis
1,*,
Iveta Varnagirytė-Kabašinskienė
1,
Virgilijus Baliuckas
1 and
Jūratė Aleinikovienė
2
1
Institute of Forestry, Lithuanian Research Centre for Agriculture and Forestry, LT-53101 Kaunas, Lithuania
2
Department of Agronomy, Vytautas Magnus University Agriculture Academy, LT-53361 Kaunas, Lithuania
*
Authors to whom correspondence should be addressed.
Sustainability 2023, 15(22), 16042; https://doi.org/10.3390/su152216042
Submission received: 6 October 2023 / Revised: 7 November 2023 / Accepted: 15 November 2023 / Published: 17 November 2023

Abstract

:
The effective management of soil organic carbon (SOC) is highlighted as one of the strategies and cost-effective options for mitigating climate change, while soil nitrogen (N) often is specified as an essential element for plant growth. This study was conducted to evaluate basic soil physical, chemical, and microbial indicators in three major soil types dominated in Lithuania—Arenosols, Retisols, and Cambisols—under forest land, perennial grassland, and arable land. Furthermore, soil microbial biomass carbon (SMBC) and nitrogen (SMBN), their ratio, and soil microbial respiration (microbial CO2) next to SOC and total N were hypothesized to be important measures for assessing SOC stability under different land uses. Therefore, selected soil indicators were evaluated in the surface 0–10 and 10–20 cm mineral soil layers. The study results showed higher concentrations of SOC, N, SMBC, and SMBN, and soil microbial CO2 in forest land and perennial grasslands than in arable land. The higher SMBC/SOC and SNBN/TN ratios indicated a higher ability to accumulate SOC and N in forest land and grasslands. Higher SOC immobilization in forest land and higher N immobilization in arable land were both specified by the obtained SMBC:SMBN ratio. This study identified forest land followed by grassland as the best land management practice that addresses soil C sequestration through higher C immobilisation. Assessing soil in forest land as a control land use next to the agricultural land could be a reasonable soil management practice to evaluate C sequestration in the region. Additionally, it was assumed that evaluation of the SMBC and SMBN concentrations together with soil physical and chemical indicators allow for a more effective assessment of SOC stability. Taken together, these findings support recommendation to develop grassland (and especially forest land systems) through afforestation or within agroforestry system, without reducing the importance of the agricultural sector.

1. Introduction

The efforts to preserve and enhance the resilience of forest ecosystems, encompassing the crucial element of forest soils, make a substantial contribution to the achievement of the Sustainable Development Goals created by the United Nations in 2015 [1]. Soil organic carbon (SOC) plays a critical role in the global context in promoting the sustainable use of terrestrial ecosystems considering climate change mitigation concerns. Furthermore, SOC is used to assess soil quality. SOC stability refers to the ability of soil organic matter to resist decomposition, leading to long-term soil carbon storage. Several studies have shown the role of aboveground and belowground plant biomass input and organic residues, physical and chemical soil properties, soil microbial composition and activity, land use, and climatic conditions, affecting SOC stability [2,3,4,5]. Moreover, the recent biotic and abiotic factors are equally important for soil organic matter formation and stability [6]. Existing research recognized the essential role of soil organic matter as an important factor in evaluating SOC stability [3]. Therefore, protecting soil organic matter from microbial degradation while preserving SOC content is important to improve soil quality, develop sustainable land management, and contribute to climate change mitigation.
Soil quality is influenced by soil environmental conditions and chemical composition. It is well known that SOC quantity and quality impact soil nitrogen (N) dynamics and its overall retention in an ecosystem [7]. The SOC to total nitrogen (TN) ratio is one of the parameters used to define SOC stability. For example, a higher C:N ratio (referred to as SOC:TN in this paper) generally indicates higher SOC stability [8]. The SOC:TN ratio was indicated as a significant predictor of SOC stabilization in soil under different management practices [9,10].
Along with other parameters characterizing soil quality and soil biota plays an important role. Soil microbial biomass and microbial community composition are good indicators of soil quality, responsible for various biochemical processes and acting on soil organic matter decomposition, carbon, and plant nutrient cycling [11,12]. Moreover, soil microorganisms are necessary mediators for a consistent carbon cycle in nature [13].
As there is still a lack of systematic understanding of how soil quality and SOC stability are influenced by microorganisms in different soil management practices, it is important to comprehensively evaluate these indicators at various levels. This has already been emphasized in previous studies [14], highlighting that land use change impacts soil fertility and overall quality and SOC accumulation. Various disturbances alter metabolic processes in soil, leading to changes in SOC stability and retention, and to the loss of carbon through CO2 emissions [15,16]. Forest soils positively affect soil microbial biomass, promoting carbon accumulation [17,18,19]. However, the role of soil microbial properties on SOC stability is still debated.
Based on the EUROSTAT data, the land area in the European Union, including Lithuania, is predominantly covered by woodland and forest cover, cropland, and grassland. These three key land-use sectors are commonly used as major reporting categories according to the Intergovernmental Panel on Climate Change—IPCC Guidelines [20]. This paper assesses the selected soil quality indicators to evaluate the SOC stability in three predominant soil types found in Lithuania–Arenosols, Retisols, and Cambisols under key land uses–forest land, perennial grassland, and arable land. Three objectives were set: the first, to assess the SOC and TN concentrations and stocks, and SOC:TN ratio; the second, to quantify soil microbial biomass carbon (SMBC) and nitrogen (SMBN) concentrations, and SMBC:SMBN ratio; the third, to evaluate the SMBC:SMBN ratio in relation to SOC:TN ratio as a measure for SOC stability in different soil types and land use. We hypothesized that expanded roles of soil microbial biomass carbon (SMBC) and nitrogen (SMBN), along with SMBC:SMBN ratio, and microbial respiration, provide a more effective indicator set for SOC stability in comparison to the evaluation of chemical and physical soil properties.

2. Materials and Methods

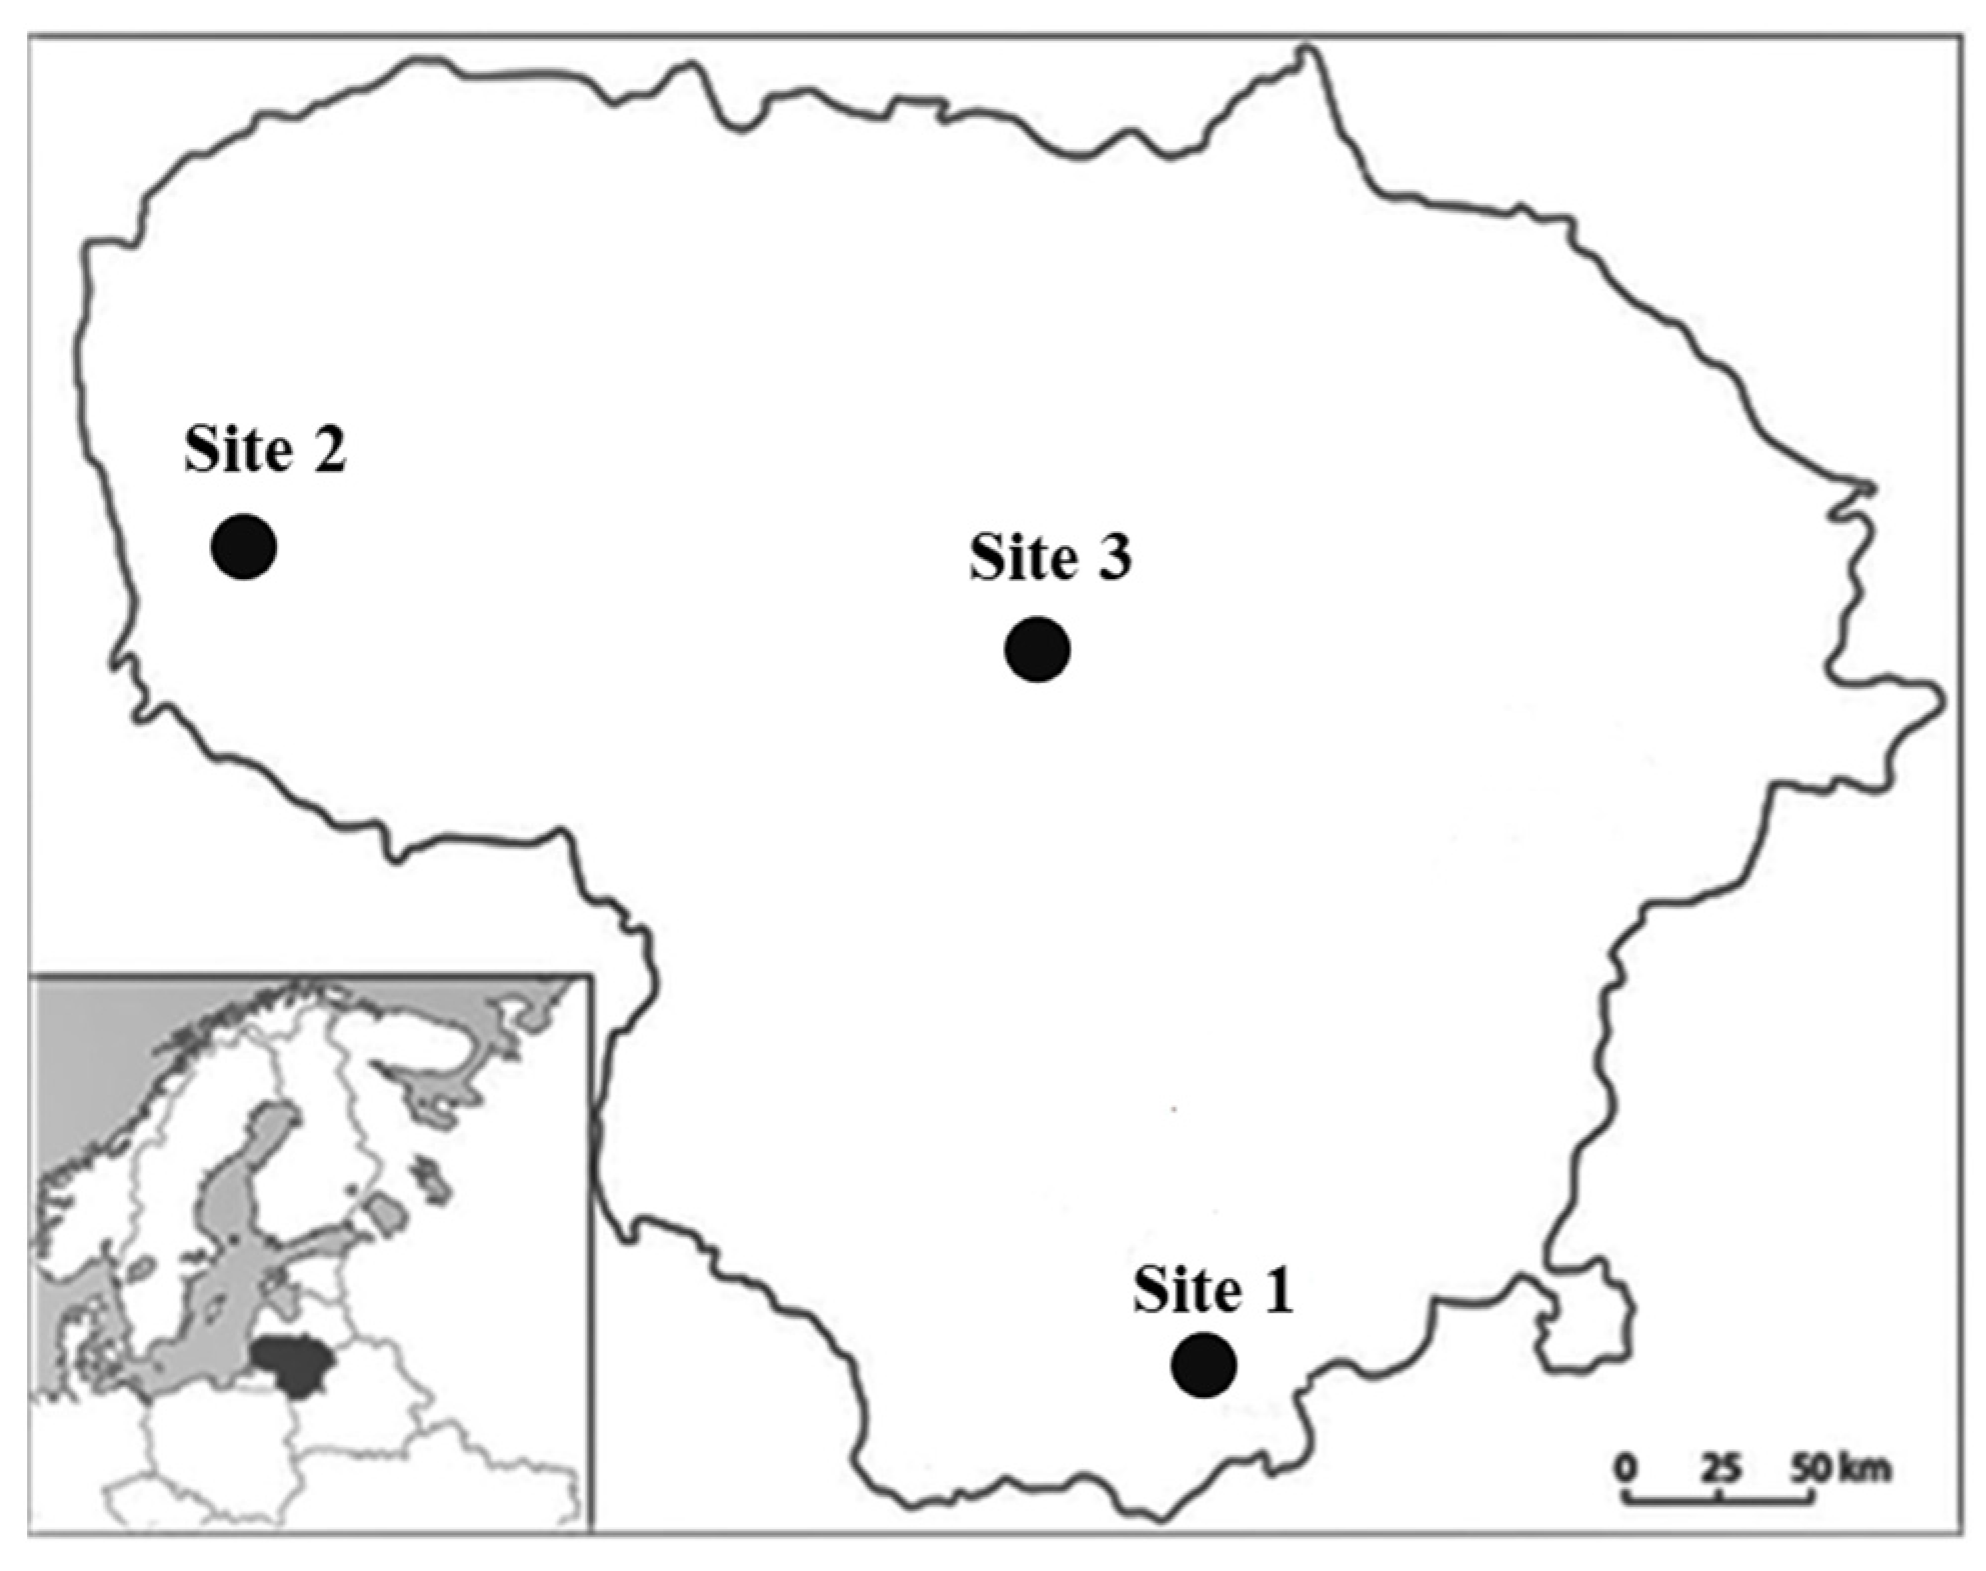
2.1. Soils and Study Sites

The study was carried out on the dominant Lithuanian major soil types—Arenosols, Retisols, and Cambisols [21] (Figure 1). Soil texture in the 0–20 cm mineral soil layers was classified as loam sand for Arenosols, loam for Retisols and sandy loam for Cambisols. Each study site included three different land uses–forest land, perennial grassland, and arable land (Table 1).
Site 1 was established on Arenosols in the Perloja region and included the variants of the forest land with silver birch (Betula pendula Roth) stand, perennial grassland on abandoned arable land since 1995, and arable land with cultivated winter rye (Secale cereale L.) (Figure 1 and Table 1). Site 2 was established on Retisols in the experimental fields located in the Vėžaičiai region. This study site included the variants of the forest land with silver birch stands, perennial grassland sown 15–20 years ago, and arable land with winter rye crops. Site 3, established on Cambisols and located in the Dotnuva region, included the variants of forest land (silver birch stands with an admixture of aspen and oak trees), perennial grassland, and arable land with cultivated forage pea (Pisum sativum L.). More details about these study sites were provided by Ref. [22].
The meteorological conditions in all study sites slightly differed during the sampling period in the summer of 2015. At Site 1, the total amount of precipitation was 536–662 mm and the average air temperature was 13.2–13.3 °C or 20% and 0.8 °C, respectively, higher than the standard climate normal of 1991–2020. At Site 2, the total amount of precipitation was 432 mm (20% lower than the standard climate normal), and the mean air temperature was 12.0 °C (0.4 °C lower than the standard climate normal) during the vegetation period. At Site 3, the precipitation amounted to 268 mm, and it was 45% lower than the standard climate normal. The average air temperature was 12.9 °C, and it was 0.9 °C lower than the standard climate normal.

2.2. Soil Sampling and Analysis

For physical, chemical, and microbiological soil analysis, the samples were collected from the surface 0–20 cm of mineral soil in 2015. To determine the bulk density (g cm−3) of fine (<2 mm) mineral soil in 0–10 cm and 10–20 cm soil layers, three composite samples were combined from five subsamples collected systematically in each sample plot. The soil was sampled using a metal cylinder of known volume, pressed into the undisturbed, flat surface in the middle of the desired soil depth. The cylinder was carefully removed, extracting an undisturbed sample. The soil sample was placed in a plastic bag and transported to the laboratory. For the determination of coarse fragment (>2 mm) content, all mineral soil samples were passed through a 2-mm sieve to remove stones and gravel. The fraction that did not pass through the 2-mm sieve was weighed for the determination of coarse fragment content. The weight of the moist sample was measured, and then the samples were oven-dried at 105 °C until they reached a constant weight and weighed again. The dry bulk density of fine soils was calculated from the mass and the volume of a soil sample according to Standard ISO 11272:1998 [23].
Mineral soil for chemical analysis was sampled from 0–10 cm and 10–20 cm soil layers by a metallic soil auger (Ø25 mm). Three composite samples were combined from five subsamples collected systematically in each sample plot with a distance between sampling points of at least five meters. To ensure representative sampling, a 1-m distance from tree stems or stumps was upheld across all study sites.
Determination of particle size distribution in mineral soil samples obtained from surface 0–10 cm and 10–20 cm mineral layers of Arenosols, Retisols, and Cambisols under different land use were estimated by sieving and sedimentation method according to the Standard ISO 11277-2020 [24]. Soil pHCaCl2 was measured by potentiometric method (ISO 10390:2005) [25]; TN concentration by the modified Kjeldahl method according to Standard ISO 11261:1995 [26], and SOC concentration was determined using a dry combustion method with a total carbon analyzer Analytic Jena multi-EA 4000 Germany, according to Standard ISO 10694:1995 [27]. For the determination of fulvic and humic acids, Method 5.4 described by Ref. [28] was used. Hot water extractable organic carbon (WEOC) was determined according to the methodology described in the Standard LST ISO 8245:1999 [29]. Laboratory analyses were provided by the Agrochemical Research Laboratory of the Lithuanian Research Centre for Agriculture and Forestry.
The samples taken for soil chemical analysis were used for soil microbiological analysis. The concentrations of soil microbial biomass carbon (SMBC) and soil microbial biomass nitrogen (SMBN) were determined by the fumigation-extraction methodology according to Standard ISO 14240-2:1997 [30]. Soil samples were fumigated by exposing the soil to alcohol-free chloroform (CHCl3) vapour for 24 h in a vacuum desiccator. The SMBC concentration (µg g−1) was calculated according to Ref. [31], taking the 0.5 M K2SO4 extract efficiency factor 2.64. The SMBN concentration (µg g−1 DM) was calculated according to Ref. [32] by taking the potassium sulphate (K2SO4) extract efficiency factor of 0.54.
Soil microbial respiration in the 0–10 cm and 10–20 cm layers of Arenosols, Retisols, and Cambisols was evaluated as the average of released CO2 (mg g−1 per day) during July 2015. Microbial soil respiration was determined by the CO2 titration method according to the Standard ISO 16072:2002 [33]. The principle was followed when the soil was incubated in a closed vessel and the released CO2 was absorbed in a solution of sodium hydroxide (NaOH). After the titration, the released CO2 was calculated according to the Equation (1), following Ref. [34] and ISO 16072:2002 [33].
R C O 2 = V V 1   ×   4.4 m   ×   t
where RCO2 is the rate of CO2 evolution on dry soil (mg CO2 g−1 per day); V is the volume of HCl consumed in the control (mL); V1 is the volume of HCl consumed in the test sample (mL); m is the mass of the dry soil sample (g); 4.4 is a factor (1 mL of 0.2 molars NaOH corresponds to 4.4 mg of CO2) (mg mL−1); t is the incubation period (days).

2.3. Calculations and Statistics

The stocks of SOC and TN in 0–10 cm and 10–20 cm layers were calculated according to the Equation (2), given by Ref. [35], and the Equation (3).
S O C i = ρ i ( 1 δ i , 2 m m 100 ) d i C i × 1 0 1
T N i = ρ i ( 1 δ i , 2 m m 100 ) d i N i × 1 0 1
where SOC is soil organic carbon (t ha−1); TN is total nitrogen (t ha–1); ρi is the bulk density of the <2 mm fraction (g cm−3); δi,2mm is the relative volume of the ≥2 mm fraction (%); di denotes the thickness of layer i (cm); Ci and Ni denote the SOC or TN concentration of layer i, respectively (mg g−1); and 10−1 is a unit factor (10−9 mg Mg−1 × 108 cm2 ha−1).
The relationship between SOC concentration and TN concentration was shown as the SOC:TN ratio. The ratio of soil microbial biomass C to N was calculated as the SMBC:SMBN ratio. The ratios of SMBC to SOC concentration or TN concentration were shown as SMBC/SOC, and SMBN/TN.
The normal distribution of variables was tested using Lilliefors and Kolmogorov-Smirnov tests and the hypothesis of normal distribution was rejected. Therefore, a non-parametric Kruskal-Wallis analysis of variance was applied to determine significant differences between land uses. The Dunn-Bonferroni post-hoc procedure was used to identify the significantly different means. Data are presented as means ± standard error (SE). Statistical analyses were conducted using STATISTICA 12.0 (StatSoft. Inc, Tulsa, OH, USA, 2007) software, and the level of significance of p < 0.05 was used in all cases.
The statistical package SAS software (version 9.4) was applied to analyze soil indicators, assessing the significance of differences in land uses and soil types using TTEST. The GLM procedure determined overall trait significance with the TEST3 method (* p < 0.05; ** p < 0.01; *** p < 0.001). Due to limited replicates, testing parameter error distributions were not meaningful. Thus, the “Pooled” or “Satterthwaite” methods were used to evaluate the significance of differences.
The MIXED procedure (REML method) was applied to calculate variation components using the statistical model Equation (4).
y ilmn = μ + p i + f ( p ) l i + g ( f ) m l + ε ilmn  
where μ is the average of the entire test, p i is the random effect of soil type (i = 1…3), f ( p ) l i is the random effect of land use (l = 1…3) in soil type (i), g ( f ) m l is fixed effect of sampling depth in land use (l), ε ilmn is random error, n is the index.
The SAS procedure CORR was used to calculate the correlation between soil indicators (Pearson correlation).

3. Results

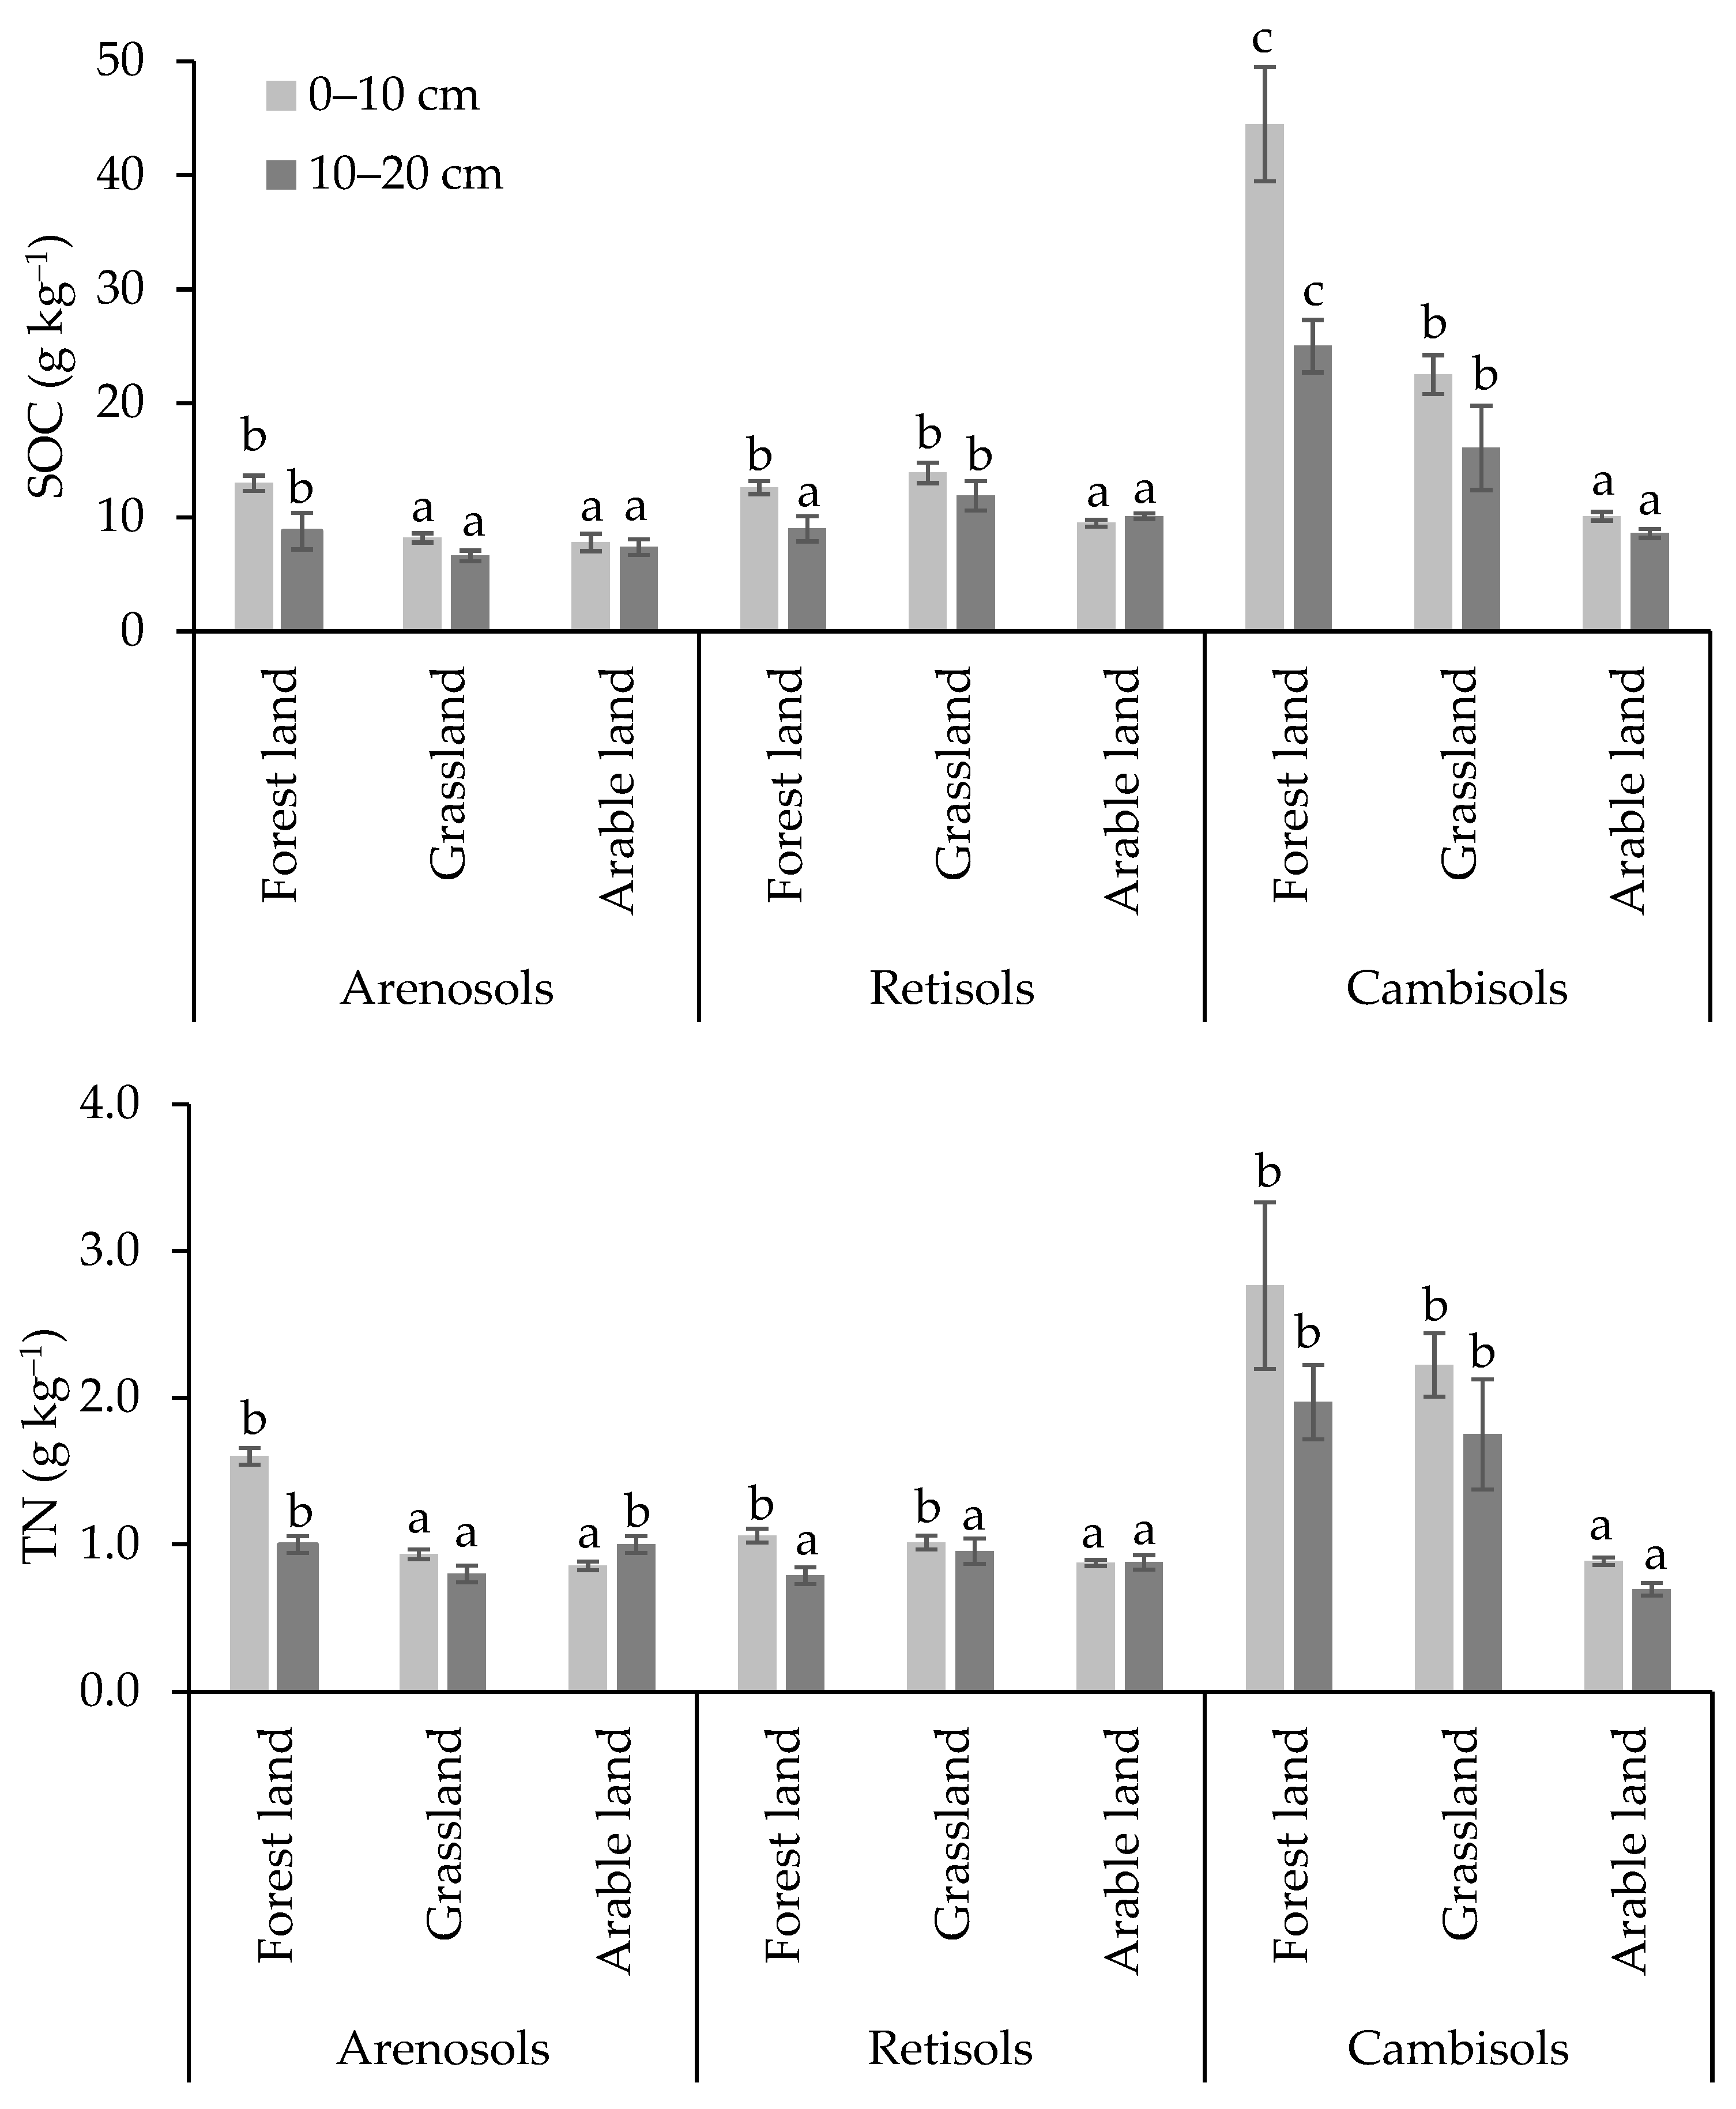
3.1. Physical and Chemical Soil Indicators in Different Land Use

The soil bulk density in Arenosols, Retisols and Cambisols varied in a narrow range of 1.01–1.69 g cm−3. The lowest soil bulk density was found in Cambisols on forest land: 1.01 g cm−3 in the 0–10 cm and 1.09 g cm−3 in the 10–20 cm soil layer. The soil pHCaCl2 varied from pH 4.4–4.9 in Arenosols, Retisols and Cambisols on forest land to pH 6.1–6.7 in Cambisols on grassland. The mean concentrations of soil organic carbon (SOC) in the 0–10 cm and 10–20 cm layers of the studied soils ranged from 6.6 g kg−1 to 44.8 g kg–1 and the mean concentrations of total nitrogen (TN)—from 0.7 g kg−1 to 2.8 g kg−1 (Figure 2). Significant differences in mean SOC concentrations were observed between the studied soil types. The SOC concentrations were approximately 1.2–1.8 times higher in Retisols and 1.3–3.4 times higher in Cambisols compared to Arenosols. The lowest SOC concentrations were found in arable land (i.e., the values were up to 4.2 times lower than those found in soils on forest land and grassland). However, the mean TN concentrations in Arenosols and Retisols did not differ significantly across different land uses. Conversely, the TN concentrations in Cambisols on forest land and grassland were approximately 1.8–2.3 times higher than in arable land.
The mean SOC stocks in the 0–10 cm and 10–20 cm layers of Arenosols, Retisols, and Cambisols ranged from 8.5 to 46.5 t ha−1, while the mean TN stocks were between 1.0 and 3.2 t ha−1 (Table 2). Although differences between minimum and maximum values were found, there was a tendency for higher SOC and TN stocks in soils on forest land and grassland. In forest Cambisols, the highest mean SOC stocks were 27.3–46.5 t ha−1 and TN stocks were 2.2–2.9 t ha−1. The SOC and TN stocks on grasslands were 25.3–32.6 t ha−1 and 2.8–3.2 t ha−1, respectively. Significantly lowest mean SOC stocks and mean TN stocks were found in Cambisols on arable land. The forest land and grasslands contained up to 3 times higher SOC and TN stocks compared to arable land.
Table 3 presents the composition of humus fractions and the mean concentrations of water-extractable organic carbon (WEOC) in the 0–10 cm and 10–20 cm layers of studied soil types on different land uses. Arenosols showed the highest percentage of fulvic acids (0.37–0.74%), while Retisols and Cambisols had the highest percentage of humic acids—0.19–0.35% and 0.14–1.20%, respectively. The soils on forest land contained the highest percentage of fulvic and humic acids in the studied soil types, while insoluble residues constituted over 99% of soil humus on all land uses. The mean WEOC concentrations in studied soils ranged from 316 mg kg−1 to 1727 mg kg−1 in all land uses (Table 3). Retisols and Cambisols had 1.2–3.3 times higher WEOC concentrations than Arenosols. The highest WEOC concentrations in Arenosols were found on forest land, while the highest WEOC concentrations in Retisols and Cambisols were obtained on forest land and grasslands.

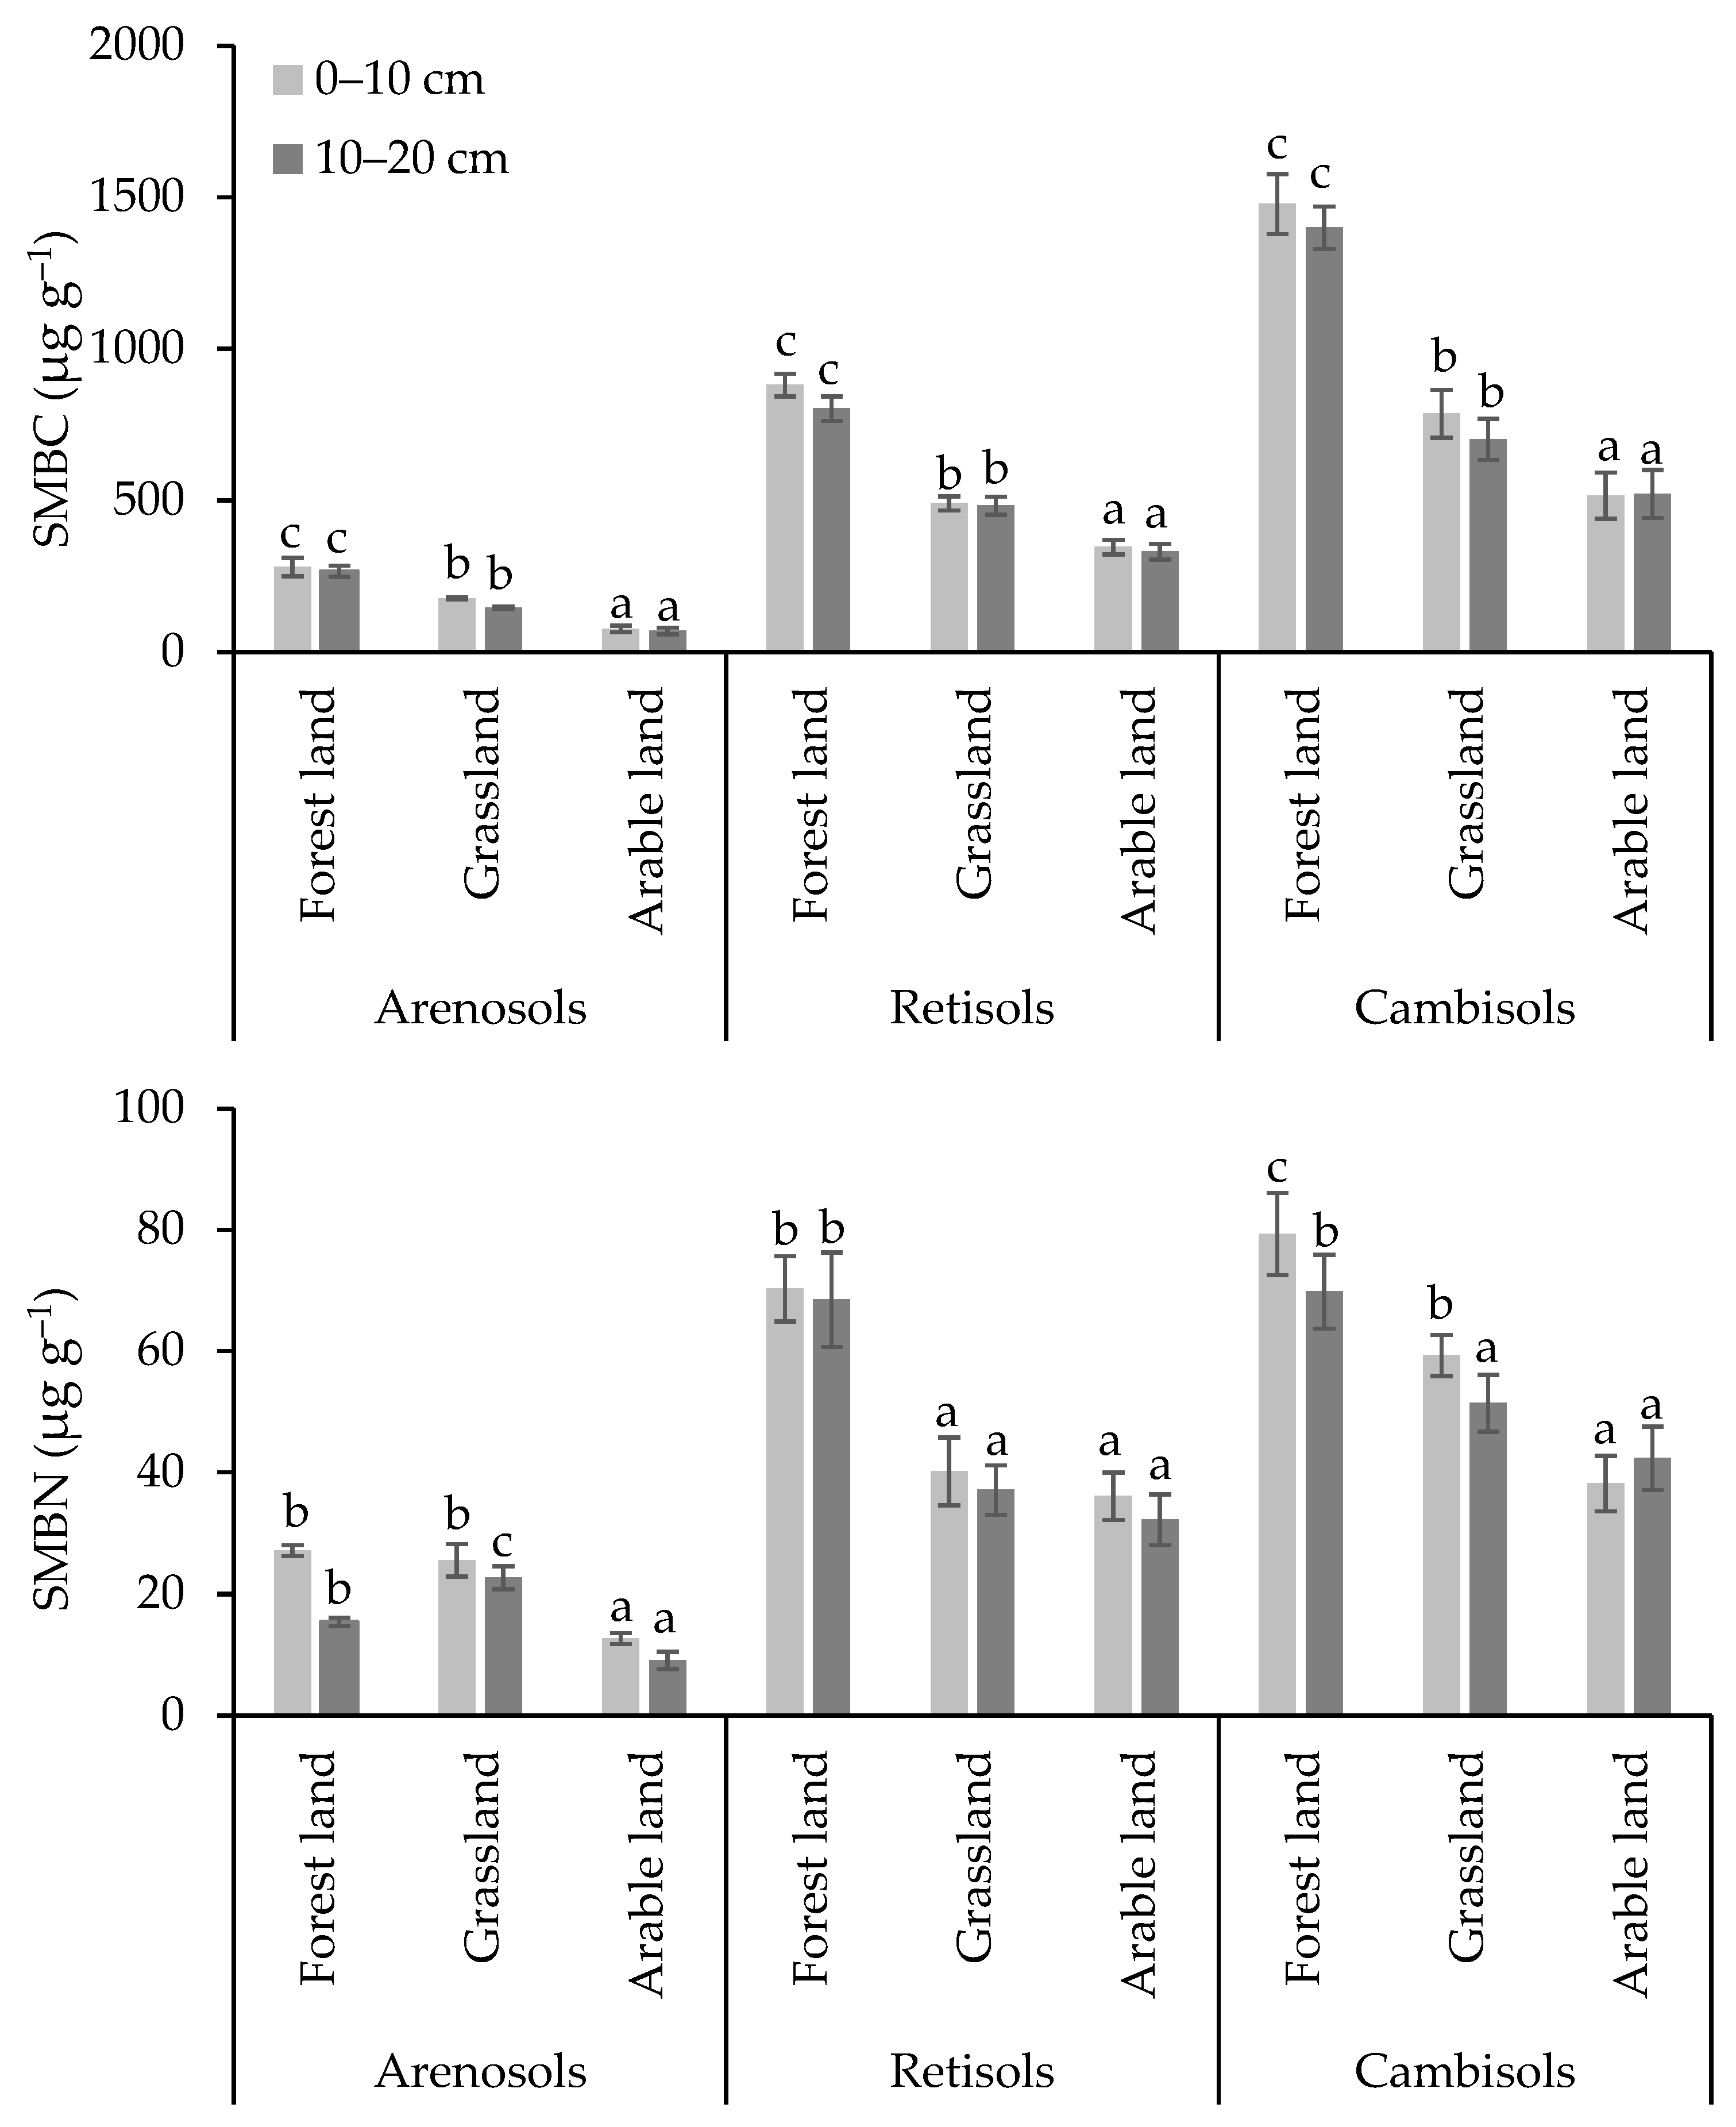
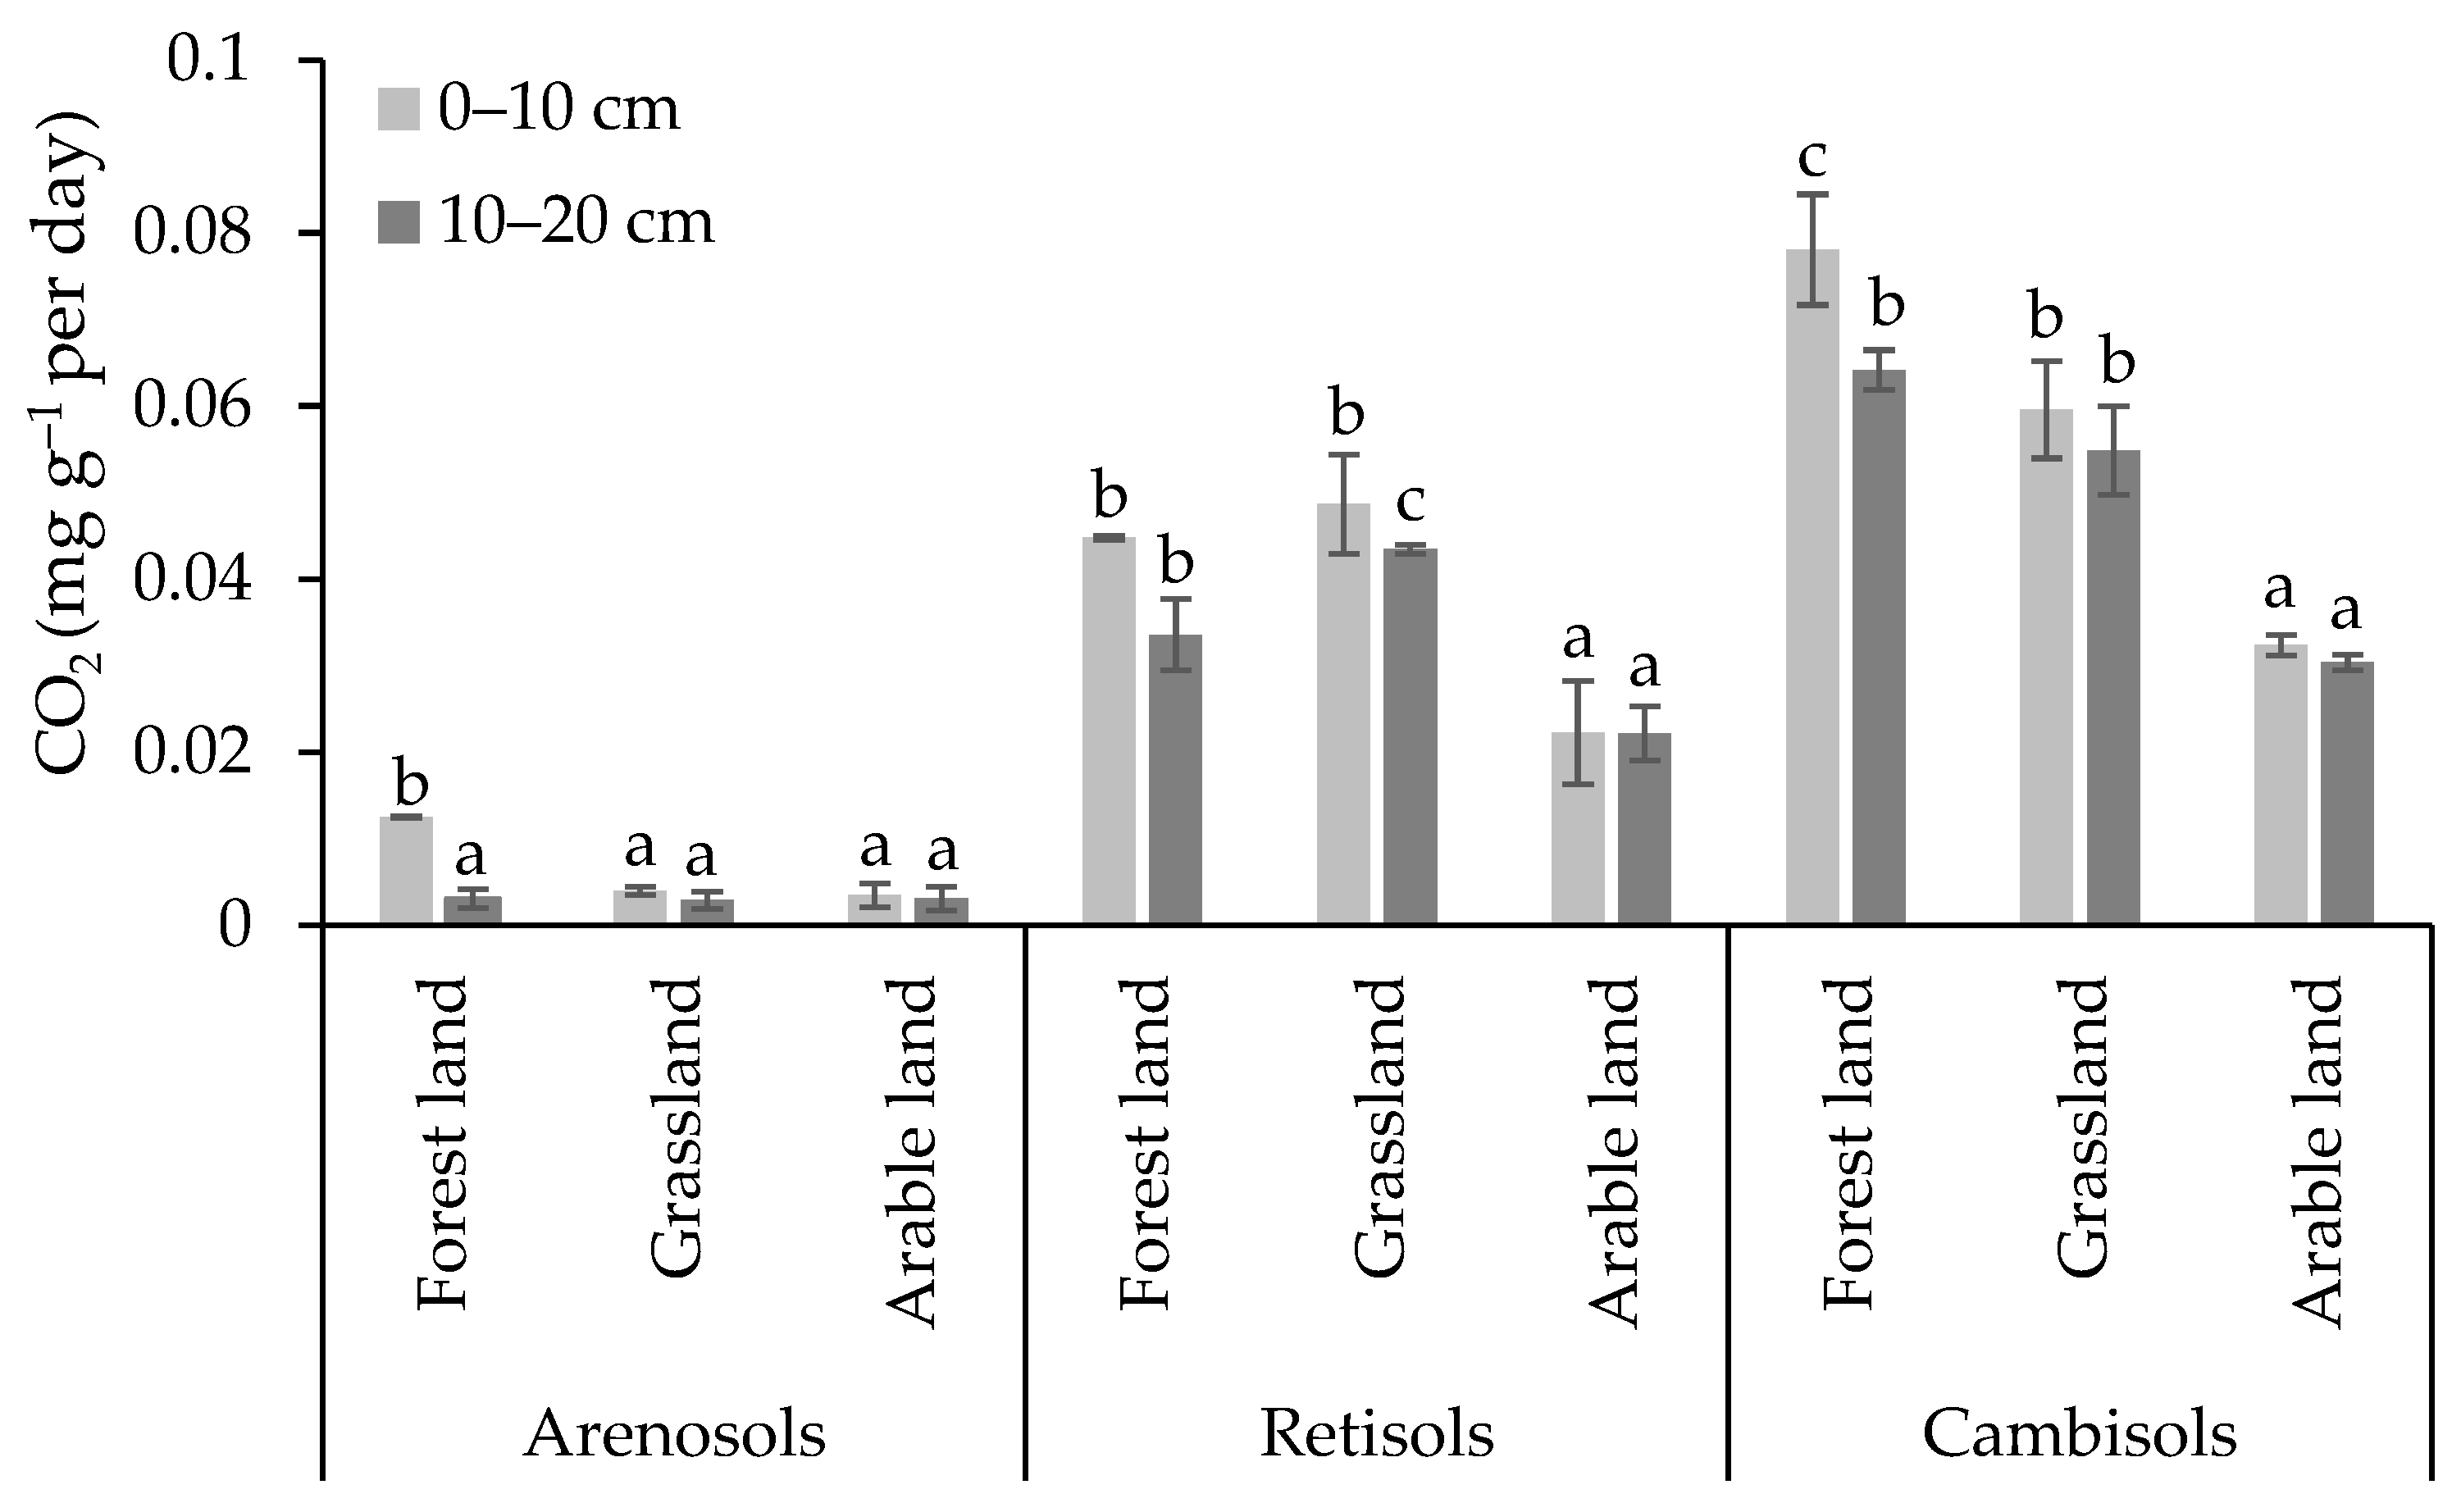
3.2. Carbon and Nitrogen Concentrations in Soil Microbial Biomass and Microbial Respiration

Across different land uses, the mean concentrations of soil microbial biomass carbon (SMBC) showed a wide range of variation, ranging from 66.7 to 1478.3 µg g−1 in Arenosols, Retisols, and Cambisols (Figure 3). The SMBC concentrations in Arenosols (69.7–280.3 µg g−1) were on average 2.8–5.0 times lower than in Retisols (331.4–880.7 µg g−1) and Cambisols (515.8–1478.3 µg g−1). Forest land showed up to 3.1 higher SMBC concentrations in both 0–10 cm and 10–20 cm soil layers on all studied soil types.
In different soil types and different land uses, the mean concentrations of soil microbial biomass nitrogen (SMBN) varied from 9.1 to 79.3 µg g−1 (Figure 3). The mean SMBN concentration in Arenosols ranged from 9.1 to 27.1 µg g−1 and was 2.6–4.7 times lower than in Retisols and Cambisols. In all study sites, the mean SMBN concentrations were 1.4–3.6 times higher in soils on forest land than on grassland and arable land.
As one of the measures of soil microbial activity, the measured mean soil microbial respiration (further, microbial CO2) ranged from 0.002 mg g−1 to 0.078 mg g−1 per day in the studied soil types on different land uses (Figure 4). The mean value of microbial CO2 was 3.6–15.0 times higher in Retisols (0.022–0.049 mg g−1) and 6.3–20.7 times higher in Cambisols (0.030–0.078 mg g−1) than in Arenosols (0.002–0.013 mg g−1) across all land uses (Figure 4). In comparison to arable land, microbial CO2 values were found to be up to 2.4 times higher in forest land and grasslands across all soil types.

3.3. Relationships between Soil Properties

The SOC:TN ratio ranged from 7.4 to 17.2 in the studied soil types (Table 4). This ratio was up to 2.1 times lower in Arenosols than in Retisols and Cambisols.
The microbial biomass carbon as a proportion of soil organic carbon (SMBC/SOC) and the microbial biomass nitrogen as a proportion of total nitrogen (SMBN/TN) ranged between 0.9% and 7.8% in Arenosols, Retisols, and Cambisols (Table 4). The specific ratios of SMBC/SOC and SMBN/TN found in different soil types were mainly influenced by land use. The largest differences in these ratios between different land uses and the highest values on forest land were found in Retisols. However, these ratios in Arenosols and Cambisols showed different distributions between land uses. For example, the ratios of SMBC/SOC and SMBN/TN were higher in Arenosols on forest land and grassland than on arable land. These ratios in fertile Cambisols under arable land were not significantly lower than in other land uses.
The mean SMBC:SMBN ratios obtained in Arenosols, Retisols, and Cambisols varied from 6.7 to 18.6 (Table 4). The SMBC:SMBN ratio was 2.2–2.9 times higher in Arenosols on forest land than on grassland and arable land. In Retisols and Cambisols, the SMBC:SMBN ratios were 1.3–1.5 times higher in forest land and grassland than in arable land.
The study results revealed that SOC and TN concentrations, soil bulk density and the percentage of humic acid were more influenced by land use (variation component–45.9–71.7%) than the soil type (soil pedogenesis) (Table 5). However, soil pHCaCl2 value, soil texture (the percentage of sand, silt, and clay particles), and percentage of fulvic acids were mainly dependent on the soil type (66.6–87.8%). The SMBC and SMBN concentrations and microbial CO2 were strongly influenced by the soil type (70.5–87.6%) rather than the land use (10.4–25.8%).
The soil indices such as the concentrations of SMBC, SMBN, SOC, TN, WEOC, and microbial CO2, soil bulk density, pHCaCl2, and humus fraction composition showed the dependence on soil sampling depth, which was presented as surface 0–10 and 10–20 cm mineral soil layers (Table 6). The concentrations of SOC, TN, WEOC, and the percentage of humic acids, also silt and clay particles showed positively moderate and strong correlations with the SMBC and SMBN concentrations, and microbial CO2 in Arenosols, Retisols, and Cambisols. While the negative correlations were obtained with the percentages of sand particles and fulvic acid. A moderate correlation was identified between SMBC, SMBN, and microbial CO2 with SOC:TN ratio (r = 0.58–0.68), whereas microbiological parameters showed a weak correlation (r = 0.28–0.34) with soil pHCaCl2.
In Arenosols, the SMBC and SMBN concentrations, as well as microbial CO2 showed a weak to moderate (r = 0.43–0.51) correlation with the SOC and TN concentrations (Table 6). A strong positive correlation (r = 0.82–0.87) was found between the SMBC and SMBN concentrations with fulvic acid. Soil microbial CO2 moderately strongly (r = 0.56) correlated with humic acid. In Retisols, the SMBC and SMBN concentrations and microbial CO2 were positively correlated (r = 0.51–0.80) with the content of silt and clay, as well as humic and fulvic acids, but negatively correlated with soil pHCaCl2, sand content and insoluble residue (r =–0.52–0.81). In Cambisols, microbial properties positively correlated (r = 0.48–0.91) with the concentrations of SOC, TN, and WEOC, and with humic and fulvic acids, but negatively with soil bulk density, pHCaCl2, and insoluble residue (r =–0.78–0.92).

4. Discussion

The objective of this study was to evaluate soil physical, chemical, and microbial indicators in three major soil types—Arenosols, Retisols, and Cambisols—under different land uses—forest land, perennial grassland, and arable land. The first question in this study was to compare SOC and TN stocks based on their concentrations and bulk densities in different land use types. The study results showed that forest soils had the lowest bulk density, indicating significant differences among land uses, particularly in fertile Cambisols. Previous studies also have shown that soil bulk density in the 0–10 cm soil layer of grasslands and croplands was 1.5 times higher in Cambisols and 20–30% higher in Luvisols and Retisols compared to the corresponding forest soils [36]. The presence of tree roots and decomposing organic matter, which preserves soil structure, contributes to the lower bulk density found in forest soils.
The study revealed that Retisols and Cambisols, promoting organic matter accumulation and better nutrient availability, had higher soil organic carbon (SOC) and total nitrogen (TN) concentrations compared to low-nutrient Arenosols (see Figure 2). Regardless of soil type, higher SOC concentrations were found in forest land compared to other studied land uses. Furthermore, higher SOC and TN stocks were obtained in forest soils and grasslands than in arable land (see Table 2). The studies from previous years, such as Armolaitis et al. (2022) [36] and Pranskevičius (2011) [37], also showed similar trends, emphasizing that soil texture, especially clay content, and land use have a significant influence on SOC and TN concentrations and stocks.
The lower SOC:TN ratio found in Arenosols than in Retisols and Cambisols (see Table 4) indicated faster organic matter decomposition or lower organic matter input [38], which may have been due to poor vegetation cover and lower carbon content. It is common that higher inputs of organic matter through plant litter and root turnover result in higher C and N stocks in forests and grasslands [39,40]. Forest land also had the highest percentage of fulvic and humic acids (see Table 3), enhancing microbial activity and biomass in soils. Analysing the relationship between the soil parameters, we found that the abovementioned soil properties such as fine soil bulk density, the SOC and TN concentrations, and the percentage of humic acids were more influenced by land use than the soil type (see Table 6). The higher concentration of water-extractable organic carbon (WEOC), which is important as an available source of nutrients for soil microorganisms and a labile form of soil C [41], was obtained in Retisols and Cambisols than Arenosols (see Table 3). The highest WEOC concentration was obtained in forest Cambisols due to higher inputs of organic matter and active microbial communities.
As a comprehensive index for the assessment of soil microbial activity further contributing to long-term SOC stability and storage [42], microbial soil respiration (microbial CO2) was also evaluated in the present study. The most intensive microbial soil respiration was found in forest land and grassland, especially in more fertile soils—Retisols and Cambisols (see Figure 4). Increased microbial respiration in forest and grassland might be related to the higher content of organic compounds and a more varied composition of microorganism species [43]. Soil microbial respiration indicated the potential rate of soil organic matter decomposition [44,45].
The next important question in this study was to evaluate the concentrations of soil microbial biomass carbon (SMBC) and nitrogen (SMBN), and their ratio. Both SMBC and SMBN concentrations were several times higher in Retisols and Cambisols than in Arenosols. The highest SMBC and SMBN values were obtained in forest land (see Figure 3) due to richer organic matter, promoting microbial activity. Differences in biological processes, microbial abundance and composition are commonly observed in forest and agricultural soils, where agricultural practices can reduce microbial biomass [46,47]. Significant differences between land uses were well illustrated by Woloszczyk et al. (2020) study which found that the mean SMBC concentrations were 197 μg g−1 in arable land, 832 μg g−1 in grassland and 467 μg g−1 in forests [48].
Prior studies have noted that the percentages of SMBC in SOC (SMBC/SOC) and SMBN in TN (SMBN/TN) provide specific information about metabolically active C and N in the soil [43,49]. We found that forest land supported the higher SMBC/SOC than other land uses, especially on non-fertile Arenosols. Unfortunately, the SMBN/TN was difficult to interpret, as the higher SMBN/TN was found in grassland Arenosols, in forest Retisols, and in Cambisols on arable land. The SMBN/TN depended more on the soil type than on the land use. Overall, the SMBC/SOC may account for 3–7%, and the SMBN/TN up to 5% [49,50]. More specifically, earlier studies found that SMBC/SOC ratio in the surface mineral layers in forest soils ranged from 1.5% to 9.0% [43,51,52] and from 0.3% to 6.0% in cultivated agricultural lands, including grasslands [30,50,51]. The SMBN/TN ranged from 2% to 6% in agricultural soils [53]. The soils with higher SMBC, SMBN, and SMBC/SOC ratios tended to have a stronger ability to accumulate SOC [54,55].
According to the studies by Li et al. (2008), SMBC and SMBN were strongly associated with SOC and soil TN [56]. On this question, we found that SMBC, SMBN, and soil microbial respiration of Arenosols, Retisols, and Cambisols positively correlated with the concentrations of SOC, TN, WEOC, and with the percentage of humic acids, as well as silt and clay particles (see Table 6). Previous studies have shown that soils with higher clay content had higher SOC content and were more stable than sandy soils [8,57]. The SOC associated with the clay-sized fraction is typically more stable against microbial decomposition and therefore important for long-term SOC stabilization [58,59,60].
The ratio of microbial biomass C to N ratio, shown as SMBC:SMBN, was found to be higher in Arenosols on forest land than on grassland and arable land (see Table 4). For Retisols and Cambisols, this ratio was up to 1.5 times higher in forest land and grassland than in arable land. This implies that C immobilization by microorganisms occurs at a higher ratio relative to N compared to arable land in nutrient-rich soils, regardless of land use. Nutrient-rich soils likely have a higher supply of C sources for microbes, leading to the observed differences in the C to N immobilization ratios. Our data were comparable with the findings obtained in the previous studies, which indicated that the SMBC:SMBN ratio ranged from 5.2 in cultivated soils to 20.8 in forest soils [61,62]. Previous studies also indicated that the SMBC:SMBN ratio is an important indicator of soil N mineralization capacity and has important ecological significance for the balance of C and N in the soils. The study by Chen et al. (2022) showed that the SMBC:SMBN ratio less than 15 indicated an excess of soil N, the ratio between 15 and 30–balanced soil C and N, and when this ratio was above 30, the development of microorganisms was limited, and they competed for N in the soils [63]. Following this, the SMBC:SMBN ratio of 7–14 was found in perennial grasslands or arable land, showing N excess in comparison to SOC. While in forest land it was 17–18, indicating the balance between SOC and N in the soil. These differences between different land uses might be related to the structure of the soil microbial community. The SMBC:SMBN ratio of 7–12 potentially indicated a higher proportion of fungi in microbial biomass, whereas the ratio of 2–6 indicated a higher proportion of bacteria [64]. Furthermore, the fungi help to accumulate more SOC in the soil as the CO2 emissions are reduced [65].
Our study showed that the SMBC:SMBN ratio in the forest soil was higher than the soil C:N ratio, indicating that soil microorganisms have a greater demand for N to support their growth and activity, the soil is biologically active, and SOC immobilization is higher. The C:N ratio exceeding 30 was identified a useful indicator of SOC immobilization [66]. In the literature, these relationships are more often analyzed in terms of N immobilization. For example, Marinari et al. (2006) study suggested that N immobilization occurred when the SMBC:SMBN ratio was lower than the soil C:N ratio [67]. A lower SMBC:SMBN ratio also suggests that the microbial community may be limited by N availability as well as nutrient depletion. To identify SOC immobilization as a key indicator of long-term C sequestration potential that depends on land use and land use change, it is rational to analyze microbial ratios alongside key soil chemical indicators and the C:N ratio.

5. Conclusions

This study examined different soil properties in the surface layer of Arenosols, Retisols, and Cambisols under three main soil uses—forest land, perennial grassland, and arable land. Forest soils were characterized by the lowest bulk density, higher fulvic and humic acid content, more intensive microbial respiration, and higher concentrations of soil organic carbon (SOC), total nitrogen (TN), soil microbial biomass carbon (SMBC) and nitrogen (SMBN) compared to the agricultural land and especially were different from the arable land. More fertile soils had a higher ability to provide C sources to microorganisms, leading to an increase in the ratio of C to N immobilization, thus affecting SOC and TN stocks. The higher SMBC and SMBN concentrations contributed to higher SOC and TN stocks and responded in more intense SOC immobilization. The SMBC:SMBN ratio was identified as a key indicator for assessing SOC and TN accumulation. Furthermore, the study findings allow us to assume forest soil as a control land use for evaluating C sequestration in a hemiboreal forest zone. Basic soil chemical properties and at least SMBC:SMBN ratio could be important tools for soil management planning.
To achieve greater soil stability and C sequestration potential, efforts can be directed to the development of grassland and especially forest land use, without reducing the importance of the agricultural sector. Afforestation of lands less suitable for other land uses or combining different land elements within the agroforestry system could be promising strategies for improving the soil properties.

Author Contributions

Conceptualization, M.M.; Data curation, M.M. and J.A.; Formal analysis, M.M., K.A., I.V.-K. and V.B.; Investigation, M.M. and K.A.; Methodology, M.M., K.A. and J.A.; Software, M.M. and V.B.; Visualization, M.M., K.A. and I.V.-K.; Writing—original draft, M.M.; Writing—review & editing, K.A., I.V.-K., V.B. and J.A. All authors have read and agreed to the published version of the manuscript.

Funding

This research received no external funding.

Institutional Review Board Statement

Not applicable.

Informed Consent Statement

Not applicable.

Data Availability Statement

Data are contained within the article.

Acknowledgments

The authors are thankful to Jakub Hofman from the Soil Environmental Chemistry and Toxicology Department, Faculty of Science, Masaryk University, Czech Republic for providing methodology consultations on microbial biomass measurements. This paper presents research findings that have been obtained through the long-term research program “Sustainable Forestry and Global Changes”, implemented by the Lithuanian Research Centre for Agriculture and Forestry.

Conflicts of Interest

The authors declare no conflict of interest.

References

  1. Biermann, F.; Hickmann, T.; Sénit, C.A.; Beisheim, M.; Bernstein, S.; Chasek, P.; Grob, L.; Kim, R.E.; Kotzé, L.J.; Nilsson, M.; et al. Scientific evidence on the political impact of the Sustainable Development Goals. Nat. Sustain. 2022, 5, 795–800. [Google Scholar] [CrossRef]
  2. Wiesmeier, M.; Urbanski, L.; Hobley, E.; Lang, B.; von Lützow, M.; Martin-Spiotta, E.; van Weswmael, B.; Rabot, E.; Ließ, M.; Garcia-Franco, N.; et al. Soil organic carbon storage as a key function of soils—A review of drivers and indicators at various scales. Geoderma 2019, 333, 149–162. [Google Scholar] [CrossRef]
  3. Jensen, J.L.; Schjønning, P.; Watts, C.W.; Christensen, B.T.; Peltre, C.; Munkholm, L.J. Relating soil C and organic matter fractions to soil structural stability. Geoderma 2019, 337, 834–843. [Google Scholar] [CrossRef]
  4. Laganière, J.; Angers, D.A.; Paré, D. Carbon accumulation in agricultural soils after afforestation: A meta-analysis. Glob. Chang. Biol. 2020, 16, 439–453. [Google Scholar] [CrossRef]
  5. Guillaume, T.; Makowski, D.; Libohova, Z.; Bragazza, L.; Sallaku, F.; Sinaj, S. Soil organic carbon saturation in cropland-grassland systems: Storage potential and soil quality. Geoderma 2022, 406, 115529. [Google Scholar] [CrossRef]
  6. Islam, M.R.; Singh, B.; Dijkstra, F.A. Stabilisation of soil organic matter: Interactions between clay and microbes. Biogeochemistry 2022, 160, 145–158. [Google Scholar] [CrossRef]
  7. Murphy, B.W. Impact of soil organic matter on soil properties—A review with emphasis on Australian soils. Soil Res. 2015, 53, 605–635. [Google Scholar] [CrossRef]
  8. Soucémarianadin, L.N.; Cécillon, L.; Guenet, B.; Chenu, C.; Baudin, F.; Nicolas, M.; Girardin, C.; Barré, P. Environmental factors controlling soil organic carbon stability in French forest soils. Plant Soil 2018, 426, 267–286. [Google Scholar] [CrossRef]
  9. Six, J.; Conant, R.T.; Paul, E.A.; Paustian, K. Stabilization mechanisms of soil organic matter: Implications for C-saturation of soils. Plant Soil 2002, 241, 155–176. [Google Scholar] [CrossRef]
  10. Franzluebbers, A.J. Soil organic matter stratification ratio as an indicator of soil quality. Soil Tillage Res. 2002, 66, 95–106. [Google Scholar] [CrossRef]
  11. Singh, J.S.; Gupta, V.K. Soil microbial biomass: A key soil driver in management of ecosystem functioning. Sci. Total Environ. 2018, 634, 497–500. [Google Scholar] [CrossRef] [PubMed]
  12. Garau, G.; Morillas, L.; Roales, J.; Castaldi, P.; Mangia, N.P.; Spano, D.; Mereu, S. Effect of monospecific and mixed Mediterranean tree plantations on soil microbial community and biochemical functioning. Appl. Soil Ecol. 2019, 140, 78–88. [Google Scholar] [CrossRef]
  13. Houfani, A.A.; Větrovsky, T.; Navarrete, O.U.; Štursová, M.; Tláskal, V.; Beiko, R.G.; Boucherba, N.; Baldrian, P.; Benallaoua, S.; Jorquera, M.A. Cellulase-Hemicellulase Activities and Bacterial Community Composition of Different Soils from Algerian Ecosystems. Microb. Ecol. 2019, 77, 713–725. [Google Scholar] [CrossRef] [PubMed]
  14. Jandl, R.; Lindner, M.; Vesterdal, L.; Bauwens, B.; Baritz, R.; Hagedorn, F.; Johnson, D.W.; Minkkinen, K.; Byrne, K.A. How strongly can forest management influence soil carbon sequestration? Geoderma 2007, 137, 253–268. [Google Scholar] [CrossRef]
  15. Creamer, C.A.; Menezes, A.B.; Krull, E.S.; Sanderman, J.; Newton-Walters, R.; Farrell, M. Microbial community structure mediates response of soil C decomposition to litter addition and warming. Soil Biol. Biochem. 2015, 80, 175–188. [Google Scholar] [CrossRef]
  16. Schuur, E.A.G.; McGuire, A.D.; Schädel, C.; Grosse, G.; Harden, J.W.; Hayes, D.J.; Hugelius, G.; Koven, C.D.; Kuhry, P.; Lawrence, D.M.; et al. Climate change and the permafrost carbon feedback. Nature 2015, 520, 171–179. [Google Scholar] [CrossRef]
  17. Högberg, M.N.; Högberg, P.; Myrold, D.D. Is microbial community composition in boreal forest soils determined by pH, C-to-N ratio, the trees, or all three? Oecologia 2007, 150, 590–601. [Google Scholar] [CrossRef]
  18. Drum, C.G.; Vogel, J.G.; Gezan, S.A.; Jokela, E.J. Belowground processes for two loblolly pine (Pinus taeda L.) families respond differently to the intensity of plantation management. For. Ecol. Manag. 2019, 441, 293–301. [Google Scholar] [CrossRef]
  19. Walkiewicz, A.; Bieganowski, A.; Rafalska, A.; Khalil, M.I.; Osborne, B. Contrasting effects of forest type and stand age on soil microbial activities: An analysis of local scale variability. Biology 2021, 10, 850. [Google Scholar] [CrossRef]
  20. IPCC. 2006 IPCC Guidelines for National Greenhouse Gas Inventories. In Prepared by the National Greenhouse Gas Inventories Programme; Eggleston, H.S., Buendia, L., Miwa, K., Ngara, T., Tanabe, K., Eds.; IGES: Kanagawa, Japan, 2006. [Google Scholar]
  21. WRB World Reference Base for Soil Resources 2014, Update 2015. In International Soil Classification System for Naming Soils and Creating Legends for Soil Maps; World Soil Resources Reports No. 106; FAO: Rome, Italy, 2015; p. 192.
  22. Muraškienė, M. Evaluation of Soil Microbial Biomass Carbon and Nitrogen in Lithuania in Different Land Use. Ph.D. Dissertation, Lithuanian Research Centre for Agriculture and Forestry, Kaunas, Lithuania, 2023; p. 164, (In Lithuanian with English Summary). [Google Scholar]
  23. ISO 11272; Soil Quality—Determination of Dry Bulk Density. International Organization for Standardization: Geneva, Switzerland, 1998; pp. 1–10.
  24. ISO 11277-2020; Soil Quality—Determination of Particle Size Distribution in Mineral Soil Material–Method by Sieving and Sedimentation. International Organization for Standardization: Geneva, Switzerland, 2020; 38p.
  25. ISO 10390; Soil Quality—Determination of pH. International Organization for Standardization: Geneva, Switzerland, 2005; pp. 1–7.
  26. ISO 11261; Soil Quality—Determination of Total Nitrogen–Modified Kjeldahl Method. International Organization for Standardization: Geneva, Switzerland, 1995; pp. 1–4.
  27. ISO 10694; Soil Quality—Determination of Organic and Total Carbon after Dry Combustion (Elementary Analysis). International Organization for Standardization: Geneva, Switzerland, 1995; pp. 1–7.
  28. Faithfull, N.T. Methods in agricultural chemical analysis. In A Practical Handbook; University of Wales: Aberystwyth, UK, 2002; p. 289. [Google Scholar]
  29. ISO 8245; Water Quality—Guidelines for the Determination of Total Organic Carbon (TOC) and Dissolved Organic Carbon (DOC). International Organization for Standardization: Geneva, Switzerland, 1999; pp. 1–11.
  30. ISO 14240–2; Soil Quality—Determination of Soil Microbial Biomass. Part 2: Fumigation–Extraction Method. International Organization for Standardization: Geneva, Switzerland, 1997; pp. 1–12.
  31. Vance, E.D.; Brookes, P.C.; Jenkinson, D.S. An extraction method for measuring soil microbial biomass C. Soil Biol. Biochem. 1987, 19, 703–707. [Google Scholar] [CrossRef]
  32. Brookes, P.C.; Landman, A.; Pruden, G.; Jenkinson, D.S. Chloroform fumigation and the release of soil nitrogen: A rapid direct extraction method to measure microbial biomass nitrogen in soil. Soil Biol. Biochem. 1985, 17, 837–842. [Google Scholar] [CrossRef]
  33. ISO 16072; Soil Quality–Laboratory Methods for Determination of Microbial Soil Respiration. International Organization for Standardization: Geneva, Switzerland, 2002; pp. 1–19.
  34. Schinner, F.; Ohlinger, R.; Kandler, E.; Margesin, R. Bodenbiologische Arbeitsmethoden; Springer: Berlin, Germany, 1993; p. 640. (In German) [Google Scholar]
  35. Vesterdal, L.; Schmidt, I.K.; Callesen, I.; Nilson, L.O.; Gundersen, P. Carbon and nitrogen in forest floor and mineral soil under six common European tree species. For. Ecol. Manag. 2008, 255, 35–48. [Google Scholar] [CrossRef]
  36. Armolaitis, K.; Varnagirytė-Kabašinskienė, I.; Žemaitis, P.; Stakėnas, V.; Beniušis, R.; Kulbokas, G.; Urbaitis, G. Evaluation of organic carbon stocks in mineral and organic soils in Lithuania. Soil Use Manag. 2022, 38, 355–368. [Google Scholar] [CrossRef]
  37. Pranskevičius, M. Research and Assessment of Total Carbon Content and Carbon Dioxide Emissions from Soils of Different Land-Use Purpose. PhD Dissertation, Lithuanian Research Centre for Agriculture and Forestry, Kėdainiai, Lithuania, 2011; p. 140. (In Lithuanian). [Google Scholar]
  38. Jílková, V.; Straková, P.; Frouz, J. Foliage C:N ratio, stage of organic matter decomposition and interaction with soil affect microbial respiration and its response to C and N addition more than C:N changes during decomposition. Appl. Soil Ecol. 2020, 152, 103568. [Google Scholar] [CrossRef]
  39. Li, J.; Zhang, Q.; Li, Y.; Liu, Y.; Xu, J.; Di, H. Effects of long-term mowing on the fractions and chemical composition of soil organic matter in a semiarid grassland. Biogeosciences 2017, 14, 2685–2696. [Google Scholar] [CrossRef]
  40. Mayer, M.; Prescott, C.; Abaker, W.E.A.; Augusto, L.; Cécillon, L.; Ferreira, G.W.D.; James, J.; Jandl, R.; Katzensteiner, K.; Laclau, J.P.; et al. Influence of forest management activities on soil organic carbon stocks: A knowledge synthesis. For. Ecol. Manag. 2020, 466, 1–25. [Google Scholar] [CrossRef]
  41. Bowles, T.M.; Acosta-Martínez, V.; Calderón, F.; Jackson, L.E. Soil enzyme activities, microbial communities, and carbon and nitrogen availability in organic agroecosystems across an intensively managed agricultural landscape. Soil Biol. Biochem. 2014, 68, 252–262. [Google Scholar] [CrossRef]
  42. Song, Y.; Liu, C.; Song, C.; Wang, X.; Ma, X.; Gao, J.; Gao, S.; Wang, L. Linking soil organic carbon mineralization with soil microbial and substrate properties under warming in permafrost peatlands of Northeastern China. Catena 2021, 203, 105348. [Google Scholar] [CrossRef]
  43. Anayeva, N.D.; Polyanskaya, L.M.; Susyan, E.A.; Vasenkina, I.V.; Wirth, S.; Zvyagintsev, D.G. Comparative assessment of soil microbial biomass determined by the methods of direct microscopy and substrate-induced respiration. Microbiology 2008, 77, 404–412. [Google Scholar]
  44. Eisenhauer, N.; Lanoue, A.; Strecker, T.; Scheu, S.; Steinauer, K.; Thakur, M.P.; Mommer, L. Root biomass and exudates link plant diversity with soil bacterial and fungal biomass. Sci. Rep. 2017, 7, 44641. [Google Scholar] [CrossRef]
  45. Bradford, M.A.; McCulley, R.L.; Crowther, T.W.; Oldfield, E.E.; Wood, S.A.; Fierer, N. Cross-biome patterns in soil microbial respiration predictable from evolutionary theory on thermal adaptation. Nat. Ecol. Evol. 2019, 3, 223–231. [Google Scholar] [CrossRef] [PubMed]
  46. Ayres, E.; Stelzer, H.; Berg, S.; Wallenstein, M.D.; Simmons, B.L.; Wall, D.H. Tree species traits influence soil physical, chemical, and biological properties in high elevation forests. PLoS ONE 2009, 4, e5964. [Google Scholar] [CrossRef] [PubMed]
  47. Khmelevtsova, L.E.; Sazykin, I.S.; Azhogina, T.N.; Sazykina, M.A. Influence of Agricultural Practices on Bacterial Community of Cultivated Soils. Agriculture 2022, 12, 371. [Google Scholar] [CrossRef]
  48. Woloszczyk, P.; Fiencke, C.; Elsner, D.C.; Gordsen, E.; Pfeiffer, E.M. Spatial and temporal patterns in soil organic carbon, microbial biomass and activity under different land-use types in a long-term soil-monitoring network. Pedobiologia 2020, 80, 150642. [Google Scholar] [CrossRef]
  49. Mendoza, B.; Béjar, J.; Luna, D.; Osorio, M.; Jimenez, M.; Melendez, J.R. Differences in the ratio of soil microbial biomass carbon (MBC) and soil organic carbon (SOC) at various altitudes of Hyperalic alisol in the Amazon region of Ecuador. F1000Reserch 2020, 9, 443. [Google Scholar] [CrossRef]
  50. Lepcha, N.T.; Devi, N.B. Effect of land use, season, and soil depth on soil microbial biomass carbon of Eastern Himalayas. Ecol. Process. 2020, 9, 1–14. [Google Scholar] [CrossRef]
  51. Dyckmans, J.; Joergensen, R.G.; Pries, J.; Raubuch, M.; Sehy, U. Adenylates as an estimate of microbial biomass C in different soil groups. Soil Biol. Biochem. 2003, 35, 1485–1491. [Google Scholar] [CrossRef]
  52. Susyan, E.A.; Wirth, S.; Ananyeva, N.D.; Stolnikova, E.V. Forest succession on abandoned arable soils in European Russia—Impacts on microbial biomass, fungal-bacterial ratio, and basal CO2 respiration activity. Eur. J. Soil Biol. 2011, 47, 169–174. [Google Scholar] [CrossRef]
  53. Frieder, J.K.; Scheller, E. Composition of hydrolysable amino acids in soil organic matter and soil microbial biomass. Soil Biol. Biochem. 2002, 34, 315–325. [Google Scholar] [CrossRef]
  54. Anderson, T.H.; Domsch, K.H. Soil microbial biomass: The eco-physiological approach. Soil Biol. Biochem. 2010, 42, 2039–2043. [Google Scholar] [CrossRef]
  55. Bünemann, E.K.; Bongiorno, G.; Bai, Z.; Creamer, R.E.; Brussaard, L. Soil quality A critical review. Soil Biol. Biochem. 2018, 120, 105–125. [Google Scholar] [CrossRef]
  56. Li, J.; Zhao, B.; Li, X.; Jiang, R.; So, H.B. Effects of long-term combined application of organic and mineral fertilizers on microbial biomass, soil enzyme activities and soil fertility. Agric. Sci. China 2008, 7, 336–343. [Google Scholar] [CrossRef]
  57. Schweizer, S.A.; Mueller, C.W.; Höschen, C.; Ivanov, P.; Kögel-Knabner, I. The role of clay content and mineral surface area for soil organic carbon storage in an arable toposequence. Biogeochemistry 2021, 156, 401–420. [Google Scholar] [CrossRef]
  58. Poeplau, C.; Jacobs, A.; Don, A.; Vos, C.; Schneider, F.; Wittnebel, M.; Tiemeyer, M.; Heidkamp, A.; Prietz, R.; Flessa, H. Stocks of organic carbon in German agricultural soils—Key results of the first comprehensive inventory. J. Plant Nutr. Soil Sci. 2020, 183, 665–681. [Google Scholar] [CrossRef]
  59. Lavallee, J.; Soong, J.; Cotrufo, M.F. Conceptualizing soil organic matter into particulate and mineral-associated forms to address global change in the 21st century. Glob. Chang. Biol. 2020, 26, 261–273. [Google Scholar] [CrossRef]
  60. Rocci, K.S.; Lavallee, J.M.; Steward, C.E.; Cotrufo, M.F. Soil organic carbon response to global environmental change depends on its distribution between mineral-associated and particulate organic matter: A meta-analysis. Sci. Total Environ. 2021, 731, 148569. [Google Scholar] [CrossRef]
  61. Joergensen, R.G.; Anderson, T.H.; Wolters, V. Carbon and nitrogen relationships in the microbial biomass of soils in beech (Fagus sylvatica L.) forests. Biol. Fertil. Soils 1995, 19, 141–147. [Google Scholar] [CrossRef]
  62. Wild, B.; Schnecker, J.; Knoltsch, A.; Takriti, M.; Mooshammer, M.; Gentsch, N.; Mikutta, R.; Alves, R.J.E.; Gittel, A.; Lashchinskiy, N.; et al. Microbial nitrogen dynamics in organic and mineral soil horizons along a latitudinal transect in western Siberia. Glob. Biogeochem. Cycles 2015, 29, 567–582. [Google Scholar] [CrossRef]
  63. Chen, W.; Yuan, W.; Wang, J.; Wang, Z.; Zhou, Z.; Liu, S. No-tillage combined with appropriate amount of straw returning increased soil biochemical properties. Sustainability 2022, 14, 4875. [Google Scholar] [CrossRef]
  64. Partey, S.T.; Preziosi, R.F.; Robson, G.D. Improving maize residue use in soil fertility restoration by mixing with residues of low C-to-N ratio: Effects on C and N mineralization and soil microbial biomass. Soil Sci. Plant. Nutr. 2014, 14, 518–531. [Google Scholar] [CrossRef]
  65. Hannula, E.S.; Morriën, E. Will fungi solve the carbon dilemma? Geoderma 2022, 413, 115767. [Google Scholar] [CrossRef]
  66. Brust, G.E. Management Strategies for Organic Vegetable Fertility. In Safety and Practice for Organic Food; Biswas, D., Micallef, S.A., Eds.; Elsevier Inc.: Amsterdam, The Netherlands, 2019; pp. 193–212. [Google Scholar] [CrossRef]
  67. Marinari, S.; Mancinelli, R.; Campiglia, E.; Grego, S. Chemical and biological indicators of soil quality in organic and conventional farming systems in Central Italy. Ecol. Indic. 2006, 6, 701–711. [Google Scholar] [CrossRef]
Figure 1. Study sites on Arenosols (Site 1), Retisols (Site 2), and Cambisols (Site 3) under different land uses—forest land, perennial grassland, and arable land—in each study site.
Sustainability 15 16042 g001
Figure 2. Mean (±SE) concentrations of soil organic carbon (SOC, g kg−1) and total nitrogen (TN, g kg−1) in Arenosols, Retisols, and Cambisols at a layer of 0–10 cm and 10–20 cm on different land use (n = 3). Different letters show significant differences at 0.05 level between land uses within each soil layer.
Sustainability 15 16042 g002
Figure 3. Mean (±SE) concentrations of soil microbial biomass carbon (SMBC) and soil microbial biomass nitrogen (SMBN) in Arenosols, Retisols, and Cambisols at a layer of 0–10 cm and 10–20 cm on different land use (n = 3). Different letters show significant differences at 0.05 level between land uses within each soil layer.
Sustainability 15 16042 g003
Figure 4. Mean (±SE) soil microbial respiration (CO2, mg g−1 per day) in Arenosols, Retisols, and Cambisols at a layer of 0–10 cm and 10–20 cm on different land use. Different letters show significant differences at 0.05 level between land uses within each soil layer.
Sustainability 15 16042 g004
Table 1. Characteristics of study sites.
Study SiteSoil [21]Study Plot Description
Site 1,
54°10′ N, 24°25′ E
Haplic
Arenosol
Forest land: 90% Betula pendula Roth; 10% Pinus sylvestris L.
Stand age 50 years; mean tree diameter (DBH) 17 cm; mean tree height (H) 20.9 m; stand volume 135 m3 ha−1.
Perennial grassland: Hieracium pilosella L., Oenothera biennis L., Achillea millefolium L., Fragaria vesca L.
Arable land: Secale cereale L.
Site 2,
55°41′ N, 21°30′ E
Dystric
Bathygleyic Glossic Retisol
Forest land: 90% Betula pendula; 10% Picea abies (L.) H. Karst.; naturally regenerated forest on abandoned
agricultural land.
Stand age 25 years; mean tree DBH 14 cm; mean tree H 15.3 m; stand volume 93 m3 ha−1.
Perennial grassland: Achillea millefolium L., Hieracium pilosella L., Campanula patula L., Holcus lanatus L.
Arable land: Secale cereale
Site 3,
55°41′ N, 21°30′ E
Endocalcari-
Epihypogleyic Cambisol
Forest land: 70% Betula pendula; 20% Populus tremula L.; 10% Quercus robur L.
Stand age 92 years; mean tree DBH 36 cm; mean tree H 30.1 m; mean stand volume 378 m3 ha−1.
Perennial grassland: Medicago sativa L., Taraxacum officinale L., Galega orientalis L., Lolium temulentum L.,
Trifolium repens L.
Arable land: Pisum sativum L.
Table 2. Mean (±SE) stocks of soil organic carbon (SOC, t ha−1) and total nitrogen (TN, t ha−1) in Arenosols, Retisols, and Cambisols at a layer of 0–10 cm and 10–20 cm on different land use (n = 3). Different letters show significant differences at 0.05 level between land uses within each soil layer.
Land UseSOC Stocks (t ha–1)TN Stocks (t ha–1)
0–10 cm10–20 cm0–10 cm10–20 cm
Arenosols
Forest land16.3 ± 1.8 b13.6 ± 2.6 b2.0 ± 0.1 b1.5 ± 0.1 b
Grassland11.2 ± 1.0 a8.5 ± 0.4 a1.3 ± 0.1 a1.0 ± 0.1 a
Arable land11.6 ± 0.4 a10.4 ± 0.7 a1.3 ± 0.0 a1.4 ± 0.1 a
Retisols
Forest land18.5 ± 1.4 b14.3 ± 1.9 a1.5 ± 0.1 b1.3 ± 0.1 a
Grassland20.2 ± 1.4 b18.6 ± 1.6 b1.5 ± 0.1 b1.5 ± 0.1 a
Arable land13.5 ± 0.6 a16.3 ± 0.2 a1.2 ± 0.0 a1.4 ± 0.1 a
Cambisols
Forest land46.5 ± 5.2 c27.3 ± 2.5 b2.7 ± 0.6 b2.1 ± 0.3 b
Grassland32.6 ± 6.6 b25.3 ± 5.6 b3.2 ± 0.2 b2.8 ± 0.6 b
Arable land15.9 ± 0.8 a14.5 ± 0.7 a1.4 ± 0.1 a1.2 ± 0.1 a
Table 3. Humus fraction composition (fulvic, humic acids and insoluble residue, %) and mean (±SE) concentrations of water extractable organic carbon (WEOC, mg kg−1) in Arenosols, Retisols, and Cambisols at a layer of 0–10 cm and 10–20 cm on different land use (n = 3).
Land UseFulvic Acid (%)Humic Acid (%)Insoluble Residue (%)WEOC (mg kg−1)
0–10 cm10–20 cm0–10 cm10–20 cm0–10 cm10–20 cm0–10 cm10–20 cm
Arenosols
Forest land0.74 ± 0.14 b0.73 ± 0.15 b0.22 ± 0.06 b0.18 ± 0.01 c99.04 ± 0.03 a99.09 ± 0.08 a527 ± 26 c367 ± 174 a
Grassland0.50 ± 0.13 a0.48 ± 0.06 a0.15 ± 0.01 a0.08 ± 0.00 a99.35 ± 0.10 b99.44 ± 0.04 b457 ± 50 b316 ± 47 a
Arable land0.39 ± 0.02 a0.40 ± 0.02 a0.15 ± 0.01 a0.14 ± 0.01 b99.46 ± 0.05 b99.46 ± 0.05 b353 ± 41 a346 ± 47 a
Retisols
Forest land0.13 ± 0.01 b0.10 ± 0.00 b0.35 ± 0.07 b0.29 ± 0.02 b99.52 ± 0.07 a99.16 ± 0.03 a627 ± 20 b463 ± 22 a
Grassland0.11 ± 0.02 b0.10 ± 0.01 b0.32 ± 0.01 b0.29 ± 0.03 b99.58 ± 0.01 a99.61 ± 0.04 a657 ± 43 b587 ± 3 b
Arable land0.07 ± 0.00 a0.07 ± 0.00 a0.19 ± 0.03 a0.22 ± 0.02 a99.74 ± 0.03 b99.72 ± 0.03 b423 ± 43 a440 ± 40 a
Cambisols
Forest land0.49 ± 0.02 c0.26 ± 0.06 c1.20 ± 0.15 c0.57 ± 0.07 c98.31 ± 0.17 a99.17 ± 0.08 a1727 ± 23 c1073 ± 201 c
Grassland0.16 ± 0.01 b0.12 ± 0.01 b0.48 ± 0.03 b0.24 ± 0.03 b99.36 ± 0.02 a99.64 ± 0.04 b1210 ± 35 b853 ± 28 b
Arable land0.05 ± 0.01 a0.06 ± 0.00 a0.17 ± 0.01 a0.14 ± 0.02 a99.81 ± 0.04 b99.82 ± 0.02 c546 ± 42 a407 ± 34 a
Note. Different letters show significant differences at 0.05 level between land uses within each soil layer.
Table 4. Mean (±SE) ratios of different soil carbon and nitrogen parameters in 0–10 cm and 10–20 cm layers of Arenosols, Retisols, and Cambisols on different land uses. Different letters show significant differences at 0.05 level between land uses within each soil layer.
Land UseSOC:TNSMBC/SOC (%)SMBN/TN (%)SMBC:SMBN
0–10 cm10–20 cm0–10 cm10–20 cm0–10 cm10–20 cm0–10 cm10–20 cm
Arenosols
Forest land8.2 ± 0.6 a8.9 ± 1.7 a2.2 ± 0.1 b3.1 ± 0.1 c1.0 ± 0.0 a1.6 ± 0.0 b17.6 ± 2.0 b17.4 ± 1.1 b
Grassland8.8 ± 0.2 a8.4 ± 0.9 a2.5 ± 0.1 b2.3 ± 0.1 b2.7 ± 0.2 c2.8 ± 0.3 c7.9 ± 0.9 a6.7 ± 1.0 a
Arable land9.1 ± 0.3 a7.4 ± 0.3 a1.0 ± 0.0 a0.9 ± 0.0 a1.5 ± 0.1 b0.9 ± 0.1 a6.0 ± 1.3 a7.6 ± 1.2 a
Retisols
Forest land11.9 ± 0.2 a11.4 ± 0.6 a6.9 ± 0.5 b7.8 ± 0.5 c5.6 ± 0.4 b6.7 ± 0.5 c12.5 ± 1.7 b12.7 ± 1.6 b
Grassland13.7 ± 0.3 b12.5 ± 0.6 a3.5 ± 0.1 a4.1 ± 0.1 b4.1 ± 0.1 a3.9 ± 0.2 b12.2 ± 1.6 b13.0 ± 2.3 b
Arable land10.8 ± 0.3 a11.6 ± 0.4 a3.7 ± 0.1 a3.3 ± 0.3 a4.2 ± 0.5 a2.9 ± 0.5 a9.6 ± 1.9 a9.7 ± 1.5 a
Cambisols
Forest land17.2 ± 2.4 b12.8 ± 0.7 b3.3 ± 0.2 a5.9 ± 0.4 b2.9 ± 0.0 a4.1 ± 0.0 b18.6 ± 2.5 b18.4 ± 2.6 b
Grassland9.9 ± 1.4 a9.3 ± 0.9 a3.5 ± 0.1 a4.4 ± 0.2 a2.7 ± 0.1 a2.9 ± 0.2 a13.3 ± 2.6 a13.6 ± 1.5 a
Arable land11.3 ± 0.2 a12.5 ± 0.7 b5.1 ± 0.3 b6.1 ± 0.4 b3.3 ± 0.1 b4.1 ± 0.4 b13.5 ± 2.1 a12.3 ± 1.2 a
Note. SOC:TN is the ratio of soil organic carbon and total nitrogen; SMBC/SOC is the ratio of soil microbial biomass carbon to soil organic carbon; SMBN/TN is the ratio of soil microbial biomass nitrogen to total nitrogen in the soil; and SMBC:SMBN ratio of soil microbial biomass carbon to soil microbial biomass nitrogen.
Table 5. Variation components (%) for soil type and land use according to the statistical model (4), and significance of soil layer (0–10 cm and 10–20 cm) shown as *—p < 0.05; **—p < 0.01; ***—p < 0.001.
Soil Quality IndicatorsVariation Component (%)Significance of
Soil Layer
Soil TypeLand Use
BD (g cm–3)0.071.7**
Sand (%)87.89.3
Silt (%)86.410.5
Clay (%)74.714.7
Soil pHCaCl266.615.6*
SOC (g kg−1)29.545.9**
TN (g kg−1)29.545.9**
SOC:TN36.232.2
Humic acid (%)18.961.8***
Fulvic acid (%)83.19.7**
Insoluble residue (%)14.061.1***
WEOC (mg kg−1)39.441.0**
SMBC (µg g−1)70.519.1*
SMBN (µg g−1)87.610.4***
Microbial CO2 (mg g−1 per day)71.525.8***
Note. BD is fine soil bulk density; SOC is soil organic carbon; TN is total nitrogen in soil; WEOC is water-extractable organic carbon; SMBC is soil microbial biomass carbon; SMBN is soil microbial biomass nitrogen; microbial CO2 is soil microbial respiration.
Table 6. Correlation coefficients between different soil quality indicators (n = 60) in Arenosols, Retisols, and Cambisols (the data obtained in both 0–10 cm and 10–20 cm soil layers were combined).
Soil Quality
Indicators
BDSOCTNSOC:TNpHCaCl2SandSiltClayHumic
Acid
Fulvic
Acid
Insoluble
Residue
WEOC
(g cm−3)(g kg−1)(%)(%)(mg kg−1)
All soil types
SMBC *−0.29 **0.800.690.580.28−0.530.510.470.78−0.27−0.380.74
SMBN−0.120.670.560.580.35−0.680.650.610.69−0.39−0.230.67
Microbial CO2−0.280.830.700.680.34−0.580.540.540.83−0.36−0.350.83
Arenosols
SMBC0.020.490.50−0.08−0.03−0.390.400.230.190.87−0.810.11
SMBN−0.020.430.51−0.210.12−0.240.250.100.160.82−0.760.14
Microbial CO2−0.190.440.360.12−0.52−0.090.040.380.56−0.09−0.090.47
Retisols
SMBC0.010.140.180.02−0.61−0.710.700.570.610.71−0.690.32
SMBN0.03−0.010.07−0.13−0.64−0.580.570.510.440.60−0.520.17
Microbial CO2−0.210.750.620.67−0.04−0.810.800.640.600.78−0.650.67
Cambisols
SMBC−0.870.810.740.38−0.740.060.31−0.430.750.82−0.780.71
SMBN −0.900.840.800.42−0.820.200.09−0.450.850.86−0.860.79
Microbial CO2−0.920.900.840.48−0.810.110.20−0.420.910.93−0.920.87
Notes. * SMBC is soil microbial biomass carbon; SMBN is soil microbial biomass nitrogen; microbial CO2 is soil microbial respiration; BD is fine soil bulk density; SOC is soil organic carbon; TN is total nitrogen; WEOC is water-extractable organic carbon; ** Significant correlation coefficients at 0.05 level are marked in bold.
Disclaimer/Publisher’s Note: The statements, opinions and data contained in all publications are solely those of the individual author(s) and contributor(s) and not of MDPI and/or the editor(s). MDPI and/or the editor(s) disclaim responsibility for any injury to people or property resulting from any ideas, methods, instructions or products referred to in the content.

