Article

Effect of P-Dipping on Growth of NERICA 4 Rice in Different Soil Types at Initial Growth Stages

1
The United Graduate School of Agricultural Sciences, Kagoshima University, Kagoshima 890-8580, Japan
2
National Agricultural Research Organisation, Abi Zonal Agricultural Research and Development Institute, Plot 3, Lugard Avenue, Entebbe P.O. Box 295, Uganda
3
Crop, Livestock and Environment Division, JIRCAS, Ibaraki 305-8686, Japan
4
Faculty of Agriculture, Setsunan University, Osaka 573-0101, Japan
5
Faculty of Agriculture, Kagoshima University, Kagoshima 890-8580, Japan
*
Author to whom correspondence should be addressed.
Sustainability 2023, 15(21), 15402; https://doi.org/10.3390/su152115402
Submission received: 30 September 2023 / Revised: 20 October 2023 / Accepted: 26 October 2023 / Published: 28 October 2023
(This article belongs to the Special Issue Plant Nutrition, Plant-Soil Relationships and Sustainable Agriculture)

Abstract

:
Phosphorus (P) deficiency resulting from P fixation is a major constraint limiting sustainable rice cultivation in sub-Saharan Africa. Soil texture also affects P availability and use efficiency. In a factorial experiment, we evaluated the combined effect of soil texture (sand, clay loam, and clay) and P treatments P-dipping (Pdip) and two other broadcasted P fertilizer levels (Brod1 and Brod2) on the growth of NERICA 4 rice in the initial growth stages. Across all soil textures and P treatments, total plant biomass ranged from 1.06 to 4.63 g pot−1. The Pdip treatment significantly increased shoot and root biomass relative to control from 1.27 to 1.98 and 0.23 to 0.38 g pot−1, respectively. Mean photosynthetic rate values under Pdip (20.1 μmol m−2 s−1), Brod2 (19.5 μmol m−2 s−1), and Brod1 (19.3 μmol m−2 s−1) treatments showed significant 42%, 37%, and 36% increases over control, regardless of soil texture. In a striking contrast, P-dipping significantly promoted growth of root length under clay soil, but without a commensurate increase in shoot P uptake. Contrary to our hypothesis, the interactive effect of soil texture and P-dipping influenced NERICA 4 shoot and root physiological and morphological characteristics under clay loam soil texture as opposed to clay.

1. Introduction

Phosphorus (P) deficiency is one of the major constraints limiting sustainable rice production globally [1,2,3]. In sub-Saharan Africa (SSA), this is exacerbated by both limited mineral fertilizer inputs by smallholder farmers and dominant soil types—such as ferralsols and acrisols—within its humid and sub-humid agroecological zones [4,5]. These soil types are inherently low in nutrient contents, low in cation exchange capacities, and low in water-holding capacities [4,6], strongly leached and deeply weathered, with low pH and high Fe and Al oxide contents that increase the soil P fixing capacity [4,7,8,9]. Large proportions of soil-derived or applied P thus remain unavailable for plant growth, presenting serious agronomic and economic challenges. Improved P acquisition and use by plants are thus of immediate and direct benefit to agriculture in SSA [5,10].
Several approaches to coping with the threats of P depletion have been studied, including the use of phosphate rocks [11,12], breeding of crops that are tolerant to low P conditions [13,14,15], recycling P from wastewater [16,17], and releasing fixed P in soil [18,19]. Among those approaches, given the limited purchasing capacity of smallholder farmers and highly P-fixing soils in SSA, small-dose and localized P application near the root system has shown promise as a management practice [20,21,22,23]. Similarly, the potential of P-dipping for lowland rice production—that is, dipping rice seedling roots into P-enriched slurry just before transplanting—has been found to improve rice seedling resilience to drought and P stresses [24], double applied P use efficiency [25], shorten days to heading, and increase yield grain [26].
On the other hand, soil texture has been widely demonstrated to exert a significant effect on P availability and use efficiency in crop production [27,28,29,30,31,32]. Improving the opportunity for wider adoption of P-dipping techniques by farmers cultivating rice in diverse soil textures thus implies the importance of understanding the interactive effect of P-dipping and soil texture on rice growth performance. Furthermore, in contrast to excessive chemical fertilizer application rates required for the broadcasting method, which often lead to nutrient losses and cause eutrophication of fresh water, rising nitrous oxide emissions, and degradation of downstream water quality [33,34], P-dipping allows for relatively minimal P fertilizer amounts and employs a localized P application method directly to the roots, thereby contributing less to greenhouse gas emissions while contributing to sustainable rice production. The objective of this study was to evaluate the combined effect of P-dipping and soil texture on the initial growth of rice, focusing on shoot P uptake and root morphological development. The hypothesis was that clay soil, owing to its high water and nutrient retention capacities, is most suited to P-dipping.

2. Materials and Methods

2.1. Physiochemical Characteristics of the Experimental Soils

The experimental soils with a range of textures were collected from Kagoshima (N31.8549 E130.2086), Tanegashima Island (N30.5331 E130.9586), and Tokunoshima Island (N27.8117 E128.8975), Japan. The soils were analyzed for pH (1:2.5 H2O), available P was determined by Truog’s method, and total carbon and nitrogen by the dry combustion method using an NC analyzer (JM1000CN/HCN TOC.TN, J-Science Lab Co., Ltd., Kyoto, Japan), the 1 mol L−1 ammonium acetate extraction method was used to determine exchangeable potassium, and soil texture was determined by the pipette method. We determined the acid oxalate extractable aluminum and iron content by ICP-MS (Eran DRC, PerkinElmer, Shelton, CT, USA) after extraction with an acid ammonium oxalate solution (pH 3.0) for 4 h in darkness [35]. We calculated soil organic matter content by multiplying the percentage of organic carbon with the conventional Van-Bemmelen’s factor of 1.724 [36]. The chemical and physical properties of the three experimental soils are presented in Table 1. Briefly, Kagoshima soil was sandy with a pH of 8.8 and low available P content. Tanegashima soil was clay loam with a pH of 4.9 and a relatively high content of available P. Tokunoshima soil was clay with a pH of 5.8 and the lowest content of available P.

2.2. Experimental Design and the Environmental Condition

The experiment was conducted in a greenhouse using three soil types and three fertilizer treatments factorially combined in 3 replicates. The soil types included sand, clay loam, and clay soil textures, and the fertilizer treatments consisted of control (no P application), two broadcasts, and one P-dipping. We used perforated plastic pots (11 cm high, 9.5 cm bottom diameter, and 12.5 cm top diameter). We filled the pots with 1.5 kg of the three types of soil (bulk density: 1.2 g cm−3) and placed the pots of each soil type in separate plastic containers (48 cm L × 32 cm W × 8 cm H) lined with black plastic sheets. To correct deficiencies in the soil N and K contents, we homogeneously mixed the experimental soil in each pot with 0.43 g of ammonium sulfate (90 mg N pot−1) and 0.12 g of potassium chloride (50 mg K pot−1). We filled the plastic containers with water to allow the soil in the pots to absorb by capillarity to the field capacities—volumetric soil moisture contents at 32% for sand soil, 42% for clay loam soil, and 48% for clay soil. Thereafter, we maintained water in the plastic containers holding the pots at 3–4 cm throughout the experiment.
NERICA 4 rice variety—an interspecific progeny between Oryza sativa and Oryza glaberrima—was grown in seedling trays until the 3–4 leaf stage and with an average of 5 cm of root system length for each seedling. Prior to transplanting, we carefully removed rice seedlings from the seedling tray to avoid root damage, and carefully hand-washed the nursery soil using water in plastic buckets fitted with 1 mm sieves to avoid root loss. For the P-dipping treatment, we dipped the washed seedling roots into the P-enriched slurry for 30 min [37]. To produce the P-enriched slurry, we mixed 45 g of air-dried soil, 14 mL of water, and 1.31 g of single superphosphate (SSP) fertilizer, an equivalent of approximately 68.7 mg P2O5 pot−1 for the P-dipping (Pdip) treatment.
The rest of the seedlings were transplanted without P-dipping in pots broadcasted with 0.25 g (43.1 mg P2O5 pot−1 (Brod1)) and 0.49 g (85.9 mg P2O5 pot−1 (Brod2)) of SSP fertilizer. To avoid root damage during transplanting, we made holes approximately 6 cm deep and 3 cm wide in the wet soil within the pots before transplanting the rice seedlings. The daily mean air temperature (29.5 °C) and the daily mean relative humidity (70.5%) in the greenhouse were measured using a sensor equipped with a data logger (RTR-503, T&D Corporation, Tokyo, Japan) throughout the experiment. A summary of the P and soil treatments is presented in Table 2.

2.3. Data Collection and Measurements

At 40 days after transplanting (DAT), we measured the shoot parameters—plant height, leaf age, and Soil Plant Analysis Development (SPAD). We measured plant length from the base of the stem (at the soil surface) to the highest part of the plant. We determined leaf age by counting the number of fully expanded leaves per plant. We conducted gas exchange measurements on the uppermost fully expanded leaf at 38 DAT between 9:00 AM and 1:30 PM, using a portable gas exchange measurement system (LI-6400, Li-Cor Inc., Lincoln, NE, USA) set at a light intensity of 1200 µmol m−2 s−1, a block temperature of 32 °C, and an ambient CO2 concentration of 410 µmol mol−1.
At the same time (40 DAT), the plant shoots in each pot were cut, and the leaves were removed to determine the leaf area using a digital image analysis machine (LIA32, Nagoya University, Nagoya, Japan). The leaves and stems were oven-dried at 80 °C for 48 h to determine the shoot dry weight per pot. The oven-dried plant materials were finely ground, and samples (0.5 g each) were wet-digested in 15 mL of di-acid digestion mixture [HNO3:HClO4 (3:2, v/v)]. Thereafter, the total P concentration in plant samples was determined in accordance with the vanadate–molybdate method [38] using a UV-VIS spectrophotometer (V-530, JASCO Co., Tokyo, Japan). We calculated shoot P uptake as the product of shoot dry weight and P concentration.
In preparation for the root analysis, the soil in each pot was carefully removed, placed in a metallic 2 mm gauge sieve, and carefully washed by spraying with low-pressure tap water to rid the roots of all soil particles. The root samples were placed in self-sealing plastic bags containing 50% aqueous ethanol solution and stored in a cold room at 4 °C prior to scanning. Root samples were scanned at 6400 dpi using an Epson scanner (EPSON GT-X830, Epson American Inc., Los Alamitos, CA, USA), and images were analyzed at pixel classification values of 130–150 using the WinRhizo software (WinRHIZO, Regent Instruments Inc., Québec, Canada; Version 2005b) to determine the total root length (RL), root surface area (RSA), and root volume (RV). Following the root morphological analysis, root samples were dried at 80 °C for 48 h in an oven to determine the root dry weight per pot.

2.4. Statistical Analyses

Data analyses were conducted with IBM SPSS Statistics (Version 27.0.1.0) using two-way ANOVA to determine the single and interaction effects of P treatments (Pdip, Brod1, Brod2, and Ctrl) and soil textures (sand, light clay, and clay). The treatment means were compared from replicates at the 5% level of probability using Tukey’s HSD test. Where significant interaction effects existed, we ran pairwise comparisons for each simple main effect, modifying statistical significance with a Bonferroni adjustment.

3. Results

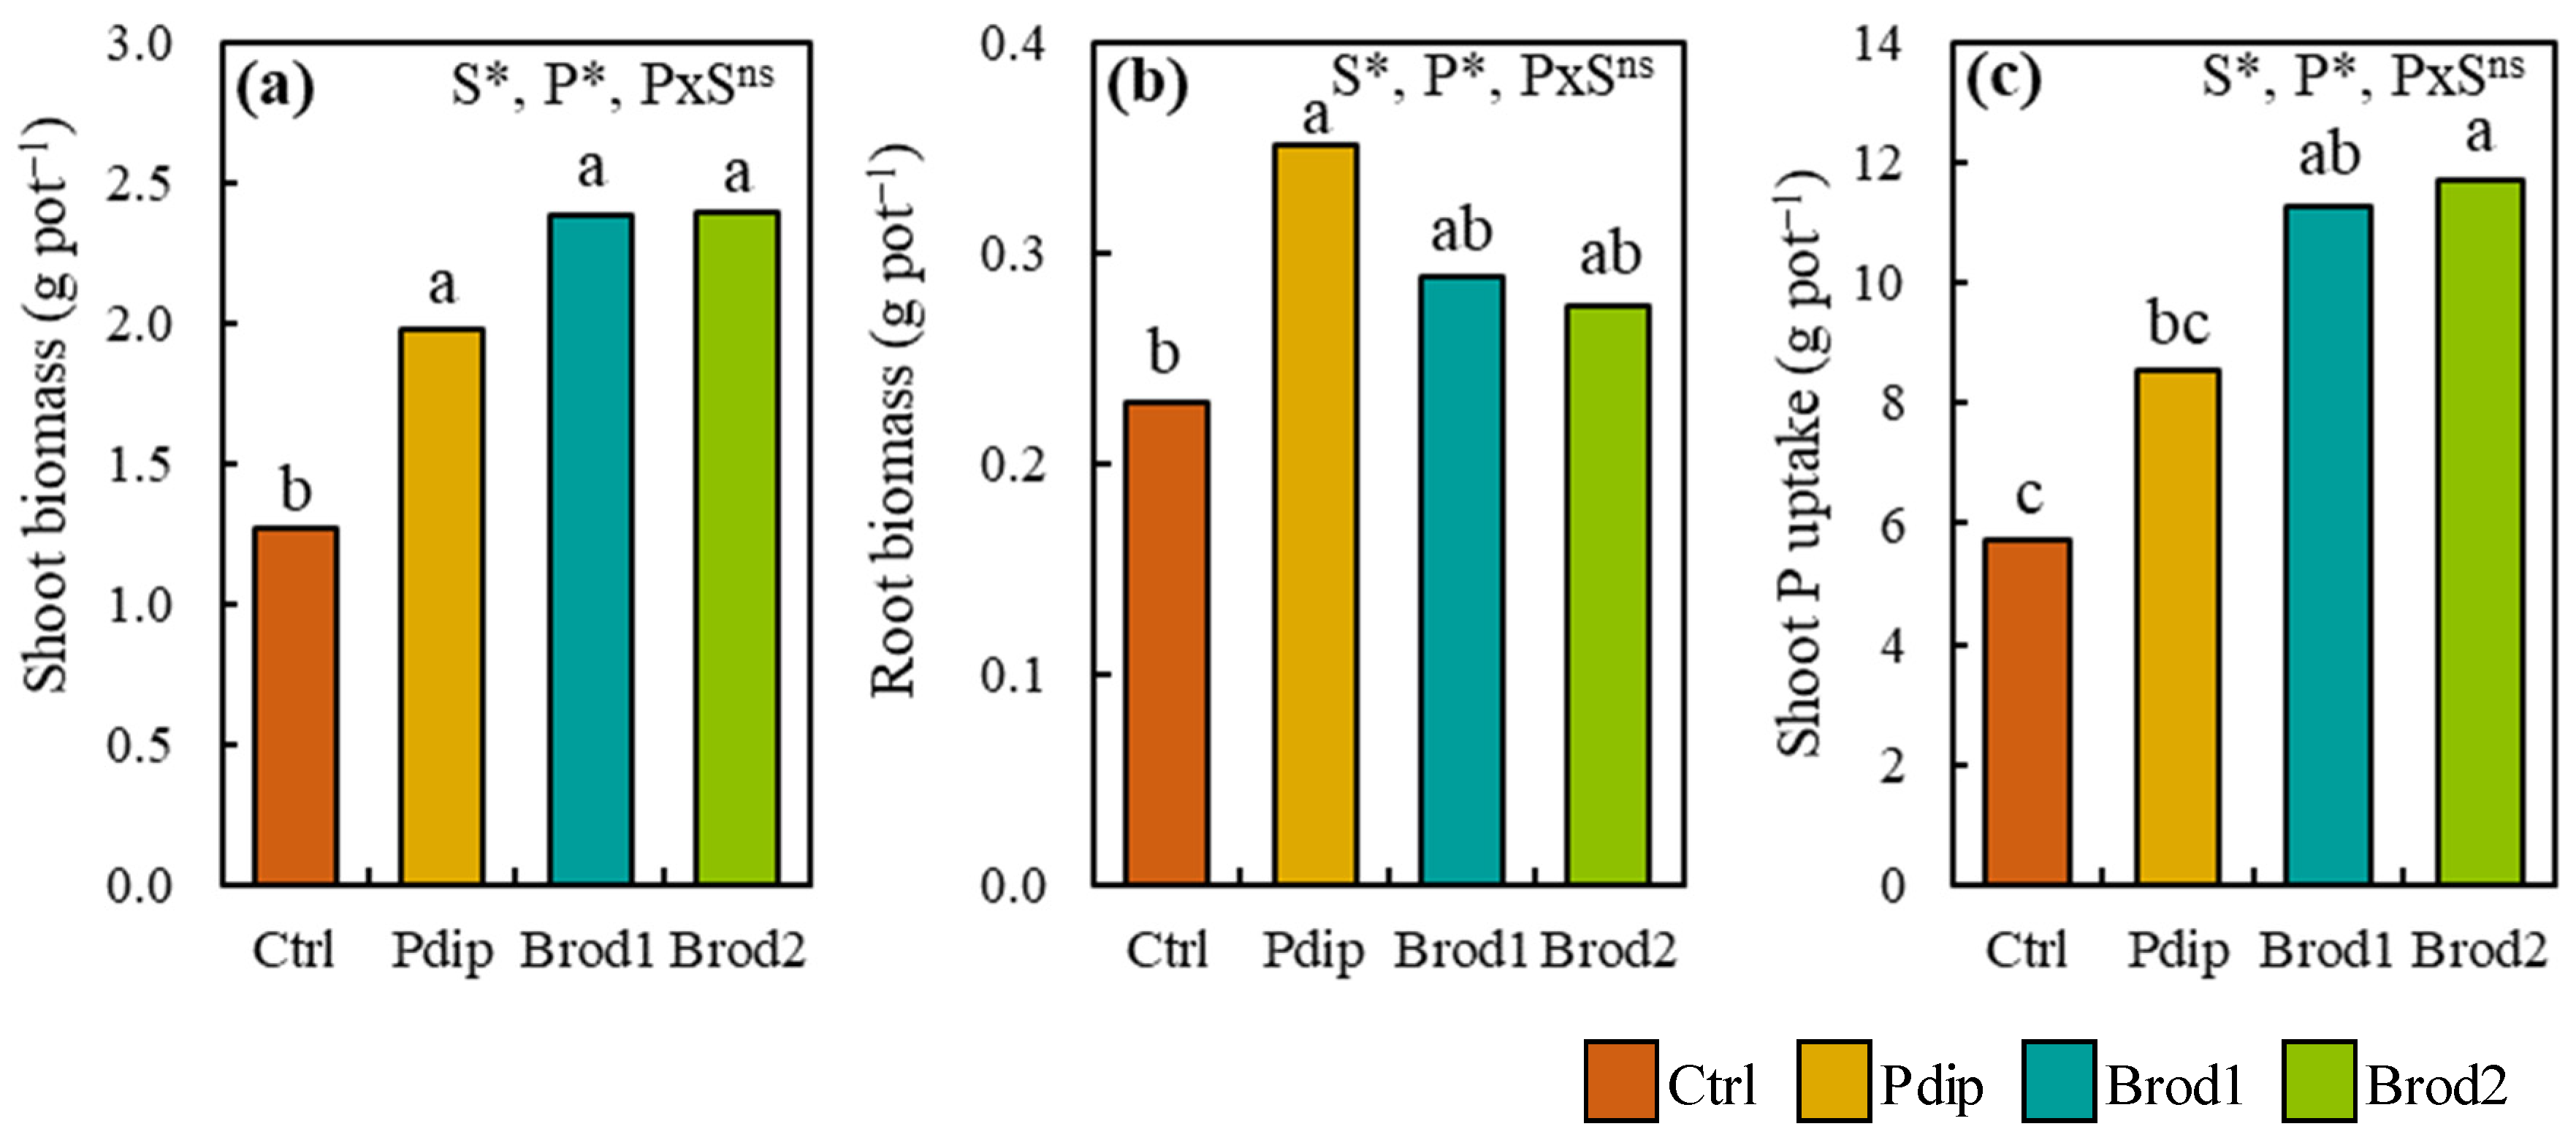
3.1. Changes in Shoot Biomass, Root Biomass, and Shoot P Uptake

Soil texture and P application methods significantly affected mean shoot biomass, mean root biomass, and mean shoot P uptake (Figure 1). Across soil textures and P treatments, total biomass ranged from 1.06 to 4.63 g pot−1. The Pdip treatment significantly increased shoot biomass relative to Ctrl from 1.27 to 1.98 g pot−1 (Figure 1a). Similarly, amongst the P treatments, Pdip significantly increased mean root biomass by 53% relative to Ctrl (Figure 1b). Whereas no statistical difference in mean shoot P uptake existed between Ctrl and Pdip, the Pdip treatment resulted in a 49% increase in shoot P uptake relative to Ctrl (Figure 1c). No significant interaction effects between soil texture and P treatments existed for shoot biomass, root biomass, and shoot P uptake.

3.2. Changes in Shoot Physiology and Morphology

Plant height tended to increase with P application rate under sand and clay soil textures, but under the light clay soil texture, plant height decreased with increased P rate from Brod1 to Brod2 (Table 3).
Mean plant height differed significantly (p < 0.05) between clay loam (86.4 cm), clay (79.9 cm), and sand (64.4 cm) soil textures. Mean plant height also differed significantly (p < 0.05) between Brod2 (82.9 cm), Brod1 (80.2 cm), Pdip (77.1 cm), and Ctrl (67.4 cm) treatments. Significant interaction effects (p < 0.05) between soil textures and P treatments emerged for mean plant height, plant leaf age, leaf area, and SPAD values (Table 3). Mean leaf age was significantly affected by clay loam (9.2), sand (6.1), and clay (5.9) soil textures. Plant leaf area was significantly affected by both soil texture and P treatments, with values of 473.4–500.9, 294.2–321.7, and 249.6–277.1 cm2 pot−1 under clay loam, clay, and sand soil textures, respectively. The Pdip treatment showed a significant 47% increase in mean leaf area relative to Ctrl only under clay soil. Under the three soil textures used, the P treatment significantly affected SPAD values, with Pdip showing a 51.7%, 9.6%, and 8.3% increase relative to Ctrl under sand, clay, and clay loam soil textures, respectively.

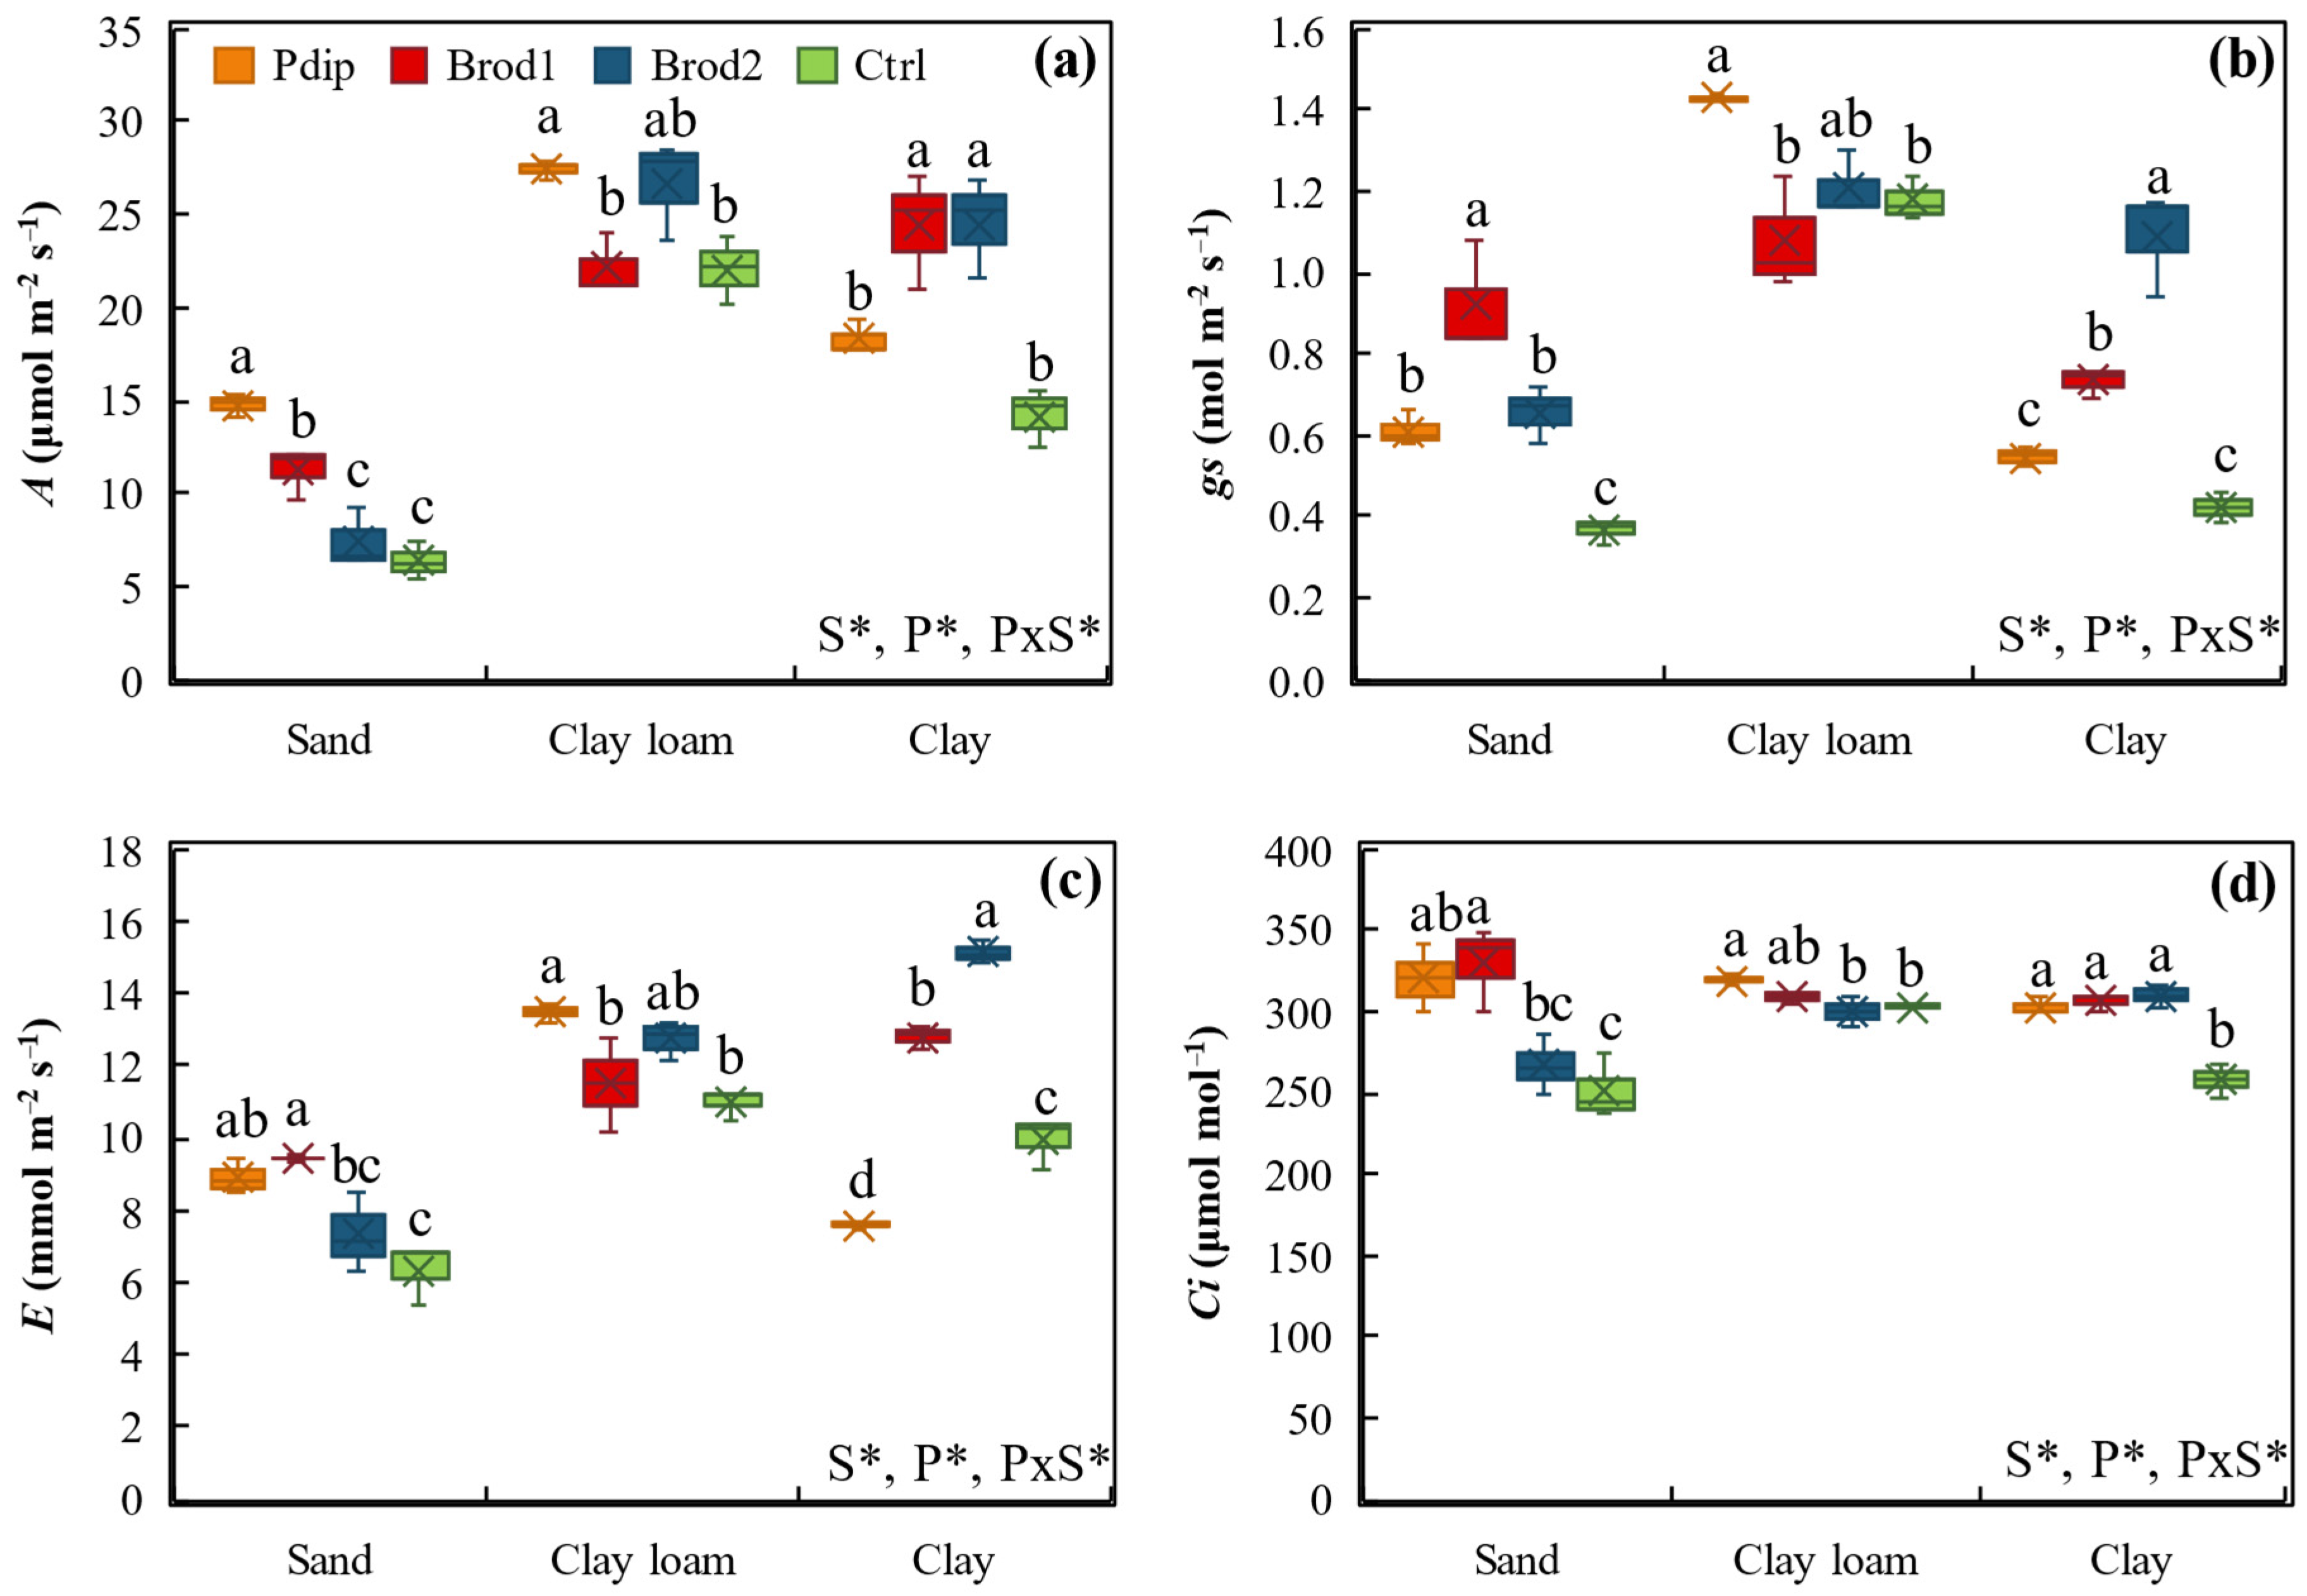
3.3. Gas Exchange Parameters

In Figure 2 we present the changes in the four gas exchange parameters—photosynthetic rate (A), stomatal conductance (gs), transpiration rate (E), and intercellular carbon dioxide concentration (Ci)—under soil texture and P treatments, both of which significantly affected all the gas exchange parameters. The effect of soil texture on A, gs, E, and Ci showed a consistent tendency where, under clay loam soil texture and sand soil texture, we observed the highest and lowest mean values for all the stated parameters, respectively.
While P treatments did not show such consistent changes across the gas exchange parameters, significant differences existed within each parameter. For instance, mean A values under Pdip (20.1 μmol m−2 s−1), Brod2 (19.5 μmol m−2 s−1), and Brod1 (19.3 μmol m−2 s−1) treatments showed significant (p < 0.05) 42%, 37%, and 36% increases over the Ctrl, regardless of soil texture (Figure 2a). Across both soil textures and P treatments, gs values ranged from 0.3 to 1.4 mol m−2 s−1 while E values ranged from 5.4 to 15.5 mmol m−2 s−1. Both gs and E had similar tendencies where under clay loam soil texture, Pdip treatment showed the highest values for gs (1.4 mol m−2 s−1; Figure 2b) and E (13.5 mmol m−2 s−1; Figure 2c). We observed significant changes in Ci between soil textures (p = 0.017) and P treatments (p < 0.05) (Figure 2d). For all the gas exchange parameters, we observed significant interaction effects (p < 0.05) between soil textures and P treatments.

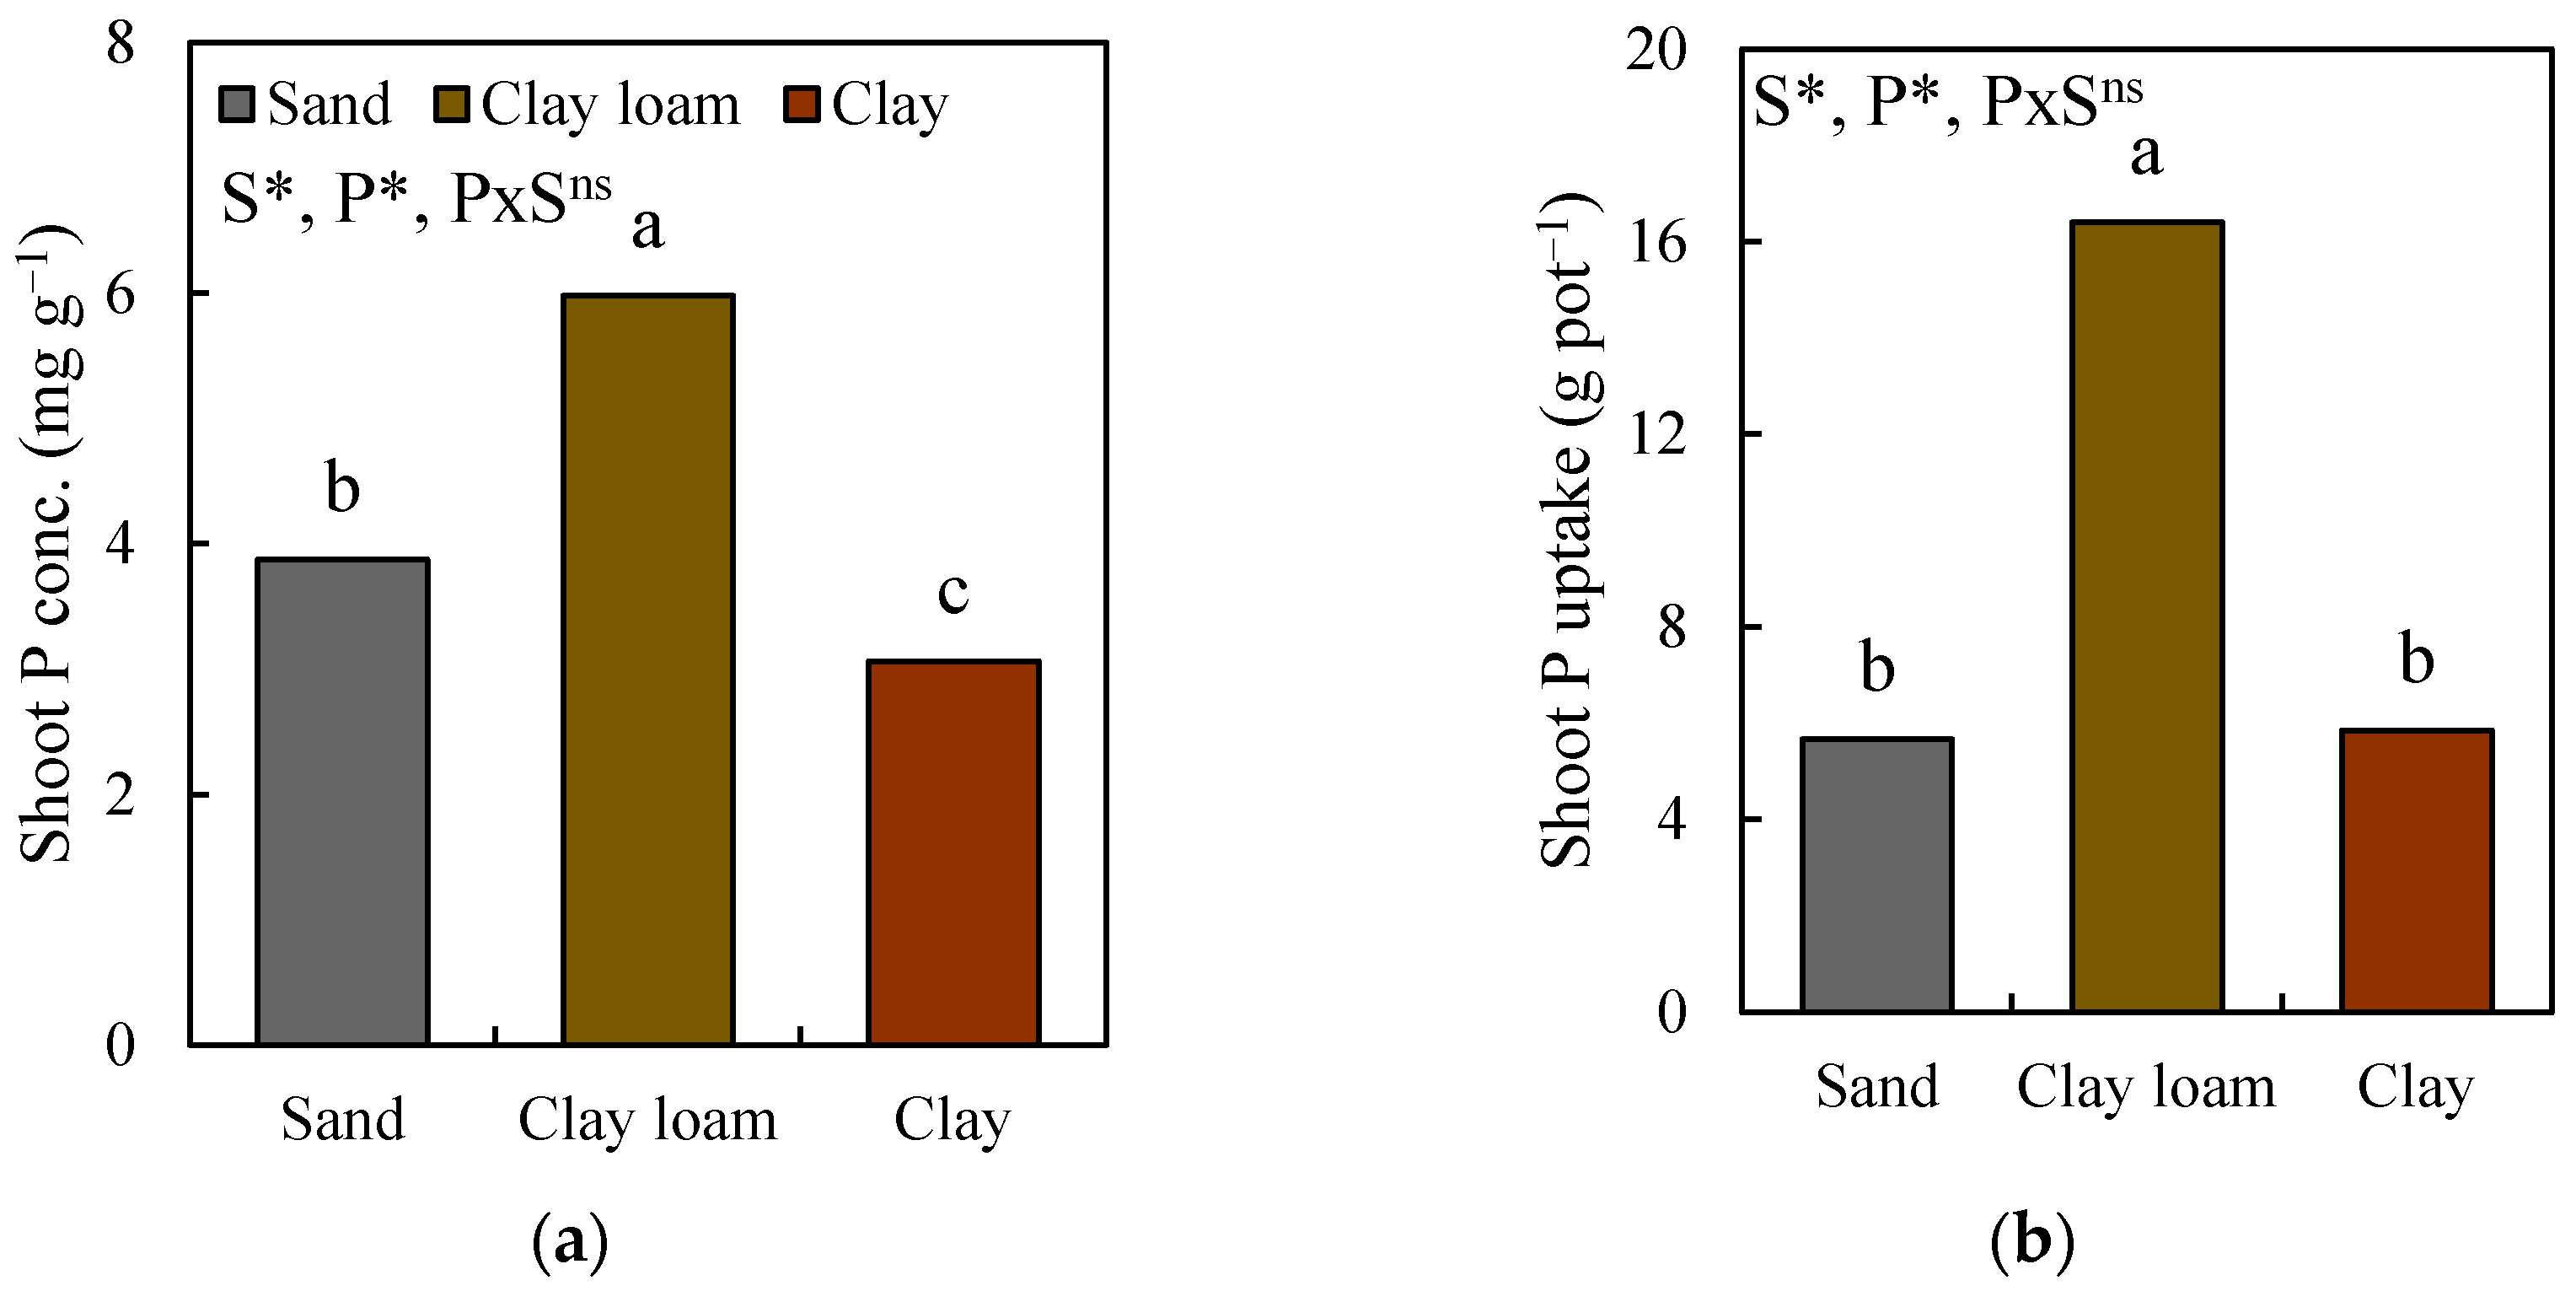
3.4. Changes in Root Morphology and Shoot P Uptake

In Table 4 we present the changes in root morphology related to soil texture and P treatments.
Broadly, the values of all root morphological parameters typically increased with an increase in the P rate from Brod1 to Brod2 under clay and clay loam soil textures but decreased under sand soil texture (Table 4). Specifically, we observed a significant difference (p < 0.05) in mean total root length (RL) between clay, sand, and clay loam soil textures. There was also a significant difference (p < 0.05) in the root length between P treatments, with the highest mean RL under Pdip treatment compared to Brod1, Brod2, and Ctrl treatments. RL showed significant interaction effects between soil texture and P treatment (p < 0.05), and analysis of the simple main effects for P treatment showed that Pdip had the highest effect size (partial η2 = 0.97). Pairwise comparisons showed the mean RL under Pdip treatment and clay was 83.9 points higher than that under clay loam (p < 0.05), and 63.9 points higher than that under sand (p < 0.05) soil textures.
In striking contrast, whereas the mean RL under clay (79.4 m pot−1) was significantly higher than that under clay loam (41.5 m pot−1) soil texture, the mean shoot P concentration and shoot P uptake under clay loam soil were significantly higher than those under clay soil texture (Figure 3).
Indeed, we had expected the higher RL under clay soil texture to result in higher shoot P concentration and shoot P uptake values under clay soil texture—but that was not the case. The mean shoot P uptake under clay loam was 180% greater than that under clay soil texture.
Root surface area, ranging from 335.6 to 1310.3 cm2, showed a similar trend to that observed in the root length, where Pdip treatment gave the highest value under clay soil texture (Table 4). The mean RSA differed significantly (p < 0.05) between that under clay (869.5 cm2), clay loam (602.3 cm2), and sand (557.9 cm2) soil textures. Mean RSA also differed significantly (p < 0.05) between P treatments, with mean RSA under Pdip treatment 17.8% and 41.7% greater relative to the combined broadcasting treatments (Brod1 and Brod2) and Ctrl, respectively, with significant interaction effects between soil texture and P treatment for RSA (p < 0.05). Among P treatments, Pdip treatment showed the highest simple main effect size (partial η2 = 0.99). Pairwise comparisons indicated the mean RSA from the Pdip treatment under clay soil texture was 362.6 and 267.2 points higher than that under sand (p < 0.05) and clay loam (p < 0.05) soil textures, respectively.
Root volume showed similar morphological changes to RL and RSA, where significant differences in the mean RV under clay soil (8.1 cm3; p < 0.05) were the highest compared to values under the clay loam and sand soil textures. Significant differences (p < 0.05) in RV also existed between P treatments, with Pdip treatments showing the highest value (7.1 cm3) among P treatments. Pairwise analysis of the simple main effects among the P treatments showed that Pdip under the clay soil accounted for the highest (partial η2 = 0.96) significant interaction effects in RV.
The changes in root length ratio (RLR)—that is, RL per total biomass—express the root’s potential for the acquisition of soil resources. On the other hand, root mass ratio (RMR)—that is, root biomass per total biomass—is an indicator of the biomass allocated to the roots. Soil texture and P treatments significantly affected RLR and RMR (Table 4). Significantly, under clay and clay loam soil textures we observed the highest (38.3 m g−1) and lowest (14.0 m g−1) mean RLR values, respectively. Among the P treatments, Pdip was associated with a significant 51.6% increase in the mean RLR relative to the combined broadcasting treatments (Brod1 and Brod2). Similarly, clay soil showed the significantly highest (0.19 g g−1) mean RMR, and relative to the combined broadcasting treatments, the Pdip treatment also showed a significant 46.9% increase in RMR. Both RLR and RMR were significantly affected by interactions between soil texture and P treatments. The mean root-to-shoot ratio under clay soil (0.25) was significantly higher (p < 0.05) than that under sand (0.13) and clay loam (0.10) soil textures (Table 4). Among P treatments, we observed the highest and lowest mean root-to-shoot ratios under Ctrl (0.21) and Brod2 (0.11), respectively. The mean root-to-shoot ratio under Pdip (0.19) was equally high but did not differ significantly from that under Ctrl.

4. Discussion

4.1. Soil Texture and P-Dipping Effects on Rice Shoot Morphology

Our findings demonstrated that P-dipping and soil texture each separately affected rice shoot biomass and shoot P uptake, and they interactively affected plant height, leaf age, leaf area, and SPAD. The mean P-dipping values for above-ground parameters—including plant height, leaf area, SPAD, and shoot biomass—showed significant increases relative to Ctrl across all soil textures. While we had hypothesized that clay soil, owing to its high water and nutrient retention capacities, is most suited to P-dipping the interactive effects between P-dipping and soil texture on plant height, leaf age, leaf area, and SPAD showed that clay loam soil texture exerted the most significant effect.
The higher quantities of available P, organic matter, and nitrogen initially present in clay loam may have accounted for the better shoot growth performance under the clay loam soil. On the other hand, because fertilizer P added to soil rapidly forms insoluble complexes in acrisols [4,39], we postulate that though P fertilizer was added to the Acrisol clay soils it may have been fixed and its effect may have been neutralized in the shoot. Miller [40] suggested that plant acquisition of P from soil organic matter is enhanced by the secretion of low-affinity enzymes into the soil to provide additional P for plant growth.
Studies have also shown that hydrolysis of organic matter contributes to the amounts of soluble P in the soil solution [41,42,43]. Thus, the low organic matter and nutrient contents in sand soil on the one hand, and the possible diffusion away of the applied soil P from the point of application, on the other, may have contributed to the overall low shoot growth response to P application in sand soil [44,45]. The high pH in sand soil may have also contributed to the decline in root activity [46,47], which could in turn have negatively impacted nutrient and water absorption, leading to low shoot growth under sand soil.

4.2. Changes in Photosynthetic Rate under Different Soil Textures

In this study, results of the gas exchange measurements showed that soil texture and P treatments significantly affected the photosynthetic rate of NERICA 4, with the highest mean values obtained under the clay loam soil texture (24.6 μmol m−2 s−1) and the P-dipping treatment (20.1 μmol m−2 s−1), respectively. With reference to the conclusion by Yang [48] that photosynthetic capacity is closely related to the leaf N content, our findings regarding the photosynthetic rate may be explained by the differences in the SPAD values as an estimate of leaf N content, where the highest mean SPAD values were equally obtained under clay loam (45.6) soil texture treatment, and Brod1 (38.5) and Pdip (37.4) P treatments (Table 3). The high N content of clay loam soil may have been taken up to the plant leaves, resulting in a high photosynthetic rate under clay loam soil texture. On the other hand, P-dipping may have boosted root growth [45], leading to an enhanced P uptake under the Pdip treatment compared to that under Brod1 and Brod2 P application treatments.

4.3. Changes in Root Morphology and the Effect on Shoot P Uptake

Plant roots are directly exposed to the rhizosphere soil, thereby providing the primary channel for nutrient acquisition and its subsequent utilization for plant growth. Root growth and development depend on several soil factors, including texture and density, water and nutrient contents, and concentration of oxygen [49,50,51]. Our findings here showed that the combined effects of soil texture and P-dipping significantly influenced NERICA 4 root morphology. Specifically, the mean values for RL, RSA, RV, and root biomass under clay soil texture and P-dipping treatment were significantly higher than those for other treatments. The low available P content in the clay experimental soil may have triggered the observed extensive root growth, as the relieved P constraints possibly led to increased soil microbial mass, and consequently an increased microbial utilization of soil carbon for increased root development [52,53].
Increased root morphological characteristics under P-deficient conditions have been reported for enhanced P absorption [54,55,56]. This has further been evidenced by high root-to-shoot ratios, which are generally inversely related to soil nutrient and water availability, as plants allocate more photosynthates to their roots for increased soil exploration [57,58,59]. While some studies have also shown strong positive linear relationships between root morphological characteristics and P acquisition under P-deficient conditions [60,61,62], our results showed the opposite—particularly under P-deficient clay soil texture. In our findings, the mean shoot P concentration under the clay texture was −48.8% lower than that under clay loam soil, yet the mean RL under clay texture was 91.4% higher than the mean RL under clay loam soil texture (Table 4; Figure 3). This suggests that enhanced root morphology does not necessarily enhance P uptake in the initial rice growth stages, and thus, further research needs to be carried out to evaluate the potential of NERICA 4 rice to increase its P acquisition and utilization efficiencies at later stages of the cropping cycle for increased grain yield.
The lower shoot P content of plants under clay soil texture—despite having the most robust root biomass—could be due to the remobilization of the shoot P into the roots. Similar studies by Abdallah [63] and Irfan [64] found that in P-deficient soils, shoot P was remobilized or translocated from metabolically inactive to active sites such as the roots; in our study, the clay soil was P-deficient (Table 1). On the other hand, we think that the combination of higher root biomass with low plant tissue P concentration in the P-deficient clay soil can be explained by the Piper–Steenbjerg effect [65], summarized concisely by De Bauw [20] as low tissue P concentrations when the fast growth of plants grown in an initially higher P medium (locally after placement) eventually leads to a more rapid depletion of external P than the slow growth of plants grown in an initially lower P medium, as was the case in our study.

5. Conclusions

We evaluated the combined effect of soil texture and P-dipping on NERICA 4 rice shoot and root physiology and morphology, with a major focus on shoot P uptake in the initial growth stages. Contrary to our hypothesis, the interactive effect of soil texture and P-dipping influenced NERICA 4 shoot and root physiological and morphological characteristics mainly under clay loam rather than clay soil. The clay loam soil examined in our study showed higher shoot morphological characteristics despite the relatively lower root biomass. On the other hand, P-dipping significantly promoted rice root morphology under clay soil, but without a commensurate shoot P concentration and uptake. This suggests that enhanced root morphology does not necessarily enhance P uptake in the initial rice growth stages; thus, further research is necessary to evaluate the potential of NERICA 4 rice to increase its P acquisition and utilization efficiencies at later stages of the cropping cycle for increased grain yield. The findings of our study provide new insights into the existing body of knowledge on the widely adapted NERICA 4 rice variety across SSA, which should ultimately contribute to improving sustainable food security among smallholder farmers in the region.

Author Contributions

Conceptualization, J.-I.S., E.O., and Y.T.; methodology, E.O., J.-I.S., S.Y., I.A., R.C., and I.S.; formal analysis, E.O.; writing—original draft preparation, E.O.; writing—review and editing, E.O., Y.T., S.Y., I.A., R.C., I.S., and J.-I.S.; supervision, J.-I.S. All authors have read and agreed to the published version of the manuscript.

Funding

This research received no external funding.

Institutional Review Board Statement

Not applicable.

Informed Consent Statement

Not applicable.

Data Availability Statement

The data presented in this work are available on request from the corresponding author.

Acknowledgments

The first author thanks the Japan International Cooperation Agency (JICA) for the Agriculture Studies Networks for Food Security (Agri-Net) scholarship that enabled him to undertake this study.

Conflicts of Interest

The authors declare no conflict of interest.

References

  1. Diagne, A.; Alia, D.Y.; Amovin-Assagba, E.; Wopereis, M.C.; Saito, K.; Nakelse, T. Farmer perceptions of the biophysical constraints to rice production in sub-Saharan Africa, and potential impact of research. In Realizing Africa’s Rice Promise; CABI: Wallingford, UK, 2013; pp. 46–68. [Google Scholar] [CrossRef]
  2. Saito, K.; Nelson, A.; Zwart, S.; Niang, A.; Sow, A.; Yoshida, H.; Wopereis, M. Towards a Better Understanding of Biophysical Determinants of Yield Gaps and the Potential for Expansion of the Rice Area in Africa; CABI: Wallingford, UK, 2013; pp. 188–203. [Google Scholar] [CrossRef]
  3. Tanaka, A.; Johnson, J.-M.; Senthilkumar, K.; Akakpo, C.; Segda, Z.; Yameogo, L.P.; Bassoro, I.; Lamare, D.M.; Allarangaye, M.D.; Gbakatchetche, H.; et al. On-farm rice yield and its association with biophysical factors in sub-Saharan Africa. Eur. J. Agron. 2017, 85, 1–11. [Google Scholar] [CrossRef]
  4. Bationo, A.; Hartemink, A.; Lungo, O.; Naimi, M.; Okoth, P.; Smaling, E.; Thiombiano, L. African Soils: Their Productivity and Profitability of Fertilizer Use: Background Paper for the African Fertilizer Summit 9–13th June 2006, Abuja, Nigeria; IFDC: Muscle Shoals, AL, USA, 2006. [Google Scholar]
  5. Sileshi, G.W.; Kihara, J.; Tamene, L.; Vanlauwe, B.; Phiri, E.; Jama, B. Unravelling causes of poor crop response to applied N and P fertilizers on African soils. Exp. Agric. 2022, 58, e7. [Google Scholar] [CrossRef]
  6. Stocking, M.A. Tropical soils and food security: The next 50 years. Science 2003, 302, 1356–1359. [Google Scholar] [CrossRef] [PubMed]
  7. Batjes, N.H. ISRIC-WISE Derived Soil Properties on a 5 by 5 Arc-Minutes Global Grid (Ver. 1.2); ISRIC-World Soil Information: Wageningen, The Netherlands, 2012. [Google Scholar]
  8. Shang, C.; Zelazny, L.W. Selective dissolution techniques for mineral analysis of soils and sediments. In Methods of Soil Analysis Part 5—Mineralogical Methods; Soil Science Society of America, Inc.: Madison, WI, USA, 2008; Volume 5, pp. 33–80. [Google Scholar] [CrossRef]
  9. Balasubramanian, V.; Sie, M.; Hijmans, R.; Otsuka, K. Increasing rice production in sub-Saharan Africa: Challenges and opportunities. Adv. Agron. 2007, 94, 55–133. [Google Scholar] [CrossRef]
  10. Vandamme, E.; Ahouanton, K.; Mwakasege, L.; Mujuni, S.; Mujawamariya, G.; Kamanda, J.; Senthilkumar, K.; Saito, K. Phosphorus micro-dosing as an entry point to sustainable intensification of rice systems in sub-Saharan Africa. Field Crops Res. 2018, 222, 39–49. [Google Scholar] [CrossRef]
  11. Nakamura, S.; Fukuda, M.; Nagumo, F.; Tobita, S. Potential utilization of local phosphate rocks to enhance rice production in sub-Saharan Africa. Jpn. Agric. Res. Q. JARQ 2013, 47, 353–363. [Google Scholar] [CrossRef]
  12. Sharma, S.B.; Sayyed, R.Z.; Trivedi, M.H.; Gobi, T.A. Phosphate solubilizing microbes: Sustainable approach for managing phosphorus deficiency in agricultural soils. SpringerPlus 2013, 2, 587. [Google Scholar] [CrossRef] [PubMed]
  13. Ahmad, Z.; Gill, M.A.; Qureshi, R.H. Genotypic variations of phosphorus utilization efficiency of crops. J. Plant Nutr. 2001, 24, 1149–1171. [Google Scholar] [CrossRef]
  14. Gunes, A.; Inal, A.; Alpaslan, M.; Cakmak, I. Genotypic variation in phosphorus efficiency between wheat cultivars grown under greenhouse and field conditions. Soil Sci. Plant Nutr. 2006, 52, 470–478. [Google Scholar] [CrossRef]
  15. Wissuwa, M.; Ae, N. Genotypic variation for tolerance to phosphorus deficiency in rice and the potential for its exploitation in rice improvement. Plant Breed. 2001, 120, 43–48. [Google Scholar] [CrossRef]
  16. Cornel, P.; Schaum, C. Phosphorus recovery from wastewater: Needs, technologies and costs. Water Sci. Technol. 2009, 59, 1069–1076. [Google Scholar] [CrossRef] [PubMed]
  17. Yuan, Z.; Pratt, S.; Batstone, D.J. Phosphorus recovery from wastewater through microbial processes. Curr. Opin. Biotechnol. 2012, 23, 878–883. [Google Scholar] [CrossRef] [PubMed]
  18. Rakotoson, T.; Amery, F.; Rabeharisoa, L.; Smolders, E. Soil flooding and rice straw addition can increase isotopic exchangeable phosphorus in P-deficient tropical soils. Soil Use Manag. 2014, 30, 189–197. [Google Scholar] [CrossRef]
  19. Shenker, M.; Seitelbach, S.; Brand, S.; Haim, A.; Litaor, M. Redox reactions and phosphorus release in re-flooded soils of an altered wetland. Eur. J. Soil Sci. 2005, 56, 515–525. [Google Scholar] [CrossRef]
  20. De Bauw, P.; Smolders, E.; Verbeeck, M.; Senthilkumar, K.; Houben, E.; Vandamme, E. Micro-dose placement of phosphorus induces deep rooting of upland rice. Plant Soil 2021, 463, 187–204. [Google Scholar] [CrossRef]
  21. McKenzie, R.; Roberts, T. Soil and fertilizers phosphorus update. In Proceedings of the Alberta Soil Science Workshop Proceedings, Edmonton, AB, Canada, 20–22 February 1990; pp. 20–22. [Google Scholar] [CrossRef]
  22. Smith, S.E.; Dickson, S.; Smith, F.A. Nutrient transfer in arbuscular mycorrhizas: How are fungal and plant processes integrated? Funct. Plant Biol. 2001, 28, 685–696. [Google Scholar] [CrossRef]
  23. Tabo, R.; Bationo, A.; Amadou, B.; Marchal, D.; Lompo, F.; Gandah, M.; Hassane, O.; Diallo, M.K.; Ndjeunga, J.; Fatondji, D. Fertilizer microdosing and “warrantage” or inventory credit system to improve food security and farmers’ income in West Africa. In Innovations as Key to the Green Revolution in Africa: Exploring the Scientific Facts; Springer: Berlin/Heidelberg, Germany, 2011; pp. 113–121. [Google Scholar]
  24. Odama, E.; Tsujimoto, Y.; Yabuta, S.; Akagi, I.; Sakagami, J.-I. P-dipping improved NERICA 4 rice seedling resilience to water and nutrient stresses under rainfed-like conditions. Rhizosphere 2023, 26, 100688. [Google Scholar] [CrossRef]
  25. Oo, A.Z.; Tsujimoto, Y.; Rakotoarisoa, N.M.; Andrianary, B.H. Localized phosphorus application via P-dipping doubles applied P use efficiency and avoids weather-induced stresses for rice production on P-deficient lowlands. Eur. J. Agron. 2023, 149, 126901. [Google Scholar] [CrossRef]
  26. Rakotoarisoa, N.M.; Tsujimoto, Y.; Oo, A.Z. Dipping rice seedlings in P-enriched slurry increases grain yield and shortens days to heading on P-deficient lowlands in the central highlands of Madagascar. Field Crops Res. 2020, 254, 107806. [Google Scholar] [CrossRef]
  27. Alhaj Hamoud, Y.; Wang, Z.; Guo, X.; Shaghaleh, H.; Sheteiwy, M.; Chen, S.; Qiu, R.; Elbashier, M.M. Effect of irrigation regimes and soil texture on the potassium utilization efficiency of rice. Agronomy 2019, 9, 100. [Google Scholar] [CrossRef]
  28. Dou, F.; Soriano, J.; Tabien, R.E.; Chen, K. Soil texture and cultivar effects on rice (Oryza sativa L.) grain yield, yield components and water productivity in three water regimes. PLoS ONE 2016, 11, e0150549. [Google Scholar] [CrossRef] [PubMed]
  29. Martins, J.D.L.; Soratto, R.P.; Fernandes, A.; Dias, P.H. Phosphorus fertilization and soil texture affect potato yield. Rev. Caatinga 2018, 31, 541–550. [Google Scholar] [CrossRef]
  30. Mojid, M.A.; Mousumi, K.A.; Ahmed, T. Performance of wheat in five soils of different textures under freshwater and wastewater irrigation. Agric. Sci. 2020, 2, 89. [Google Scholar] [CrossRef]
  31. Azam, M.G.; Sarker, U.; Uddin, M.S. Screening maize (Zea mays L.) genotypes for phosphorus deficiency at the seedling stage. Turk. J. Agric. For. 2022, 46, 802–821. [Google Scholar] [CrossRef]
  32. Jabborova, D. The effects of Pseudomonas koreensis IGPEB 17 and arbuscular mycorrhizal fungi on growth and physiological properties of ginger. Turk. J. Agric. For. 2022, 46, 488–495. [Google Scholar] [CrossRef]
  33. Lu, C.; Tian, H. Global nitrogen and phosphorus fertilizer use for agriculture production in the past half century: Shifted hot spots and nutrient imbalance. Earth Syst. Sci. Data 2017, 9, 181–192. [Google Scholar] [CrossRef]
  34. Vitousek, P.M.; Naylor, R.; Crews, T.; David, M.B.; Drinkwater, L.; Holland, E.; Johnes, P.; Katzenberger, J.; Martinelli, L.A.; Matson, P. Nutrient imbalances in agricultural development. Science 2009, 324, 1519–1520. [Google Scholar] [CrossRef] [PubMed]
  35. Blakemore, L.C.; Searle, P.L.; Daly, B.K. Methods for chemical analysis of soils. NZ Soil Bur. Sci. Rep. 1987, 80, 71–76. [Google Scholar]
  36. Piper, C. Soil and Plant Analysis; Hassel Press: Adelaide, Australia, 1950; 368p. [Google Scholar]
  37. Oo, A.Z.; Tsujimoto, Y.; Rakotoarisoa, N.M. Optimizing the phosphorus concentration and duration of seedling dipping in soil slurry for accelerating the initial growth of transplanted rice. Agronomy 2020, 10, 240. [Google Scholar] [CrossRef]
  38. Chapman, H.D.; Pratt, P.F. Methods of analysis for soils, plants and waters. Soil Sci. 1962, 93, 68. [Google Scholar] [CrossRef]
  39. Nziguheba, G.; Merckx, R.; Palm, C.A. Soil phosphorus dynamics and maize response to different rates of phosphorus fertilizer applied to an Acrisol in western Kenya. Plant Soil 2002, 243, 1–10. [Google Scholar] [CrossRef]
  40. Miller, S.S.; Liu, J.; Allan, D.L.; Menzhuber, C.J.; Fedorova, M.; Vance, C.P. Molecular control of acid phosphatase secretion into the rhizosphere of proteoid roots from phosphorus-stressed white lupin. Plant Physiol. 2001, 127, 594–606. [Google Scholar] [CrossRef] [PubMed]
  41. Hinsinger, P. Bioavailability of soil inorganic P in the rhizosphere as affected by root-induced chemical changes: A review. Plant Soil 2001, 237, 173–195. [Google Scholar] [CrossRef]
  42. Matar, A.; Torrent, J.; Ryan, J. Soil and fertilizer phosphorus and crop responses in the dryland Mediterranean zone. Adv. Soil Sci. 1992, 18, 81–146. [Google Scholar] [CrossRef]
  43. Takahashi, Y.; Katoh, M. Root response and phosphorus uptake with enhancement in available phosphorus level in soil in the presence of water-soluble organic matter deriving from organic material. J. Environ. Manag. 2022, 322, 116038. [Google Scholar] [CrossRef] [PubMed]
  44. De Bauw, P.; Vandamme, E.; Senthilkumar, K.; Lupembe, A.; Smolders, E.; Merckx, R. Combining phosphorus placement and water saving technologies enhances rice production in phosphorus-deficient lowlands. Field Crops Res. 2019, 236, 177–189. [Google Scholar] [CrossRef]
  45. Oo, A.Z.; Tsujimoto, Y.; Rakotoarisoa, N.M.; Kawamura, K.; Nishigaki, T. P-dipping of rice seedlings increases applied P use efficiency in high P-fixing soils. Sci. Rep. 2020, 10, 11919. [Google Scholar] [CrossRef] [PubMed]
  46. Kobayashi, O.; Higuchi, K.; Miwa, E.; Tadano, T. Growth injury induced by high pH in rice and tomato. Soil Sci. Plant Nutr. 2010, 56, 407–411. [Google Scholar] [CrossRef]
  47. Turner, A.J.; Arzola, C.I.; Nunez, G.H. High pH stress affects root morphology and nutritional status of hydroponically grown Rhododendron (Rhododendron spp.). Plants 2020, 9, 1019. [Google Scholar] [CrossRef]
  48. Yang, H.; Yu, Q.; Sheng, W.-p.; Li, S.-g.; Tian, J. Determination of leaf carbon isotope discrimination in C4 plants under variable N and water supply. Sci. Rep. 2017, 7, 351. [Google Scholar] [CrossRef]
  49. Lloret, P.G.; Casero, P.J. Lateral root initiation. In Plant Roots: The Hidden Half; CRC Press: Boca Raton, FL, USA, 2002; Volume 3. [Google Scholar]
  50. Lynch, J. Root architecture and plant productivity. Plant Physiol. 1995, 109, 7. [Google Scholar] [CrossRef]
  51. Raven, J.A.; Edwards, D. Roots: Evolutionary origins and biogeochemical significance. J. Exp. Bot. 2001, 52, 381–401. [Google Scholar] [CrossRef] [PubMed]
  52. Wang, W.; Mo, Q.; Han, X.; Hui, D.; Shen, W. Fine root dynamics responses to nitrogen addition depend on root order, soil layer, and experimental duration in a subtropical forest. Biol. Fertil. Soils 2019, 55, 723–736. [Google Scholar] [CrossRef]
  53. Griffiths, B.S.; Spilles, A.; Bonkowski, M. C:N:P stoichiometry and nutrient limitation of the soil microbial biomass in a grazed grassland site under experimental P limitation or excess. Ecol. Process. 2012, 1, 6. [Google Scholar] [CrossRef]
  54. He, Y.; Liao, H.; Yan, X. Localized supply of phosphorus induces root morphological and architectural changes of rice in split and stratified soil cultures. Plant Soil 2003, 248, 247–256. [Google Scholar] [CrossRef]
  55. Lynch, P.; Bates, R. Root hairs confer a competitive advantage under low P availability. Plant Soil 2001, 236, 243–250. [Google Scholar] [CrossRef]
  56. Ma, Z.; Bielenberg, D.; Brown, K.; Lynch, J. Regulation of root hair density by phosphorus availability in Arabidopsis thaliana. Plant Cell Environ. 2001, 24, 459–467. [Google Scholar] [CrossRef]
  57. Ho, M.D.; Rosas, J.C.; Brown, K.M.; Lynch, J.P. Root architectural tradeoffs for water and phosphorus acquisition. Funct. Plant Biol. 2005, 32, 737–748. [Google Scholar] [CrossRef]
  58. Prescott, C.E.; Grayston, S.J.; Helmisaari, H.-S.; Kaštovská, E.; Körner, C.; Lambers, H.; Meier, I.C.; Millard, P.; Ostonen, I. Surplus carbon drives allocation and plant–soil interactions. Trends Ecol. Evol. 2020, 35, 1110–1118. [Google Scholar] [CrossRef]
  59. Wang, R.; Cavagnaro, T.R.; Jiang, Y.; Keitel, C.; Dijkstra, F.A. Carbon allocation to the rhizosphere is affected by drought and nitrogen addition. J. Ecol. 2021, 109, 3699–3709. [Google Scholar] [CrossRef]
  60. Aziz, T.; Ahmed, I.; Farooq, M.; Maqsood, M.A.; Sabir, M. Variation in phosphorus efficiency among Brassica cultivars I: Internal utilization and phosphorus remobilization. J. Plant Nutr. 2011, 34, 2006–2017. [Google Scholar] [CrossRef]
  61. de Souza Campos, P.M.; Meier, S.; Morales, A.; Borie, F.; Cornejo, P.; Ruiz, A.; Seguel, A. Root traits distinguish phosphorus acquisition of two wheat cultivars growing in phosphorus-deficient acid soil. Rhizosphere 2022, 22, 100549. [Google Scholar] [CrossRef]
  62. De Bauw, P.; Vandamme, E.; Lupembe, A.; Mwakasege, L.; Senthilkumar, K.; Merckx, R. Architectural root responses of rice to reduced water availability can overcome phosphorus stress. Agronomy 2018, 9, 11. [Google Scholar] [CrossRef]
  63. Abdallah, M.; Dubousset, L.; Meuriot, F.; Etienne, P.; Avice, J.; Ourry, A. Effect of mineral sulphur availability on nitrogen and sulphur uptake and remobilization during the vegetative growth of Brassica napus L. J. Exp. Bot. 2010, 61, 2635–2646. [Google Scholar] [CrossRef]
  64. Irfan, M.; Abbas, M.; Shah, J.A.; Akram, M.A.; Depar, N.; Memon, M.Y. Biomass and phosphorus accumulation, partitioning and remobilization during grain development in wheat under phosphorus deficiency. Intr. J. Agric. Biol. 2019, 21, 351–358. [Google Scholar] [CrossRef]
  65. Wikström, F. A theoretical explanation of the Piper-Steenbjerg effect. Plant Cell Environ. 1994, 17, 1053–1060. [Google Scholar] [CrossRef]
Figure 1. Comparison of means from the effect of P treatments (P) on shoot mass (a), root mass (b), and shoot P uptake (c) at 40 days after transplanting. S, soil texture; *, p < 0.05; ns, not significant according to Tukey’s HSD test. Different lowercase letters above P treatments indicate significant differences between P treatments at p < 0.05.
Sustainability 15 15402 g001
Figure 2. Boxplots of the responses of NERICA 4 photosynthetic rate (a), stomatal conductance (b), transpiration rate (c), and intercellular CO2 concentration (d) to sand, clay loam, and clay soil textures planted in P treatments including Pdip, Brod1, Brod2, and Ctrl. *, p < 0.05 according to Tukey’s HSD test. Different lowercase letters above P treatments indicate significant differences at p < 0.05 within each soil texture.
Sustainability 15 15402 g002
Figure 3. Comparison of means from the effect of soil texture (S) on shoot P concentration (a) and shoot P uptake (b) across P treatments (P) at 40 days after transplanting. *, p < 0.05; ns, not significant, both according to Tukey’s HSD test. Different lowercase letters above soil textures indicate significant differences between soil textures at p < 0.05.
Sustainability 15 15402 g003
Table 1. Experimental soil physical and chemical properties.
PropertyKagoshima 1 Tanegashima 1Tokunoshima 1
WRB classificationArenosolsAndosolsAcrisols
pH (1:2.5 H2O)8.84.95.8
EC (mS m−1)44.016.328.9
Total N (%)0.020.190.10
Total organic C (%) 0.051.620.52
C:N ratio0.98.55.3
Organic matter content (%)0.092.790.90
Available P (mg kg−1)24.5186.518.3
Al oxalate (mg g−1)9.125.213.2
Fe oxalate (mg g−1)1.76.91.8
Sand (%)95.630.812.6
Clay (%)2.743.479.7
Silt (%)1.725.87.7
Textural nameSand Clay loamClay
1 Locations from which the experimental soil samples were taken.
Table 2. Overview of the P and soil texture treatments.
Treatments Application Rate
(mg P2O5 pot−1)
Application MethodTiming
P application
 Pdip68.7 P-dipping 2At transplanting
 Brod143.1BroadcastingAt transplanting
 Brod285.9BroadcastingAt transplanting
 Ctrl0--
Soil textureQuantity
(kg soil pot−1)
Field condition volumetric moisture content (% w/w)
 Sand 1.532
 Clay loam1.542
 Clay 1.548
2 The P-enriched slurry for the P-dipping treatment was produced by mixing 45 g of air-dried soil, 14 mL of water, and 1.31 g of SSP fertilizer. To correct deficiencies in the soil N and K contents, 90 mg N pot−1 and 50 mg K pot−1, respectively, were homogeneously mixed with the experimental soil in each pot.
Table 3. Shoot morphological changes related to soil texture and P treatments.
Soil Texture (S)Phosphorus Treatment (P)Plant HeightLeaf AgeLeaf AreaSPAD
(cm) (cm2 pot−1)Value
SandCtrl55.6 ± 1.8 c5.0 ± 0.01 b197.3 ± 10.9 b14.3 ± 2.4 b
Pdip63.1 ± 2.5 b5.0 ± 0.01 b238.4 ± 17.4 b21.7 ± 1.1 a
Brod166.2 ± 2.7 b7.3 ± 0.58 a312.0 ± 17.4 a24.0 ± 1.3 a
Brod272.6 ± 2.1 a7.2 ± 1.44 a305.7 ± 27.5 a17.6 ± 0.1 b
Clay loamCtrl81.7 ± 2.8 b9.5 ± 0.87 a447.2 ± 10.7 a43.5 ± 0.8 b
Pdip87.3 ± 3.2 ab9.3 ± 0.58 a501.3 ± 16.7 a47.1 ± 0.3 a
Brod189.6 ± 1.7 a9.2 ± 0.58 a499.5 ± 35.6 a45.6 ± 0.6 a
Brod286.9 ± 0.9 ab8.8 ± 0.29 a500.7 ± 12.0 a46.1 ± 0.6 a
ClayCtrl65.0 ± 5.9 b4.7 ± 0.58 b180.1 ± 30.9 c39.7 ± 1.4 c
Pdip81.0 ± 5.5 a5.0 ± 0.01 b265.2 ± 28.3 b43.5 ± 0.6 b
Brod184.8 ± 5.9 a6.8 ± 0.29 a368.2 ± 10.3 a45.8 ± 0.4 a
Brod289.2 ± 1.0 a7.0 ± 0.50 a418.4 ± 10.1 a47.9 ± 0.6 a
Two-way
ANOVA
S****
P****
S × P****
NERICA 4 shoot morphological changes under sand, clay loam, and clay soil texture and phosphorus treatments including Pdip, Brod1, Brod2, and Ctrl at 40 days after transplanting. *, p < 0.05 according to Tukey’s HSD test. Values are means ± standard deviations (n = 3). Different lowercase letters after parameter values indicate significant differences at p < 0.05 within each soil texture.
Table 4. Root morphological changes related to soil texture and P treatments.
Soil Texture (S)Phosphorus Treatment (P)Total Root LengthRoot Surface AreaRoot VolumeRoot Length RatioRoot Mass RatioRoot to Shoot Ratio
(m pot−1)(cm2 pot−1)(cm3 pot−1)(m g−1)(g g−1)
SandCtrl33.9 ± 1.3 c519.7 ± 6.8 c4.5 ± 0.1 a29.0 ± 1.1 ab0.13 ± 0.02 a0.15 ± 0.03 a
Pdip52.0 ± 0.8 a557.6 ± 8.7 b4.8 ± 0.3 a38.2 ± 2.6 a0.12 ± 0.01 ab0.13 ± 0.01 a
Brod152.5 ± 0.9 a588.6 ± 9.9 a4.9 ± 0.4 a27.8 ± 5.8 ab0.11 ± 0.01 ab0.12 ± 0.02 ab
Brod236.9 ± 0.9 b361.6 ± 6.4 d2.8 ± 0.1 b20.3 ± 5.2 c0.09 ± 0.02 b0.10 ± 0.02 ab
Clay loamCtrl27.2 ± 6.0 b404.2 ± 5.9 d4.1 ± 0.1 c13.6 ± 1.2 ab0.25 ± 0.04 a0.13 ± 0.06 a
Pdip31.9 ± 6.4 b481.6 ± 9.4 c4.8 ± 0.1 c9.8 ± 2.9 b0.24 ± 0.04 a0.12 ± 0.04 a
Brod143.0 ± 5.9 b670.9 ± 29.4 b6.7 ± 0.4 b12.6 ± 2.0 b0.14 ± 0.01 b0.08 ± 0.01 a
Brod263.7 ± 6.2 a852.4 ± 29.7 a8.1 ± 0.9 a20.2 ± 4.0 a0.13 ± 0.02 b0.09 ± 0.02 a
ClayCtrl60.2 ± 0.2 c717.2 ± 7.2 c6.7 ± 0.2 b47.1 ± 8.4 a0.11 ± 0.05 a0.33 ± 0.06 a
Pdip115.9 ± 3.0 a1286.3 ± 23.9 a11.8 ± 0.5 a53.2 ± 3.9 a0.10 ± 0.03 a0.33 ± 0.08 a
Brod166.1 ± 3.7 c781.8 ± 25.5 b7.3 ± 0.6 b25.2 ± 1.0 b0.08 ± 0.01 a0.17 ± 0.01 b
Brod275.2 ± 3.5 b692.5 ± 23.0 c6.4 ± 0.5 b27.4 ± 6.3 b0.08 ± 0.02 a0.15 ± 0.03 b
Two-way ANOVAS******
P******
S × P*****ns
NERICA 4 root morphological changes under sand, clay loam, and clay soil texture and phosphorus treatments including Pdip, Brod1, Brod2, and Ctrl at 40 days after transplanting. *, p < 0.05 according to Tukey’s HSD test. Values are means ± standard deviations (n = 3). Different lowercase letters after parameter values indicate significant differences at p < 0.05 within each soil texture.
Disclaimer/Publisher’s Note: The statements, opinions and data contained in all publications are solely those of the individual author(s) and contributor(s) and not of MDPI and/or the editor(s). MDPI and/or the editor(s) disclaim responsibility for any injury to people or property resulting from any ideas, methods, instructions or products referred to in the content.

