Article

Phosphorus Fertilization Affects Morphological, Physiological and Agronomic Characteristics of Faba Bean Cultivars

by
Paschalis Papakaloudis
and
Christos Dordas
*
Laboratory of Agronomy, School of Agriculture, Aristotle University of Thessaloniki, 54124 Thessaloniki, Greece
*
Author to whom correspondence should be addressed.
Sustainability 2023, 15(17), 13172; https://doi.org/10.3390/su151713172
Submission received: 21 July 2023 / Revised: 22 August 2023 / Accepted: 28 August 2023 / Published: 1 September 2023
(This article belongs to the Special Issue Plant Nutrition, Plant-Soil Relationships and Sustainable Agriculture)

Abstract

:
Faba bean (Vicia faba L.) is an important legume crop grown worldwide, especially under rainfed conditions. Faba beans require phosphorus (P) fertilization to maintain high N2 fixation rates and to obtain high yields. However, farmers in many countries use low quantities of P because of its cost and the risk of drought, which reduces the crop’s response to P fertilization. The objective of the present study was to determine the effect of P fertilization on two faba bean cultivars, examining several key traits to identify the most efficient genotype. Seed yield was influenced by the main effect of variety, the two-way interaction between year and variety, and the three-way interaction among year, treatment, and variety. In the KK-14 cultivar, seed yield increased by 99% during the first year. Similar trends were observed for the yield components. Additionally, the morphological and physiological characteristics were affected by the fertilization treatments and the interaction between cultivars and year. Therefore, the use of appropriate cultivars, along with proper management in cropping systems, can significantly impact growth, biomass yield, and productivity under different conditions, leading to higher yields and greater economic returns for farmers.

1. Introduction

Legumes are grown worldwide due to their important benefits, since they produce nutritional and healthy products, together with their positive effect of maintaining the sustainability of the agricultural systems through N2 fixation and diversification of cropping systems [1]. Additionally, legumes rank as the second major crop family globally, following cereals, and they cover approximately 14% of agricultural land [2]. Legumes play a crucial role in producing a variety of essential products for human and animal nutrition, including cooking oil and biofuels [3]. Some of the most significant legume species cultivated worldwide include beans, peas, chickpeas, and faba beans [4].
Faba bean (Vicia faba L.) is one of the most important legume crops that is grown for its high seed protein content and adaptability to diverse conditions [5,6,7]. The grain of faba bean contains high-quality protein with numerous essential nutrients, making it valuable for animal nutrition [8,9]. Faba beans also offer farmers flexibility in cropping rotations due to their rapid growth, providing forage with high nutritive value and palatability in a short period [10]. Incorporating faba beans into crop rotations with cereals enhances soil properties such as physical, chemical, and biological aspects, reduces the incidence of diseases and pests, and diminishes the need for nitrogen fertilizers thanks to biological N2 fixation [3].
Faba bean efficiently acquires most of the nitrogen (N) it needs for growth through N2 fixation, allowing it to grow in various climatic areas [11,12]. However, symbiotic N2 fixation is an energy-intensive process, requiring 16 adenosine triphosphate (ATP) molecules to produce 2 NH3 molecules [13,14,15]. Due to its high phosphorus (P) requirements, P deficiency or low P availability in the soil become limiting factors adversely affecting nodulation, N2 fixation, faba bean growth, and productivity [16]. Overcoming P deficiency is essential to enhance the productivity of faba bean and other legumes, necessitating yearly P fertilization. Unfortunately, only a small fraction (15–30%) of the applied P fertilizer is utilized by the crop [17], leading to potential eutrophication of aquatic ecosystems and zinc deficiency in certain crops [18,19,20]. Additionally, in soils with abundant phosphorus, a significant portion of it remains unavailable for plant growth because it forms highly insoluble forms of P with soil components such as iron, zinc, aluminum, and calcium, resulting in low availability for crop plants.
While the use of P fertilizers can be part of the solution, they are expensive and can become immobilized in the soil. Moreover, global reserves of P fertilizers are depleting rapidly, and it is projected that these reserves will be exhausted in the next 30–50 years [21,22]. Hence, there is a critical need to identify and evaluate P-efficient cultivars suitable for P-limited soils, offering better growth and yields while reducing production costs and farmers’ dependence on soil amendment inputs [23]. P-efficient legume genotypes have evolved various chemical, biological, and biochemical responses to thrive in P-limited environments [24,25,26]. These responses include rhizosphere acidification, which solubilizes inorganic P, and exudation of organic anions, as well as the acquisition of phosphatase enzymes that desorb sparingly available inorganic and organic P forms [14,27,28,29]. However, the response of legumes to P fertilization can exhibit considerable variability [30,31,32]. In addition, it is important to identify key traits that can be used to identify phosphorus-efficient cultivars, as there are a number of traits (such as morphological, physiological, and agronomical [33,34,35,36] that can be used to find the most efficient genotype under low P availability which can be used by the farmers [33,34,35,36].
The objective of the present study was to evaluate the impact of phosphorus fertilization on different faba bean cultivars, evaluating morphological, physiological, and agronomical traits and to identify P-efficient cultivars suitable for dryland conditions.

2. Materials and Methods

2.1. Experimental Protocol

The experiments described in the present study were conducted for two consecutive growing seasons, 2020–2021 and 2021–2022, at the Experimental University Farm of Aristotle University of Thessaloniki, located in North Greece (40°32′12.2″ N, 22°59′29.9″ E, 2 m). The experimental field that was used over the two growing seasons had a loam soil type and the chemical properties were as follows: pH of 7.7 (1:2 H2O), ECse at 0.547 dSm−1, organic matter 1.6 g kg−1, N-NO3 15.3 mg kg−1, 4.52 mg kg−1 P (Olsen), and 204 mg kg−1 exchangeable K. The field had not been cultivated for two years, and before the experiments it was plowed, harrowed, and then a cultivator was used. Mean temperature and rainfall were recorded daily using an automatic weather station on-site, and the weather data are presented as monthly means of both growing years (Figure 1).

2.2. Crop Species and Plant Cultivars Used in the Study

During the two growing seasons, 2020–2021 and 2021–2022, two different cultivars of faba bean (Vicia faba L.) were evaluated under two different fertilization treatments in field conditions to assess their morphological, physiological, and agronomical characteristics. More specifically, the cultivars were “KK-14” and “Polycarpi”, which are both Greek cultivars with favorable characteristics to farmers and well adapted to the Mediterranean area [33].

2.3. Experimental Design and Crop Management

A completely randomized block design was used with four replications. The treatments that were used were: (1) 0 kg ha−1 P2O5 no fertilization (control) and (2) application of TSP (0-46-0) fertilizer in the amount of 60 kg ha−1 P2O5.The fertilizer was applied by hand and incorporated to a depth of 10–15 cm 10 days before sowing. The sowing of the two cultivars took place on 30 December 2020 and on 3 December 2021 by hand, at a seeding rate of 200 kg ha−1. The dimensions of the experimental area that was used were 773 m2, and each plot was 5 m × 1.25 m, covering an area of 6.25 m2. The harvest took place between 28 May and 3 June 2021 for the first growing season and 30 May and 3 June 2022 for the second growing season due to the differing maturity of the two cultivars which were used.
Weed control was performed manually or by tilling them, and no herbicides were used. Pest control was achieved with Deltamethrin 500 mL ha−1 and Imidacloprid 1250 mL ha−1. Various characteristics were measured, including morphological, physiological, and agronomical characteristics, as well as seed yield and seed yield components. Representative plants from the middle row of each plot were selected for these measurements. The representative plants were in the same growth stage, with healthy leaves at full growth. All measurements were conducted from March up to May for both years of the study. In total, four measurements were conducted: the first one before anthesis, the second one at the beginning of the anthesis, the third one at full bloom, and the last one at the physiological maturity of the plants.

2.4. Morphological Characteristics

2.4.1. Plant Height

Plant height was determined from five plants from each plot that were selected randomly, located in the middle rows with a measuring tape. The average value of plant height for each plot was obtained from the five measurements.

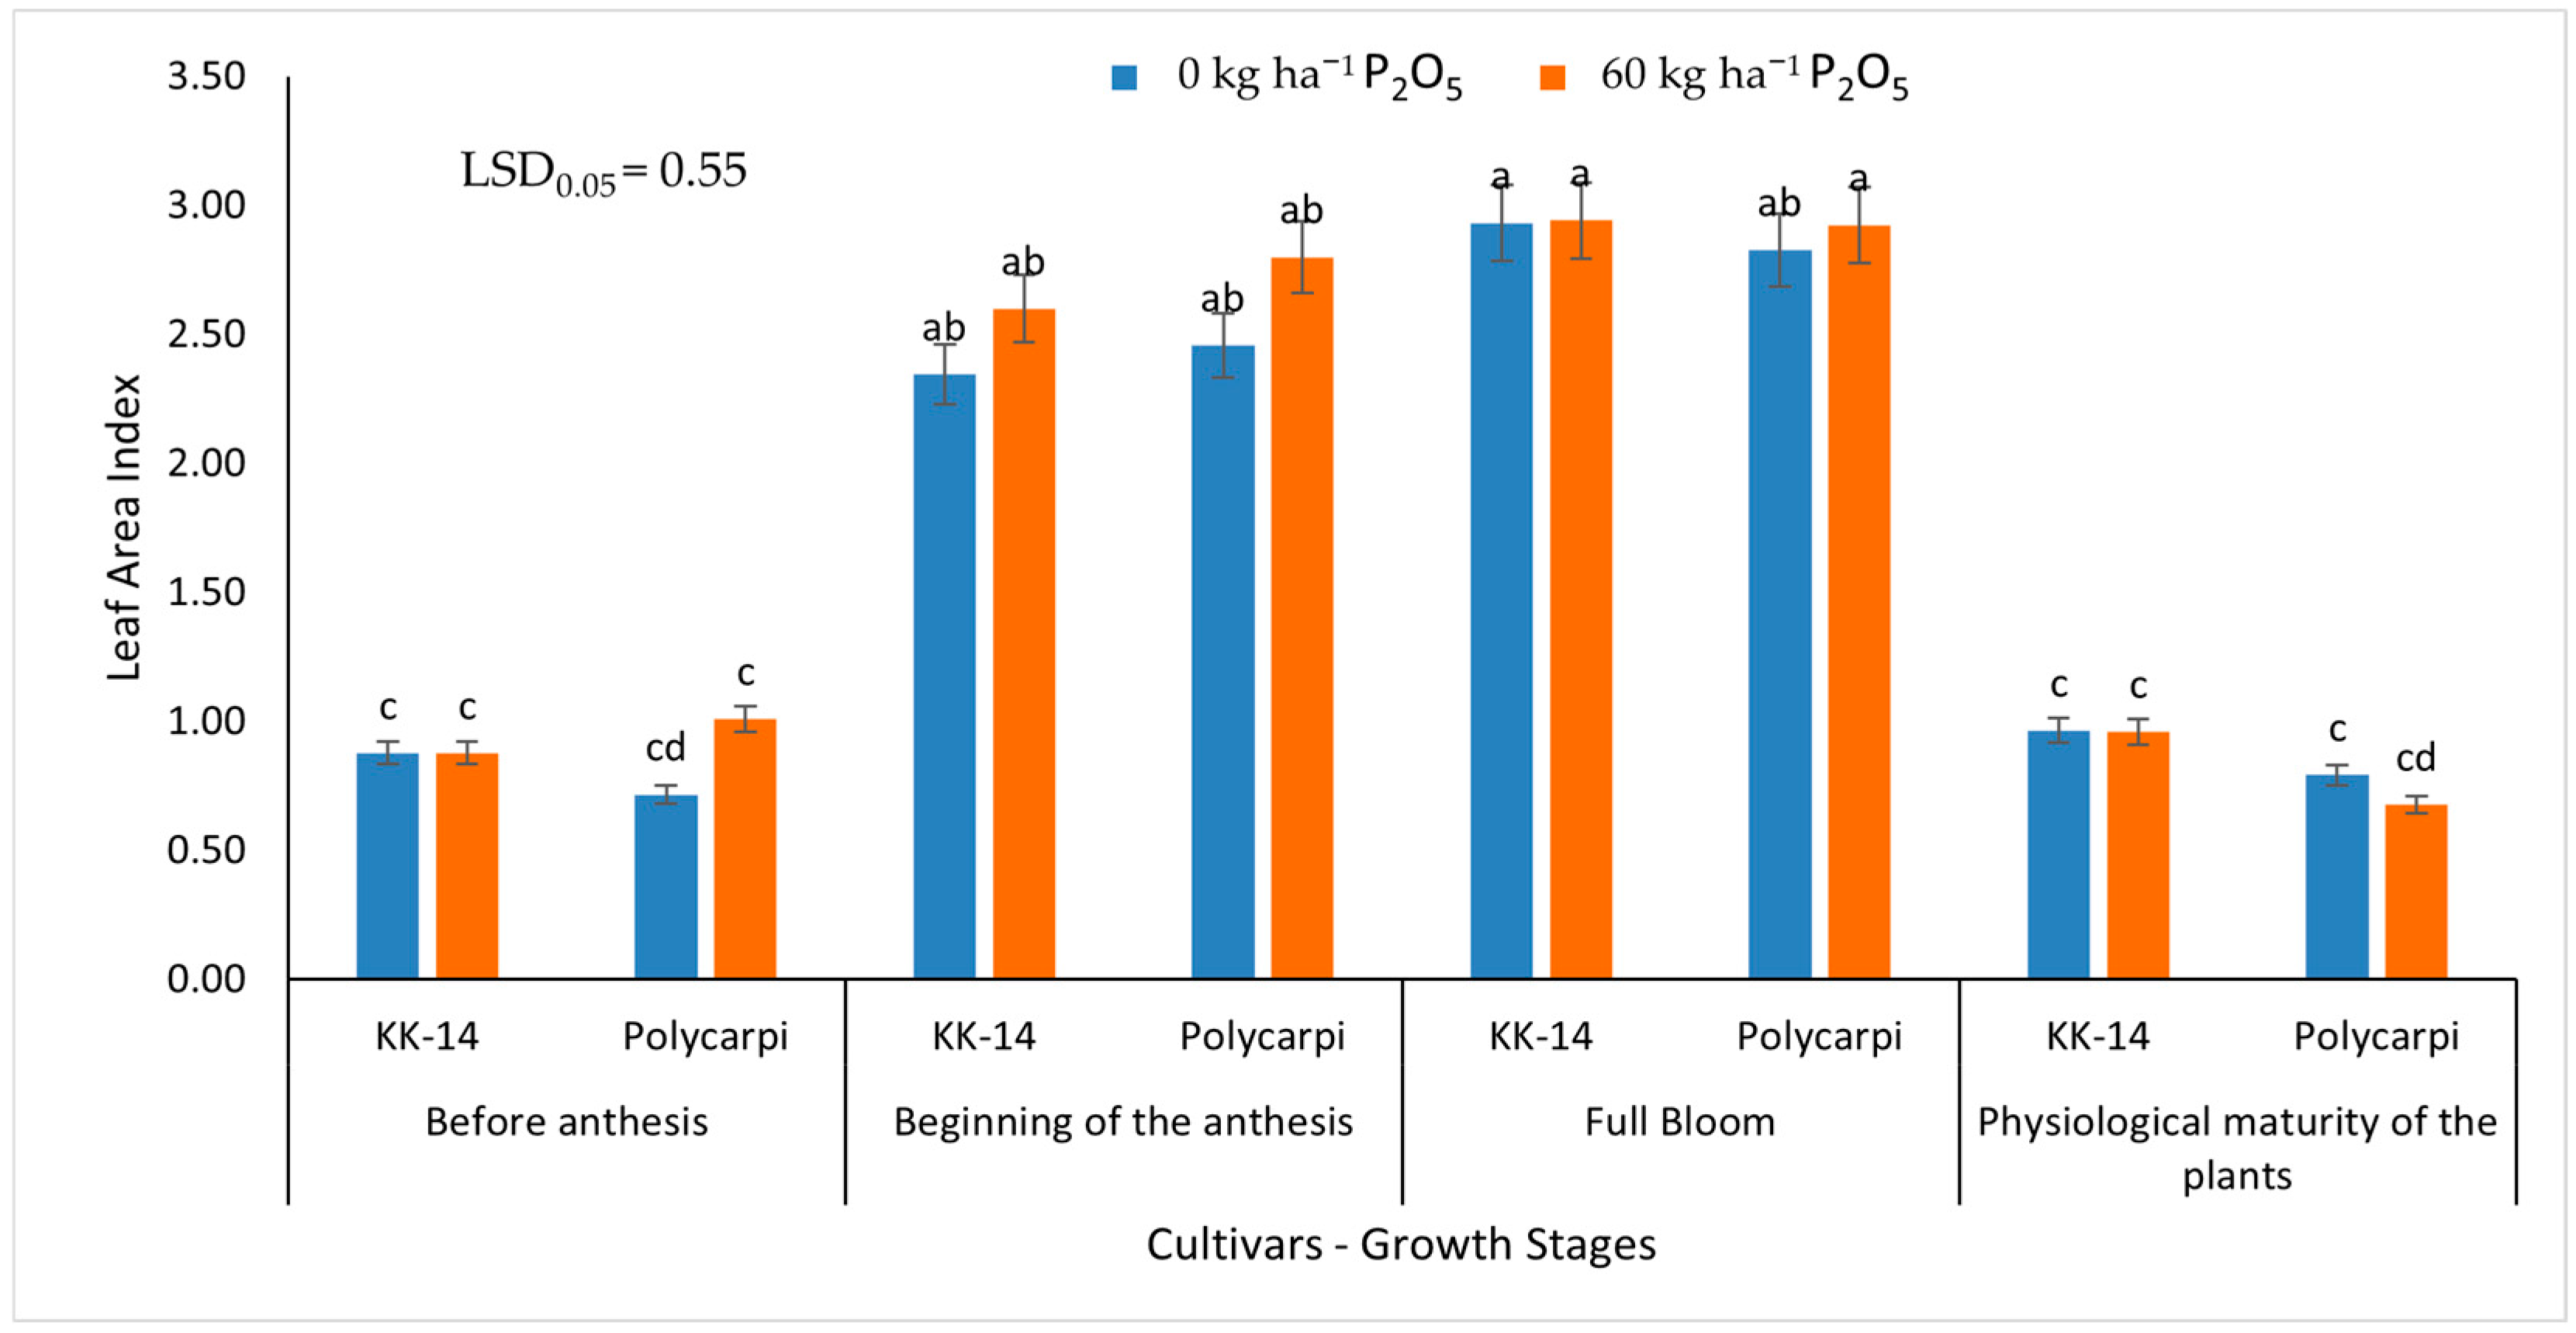
2.4.2. Leaf Area Index

Leaf area index (LAI) was determined nondestructively using the AccuPAR, LP–80 device (Decagon Devices, Inc., Pullman, WA, USA). The device comprises of a microprocessor, an external sensor with 1 m length which records Photosynthetically Active Radiation (PAR) and a data recorder. For the determination of LAI, one measurement was taken above the plants’ canopy for the PAR estimation in the 400–700 nm waveband in units of micromoles per meter squared per second (μmol m−2 s −1). Subsequently, at soil level, three measurements were taken following the recommendations from the manufacturer. The mean value of these measurements was used as the value of LAI. The measurements were conducted between 11 a.m. and 1 p.m.

2.5. Physiological Characteristics

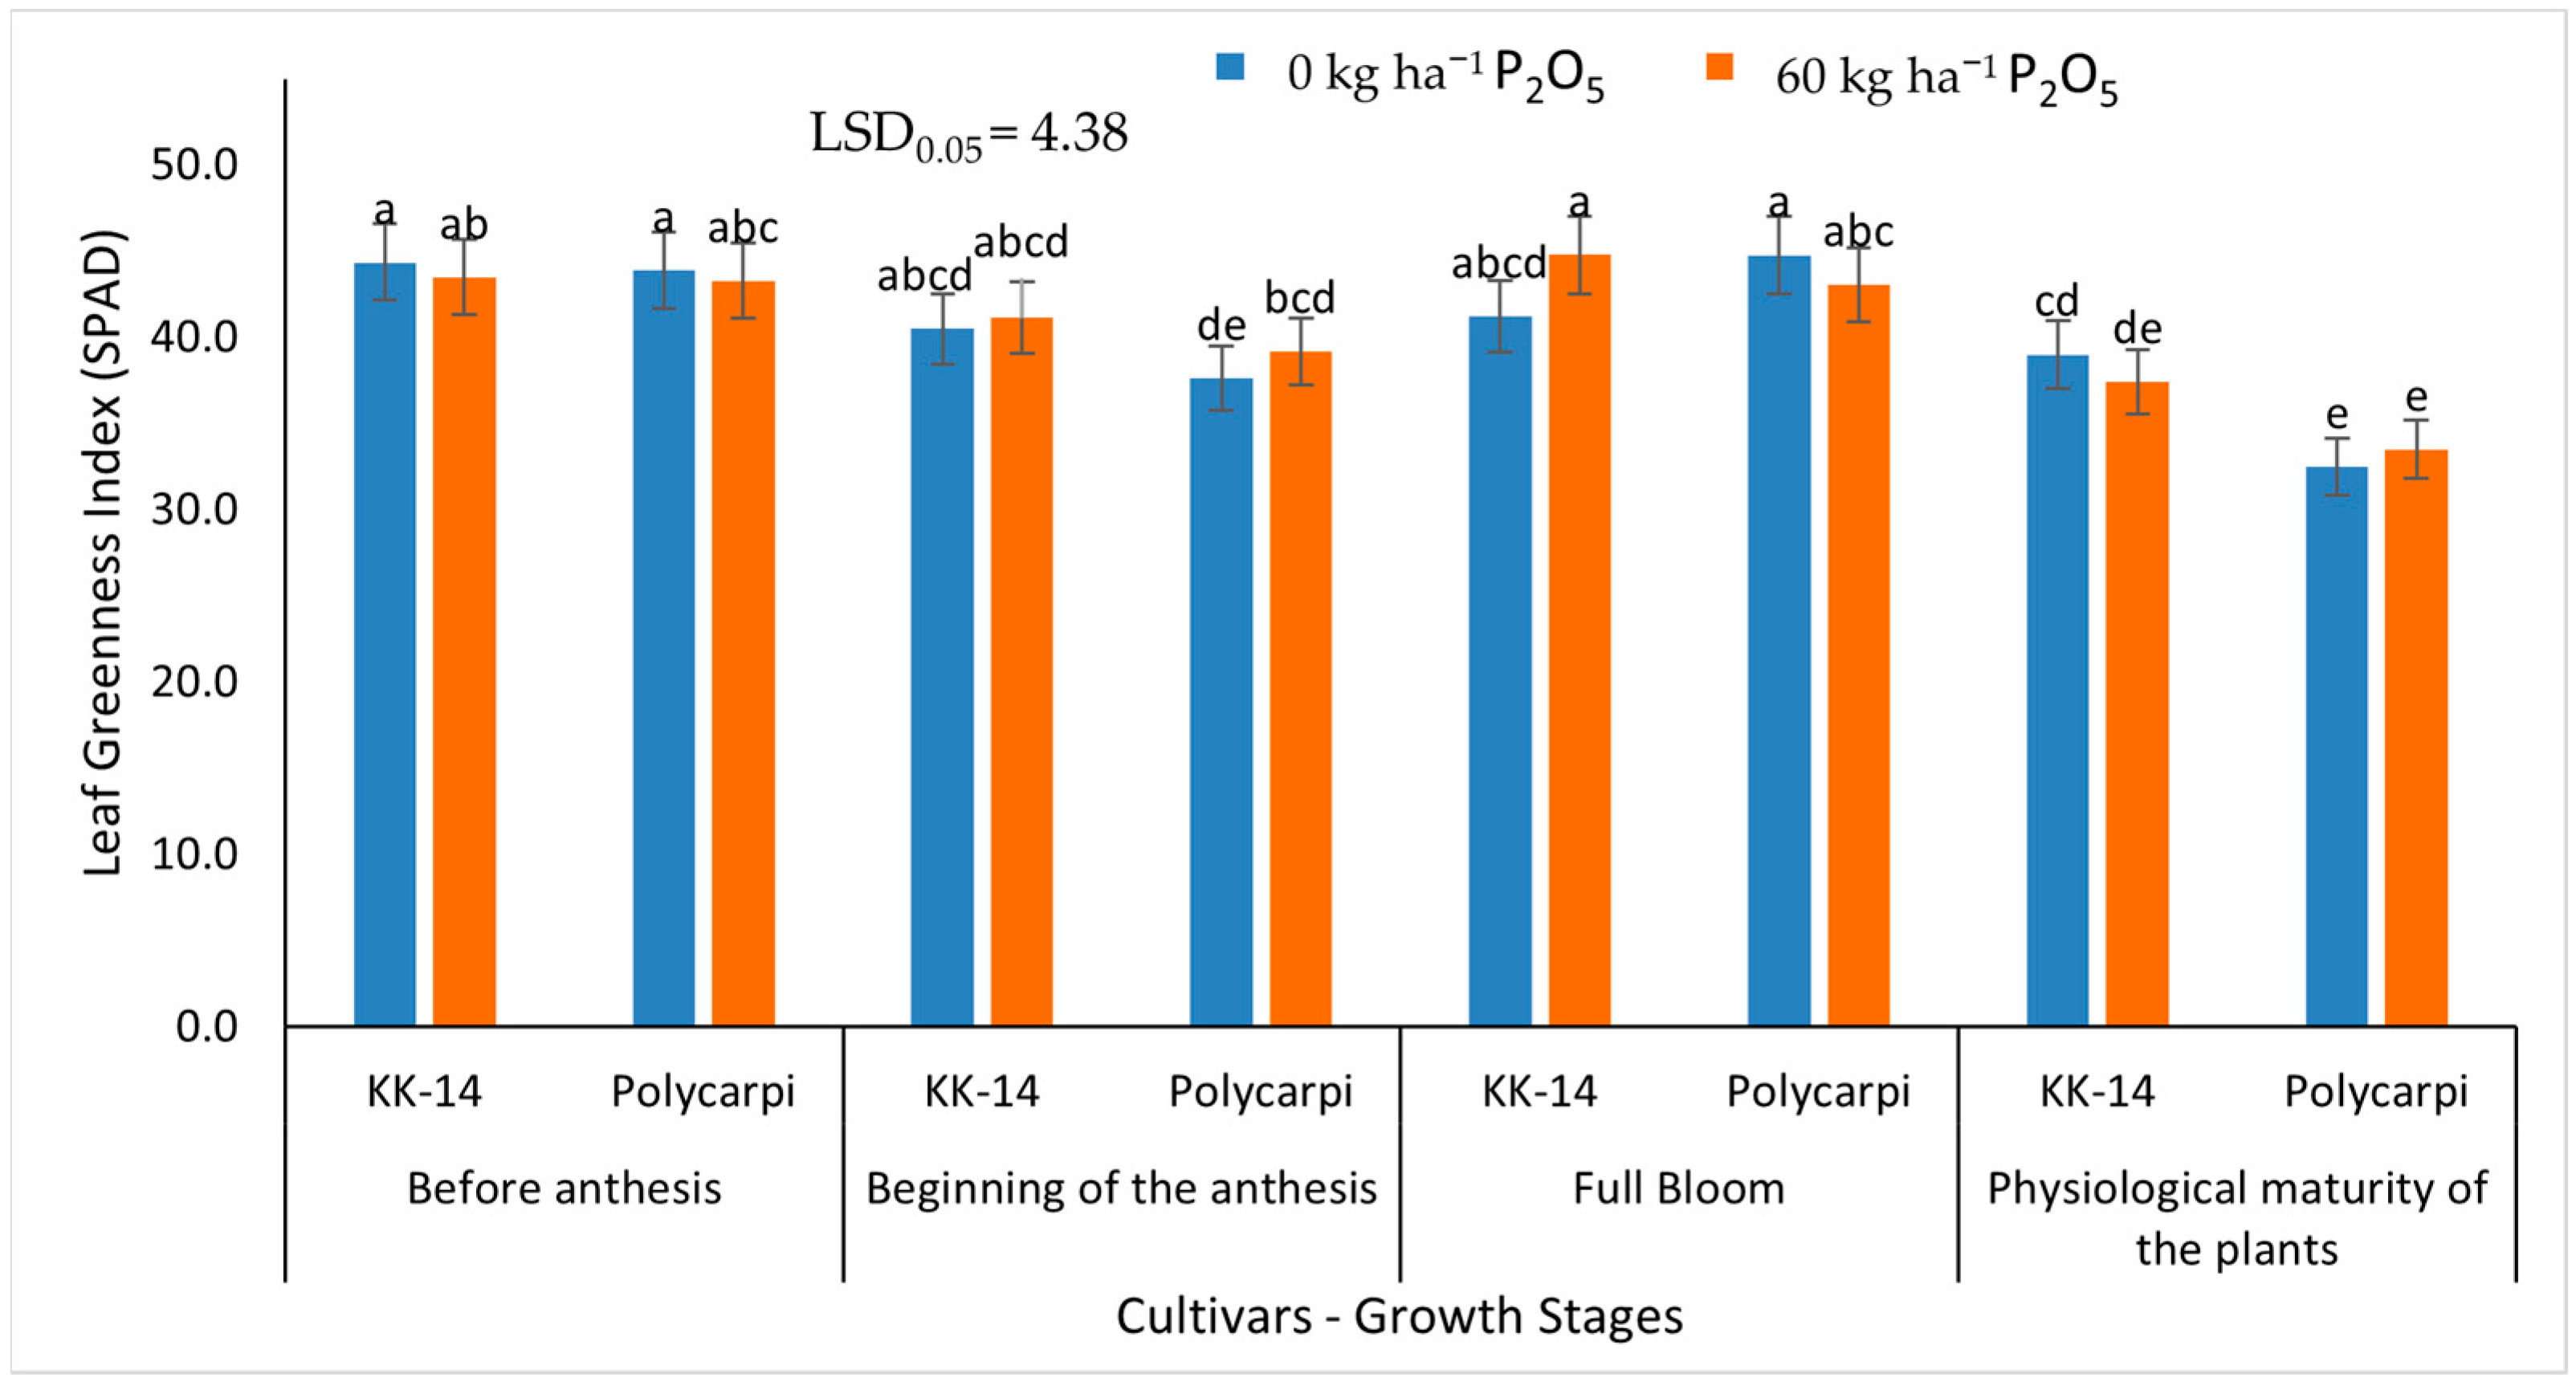
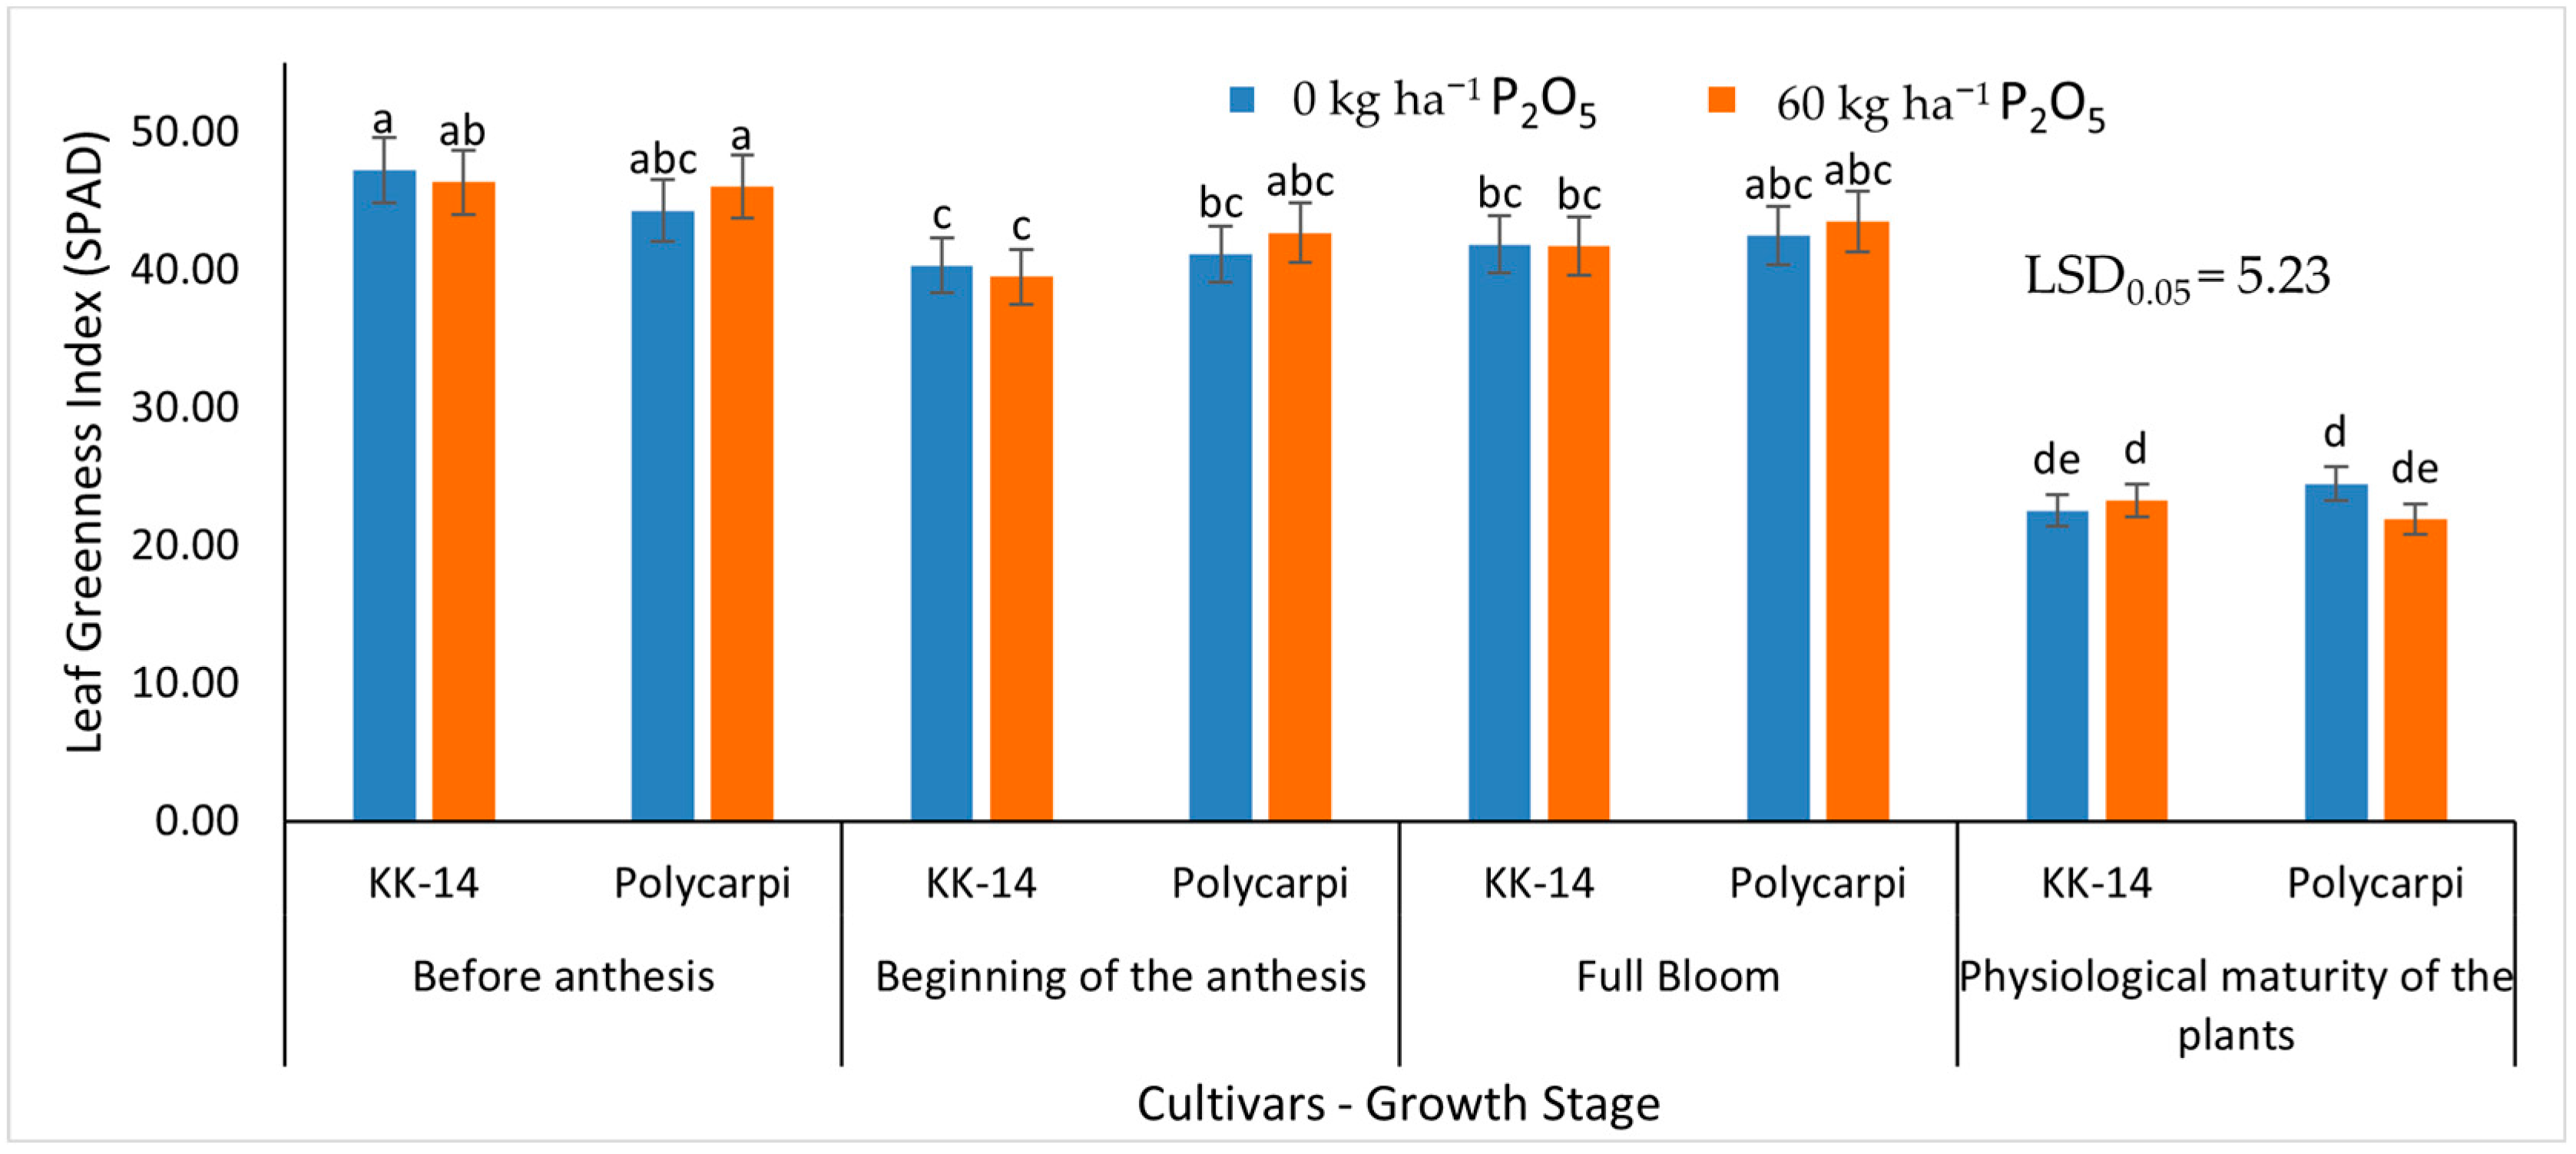
2.5.1. Leaf Greenness Index (SPAD)

A dual-wavelength meter handheld (SPAD 502, Chlorophyll meter, Minolta Camera Co., Ltd., Tokyo, Japan) was used to measure the leaf greenness index. The device calculates the content of leaf chlorophyll, which absorbs maximum at two different wavelengths (400–500 nm and 600–700 nm) and zero absorption in the near-infrared region. For each measurement, a total of 25 leaves from different plants from the central rows of each plot were used. The average value of these plants constitutes the chlorophyll content at each of the three growing stages of the plants where the measurements were held.

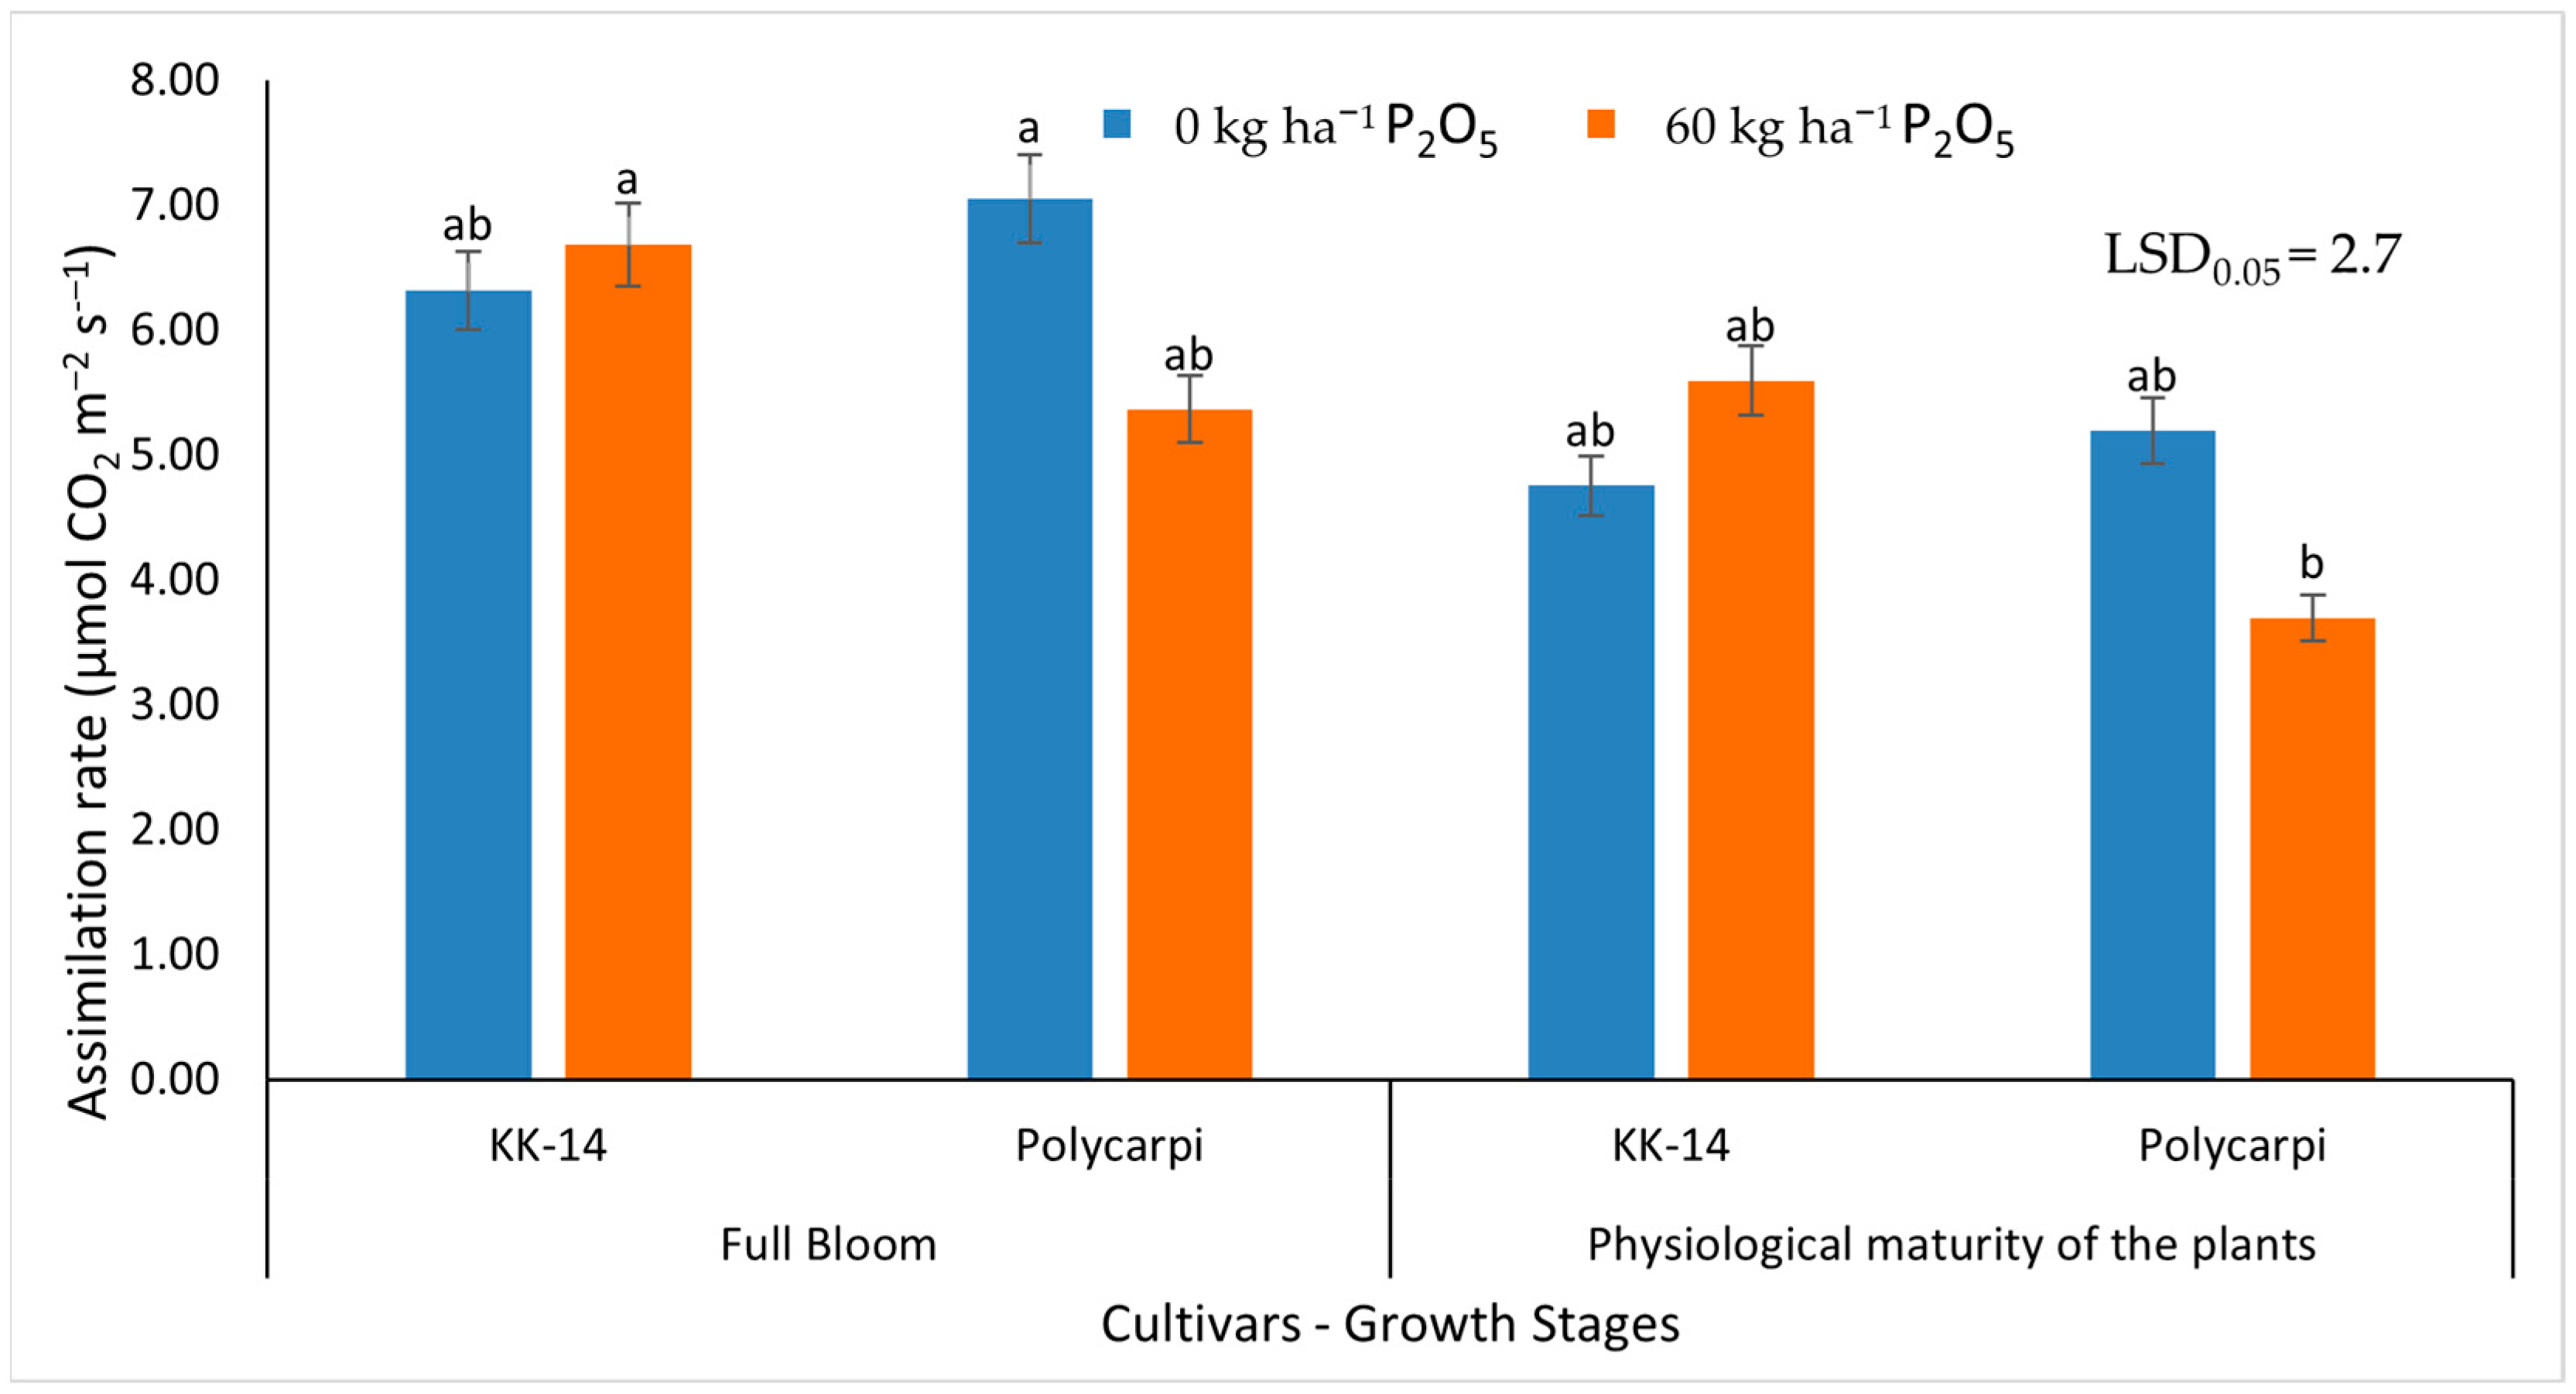
2.5.2. Gas Exchange Measurements

A portable photosynthesis system (LCi-SD, ADC BioScientific Ltd., Hoddesdon, UK) was employed to assess the gas exchange parameters of the plants. These parameters encompassed the assimilation rate (A), the transpiration rate (E), the stomatal conductance (gs), and the concentration of intercellular CO2 (Ci). From each plot’s central rows, five plants were chosen. The measurements were conducted during two growth stages (full bloom and physiological maturity) between 10:00 a.m. and 1:00 p.m. For each plot, the parameter value was determined as the mean of the five measurements.

2.6. Seed Yield and Yield Components Determination

In both years of experimentation, all cultivars reached maturity concurrently, leading to the harvest occurring at the full-maturity stage. This procedure was carried out to ascertain the seed yield of the plants from the middle rows of each plot. All cultivars were gathered, and the LD 350 laboratory thresher (Wintersteiger AG, Ried im Innkreis, Austria) was utilized to extract the seeds.
The yield components (seeds per pod, pods per plant) were established by quantifying the pod and seed count from five plants in each plot’s inner rows during harvest. In addition, seed yield was obtained by weighting the seeds of each experimental plot after threshing and cleaning them.

2.7. Water Use Efficiency

The WUE was determined by dividing the seed yield from each plot by the rainfall that the crop received during the growth period [34].

2.8. Phosphorus Use Efficiency

The calculation of phosphorus use efficiency (PUE) was based on an equation adapted from Moll et al. [35], originally designed for nitrogen but also applicable to phosphorus. The equation that was used was:
PUE = SY/Pavailable
where:
SY: is the seed yield;
Pavailable = Psol + Padded as fertilizer;
Psol: denotes the phosphorus supply sourced from the soil itself, estimated as follows:
Psol = d × S × Z × P(sol);
d: dry bulk density (1.2 g cm−3);
S: total area (1 ha);
Z: approximated rooting zone for mineral nutrition (30 cm);
and P (sol) represents phosphorus content as indicated by the Olsen method (mg P kg−1 sol).
We estimated soil supply by 16.27 kg ha−1 P for both years.

2.9. Statistical Analysis

Data for height, LAI, SPAD, and gas exchange measurements were subjected to analysis using the ANOVA method. This analysis followed a 2 × 2 × 2 × 4 experimental design within a Randomized Complete Block Design framework. The experiment included four factors in a split-split-split plot arrangement, with four replications (blocks) per treatment combination (years × fertilizer treatments × cultivars × growth stages). The years were considered as main plots, fertilization treatments as sub-plots, faba bean cultivars were categorized as sub-subplots, and growth stages as sub-sub-sub-plots.
The data pertaining to seed yield, number of seeds per pod, and number of pods per plant were subjected to analysis following a 2 × 2 × 2 experimental design utilizing the Randomized Complete Block Design framework. In this case, the experiment consisted of three factors, organized within a split-split plot arrangement, with four replications (blocks) per combined treatment (years × fertilizer treatments × cultivars). According to this arrangement, the two years were considered as main plots, the two fertilization treatments were considered as sub-plots, and the two faba bean cultivars were considered as sub-sub-plots. The main purpose of utilizing the ANOVA method was to correctly compute standard errors that account for the variations among the mean values of treatment combinations. For assessing differences among treatment means, the “protected” Least Significant Difference (LSD) criterion was utilized. Throughout all hypothesis testing procedures, the predetermined level of significance was set at p ≤ 0.05. All the data were analyzed by using the SPSS software package (version 25, SPSS Inc., Chicago, IL, USA).

3. Results

Between the two growing seasons of the experiment, 2020–2021 and 2021–2022, there was significant variation in weather conditions, primarily in terms of the distribution of rainfall (Figure 1). In the first season, total rainfall during December, January, and April was considerably higher compared to the second growing season, where the largest amounts of rainfall were reported during the months of February, March, and June. Average monthly temperatures fluctuated at similar levels for both years. The combined ANOVA over the years revealed that (Supplementary Materials) most of the evaluated characteristics were influenced by the main effects of years and growth stages. Additionally, the two-way interactions of treatment × year, treatment × cultivar, year × cultivar, and year × growth stage, as well as the three-way interaction of year × treatment × cultivar, played significant roles.

3.1. Morphological Characteristics
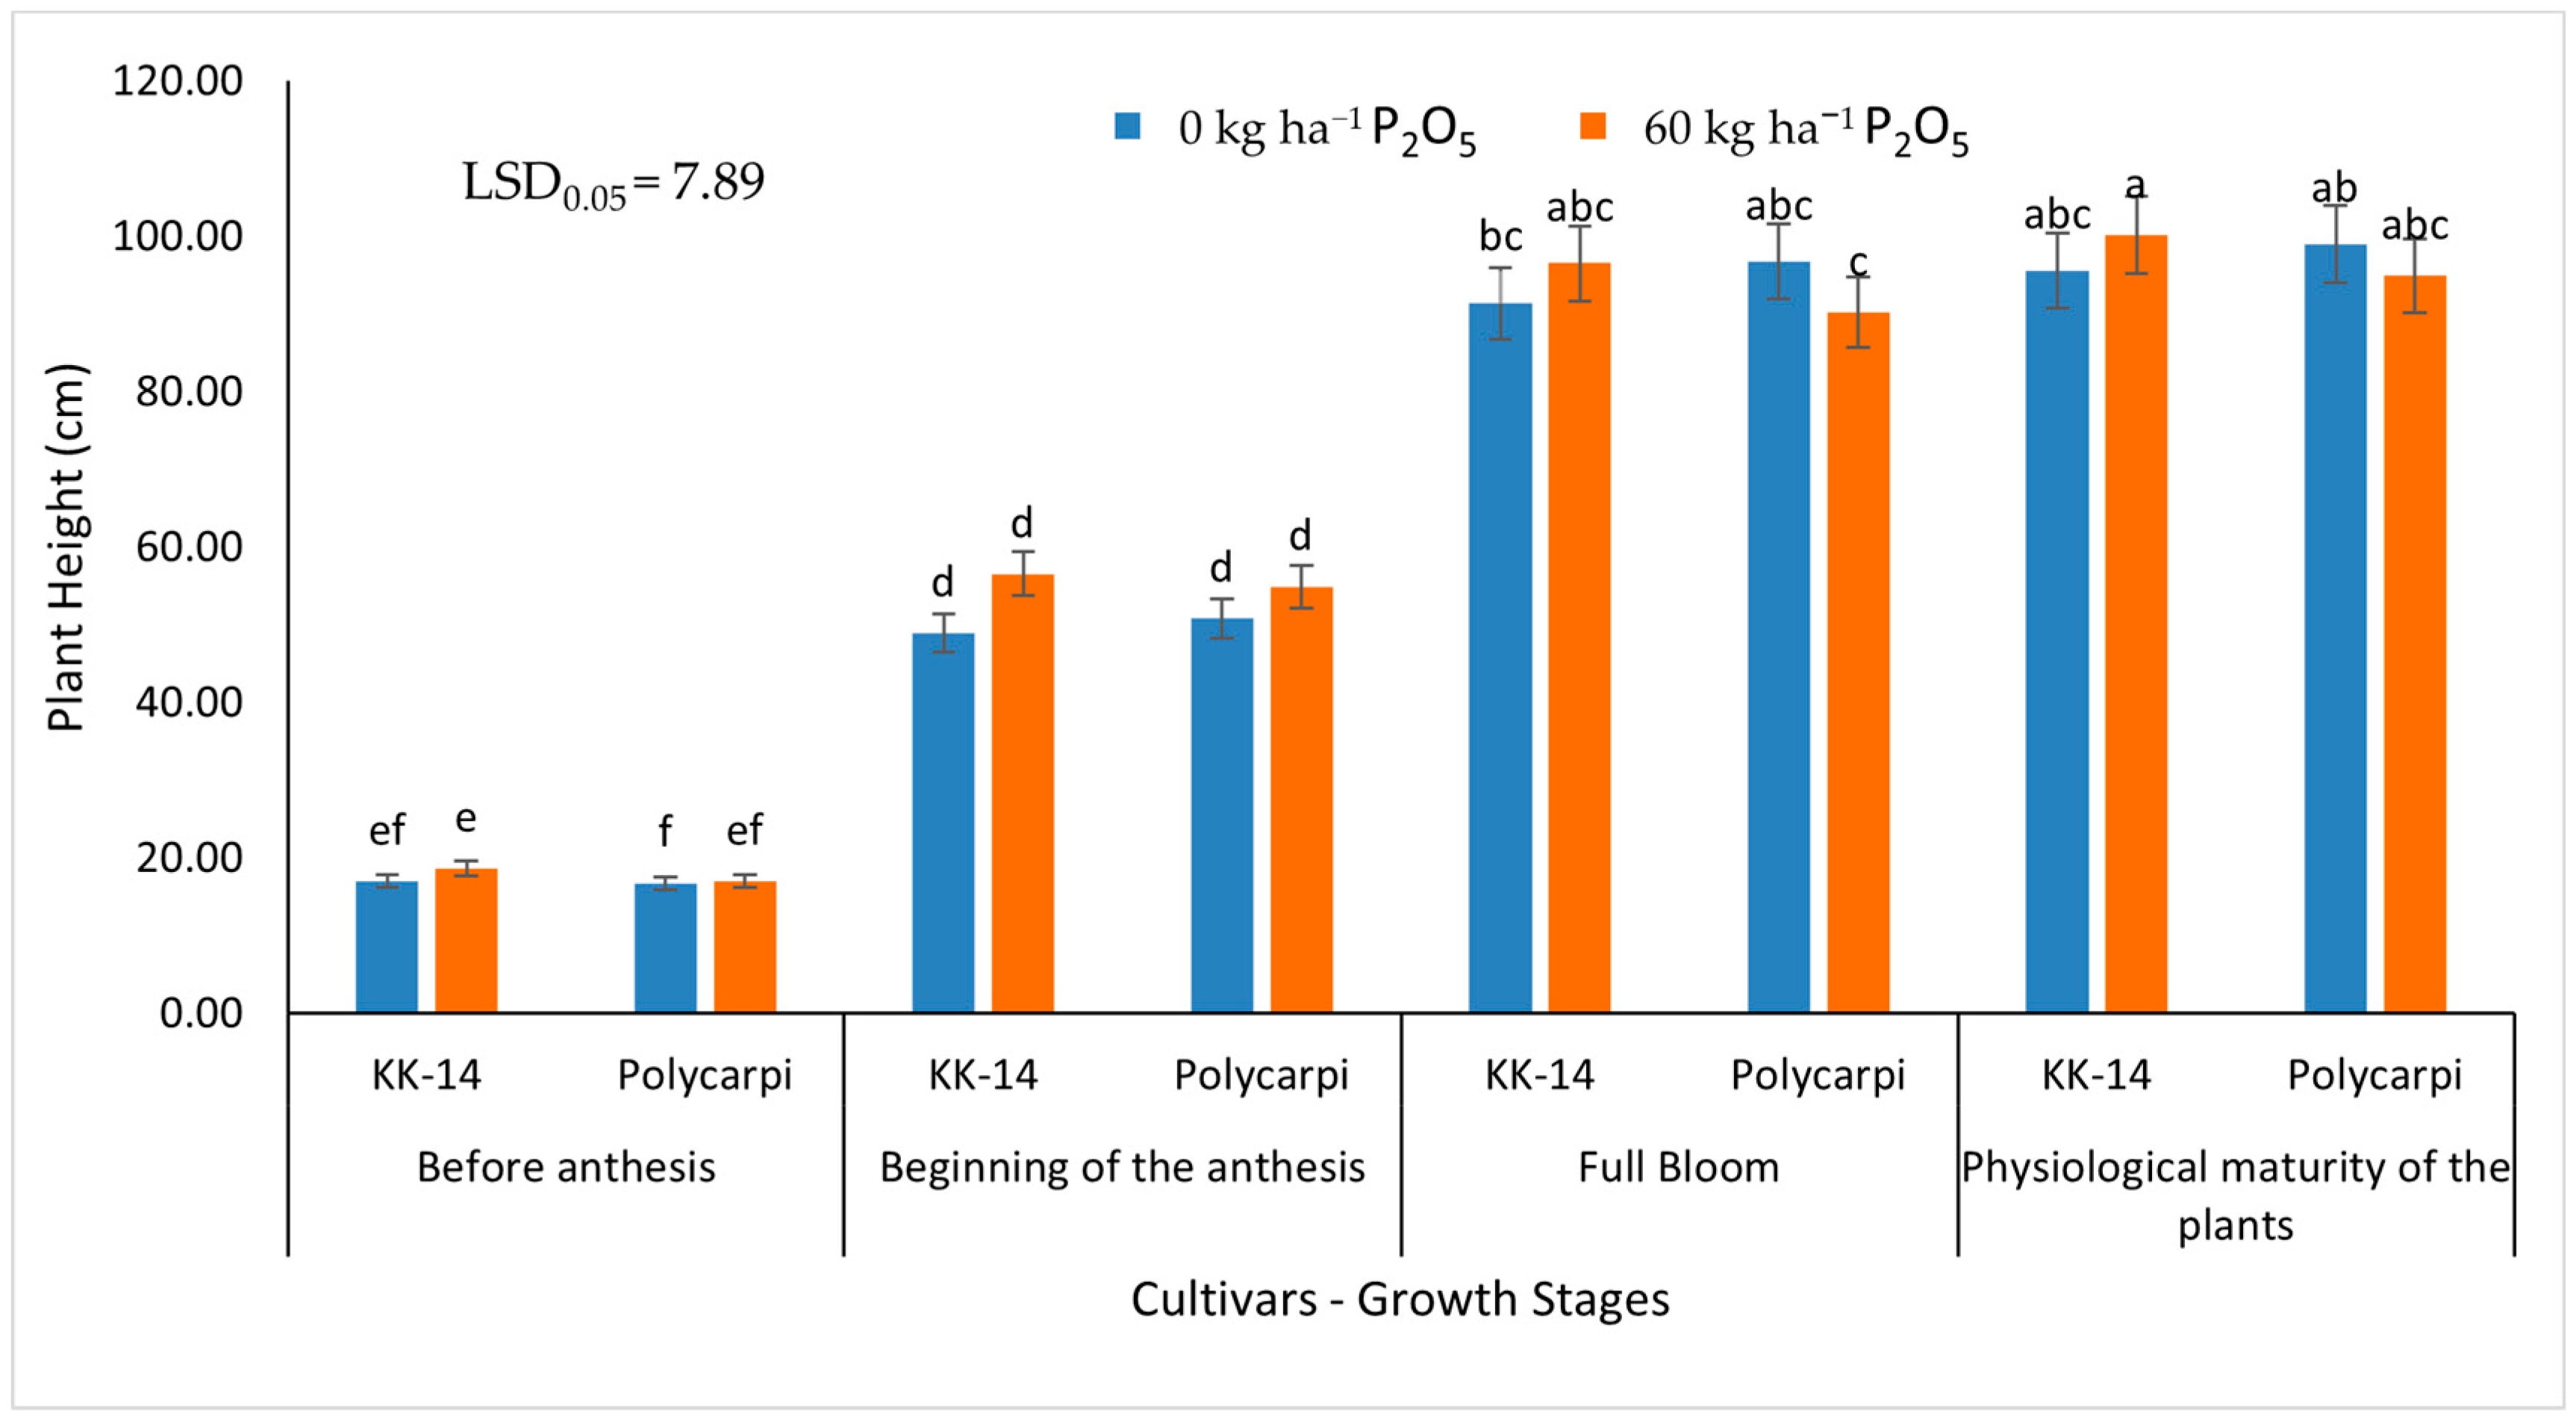
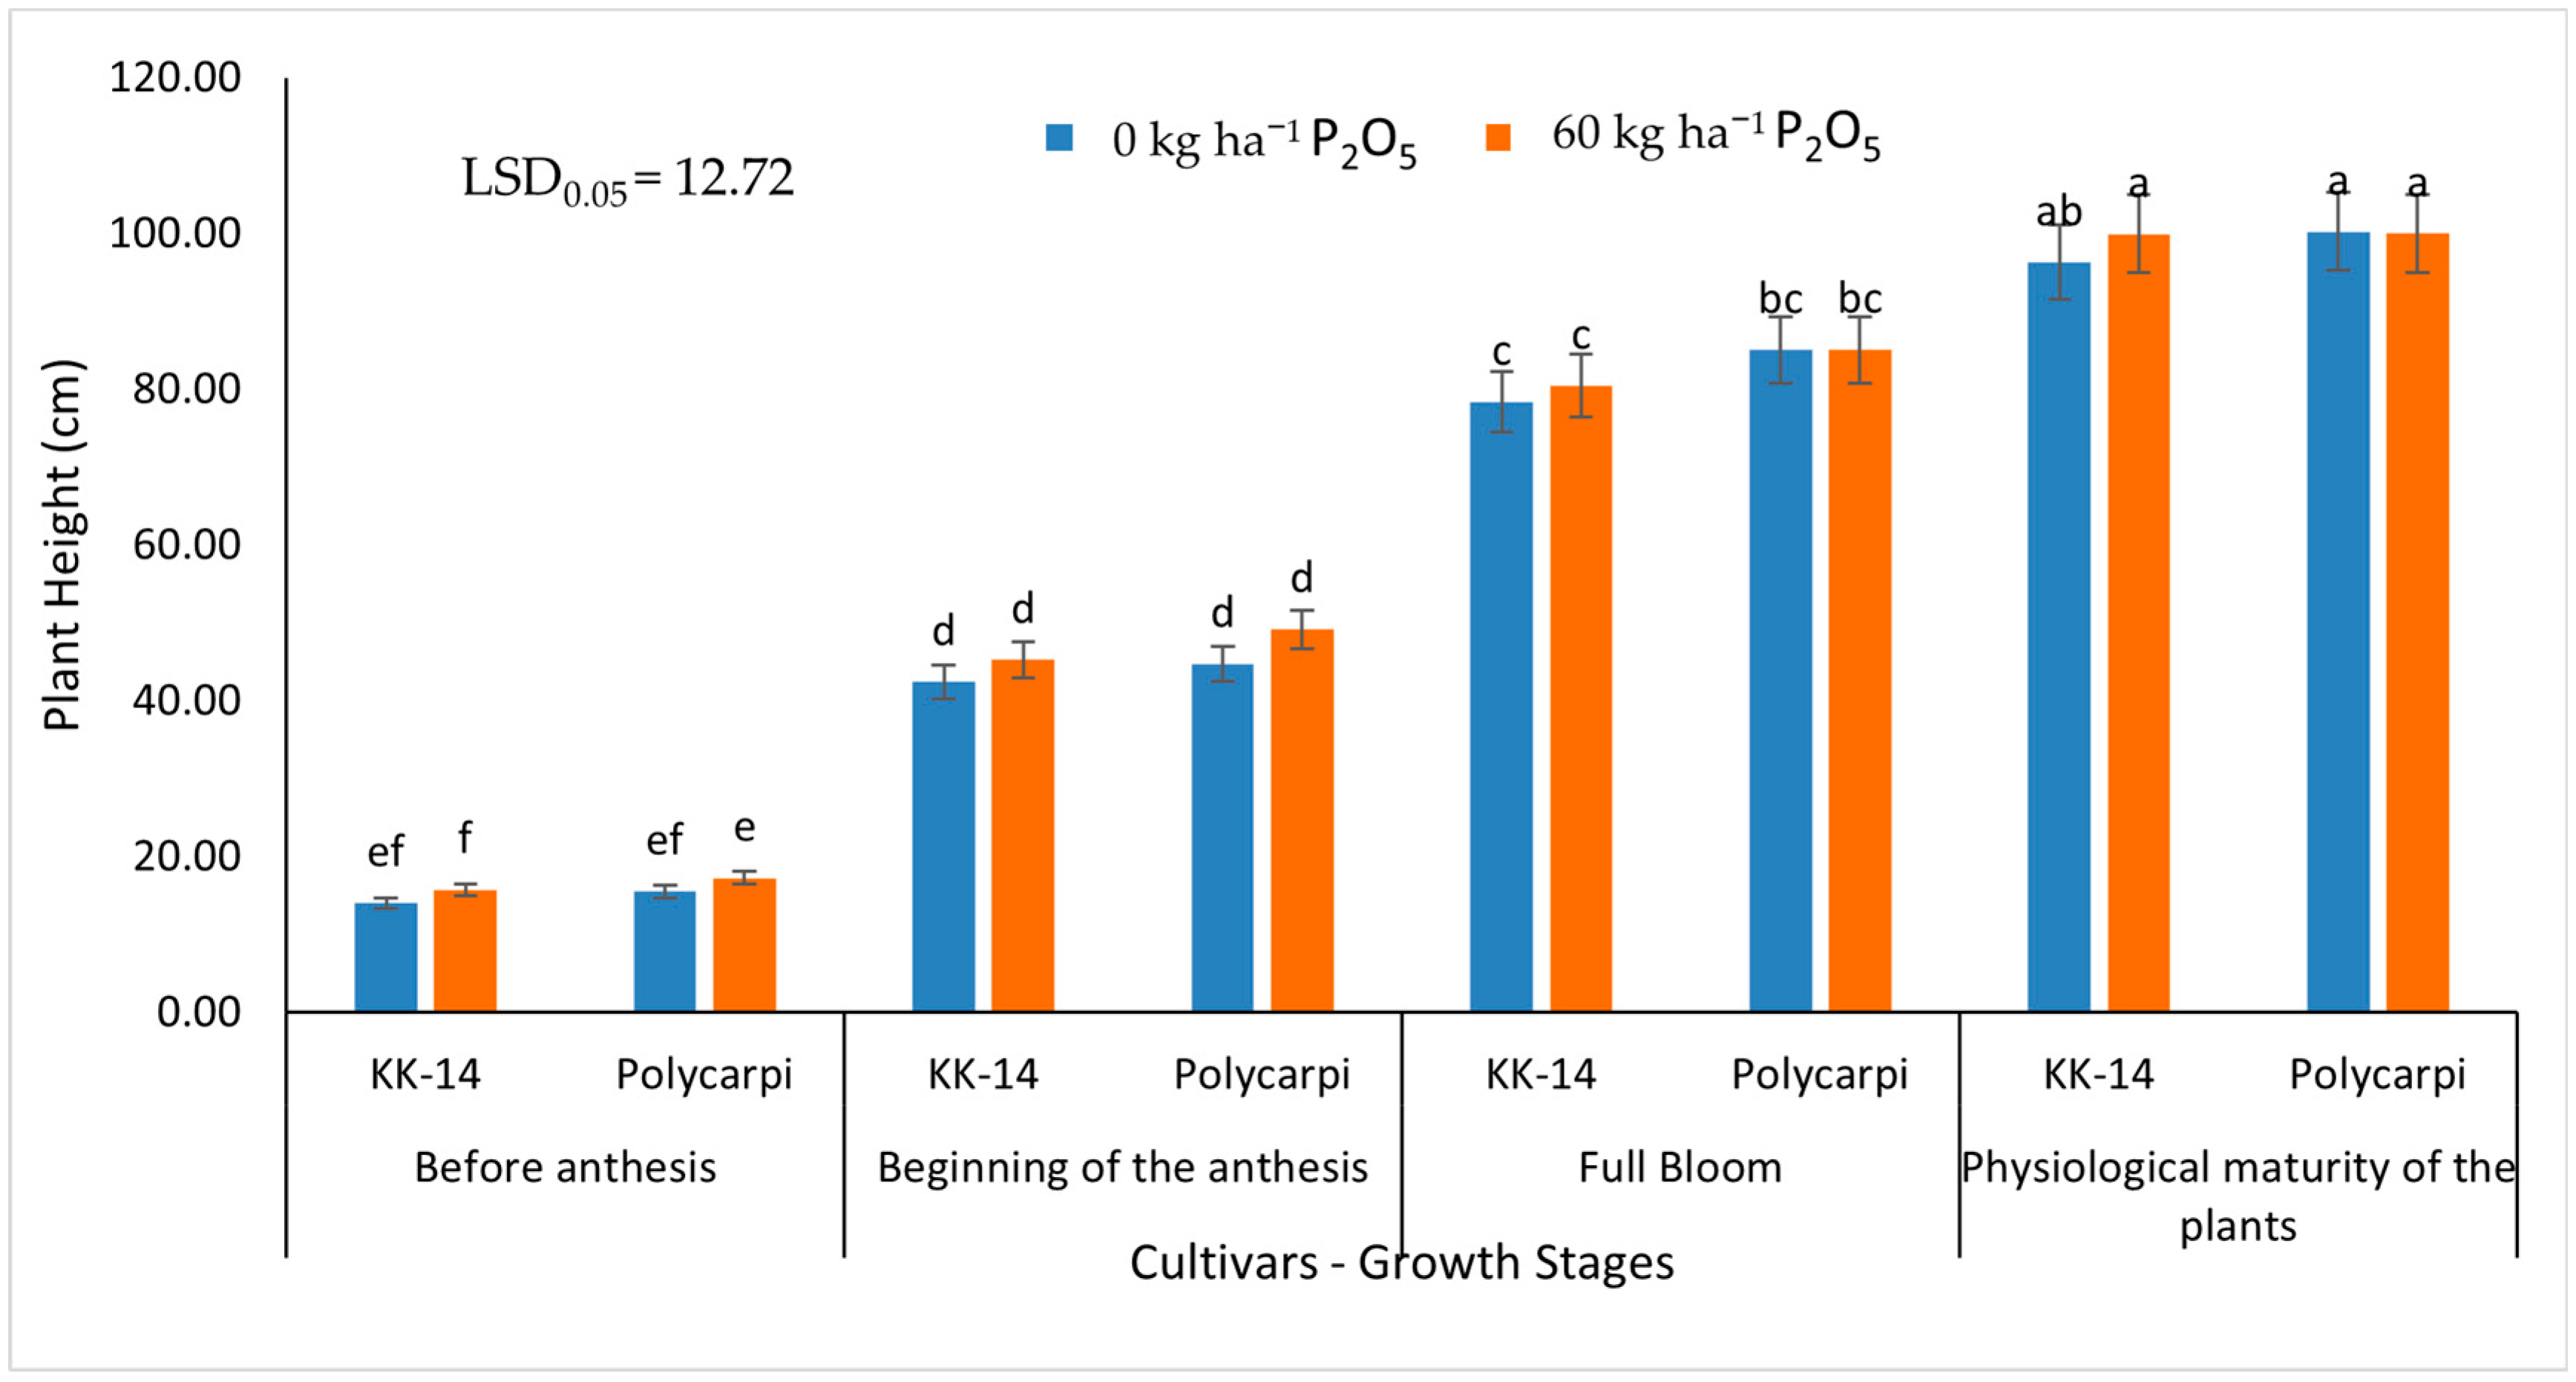
3.1.1. Plant Height

Plant height was significantly influenced mainly by the following factors: the year, growth stage, and the interactions year x cultivar, treatment x cultivar, and year x growth stage. Specifically, during the year 2020–2021, the tallest plants were recorded at the physiological maturity stage for both varieties, KK-14 and Polycarpi (100.2 cm and 99 cm, respectively). In the cultivar KK-14, the tallest plants were observed in the 60 kg ha−1 of P2O5 fertilizer treatment, whereas for the cultivar Polycarpi, the tallest plants were found in the absence of phosphate fertilization (Figure 2). In the second year, the plants from both varieties, KK-14 and Polycarpi, were tallest in the 60 kg ha−1 of P2O5 treatment at the growing stage of physiological maturity of the plants (99.9 cm and 100.2 cm, respectively) (Figure 3). Furthermore, it was evident from both years that the KK-14 cultivar responded positively to the phosphate fertilization treatment, as taller plants were observed in this cultivar from the early stages of development in the field until crop harvest, with the highest difference of 15% between the two fertilization treatments during the first year at the beginning of anthesis. On the contrary, in the Polycarpi cultivar, the plants did not show significant height differences between the two fertilizer treatments.

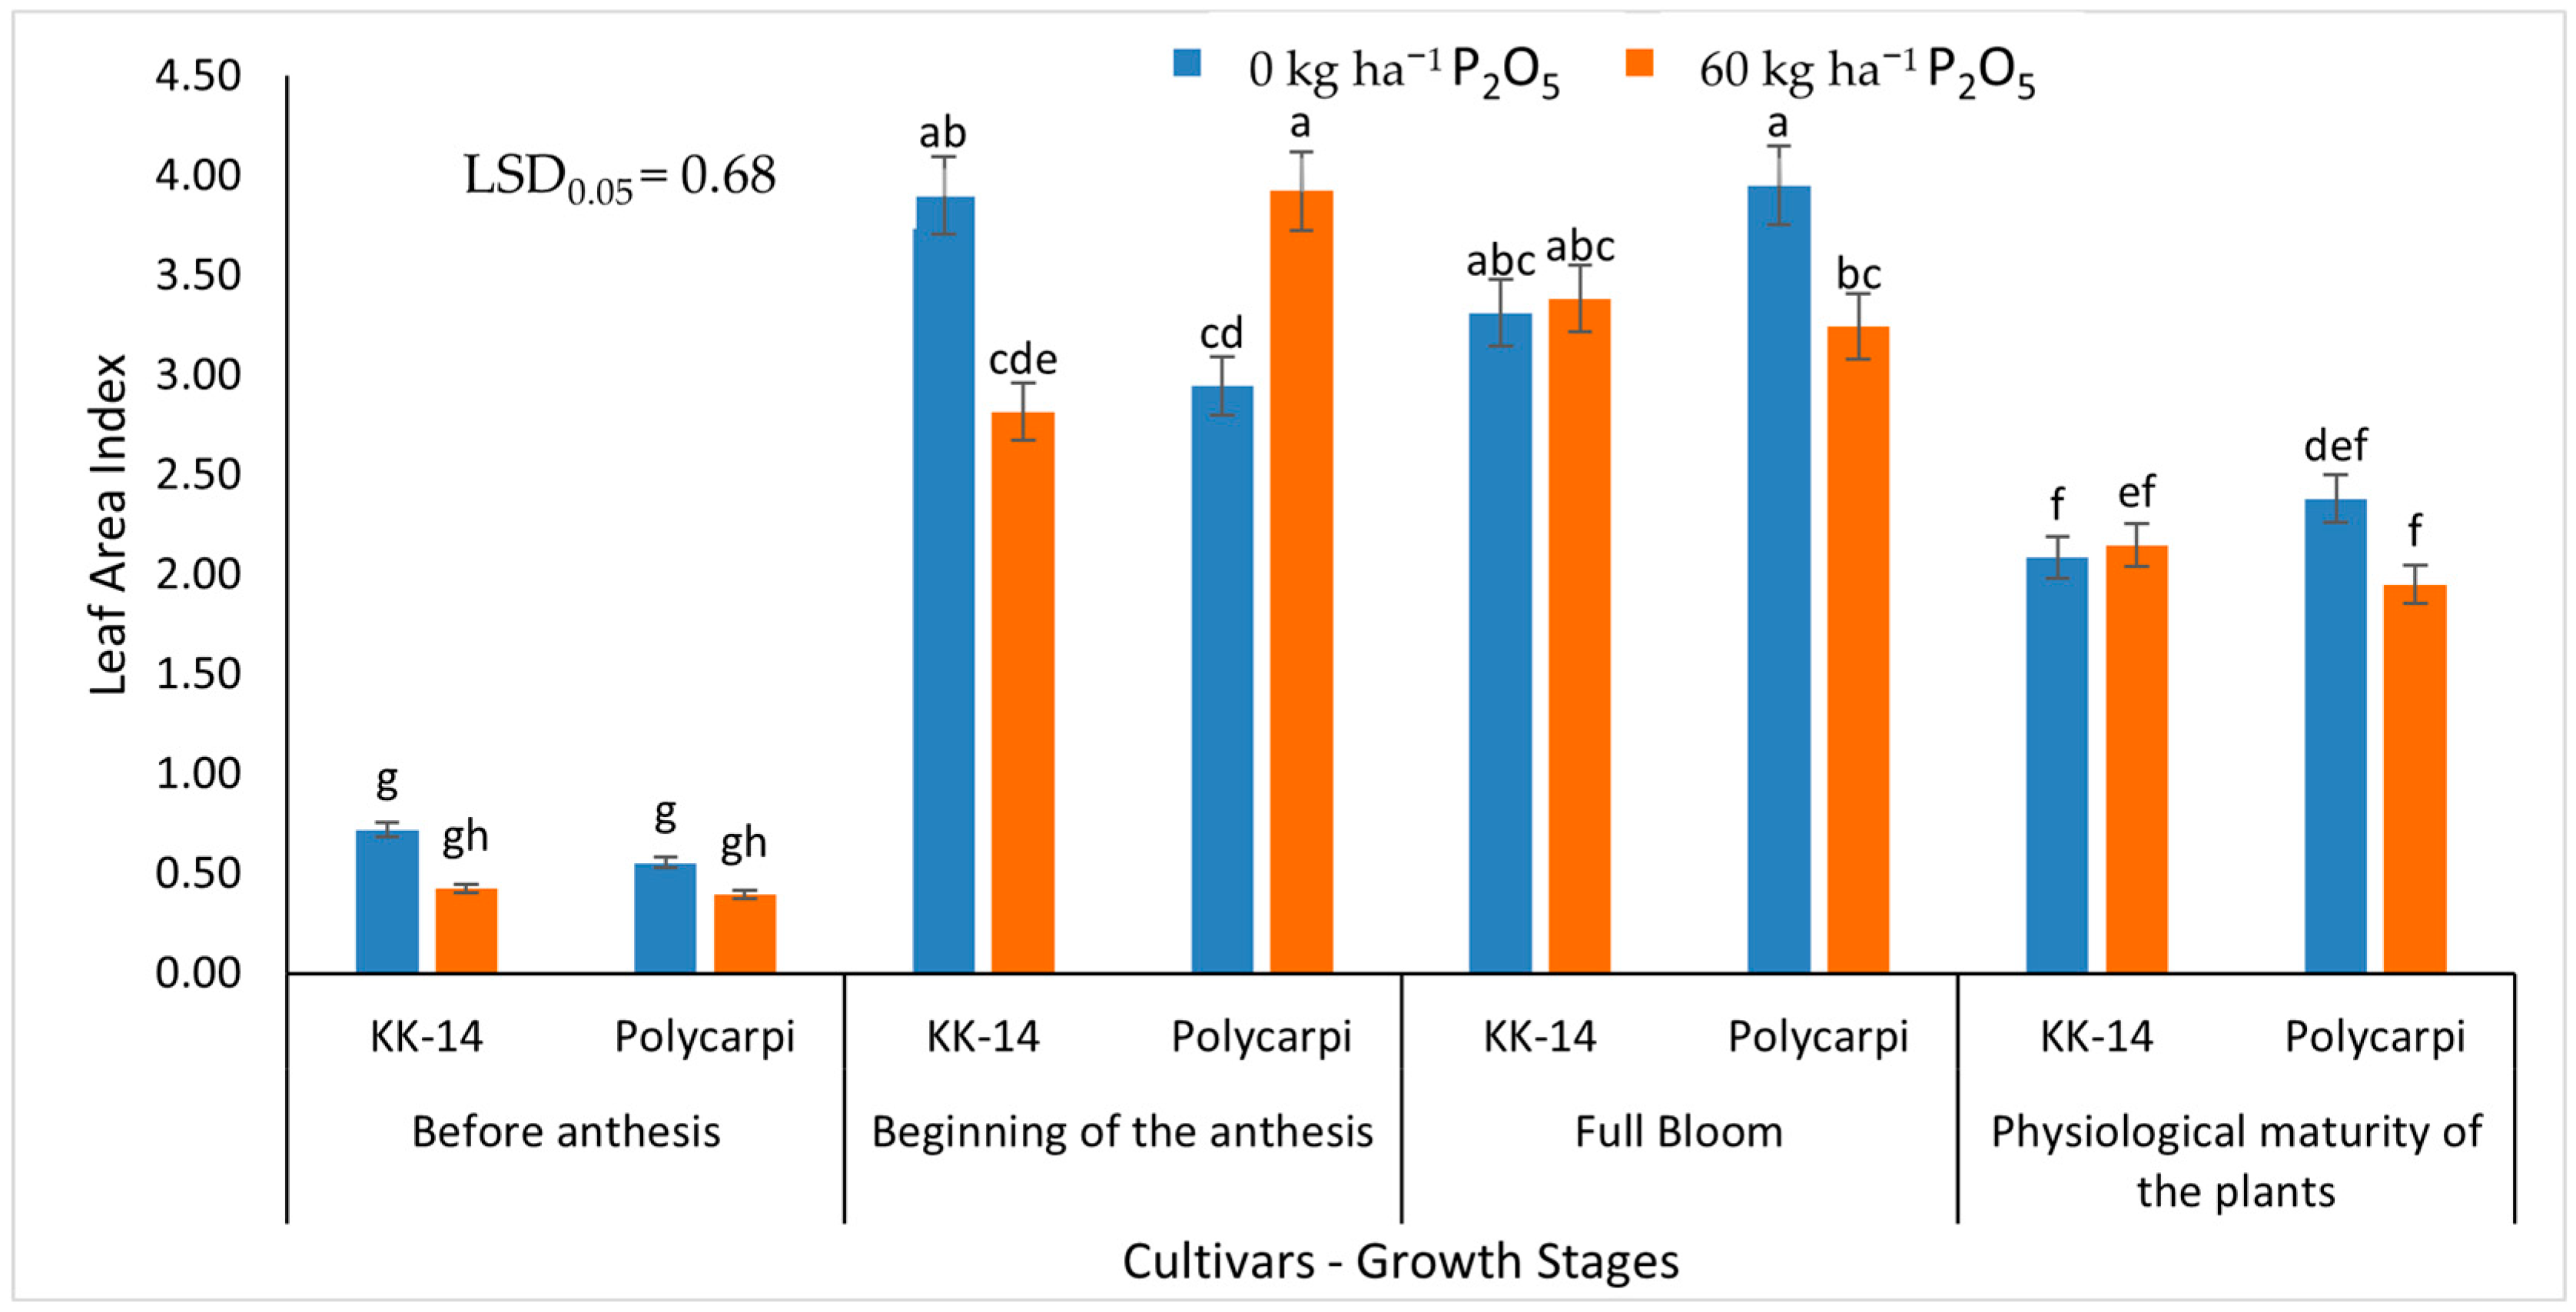
3.1.2. Leaf Area Index

Leaf area index was influenced by the year, the growth stage, the two-way interaction year × growth stage, and the three-way interaction treatment × cultivar × growth stage. LAI showed an increase from the beginning of the flowering until the stage of full bloom for both years (Figure 4). Furthermore, in the first growing season, 2020–2021, the values of LAI in KK-14 were higher (3.91) when the P2O5 treatment was 0 kg ha−1, in contrast to 2.81, when 60 kg ha−1 of P2O5 were added at the beginning of the anthesis; while, in full bloom, the treatments showed similar LAI values (3.31 and 3.38, respectively). On the other hand, it was found that Polycarpi had a larger LAI (40% more than the control) at the beginning of anthesis (Figure 5). In the second year, 2021–2022, both faba bean cultivars gave higher LAI values at the stage of full bloom and also at the 60 kg ha−1 of P2O5 fertilizer treatment.

3.2. Physiological Characteristics

3.2.1. Leaf Greenness Index (SPAD)

Leaf greenness index (SPAD) was influenced by the year, cultivar, and growth stage, and the two-way interactions of year × cultivar and year × growth stage. The highest values of SPAD index were found in the first growing season, 2020–2021, on the KK-14 cultivar in all stages, except for full bloom, where Polycarpi gave a higher index value in 0 kg ha−1 of P2O5 fertilizer treatment (44.7). Furthermore, 60 kg ha−1 of P2O5 fertilizer treatment gave greener plants, especially at the beginning of the flowering, in comparison with non-fertilized plants for both faba bean cultivars (Figure 6). On the other hand, in the second growing season, the highest SPAD values were found before anthesis and at the full blooming in both cultivars. However, the plants of the KK-14 cultivar were found to have higher values in the 0 kg ha−1 of P2O5 fertilizer treatment at the first three growth stages (47.6, 40.3, and 41.8, respectively), in contrast to Polycarpi, which showed lower SPAD values at the same treatments and growth stages (44.3, 41.1, and 42.4, respectively) (Figure 7).

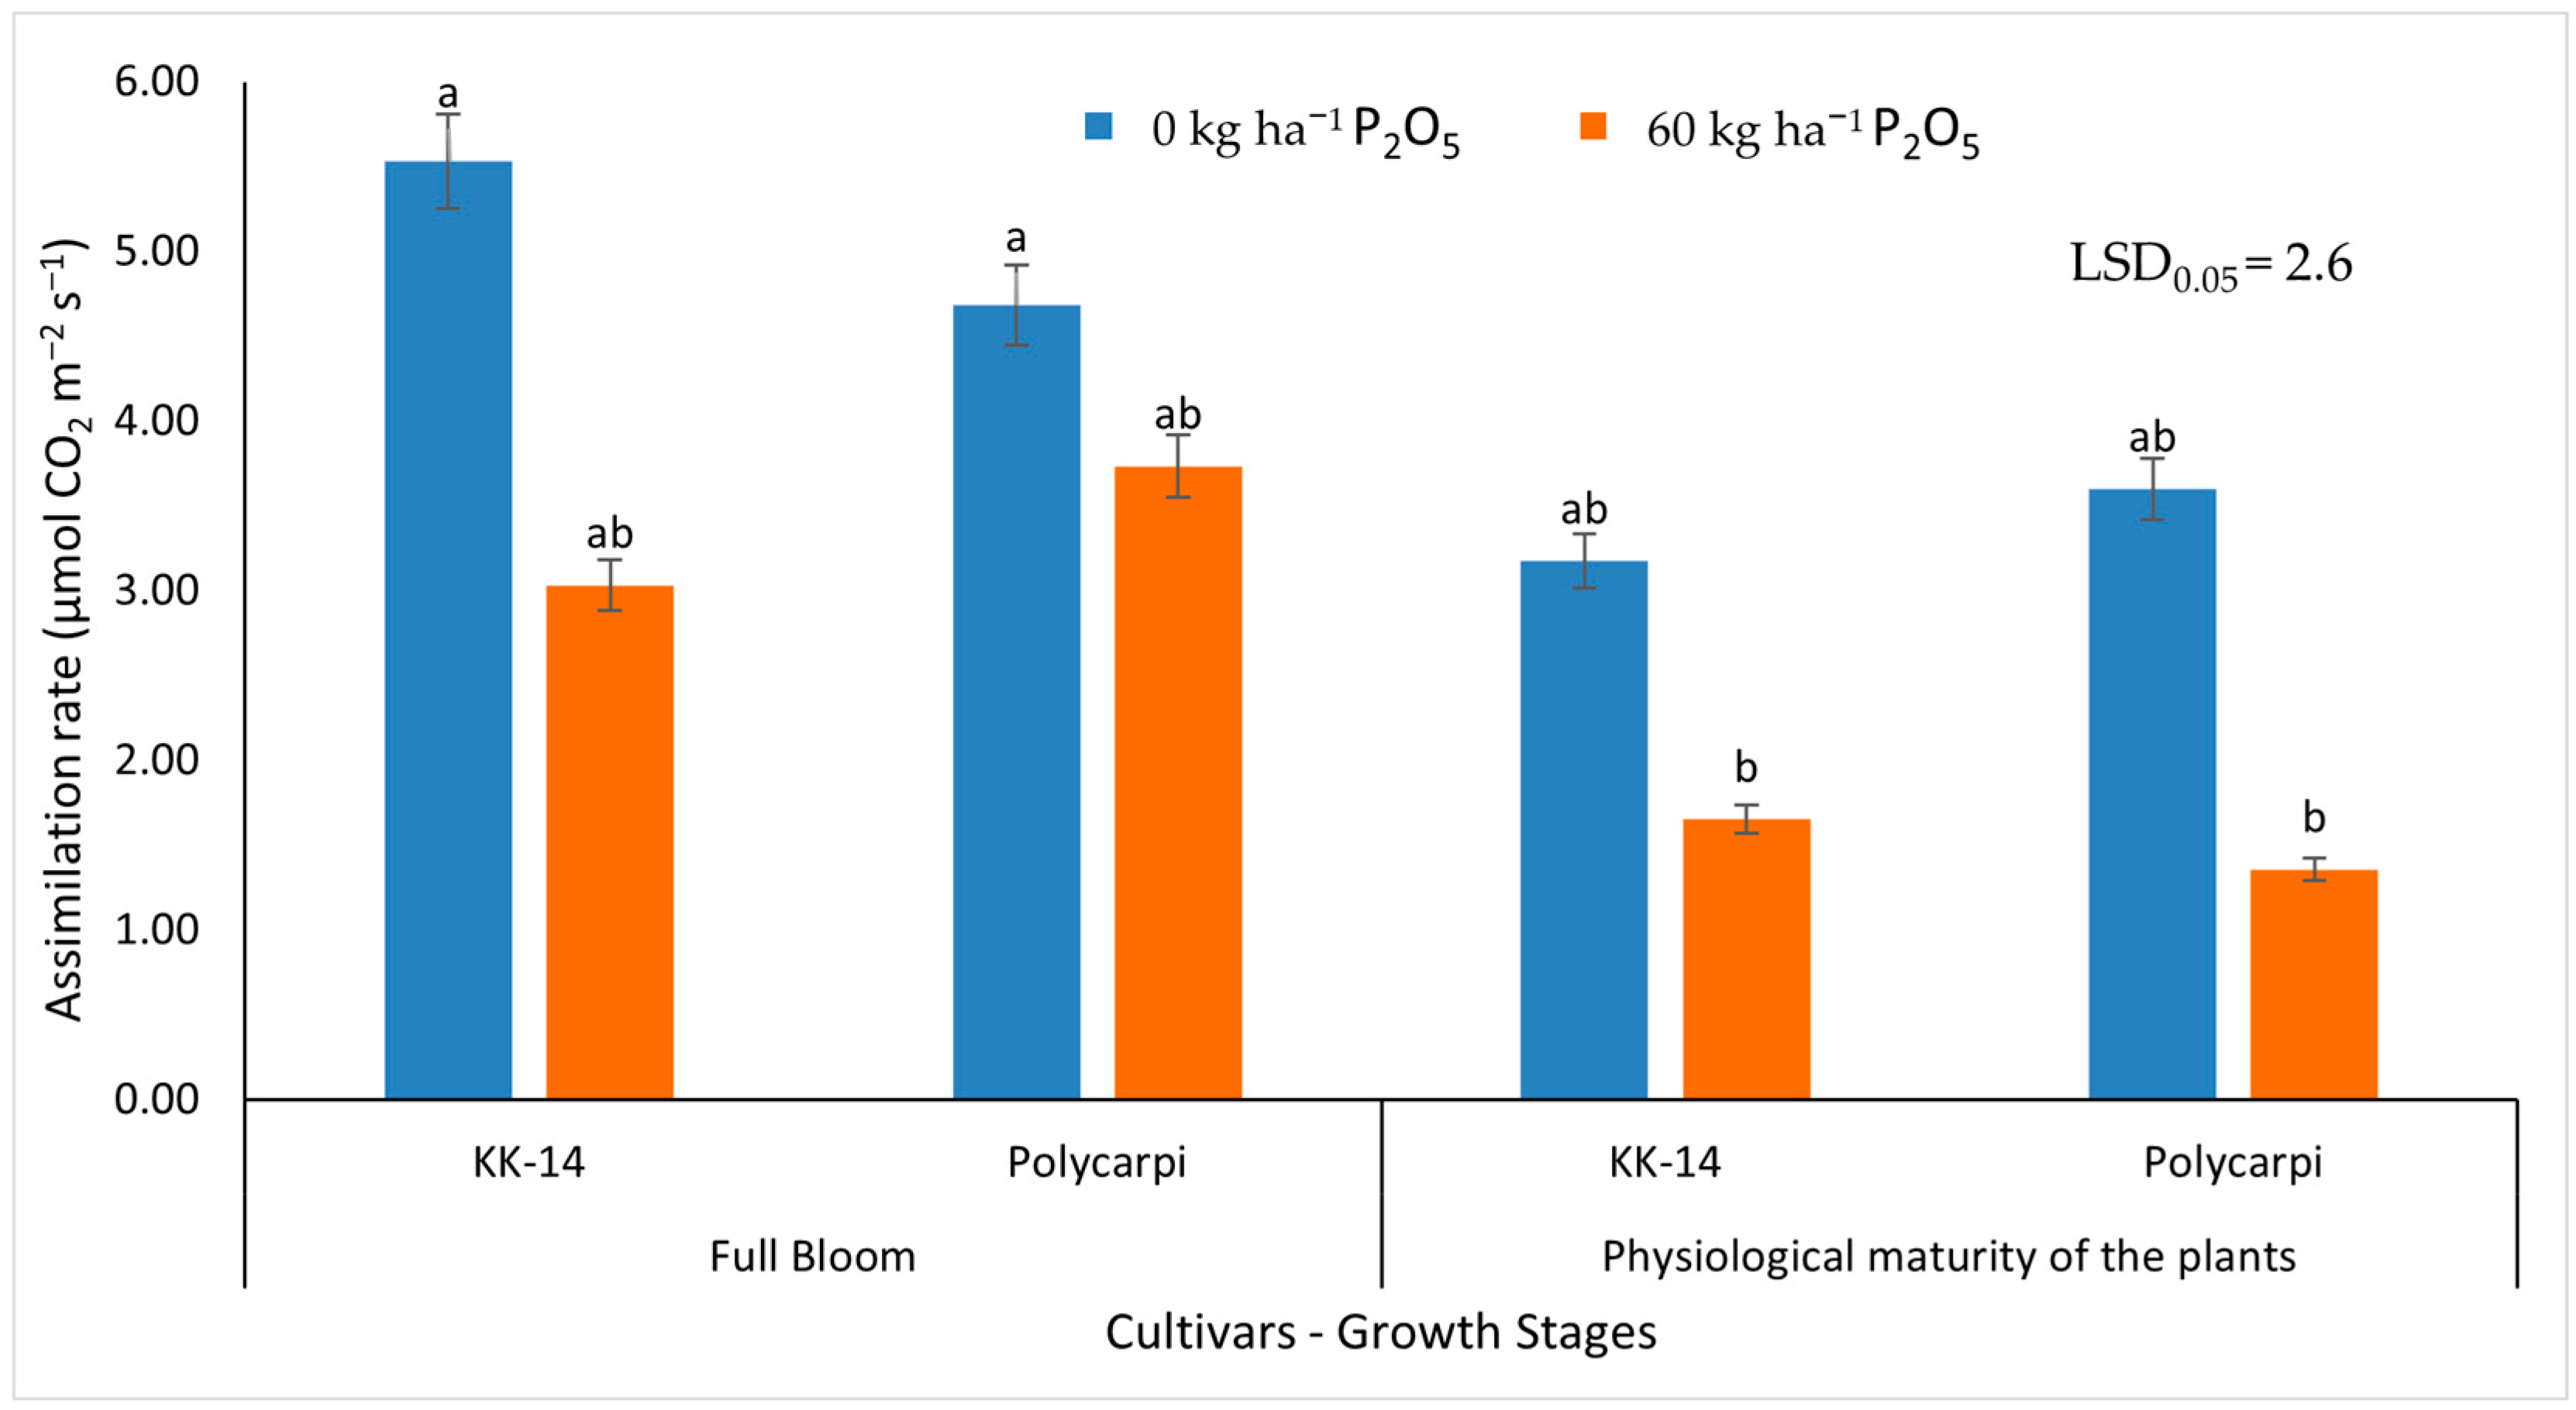
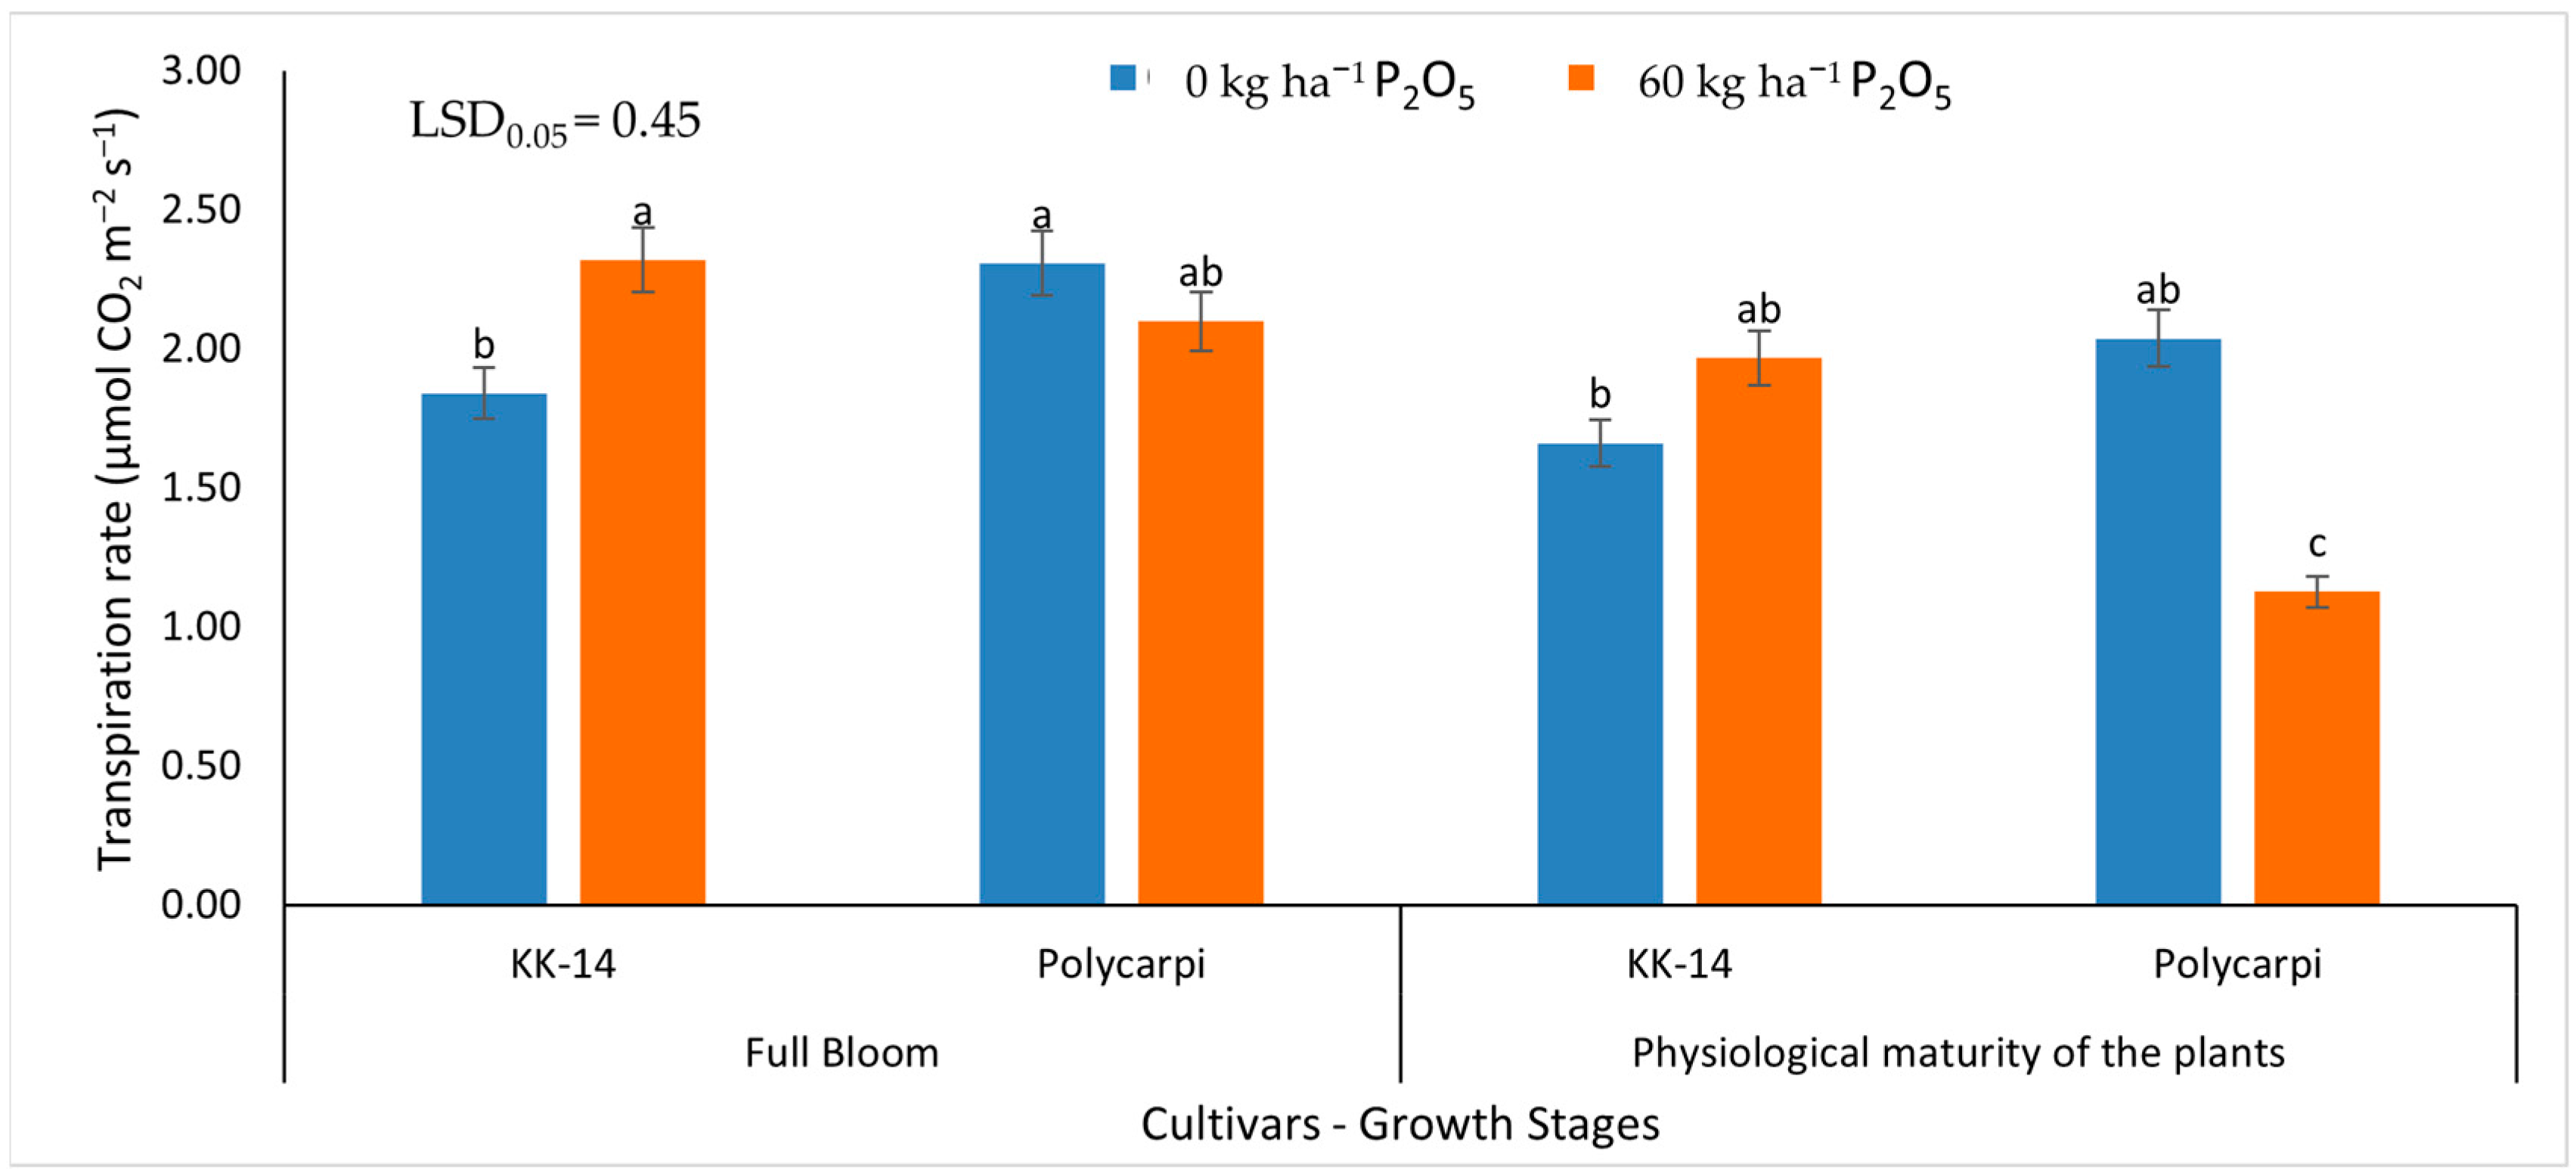
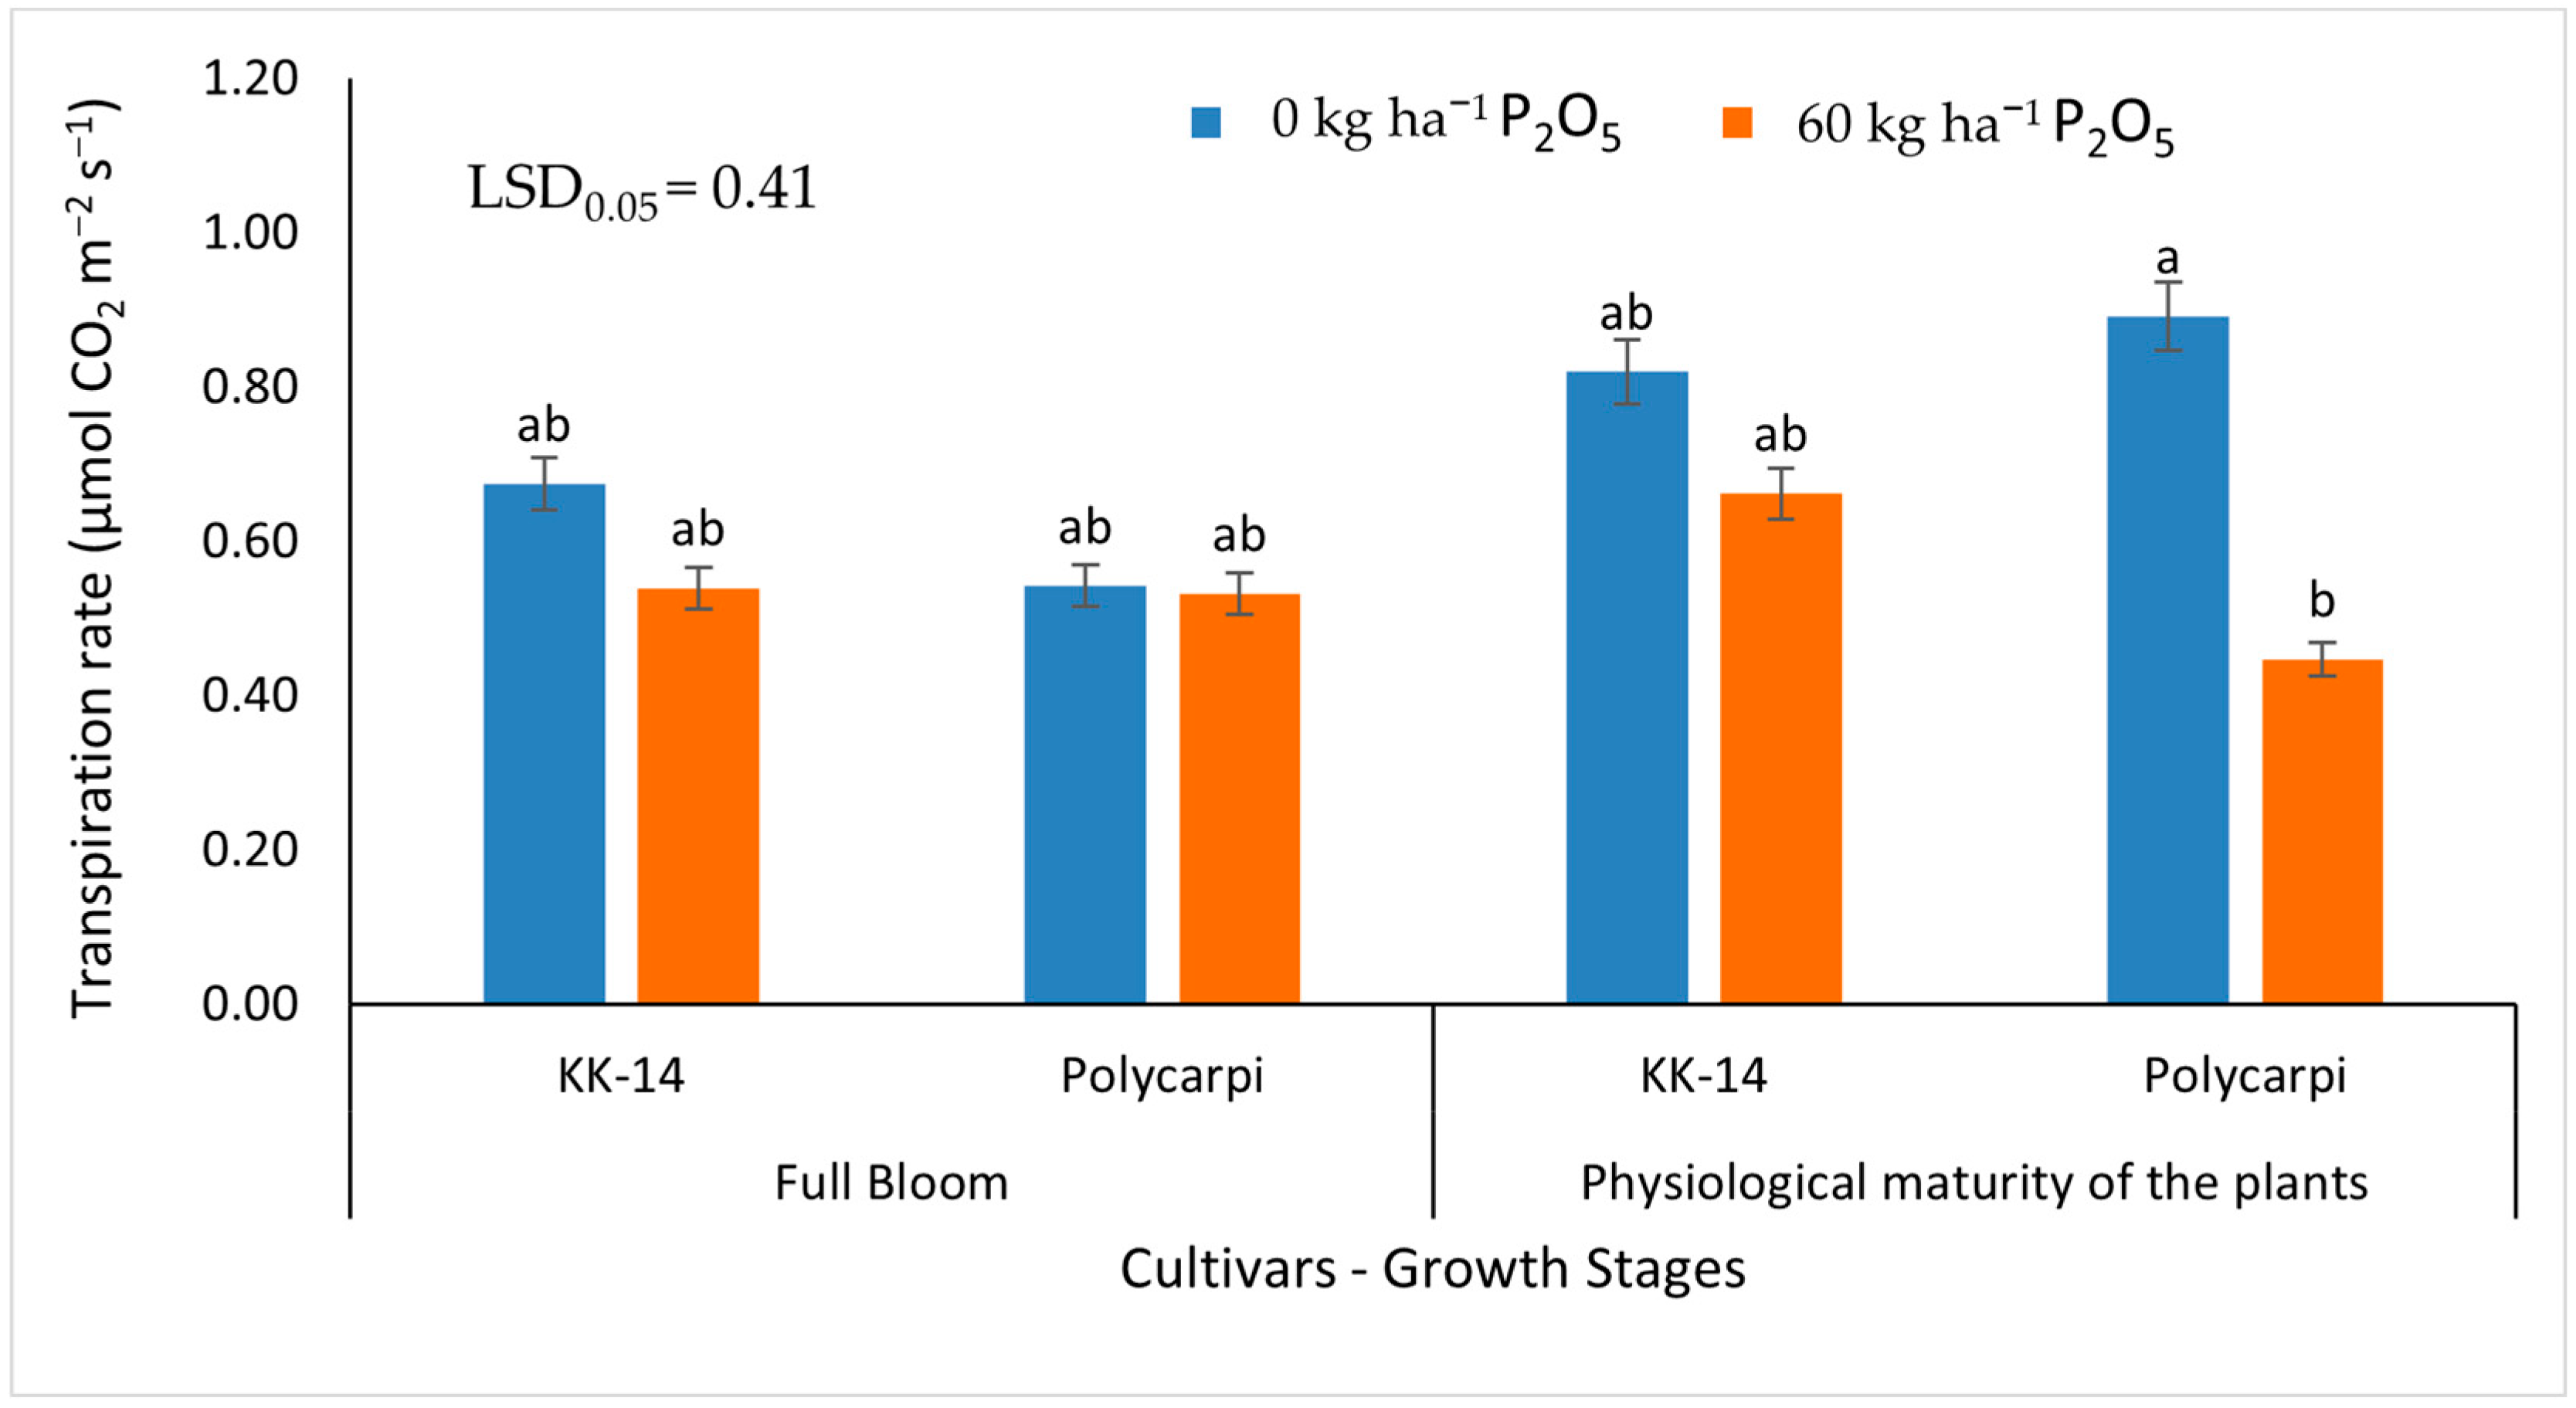
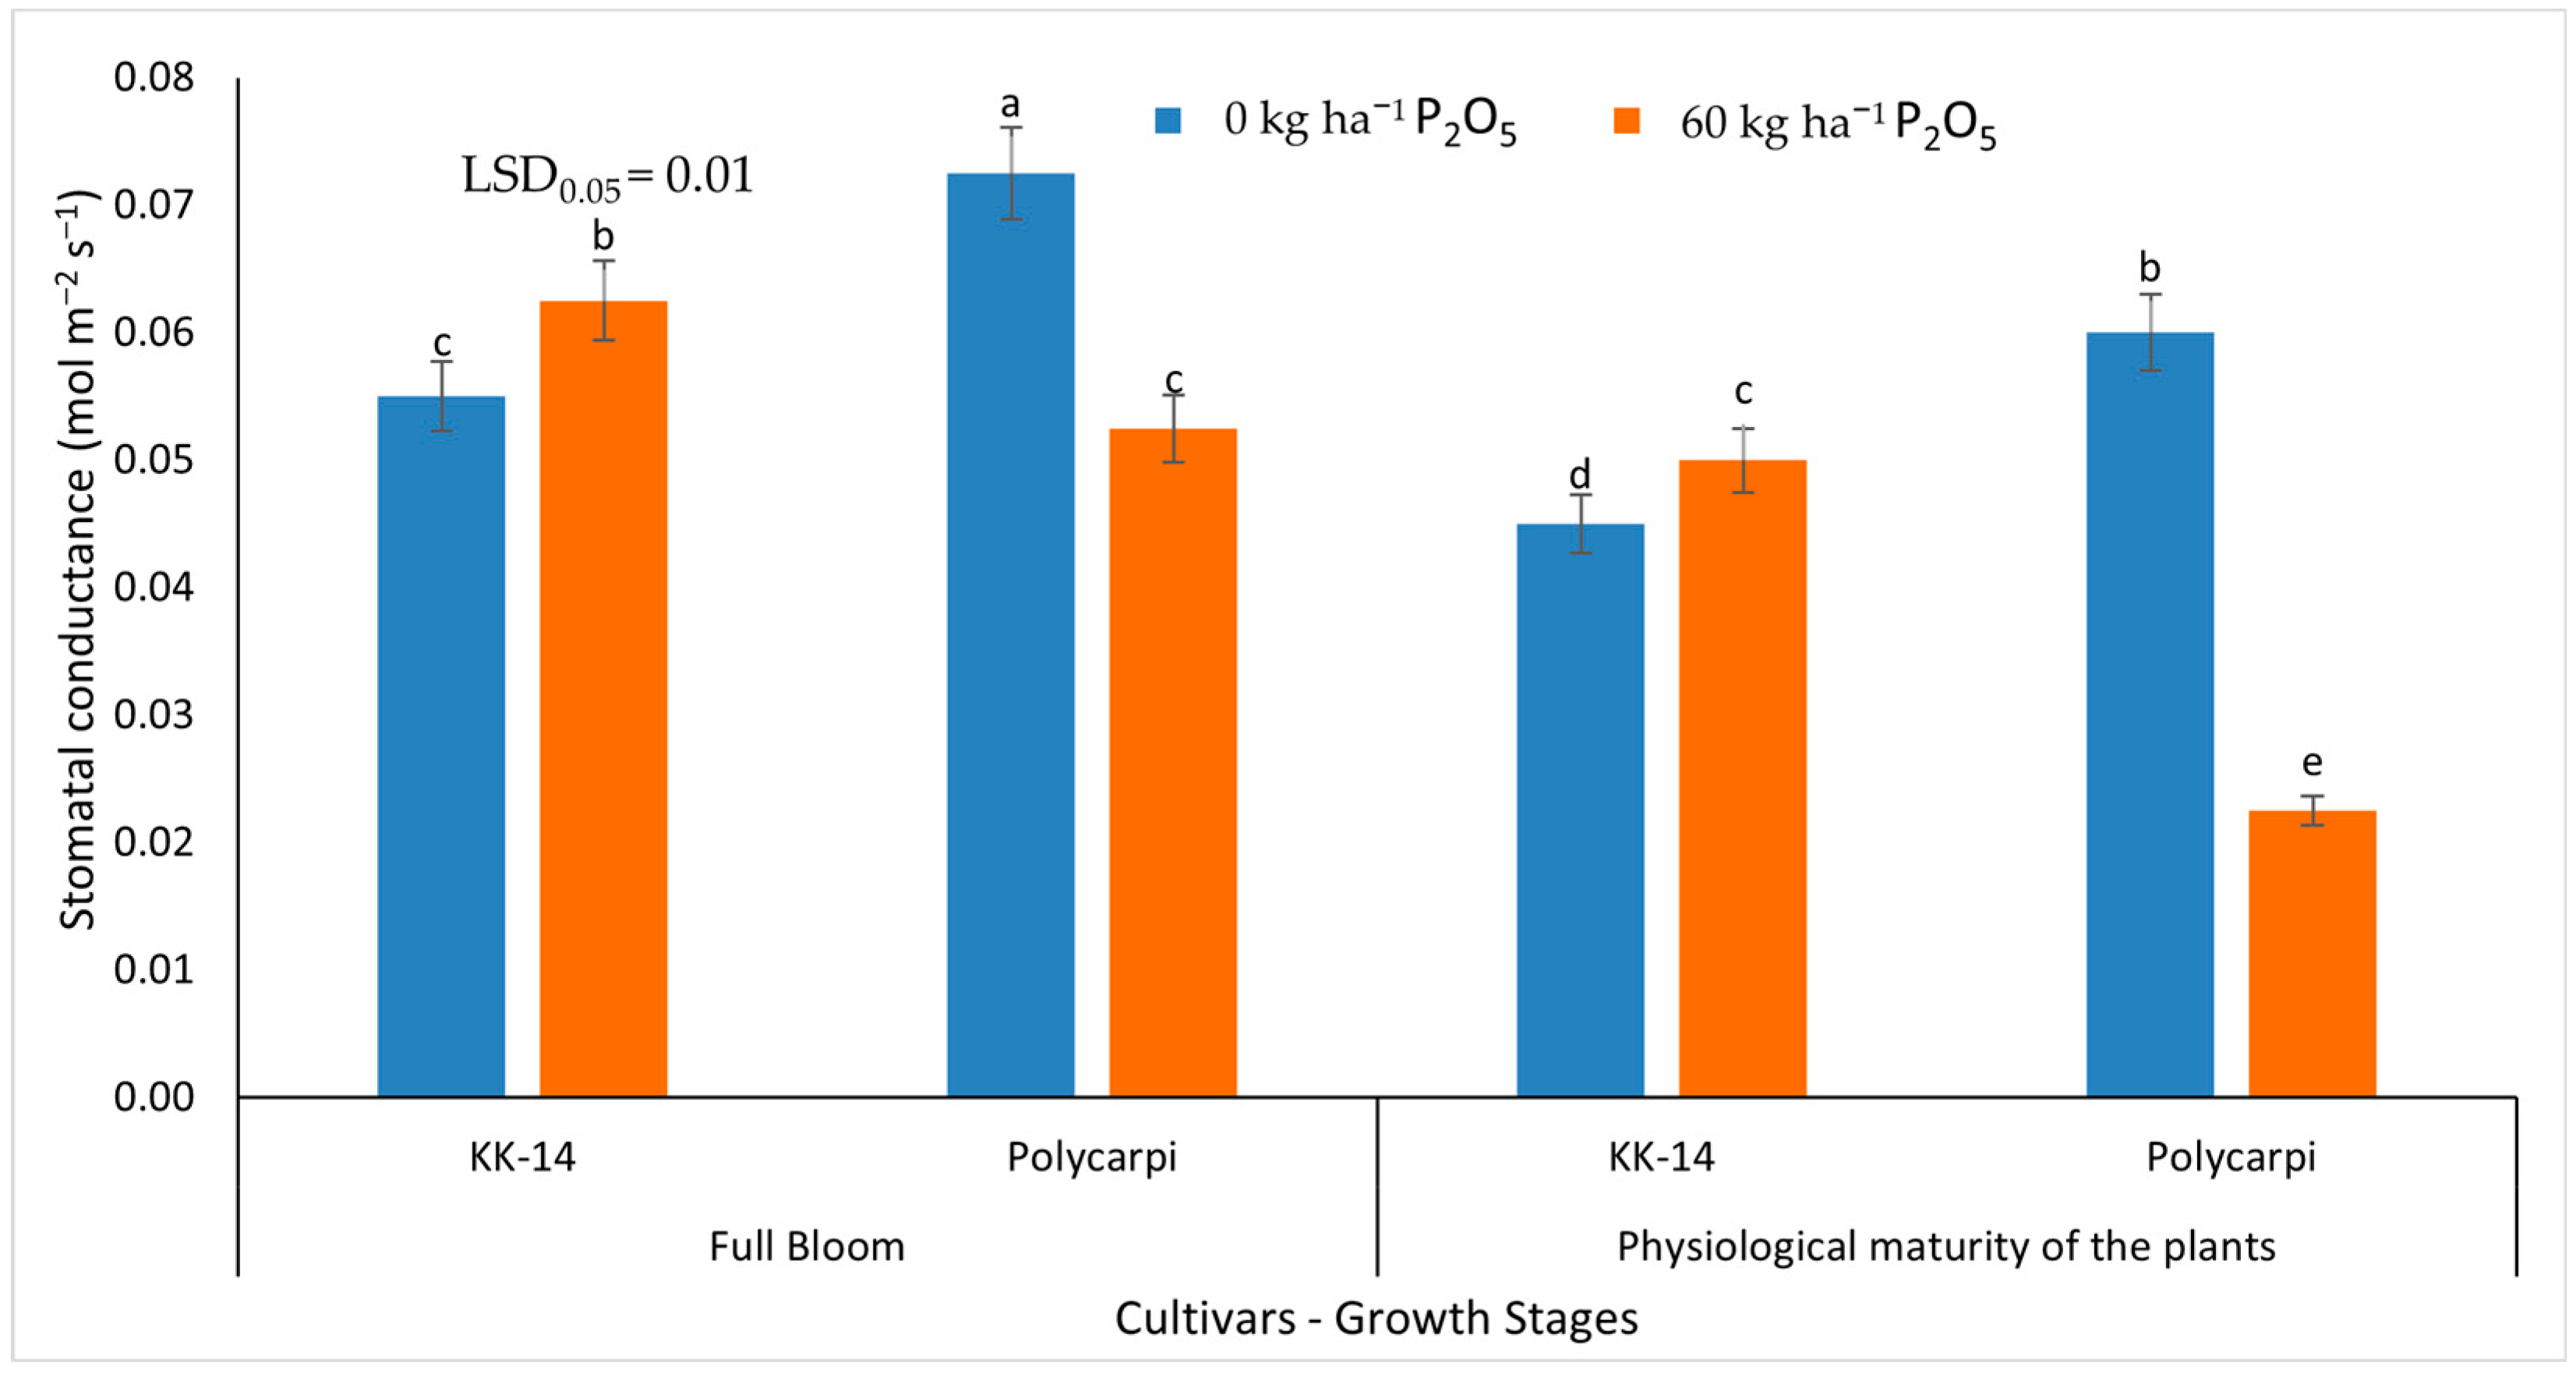
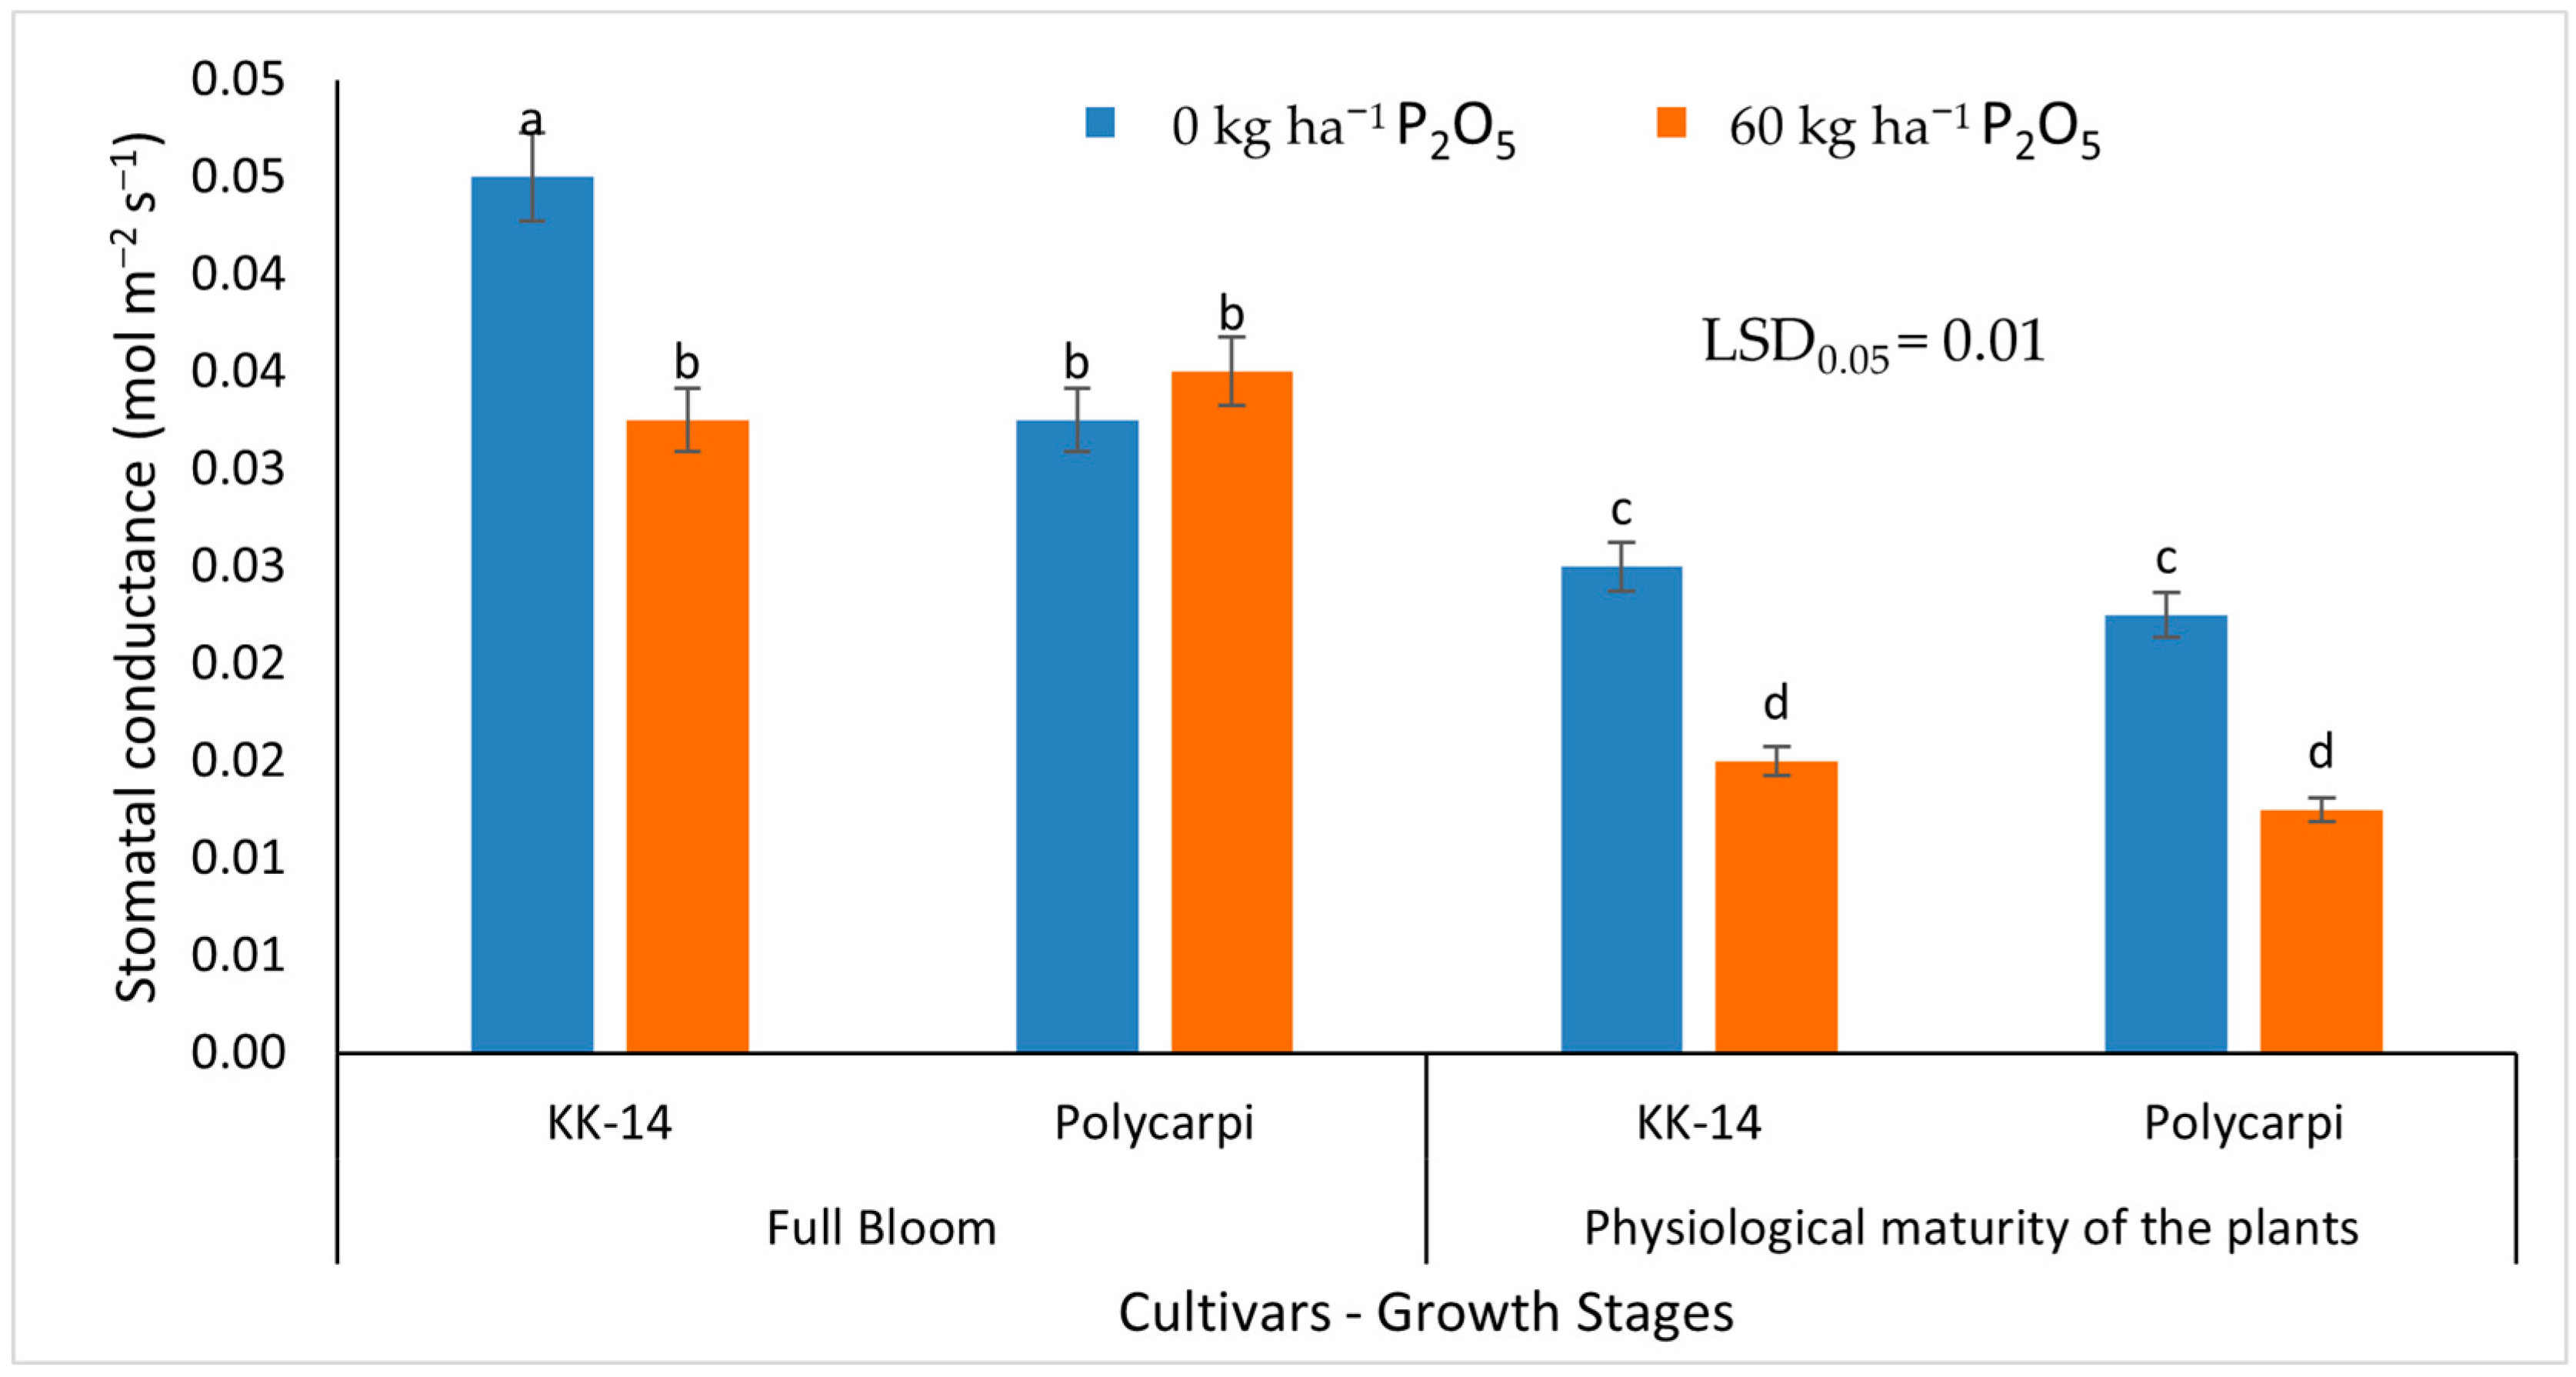
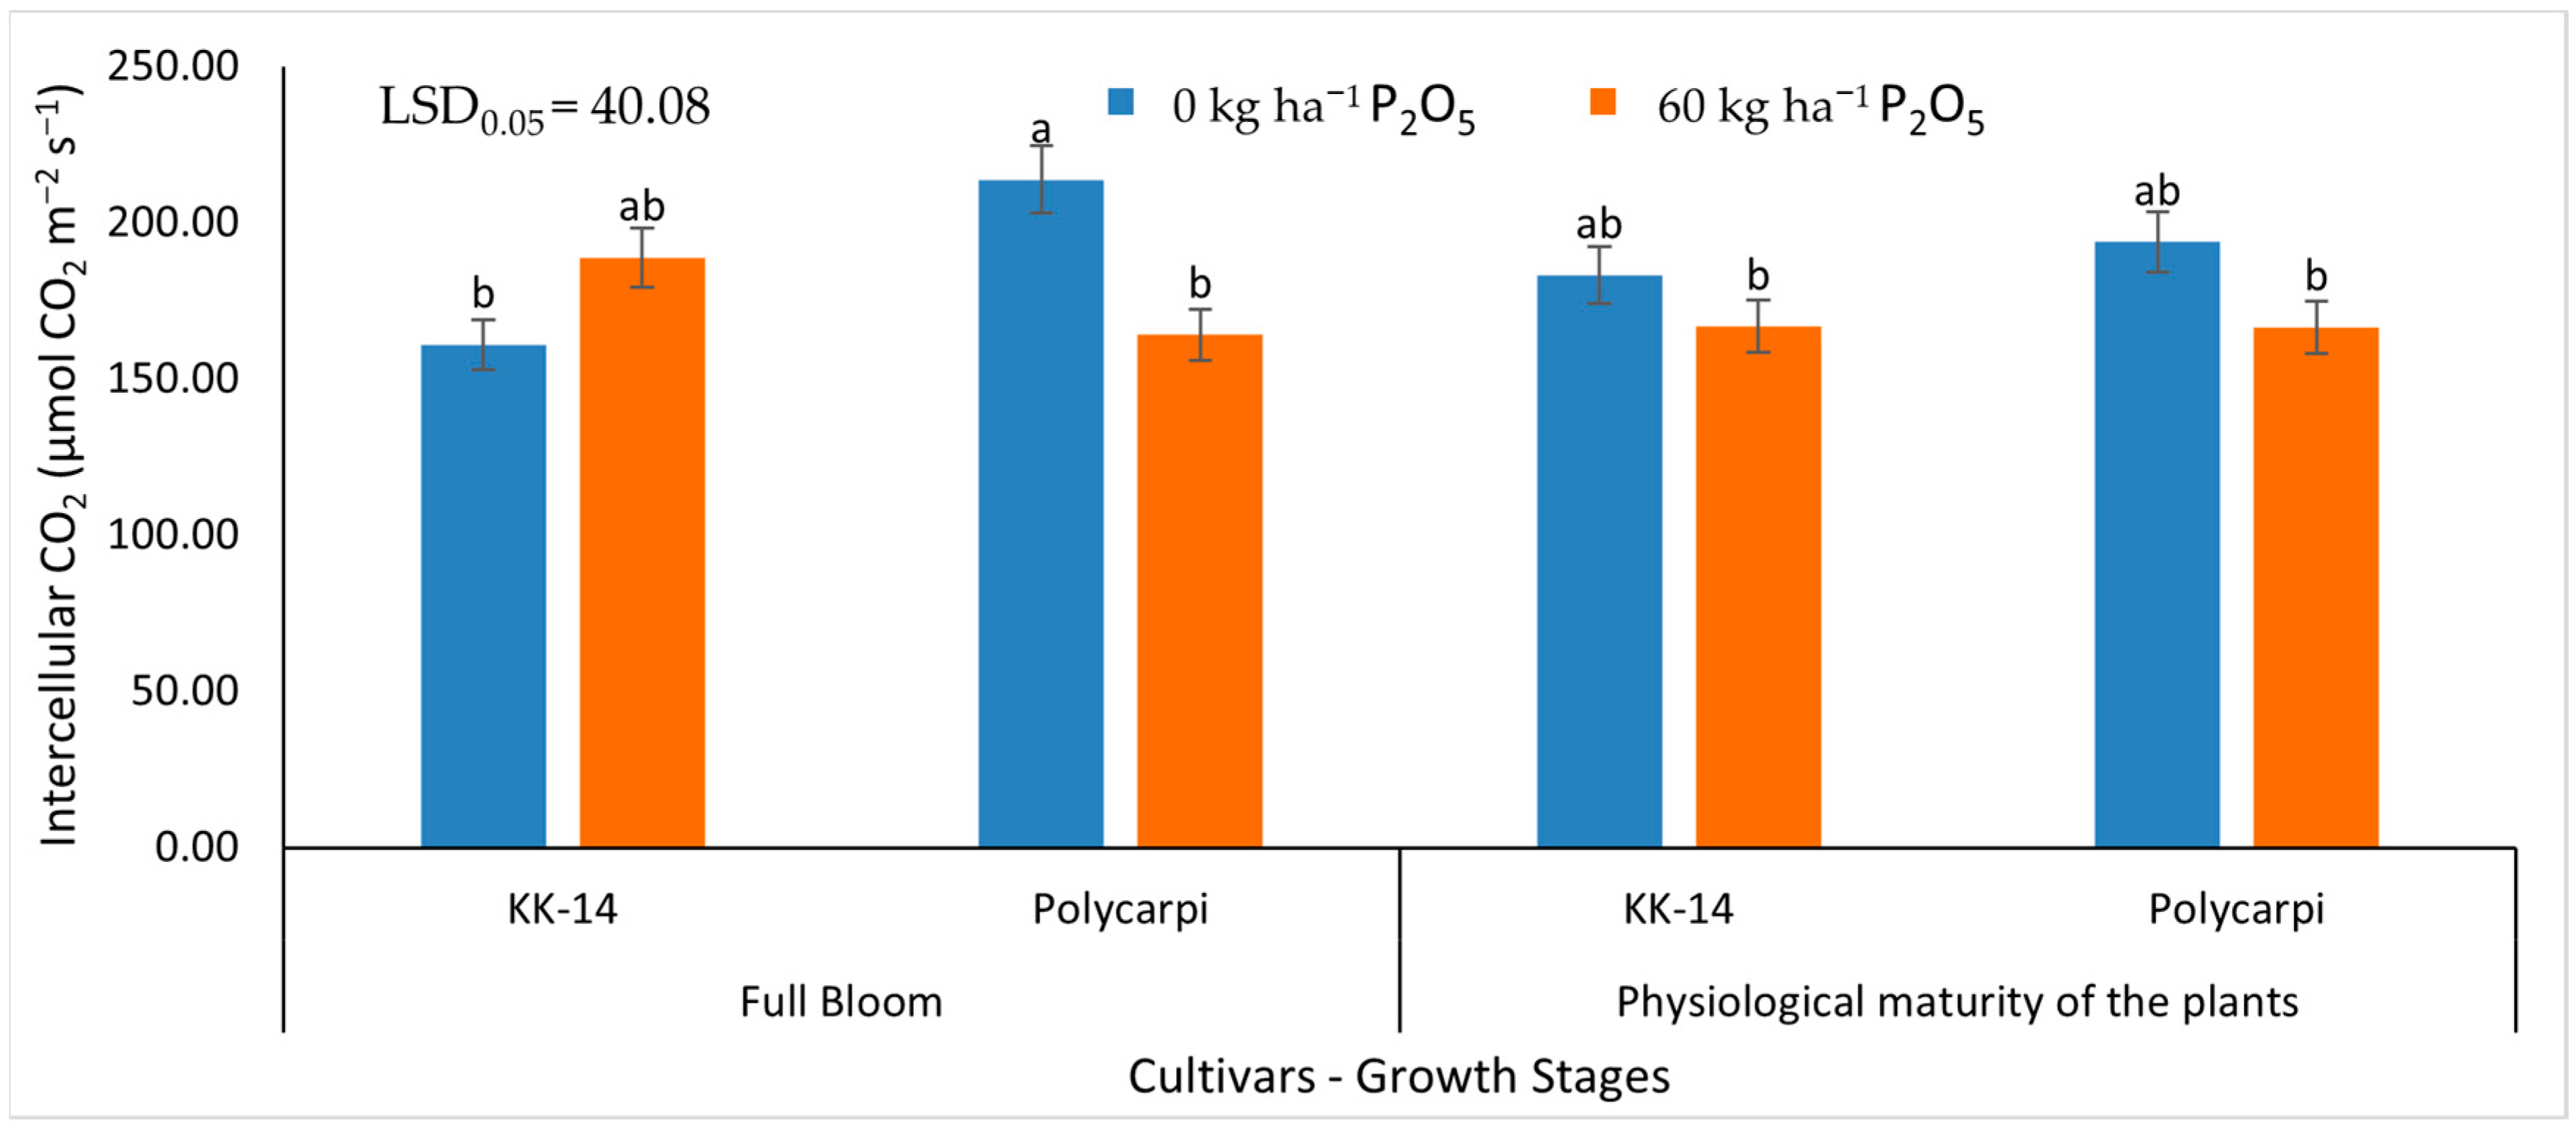
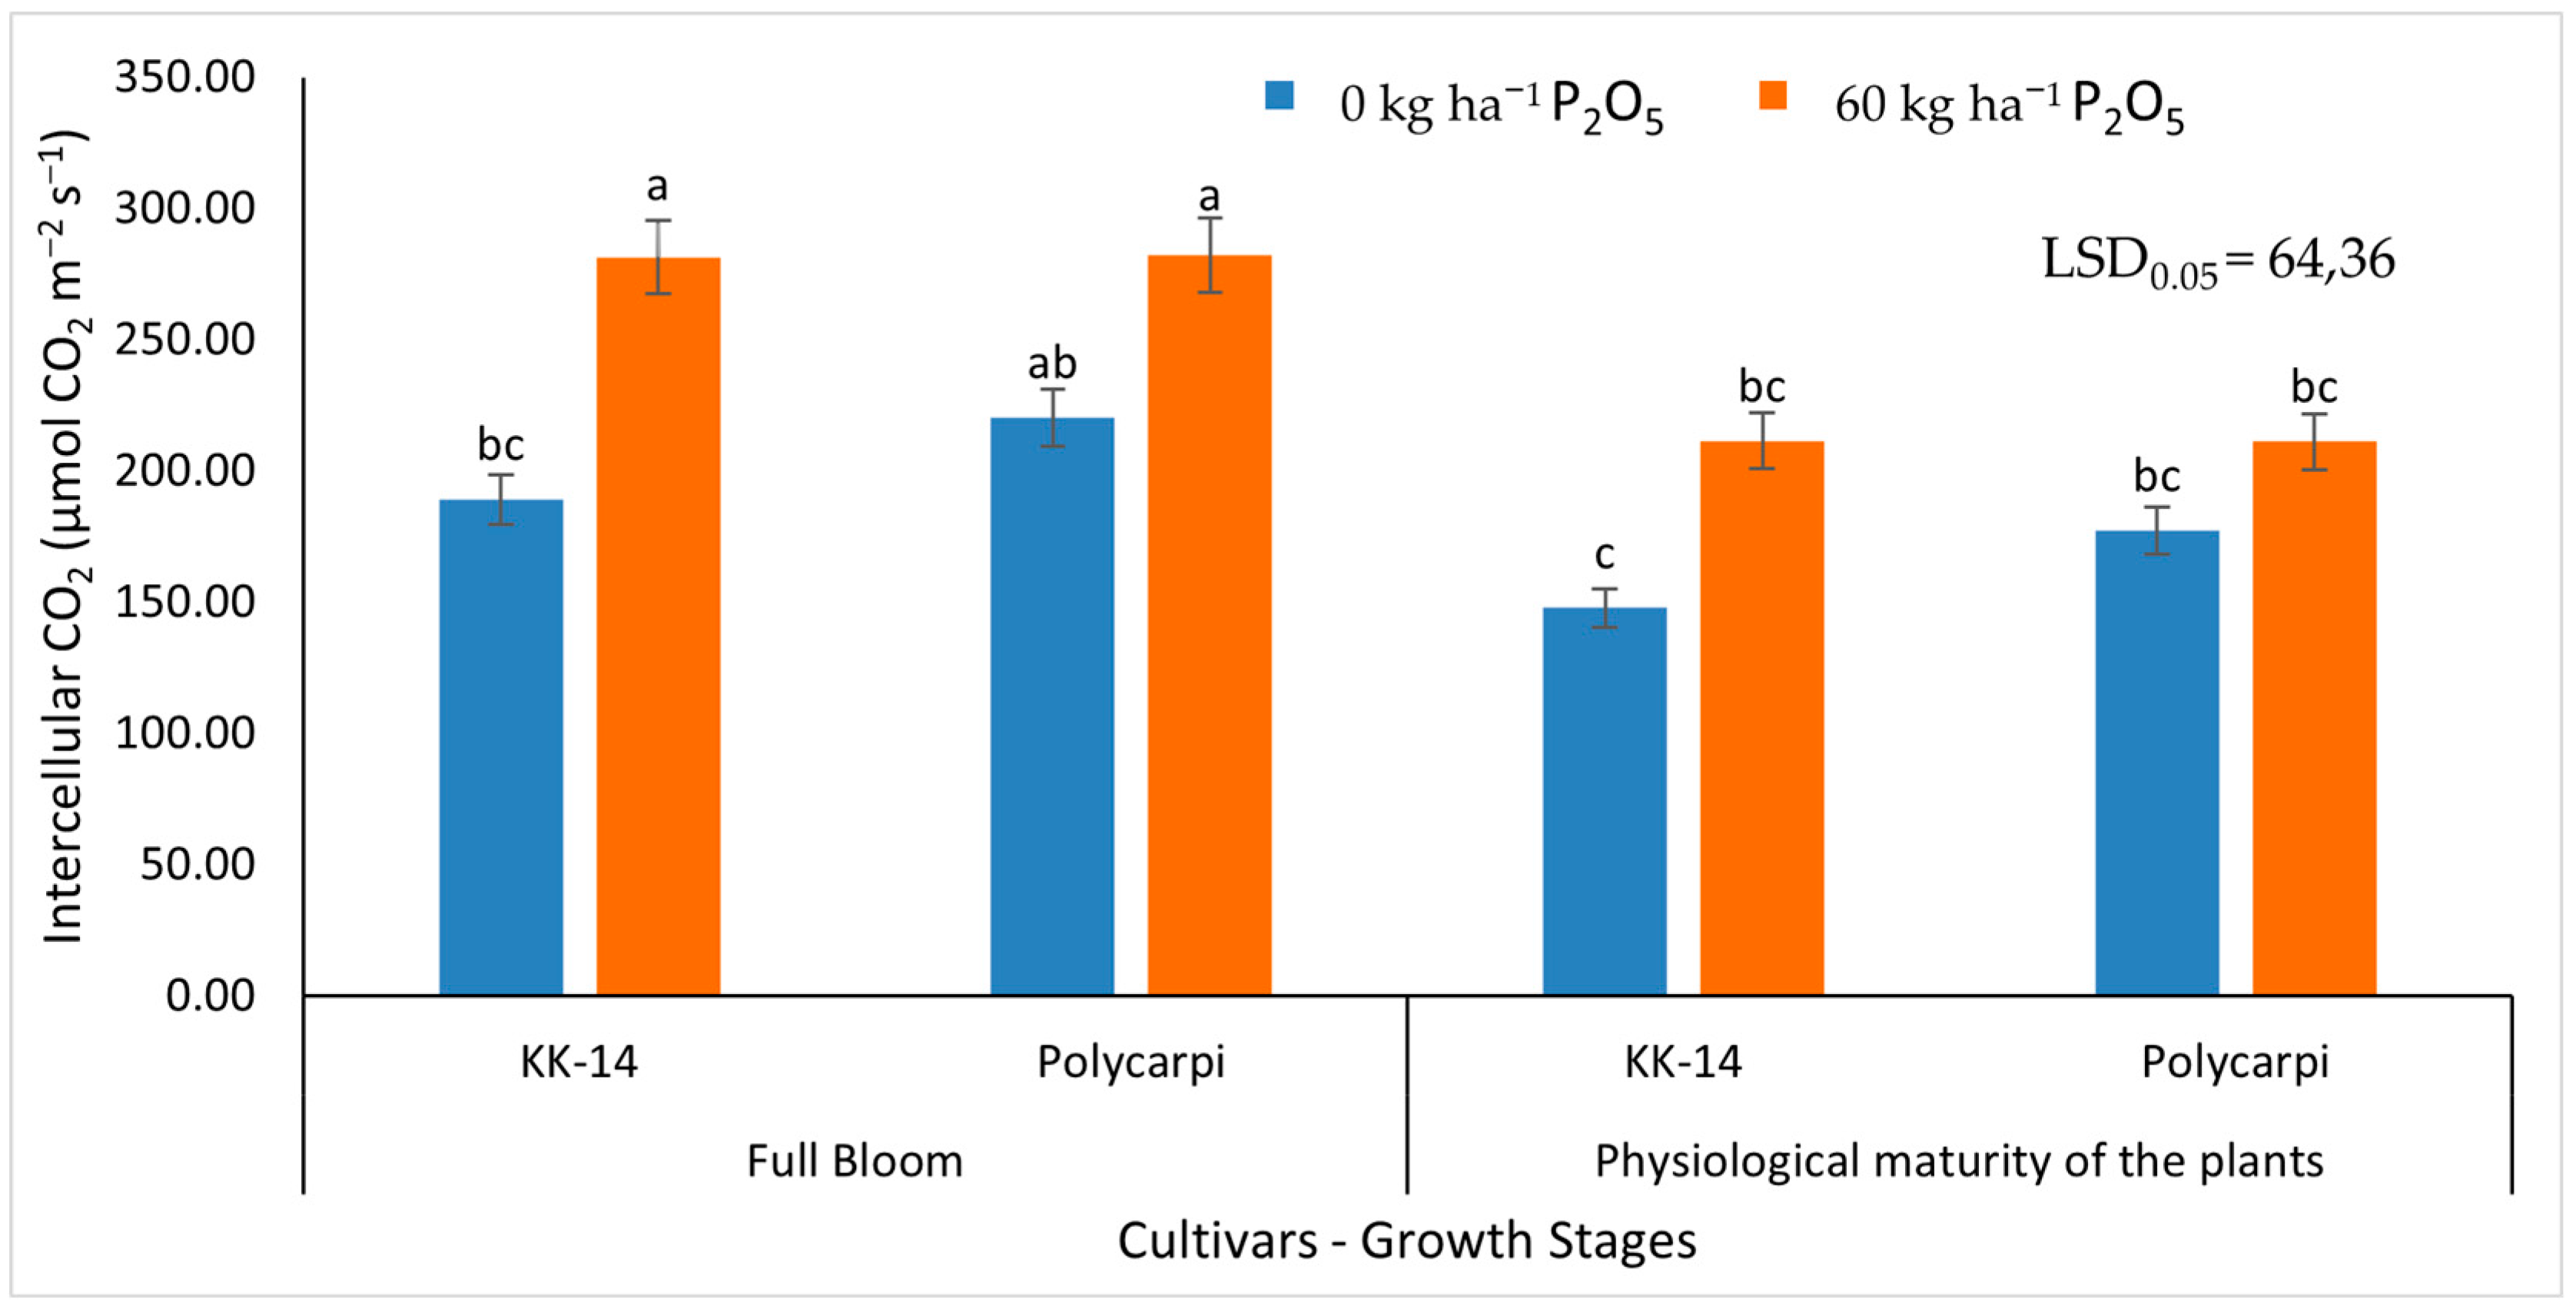
3.2.2. Gas Exchange Measurements

Gas exchange measurements were affected by the factors of the experiment as assimilation rate of CO2 (A) was affected by the main effects of year and growth stage. In the first growing season, 2020–2021, higher values of assimilation rate were observed in Polycarpi on 0 kg ha−1 of P2O5 fertilization treatment either at full bloom, or at the physiological maturity of the plants (7.05 μmol CO2 m−2 s1 and 5.19 μmol CO2 m−2 s1, respectively). On the other hand, KK-14 had higher values of assimilation rate in both growth stages on the 60 kg ha−1 of P2O5 treatment (6.68 μmol CO2 m−2 s1 and 5.59 μmol CO2 m−2 s1, respectively) (Figure 8). In the second growing season, 2021–2022, the highest assimilation rate was found at the 0 kg ha−1 of P2O5 fertilization treatment. Both cultivars, KK-14 and Polycarpi, gave higher values of assimilation rate at 0 kg ha−1 of P2O5 fertilization treatment than the 60 kg ha−1 of P2O5 treatment at the stage of full bloom and at the physiological maturity of the plants (Figure 9).
The gas exchange measurements and especially the transpiration rate (E) were influenced by the main effect of the year and the two-way interactions of treatment × cultivar and year × growth stage. More specifically, in the first year, 2020–2021, plants of KK-14 cultivar recorded a lower transpiration rate in the non-fertilized treatment (0 kg ha−1 of P2O5) compared to the 60 kg ha−1 of P2O5 fertilizer treatment in both growth stages. However, Polycarpi showed a higher transpiration rate in the 0 kg ha−1 of P2O5 fertilizer treatment either at full blooming or at the physiological maturity of the plants (Figure 10). In the second growing season, 2021–2022, both cultivars, KK-14 and Polycarpi, obtained higher transpiration rate values in the 0 kg ha−1 of P2O5 fertilizer treatment in contrast to the 60 kg ha−1 of P2O5 treatment, at full bloom and at the physiological maturity of the plants (Figure 11).
The stomatal conductance to water vapor (gs) was influenced by the year, growth stage, the two-way interaction of treatment × cultivar, and also the three-way interaction of year × treatment × cultivar. Particularly, in the 2020–2021 growing season, non-fertilized plants of Polycarpi were observed to have higher stomatal conductance to water vapor (0.07 mol m−2 s−1 and 0.06 mol m−2 s−1, respectively) compared to the fertilized plants (0.06 mol m−2 s−1 and 0.02 mol m−2 s−1, respectively) at both growth stages. On the other hand, the differences between the two fertilizer treatments of KK-14 plants were not statistically significant, although the fertilized plants showed higher values of stomatal conductance (Figure 12). In the second growing season, 2021–2022, plants of the KK-14 cultivar in the 0 kg ha−1 of P2O5 treatment for both growth stages, and plants of the Polycarpi cultivar at physiological maturity, presented higher stomatal conductance to water vapor, in contrast to those in the 60 kg ha−1 of P2O5 fertilizer treatment. On the contrary, the plants of the Polycarpi cultivar did not show any statistically significant differences between the two fertilizer treatments at full bloom in terms of stomatal conductance (Figure 13).
The intercellular CO2 concentration (Ci) was influenced by year, growth stage, and the two-way interaction of year × treatment. In the first growing period, 2020–2021, higher values of the intercellular CO2 concentration were observed in Polycarpi in the 0 kg ha−1 of P2O5 treatment in both growth stages (213.83 μmol CO2 m−2 s1 and 193.83 μmol CO2 m−2 s1, respectively). At the stage of full blooming, we noted that non-fertilized plants of the KK-14 cultivar had lower intercellular CO2 concentration compared to those in the 60 kg ha−1 of P2O5 fertilizer treatment (161.00 μmol CO2 m−2 s1 and 186.91 μmol CO2 m−2 s1, respectively) (Figure 14). In the second year, 2021–2022, the highest concentrations of intercellular CO2 were noted in the 60 kg ha−1 of P2O5 fertilizer treatment, at full blooming either for KK-14 or Polycarpi (281.55 μmol CO2 m−2 s1 and 282.08 μmol CO2 m−2 s1, respectively). At the physiological maturity of the plants, the values of the concentration of intercellular CO2 were lower for both cultivars and treatments, whereas between the two fertilizer treatments, again the plants in the 60 kg ha−1 of P2O5 treatment presented higher values compared to those in the 0 kg ha−1 of P2O5 treatment (Figure 15).

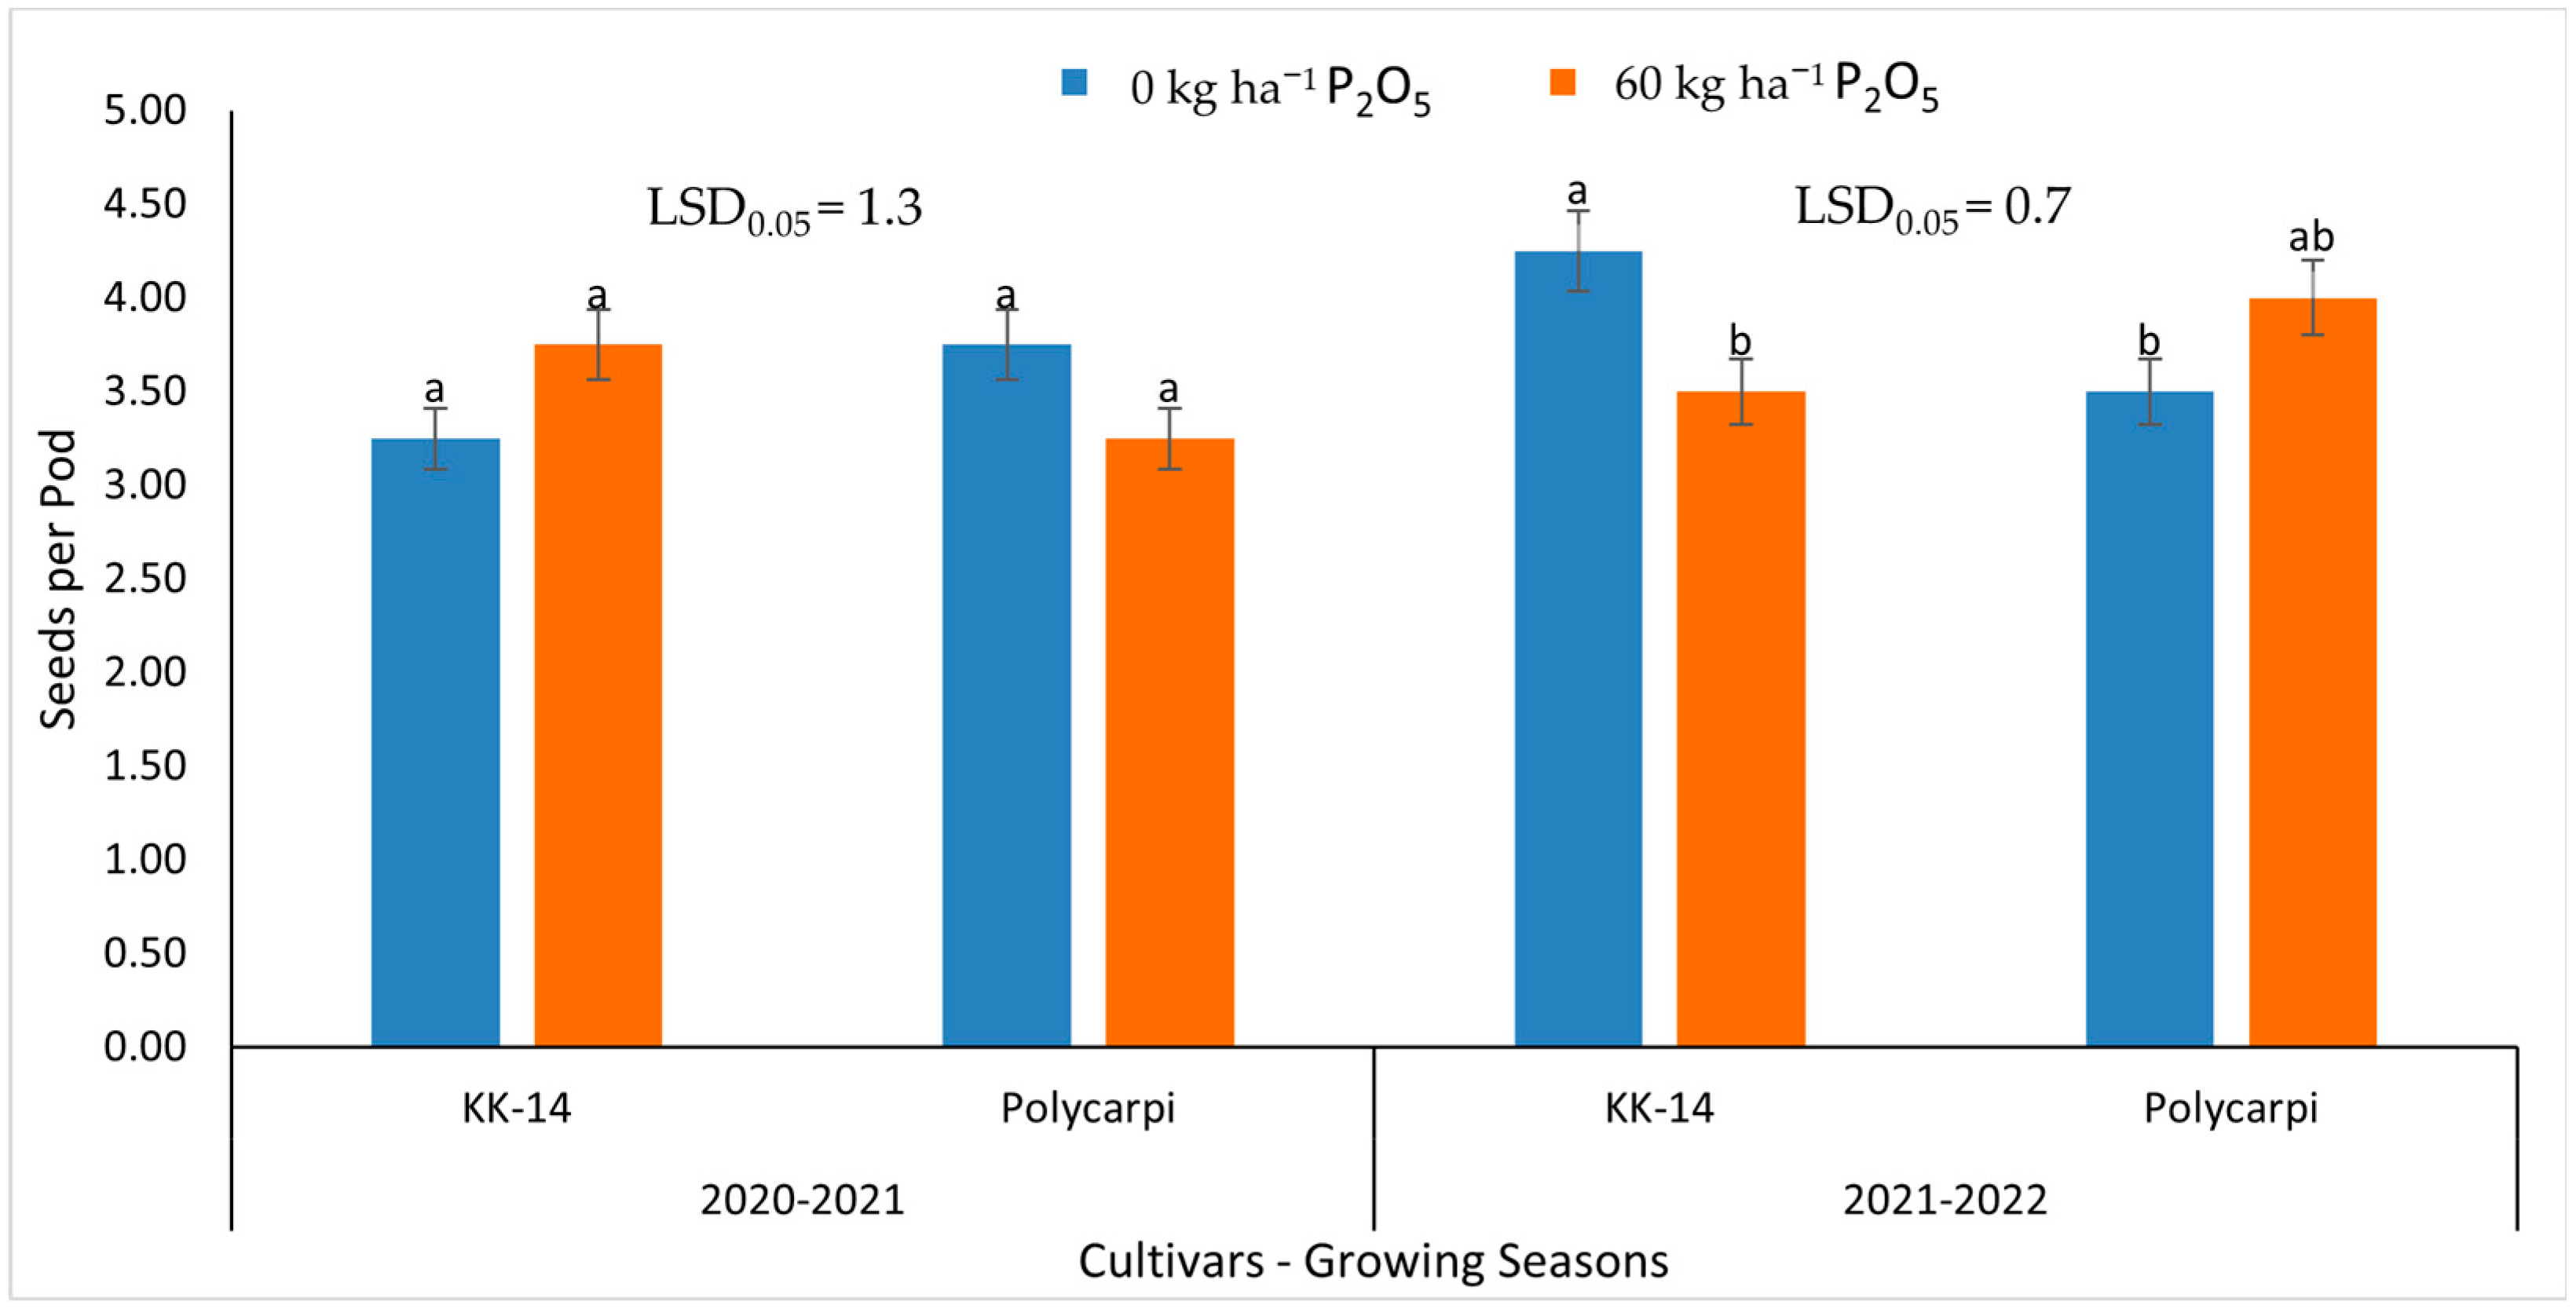
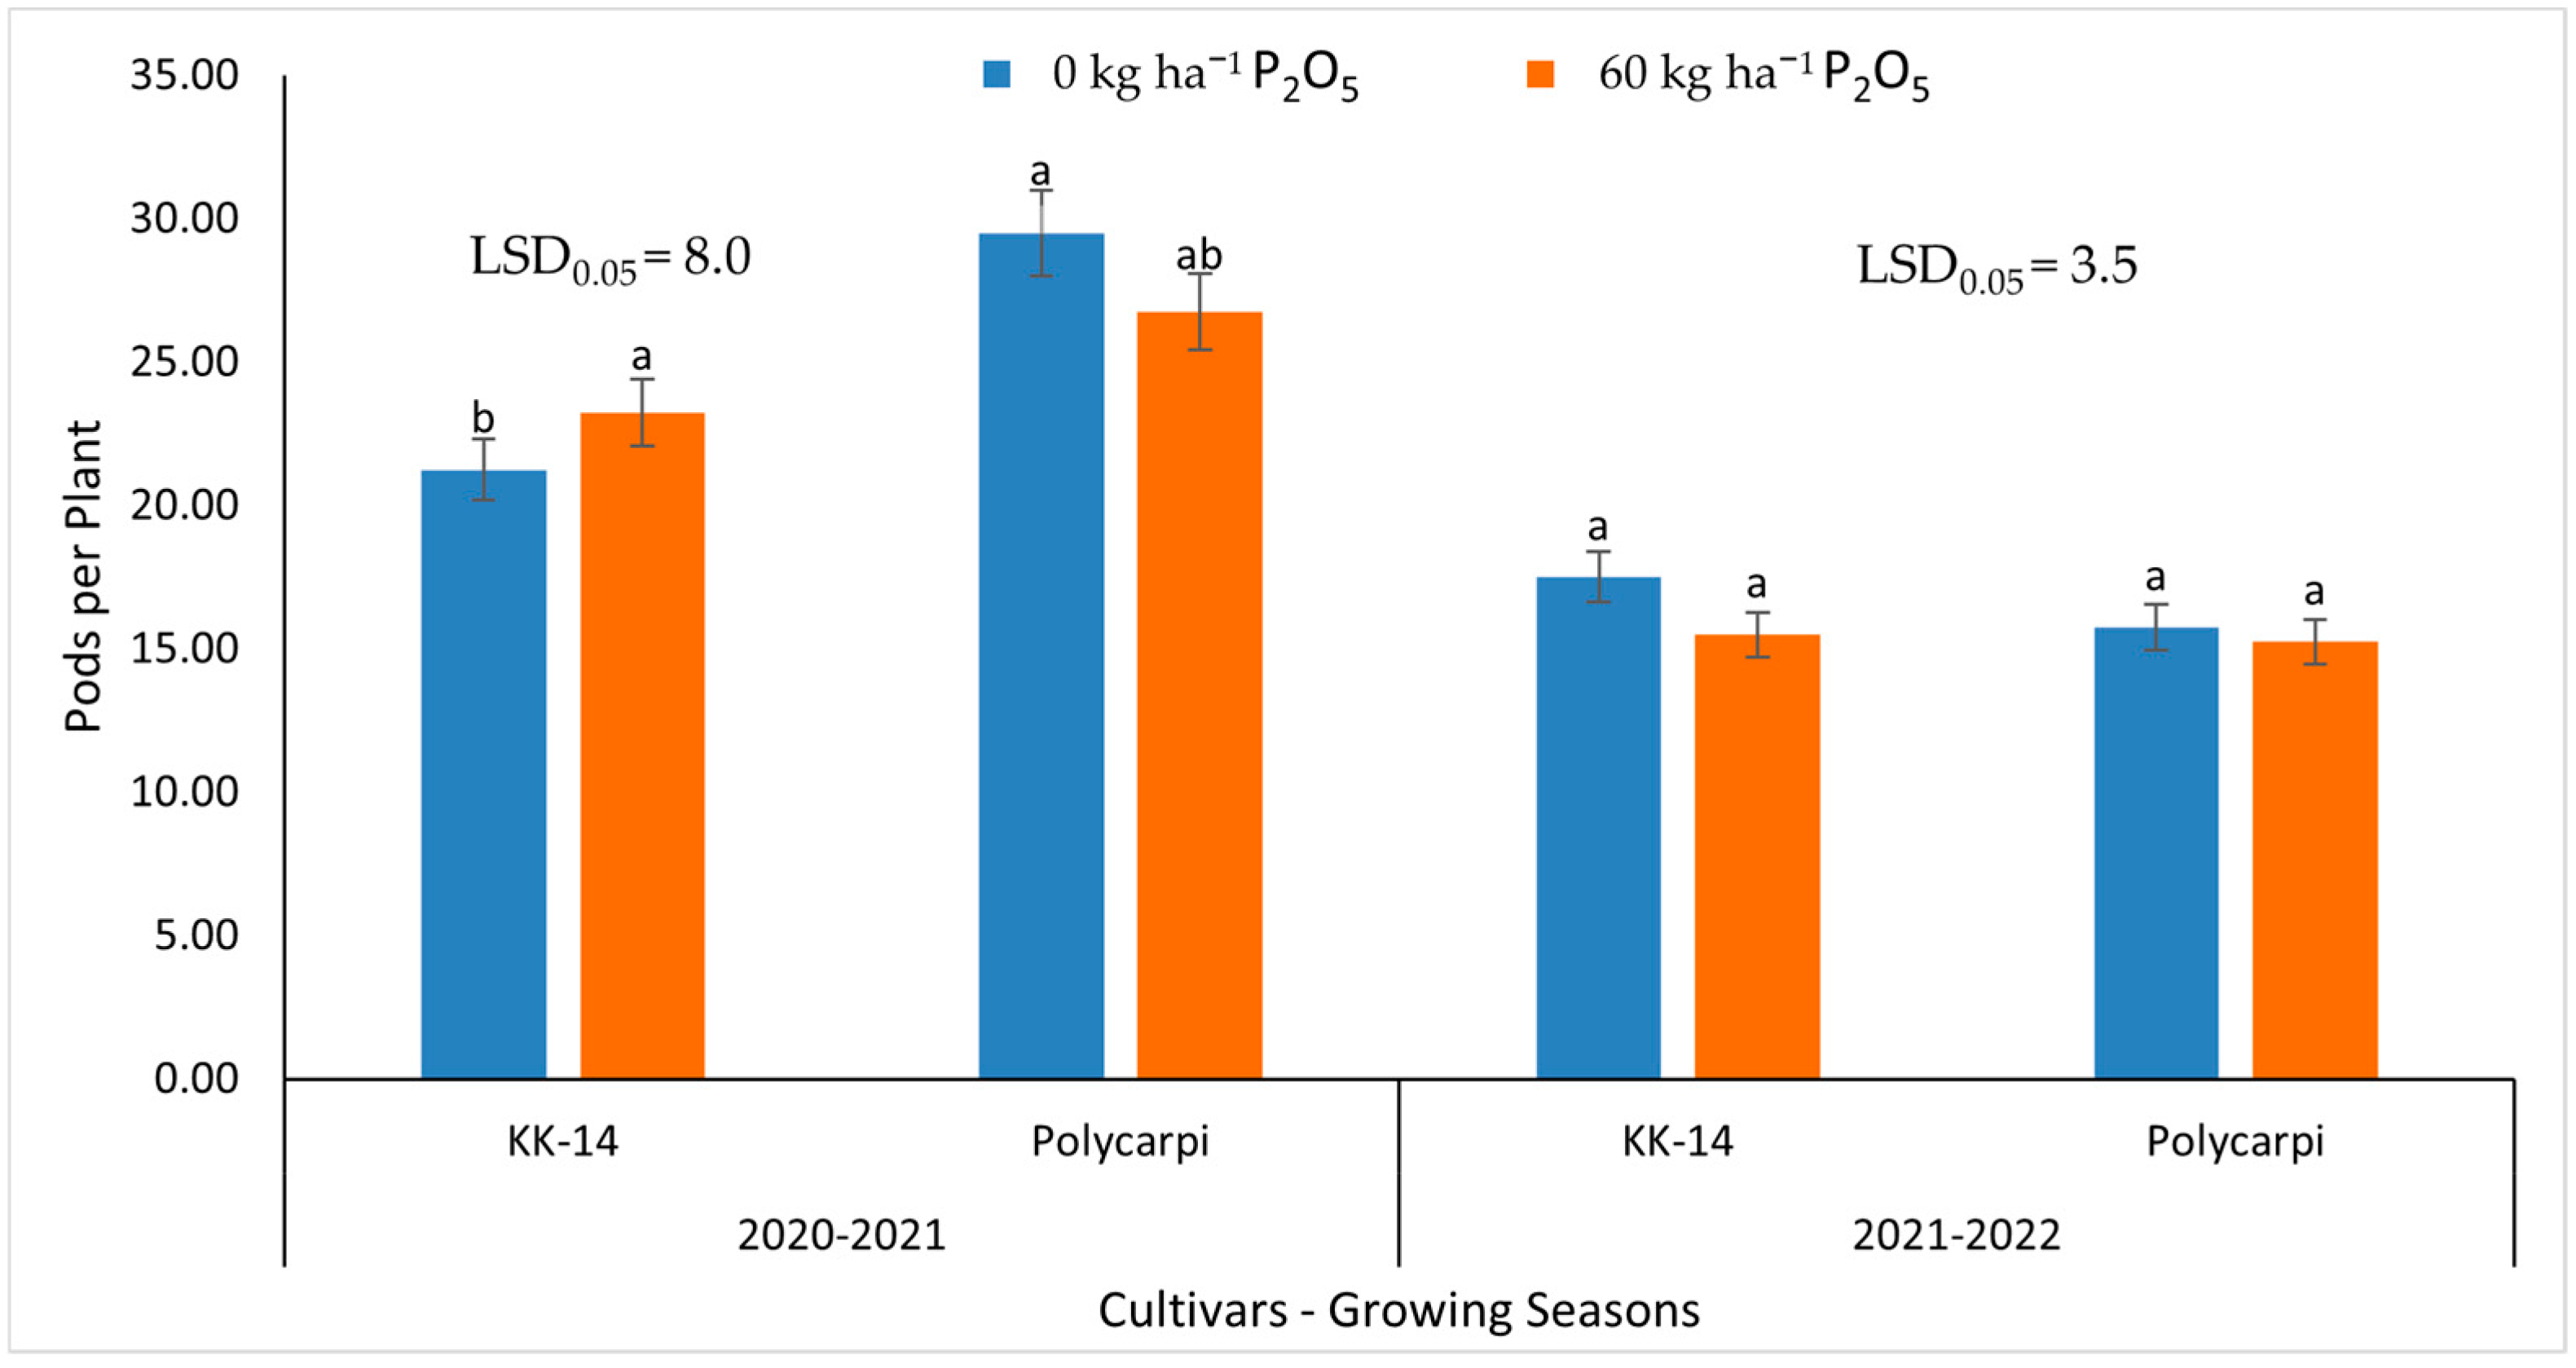
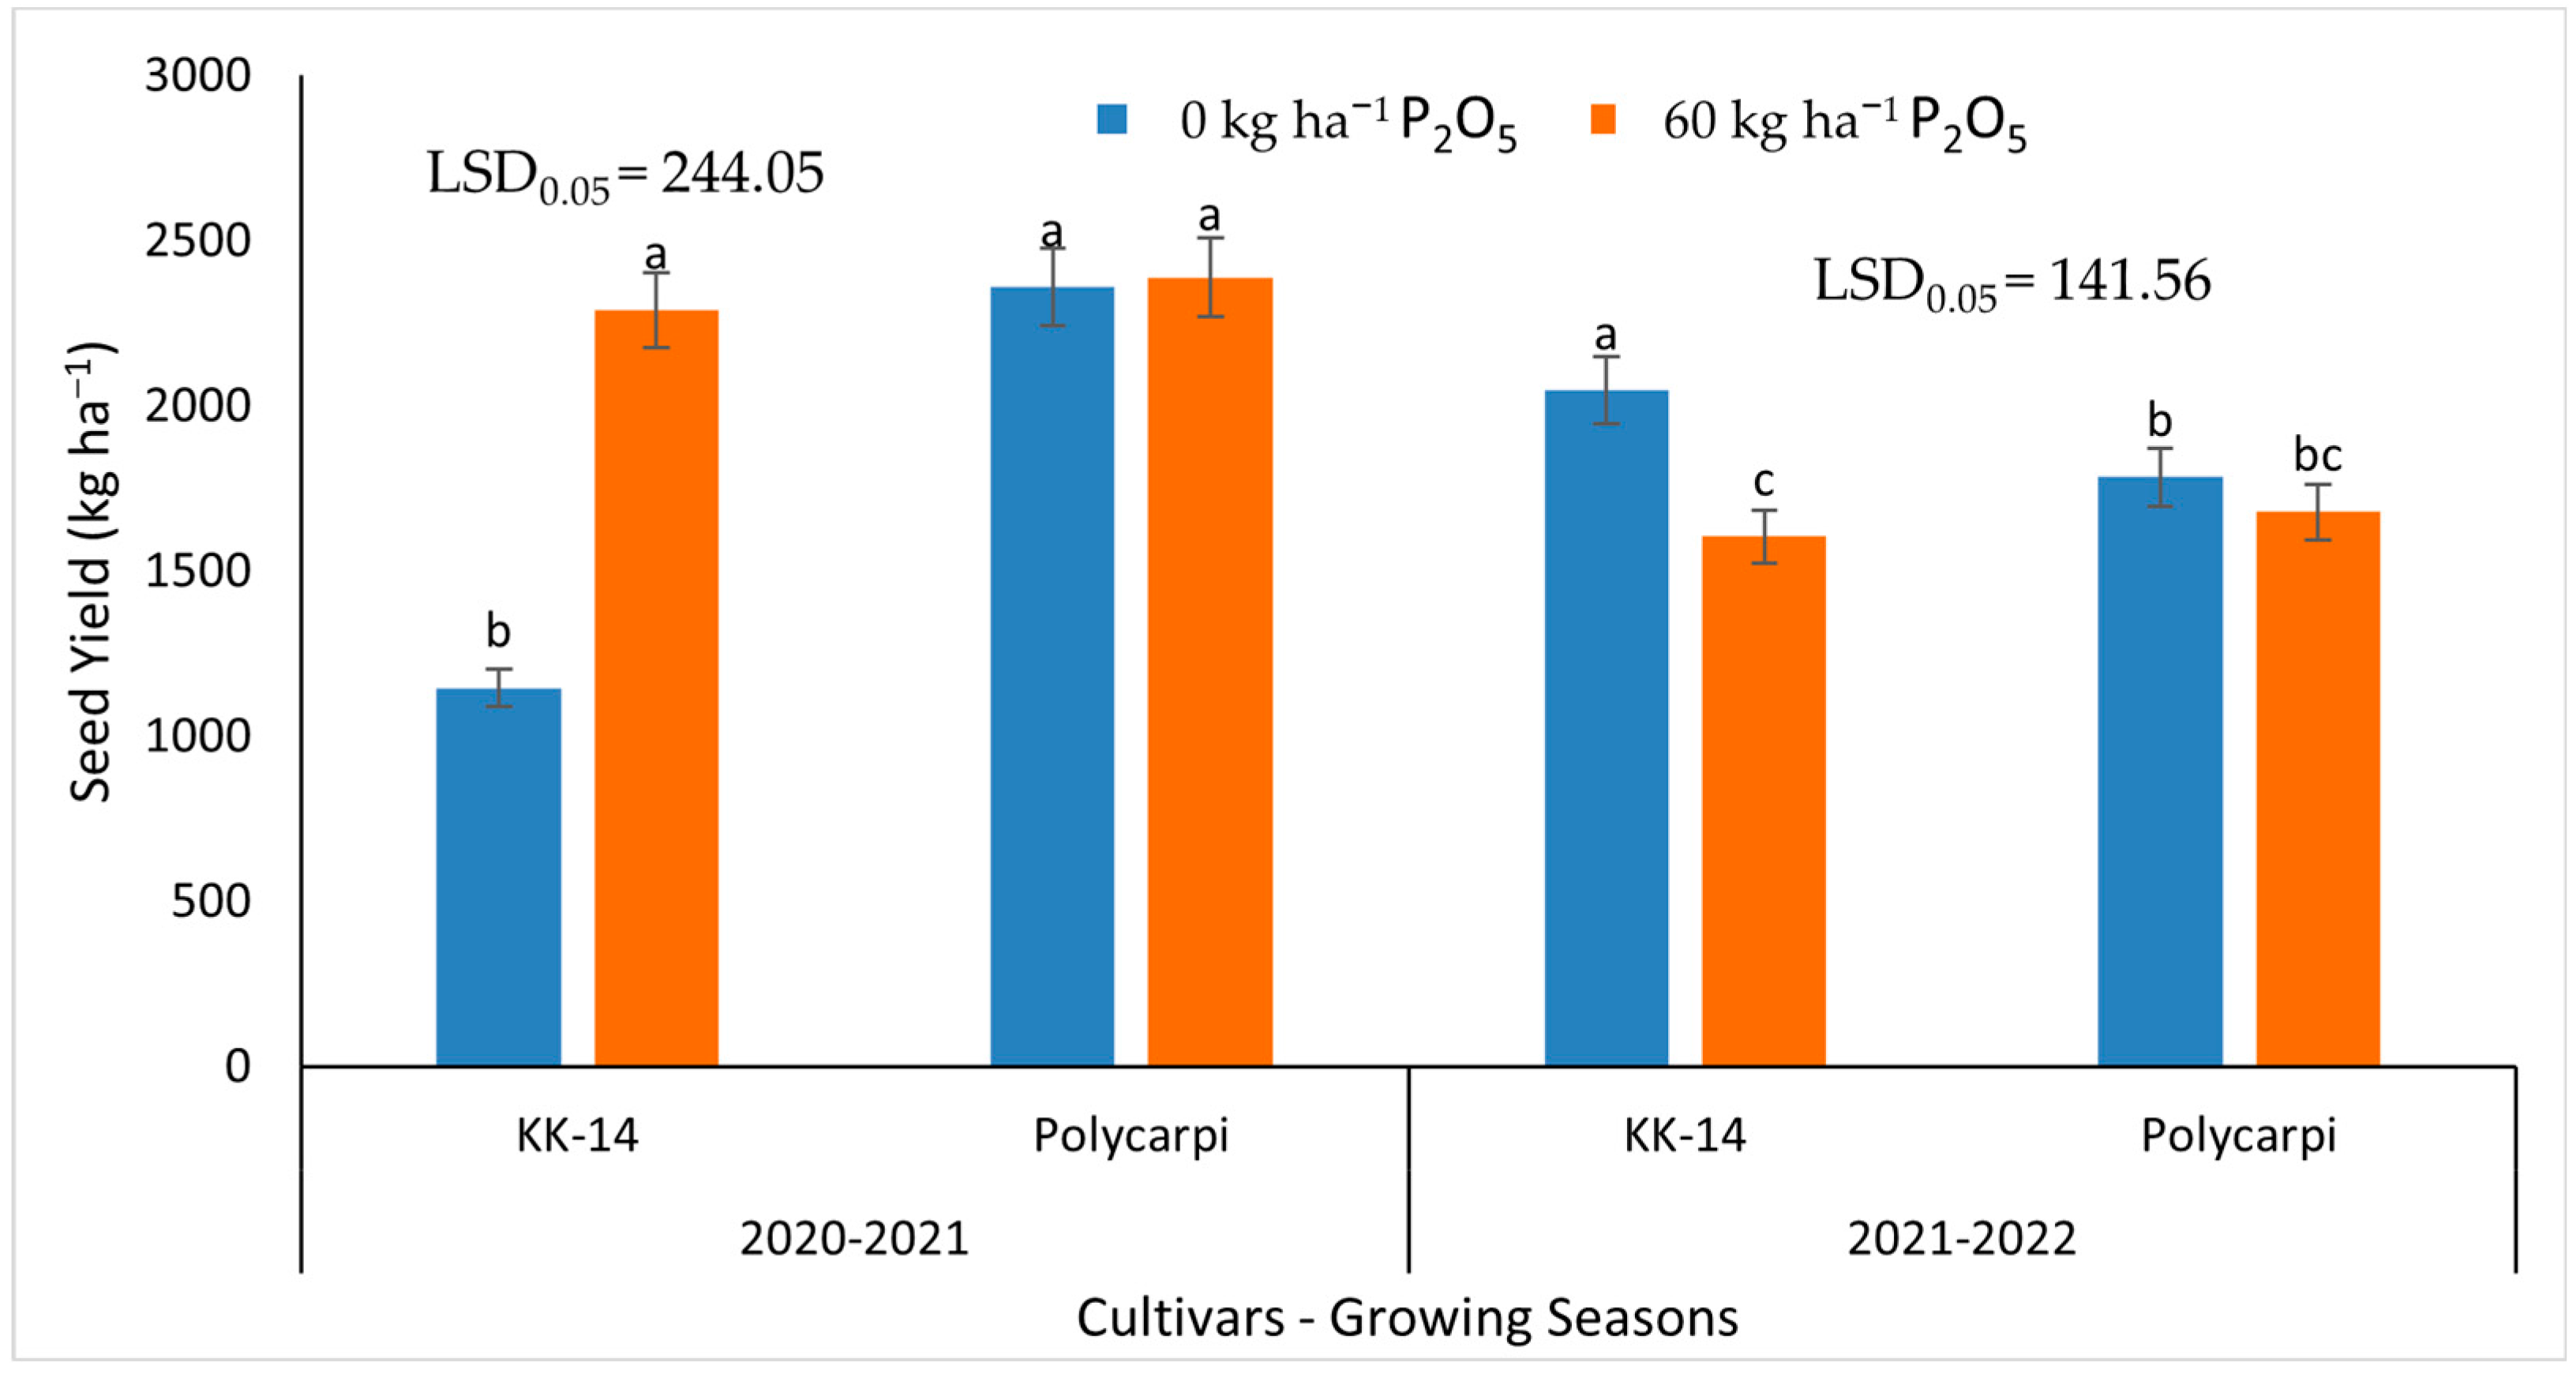
3.3. Seed Yield and Yield Components

The number of seeds per pod was affected by the three-way interaction between year x treatment x cultivar. Specifically, during the first year, 2020–2021, there were no statistical differences between the two fertilizer treatments either on KK-14 or Polycarpi (Figure 16), although the highest numbers of seeds per pod were obtained from the 60 kg ha−1 of P2O5 treatment for KK-14 and the 0 kg ha−1 of P2O5 treatment for Polycarpi, with an average of fewer than four seeds per pod for each cultivar. On the other hand, during the 2021–2022 growing season, the number of seeds per pod was consistently higher than four, especially in the the 0 kg ha−1 of P2O5 treatment for KK-14 and the 60 kg ha−1 of P2O5 treatment for Polycarpi (Figure 16).
The number of pods per plant was affected by the year and the two-way interaction of year x cultivar. More specifically, between the two growing seasons, the number of pods per plant was higher in the first one for both KK-14 and Polycarpi, with an average of 19 and 22 pods per plant, respectively. In addition, the number of pods per plant for Polycarpi in the 2020–2021 season was significantly higher in the 0 kg ha−1 of P2O5 fertilizer treatment than in the 60 kg ha−1 of P2O5 treatment. This difference between the two fertilizer treatment for Polycarpi was observed again in the second year of experimentation (Figure 17). On the contrary, KK-14 did not show any significant difference between the two fertilizer treatments regarding the number of pods per plant (Figure 17).
Seed yield was affected by the main effect of the cultivar, the two-way interaction of year x cultivar, and also the three-way interaction of year x treatment x cultivar. According to Figure 16, KK-14 showed the greatest variation among the two fertilizer treatments and years of experimentation. More specifically, in 2020–2021, the seed yield of KK-14 was significantly higher in the 60 kg ha−1 of P2O5 treatment (2291 kg ha−1) compared to the non-fertilized plants (1147 kg ha−1). In contrast, during the second growing period, 2021–2022, the highest seed yield was obtained in the 0 kg ha−1 of P2O5 treatment, with an average of 2047 kg ha−1. Regarding the Polycarpi cultivar, in both years of the experiment, there were no significant differences between the two fertilizer treatments. However, during the 2020–2021 growing season, the highest seed yield was recorded, with an average of 2375 kg ha−1 (Figure 18).

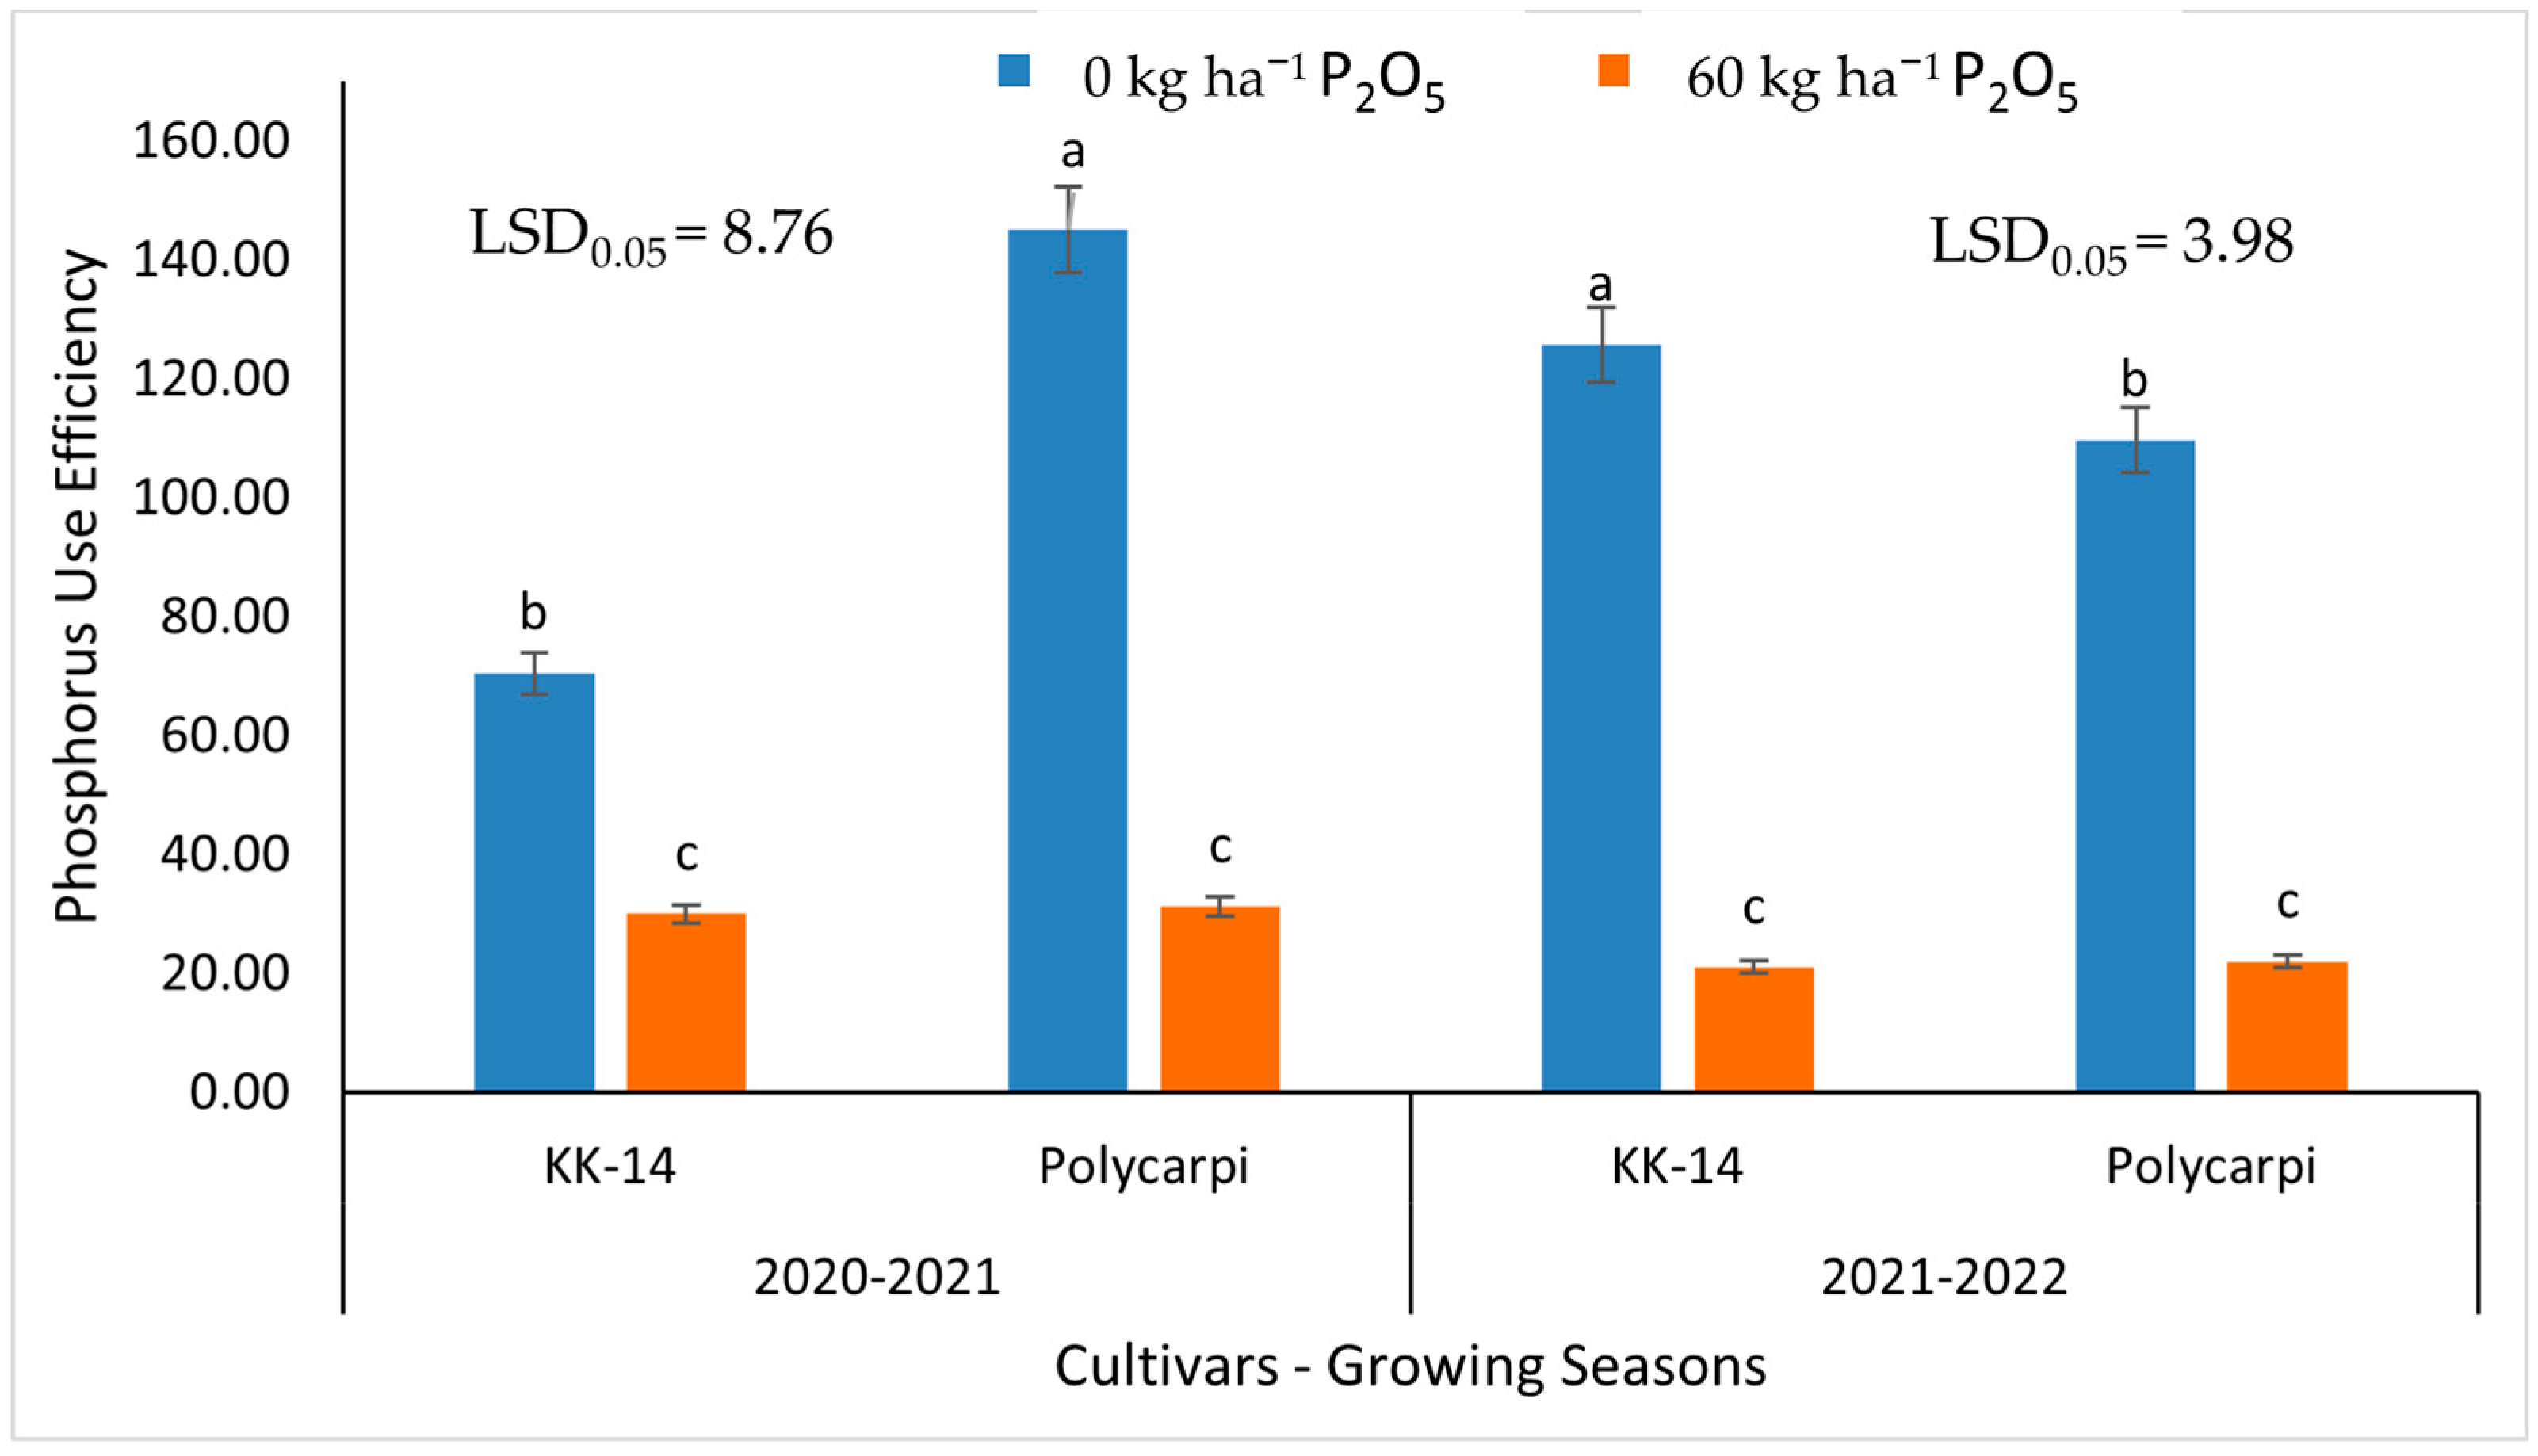
3.4. Phosphorus Use Efficiency

The phosphorus use efficiency (PUE) of the plants differed between the two fertilization treatments and also the two cultivars. More specifically, PUE was higher in the 60 kg ha−1 of P2O5 fertilization treatment in contrast to the 0 kg ha−1 of P2O5 treatment for both years and faba bean cultivars. The genotype with the highest PUE in the absence of phosphorus fertilization was Polycarpi in the first growing season. Additionally, during the second year, there was no significant difference between the two cultivars for both treatments of phosphorus fertilization (Figure 19).

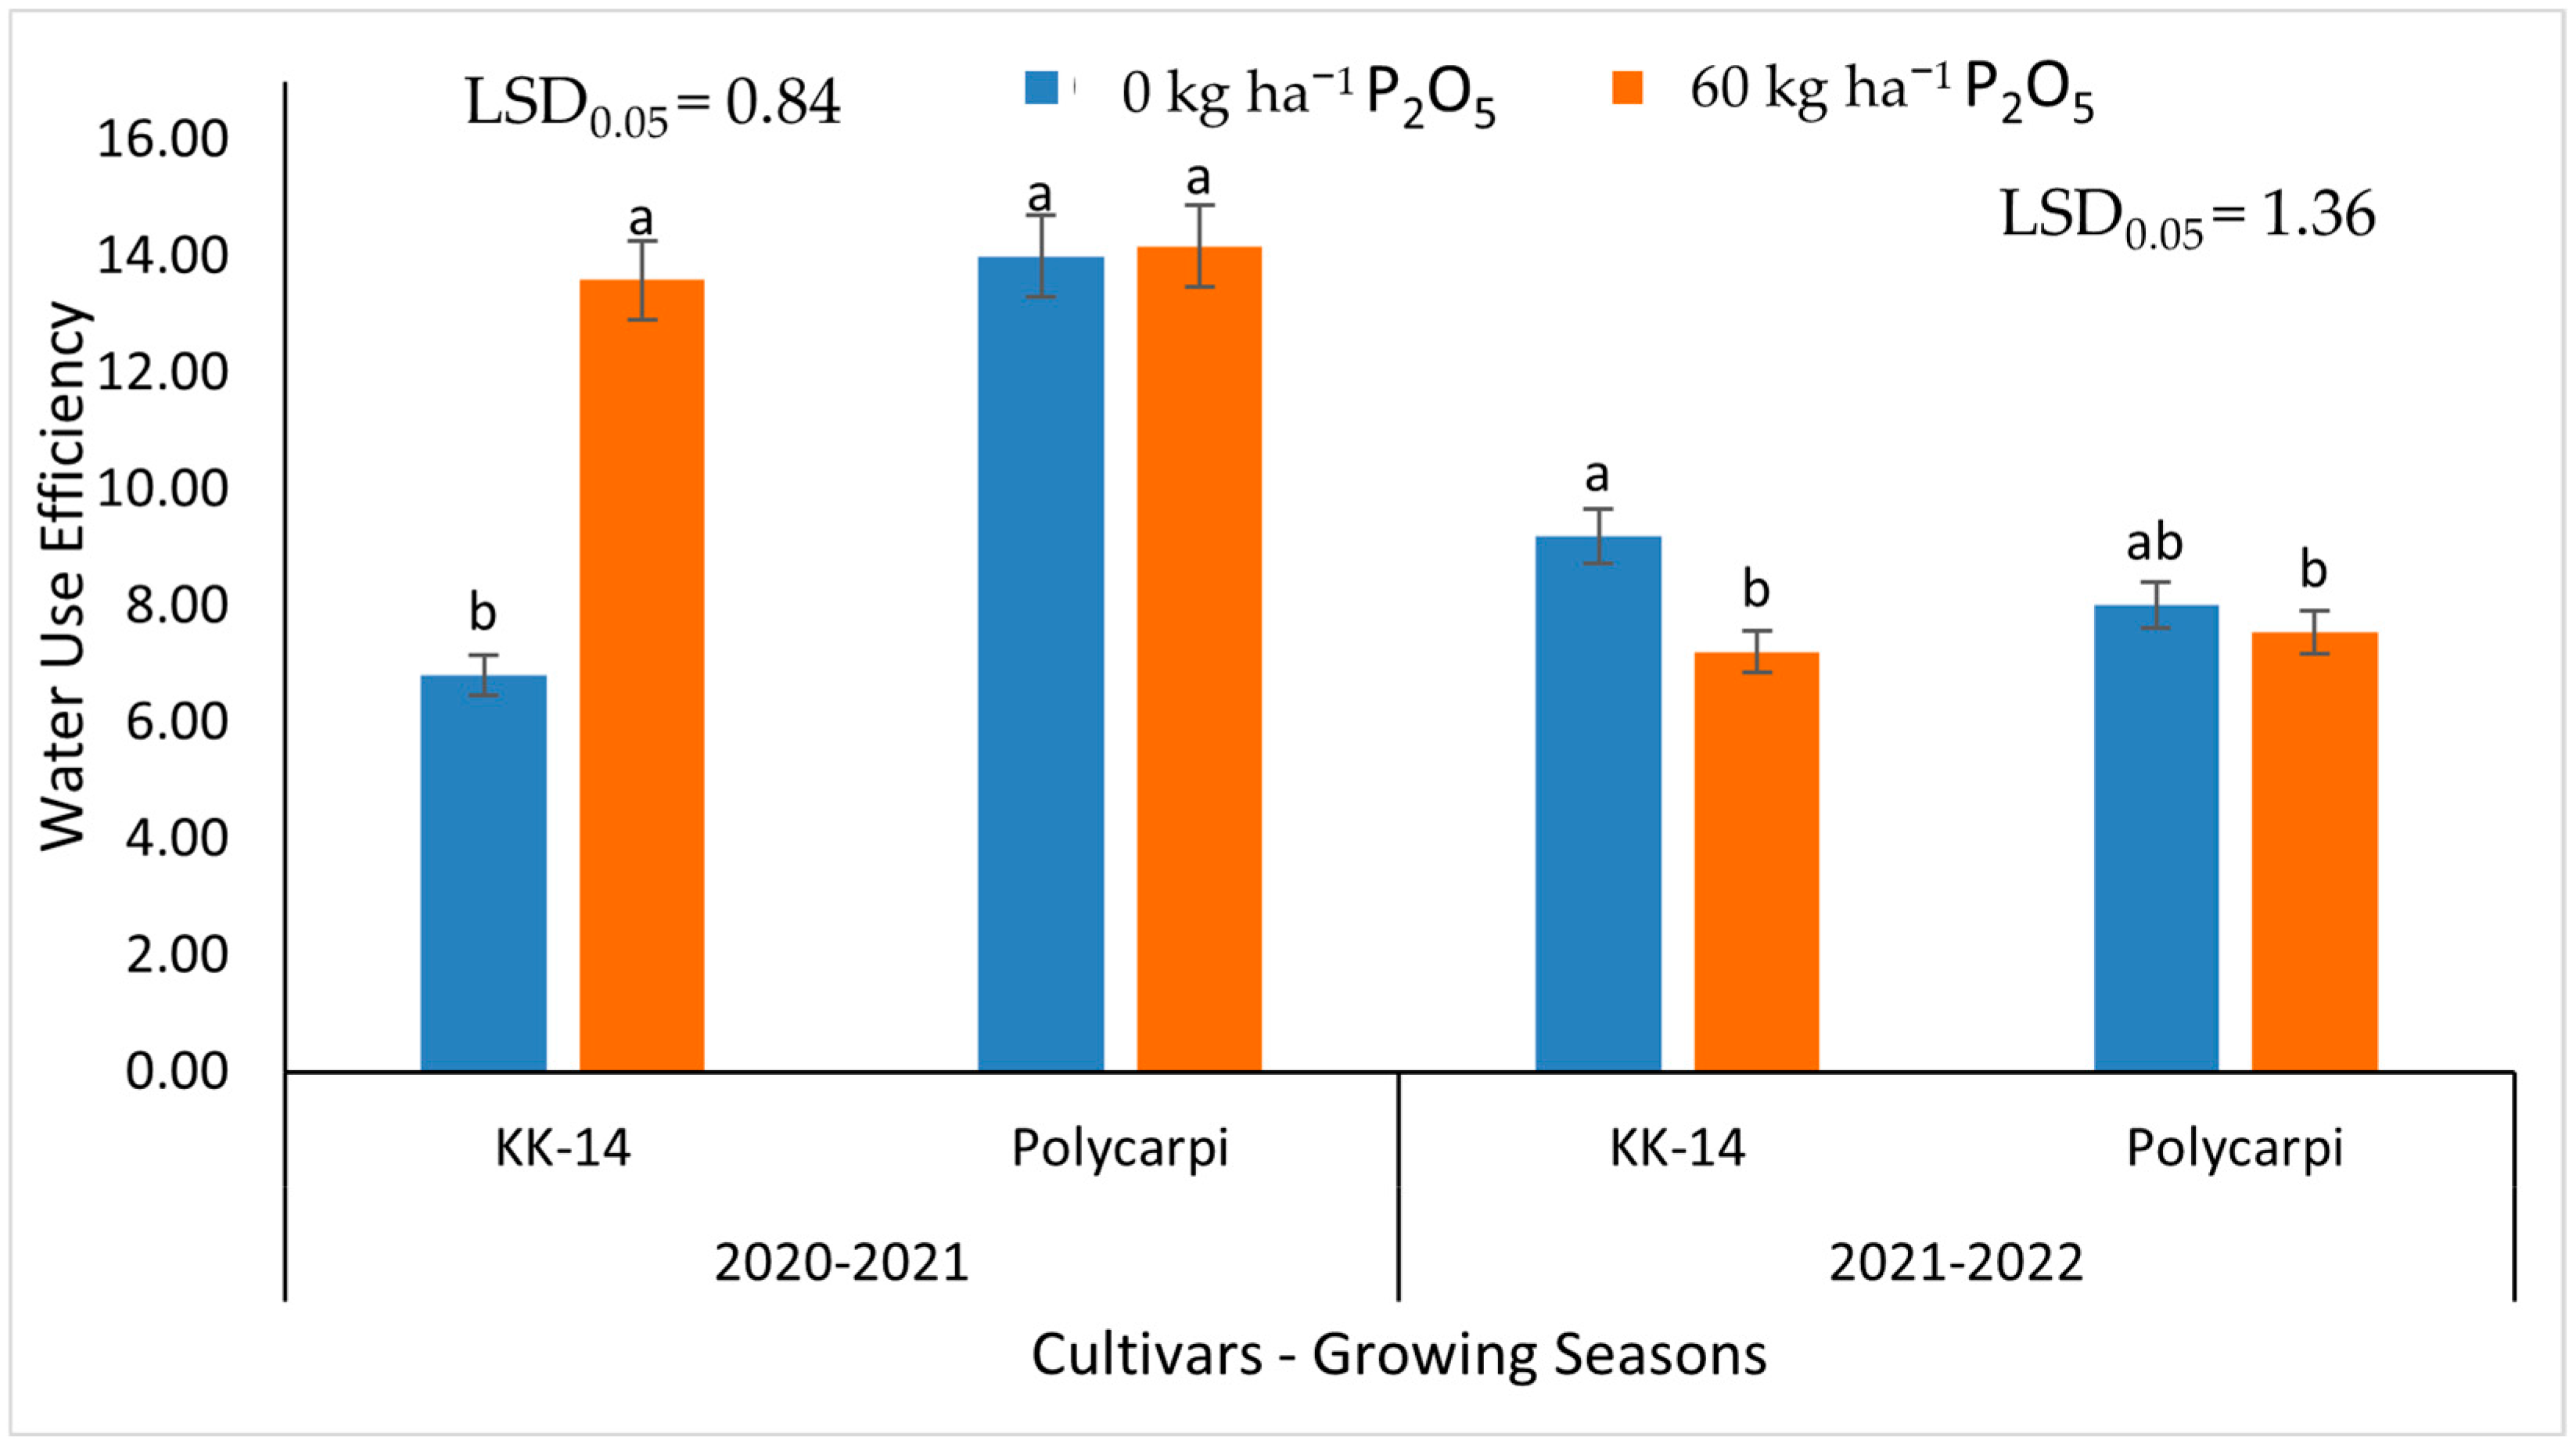
3.5. Water Use Efficiency

Water use efficiency (WUE) of faba bean cultivars varied between the two growing seasons and the two cultivars that were tested. During the first year of experimentation, plants of KK-14 showed higher values of WUE in the 60 kg ha−1 of P2O5 fertilization treatment compared with the 0 kg ha−1 of P2O5 treatment, while plants of Polycarpi did not present any differences among the fertilization treatments. In addition, in the second year, where the total rainfall was higher than the first and the plants did not face any drought stress, both faba bean cultivars had higher values of WUE in the 0 kg ha−1 of P2O5 treatment of phosphorus fertilization (Figure 20).

4. Discussion

4.1. Plant Height

Plant height is a crucial morphological characteristic with a strong positive correlation with biomass [36,37,38] and an impact on lodging susceptibility [37,39]. The study found that plant height was affected by the year, the growth stage, and the interactions of year x cultivar, treatment x cultivar, and year x growth stage. In the second year, both KK-14 and Polycarpi varieties exhibited the tallest plants in the 60 kg ha−1 of P2O5 treatment at the growing stage of physiological maturity of the plants (99.9 cm and 100.2 cm, respectively). Notably, the KK-14 variety was more affected by fertilization and especially by the phosphate fertilization treatment compared with the other cultivar that was used in the study. Plant height is a characteristic that can be affected by P fertilization, as was found in other studies [40,41]. However, there are studies which have reported that P did not have any significant effect on plant height when the plants are exposed to water stress, or different forms of P fertilization are applied to the plants [42,43]. This is because of the dryland conditions, or the fact that that the environment was not favorable for the growth and response of faba bean to P fertilization. In addition, plant height is a characteristic that is affected by the environment, as was shown in a previous study [33]. The plant height ranged from 14 cm up to 100.25 cm and it was similar to values reported in a previous study [33]. The plant height was at a desirable range for faba bean, as it is required to be high enough to suppress weeds but also not high enough to be resistant to lodging [37,39].

4.2. Leaf Area Index

Leaf area index (LAI) is a critical characteristic that influences photosynthesis, assimilate partitioning, and biomass yield [42,44]. Our study found that LAI was influenced by the year and growth stage, as well as the two-way interaction of year × growth stage and the three-way interaction of treatment × cultivar × growth stage. There was a consistent increase in LAI from the beginning of flowering until the stage of full bloom. P fertilization can increase LAI, as was reported in other studies [42,45,46]. However, some studies report no significant effect of P fertilization on LAI, especially under water stress, or limited responsiveness to phosphorus fertilization [42,47].

4.3. Leaf Greenness Index (SPAD)

Leaf greenness index, measured with a chlorophyll meter, provides valuable information about nutrient deficiencies in different crop species [48,49,50,51]. It measures the degree of green color and also the degree of the leaf senescence, which is an important characteristics for most plants that allows them to stay green [49,50,51]. The duration of leaf greenness is a characteristic that is important for a long duration of photosynthesis and also ensures high yield [50,52]. Leaf greenness index was found to be affected by P, the year, variety, growth stage, and the two-way interactions of year × variety and year × growth stage. The highest values of the SPAD index were found in the first growing season, 2020–2021, on the KK-14 cultivar in all stages, except for full blooming, where Polycarpi showed a higher index value in the 0 kg ha−1 of P2O5 fertilizer treatment (44.7). Furthermore, fertilization with P increased SPAD values, especially at the beginning of flowering, in comparison with non-fertilized plants for both faba bean cultivars. Leaf greenness index is a characteristic that was affected by P fertilization in other studies [50,52,53,54].

4.4. Gas Exchange Measurements

Photosynthesis is a process that can be affected by P fertilization in different crop species [55,56]. One of the most important characteristics is the assimilation rate of CO2 that was affected by the by the year and growth stage. The reduction in photosynthesis was reported in different nutrient deficiencies and has also been observed in many plant species [42,55,57]. In the present study, there was a reduction in the assimilation rate in most cultivars and this reduction was usually followed by a decrease in gs and E.
The transpiration rate (E) was affected by the year and the two-way interactions of treatment × variety and year × growth stage. Transpiration rate is a measurement that shows how well water is utilized, together with the other measurements such as Ci and gs [58]. The two cultivars showed different responses to P fertilization treatments, as the KK-14 cultivar showed a lower transpiration rate in the non-fertilized treatment (0 kg ha−1 of P2O5) compared to the 60 kg ha−1 of P2O5 fertilizer treatment in both growth stages. In contrast, Polycarpi had a higher transpiration rate in the 0 kg ha−1 of P2O5 fertilizer treatment either at full bloom or at the physiological maturity of the plants. In the second growing season, 2021–2022, for both cultivars, KK-14 and Polycarpi, higher transpiration rates values were obtained with the 0 kg ha−1 of P2O5 fertilizer treatment in contrast to 60 kg ha−1 of P2O5 treatment, at full bloom and at the physiological maturity of the plants.
The stomatal conductance to water vapor (gs) was affected by the year, growth stage, and several interactions, such as treatment × variety and the three-way interaction of year × treatment × variety [42]. Differences related to the stomatal conductance of faba bean plants were observed also in other studies in which different P fertilization or water stress treatments were applied [59,60].
The intercellular CO2 concentration (Ci) was in the range of 161 up to 282 μmol CO2 m−2 s−1 and it was affected by the year, growth stage, and the two-way interaction of year x treatment. At physiological maturity, the concentration of the intercellular CO2 was higher in the 60 kg ha−1 of P2O5 treatment compared with the 0 kg ha−1 of P2O5 treatment. Similar values were reported by others [55,61,62].
The use of physiological characteristics in many important crop species such as legumes was not explored, and can be used to find genotypes that are better adapted to different nutrient stresses or assist in finding genotypes that are better adapted across environments. Also, the physiological characteristics have to be as simple as possible, the measurements should be fast, and there is a need for good correlations with tolerance and good interspecific genetic variation [56,63,64,65].
The significant variability of the physiological characteristics that were used in this study were reported in other studies [33,65,66]. Therefore, these parameters can be used for the selection of faba bean cultivars that are tolerant of P deficiency. In addition, in other studies, a higher effect of P fertilization was seen at the highest P rates [67].

4.5. Seed Yield and Yield Components Determination

Seed yield was relatively high in the two years of the experiments, as it ranged from 1147 up to 2375 kg ha−1. Similar seed yields were observed by other researchers and especially in the Mediterranean area [68,69,70,71], indicating that these genotypes can be cultivated in this area. Seed yield was not always affected by P fertilization as P is immobilized in the soil [67,68,72,73,74,75].
The number of pods per plant (PP) ranged from 15.5 to 18.1 between genotypes and the number of seeds per plant (SP) from 48.8 to 57.6. The number of pods per plant was higher in the present study compared with lower values found in other studies, which were in the range from 5.13 up to 10.17 [40].
The number of seeds per pod ranged from 3.25 up to 4.25 and was affected by the three-way interaction of year × treatment × variety. The highest numbers of seeds per pod were obtained from the 60 kg ha−1 of P2O5 treatment for KK-14 and the 0 kg ha−1 of P2O5 treatment for Polycarpi with an average of less than four seeds per pod for each cultivar. On the other hand, in the 2021–2022 growing season, the number of seeds per pod was consistently higher than four due to the better weather conditions in this year [67,68,71].
The differences that were found in the present study may be because of the limited P availability of the soil, as P can react with soil components and can become unavailable for plant roots. In addition, the experiments that were conducted were field experiments under real conditions in which the results were dependent on the environment. In addition, water stress or high temperatures can affect the growth of faba beans and can affect their response to P fertilization [76,77].
There are several reports that show an increase in faba bean seed yield with P fertilization [78,79,80,81]. On the other hand, there are also studies that do not show any effect of P fertilization [82]. This effect can be because of the depletion of soil fertility over time and the rotation systems that the farmers are using; the different genotypes that were used [41,81] found that for a seed yield of 1000 kg ha−1, faba bean requires 13–14 kg ha−1 of P2O5. In addition, the response of faba bean seed yield on P fertilization depends on the residual fertility level of nutrients in the soil [79,83,84].

4.6. Phosphorus Use Efficiency

The phosphorus use efficiency (PUE) of the plants was different between the two fertilization treatments and the two cultivars. The genotype with the highest PUE in the absence of phosphorus fertilization was Polycarpi in the first growing season, showing that it can be better adapted to a P-limited environment. Different environmental conditions, water stress, and water salinity could also contribute to different values in plants’ PUE [5]. Additionally, differences in PUE between the genotypes that were tested have been observed in some studies [73,85,86,87].

4.7. Water Use Efficiency

The water use efficiency (WUE) of faba bean cultivars varied between the two growing seasons and the two cultivars that were tested. In addition, in the second year, where the total rainfall was higher than the first and the plants did not face any drought stress, both faba bean cultivars had higher values of WUE in the 0 kg ha−1 of P2O5 treatment of phosphorus fertilization. Also, rainfall was low in both growing seasons, as it was 168.6 mm and 222.8 mm in the 2020–2021 and 2021–2022 growing seasons, respectively. The values of WUE efficiency were in the range of 6.8 and 14 kg mm−1 and are close to values reported in other studies [86,87,88,89]. Also, the low rainfall indicates that this is a limited factor for higher growth and yield.

5. Conclusions

The data from this study revealed that the two cultivars of faba beans responded differently under the two levels of phosphorus (P) and also over the two years of the study. Additionally, certain characteristics used to assess the response to P fertilization, such as leaf area index (LAI) and plant height, demonstrated their potential for determining the response to P fertilization. The cultivar that exhibited greater P efficiency was Polycarpi, as it demonstrated the highest seed yield and outperformed the KK-14 cultivar that was tested. Nevertheless, further research is required to identify more P-efficient cultivars that can thrive and yield better results in P-limited environments. These findings can be particularly beneficial for farmers, especially in dryland areas like the Mediterranean region.

Supplementary Materials

The following supporting information can be downloaded at: https://www.mdpi.com/article/10.3390/su151713172/s1, Table S1: Descriptive statistics (mean ± common SE, median, standard deviation, minimum and maximum values) for the two consecutive years of experimentation regarding the plant height, Leaf Area Index, Leaf greenness index (SPAD), Assimilation rate, Transpiration rate, Stomatal conductance, Intercellular CO2, seeds per pod, pods per plant, seed yield, Phosphorus Use Efficiency and Water Use Efficiency. Table S2. Descriptive statistics (mean ± common SE, median, standard deviation, minimum and maximum values) for the two fertilization treatments regarding the plant height, Leaf Area Index, Leaf greenness index (SPAD), Assimilation rate, Transpiration rate, Stomatal conductance, Intercellular CO2, seeds per pod, pods per plant, seed yield, Phosphorus Use Efficiency and Water Use Efficiency. Table S3. Descriptive statistics (mean ± common SE, median, standard deviation, minimum and maximum values) for the two faba bean cultivars regarding the plant height, Leaf Area Index, Leaf greenness index (SPAD), Assimilation rate, Transpiration rate, Stomatal conductance, Intercellular CO2, seeds per pod, pods per plant, seed yield, Phosphorus Use Efficiency and Water Use Efficiency. Table S4. Analysis of variance results (significance of the effects) for testing the effects (main and interactions) of Year (Y), Fertilization treatment (T), Cultivar (C), and Growth Stages (S) on the measured plant characteristics. Table S5. Mean values of plant height, for the two faba bean cultivars (KK-14 and Polycarpi) during the two years of experimentation (2020–2021 and 2021–2022), the two fertilization treatments (0 kg ha−1 P2O5 and 60 kg ha−1 P2O5) and the four growth stages. Table S6. Mean values of Leaf Area Index, for the two faba bean cultivars (KK-14 and Polycarpi) during the two years of experimentation (2020–2021 and 2021–2022), the two fertilization treatments (0 kg ha−1 P2O5 and 60 kg ha−1 P2O5) and the four growth stages.; Table S7. Mean values of Leaf Greenness Index, for the two faba bean cultivars (KK-14 and Polycarpi) during the two years of experimentation (2020–2021 and 2021–2022), the two fertilization treatments (0 kg ha−1 P2O5 and 60 kg ha−1 P2O5) and the four growth stages. Table S8. Mean values of Intercellular CO2, for the two faba bean cultivars (KK-14 and Polycarpi) during the two years of experimentation (2020–2021 and 2021–2022), the two fertilization treatments (0 kg ha−1 P2O5 and 60 kg ha−1 P2O5) and the two growth stages. Table S9. Mean values of plants’ Transpiration rate, for the two bean cultivars (KK-14 and Polycarpi) during the two years of experimentation (2020–2021 and 2021–2022), the two fertilization treatments (0 kg ha−1 P2O5 and 60 kg ha−1 P2O5) and the two growth stages. Table S10. Mean values of plants’ Assimilation rate, for the two faba bean cultivars (KK-14 and Polycarpi) during the two years of experimentation (2020–2021 and 2021–2022), the two fertilization treatments (0 kg ha−1 P2O5 and 60 kg ha−1 P2O5) and the two growth stages. Table S11. Mean values of stomatal conductance, for the two faba bean cultivars (KK-14 and Polycarpi) during the two years of experimentation (2020–2021 and 2021–2022), the two fertilization treatments (0 kg ha−1 P2O5 and 60 kg ha−1 P2O5) and the two growth stages. Table S12. Mean values of seeds per pod, for the two faba bean cultivars (KK-14 and Polycarpi) during the two years of experimentation (2020–2021 and 2021–2022) and the two fertilization treatments (0 kg ha−1 P2O5 and 60 kg ha−1 P2O5). Table S13. Mean values of pods per plant, for the two faba bean cultivars (KK-14 and Polycarpi) during the two years of experimentation (2020–2021 and 2021–2022) and the two fertilization treatments (0 kg ha−1 P2O5 and 60 kg ha−1 P2O5). Table S14. Mean values of seed yield, for the two faba bean cultivars (KK-14 and Polycarpi) during the two years of experimentation (2020–2021 and 2021–2022) and the two fertilization treatments (0 kg ha−1 P2O5 and 60 kg ha−1 P2O5). Table S15. Mean values of Water Use Efficiency, for the two faba bean cultivars (KK-14 and Polycarpi) during the two years of experimentation (2020–2021 and 2021–2022) and the two fertilization treatments (0 kg ha−1 P2O5 and 60 kg ha−1 P2O5).; Table S16. Mean values of Phosphorus Use Efficiency, for the two faba bean cultivars (KK-14 and Polycarpi) during the two years of experimentation (2020–2021 and 2021–2022) and the two fertilization treatments (0 kg ha−1 P2O5 and 60 kg ha−1 P2O5).; Table S17. Analysis of variance for the parameter of plant height. Table S18. Analysis of variance for the parameter of Leaf Area Index.; Table S19. Analysis of variance for the parameter of Leaf Greenness Index.; Table S20. Analysis of variance for the parameter of plants’ Assimilation rate of CO2.; Table S21. Analysis of variance for the parameter of plants’ intercellular CO2. Table S22. Analysis of variance for the parameter of stomatal conductance.; Table S23. Analysis of variance for the parameter of plants’ transpiration rate. Table S24. Analysis of variance for the parameter of seeds per pod. Table S25. Analysis of variance for the parameter of pods per plant.; Table S26. Analysis of variance for the seed yield. Table S27. Analysis of variance for the parameter of Water Use Efficiency. Table S28. Analysis of variance for the parameter of Phosphorus Use Efficiency.

Author Contributions

All the authors have contributed to the manuscript significantly. P.P. conducted the experiments and analyzed the results. C.D. was responsible for conducting the experiment and writing the manuscript. All authors have read and agreed to the published version of the manuscript.

Funding

This research has been co-financed by the European Regional Development Fund of the European Union and Greek national funds through the Operational Program Competitiveness, Entrepreneurship and Innovation, under the call RESEARCH–CREATE–INNOVATE (project code: T1EDK-04448).

Institutional Review Board Statement

There is no institutional review board statement.

Informed Consent Statement

Not applicable.

Data Availability Statement

The data presented in this study are available on request from the corresponding author.

Acknowledgments

We are grateful to Anastasios Lithourgidis and the personnel of the University Farm of the Aristotle University of Thessaloniki for assistance with the field experiments. Also, we are grateful to George Menexes for assistance with the statistical analysis of the data.

Conflicts of Interest

The authors declare no conflict of interest.

References

  1. Araujo, S.S.; Beebe, S.; Crespi, M.; Delbreli, B.; Gonzaliz, E.M.; Gruber, V. Abiotic stress responses in legumes: Strategies used to cope with environmental challenges. Crit. Rev. Plant Sci. 2015, 34, 237–280. [Google Scholar] [CrossRef]
  2. Aranjuelo, I.; Arrese-Igor, C.; Molero, G. Nodule performance within a changing environmental context. J. Plant Physiol. 2014, 171, 1076–1090. [Google Scholar] [CrossRef]
  3. Jensen, E.S.; Peoples, M.B.; Boddey, R.M.; Gresshoff, P.M.; Hauggaard-Nielsen, H.; Alves, B., Jr.; Morrison, M.J. Legumes for mitigation of climate change and the provision of feedstock for biofuels and biorefineries. A review. Agron. Sustain. Dev. 2012, 32, 329–364. [Google Scholar] [CrossRef]
  4. Oliveira, H.R.; Tomás, D.; Silva, M.; Lopes, S.; Viegas, W.; Veloso, M.M. Genetic Diversity and Population Structure in Vicia faba L. Landraces and Wild Related Species Assessed by Nuclear SSRs. PLoS ONE 2016, 11, e0154801. [Google Scholar] [CrossRef] [PubMed]
  5. Attia, M.A. Response of some Faba Bean Cultivars (Vicia Faba L.) to Phosphorus Fertilization Under El-Tur and New Valley Conditions. Alex. Sci. Exch. J. 2023, 44, 93–108. [Google Scholar]
  6. Derese, T. Evaluation of Faba bean (Vicia faba L.) varieties for yield and yield contributing traits in the southern parts of Ethiopia. Acad. J. 2021, 8, 18–22. [Google Scholar]
  7. Abou-Khater, L.; Maalouf, F.; Jighly, A.; Rubiales, D.; Kumar, S. Adaptability and stability of faba bean (Vicia faba L.) accessions under diverse environments and herbicide treatments. Plants 2022, 11, 251. [Google Scholar] [CrossRef] [PubMed]
  8. Vogelsang-O’Dwyer, M.; Petersen, I.L.; Joehnke, M.S.; Sørensen, J.C.; Bez, J.; Detzel, A.; Busch, M.; Krueger, M.; O’Mahony, J.A.; Arendt, E.K.; et al. Comparison of faba bean protein ingredients produced using dry fractionation and isoelectric precipitation: Techno-functional, nutritional and environmental performance. Foods 2020, 9, 322. [Google Scholar] [CrossRef]
  9. Robinson, G.H.J.; Balk, J.; Domoney, C. Improving pulse crops as a source of protein, starch and micronutrients. Nutr. Bull. 2019, 44, 202–215. [Google Scholar] [CrossRef]
  10. Koivisto, J.M.; Benjamin, L.R.; Lane, G.P.F.; Davies, W.P. Forage potential of semi-leafless grain peas. Grass Forage Sci. 2003, 58, 220–223. [Google Scholar] [CrossRef]
  11. Considine, M.J.; Siddique, K.H.; Foyer, C.H. Nature’s pulse power: Legumes, food security and climate change. J. Exp. Bot. 2017, 68, 1815–1818. [Google Scholar] [CrossRef]
  12. Valliyodan, B.; Ye, H.; Song, L.; Murphy, M.; Shannon, J.G.; Nguyen, H.T. Genetic diversity and genomic strategies for improving drought and waterlogging tolerance in soybeans. J. Exp. Bot. 2017, 68, 1835–1849. [Google Scholar] [CrossRef]
  13. Thuynsma, R.; Valentine, A.; Kleinert, A. Phosphorus deficiency affects the allocation of below-ground resources to combined cluster roots and nodules in Lupinus albus. J. Plant Physiol. 2014, 171, 285–291. [Google Scholar] [CrossRef]
  14. Vance, C.P.; Uhde-Stone, C.; Allan, D.L. Phosphorus acquisition and use: Critical adaptations by plants for securing a nonrenewable resource. New Phytol. 2003, 157, 423–447. [Google Scholar] [CrossRef]
  15. Sulieman, S.; Ha, C.V.; Schulze, J.; Tran, L.S.P. Growth and nodulation of symbiotic Medicago truncatula at different levels of phosphorus availability. J. Exp. Bot. 2013, 64, 2701–2712. [Google Scholar] [CrossRef] [PubMed]
  16. Tesfaye, M.; Liu, J.; Allan, D.L.; Vance, C.P. Genomic and genetic control of phosphate stress in legumes. Plant Physiol. 2007, 144, 594–603. [Google Scholar] [CrossRef]
  17. Wang, Y.; Lambers, H. Root-released organic anions in response to low phosphorus availability: Recent progress, challenges, and future perspectives. Plant Soil 2020, 447, 135–156. [Google Scholar] [CrossRef]
  18. Carpenter, S.R. Eutrophication of aquatic ecosystems: Biostability and soil phosphorus. Proc. Natl. Acad. Sci. USA 2005, 102, 10002–10005. [Google Scholar] [CrossRef]
  19. MacDonald, G.K.; Bennett, E.M.; Potter, P.A.; Ramankutty, N. Agronomic phosphorus imbalances across the world’s croplands. Proc. Natl. Acad. Sci. USA 2011, 108, 3086–3091. [Google Scholar] [CrossRef] [PubMed]
  20. Mekonnen, M.M.; Hoekstra, A.Y. Global anthropogenic phosphorus loads to freshwater and associated grey water footprints and water pollution levels: A high-resolution global study. Water Resour. Res. 2018, 54, 345–358. [Google Scholar] [CrossRef]
  21. Fixen, P.E.; Johnston, A.M. World fertilizer nutrient reserves: A view to the future. J. Sci. Food Agric. 2012, 92, 1001–1005. [Google Scholar] [CrossRef] [PubMed]
  22. Johnston, A.E.; Poulton, P.R.; Fixen, P.E.; Curtin, D. Phosphorus: Its efficient use in agriculture. Adv. Agron. 2014, 123, 177–228. [Google Scholar]
  23. Singh, A.K.; Bharati, R.C.; Manibhushan, N.C.; Pedpati, A. An assessment of faba bean (Vicia faba L.) current status and future prospect. Afr. J. Agric. Res. 2013, 8, 6634–6641. [Google Scholar]
  24. Hinsinger, P.; Bengough, A.G.; Vetterlein, D.; Young, I.M. Rhizosphere: Biophysics, biogeochemistry and ecological relevance. Plant Soil 2009, 321, 117–152. [Google Scholar]
  25. Richardson, A.E.; Barea, J.-M.; McNeill, A.M.; Prigent-Combaret, C. Acquisition of phosphorus and nitrogen in the rhizosphere and plant growth promotion by microorganisms. Plant Soil 2009, 321, 305–339. [Google Scholar]
  26. Shen, J.; Yuan, L.; Zhang, J.; Li, H.; Bai, Z.; Chen, X.; Zhang, W.; Zhang, F. Phosphorus dynamics: From soil to plant. Plant Physiol. 2011, 156, 997–1005. [Google Scholar] [PubMed]
  27. Jones, D.L.; Oburger, E. Solubilization of Phosphorus by Soil Microorganisms. In Phosphorus in Action; Bünemann, E., Oberson, A., Frossard, E., Eds.; Soil Biology; Springer: Berlin/Heidelberg, Germany, 2011; Volume 26. [Google Scholar] [CrossRef]
  28. Oburger, E.; Jones, D.L.; Wenzel, W.W. Phosphorus saturation and pH differentially regulate the efficiency of organic acid anion-mediated P solubilization mechanisms in soil. Plant Soil 2011, 341, 363–382. [Google Scholar]
  29. Wang, Q.; Wang, J.; Yang, Y.; Du, W.; Zhang, D.; Yu, D.; Cheng, H. A genome-wide expression profile analysis reveals active genes and pathways coping with phosphate starvation in soybean. BMC Genom. 2016, 17, 192. [Google Scholar]
  30. Henry, J.L.; Slinkard, A.E.; Hogg, T.J. The effect of phosphorus fertilizer on establishment, yield and quality of pea, lentil and faba bean. Can. J. Plant Sci. 2011, 75, 395–398. [Google Scholar] [CrossRef]
  31. Mitran, T.; Meena, R.S.; Lal, R.; Layek, J.; Kumar, S.; Datta, R. Role of soil phosphorus on legume production. In Legumes for Soil Health and Sustainable Management; Springer: Singapore, 2018; pp. 487–510. [Google Scholar]
  32. Adjei-Nsiah, S.; Alabi, B.U.; Ahiakpa, J.K.; Kanampiu, F. Response of Grain Legumes to Phosphorus Application in the Guinea Savanna Agro-Ecological Zones of Ghana. Agron. J. 2018, 110, 1089–1096. [Google Scholar]
  33. Papastylianou, P.; Vlachostergios, D.N.; Dordas, C.; Tigka, E.; Papakaloudis, P.; Kargiotidou, A.; Pratsinakis, E.; Koskosidis, A.; Pankou, C.; Kousta, A.; et al. Genotype X environment interaction analysis of faba bean (Vicia faba L.) for biomass and seed yield across different environments. Sustainability 2021, 13, 2586. [Google Scholar]
  34. Kalamartzis, I.; Dordas, C.; Georgiou, P.; Menexes, G. The use of appropriate cultivar of basil (Ocimum basilicum) can increase water use efficiency under water stress. Agronomy 2020, 10, 70. [Google Scholar]
  35. Moll, R.H.; Kamprath, E.J.; Jackson, W.A. Analysis and interpretation of factors which contribute to efficiency of nitrogen utilization. Agron. J. 1982, 74, 562–564. [Google Scholar]
  36. Link, W.; Abdelmula, A.A.; von Kittlitz, E.; Bruns, S.; Riemer, H.; Stelling, D. Genotypic variation for drought tolerance in Vicia faba. Plant Breed. 1999, 118, 477–483. [Google Scholar]
  37. Bodner, G.; Kronberga, A.; Lepse, L.; Olle, M.; Vågen, I.M.; Rabante, L.; Fernandez, J.A.; Ntatsi, G.; Balliu, A.; Rewald, B. Trait identification of faba bean ideotypes for Northern European environments. Eur. J. Agron. 2018, 96, 1–12. [Google Scholar]
  38. Ulukan, H.; Culer, M.; Keskin, S. A path coefficient analysis of some yield and yield components in faba bean (Vicia faba L.) genotypes. Pak. J. Biol. Sci. 2003, 6, 1951–1955. [Google Scholar]
  39. Olle, M.; Williams, I.H.; Rosa, E. Selecting appropriate faba bean var. minor varieties for production under Northern European environmental conditions. Acta Agric. Scand. B Soil Plant Sci. 2019, 69, 432–438. [Google Scholar]
  40. Adak, M.S.; Kibritci, M. Effect of nitrogen and phosphorus levels on nodulation and yield components in faba bean (Vicia faba L.). Legum. Res. 2016, 39, 991–994. [Google Scholar]
  41. Ghizaw, A.; Mamo, T.; Yilma, Z.; Molla, A.; Ashagre, Y. Nitrogen and phosphorus effects on faba bean yield and some yield components. J. Agron. Crop. Sci. 1999, 182, 167–174. [Google Scholar]
  42. Oukaltouma, K.; El Moukhtari, A.; Lahrizi, Y.; Mouradi, M.; Farissi, M.; Willems, A.; Qaddoury, A.; Bekkaoui, F.; Ghoulam, C. Phosphorus deficiency enhances water deficit impact on some morphological and physiological traits in four faba bean (Vicia faba L.) varieties. Ital. J. Agron. 2021, 16, 1–13. [Google Scholar]
  43. Hashemabadi, D. Phosphorus fertilizers effect on the yield and yield components of faba bean (Vicia faba L.). Ann. Biol. Res. 2013, 4, 181–184. [Google Scholar]
  44. Nkaa, F.; Nwokeocha, O.W.; Ihuoma, O. Effect of phosphorus fertilizer on growth and yield of cowpea (Vigna unguiculata). J. Pharm. Biol. Sci. 2014, 9, 74–82. [Google Scholar]
  45. Yemane, A.; Skjelvåg, A.O. Effects of fertilizer phosphorus on yield traits of dekoko (Pisum sativum var. abyssinicum) under field conditions. J. Agron. Crop. Sci. 2003, 189, 14–20. [Google Scholar]
  46. Jia, Y.; Gray, V.M. Influence of phosphorus and nitrogen on photosynthetic parameters and growth in Vicia faba L. Photosynthetica 2004, 42, 535–542. [Google Scholar]
  47. Carpici, E.B. Changes in leaf area index, light interception, quality and dry matter yield of an abandoned rangeland as affected by the different levels of nitrogen and phosphorus fertilization. Turkish J. Field Crop. 2011, 16, 117–120. [Google Scholar]
  48. Dordas, C.A. Chlorophyll meter readings, N leaf concentration and their relationship with N use efficiency in oregano. J. Plant Nutr. 2017, 40, 391–403. [Google Scholar]
  49. Filiz, O.; Takil, E.; Kayan, N. The role of plant growth promoting rhizobacteria (PGPR) and phosphorus fertilization in improving phenology and physiology of bean (Phaseolus vulgaris L.). Appl. Ecol. Environ. Res. 2021, 19, 2507–2517. [Google Scholar]
  50. Lahmoud, A.M.; Laftta, W.M. Effect of planting distances and phosphate fertilization on two cultivars of broad bean (Vicia faba L). Int. J. Aquatic Sci. 2022, 13, 379–393. [Google Scholar]
  51. Saudy, H.; Noureldin, N.; Mubarak, M.; Fares, W.; Elsayed, M. Cultivar selection as a tool for managing soil phosphorus and faba bean yield sustainability. Arch. Agron. Soil Sci. 2020, 66, 414–425. [Google Scholar] [CrossRef]
  52. Fouda, K.F. Effect of phosphorus level and some growth regulators on productivity of faba bean (Vicia faba L.). Egypt. J. Soil Sci. 2017, 57, 73–87. [Google Scholar]
  53. Baccari, B.; Krouma, A. Rhizosphere Acidification Determines Phosphorus Availability in Calcareous Soil and Influences Faba Bean (Vicia faba) tolerance to P Deficiency. Sustainability 2023, 15, 6203. [Google Scholar] [CrossRef]
  54. Dordas, C.A.; Sioulas, C. Safflower yield, chlorophyll content, photosynthesis, and water use efficiency response to nitrogen fertilization under rainfed conditions. Ind. Crops Prod. 2008, 27, 75–85. [Google Scholar] [CrossRef]
  55. Jia, Y.S.; Gray, V.M. The influence N and P supply on the short-term responses to elevated CO2 in faba bean (Vicia faba L.). S. Afr. J. Bot. 2007, 73, 466–470. [Google Scholar] [CrossRef]
  56. Jin, J.; Tang, C.; Armstrong, R.; Sale, P. Phosphorus supply enhances the response of legumes to elevated CO2 (FACE) in a phosphorus-deficient vertisol. Plant Soil 2012, 358, 91–104. [Google Scholar] [CrossRef]
  57. Oukaltouma, K.; El Moukhtari, A.; Lahrizi, Y.; Makoudi, B.; Mouradi, M.; Farissi, M.; Willems, A.; Qaddoury, A.; Bekkaoui, F.; Ghoulam, C. Physiological, biochemical and morphological tolerance mechanisms of faba bean (Vicia faba L.) to the combined stress of water deficit and phosphorus limitation. J. Soil Sci. Plant Nutr. 2022, 22, 1632–1646. [Google Scholar] [CrossRef]
  58. Farooq, M.; Gogoi, N.; Barthakur, S.; Baroowa, B.; Bharadwaj, N.; Alghamdi, S.S.; Siddique, K.H. Drought stress in grain legumes during reproduction and grain filling. J. Agron. Crop Sci. 2017, 203, 81–102. [Google Scholar] [CrossRef]
  59. Cheto, S.; Oukaltouma, K.; Chamkhi, I.; Ibn Yassar, A.; Benmrid, B.; Qaddoury, A.; Kouisni, L.; Geistlinger, J.; Zeroual, Y.; Bargaz, A.; et al. Inoculation with rhizobacterial consortia alleviates combined water and phosphorus deficit stress in intercropped faba bean and wheat. Front. Sustain. Food Syst. 2023, 7, 203. [Google Scholar] [CrossRef]
  60. Khazaei, H.; Wach, D.; Pecio, A.; Vandenberg, A.; Stoddard, F.L. Genetic analysis of photosynthesis-related traits in faba bean (Vicia faba) for crop improvement. Plant Breed. 2019, 138, 761–769. [Google Scholar] [CrossRef]
  61. Jillani, G.; Sulieman, S.; Mühling, K.H. Carbohydrate utilization by belowground organs defines the capacity of faba bean to exploit organic phosphorus sources. J. Soil Sci. Plant Nutr. 2022, 185, 567–577. [Google Scholar] [CrossRef]
  62. Li, B.; Liu, J.; Shi, X.; Han, X.; Chen, X.; Wei, Y.; Xiong, F. Effects of belowground interactions on crop yields and nutrient uptake in maize-faba bean relay intercropping systems. Arch. Agron. Soil Sci. 2021, 69, 314–325. [Google Scholar] [CrossRef]
  63. Stoddard, F.L.; Balko, C.; Erskine, W.; Khan, H.R.; Link, W.; Sarker, A. Screening techniques and sources of resistance to abiotic stresses in cool season food legumes. Euphytica 2006, 147, 167–186. [Google Scholar] [CrossRef]
  64. Jensen, E.S.; Peoples, M.; Hauggaard, N.H. Review: Faba beans in cropping systems. Field Crop. Res. 2010, 115, 203–216. [Google Scholar] [CrossRef]
  65. Reckling, M.; Döring, T.F.; Bergkvist, G.; Chemielewski, F.-M.; Stoddard, F.L.; Watson, C.A.; Sedding, S.; Bachinger, J. Grain legume yield instability has increased over 60 years in long-term experiments as measured by a scale-adjusted coefficient of variation. Asp. Appl. Biol. 2018, 138, 15–20. [Google Scholar]
  66. Mwanamwenge, J.; Loss, S.P.; Siddique, K.H.M.; Cocks, P.S. Effect of water stress during floral initiation, flowering and podding on the growth and yield of faba bean (Vicia faba L.). Eur. J. Agron. 1999, 11, 1–11. [Google Scholar] [CrossRef]
  67. Sarkar, S.; Sarkar, A.; Zaman, A. Effect of irrigation and phosphorus levels on broad bean (Vicia faba L.) for improving growth, yield and water extraction pattern. Legum. Res. 2017, 40, 257–263. [Google Scholar] [CrossRef]
  68. Daoui, K.; Karrou, M.; Mrabet, R.; Fatemi, Z.; Draye, X.; Ledent, J.F. Genotypic variation of phosphorus use efficiency among Moroccan faba bean varieties (Vicia faba major) under rainfed conditions. J. Plant Nutr. 2012, 35, 34–48. [Google Scholar] [CrossRef]
  69. Di Paolo, E.; Garofalo, P.; Rinaldi, M. Irrigation and nitrogen fertilization treatments on productive and qualitative traits of broad bean (Vicia faba var. minor L.) in a Mediterranean environment. Legum. Res. 2015, 38, 209–218. [Google Scholar]
  70. Youseif, S.H.; Abd El-Megeed, F.H.; Saleh, S.A. Improvement of faba bean yield using Rhizobium/Agrobacterium inoculant in low-fertility sandy soil. Agronomy 2017, 7, 2. [Google Scholar] [CrossRef]
  71. Brahimi, S.; Toumatia, O.; Drevon, J.J.; Lazali, M.; Zitouni, A. Genotypic variability for tolerance to low soil phosphorus availability in faba bean (Vicia faba L.). J. Plant Nutr. 2022, 46, 167–183. [Google Scholar] [CrossRef]
  72. Bolland, M.D.A.; Siddique, K.H.M.; Brennan, R.F. Grain yield responses of faba bean (Vicia faba L.) to applications of fertiliser phosphorus and zinc. Austr. J. Exper. Agric. 2000, 40, 849–857. [Google Scholar] [CrossRef]
  73. Nebiyu, A.; Diels, J.; Boeckx, P. Phosphorus use efficiency of improved faba bean (Vicia faba) varieties in low-input agro-ecosystems. J. Soil Sci. Plant Nutr. 2016, 179, 347–354. [Google Scholar] [CrossRef]
  74. Amanuel, A.; Ku¨hne, R.F.; Tanner, D.G.; Vlek, P.L.G. Biological nitrogen fixation in faba bean (Vicia faba L.) in the Ethiopian highlands as affected by P fertilization and inoculation. Biol. Fert. Soils 2000, 32, 353–359. [Google Scholar] [CrossRef]
  75. Klippenstein, S.R.; Khazaei, H.; Vandenberg, A.; Schoenau, J. Nitrogen and phosphorus uptake and nitrogen fixation estimation of faba bean in western Canada. Agron. J. 2022, 114, 811–824. [Google Scholar] [CrossRef]
  76. Burman, U.; Garg, B.K.; Kathju, S. Effect of phosphorus application on cluster bean under different intensities of water stress. J. Plant Nutr. 2009, 32, 668–680. [Google Scholar] [CrossRef]
  77. Bishop, J.; Potts, S.G.; Jones, H.E. Susceptibility of faba bean (Vicia faba L.) to heat stress during floral development and anthesis. J. Agron. Crop. Sci. 2016, 202, 508–517. [Google Scholar] [CrossRef]
  78. Saxena, M.C. Some agronomic and physiological aspects of the important food legume crops in West Asia [Middle East]. In Food Legume Improvement and Development: Proceedings of the a Workshop Held at the University of Aleppo, Aleppo, Syria, 2–7 May 1978; IDRC: Ottawa, ON, Canada, 1979. [Google Scholar]
  79. Murinda, M.V.; Saxena, M.C. Agronomy of faba beans, lentils, and chickpeas. In Faba BEANS, Kabuli Chickpeas, and Lentils in the 1980s; Saxena, M.C., Verma, S., Eds.; ICARDA: Aleppo, Syria, 1985; pp. 229–244. [Google Scholar]
  80. Bond, D.A.; Lawes, D.A.; Hawtin, G.C.; Saxena, M.C.; Stephens, J.S. Faba Bean (Vicia faba L.). In Grain Legume Crops; Summer field, R.J., Roberts, E.H., Eds.; Mackeys of Chatham: Kent, UK, 1985; pp. 199–265. [Google Scholar]
  81. Papendick, R.I.; Chowdhury, S.L.; Johansen, C. Managing systems for increasing productivity of pulses in dryland agriculture. In World Crops: Cool Season Food Legumes: A Global Perspective of the Problems and Prospects for Crop Improvement in Pea, Lentil, Faba Bean and Chickpea; Springer: Dordrecht, The Netherlands, 1988; pp. 237–255. [Google Scholar]
  82. Tsigie, A.; Woldeab, A. Fertilizer response trials on highland food legumes [Pisum sativum, Lens culinaris, Cicer arietinum, Vicia faba]. In Proceedings of the First National Cool-Season Food Legumes Review Conference, Addis Abeba, Ethiopia, 16–20 December 1993; ICARDA: Beirut, Lebanon, 1995. [Google Scholar]
  83. Hebblethwaite, P.D.; Hawtin, G.C.; Latman, P.J.W. The husbandry of establishment and maintenance. Faba Bean 1983, 271–312. [Google Scholar]
  84. Saxena, M.C.; Wassimi, N. Crop-weed competition studies in lentils. Lens 1980, 7, 55–57. [Google Scholar]
  85. Algraishi, A.H.A.; Alogaidi, F.F.M. Evaluation of the performance of some cultivars of Faba Bean Vicia faba L. under different levels of phosphorus. J. Kerbala Agric. Sci. 2022, 9, 227–238. [Google Scholar] [CrossRef]
  86. Houassine, D.; Latati, M.; Rebouh, N.Y.; Gérard, F. Phosphorus acquisition processes in the field: Study of faba bean cultivated on calcareous soils in Algeria. Arch. Agron. Soil Sci. 2020, 66, 168–181. [Google Scholar] [CrossRef]
  87. Belouchrani, A.S.; Drouiche, N.; Ziche, Z.I.; Lounici, H. Study of the Effect of Phosphorus on Mineral Nutrition of Faba Bean «Vicia fabae L.». J. Plant Growth Regul. 2022, 42, 1750–1761. [Google Scholar] [CrossRef]
  88. Alghamdi, S.S.; Al-Shameri, A.M.; Migdadi, H.M.; Ammar, M.H.; El-Harty, E.H.; Khan, M.A.; Farooq, M. Physiological and molecular characterization of faba bean (Vicia faba L.) genotypes for adaptation to drought stress. J. Agron. Crop. Sci. 2015, 201, 401–409. [Google Scholar] [CrossRef]
  89. Abd El-Mageed, T.A.; Belal, E.E.; Rady, M.O.; Abd El-Mageed, S.A.; Mansour, E.; Awad, M.F.; Semida, W.M. Acidified biochar as a soil amendment to drought stressed (Vicia faba L.) plants: Influences on growth and productivity, nutrient status, and water use efficiency. Agronomy 2021, 11, 1290. [Google Scholar] [CrossRef]
Figure 1. Weather conditions recorded daily (mean temperature and total rainfall) for both growing seasons, 2020–2021 and 2021–2022, of the experiment in the University Farm of Aristotle University in Thessaloniki. Weather data were recorded with an automatic weather station on-site.
Sustainability 15 13172 g001
Figure 2. Plant height (cm) for the first year, 2020–2021, in two fertilization treatments, for two faba bean cultivars and four growth stages. Means followed by the same letter do not differ significantly between the two fertilization treatments (0 kg ha−1 P2O5 and 60 kg ha−1 P2O5), the four growth stages (before anthesis, beginning of the anthesis, full bloom, and physiological maturity of plants), and the two genotypes (KK-14 and Polycarpi), according to the LSD0.05 (Least Significant Difference) test (p = 0.05).
Sustainability 15 13172 g002
Figure 3. Plant height (cm) for the second year, 2021–2022, in two fertilization treatments, with two faba bean cultivars and four growth stages. Means followed by the same letter do not differ significantly between the two fertilization treatments (0 kg ha−1 P2O5 and 60 kg ha−1 P2O5), the four growth stages (before anthesis, beginning of the anthesis, full bloom, and physiological maturity of plants), and the two genotypes (KK-14 and Polycarpi), according to the LSD0.05 (Least Significant Difference) test (p = 0.05).
Sustainability 15 13172 g003
Figure 4. Leaf area index for the first growing season, 2020–2021, in two fertilization treatments, for two faba bean cultivars and four growth stages. Means followed by the same letter do not differ significantly between the two fertilization treatments (0 kg ha−1 P2O5 and 60 kg ha−1 P2O5), the four growth stages (before anthesis, beginning of the anthesis, full bloom, and physiological maturity of plants) and the two genotypes (KK-14 and Polycarpi), according to the LSD0.05 (Least Significant Difference) test (p = 0.05).
Sustainability 15 13172 g004
Figure 5. Leaf area index for the second growing season, 2021–2022, in two fertilization treatments, for two cultivars, and four growth stages. Means followed by the same letter do not differ significantly between the two fertilization treatments (0 kg ha−1 P2O5 and 60 kg ha−1 P2O5), the four growth stages (before anthesis, beginning of the anthesis, full bloom and physiological maturity of plants) and the two genotypes (KK-14 and Polycarpi), according to the LSD0.05 (Least Significant Difference) test (p = 0.05).
Sustainability 15 13172 g005
Figure 6. Leaf greenness index for the first year growing season, 2020–2021, in two fertilization treatments, for two cultivars and four growth stages. Means followed by the same letter do not differ significantly between the two fertilization treatments (0 kg ha−1 P2O5 and 60 kg ha−1 P2O5), the four growth stages (before anthesis, beginning of the anthesis, full bloom, and physiological maturity of plants), and the two genotypes (KK-14 and Polycarpi), according to the LSD0.05 (Least Significant Difference) test (p = 0.05).
Sustainability 15 13172 g006
Figure 7. Leaf greenness index for the second growing season, 2021–2022, in two fertilization treatments, for two cultivars and four growth stages. Means followed by the same letter do not differ significantly between the two fertilization treatments (0 kg ha−1 P2O5 and 60 kg ha−1 P2O5), the four growth stages (before anthesis, beginning of the anthesis, full bloom, and physiological maturity of plants), and the two genotypes (KK-14 and Polycarpi), according to the LSD0.05 (Least Significant Difference) test (p = 0.05).
Sustainability 15 13172 g007
Figure 8. Assimilation rate of CO2 for the first growing season, 2020–2021, in two fertilization treatments, of the two cultivars and two growth stages. Means followed by the same letter do not differ significantly between the two fertilization treatments (0 kg ha−1 P2O5 and 60 kg ha−1 P2O5), the two growth stages (full bloom and physiological maturity of plants), and the two genotypes (KK-14 and Polycarpi), according to the LSD0.05 (Least Significant Difference) test (p = 0.05).
Sustainability 15 13172 g008
Figure 9. Assimilation rate of CO2 for the second growing season, 2021–2022, in two fertilization treatments, of the two cultivars and two growth stages. Means followed by the same letter do not differ significantly between the two fertilization treatments (0 kg ha−1 P2O5 and 60 kg ha−1 P2O5), the two growth stages (full bloom and physiological maturity of plants), and the two genotypes (KK-14 and Polycarpi), according to the LSD0.05 (Least Significant Difference) test (p = 0.05)).
Sustainability 15 13172 g009
Figure 10. Transpiration rate for the first growing season, 2020–2021, in two fertilization treatments, for the two cultivars and two growth stages. Means followed by the same letter do not differ significantly between the two fertilization treatments (0 kg ha−1 P2O5 and 60 kg ha−1 P2O5), the two growth stages (full bloom and physiological maturity of plants), and the two genotypes (KK-14 and Polycarpi), according to the LSD0.05 (Least Significant Difference) test (p = 0.05).
Sustainability 15 13172 g010
Figure 11. Transpiration rate for the second growing season, 2021–2022, in two fertilization treatments, for the two cultivars, and two growth stages. Means followed by the same letter do not differ significantly between the two fertilization treatments (0 kg ha−1 P2O5 and 60 kg ha−1 P2O5), the two growth stages (full bloom and physiological maturity of plants), and the two genotypes (KK-14 and Polycarpi), according to the LSD0.05 (Least Significant Difference) test (p = 0.05).
Sustainability 15 13172 g011
Figure 12. Stomatal conductance for the first growing season, 2020–2021, in two fertilization treatments, for two cultivars and two growth stages. Means followed by the same letter do not differ significantly between the two fertilization treatments (0 kg ha−1 P2O5 and 60 kg ha−1 P2O5), the two growth stages (full bloom and physiological maturity of plants), and the two genotypes (KK-14 and Polycarpi), according to the LSD0.05 (Least Significant Difference) test (p = 0.05).
Sustainability 15 13172 g012
Figure 13. Stomatal conductance for the second growing season, 2021–2022, in two fertilization treatments, for two cultivars and two growth stages. Means followed by the same letter do not differ significantly between the two fertilization treatments (0 kg ha−1 P2O5 and 60 kg ha−1 P2O5), the two growth stages (full bloom and physiological maturity of plants), and the two genotypes (KK-14 and Polycarpi), according to the LSD0.05 (Least Significant Difference) test (p = 0.05).
Sustainability 15 13172 g013
Figure 14. Intercellular CO2 concentration (Ci) for the first growing season, 2020–2021, in two fertilization treatments, for two cultivars and two growth stages. Means followed by the same letter do not differ significantly between the two fertilization treatments (0 kg ha−1 P2O5 and 60 kg ha−1 P2O5), the two growth stages (full bloom and physiological maturity of plants), and the two genotypes (KK-14 and Polycarpi), according to the LSD0.05 (Least Significant Difference) test (p = 0.05).
Sustainability 15 13172 g014
Figure 15. Intercellular CO2 concentration (Ci) for the second growing season, 2021–2022, in two fertilization treatments, for two cultivars and two growth stages. Means followed by the same letter do not differ significantly between the two fertilization treatments (0 kg ha−1 P2O5 and 60 kg ha−1 P2O5), the two growth stages (full bloom and physiological maturity of plants), and the two genotypes (KK-14 and Polycarpi), according to the LSD0.05 (Least Significant Difference) test (p = 0.05).
Sustainability 15 13172 g015
Figure 16. Number of seeds per pod for the two consecutive growing seasons, 2020–2021 and 2021–2022, in two fertilization treatments. Means in the same year followed by the same letter do not differ significantly between the two fertilization treatments (0 kg ha−1 P2O5 and 60 kg ha−1 P2O5) and the two genotypes (KK-14 and Polycarpi), according to the LSD0.05 (Least Significant Difference) test (p = 0.05).
Sustainability 15 13172 g016
Figure 17. Number of pods per plant for the two consecutive growing seasons, 2020–2021 and 2021–2022, in two fertilization treatments. Means in the same year followed by the same letter do not differ significantly between the two fertilization treatments (0 kg ha−1 P2O5 and 60 kg ha−1 P2O5) and the two genotypes (KK-14 and Polycarpi), according to the LSD0.05 (Least Significant Difference) test (p = 0.05).
Sustainability 15 13172 g017
Figure 18. Seed yield for the two consecutive growing periods, 2020–2021 and 2021–2022, in two fertilization treatments. Means in the same year followed by the same letter do not differ significantly between the two fertilization treatments (0 kg ha−1 P2O5 and 60 kg ha−1 P2O5) and the two genotypes (KK-14 and Polycarpi), according to the LSD0.05 (Least Significant Difference) test (p = 0.05).
Sustainability 15 13172 g018
Figure 19. Phosphorus use efficiency (PUE) for the two growing seasons, 2020–2021 and 2021–2022, in two fertilization treatments. Means in the same year followed by the same letter do not differ significantly between the two fertilization treatments (0 kg ha−1 P2O5 and 60 kg ha−1 P2O5) and the two genotypes (KK-14 and Polycarpi), according to the LSD0.05 (Least Significant Difference) test (p = 0.05).
Sustainability 15 13172 g019
Figure 20. Water use efficiency (WUE) for the two growing seasons, 2020–2021 and 2021–2022, in two fertilization treatments. Means in the same year followed by the same letter do not differ significantly between the two fertilization treatments (0 kg ha−1 P2O5 and 60 kg ha−1 P2O5) and the two genotypes (KK-14 and Polycarpi), according to the LSD0.05 (Least Significant Difference) test (p = 0.05).
Sustainability 15 13172 g020
Disclaimer/Publisher’s Note: The statements, opinions and data contained in all publications are solely those of the individual author(s) and contributor(s) and not of MDPI and/or the editor(s). MDPI and/or the editor(s) disclaim responsibility for any injury to people or property resulting from any ideas, methods, instructions or products referred to in the content.

