Article

Consumers’ Continued Intention to Use Online-to-Offline (O2O) Services in Omnichannel Retail: Differences between To-Shop and To-Home Models

1
Faculty of Human Ecology, Universiti Putra Malaysia, Serdang 43400, Malaysia
2
Business School, Guilin University of Technology, Guilin 541004, China
*
Author to whom correspondence should be addressed.
Sustainability 2023, 15(2), 945; https://doi.org/10.3390/su15020945
Submission received: 2 November 2022 / Revised: 26 December 2022 / Accepted: 3 January 2023 / Published: 4 January 2023
(This article belongs to the Section Economic and Business Aspects of Sustainability)

Abstract

:
Online-to-offline (O2O) commerce is a specific form of omnichannel retailing, wherein consumers search and purchase online and then consume offline. There are many different O2O models, and new O2O businesses are emerging during the COVID-19 pandemic; they can be categorized into two types of O2O services: to-shop and to-home. However, few studies have focused on consumer behavior in a comprehensive O2O scenario, and no study has attempted to compare the differences between to-shop and to-home consumers. Therefore, this study aimed to propose a universal model to predict consumers’ continued intention to use O2O services and to compare the differences between to-shop and to-home O2O in terms of factors influencing consumer behavior. A cross-sectional survey was conducted, and the PLS-SEM was used for data analysis. The basic SEM results indicated that habit, performance expectancy, confirmation, and offline facilitating conditions are the main predictors. The multigroup analysis showed differences between to-shop and to-home consumers regarding hedonic motivation, price value, and perceived risk. The study suggests that marketers and designers in various O2O scenarios can use the framework to build their business plans and develop different marketing strategies or sub-platforms for to-shop and to-home consumers.

1. Introduction

With digital technologies, mobile devices, and social media development, omnichannel strategies linking online and offline channels have become quite common in the retail industry. Multichannel is one of the first strategies retailers adopt in response to changes in the retail mix, wherein retailers encourage consumers to shop in multiple channels and decide whether to add new channels to the existing channel mix [1,2,3]. In multichannel retail, channels may be separated and compete with each other, and therefore channel integration is limited. As digitization continues and channels increase, multichannel retailing is moving to omnichannel retailing. Omnichannel is a popular strategy or technique that allows consumers to use multiple sales channels to make a single transaction, providing real-time, seamless, consistent, and personalized customer experience by channel integration [4,5,6]. Compared with the multichannel phase, omnichannel involves more channels, but the different channels become blurred as the natural borders between channels begin to disappear [7]. Online-to-offline (O2O) commerce is a specific form of omnichannel retailing, which emphasizes utilizing the online channel to drive offline sales [4,8,9]. In O2O commerce, consumers make purchases online and then consume offline. Specifically, they typically use mobile devices to search and buy nearby products or services and then pick up orders or consume them at offline places.
O2O commerce can be defined as a business model that seamlessly connects online channels with offline brick-and-mortar stores via various mobile Internet devices. O2O commerce is regarded as an upgrade and expansion of traditional e-commerce, such as business-to-consumer (B2C) commerce. Unlike traditional e-commerce business models, O2O commerce is location-based and focuses on local retail and service industries [10]. The concept of O2O began with group-buying in service industries such as catering, tourism, and entertainment [11]. Subsequently, it was extended to tangible products in the retail sector, with many local retailers beginning to use O2O platforms to find customers. During the COVID-19 pandemic, many traditional offline retailers tried to enter the O2O market or integrate channels, providing O2O services to attract consumers [12]. Nowadays, O2O commerce has played a significant role in various consumer life scenarios [13].
With the innovation of business models and the popularity of omnichannel retailing, consumer behavior has become increasingly complex. Channel-switching behaviors such as “showrooming” and “webrooming” are typical phenomena in the retail market [1,7]. Showrooming refers to consumers researching products offline but buying them online, while webrooming is the opposite [7]. In addition, omnichannel businesses are plagued by problems of “free-riding,” for example, consumers switching among retailers when moving across channels [14]. O2O commerce, trying to integrate online and offline channels, is considered one of the effective solutions to these problems [11]. While O2O commerce is promising, the understanding of this business model is limited. Consumer behavior has long been a question of great interest in the field of e-commerce and marketing, which is true in the O2O literature. This study focuses on consumers’ O2O behavior (i.e., continued intention to use O2O services) and is expected to provide insights into O2O literature and its practice.
Since its emergence, O2O commerce has been admired by numerous businesses, especially those small- and medium-sized enterprises that lack funds for omnichannel promotion [15]. Local brick-and-mortar stores can use the O2O platforms to expand the geographic scope of their business, increase market visibility, and attract more consumers to improve their profitability [12]. More and more companies are starting to provide O2O services. Even ByteDance has started to enter the O2O market in China by using Douyin (TikTok), a popular social media, as an O2O platform. Although O2O commerce has been demonstrated to be a successful business model, its intensity and sustainability remain open questions [10]. Recently, numerous O2O-related startups or platforms have terminated their businesses, and one of the reasons is that they lack an understanding of consumer behavior [15]. Consumers’ continued use of O2O services is crucial to the survival of the businesses involved. Therefore, it is necessary to study the factors determining consumers’ intention to continue using O2O services. However, related works are limited to date, as O2O commerce is an emerging business model.
O2O commerce covers a wide range of local businesses. Previous studies have only involved a single scenario, with the most widely discussed being O2O food delivery [13,16,17,18,19]. However, O2O services exist not only in the food industry but also in other local retail and service sectors, such as beauty [20], furniture [21], and hotels [22]. Business models are changing due to technological advancements [4], allowing numerous new O2O scenarios to emerge. Since there is no universal model to understand consumer behavior in a general O2O context, stakeholders may not know which theory or model can help them develop market strategies when new O2O scenarios emerge. Although O2O scenarios are diverse and are still being updated, their essence is the same: the online-to-offline channel integration [10]. Thus, the development of a universal model for predicting consumers’ O2O behavior is of both theoretical and practical significance.
There are two segments in the O2O market: “to-shop” and “to-home” [23,24]. To-shop O2O refers to paying or booking online but consuming in-store. In this model, consumers can utilize location-based technologies to easily find and enter targeted brick-and-mortar stores to pick up orders or experience services. A business model called “buy online and pick up in store” [25] is one of the types of to-shop O2O. By contrast, to-home O2O generally refers to consumers receiving products or services at their homes or workplaces utilizing instant home delivery service. The food delivery service is the most visible example of to-home O2O, e.g., [13,16,17]. Factors influencing consumer behavior may be different between to-shop and to-home O2O. This market segmentation is apparent. However, no previous study has investigated the differences between these two models in a general O2O context. Although Wang et al. [26] and Yang et al. [13] have discussed the differences between food in-store and food delivery services in the food O2O context, there is no evidence that these differences are significant or that these findings apply to other O2O scenarios.
Given the above-mentioned literature gaps, this study aims to propose a universal model to predict consumers’ continued intention to use O2O services and to compare the differences between to-shop and to-home O2O in terms of factors influencing consumer behavior. The importance and originality of this study are in the exploration of the differences between to-shop and to-home models in a general O2O context.

2. Literature Review

2.1. Theories and Models

Different theories and models exist in the literature regarding consumer behavior. Traditional models of consumer behavior were developed in the 1960s and 1970s, such as Howard and Sheth [27] and Fishbein and Ajzen [28]. After the rise of e-commerce, researchers considered that consumer online behavior is different from offline behavior and, as a consequence, requires new theories or models [29]. Since e-commerce is often treated as innovative information systems by consumers [30], information technology literature based on social psychology theories is relevant to understanding consumers’ behavior related to e-commerce [31]. Haryanti and Subriadi [32] have shown that many technology acceptance and usage theories have been extensively used in the e-commerce literature. More recently, the emergence of O2O commerce seemed to complicate the situation because it involved online and offline channels. Nevertheless, previous theories or models have been applied to study consumer behavior in O2O commerce, as shown in Table 1.
According to a thematic review of factors influencing consumer behavior in O2O commerce, UTAUT2 was the theory matching the most themes [10]. However, few studies have used UTAUT2 to predict consumers’ O2O behavior, except for Agarwal and Sahu [16] and Lee et al. [68] applying it to the O2O food delivery context. In addition, Venkatesh et al. [70], the founders of UTAUT2, suggested that researchers should make necessary adaptations and omit irrelevant constructs based on specific contexts rather than have the urge to replicate all the elements in UTAUT2. Regarding explaining consumers’ continued intention, ECT/ECM was the most popular theory/model in O2O literature. Researchers often tended to adopt new constructs outside the theory to predict consumers’ intention to continue using O2O services, e.g., [55,57], indicating that the original theory was insufficient to address the research question. In fact, ECT/ECM was generally used as a supporting theory to explain the effects of confirmation and satisfaction.

2.2. Continued Intention

Information system continuance at the consumer level is central to the survival of many businesses in various e-commerce markets [53], because acquiring new customers may cost as much as five times more than retaining existing ones [30]. Continued intention in the O2O context refers to a consumer’s intention to continue using an O2O service (e.g., to-shop or to-home service) to purchase products and services, which is similar to the term repurchase intention or reuse intention. According to Bhattacherjee [53], both continued use and repurchase decisions follow an initial acceptance or purchase decision. They are influenced by the initial experience and can potentially lead to an ex-post reversal of the initial decision. Satisfied consumers continue using an information system service or repurchase the same product, while dissatisfied ones discontinue using them or switch to alternative products [31,52,53].
Recently, the continued intention has been studied in many different innovation contexts, such as online social networks [71], mobile food delivery applications [72], mobile payment [73], etc. In O2O literature, some studies investigated continued intention in the context of O2O food delivery [43,51,68], O2O tourism [22,57]), and community O2O [41], while others did not mention specific O2O scenarios. Most studies did not highlight whether they were in a to-shop or to-home context. However, consumers’ information technology use behaviors may vary by context. Previous studies have not shown that their findings apply to other O2O scenarios.

2.3. Factors Influencing Continued Intention

According to ECT [52] or ECM [53], satisfaction is the primary determinant of consumers’ continued use of a particular service or information system. The connection between consumer satisfaction and continued intention has been broadly discussed. For example, Lin et al. [74] showed that satisfaction is a crucial determinant of consumers’ continued intention on social networking sites; Shang and Wu [75] further showed that continuance intention would cause a purchase only if mobile shopping satisfied the consumers’ needs. Studies in the O2O context have also provided additional support for that relationship. Zhang and Kim [50] demonstrated that satisfaction is the factor that directly and solely determines consumers’ intention to reuse O2O food delivery services. Prassida et al. [22] revealed that online and offline satisfaction significantly positively affect consumers’ continuance intention to use O2O services in tourism. Thus, the connection between satisfaction and continued intention has been firmly established in various contexts. Researchers should pay more attention to other factors that influence continued intention.
Although satisfaction is obviously a primary determinant of consumers’ continued intention, other factors also directly or indirectly affect it. Choi et al. [43] showed that online service quality (i.e., convenience, safety, and economy) and offline service quality (i.e., accuracy and speed) have significant direct and indirect effects on the reuse intention of an O2O delivery service. Hsu and Lin [55] illustrated the direct effects of perceived utilitarian value and perceived hedonic value on continuance intention to use O2O applications. Zhang [57] pointed out that ongoing trust determines consumers’ intention to continue using the tourism O2O platform. While these studies have contributed beneficial insights into O2O continuance, empirical research on this issue remains underexplored, as factors influencing consumers’ continued intention in the O2O context have been loosely theorized.

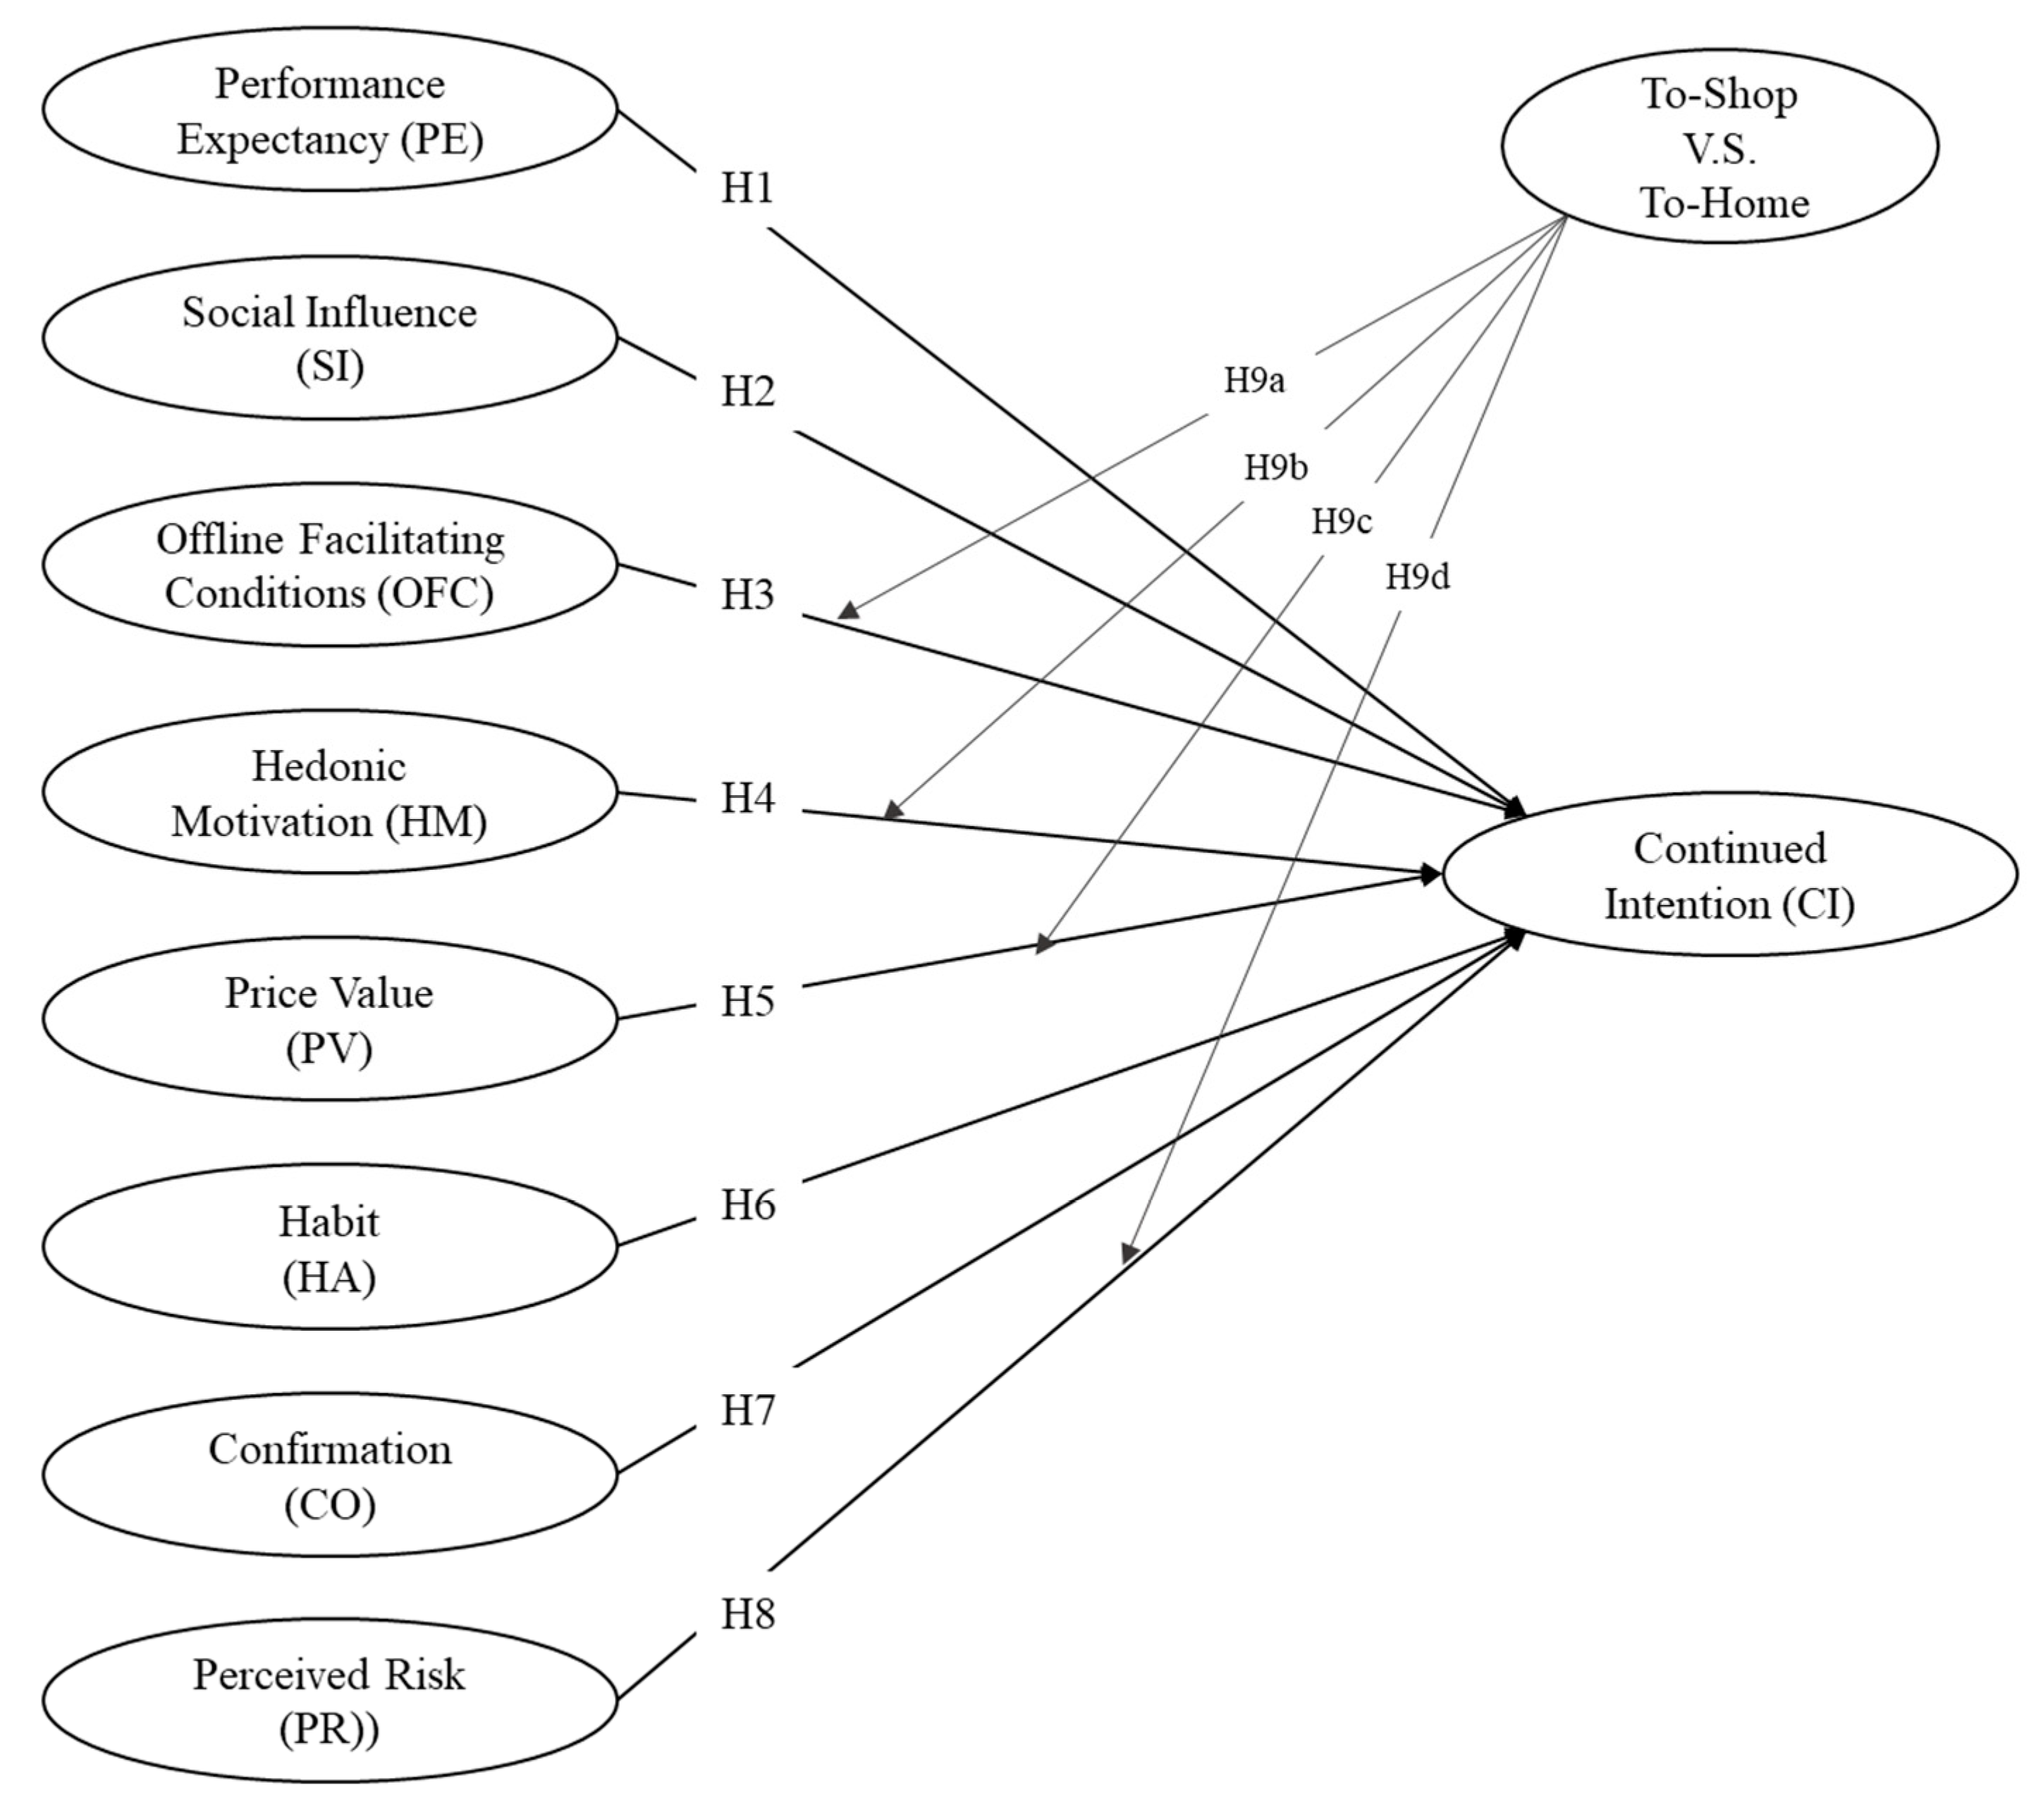
3. Research Framework and Hypotheses

3.1. Theoretical Foundation

3.1.1. UTAUT2

UTAUT2 was developed by Venkatesh et al. [67], extending the technology acceptance and usage from the organizational context in the unified theory of acceptance and use of technology (UTAUT) [76] to the consumer context. Seven primary constructs in UTAUT2 (i.e., performance expectancy, effort expectancy, social influence, facilitating conditions, hedonic motivation, price value, and habit) are theorized to determine the behavioral intention of technology acceptance and usage. UTAUT2 has been broadly employed in various research contexts as a theoretical lens for researchers conducting empirical studies of users’ behavioral intentions and behavior. The robustness of the UTAUT2 relationship has been extensively empirically verified [77]. The comprehensive nature of the UTAUT2 is beneficial to better understand the consumers’ complex behaviors in O2O commerce.
Nonetheless, Venkatesh et al. [70] suggested that researchers make necessary adaptations to UTAUT2 to fit specific contexts. Thus, this study adapted UTAUT2 to the research context. First, the effort expectancy construct was omitted. This is because the current study focused on consumers’ continued intention, and using an O2O service or app does not require much effort for experienced users. Tamilmani et al. [77] also cautioned against using effort expectancy in studies involving existing, experienced, or specialist technology users. In addition, effort expectancy may deter facilitating conditions’ predictive ability on behavioral intention [76,77]. Second, the rest of the exogenous constructs were contextualized to apply to the context of O2O commerce (see Section 3.2).

3.1.2. ECM

The ECM developed by Bhattacherjee [53] is usually used to study information system continuance. ECM posits that consumers’ intention to continue using a particular information system depends on three variables: consumers’ post-adoption perceived usefulness, confirmation of prior expectations, and satisfaction with the system. The ECM can explain the formation process of consumers’ continued intention in O2O commerce. First, consumers assess product quality, service quality, and online content reliability based on previous usage. Confirmation is then formed by comparing the assessment results with initial expectations. Finally, modified expectations (e.g., perceived usefulness) and confirmation jointly determine satisfaction. As mentioned earlier, satisfied consumers continue to use O2O services.
Because the link between satisfaction and continued intention has been firmly established, this study was interested in the direct effects of perceived usefulness and confirmation on continued intention rather than the indirect effect through satisfaction. The association of perceived usefulness and continuance intention in ECM is similar to that of performance expectancy and behavioral intention in UTAUT2. Perceived usefulness or performance expectancy as one of the individual beliefs is considered a modified expectation after an initial consumption experience, which can influence information system continuance usage [53]. The rest of the UTAUT2 components, other individual beliefs, can also be viewed as modified expectations to influence the consumers’ continued intention. Thus, ECM explains the applicability of UTAUT2 in the post-adoption stage. Furthermore, confirmation is expected to affect the consumers’ behavioral intention directly, as demonstrated by Huang et al. [45]. In addition, previous studies [54,57] have shown that confirmation involves many aspects, such as product quality, service quality, and website (online content) confirmations.

3.1.3. Perceived Risk

A thematic review [10] pointed out eight groups of factors influencing consumers’ O2O behavior: (1) technical and utilitarian factors, (2) social factors, (3) emotional and hedonic factors, (4) price and cost, (5) habit, (6) product and service quality, (7) online content, and (8) trust and risk. The UTAUT2 matches the first five themes, while the ECM captures three (i.e., technical and utilitarian factors, product and service quality, and online content). The remaining one is trust and risk. Trust and perceived risk are often correlated, and Chen et al. [35] illustrated that trust can reduce consumers’ perceived risk in the O2O context. In addition, the features of O2O commerce make it difficult for consumers to claim refunds if they are unsatisfied with products or services after consumption. As a result, consumers may perceive O2O commerce as riskier and be more cautious about using O2O services. Therefore, this study extended the research model by adding perceived risk as a feature factor to more comprehensively conceptualize consumer behavior in using O2O services. Perceived risk involves multiple dimensions, such as performance risk, financial risk, psychological risk, etc. [78].

3.2. Hypotheses Development

The hypotheses were developed based on the above theoretical foundations. The justifications for the proposed hypotheses are discussed in the following subsections.

3.2.1. Performance Expectancy

Performance expectancy (i.e., perceived usefulness) highlights the utilitarian aspect [76], which is the primary motivator of technology acceptance [53]. Performance expectancy in this study is defined as the degree to which using O2O services will provide benefits to consumers in performing certain purchase activities [67]. In O2O commerce, consumers are more likely to have a positive attitude or intention toward using O2O services if they perceive that the technology or system will provide them with more benefits (e.g., time and effort savings) than traditional ways [11,17,21,37]. Although the usefulness–intention association was usually found in acceptance contexts, it is likely to hold true in a continuance context because human tendencies to pursue instrumental behaviors subconsciously are independent of the stage or timing of such behaviors [53]. In fact, perceived usefulness has been demonstrated to consistently influence users’ intention across temporal stages of technology use [34,79]. This is evident in the case of O2O food delivery services usage [16,68]. Therefore, performance expectancy is an adequate predictor in the context of O2O continuance. The hypothesis is proposed as follows:
H1. 
Performance expectancy (PE) positively affects consumers’ continued intention (CI) to use O2O services.

3.2.2. Social Influence

Social influence has always been important in influencing consumers to accept or reject mobile commerce. This is because consumers are likely to return to their social system to access more information or to seek social approval for their decision to use the new technology [80]. Venkatesh et al. [67] defined social influence as “the extent to which consumers perceive that important others believe they should use a particular technology,” which is similar to subjective norm [76]. In this study, social influence is considered to come not only from important others but also from the user community and society, as O2O services have social attributes. To illustrate, O2O consumers like to share their relevant experiences with others in comment sections or on social media, which can enhance social approval and acceptance [35]. Thus, it can be defined as the influence that consumers perceive from others and society on using O2O services. Consumer perceptions of social influence may change at the post-adoption stage, which in turn affects post-adoption attitude and continued intention [81]. Lee et al. [68] have confirmed that social influence significantly influences continued intention in an O2O food delivery context. Zhu et al. [41] provided further evidence regarding the positive influence of the subjective norm on consumers’ continued intention to use the community O2O platform. Thus, the following hypothesis suggests that:
H2. 
Social influence (SI) positively affects consumers’ continued intention (CI) to use O2O services.

3.2.3. Offline Facilitating Conditions

With O2O commerce being popular, many aspects of online facilitating conditions, such as mobile Internet and mobile devices, will be readily available and fairly invariant across experienced consumers. In contrast, the offline facilitation in the environment that is available to each consumer can vary significantly across geographic locations, business settings, traffic conditions, etc. This study hence focuses on offline facilitating conditions in the O2O context. Offline facilitating conditions can be defined as consumers’ perceptions of available offline resources and support when they use O2O services [67]. It can be expected that consumers with access to a set of favorable facilitating conditions are more likely to have a higher intention to use a particular technology [67]. According to previous studies, facilitating conditions have a positive influence on continued intention in the post-adoption stage [76,81]. Alalwan [80] has also shown that facilitating conditions positively influence customers’ continued intention to use O2O food delivery services. Therefore, the following hypothesis is proposed:
H3. 
Offline facilitating conditions (OFC) positively affect consumers’ continued intention (CI) to use O2O services.

3.2.4. Hedonic Motivation

Hedonic motivation is regarded as the most important theoretical addition to UTAUT2 because it integrates the much-needed affective component into the cognitively oriented UTAUT [82]. Hedonic motivation can be expressed through intrinsic motivation (e.g., fun or pleasure) derived from using a new product, service, or technology, and such fun or pleasure can be related to the degree of innovation and novelty in using a new system [67,80]. In this study, hedonic motivation refers to the fun or pleasure derived from using O2O services to purchase [67]. According to Venkatesh et al. [67], hedonic motivation is one of the key factors contributing to the continued use of information technology. In the retail context, the emotional aspects are also important predictors of repurchasing [83]. Previous studies have shown that hedonic motivation positively influences continued intention to use O2O-related applications [55,80]. Accordingly, the hypothesis is proposed as follows:
H4. 
Hedonic motivation (HM) positively affects consumers’ continued intention (CI) to use O2O services.

3.2.5. Price Value

Venkatesh et al. [67] defined price value as “consumers’ cognitive tradeoff between the perceived benefits of the applications and the monetary cost for using them.” Pascual-Miguel et al. [84] argued that the use of e-commerce itself does not imply a clear or specific cost and omitted the price value from the UTAUT2. However, price is a constant topic in marketing because it is regarded as one of the essential determinants of consumer behavior [85]. Financial aspects indeed play an essential role in people’s lives [86,87,88]. Consumers may like to compare the cost of purchasing through O2O with that through traditional ways. This suggests that considering price value as a predictor of consumers’ continued intention is necessary. Thus, this study retained the price value, which involves the cost of purchasing target products or services rather than that of using an O2O application. Venkatesh et al. [67] have demonstrated that price value plays an important role when predicting the continued use of information technology. In the O2O context, studies have confirmed that price value or other price-related factors positively influences the continued use or reuse intention of O2O food delivery services [43,80]. Therefore, the following hypothesis is proposed:
H5. 
Price value (PV) positively affects consumers’ continued intention (CI) to use O2O services.

3.2.6. Habit

Habit is defined as consumers’ tendency to use O2O services automatically [67]. As with hedonic motivation and price value, habit is also one of the key factors predicting information technology continuance [67]. A meta-analysis shows that the habit–intention path is the strongest one in the UTAUT2, except for the intention–behavior path [77]. The habit–intention relationship is based on the instant activation perspective [89] or stored intention view [67]. In short, previous repetitive behaviors form the habit, and a stronger habit will cause a stored intention that will in turn influence future behavior. Studies have illustrated that habit has a significant (positive) influence on consumers’ continued intention in O2O contexts [16,68,80]. It can be expected that consumers who form habitual behavior of using O2O services are more likely to have a higher intention to continue using them. Thus, the following hypothesis is proposed:
H6. 
Habit (HA) positively affects consumers’ continued intention (CI) to use O2O services.

3.2.7. Confirmation

Confirmation is defined as the consumers’ perception of congruence between expectation and actual performance [53], which is a judgment or evaluation made by consumers about a particular product or service. Studies have shown that confirmation involves multiple dimensions in the O2O context [54,57]. This study focused on product quality, service quality, and online content confirmations. In the offline reception or experience of O2O commerce, if consumers perceive that product quality, service quality, or online content reliability outperforms their previous expectations, positive confirmation is formed. Conversely, disconfirmation (i.e., negative confirmation) is formed. ECM proposed that positive confirmation can increase post-adoption/purchase satisfaction, which in turn influences continued use or repurchase. This study expected that confirmation would directly affect O2O consumers’ continued intention. Empirical studies provided support for the confirmation–intention relationship. For example, Huang et al. [45] have illustrated that offline confirmation positively influences O2O consumers’ patronage intention in the context of tourism. Similarly, Che et al. [54] have shown the negative influence of disconfirmation on continued intention to use O2O websites. Therefore, the following hypothesis is proposed:
H7. 
Confirmation (CO) positively affects consumers’ continued intention (CI) to use O2O services.

3.2.8. Perceived Risk

This study incorporated perceived risk into the research model, given the potential uncertainty of the O2O commerce environment. Perceived risk is considered an uncertainty regarding possible negative consequences of using a product or service [78]. It was defined by Peter and Ryan [90] as “the expectation of losses associated with purchase and acts as an inhibitor to purchase behavior.” This study focused on five dimensions of perceived risk: performance, financial, time, psychological, and privacy risks [78]. Previous research has demonstrated the negative influence of perceived risk on consumers’ behavioral intention to adopt e-commerce [91]. According to ECM, perceived risk, like other expectations, may change in the post-adoption/purchase stage, and the modified perceived risk will in turn influence future behavior. Indeed, studies have shown that perceived risk negatively influences consumers’ repurchase/reuse intention [92,93]. It might be expected that consumers who perceive using O2O services as low-risk are more likely to continue using them. Accordingly, the following hypothesis suggests:
H8. 
Perceived risk (PR) negatively affects consumers’ continued intention (CI) to use O2O services.

3.2.9. Differences between To-Shop and To-Home

The present study aimed to compare the to-shop and to-home O2O models. This is because the two models are inherently different, and factors affecting consumers’ continued intention to use O2O services may work differently [10]. As there is a lack of support from the literature, this part of the study is exploratory. The to-shop and to-home models may differ in the following aspects. First, the consumers’ concerns about offline facilitating conditions may be different. For example, to-shop consumers may care more about traffic conditions than to-home consumers. Second, the perceived fun of to-shop consumers may come offline, while that of to-home consumers may come online. Third, compared with the to-shop model, the to-home model involves the delivery service fee, which consumers easily and directly perceive as a price-related factor. Fourth, the purchase process is different for the two models; thus, the perceived risk for to-shop and to-home consumers may come from different aspects. Given these, hypotheses are proposed as follows:
H9a. 
There is a difference between to-shop and to-home O2O consumers in terms of the relationship between offline facilitating conditions (OFC) and continued intention (CI) to use O2O services.
H9b. 
There is a difference between to-shop and to-home O2O consumers in terms of the relationship between hedonic motivation (HM) and continued intention (CI) to use O2O services.
H9c. 
There is a difference between to-shop and to-home O2O consumers in terms of the relationship between price value (PV) and continued intention (CI) to use O2O services.
H9d. 
There is a difference between to-shop and to-home O2O consumers in terms of the relationship between perceived risk (PR) and continued intention (CI) to use O2O services.
Based on the discussion, the research model of this study is proposed, as shown in Figure 1.

4. Materials and Methods

This study adopted a quantitative design with a cross-sectional survey approach. Survey research is one of the most extensively used approaches in the marketing literature [94], which allows researchers to conduct questionnaires on a sample group to describe trends or behaviors of a population.

4.1. Sampling

This study was conducted on China’s mainland because O2O commerce is popular there [10]. In addition, China’s to-shop and to-home O2O markets are both very mature [23,24]. Thus, the investigators could easily find respondents and ensure the sample represents the population relevant to the study. We chose a famous international tourist destination as the research site. Although international travelers had difficulty entering the city during the COVID-19 pandemic, many domestic travelers still came to visit. Additionally, there are several universities located in the city. Significant human traffic makes the city’s local economy very developed, and O2O commerce is particularly popular because O2O focuses on local business. Therefore, the O2O consumers in this city as the population of the study are appropriate to examine people’s continued intention to use O2O services.
The purposive (or judgmental) sampling technique was used in the present study, wherein respondents were selected based on appropriate characteristics as judged by investigators. Specifically, the inclusion criteria for respondents were that (1) they must be at least sixteen years old, (2) they must be Chinese citizens, and (3) they must be O2O consumers who have used any O2O service for at least six months. These criteria were designed to ensure the sample would provide information relevant to the study while minimizing sampling error [95]. We distributed questionnaires to respondents face-to-face to collect data. The face-to-face approach could ensure questions are answered thoroughly and provide explanations to respondents immediately when they are confused, increasing the return rate.
The survey was conducted on the premise of complete anonymity and voluntary participation. At the beginning of the survey, respondents were asked whether they predominantly used to-shop or to-home O2O services. Subsequently, they answered the remaining questions based on this choice (i.e., to-shop or to-home). We divided the respondents into two groups based on the service type. Furthermore, for unknown or enormous population sizes, the sample size recommended by Krejcie and Morgan [96] is 384. Since one of the objectives of this study was to compare to-shop and to-home O2O consumers, it was necessary to increase the total sample size appropriately to ensure that each sub-sample size met the minimum requirements for data analysis. However, Sekaran and Bougie [97] argued that too large a sample size (larger than 500) could cause a problem, since researchers would then be prone to committing the type II error. Therefore, we finally selected 500 eligible responses after a series of data-cleaning procedures. Specifically, responses with suspicious response patterns (e.g., straight lining and diagonal lining) or excessively short response times were eliminated. Among the 500 respondents, 223 claimed they primarily use to-shop O2O, while the remaining 277 were to-home O2O consumers. The profile of the respondents is shown in Table 2.

4.2. Measurement

According to previous studies, the perceived risk and confirmation constructs are composed of multiple dimensions. In addition, formative measurements are suggested when the construct can be viewed as a combination of indicators [98]. Therefore, we developed formative scales to measure these two constructs based on previous studies (see Appendix A). The remaining constructs used reflective measurement, and all reflective scales of the study were adapted from existing literature (i.e., [67]). We recruited a panel of experts to evaluate the measurement instrument, and the result suggested that the content validity was acceptable.
All constructs were measured using Likert scales, in which the ultimate endogenous construct (i.e., continued intention) was scored using a 7-point scale, and the remaining constructs were scored using 5-point scales. The different scale was used because it was suggested as one of the procedural remedies to reduce common method bias [99]. In addition, the service type is a binary variable, namely to-shop and to-home. As this study was conducted in China, all measurement items were translated into simplified Chinese following a back-translation approach [100]. A pre-test was conducted before the formal survey to ensure the research instrument worked well.

4.3. Data Analysis

Structural equation modeling (SEM) was used to test hypotheses in this study; it is a broadly adopted standard data analysis approach that allows researchers to model and estimate complex relationships among multiple variables simultaneously [98]. There are two types of SEM: partial least squares SEM (PLS-SEM) and covariance-based SEM (CB-SEM). This study used PLS-SEM for the following reasons [98]: (1) the research model was relatively complex and involved formatively measured constructs; (2) one of the research objectives is to explore theoretical extensions of established theories. In addition, PLS-SEM has the following two characteristics. First, it is a nonparametric statistical approach and does not make any distributional assumptions [101]. The kurtosis and skewness of each variable in this study were between −2 and +2, respectively, which are generally considered acceptable [98]. Second, PLS-SEM performs well with small sample sizes. We used the power analysis approach [102] and the G*Power 3.1 software [103] to detect whether the sample size was appropriate for the data analysis. With a common power level of 0.80, a medium effect size of 0.15, a significance level (α) of 0.05, and 8 predictors, the required minimum sample size was calculated to be 109.
We basically followed Hair et al.’s [98] guidelines to assess the measurement and structural models in the PLS-SEM. We also used the measurement invariance of the composite models approach (MICOM) proposed by Henseler et al. [104] to test the measurement invariance, which is a prerequisite to performing a permutation-based multigroup analysis [98,105]. Specifically, we primarily adopted SmartPLS 3.3.9 software to analyze the data [98,106], and all default settings were left unless otherwise specified.

5. Results

5.1. Common Method Bias

Ali et al. [107] argued that common method bias should not be a severe issue in PLS-SEM applications. However, given that the type of measurement was not objectively verifiable and that the data collection had no time lag [108], this study adopted the full collinearity method [109] to detect the potential common method bias. This method provides a more stable result and is arguably more advanced than traditional post hoc analyses [110]. According to Kock [110], it can be concluded that a model is not contaminated by common method bias if the variance inflation factor (VIF) values of all latent variables are below the threshold value of 3.33. As shown in Table 3, the full collinearity assessment yielded VIFs between 1.074 and 1.881 when a dummy variable was regressed on all latent variables, indicating no cause for concern regarding common method bias.

5.2. Measurement Models

The reliability and validity of measures were considered to assess the reflective →measurement model. The first step was to evaluate the indicator reliability, examining each indicator’s outer loading, which should be higher than 0.70 [98]. Next, three criteria were used to assess the internal consistency reliability: Cronbach’s alpha, reliability coefficient (Rho_A), and composite reliability (CR). The Rho_A usually lies between alpha and CR and is hence regarded as a good representation of a construct’s internal consistency reliability, which should be higher than 0.70 but not higher than 0.95 [98,111]. The reliability assessment results are shown in Table 4, indicating the good reliability of all reflective measures.
Regarding validity, the average variance extracted (AVE) was applied to examine the convergent validity, which should be higher than 0.50 [98]. Finally, the heterotrait–monotrait ratio (HTMT) proposed by Henseler et al. [112] was used to assess the discriminant validity accurately. The threshold values of the HTMT ratio are 0.90 and 0.85 for conceptually similar and different constructs, respectively. [112]. In this study, habit (HA) was measured using a perception-based approach in line with Venkatesh et al. [67] and was regarded as conceptually similar to continued intention (CI) in that they are both beliefs about the use of O2O services. Consequently, the threshold value for the HTMT ratio between habit and intention was assumed to be 0.90, while the rest was set to 0.85. Researchers should also apply a procedure called bootstrapping to test whether the HTMT ratios are significantly different from the threshold value [98]. Table 5 displays the results of the validity assessment, confirming the establishment of measures’ validity.
The assessment of the formative measurement model is different from that of the reflective measurement model. First, all sets of indicators were synthesized from the existing literature, and hence the content validity was considered to be acceptable. Second, the redundancy analysis was used to assess the convergent validity of formative measurement models [113]. Specifically, the formatively measured construct was used as an exogenous variable to predict an endogenous single-item variable (i.e., the global item). The path coefficient linking the two constructs should be 0.70 or higher [98]. Next, indicators’ VIF values were employed to examine collinearity issues, each of which should ideally be lower than 3.00 but certainly lower than 5.00 [98]. The final step was to assess the formative indicators’ significance and relevance. Each indicator’s outer weight and outer loading were examined, and their significance was tested using the bootstrapping procedure. The results of all assessments are shown in Table 6, suggesting that formative measures exhibited satisfactory levels of quality.

5.3. Measurement Invariance

We can be confident that group differences in model estimates were not due to the distinctive meaning and/or content of latent variables across groups by establishing measurement invariance, which can be assessed using the MICOM procedure. According to Henseler et al. [104], this procedure involves testing the configural invariance, compositional invariance, and equality of composite mean values and variances. First, in this study, identical indicators, data treatment, and algorithm settings per measurement model were used for both groups, indicating that configural invariance was established. Second, when the composite scores are the same across the groups, the compositional invariance is established. A statistical test in the MICOM procedure called permutation was applied to assess whether the composite scores differed significantly across the groups. When the configural and compositional invariance of all latent variables are established, partial measurement invariance is confirmed, which permits multigroup analysis, namely comparing the path coefficient estimates across the groups [98].
Once compositional invariance is confirmed, the final step in the MICOM is to assess the equality of mean values and variances. Similar to the second step, the permutation test was used to assess whether the composite scores differed across the groups in terms of their means and variances. When the full measurement invariance is established, pooled data analysis is allowed [98]. Table 7 shows the assessment results of measurement invariance for the current study, supporting the establishment of full measurement invariance. Accordingly, the following sections assessed the structural model using the pooled data and performed a multigroup analysis.

5.4. Structural Model

To evaluate the structural model results, this study mainly assessed the collinearity issues, significance of path coefficients, and explanatory power. Table 8 presents an overview of the above evaluation results. First, all inner VIF values were less than 3.00, indicating that the collinearity had no substantial effect on the model estimates [98]. Next, the bootstrapping procedure was applied to assess the significance of path coefficients. As can be seen from Table 8, the path coefficients for all paths except SI→CI were significant. Regarding the assessment of exploratory power, the most commonly used measure is to examine the coefficient of determination (R2) value, which represents a measure of in-sample predictive power [114,115]. According to general guidelines, the R2 value of 0.75 can be considered substantial [101]. However, the R2 value increases with the number of predictors; therefore, it should be interpreted based on the related studies and models of similar complexity [98]. Compared to previous studies [16,67,80,116], the R2 value (0.798) of CI in this study indicated an adequate exploratory power.
Following Hair et al. [98], this study also evaluated the model’s predictive power [117,118] using the PLS_predict procedure proposed by Shmueli et al. [119]. Specifically, drawing on Shmueli et al. [120], this study selected a key target construct, i.e., continued intention (CI), to assess the predictive power of the structural model. The root mean square error (RMSE) was chosen as a prediction statistic. A smaller divergence between the actual and predicted values (i.e., a lower RMSE) suggests a higher predictive power. As shown in Table 9, all three indicators’ Q2_predict values were larger than zero, indicating that the PLS path model outperforms most naive benchmarks. Furthermore, all indicators in the PLS-SEM analysis have lower RMSE values compared with the naive linear regression model (LM) benchmark. Accordingly, the structural model of the present study has a high predictive power, as the PLS-SEM analysis outperforms the naive LM benchmark model for all CI indicators.

5.5. Multigroup Analysis

According to Section 5.3, the multigroup analysis was applicable in the current study. First, the group-specific sample sizes fulfilled the minimum sample size requirement for data analysis. Next, since the sample of this study was set to only two groups and the sample size of each group was not much different, a nonparametric approach called the permutation test was used to perform the multigroup analysis in the context of PLS-SEM [105]. Finally, the multigroup analysis results between to-shop and to-home regarding the path coefficients are shown in Table 10.

6. Discussion

Previous studies have identified different factors influencing consumers’ adoption of O2O services. However, consumers’ O2O behavior has been loosely theorized as most previous studies were single-scenario, with food O2O being the most popular research context [10]. Therefore, the present study proposed a model based on UTAUT2 and ECM to predict consumer behavior in a comprehensive O2O context. The evaluation results indicate that the research model has good exploratory and predictive power. This study found that performance expectancy, offline facilitating conditions, hedonic motivation, price value, habit, perceived risk, and confirmation significantly affected consumers’ continued intention to use O2O services, while the result for social influence was not significant. We also observed differences between to-shop and to-home O2O consumers in terms of three influencing factors: hedonic motivation, price value, and perceived risk.

6.1. Discussion of the Results

Habit, performance expectancy, confirmation, and offline facilitating conditions are the main predictors of consumers’ continued intention to use O2O services. Consistent with the UTAUT2 literature [68,77,80], habit and performance expectancy were found to be the two strongest predictors in this study. Confirmation was revealed to affect the consumers’ continued intention directly. This result is in line with the rationale of ECM because confirmation can be regarded as a proxy for satisfaction, which is an important antecedent of continued intention [53,55,116]. Offline facilitating conditions are a UTAUT2-derived construct adapted to the O2O context, and the result indicated that consumers with access to a set of favorable facilitating conditions, such as offline human support and transportation infrastructure, are more likely to have a higher intention to continue using O2O services. The effect of offline facilitating conditions on behavioral intention is similar to the perceived behavioral control of TPB [69].
Surprisingly, the result for social influence was not significant. A possible explanation for this might be that the expectations of experienced O2O consumers are based on their prior experience rather than the opinions of others (i.e., social influence). In the O2O context, the social factors influencing consumer behavior probably are other factors, such as social interaction [35] or social value [22,59,60] instead of social influence. Although many studies have found that social influence significantly affects behavioral intention, they reported the slightest path coefficients [77]. In fact, the significance of social influence in influencing users’ behavioral intention to use a particular technology varies across studies. Agarwal and Sahu [16] and Alalwan [80] also reported non-significant results for social influence. Thus, the result is acceptable.
This study also compares the differences between to-shop and to-home O2O in terms of the factors influencing consumer behavior. The multigroup analysis results show that hedonic motivation, price value, and perceived risk worked differently between to-shop and to-home O2O consumers.
First, the effect of hedonic motivation is more potent for to-shop consumers than for to-home consumers. Experienced consumers are likely to use technologies such as O2O food delivery applications more for convenience than seeking novelty. For to-home consumers, the effect of hedonic motivation on technology use diminishes with increasing experience [67]. In contrast, the hedonic experience could occur when to-shop consumers consume in offline stores. Therefore, hedonic motivation should be used with caution as a predictor in the context of O2O services that focus on utilitarian aspects.
Second, to-shop consumers are more price sensitive than to-home consumers. In fact, the early to-shop O2O was in the form of group-buying, wherein offline merchants attracted consumers through online coupons and price discounts [8]. Conversely, while to-home consumers still like to compare prices, they are less likely to discontinue using O2O services due to the price factor. This may be because to-home consumers often voluntarily pay a service fee in exchange for the convenience of to-door services, and such consumers may not care much about price changes.
Third, the negative effect of perceived risk is more significant for to-home consumers than for to-shop consumers. One possible explanation is that consumers face more uncertainty when shopping through to-home O2O and that to-home consumers cannot see the actual product until they receive it. In comparison, to-shop consumers research products or seek coupons online and then make purchases offline, which is similar to the phenomenon known as “webrooming.” Such an O2O business model based on offline experience can reduce consumers’ perceived risk [11] because they can decide whether to buy after the physical experience.
However, offline facilitating conditions were not found to differ between to-shop and to-home O2O consumers in terms of their influence on continued intention. The non-significant result may result from sampling aspects. First, O2O commerce is very popular in the selected city, and therefore offline facilitating conditions may have been generally improved and satisfactory. Second, the use of a face-to-face survey led to a relative concentration of specific locations for data collection, wherein respondents’ perceptions of offline facilitating conditions are likely to be convergent. These reasons from the sampling aspect may make the between-group difference not easily detected.

6.2. Theoretical Contributions

This study contributes to the theory in several ways. First, it theoretically adds value to the body of knowledge pertinent to O2O commerce by providing a universal model to understand consumer behavior and the differences between the two market segments, to-shop and to-home. In this rapidly developing digital era, new O2O scenarios are constantly emerging, and consumer behavior is becoming increasingly complex. However, the essence of O2O services does not change, that is, the integration of online and offline channels. Therefore, it is of theoretical interest to study consumer behavior in the O2O context. This study provides a theoretical basis for consumers’ O2O behavior, expanding e-commerce theories from purely online to omnichannel retailing. The study also helps to understand the technology usage behavior and decision-making process of O2O consumers.
Second, this study extends the UTAUT2 from general technology usage to the O2O commerce context. According to Venkatesh et al.’s [70] suggestion, UTAUT2 was adapted as necessary to apply to the context of O2O services usage. In fact, most researchers referred to “new context” as one of the primary research motivations or contributions, which has become one of the critical theoretical lenses in the field of information technology [70]. One of the main contributions regarding the research context is to contextualize the UTAUT2 with a new moderation mechanism (i.e., the differences between to-shop and to-home services). Another contribution is to refine current context effects (e.g., facilitating conditions and price value) and identify a new context effect (e.g., perceived risk). UTAUT2 was developed in the context of technology adoption; nevertheless, this paper provides empirical evidence for the extension of UTAUT2 in different contexts.
Third, the study re-integrates two dominant information technology theories, UTAUT2 and ECM, whose tenets have been quite different to date. Specifically, the confirmation construct of ECM was integrated into the UTAUT2-based model as a direct predictor of consumers’ continued intention to use O2O services. More importantly, ECM explained and supported the application of UTAUT2 in the context of information system continuance. Such integration is regarded as a vital contribution and way to advancing science.

6.3. Practical Contributions

When new players enter the O2O market, they may not know whether various previous theories or business cases will work for them. Given this, the present study can provide a general framework to help them understand O2O commerce and develop business plans in this way. Specifically, apart from widely considered factors such as perceived usefulness (i.e., performance expectancy) and price, O2O businesses should consider offline facilitating conditions when developing their business plans because O2O commerce is a location-based business model. For example, they can add more offline service facilities and personnel to improve consumers’ perceived offline facilitating conditions, which is expected to increase consumers’ intention to use O2O services. In addition, habit as one of the important predictors deserves to be considered. To ensure the sustainability of their business, managers should focus on what fosters or disrupts consumers’ habits. For instance, increasing consumers’ online engagement may contribute to habit formation.
For marketers of omnichannel retailing and designers of O2O platforms, this study offers valuable insights into understanding consumer behavior and helps them to develop strategies to maintain their existing customers. For example, the results of this study show that confirmation has a more substantial effect on O2O consumers’ continued intention than price value. Price strategies do not always encourage consumers to continue using O2O services. Instead, O2O merchants should provide truthful, comprehensive, and valuable online content to avoid consumers forming overly high expectations. Meanwhile, they should ensure the quality of their products and services to avoid consumers’ disconfirmation.
Furthermore, although an O2O platform (i.e., O2O application) usually involves both to-shop and to-home services in the industry practice, the current study findings suggest that the behavioral patterns of to-shop and to-home O2O consumers may be different. For this reason, it is recommended that marketers develop different marketing strategies for these two types of O2O consumers. In addition, designers should purposely design different sub-platforms and business processes to improve the consumer experience.

6.4. Limitations and Future Research Directions

Several limitations need to be noted regarding the present study, which could be considered as directions for further research. First, this study focused on theoretical generalization rather than sampling generalization and hence collected data from only one typical city. In addition, the study was conducted in a China context, and the findings may not apply to other country contexts. Thus, further research could use a geographically broader sample to test theories. It would also be interesting to conduct a cross-country investigation. Second, consumers’ use intention toward online services may not imply the actual purchase. Therefore, further work is recommended to investigate the actual purchasing behavior of O2O service users. Third, the grouping of O2O consumers was based on the self-report measure. Some consumers may use both to-shop and to-home services and may have difficulty determining which one they prefer. Accordingly, future research could use behavioral measures to identify to-shop and to-home consumers. Fourth, the self-developed first-order formative scales may not quite effectively measure complex and multidimensional constructs. Future research is therefore encouraged to adopt higher-order models to measure the constructs of confirmation and perceived risk.

7. Conclusions

The aim of the present study was to develop a universal model to predict consumers’ continued intention to use O2O services and to compare the differences between to-shop and to-home O2O regarding consumer behavior. This study adapted and integrated UTAUT2, ECM, and a contextual factor perceived risk to conceptualize consumers’ O2O service continued intention. The results show that the research model has good explanatory and predictive powers, with the habit, performance expectancy, confirmation, and offline facilitating conditions being the primary predictors. However, social influence was found to have no significant effect on consumers’ behavioral intention in the O2O continuance context. This study is probably the first attempt to examine the differences between consumer behaviors in the to-shop and to-home O2O market segments. The multigroup analysis results demonstrate that to-shop and to-home O2O consumers differ in terms of hedonic motivation, price value, and perceived risk that influence their continued use intention of O2O services. Overall, the study provided beneficial insight into theory development and industry practice of O2O commerce.

Author Contributions

Conceptualization, P.Y. and S.O.; methodology, P.Y. and S.O.; formal analysis, P.Y.; investigation, Y.L.; data curation, Y.L.; writing—original draft preparation, P.Y.; writing—review and editing, S.O. and N.Z.; supervision, M.F.S. All authors have read and agreed to the published version of the manuscript.

Funding

This research received no external funding.

Institutional Review Board Statement

The study was conducted in accordance with the Declaration of Helsinki. Ethical review and approval were waived for this study, as it involved no explicit manipulation of participants nor any type of deception.

Informed Consent Statement

Informed consent was obtained from all subjects involved in the study.

Data Availability Statement

Not applicable.

Conflicts of Interest

The authors declare no conflict of interest.

Appendix A

Formative measurement items of constructs.
Perceived Risk(developed by the authors drawing on Featherman and Pavlou [78])
PR1O2O merchants have the potential to deceive me about the performance of products and services.
PR2Using O2O services can potentially lead to a waste of money.
PR3Using O2O services can potentially lead to time loss.
PR4I worry that I will be very frustrated by not achieving the expected results from O2O services.
PR5I worry that using O2O services will lead to privacy information theft.
PR_globalUsing O2O services exposes me to an overall risk.
Confirmation(developed by the authors drawing on Bhattacherjee [53])
CO1O2O product quality is better than what I expected.
CO2O2O service quality is better than what I expected.
CO3Online content on O2O platforms is more valuable than what I expected.
CO_globalOverall, most of my expectations from using O2O services are confirmed.

References

  1. Verhoef, P.C.; Neslin, S.A.; Vroomen, B. Multichannel Customer Management: Understanding the Research-Shopper Phenomenon. Int. J. Res. Mark. 2007, 24, 129–148. [Google Scholar] [CrossRef]
  2. Venkatesan, R.; Kumar, V.; Ravishanker, N. Multichannel Shopping: Causes and Consequences. J. Mark. 2007, 71, 114–132. [Google Scholar] [CrossRef]
  3. Dholakia, U.M.; Kahn, B.E.; Reeves, R.; Rindfleisch, A.; Stewart, D.; Taylor, E. Consumer Behavior in a Multichannel, Multimedia Retailing Environment. J. Interact. Mark. 2010, 24, 86–95. [Google Scholar] [CrossRef]
  4. Tsai, T.-M.; Wang, W.-N.; Lin, Y.-T.; Choub, S.-C. An O2O Commerce Service Framework and Its Effectiveness Analysis with Application to Proximity Commerce. Procedia Manuf. 2015, 3, 3498–3505. [Google Scholar] [CrossRef] [Green Version]
  5. Cotarelo, M.; Fayos, T.; Calderón, H.; Mollá, A. Omni-Channel Intensity and Shopping Value as Key Drivers of Customer Satisfaction and Loyalty. Sustainability 2021, 13, 5961. [Google Scholar] [CrossRef]
  6. Chen, Y.; Chi, T. How Does Channel Integration Affect Consumers’ Selection of Omni-Channel Shopping Methods? An Empirical Study of U.S. Consumers. Sustainability 2021, 13, 8983. [Google Scholar] [CrossRef]
  7. Verhoef, P.C.; Kannan, P.K.; Inman, J.J. From Multi-Channel Retailing to Omni-Channel Retailing. J. Retail. 2015, 91, 174–181. [Google Scholar] [CrossRef]
  8. Phang, C.W.; Tan, C.-H.; Sutanto, J.; Magagna, F.; Lu, X. Leveraging O2O Commerce for Product Promotion: An Empirical Investigation in Mainland China. IEEE Trans. Eng. Manag. 2014, 61, 623–632. [Google Scholar] [CrossRef]
  9. Zhang, J.; Chen, H.; Wu, X. Operation Models in O2O Supply Chain When Existing Competitive Service Level. Int. J. U- E- Serv. Sci. Technol. 2015, 8, 279–290. [Google Scholar] [CrossRef]
  10. Yao, P.; Osman, S.; Sabri, M.F.; Zainudin, N. Consumer Behavior in Online-to-Offline (O2O) Commerce: A Thematic Review. Sustainability 2022, 14, 7842. [Google Scholar] [CrossRef]
  11. Yang, Y.; Gong, Y.; Land, L.P.W.; Chesney, T. Understanding the Effects of Physical Experience and Information Integration on Consumer Use of Online to Offline Commerce. Int. J. Inf. Manag. 2020, 51, 102046. [Google Scholar] [CrossRef]
  12. He, B.; Gupta, V.; Mirchandani, P. Online Selling through O2O Platform or on Your Own? Strategic Implications for Local Brick-and-Mortar Stores. Omega 2021, 103, 102424. [Google Scholar] [CrossRef]
  13. Yang, F.X.; Li, X.; Lau, V.M.-C.; Zhu, V.Z. To Survive or to Thrive? China’s Luxury Hotel Restaurants Entering O2O Food Delivery Platforms amid the COVID-19 Crisis. Int. J. Hosp. Manag. 2021, 94, 102855. [Google Scholar] [CrossRef] [PubMed]
  14. Chen, Y.; Cheung, C.M.K.; Tan, C.-W. Omnichannel Business Research: Opportunities and Challenges. Decis. Support Syst. 2018, 109, 1–4. [Google Scholar] [CrossRef]
  15. Xiao, L.; Guo, Z.; D’Ambra, J. Benefit-Based O2O Commerce Segmentation: A Means-End Chain Approach. Electron. Commer. Res. 2019, 19, 409–449. [Google Scholar] [CrossRef]
  16. Agarwal, V.; Sahu, R. Predicting Repeat Usage Intention towards O2O Food Delivery: Extending UTAUT2 with User Gratifications and Bandwagoning. J. Foodserv. Bus. Res. 2022, 25, 434–474. [Google Scholar] [CrossRef]
  17. Roh, M.; Park, K. Adoption of O2O Food Delivery Services in South Korea: The Moderating Role of Moral Obligation in Meal Preparation. Int. J. Inf. Manag. 2019, 47, 262–273. [Google Scholar] [CrossRef]
  18. Wang, O.; Scrimgeour, F. Consumer Adoption of Online-to-Offline Food Delivery Services in China and New Zealand. Br. Food J. 2021, 124, 1590–1608. [Google Scholar] [CrossRef]
  19. Li, Y.; Yao, P.; Osman, S.; Zainudin, N.; Sabri, M.F. A Thematic Review on Using Food Delivery Services during the Pandemic: Insights for the Post-COVID-19 Era. Int. J. Environ. Res. Public Health 2022, 19, 15267. [Google Scholar] [CrossRef]
  20. Leung, P.P.L.; Wu, C.H.; Ip, W.H.; Ho, G.T.S. Enhancing Online-to-Offline Specific Customer Loyalty in Beauty Industry. Enterp. Inf. Syst. 2019, 13, 352–375. [Google Scholar] [CrossRef]
  21. Lin, M.; Wang, Z.; Zhang, Z.; Cao, Y. Research on Consumers’ Attitudes in China about Using Online-to-Offline Mode for Purchasing Wooden Furniture. For. Prod. J. 2019, 69, 159–172. [Google Scholar] [CrossRef]
  22. Prassida, G.F.; Hsu, P.-Y.; Chang, Y.-W. Understanding How O2O Service Synergies Drive Customer Continuance Intention: A Study of OTAs and Hotels. Asia Pac. J. Tour. Res. 2021, 26, 1139–1155. [Google Scholar] [CrossRef]
  23. Statista. Gross Merchandise Value of the To-Shop O2O Market in China from 1st Half of 2016 to 1st Half of 2019. Available online: https://www.statista.com/statistics/1147378/china-gmv-of-to-shop-o2o-market/ (accessed on 1 June 2022).
  24. Statista. Gross Merchandise Value of To-Home O2O Market in China from 1st Half of 2016 to 1st Half of 2019. Available online: https://www.statista.com/statistics/1147402/china-gmv-of-to-home-o2o-market/ (accessed on 1 June 2022).
  25. Chai, L.; Wang, Y. Exploring the Sustainable Usage Intention of BOPS: A Perspective of Channel Integration Quality. Sustainability 2022, 14, 14114. [Google Scholar] [CrossRef]
  26. Wang, O.; Somogyi, S.; Charlebois, S. Food Choice in the E-Commerce Era: A Comparison between Business-to-Consumer (B2C), Online-to-Offline (O2O) and New Retail. Br. Food J. 2020, 122, 1215–1237. [Google Scholar] [CrossRef]
  27. Howard, J.A.; Sheth, J.N. The Theory of Buyer Behavior; Wiley: New York, NY, USA, 1969; ISBN 978-0-471-41657-9. [Google Scholar]
  28. Fishbein, M.; Ajzen, I. Belief, Attitude, Intention, and Behavior: An Introduction to Theory and Research; Addison-Wesley series in social psychology; Addison-Wesley: Reading, MA, USA, 1975; ISBN 978-0-201-02089-2. [Google Scholar]
  29. Cai, S.; Xu, Y. Effects of Outcome, Process and Shopping Enjoyment on Online Consumer Behaviour. Electron. Commer. Res. Appl. 2006, 5, 272–281. [Google Scholar] [CrossRef]
  30. Parthasarathy, M.; Bhattacherjee, A. Understanding Post-Adoption Behavior in the Context of Online Services. Inf. Syst. Res. 1998, 9, 362–379. [Google Scholar] [CrossRef] [Green Version]
  31. Bhattacherjee, A. An Empirical Analysis of the Antecedents of Electronic Commerce Service Continuance. Decis. Support Syst. 2001, 32, 201–214. [Google Scholar] [CrossRef]
  32. Haryanti, T.; Subriadi, A.P. Factors and Theories for E-Commerce Adoption: A Literature Review. Int. J. Electron. Commer. Stud. 2020, 11, 87–105. [Google Scholar] [CrossRef]
  33. Davis, F.D. Perceived Usefulness, Perceived Ease of Use, and User Acceptance of Information Technology. MIS Q. 1989, 13, 319. [Google Scholar] [CrossRef] [Green Version]
  34. Davis, F.D.; Bagozzi, R.P.; Warshaw, P.R. User Acceptance of Computer Technology: A Comparison of Two Theoretical Models. Manag. Sci. 1989, 35, 982–1003. [Google Scholar] [CrossRef]
  35. Chen, C.-C.; Hsiao, K.-L.; Hsieh, C.-H. Understanding Usage Transfer Behavior of Two Way O2O Services. Comput. Hum. Behav. 2019, 100, 184–191. [Google Scholar] [CrossRef]
  36. Dai, T.; Wen, D.; Chen, X. An Empirical Study on the Customer Channel Choice Behavior in the Overall Process of Shopping under O2O Mode. Int. J. Web Portals 2016, 8, 13–31. [Google Scholar] [CrossRef] [Green Version]
  37. Kang, J.-W.; Namkung, Y. The Information Quality and Source Credibility Matter in Customers’ Evaluation toward Food O2O Commerce. Int. J. Hosp. Manag. 2019, 78, 189–198. [Google Scholar] [CrossRef]
  38. Lin, S.; Chen, S.-C.; Chuang, S.-H. Perceived Innovation and Quick Response Codes in an Online-to-Offline E-Commerce Service Model. Int. J. E-Adopt. 2017, 9, 1–16. [Google Scholar] [CrossRef] [Green Version]
  39. Pei, Y.; Xue, W.; Yang, Y.; Li, D.; Li, Y. The Impacts of User Experience on User Loyalty Based on O2O Innovation Platform. J. Electron. Commer. Organ. 2019, 17, 79–87. [Google Scholar] [CrossRef]
  40. Wu, T.-J.; Zhao, R.-H.; Tzeng, S.-Y. An Empirical Research of Consumer Adoption Behavior on Catering Transformation to Mobile O2O. J. Interdiscip. Math. 2015, 18, 769–788. [Google Scholar] [CrossRef]
  41. Zhu, Y.; Wei, Y.; Zhou, Z.; Jiang, H. Consumers’ Continuous Use Intention of O2O E-Commerce Platform on Community: A Value Co-Creation Perspective. Sustainability 2022, 14, 1666. [Google Scholar] [CrossRef]
  42. Parasuraman, A.; Zeithaml, V.A.; Berry, L.L. SERVQUAL: A Multiple-Item Scale for Measuring Consumer Perceptions of Service Quality. J. Retail. 1988, 64, 12–40. [Google Scholar]
  43. Choi, Y.; Zhang, L.; Debbarma, J.; Lee, H. Sustainable Management of Online to Offline Delivery Apps for Consumers’ Reuse Intention: Focused on the Meituan Apps. Sustainability 2021, 13, 3593. [Google Scholar] [CrossRef]
  44. Ha, H.-Y.; Kitchen, P.J. Positive Crossover Loyalty Shifts or Negative Temporal Changes? The Evolution of Shopping Mechanism in the O2O Era. Eur. J. Mark. 2020, 54, 1383–1405. [Google Scholar] [CrossRef]
  45. Huang, C.-C.; Chang, Y.-W.; Hsu, P.Y.; Prassida, G.F. A Cross-Country Investigation of Customer Transactions from Online to Offline Channels. Ind. Manag. Data Syst. 2020, 120, 2397–2422. [Google Scholar] [CrossRef]
  46. Hwang, S.; Kim, S. Does MIM Experience Affect Satisfaction with and Loyalty toward O2O Services? Comput. Hum. Behav. 2018, 82, 70–80. [Google Scholar] [CrossRef]
  47. Kang, M.J.; Wu, Z.; Hwang, H.J. A Study on the Mediating Effect of Customer Orientation between O2O Service Quality and Customers’ Perceived Service Satisfaction. J. Distrib. Sci. 2021, 19, 37–44. [Google Scholar] [CrossRef]
  48. Moon, Y.; Armstrong, D.J. Service Quality Factors Affecting Customer Attitudes in Online-to-Offline Commerce. Inf. Syst. E-Bus. Manag. 2020, 18, 1–34. [Google Scholar] [CrossRef]
  49. Pei, Y.; Li, D.; Xue, W. The Evaluation of Customer Experience Using BP Neural Network-taking Catering O2O Takeout. Concurr. Comput. Pract. Exp. 2020, 32, e5515. [Google Scholar] [CrossRef]
  50. Zhang, Y.-B.; Kim, H.-K. A Study on the Factors Affecting Satisfaction and Reuse Intention among Customers Using O2O Delivery Platform in China. J. Syst. Manag. Sci. 2021, 11, 58–74. [Google Scholar] [CrossRef]
  51. Zhuang, X.; Lin, L.; Zhang, R.; Li, J.; He, B. E-Service Quality Perceptions of Millennials and Non-Millennials on O2O Delivery Applications. Br. Food J. 2021, 123, 4116–4134. [Google Scholar] [CrossRef]
  52. Oliver, R.L. A Cognitive Model of the Antecedents and Consequences of Satisfaction Decisions. J. Mark. Res. 1980, 17, 460–469. [Google Scholar] [CrossRef]
  53. Bhattacherjee, A. Understanding Information Systems Continuance: An Expectation-Confirmation Model. MIS Q. 2001, 25, 351. [Google Scholar] [CrossRef]
  54. Che, T.; Ji, M.; Zheng, X.; Feng, B. Dissatisfaction toward O2O Websites: Expectation Disconfirmation and Justice Perspective. Asia Pac. J. Mark. Logist. 2022, 34, 190–208. [Google Scholar] [CrossRef]
  55. Hsu, C.-L.; Lin, J.C.-C. Understanding Continuance Intention to Use Online to Offline (O2O) Apps. Electron. Mark. 2020, 30, 883–897. [Google Scholar] [CrossRef]
  56. Kim, S.H.; Bae, J.H.; Jeon, H.M. Continuous Intention on Accommodation Apps: Integrated Value-Based Adoption and Expectation–Confirmation Model Analysis. Sustainability 2019, 11, 1578. [Google Scholar] [CrossRef] [Green Version]
  57. Zhang, X. Ongoing Trust and Tourism O2O Platform Continuance: A Two-Trustee Involved Model With Moderating Variable. SAGE Open 2020, 10, 1–18. [Google Scholar] [CrossRef]
  58. Sweeney, J.C.; Soutar, G.N. Consumer Perceived Value: The Development of a Multiple Item Scale. J. Retail. 2001, 77, 203–220. [Google Scholar] [CrossRef]
  59. Chang, Y.-W.; Hsu, P.-Y.; Yang, Q.-M. Integration of Online and Offline Channels: A View of O2O Commerce. Internet Res. 2018, 28, 926–945. [Google Scholar] [CrossRef]
  60. Hsu, C.-L.; Lin, J.C.-C. Examining Social Networking O2O Apps User Loyalty. J. Comput. Inf. Syst. 2020, 60, 459–467. [Google Scholar] [CrossRef]
  61. DeLone, W.H.; McLean, E.R. Information Systems Success: The Quest for the Dependent Variable. Inf. Syst. Res. 1992, 3, 60–95. [Google Scholar] [CrossRef] [Green Version]
  62. DeLone, W.H.; McLean, E.R. The DeLone and McLean Model of Information Systems Success: A Ten-Year Update. J. Manag. Inf. Syst. 2003, 19, 9–30. [Google Scholar] [CrossRef]
  63. Kim, Y.; Wang, Q.; Roh, T. Do Information and Service Quality Affect Perceived Privacy Protection, Satisfaction, and Loyalty? Evidence from a Chinese O2O-Based Mobile Shopping Application. Telemat. Inform. 2021, 56, 101483. [Google Scholar] [CrossRef]
  64. Petty, R.E.; Cacioppo, J.T. The Elaboration Likelihood Model of Persuasion. In Advances in Experimental Social Psychology; Berkowitz, L., Ed.; Academic Press: Cambridge, MA, USA, 1986; Volume 19, pp. 123–205. ISBN 978-0-12-015219-3. [Google Scholar]
  65. Xu, X.; Huang, Y. Restaurant Information Cues, Diners’ Expectations, and Need for Cognition: Experimental Studies of Online-to-Offline Mobile Food Ordering. J. Retail. Consum. Serv. 2019, 51, 231–241. [Google Scholar] [CrossRef]
  66. Rogers, E.M. Diffusion of Innovations, 5th ed.; Free Press: New York, NY, USA, 2003; ISBN 978-0-7432-2209-9. [Google Scholar]
  67. Venkatesh, V.; Thong, J.Y.L.; Xu, X. Consumer Acceptance and Use of Information Technology: Extending the Unified Theory of Acceptance and Use of Technology. MIS Q. 2012, 36, 157. [Google Scholar] [CrossRef]
  68. Lee, S.W.; Sung, H.J.; Jeon, H.M. Determinants of Continuous Intention on Food Delivery Apps: Extending UTAUT2 with Information Quality. Sustainability 2019, 11, 3141. [Google Scholar] [CrossRef] [Green Version]
  69. Ajzen, I. The Theory of Planned Behavior. Organ. Behav. Hum. Decis. Process. 1991, 50, 179–211. [Google Scholar] [CrossRef]
  70. Venkatesh, V.; Thong, J.Y.L.; Xu, X. Unified Theory of Acceptance and Use of Technology: A Synthesis and the Road Ahead. J. Assoc. Inf. Syst. 2016, 17, 328–376. [Google Scholar] [CrossRef]
  71. Sun, Y.; Liu, L.; Peng, X.; Dong, Y.; Barnes, S.J. Understanding Chinese Users’ Continuance Intention toward Online Social Networks: An Integrative Theoretical Model. Electron. Mark. 2014, 24, 57–66. [Google Scholar] [CrossRef]
  72. Tran, V.D. Using Mobile Food Delivery Applications during the COVID-19 Pandemic: Applying the Theory of Planned Behavior to Examine Continuance Behavior. Sustainability 2021, 13, 12066. [Google Scholar] [CrossRef]
  73. Cao, X.; Yu, L.; Liu, Z.; Gong, M.; Adeel, L. Understanding Mobile Payment Users’ Continuance Intention: A Trust Transfer Perspective. Internet Res. 2018, 28, 456–476. [Google Scholar] [CrossRef]
  74. Lin, H.; Fan, W.; Chau, P.Y.K. Determinants of Users’ Continuance of Social Networking Sites: A Self-Regulation Perspective. Inf. Manag. 2014, 51, 595–603. [Google Scholar] [CrossRef]
  75. Shang, D.; Wu, W. Understanding Mobile Shopping Consumers’ Continuance Intention. Ind. Manag. Data Syst. 2017, 117, 213–227. [Google Scholar] [CrossRef]
  76. Venkatesh, V.; Morris, M.G.; Davis, G.B.; Davis, F.D. User Acceptance of Information Technology: Toward a Unified View. MIS Q. 2003, 27, 425. [Google Scholar] [CrossRef] [Green Version]
  77. Tamilmani, K.; Rana, N.P.; Dwivedi, Y.K. Consumer Acceptance and Use of Information Technology: A Meta-Analytic Evaluation of UTAUT2. Inf. Syst. Front. 2021, 23, 987–1005. [Google Scholar] [CrossRef]
  78. Featherman, M.S.; Pavlou, P.A. Predicting E-Services Adoption: A Perceived Risk Facets Perspective. Int. J. Hum. Comput. Stud. 2003, 59, 451–474. [Google Scholar] [CrossRef] [Green Version]
  79. Karahanna, E.; Straub, D.W.; Chervany, N.L. Information Technology Adoption Across Time: A Cross-Sectional Comparison of Pre-Adoption and Post-Adoption Beliefs. MIS Q. 1999, 23, 183. [Google Scholar] [CrossRef]
  80. Alalwan, A.A. Mobile Food Ordering Apps: An Empirical Study of the Factors Affecting Customer e-Satisfaction and Continued Intention to Reuse. Int. J. Inf. Manag. 2020, 50, 28–44. [Google Scholar] [CrossRef]
  81. Venkatesh, V.; Thong, J.Y.L.; Chan, F.K.Y.; Hu, P.J.-H.; Brown, S.A. Extending the Two-Stage Information Systems Continuance Model: Incorporating UTAUT Predictors and the Role of Context: Context, Expectations and IS Continuance. Inf. Syst. J. 2011, 21, 527–555. [Google Scholar] [CrossRef]
  82. Tamilmani, K.; Rana, N.P.; Prakasam, N.; Dwivedi, Y.K. The Battle of Brain vs. Heart: A Literature Review and Meta-Analysis of “Hedonic Motivation” Use in UTAUT2. Int. J. Inf. Manag. 2019, 46, 222–235. [Google Scholar] [CrossRef]
  83. Simanjuntak, M.; Nur, H.R.; Sartono, B.; Sabri, M.F. A General Structural Equation Model of the Emotions and Repurchase Intention in Modern Retail. Manag. Sci. Lett. 2020, 10, 801–814. [Google Scholar] [CrossRef]
  84. Pascual-Miguel, F.J.; Agudo-Peregrina, Á.F.; Chaparro-Peláez, J. Influences of Gender and Product Type on Online Purchasing. J. Bus. Res. 2015, 68, 1550–1556. [Google Scholar] [CrossRef]
  85. Zeithaml, V.A. Consumer Perceptions of Price, Quality, and Value: A Means-End Model and Synthesis of Evidence. J. Mark. 1988, 52, 2–22. [Google Scholar] [CrossRef]
  86. Magli, A.S.; Sabri, M.F.; Rahim, H.A. The Influence of Financial Attitude, Financial Behaviour, and Self-Belief towards Financial Vulnerability among Public Employees in Malaysia. Malays. J. Consum. Fam. Econ. 2020, 25, 175–193. [Google Scholar]
  87. Sabri, M.F.; Aw, E.C.X.; Rahim, H.A.; Burhan, N.A.S.; Othmana, M.A.; Simanjuntak, M. Financial Literacy, Behavior and Vulnerability Among Malaysian Households: Does Gender Matter? Int. J. Econ. Manag. 2021, 15, 241–256. [Google Scholar]
  88. Sabri, M.F.; Gudmunson, C.G.; Griesdorn, T.S.; Dean, L.R. Influence of Family Financial Socialization on Academic Success in College. J. Financ. Couns. Plan. 2020, 31, 267–283. [Google Scholar] [CrossRef]
  89. Ajzen, I.; Fishbein, M. Attitudes and the Attitude-Behavior Relation: Reasoned and Automatic Processes. Eur. Rev. Soc. Psychol. 2000, 11, 1–33. [Google Scholar] [CrossRef]
  90. Peter, J.P.; Ryan, M.J. An Investigation of Perceived Risk at the Brand Level. J. Mark. Res. 1976, 13, 184–188. [Google Scholar] [CrossRef]
  91. Pavlou, P.A. Consumer Acceptance of Electronic Commerce: Integrating Trust and Risk with the Technology Acceptance Model. Int. J. Electron. Commer. 2003, 7, 101–134. [Google Scholar] [CrossRef]
  92. Chiu, C.-M.; Wang, E.T.G.; Fang, Y.-H.; Huang, H.-Y. Understanding Customers’ Repeat Purchase Intentions in B2C e-Commerce: The Roles of Utilitarian Value, Hedonic Value and Perceived Risk: Understanding Customers’ Repeat Purchase Intentions. Inf. Syst. J. 2014, 24, 85–114. [Google Scholar] [CrossRef]
  93. Fong, L.H.N.; Lam, L.W.; Law, R. How Locus of Control Shapes Intention to Reuse Mobile Apps for Making Hotel Reservations: Evidence from Chinese Consumers. Tour. Manag. 2017, 61, 331–342. [Google Scholar] [CrossRef]
  94. Hulland, J.; Baumgartner, H.; Smith, K.M. Marketing Survey Research Best Practices: Evidence and Recommendations from a Review of JAMS Articles. J. Acad. Mark. Sci. 2018, 46, 92–108. [Google Scholar] [CrossRef]
  95. Saunders, M.N.K.; Lewis, P. Doing Research in Business and Management, 2nd ed.; Pearson: Harlow, UK, 2018; ISBN 978-1-292-13352-2. [Google Scholar]
  96. Krejcie, R.V.; Morgan, D.W. Determining Sample Size for Research Activities. Educ. Psychol. Meas. 1970, 30, 607–610. [Google Scholar] [CrossRef]
  97. Sekaran, U.; Bougie, R. Research Methods for Business: A Skill-Building Approach, 7th ed.; Wiley: Chichester, UK, 2016; ISBN 978-1-119-26684-6. [Google Scholar]
  98. Hair, J.F.; Hult, G.T.M.; Ringle, C.M.; Sarstedt, M. A Primer on Partial Least Squares Structural Equation Modeling (PLS-SEM), 3rd ed.; SAGE: Thousand Oaks, CA, USA, 2022; ISBN 978-1-5443-9640-8. [Google Scholar]
  99. Podsakoff, P.M.; MacKenzie, S.B.; Lee, J.-Y.; Podsakoff, N.P. Common Method Biases in Behavioral Research: A Critical Review of the Literature and Recommended Remedies. J. Appl. Psychol. 2003, 88, 879–903. [Google Scholar] [CrossRef]
  100. Brislin, R.W. Back-Translation for Cross-Cultural Research. J. Cross-Cult. Psychol. 1970, 1, 185–216. [Google Scholar] [CrossRef]
  101. Hair, J.F.; Ringle, C.M.; Sarstedt, M. PLS-SEM: Indeed a Silver Bullet. J. Mark. Theory Pract. 2011, 19, 139–152. [Google Scholar] [CrossRef]
  102. Cohen, J. A Power Primer. Psychol. Bull. 1992, 112, 155–159. [Google Scholar] [CrossRef]
  103. Faul, F.; Erdfelder, E.; Buchner, A.; Lang, A.-G. Statistical Power Analyses Using G* Power 3.1: Tests for Correlation and Regression Analyses. Behav. Res. Methods 2009, 41, 1149–1160. [Google Scholar] [CrossRef] [Green Version]
  104. Henseler, J.; Ringle, C.M.; Sarstedt, M. Testing Measurement Invariance of Composites Using Partial Least Squares. Int. Mark. Rev. 2016, 33, 405–431. [Google Scholar] [CrossRef]
  105. Hair, J.F.; Sarstedt, M.; Ringle, C.M.; Gudergan, S.P. Advanced Issues in Partial Least Squares Structural Equation Modeling; SAGE: Thousand Oaks, CA, USA, 2018; ISBN 978-1-4833-7739-1. [Google Scholar]
  106. Sarstedt, M.; Cheah, J.-H. Partial Least Squares Structural Equation Modeling Using SmartPLS: A Software Review. J. Mark. Anal. 2019, 7, 196–202. [Google Scholar] [CrossRef]
  107. Ali, F.; Rasoolimanesh, S.M.; Sarstedt, M.; Ringle, C.M.; Ryu, K. An Assessment of the Use of Partial Least Squares Structural Equation Modeling (PLS-SEM) in Hospitality Research. Int. J. Contemp. Hosp. Manag. 2018, 30, 514–538. [Google Scholar] [CrossRef] [Green Version]
  108. Vomberg, A.; Klarmann, M. Crafting Survey Research: A Systematic Process for Conducting Survey Research. In Handbook of Market Research; Homburg, C., Klarmann, M., Vomberg, A., Eds.; Springer: Cham, Switzerland, 2022; pp. 67–119. ISBN 978-3-319-57413-4. [Google Scholar]
  109. Kock, N.; Lynn, G. Lateral Collinearity and Misleading Results in Variance-Based SEM: An Illustration and Recommendations. J. Assoc. Inf. Syst. 2012, 13, 546–580. [Google Scholar] [CrossRef] [Green Version]
  110. Kock, N. Common Method Bias in PLS-SEM: A Full Collinearity Assessment Approach. Int. J. E-Collab. 2015, 11, 1–10. [Google Scholar] [CrossRef] [Green Version]
  111. Hair, J.F.; Risher, J.J.; Sarstedt, M.; Ringle, C.M. When to Use and How to Report the Results of PLS-SEM. Eur. Bus. Rev. 2019, 31, 2–24. [Google Scholar] [CrossRef]
  112. Henseler, J.; Ringle, C.M.; Sarstedt, M. A New Criterion for Assessing Discriminant Validity in Variance-Based Structural Equation Modeling. J. Acad. Mark. Sci. 2015, 43, 115–135. [Google Scholar] [CrossRef] [Green Version]
  113. Chin, W.W. The Partial Least Squares Approach to Structural Equation Modelling. In Modern Methods for Business Research; Marcoulides, G.A., Ed.; Lawrence Erlbaum: Mahwah, NJ, USA, 1998; pp. 295–358. ISBN 978-0-8058-2677-7. [Google Scholar]
  114. Rigdon, E.E. Rethinking Partial Least Squares Path Modeling: In Praise of Simple Methods. Long Range Plan. 2012, 45, 341–358. [Google Scholar] [CrossRef]
  115. Sarstedt, M.; Ringle, C.M.; Henseler, J.; Hair, J.F. On the Emancipation of PLS-SEM: A Commentary on Rigdon (2012). Long Range Plan. 2014, 47, 154–160. [Google Scholar] [CrossRef]
  116. Tam, C.; Santos, D.; Oliveira, T. Exploring the Influential Factors of Continuance Intention to Use Mobile Apps: Extending the Expectation Confirmation Model. Inf. Syst. Front. 2020, 22, 243–257. [Google Scholar] [CrossRef]
  117. Chin, W.; Cheah, J.-H.; Liu, Y.; Ting, H.; Lim, X.-J.; Cham, T.H. Demystifying the Role of Causal-Predictive Modeling Using Partial Least Squares Structural Equation Modeling in Information Systems Research. Ind. Manag. Data Syst. 2020, 120, 2161–2209. [Google Scholar] [CrossRef]
  118. Hair, J.F.; Sarstedt, M. Explanation Plus Prediction—The Logical Focus of Project Management Research. Proj. Manag. J. 2021, 52, 319–322. [Google Scholar] [CrossRef]
  119. Shmueli, G.; Ray, S.; Velasquez Estrada, J.M.; Chatla, S.B. The Elephant in the Room: Predictive Performance of PLS Models. J. Bus. Res. 2016, 69, 4552–4564. [Google Scholar] [CrossRef]
  120. Shmueli, G.; Sarstedt, M.; Hair, J.F.; Cheah, J.H.; Ting, H.; Vaithilingam, S.; Ringle, C.M. Predictive Model Assessment in PLS-SEM: Guidelines for Using PLSpredict. Eur. J. Mark. 2019, 53, 2322–2347. [Google Scholar] [CrossRef]
Figure 1. Proposed research model.
Sustainability 15 00945 g001
Table 1. Theories and models in O2O literature.
Theory and ModelArticleCount
Technology acceptance model (TAM) [33,34][11,17,21,35,36,37,38,39,40,41]10
General service quality theories
(e.g., SERVQUAL [42])
[22,43,44,45,46,47,48,49,50,51]10
Expectation confirmation theory (ECT) [52]
and expectation confirmation model (ECM) [53]
[45,54,55,56,57]5
General value theories/models
(e.g., consumer perceived value [58])
[11,22,56,59,60]5
Information systems success model (ISSM) [61,62][35,59,63]3
Elaboration likelihood model (ELM) [64][37,65]2
Diffusion of innovations theory (DIT) [66][17,18]2
The extended unified theory of acceptance and use of technology (UTAUT2) [67][16,68]2
Theory of planned behavior (TPB) [69][38,41]2
Table 2. The profile of respondents (N = 500).
FieldCategoryFrequencyPercentage
GenderMale28957.8%
Female21142.2%
Age16–2217535.0%
23–3020140.2%
31–4010220.4%
Over 40224.4%
Service typeTo-shop22344.6%
To-home27755.4%
Table 3. Results of full collinearity assessment.
VariablePESIOFCHMPVHACOPRCI
Inner VIF1.7021.2621.4181.3101.3461.8811.6861.0741.542
Table 4. Reliability of reflective measures.
ConstructItemIndicator ReliabilityInternal Consistency Reliability
LoadingAlphaRho_ACR
PEPE10.8670.8810.8810.918
PE20.834
PE30.845
PE40.886
SISI10.8410.7910.7980.877
SI20.829
SI30.846
OFCOFC10.8350.8190.8230.881
OFC20.833
OFC30.809
OFC40.742
HMHM10.8710.8720.8720.922
HM20.905
HM30.902
PVPV10.8958.8550.8580.912
PV20.886
PV30.860
HAHA10.8990.8830.8850.920
HA20.792
HA30.895
HA40.855
CICI10.9120.9030.9030.939
CI20.929
CI30.904
Table 5. Convergent and discriminant validity of reflective measures.
ConstructConvergent ValidityDiscriminant Validity *
AVEPESIOFCHMPVHA
PE0.737
SI0.7040.441
OFC0.6490.4460.391
HM0.7970.4770.2990.405
PV0.7750.4520.3610.4220.365
HA0.7420.6090.4630.5970.4930.473
CI0.8380.8100.4910.6830.5930.5660.847
* The lower left triangle contains HTMT ratios, all of which were significantly lower than the threshold value (bootstrapping settings: 10,000 subsamples, percentile bootstrap method, one-tailed test, α = 0.05).
Table 6. Assessment of formative measurement models.
ConstructItemConvergent ValidityCollinearityIndicator’s Significance and Relevance
Redundancy AnalysisOuter VIFWeightLoadingSignificance *
COCO10.8301.3870.3590.749Yes
CO21.3450.4380.769Yes
CO31.1710.5110.770Yes
PRPR10.7891.3660.2600.686Yes
PR21.7800.3200.757Yes
PR31.7130.2870.739Yes
PR41.1460.3100.601Yes
PR51.1630.3000.605Yes
* Bootstrapping settings: 10,000 subsamples, percentile bootstrap method, two-tailed test, α = 0.05.
Table 7. Assessment of measurement invariance (to-shop versus to-home).
ModelConfigural
Invariance
Compositional InvarianceEquality of Composite Means and Variances
c
Value
p
Value
ResultMean
Difference
p
Value
ResultVariance
Difference
p
Value
Result
PEEstablished1.0000.655Established0.0440.626Equal−0.0240.823Equal
SIEstablished0.9980.391Established0.1330.140Equal−0.0280.769Equal
OFCEstablished0.9990.521Established0.0880.324Equal−0.0980.394Equal
HMEstablished1.0000.930Established0.1660.065Equal0.1080.279Equal
PVEstablished1.0000.875Established0.1350.128Equal−0.0820.412Equal
HAEstablished1.0000.831Established−0.1250.169Equal0.0810.423Equal
COEstablished0.9950.497Established0.0460.623Equal0.0620.549Equal
PREstablished0.9820.624Established−0.0950.288Equal0.0150.889Equal
CIEstablished1.0000.961Established0.0140.866Equal−0.0160.887Equal
Permutation settings: 5000 permutations, two-tailed test, α = 0.05.
Table 8. PLS path analysis results.
PathHypothesisInner
VIF
Path
Coefficient
95% Percentile
Confidence Interval
p
Value
Resultƒ2R2
PE→CIH12.1530.224[0.168, 0.276]0.000 *Supported0.1150.798
SI→CIH21.2740.014[−0.022, 0.050]0.261 Not supported0.001
OFC→CIH31.4660.158[0.112, 0.205]0.000 *Supported0.084
HM→CIH41.3730.089[0.048, 0.129]0.000 *Supported0.029
PV→CIH51.3440.087[0.050, 0.124]0.000 *Supported0.028
HA→CIH61.9060.321[0.265, 0.373]0.000 *Supported0.267
CO→CIH72.3670.210[0.155, 0.269]0.000 *Supported0.092
PR→CIH81.829−0.084[−0.134, −0.042]0.001 *Supported0.019
Bootstrapping settings: 10,000 subsamples, percentile bootstrap method, one-tailed test, α = 0.05. * Significant at the given α.
Table 9. Assessment of predictive power focusing on continued intention (CI).
IndicatorQ2_PredictRMSE_PLSRMSE_LMRMSE_PLS—RMSE_LM
CI 10.6600.7000.716−0.016
CI 20.6560.7900.817−0.027
CI 30.6650.7860.802−0.016
Table 10. Multigroup analysis for path coefficients (PC).
PathHypothesis①PC
(to-Shop)
②PC
(to-Home)
PC Difference
(① − ②)
p
Value
95% Percentile
Confidence Interval
Result
OFC→CIH9 a0.1330.176−0.0430.460[−0.113, 0.111]Not supported
HM→CIH9 b0.1480.0410.1070.033 *[−0.099, 0.098]Supported
PV→CIH9 c0.1540.0500.1050.025 *[−0.089, 0.091]Supported
PR→CIH9 d−0.036−0.1560.1200.032 *[−0.114, 0.105]Supported
Permutation settings: 5000 permutations, two-tailed test, and α = 0.05. * Significant at the given α.
Disclaimer/Publisher’s Note: The statements, opinions and data contained in all publications are solely those of the individual author(s) and contributor(s) and not of MDPI and/or the editor(s). MDPI and/or the editor(s) disclaim responsibility for any injury to people or property resulting from any ideas, methods, instructions or products referred to in the content.

