Article

Influence of Landscape Pattern Evolution on Soil Conservation in a Red Soil Hilly Watershed of Southern China

1
College of Landscape Architecture and Art, Fujian Agriculture and Forestry University, Fuzhou 350002, China
2
Innovation Center of Engineering Technology for Monitoring and Restoration of Ecological Fragile Areas in Southeast China, Ministry of Natural Resources, Fuzhou 350013, China
*
Author to whom correspondence should be addressed.
Sustainability 2023, 15(2), 1612; https://doi.org/10.3390/su15021612
Submission received: 17 November 2022 / Revised: 3 January 2023 / Accepted: 10 January 2023 / Published: 13 January 2023

Abstract

:
The Tingjiang Watershed is a typical mountainous area with red soil in the south of China. Due to the high rainfall intensity, significant cultivated land expansion, and accelerated urbanization, ecological problems such as soil erosion are prominent in the study area. Based on the land use, precipitation, digital elevation model (DEM), normalized difference vegetation Index (NDVI), and soil types in 2000, 2010, and 2020, the landscape pattern and soil conservation in the Tingjiang Watershed were assessed at the sub-watershed scale. The spatial correlation between soil conservation and landscape pattern was analyzed using GeoDA software. The results show the following: (1) From 2000 to 2020, the total amount of soil conservation decreased by 4.15 × 10⁸ t. In terms of spatial analysis, the amount of soil conservation in the Tingjiang Watershed showed an upward and then downward trend in the north and a downward trend in the south, with the most obvious downward trend in the southeast and the northeast. (2) Fragmentation of the overall landscape pattern in the Tingjiang Watershed has increased. The discrete degree and homogeneity of patches decreased in Changting County, while landscape heterogeneity and homogeneity increased in Shanghang, Liancheng, and Yongding Counties. (3) Soil conservation was significantly correlated with the landscape indices patch density (PD), landscape shape index (LSI), mean patch area (AREA_MN), patch cohesion index (COHESION), splitting index (SPLIT), and Shannon evenness index (SHEI). Sub-watersheds with low soil conservation had landscape splitting index, landscape dispersion, patch type richness, and boundary complexity. These areas were mainly distributed in the southern part of the watershed. Sub-watersheds with higher soil conservation were characterized by low patch fragmentation and strong connectivity of dominant patches, which were mainly located in the northern part of the watershed. (4) The spatial error model (SEM) fit better in 2000, 2010, and 2020 compared with the spatial lag model (SLM) and ordinary least squares regression (OLS). The diagnostic results of the SEM model show that among the six landscape indices, PD, SHEI, and AREA_MN are the main influencing factors affecting soil conservation in the watershed to different degrees. The purpose of this study was to investigate the response state of soil conservation capacity as landscape patterns evolve in the Tingjiang Watershed, with the goal of providing a reference for landscape planning and management as well as soil erosion management in the watershed.

1. Introduction

The landscape pattern can reflect the composition of the landscape structure and the spatial configuration and other characteristics of the study area. At the same time, the landscape pattern also determines the stability of ecological processes such as the water cycle, carbon cycle, and flow of information in terrestrial ecosystems [1,2,3]. The landscape index, as a quantitative indicator of spatial pattern changes, is often used to describe and compare the dynamic changes in landscape patterns [4]. In addition, landscape pattern indices have been applied in many studies, such as studies on the construction of regional ecological networks [5], landscape ecological risk assessment [6], green space planning and design [7], and the calculation of ecosystem service value [8].
Soil conservation is an important regulating service of ecosystem components [9]; it characterizes the ability of the ecosystem to control erosion [10]. The sustainability of human well-being is correlated with the health of ecosystems, which serve as the foundation for human existence and progress. Soil conservation is not only a key to sustainable development [11] but also an important method to prevent soil erosion and conserve land productivity [12,13]. Data calculation is usually based on the difference between the amount of erosion in the bare ground state and the actual amount of soil erosion. Soil erosion, as one of the most serious global environmental problems, has led to the destruction of many primary forests and the fragmentation of land use since the industrial revolution under the influence of accelerated urbanization, rapid population growth, and inappropriate land use planning [14,15]. This has further led to weakening of the productivity of the land and even affected the safety of people [16]. Therefore, capturing the extent of soil conservation and its spatial distribution characteristics can help in providing targeted solutions for different regions [17]. To assess the dynamics of soil erosion changes, scholars commonly use empirical and physical models [18]. Empirical modeling methods include the Soil Loss Estimator for Southern Africa (SLEMSA) model [19] and the revised Morgan, Morgan and Finney (RMMF) model [20]. Physical models include the water erosion prediction project (WEPP) model [21], the Griffith University Erosion Sedimentation System (GUESS) model [22], and the European Soil Erosion Model (EUROSEM) [23]. In addition, several modeling tools are used in quantitative soil conservation studies: the soil and water assessment tool (SWAT) [24], the soil and water loss equation (RUSLE) [25], the universal soil loss equation (USLE) [26], and the sediment delivery ratio module of the Integrated Valuation of Ecosystem Services and Trade-offs model (InVEST-SDR). The InVEST-SDR model has the advantages of easy operation and strong spatial expression and is mostly used in studies to assess the dynamics of soil conservation at medium and large scales [27].
In China, the southern red soil hilly region has some of the most serious soil erosion. This region is a special karst landscape with large topographic relief, poor soil texture, and more concentrated areas of heavy rainfall. In addition, the intensity of disturbance from human activities is high [28]. Since 1957, when the provisional soil and water conservation policies was promulgated, soil conservation has gradually received attention from all parts of society in China [29,30,31]. Systematically managing mountains, water, forests, fields, lakes, grassland, and sands and strengthening the integrated management of regional soil erosion are crucial subjects of current policies [32].
Studies on soil conservation in the past only looked at the region’s geographical features and variability from a mathematical and statistical point of view. The majority of research used landscape ecology as the starting point and applied the landscape pattern index and land use cover data to the quantitative analysis of soil conservation and landscape pattern evolution [33,34]. According to Sourn et al., changes in land use and land cover have an impact on soil conservation [35]. Another example is the soil erosion at mining pit sites, which Xu et al. found may be accurately expressed by the landscape index [36]. Liu et al. claimed that the evolution of landscape patterns can have an impact on hydrological processes [37], which in turn will affect the health of the entire ecosystem [38]. However, fewer studies have focused on the geographical spillover effects within research regions and the multiple covariances that might exist across landscape indices, which show the spatial dependency between landscape patterns and soil conservation. In this study, we also analyzed the geographical statistical response of soil conservation to the evolution of landscape patterns and explored the spatial association between them.
The Tingjiang Watershed, the third largest water system in Fujian Province, is a typical red soil hilly area. There are significant human activities in the watershed, which has a total population of about 1.65 million. Granite makes up the majority of the soil parent material in the watershed, which makes it vulnerable to weathering and erosion from both excessive rainfall and severe weather. The majority of the vegetation in the research region is planted and secondary woods, and there is so little natural vegetation that the soil conservation capacity is poor. The watershed covers Fujian and Guangdong Provinces, and its downstream tributaries converge into the Han River watershed, the second largest water system in Guangdong Province. Therefore, the health of the Tingjiang Watershed ecosystem directly affects the ecological and environmental quality of Fujian and Guangdong provinces [39].
At present, studies on the Tingjiang Watershed mainly focus on water and sand changes, runoff changes, and soil erosion conditions. Studies on soil conservation are mainly concentrated in areas distributed in Changting County and the upper reaches of the Tingjiang. Furthermore, no study has been published investigating the spatial correlation between landscape pattern changes and soil conservation over a long time series using the whole Tingjiang Watershed as the study area. Therefore, after combining related studies and the status of the watershed, in this study, we used the sediment transport ratio (SDR) in the Integrated Valuation of Environmental Services and Trade-offs (InVEST) assessment model to calculate soil conservation. This module is an enhancement of the basic framework of the universal soil loss equation (USLE). Then, the relevant landscape indices were calculated using FRAGSTAS 4.1 software, and multiple covariance index screening was performed in SPSS software. Finally, after processing the data with ArcGIS 10.7 software, the spatial correlation and spatial dependence between landscape indices and soil conservation were explored using GeoDA software, which provided a reliable reference for soil conservation services in the Tingjiang Watershed [40,41].

2. Study Area Overview and Data

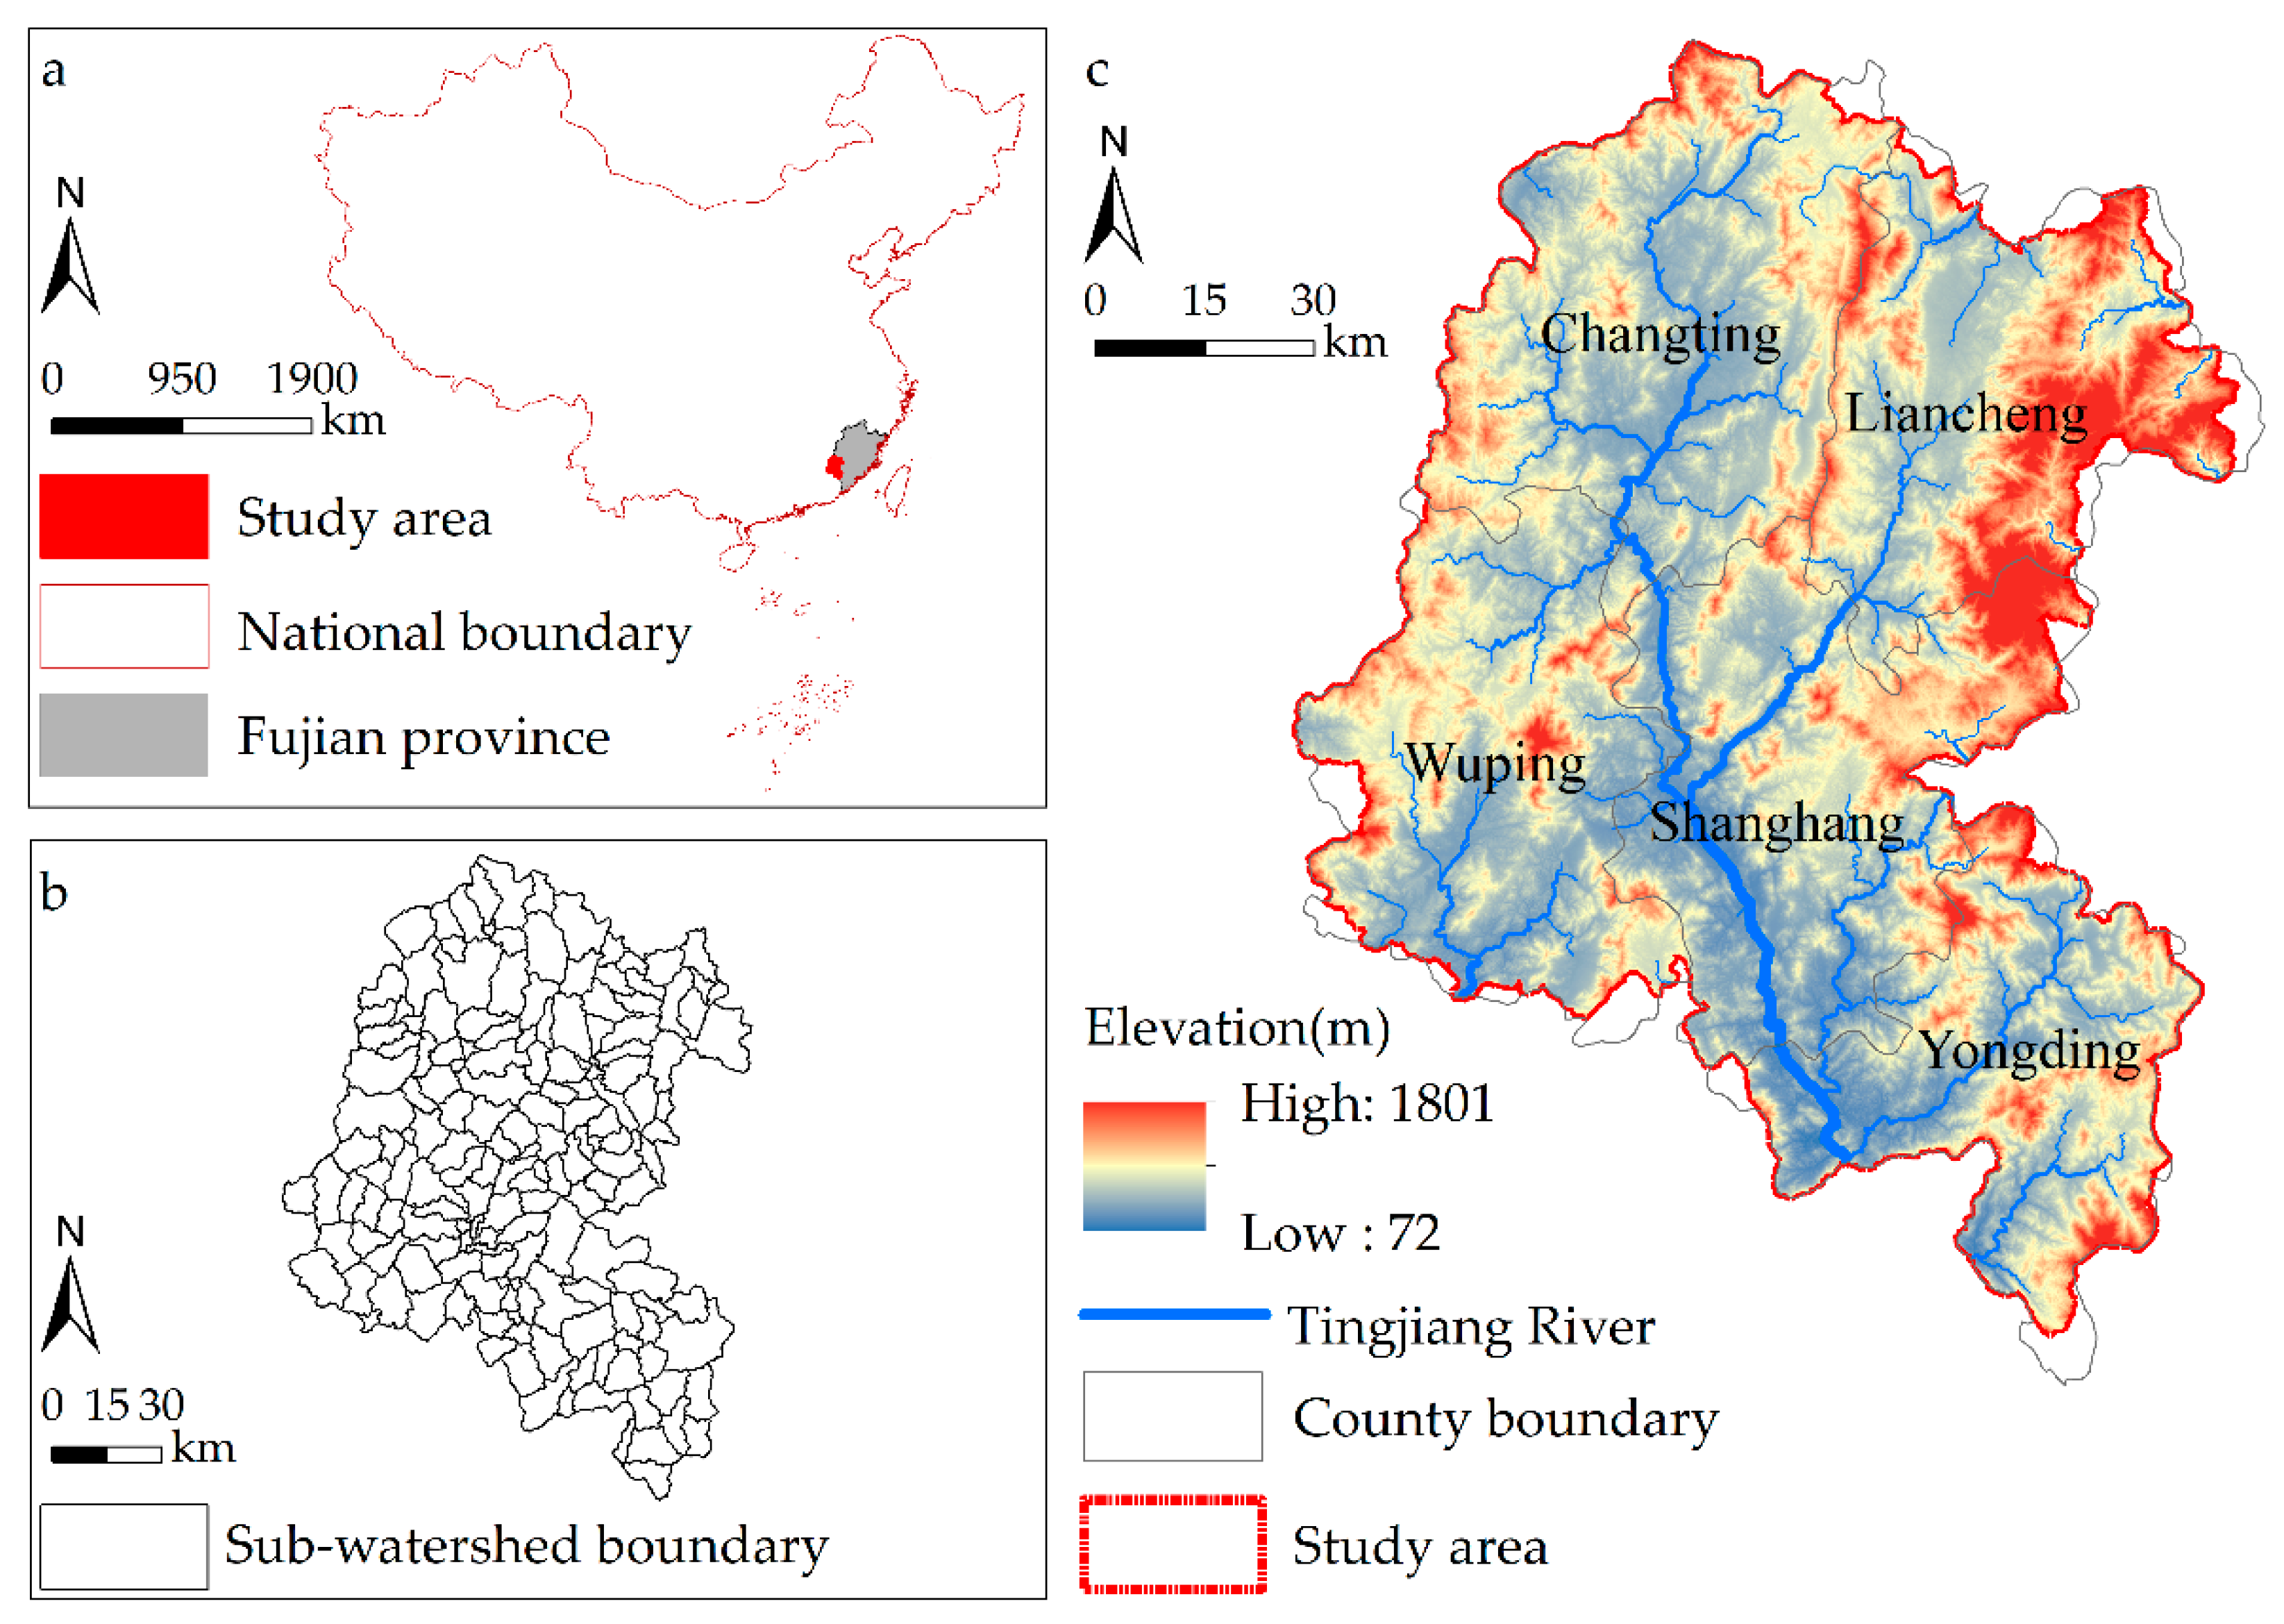
2.1. Study Area Overview

The Tingjiang, located in the west of Fujian Province, originates from a hilly area on the southeast side of the southern slope of Wuyi Mountain. It is one of the main tributaries of the Han River watershed, with a length of about 285 km, along which the catchment area of Fujian Province is 9022 km2. The main tributaries in the watershed include the Qutian River, Taolan stream, Jiuxian River, Huangtan River, Yongding River, and Jinfeng stream [42]. The Tingjiang Watershed (115°59′–117°10′ E, 24°28′–26°02′ N) belongs to the central subtropical monsoon climate zone and is controlled by the subtropical anticyclone, with annual precipitation peaking in May–August each year; it is one of the high rainfall areas in Fujian Province [43]. The watershed receives an average of 1450 to 2200 mm of rain annually, and because of the red and yellow loam soil type and sparse surface plant cover, heavy rain and typhoons can easily cause soil erosion and floods. [44]. From 2000 to 2020, with increasing urbanization in the watershed, large areas of natural surfaces were replaced by artificial environments. For example, in 2000–2020, the urbanization rate in Shanghang County increased from 18.45 to 51.47%. In this study, five areas through which the mainstream and main tributaries of the Tingjiang flow were selected: Changting County (CT), Liancheng County (LC), Shanghang County (SH), Wuping County (WP), and Yongding District (TD). Based on GDEMV2 digital elevation data with a resolution of 30 m, and using the hydrological analysis tool of ArcGIS 10.7 to process the watersheds, and 167 sub-watersheds were obtained after excluding the abnormal values (Figure 1b) [45].

2.2. Data Source

The China Land Cover Dataset (CLCD), with a resolution of 30 m, was obtained from a public study by Yang et al. at Wuhan University [46] (http://irsip.whu.edu.cn/resources/CLCD.php, accessed on 8 May 2022). The digital elevation model (DEM) data adopted the GDEMV2 digital elevation data with a resolution of 30 m from the Geospatial Data Cloud (http://www.gscloud.cn, accessed on 11 March 2022). Chinese 1 km resolution precipitation data were obtained from the Geographic Resources Sub-center of the National Science and Technology Infrastructure Platform’s National Earth System Science Data Center (http://gre.geodata.cn, accessed on 8 May 2022). The largest normalized difference vegetation index (NDVI) datasets of the year were obtained from the National Science and Technology Infrastructure Platform’s National Data Center for Ecological Sciences (http://www.nesdc.org.cn, accessed on 8 May 2022) [47]. The distribution of soil types and data on their physical and chemical properties with a resolution of 500 m were obtained from the “National Qinghai-Tibet Plateau Science Data Center” (http://data.tpdc.ac.cn, accessed on 8 May 2022) [48,49]. To make the model run smoothly and reduce errors, the accuracy of the obtained data was standardized to 30 m using resampling. The general ideas and data organization regarding this study have been integrated in the framework of the study (Figure 2).

3. Materials and Methods

3.1. Soil Conservation Function Assessment

This study applied the sediment transport ratio (SDR) module of the Integrated Valuation of Environmental Services and Trade-offs (InVEST) software to quantify potential versus actual erosion in the study area to quantitatively assess the soil conservation function of the watershed, which is improved by the soil loss equation (USLE). The model equations and specific calculations are as follows [50,51]:
SD = RKLS     USLE
RKLS = f   ( R · K · LS )
ULSE = R · K · LS · C · P
where SD is the soil conservation amount, ULSE is the actual soil erosion amount, RKLS is the potential soil erosion, R is the rainfall erosion force factor, K is the soil erodibility factor, C is the vegetation cover and management factor, P is the soil and water conservation measure factor based on the current status of the site and previous studies (its value is in 0~1), LS is the slope length factor, which is automatically generated based on the input of filled DEM data. The formula is as follows:
R = 0.053 P n 1.655
where Pn is the annual rainfall.
K epic = 0.2 + 0.3 e 0.0256 SAN 1 SIL × SIL CLA + SIL 0.3 × 1 0.25 OC OC + e 3.72 2.95 OC × 1 0.7 SN 1 SN 1 + e 5.51 + 22.9 SN 1
K = 0.0138 + 0.51575 × K epic × 0.1317
where SAN, SIL, CLA, OC are the content of sand, powder, clay sand, and organic carbon, respectively. SN1 = 1 – SAN/100.
C = 1 , c = 0 0.6508 0.3436 × l o g 100 c , 0 < c 78.3 % 0 , c 78.3 %
c = NDVI NDVI min / NDVI max NDVI min
where C is the vegetation cover and management factor, c is the vegetation cover obtained by NDVI, and its value range is [0, 1]; NDVI is the normalized difference vegetation index; NDVImax is the maximum value; and NDVImin is the minimum value.

3.2. Landscape Pattern Index

To reflect landscape pattern characteristics such as composition, fragmentation, and connectivity, six landscape pattern indices (Table 1) were selected as indicators by referring to relevant studies and the actual conditions in the study area [29,52]: patch density (PD), landscape shape index (LSI), mean patch area (AREA_MN), patch cohesion index (COHESION), splitting index (SPLIT), and Shannon evenness index (SHEI).
The interaction between the selected landscape indices can lead to multicollinearity among the variables. Therefore, in this study, the soil conservation per unit area was used as the dependent variable and each landscape index as an independent variable, and the linear regression model in SPSS software was used to diagnose the multiple cointegrations of the selected independent variables. From the analysis of the results of the F-test, it was found that the independent variables showed significance at the 5% level, and the model met the requirements, Moreover, if the variance inflation factor (VIF) in the results obtained from the linear regression model (Table 2) is less than 10, there was no multicollinearity. In this study, we found that the variables AREA_MN, SPLIT, COHESION, SHEI, CONTAG, and PD all had a VIF value of less than 10, so all six landscape indices were included in the subsequent model analysis. The equation to calculate the VIF is as follows:
VIF = 1 1     R 2
R 2 = 1   SS res SS tot
SS tot = i = 1 n y i y ¯ 2
SS res = i = 1 n y i   x i 2
y ¯ = 1 n i = 1 n y i
where xi and yi are the x and y variables’ values at i (i = 1, 2, 3, ... n), y ¯ is the mean value of the simulation, SSres is the sum of squared residuals, SStot is the sum of squares after removing the mean, and R2 is the overall fit of the fitted function.

3.3. Spatial Autocorrelation

The study of the relationship between regions on a spatial scale is known as spatial autocorrelation. First, in order to express the spatial relationship between sub-watersheds, in this study we selected the queen contiguity criterion in GeoDA software to construct a spatial weight matrix W [53,54]. The formula is as follows:
W   = w 11 w 12 w 1 n w 21 w 22 w 2 n w n 1 w n 2 w nn
where n is the number of space units, Wij is the neighbor relationship between region i and j. In this study, a weight matrix based on spatial adjacency relationships is established for 167 sub-watersheds within the Tingjiang Watershed, where adjacency means having common boundaries; the formula is as follows:
w ij = 1 , W h e n   r e g i o n   i   i s   a d j a c e n t   t o   j 0 , o t h e r
Second, the spatial correlation between landscape pattern indices and soil conservation was analyzed using global and local spatial autocorrelation [55].

3.3.1. Global Spatial Autocorrelation

Global spatial autocorrelation is used to reflect the distribution pattern of the independent and dependent variables in the entire space, divided into aggregation, discrete, and random. Among the indices, the global Moran’s I index reflects the similarity of the attribute values of spatially adjacent regions [56]. The formula is as follows [57]:
I = r = 1   n h = 1   n w r   h ( x r x ¯ ) ( x h x ¯ ) S 2 r = 1 n   h = 1 n w rh
S 2 = 1 n r ( x r   x ) 2
x ¯ = 1 n r = 1 n x r
where I is Moran’s index, n is the number of spatial units, xi and xj are the values or attributes of variables x at i and j, wij is the spatial weight array, and S2 is the squared difference of observations.

3.3.2. Local Spatial Autocorrelation

The local Moran’s I index characterizes the degree of similarity between the attribute values of a particular area and its neighbors. The degree of spatial correlation between soil conservation in each sub-watershed and the landscape pattern index of neighboring sub-watersheds was analyzed with the help of GeoDA software. The meaning of the formula is consistent with that of the global spatial autocorrelation, and the formula is as follows [58]:
I i = ( x i x ¯ ) S 2 j w ij ( x j x ¯ )

3.4. Spatial Autoregressive Model

In this study, three sets of regression models were selected for measurement: ordinary least squares regression (OLS), spatial lag model (SLM), and Spatial Error Model (SEM). The OLS model does not consider the spatial influence of neighboring regions, while the SLM and SEM consider the spatial error term and spatial lag term, respectively [59]. The presence of spatial spillover effects in the independent variables affects the explanatory power of the model, which leads to the possibility that the ordinary OLS model will no longer be applicable. In the OLS model, the spatial weight matrix W is added to obtain the Lagrange multipliers (LMLAG and LMERR) and their robustness (R-LMLAG and R-LMERR) as a way to determine which is a better fit, the SLM, SEM, or OLS model. If the results are significant for both LMLAG and LMERR, the models are selected according to the following criteria: when R-LMLAG is significant, use the SLM model, and when R-LMERR is significant, use the SEM model. However, if both LMLAG and LMERR are insignificant, the results of the OLS model are selected directly for the next step of analysis [60,61].

4. Results and Analysis

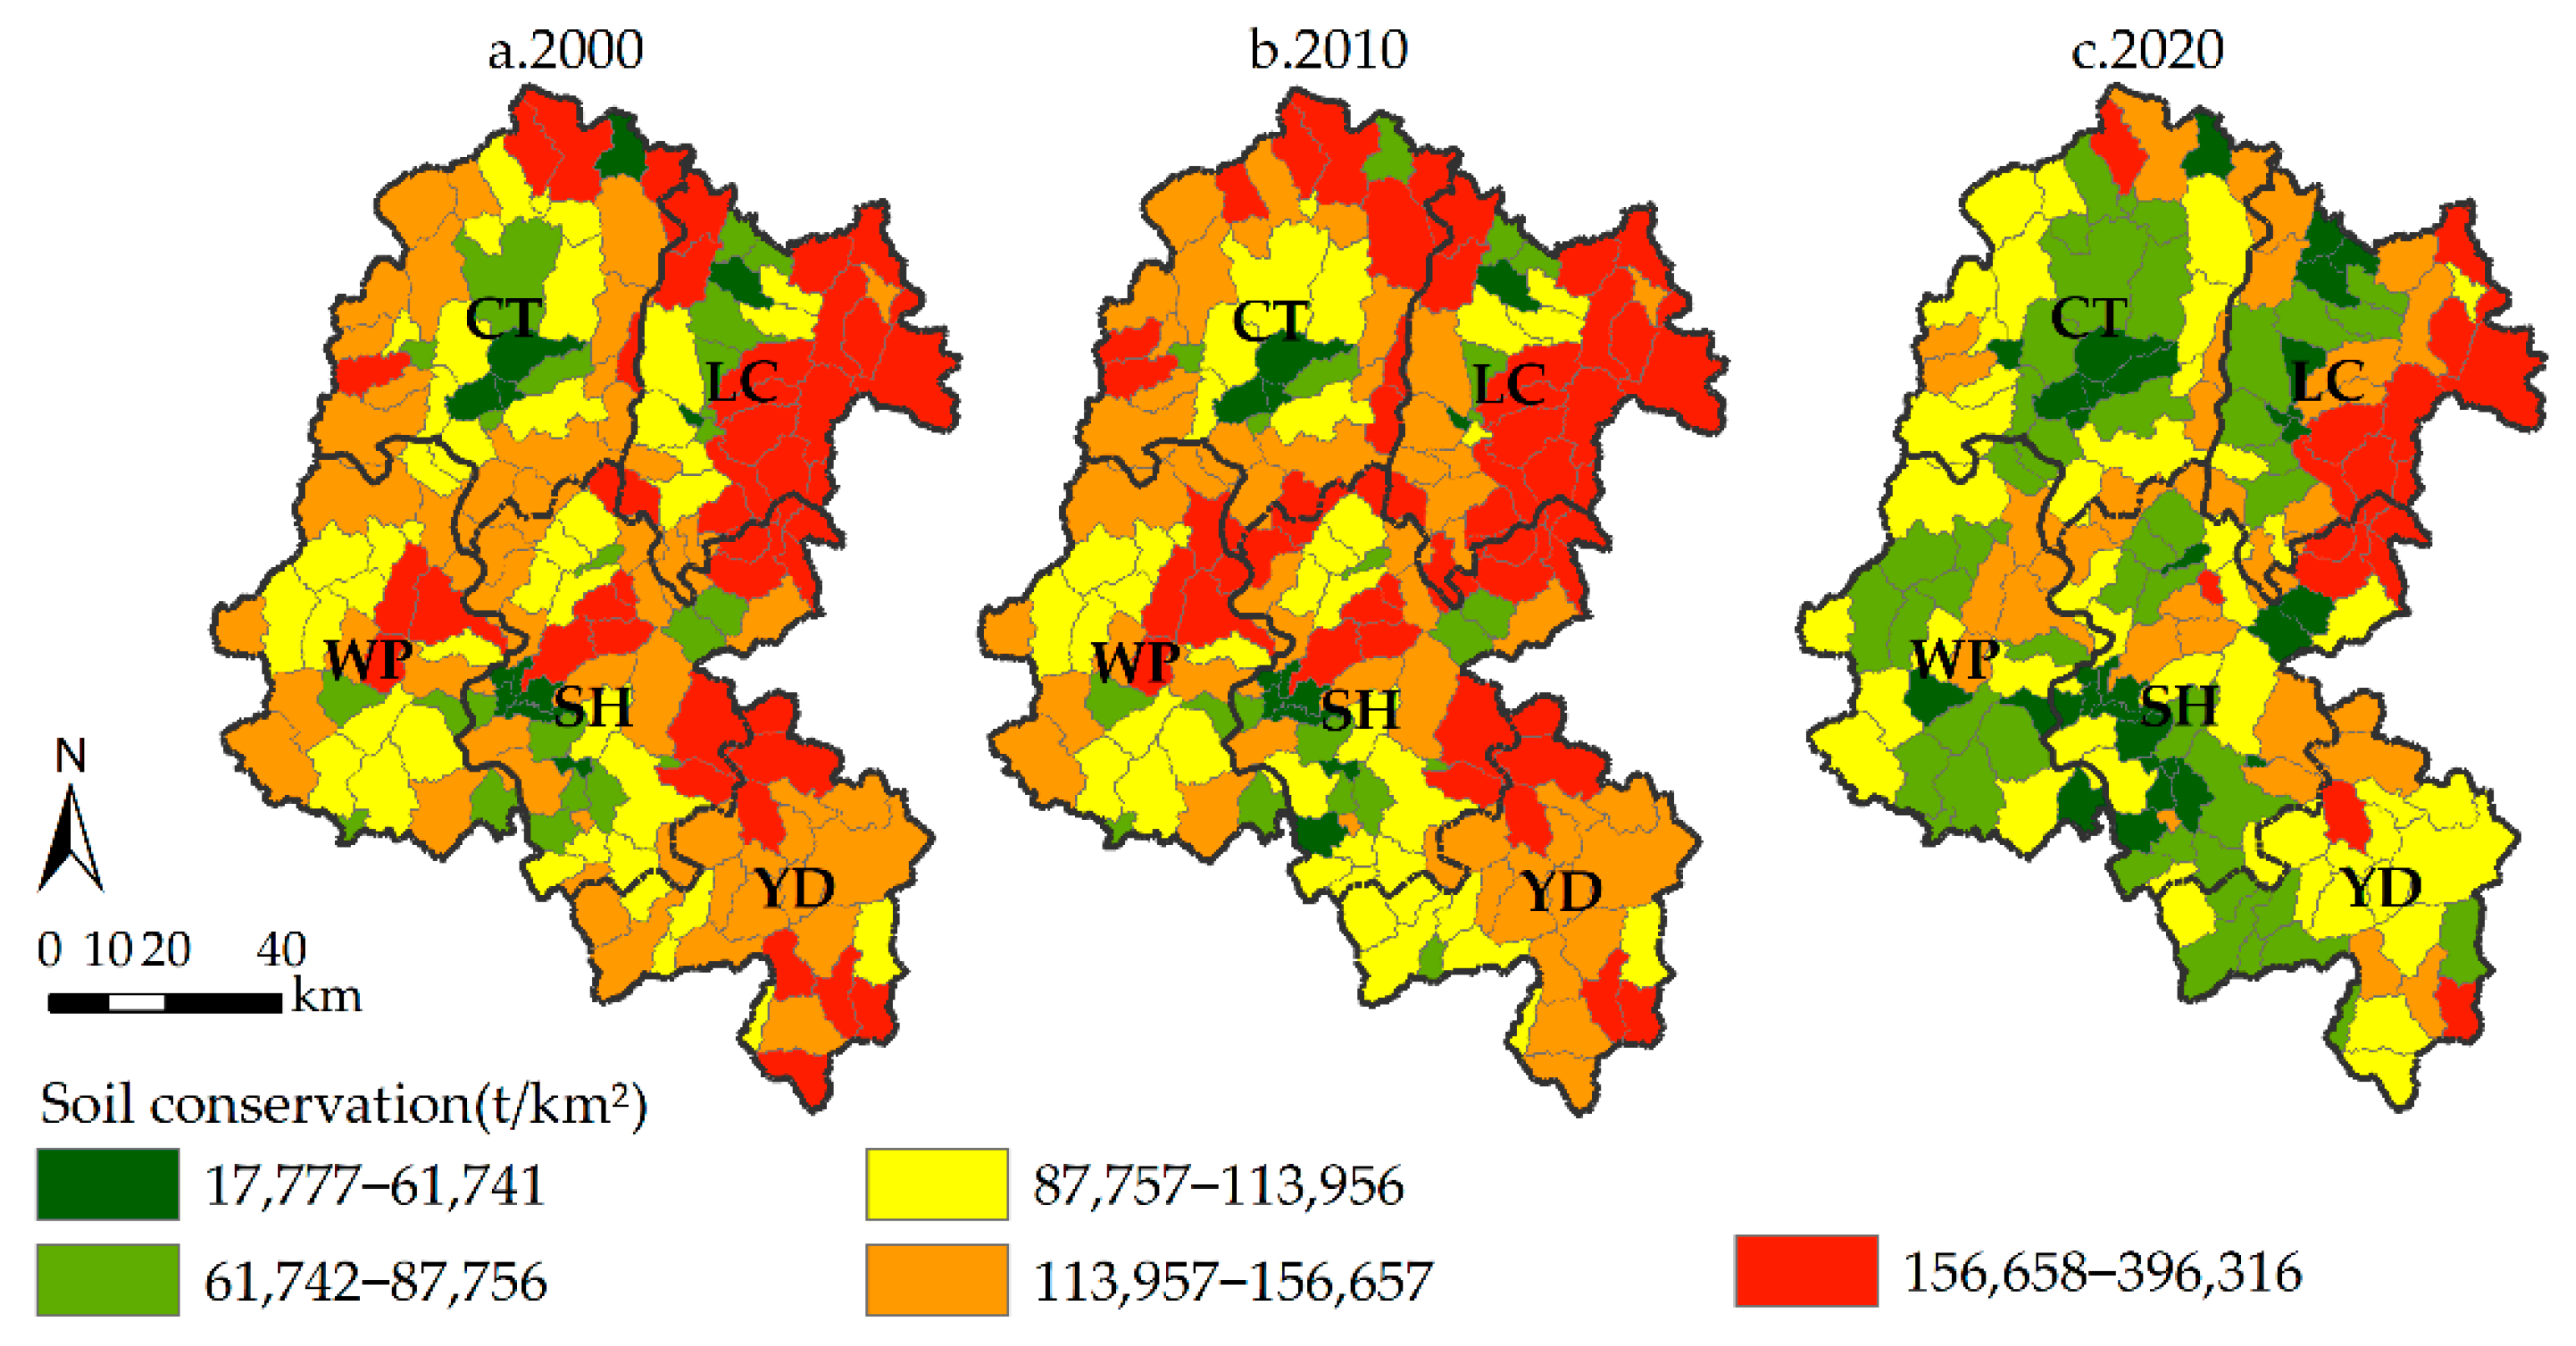
4.1. Spatial and Temporal Variation Characteristics of Soil Conservation in Watersheds

The total soil conservation of the Tingjiang Watershed initially increased and then decreased from 2000 to 2020 (Figure 3 and Figure 4). The total amount of soil conservation was 17.27 × 10⁸ t, 18.15 × 10⁸ t and 13.12 × 10⁸ t in 2000, 2010, and 2020, respectively, with a total decrease of 4.15 × 10⁸ t The variation of soil conservation in spatial characteristics is expressed as follows: 2000–2010, 33.53% of the sub-watersheds showed a trend of increasing soil conservation, distributed in the northern part of the watershed, while 66.47% of the sub-watersheds showed a decreasing trend, distributed in the southern part; in 2010–2020, the soil conservation in the whole study area showed a decreasing trend, mainly in the northeastern part of the watershed. Overall, it seems that the areas with the most obvious decreasing trend in soil retention from 2000 to 2020 are mainly concentrated in the central part of Shanghang and Liancheng Counties and the northern part of Yongding County.
Soil conservation per unit area was generally high in the east and low in the west, and the spatial distribution of soil conservation per unit area in the three years was relatively similar (Figure 3 and Figure 4). First, low values of soil conservation per unit area were distributed in the southwest of Wuping County, Shanghang County, and Yongding District, the south of Changting County, and the northwest of Liancheng County, where human activity was intense and the level of urbanization was relatively high. These regions are also the main flowing areas of the Tingjiang Watershed. Second, high values of soil conservation per unit area were distributed in the eastern part of Liancheng County, the border between Shanghang County and the northern part of Wuping County, and the northern part of Yongding District. The vegetation cover in these areas was continuous, and the distribution type was mainly large areas of forest, which has a stronger effect on soil conservation compared with other areas. Meanwhile, the spatial distribution characteristics of soil retention and potential soil erosion were roughly similar over the three years (Figure 5). In summary, from 2000 to 2020, the soil conservation volume in the northern part of the watershed showed an increasing and then decreasing trend, while the southern part showed a decreasing trend, which was most obvious in the southeastern and northeastern parts of the watershed.

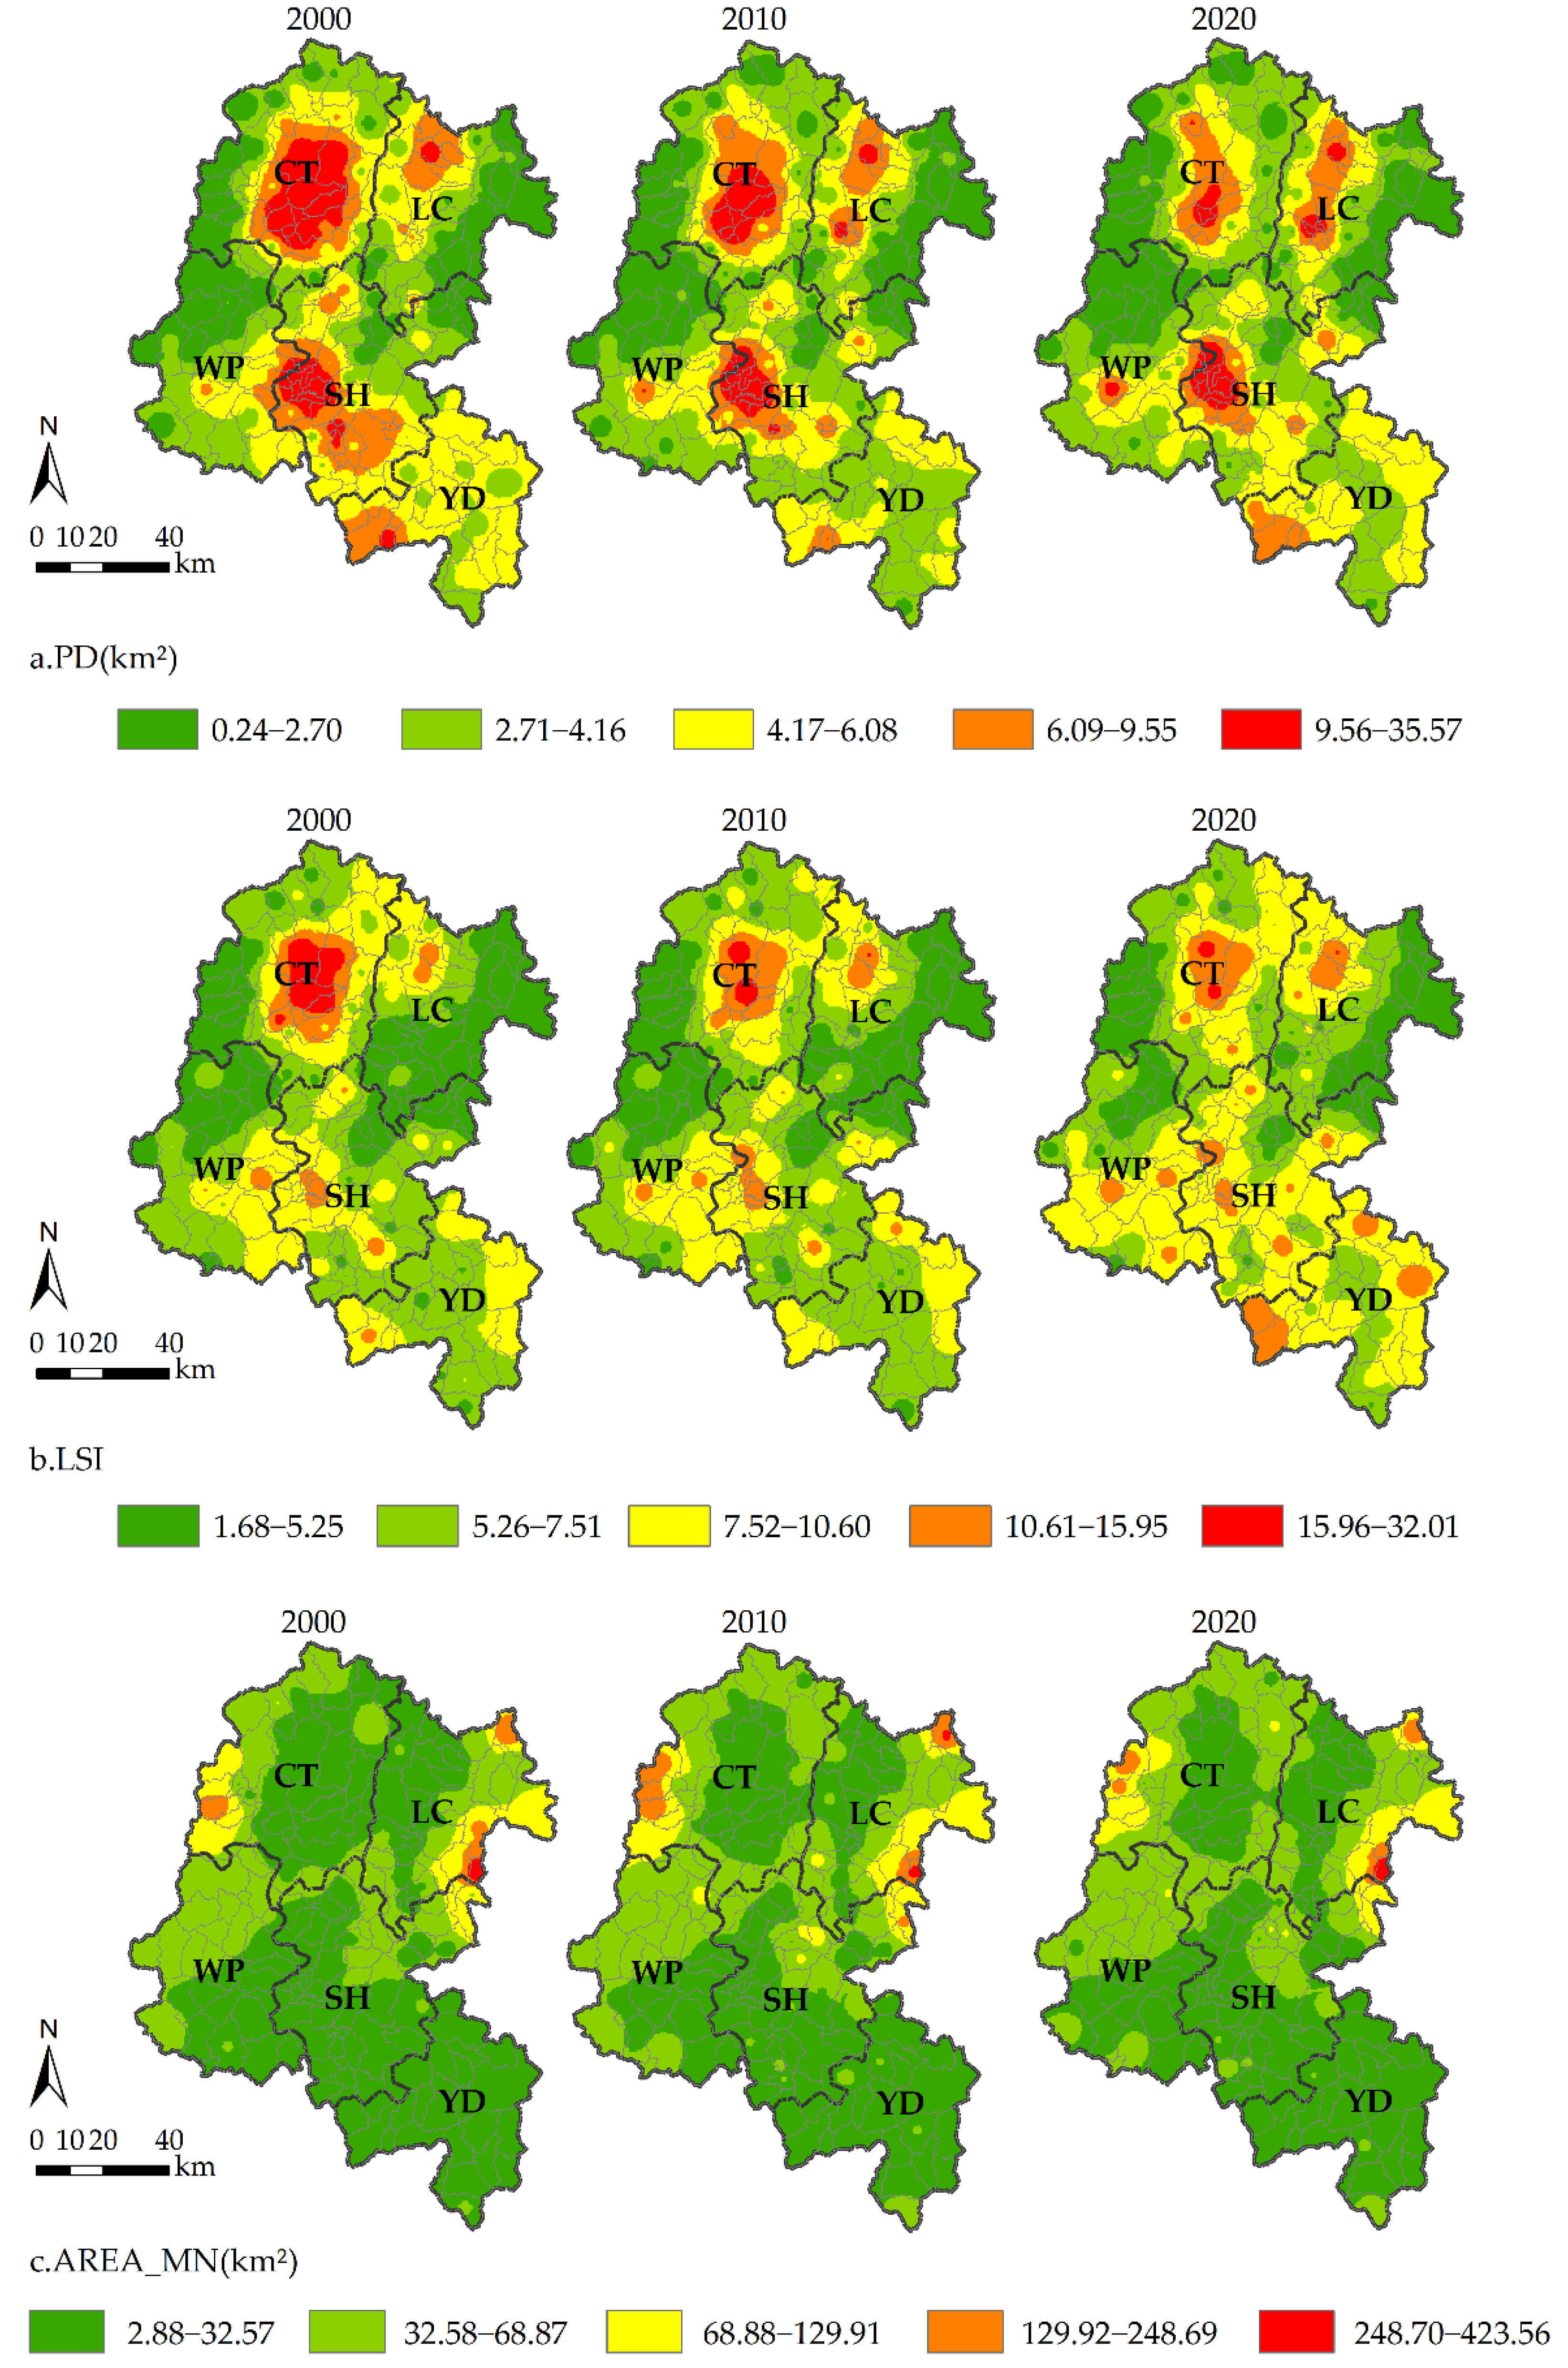
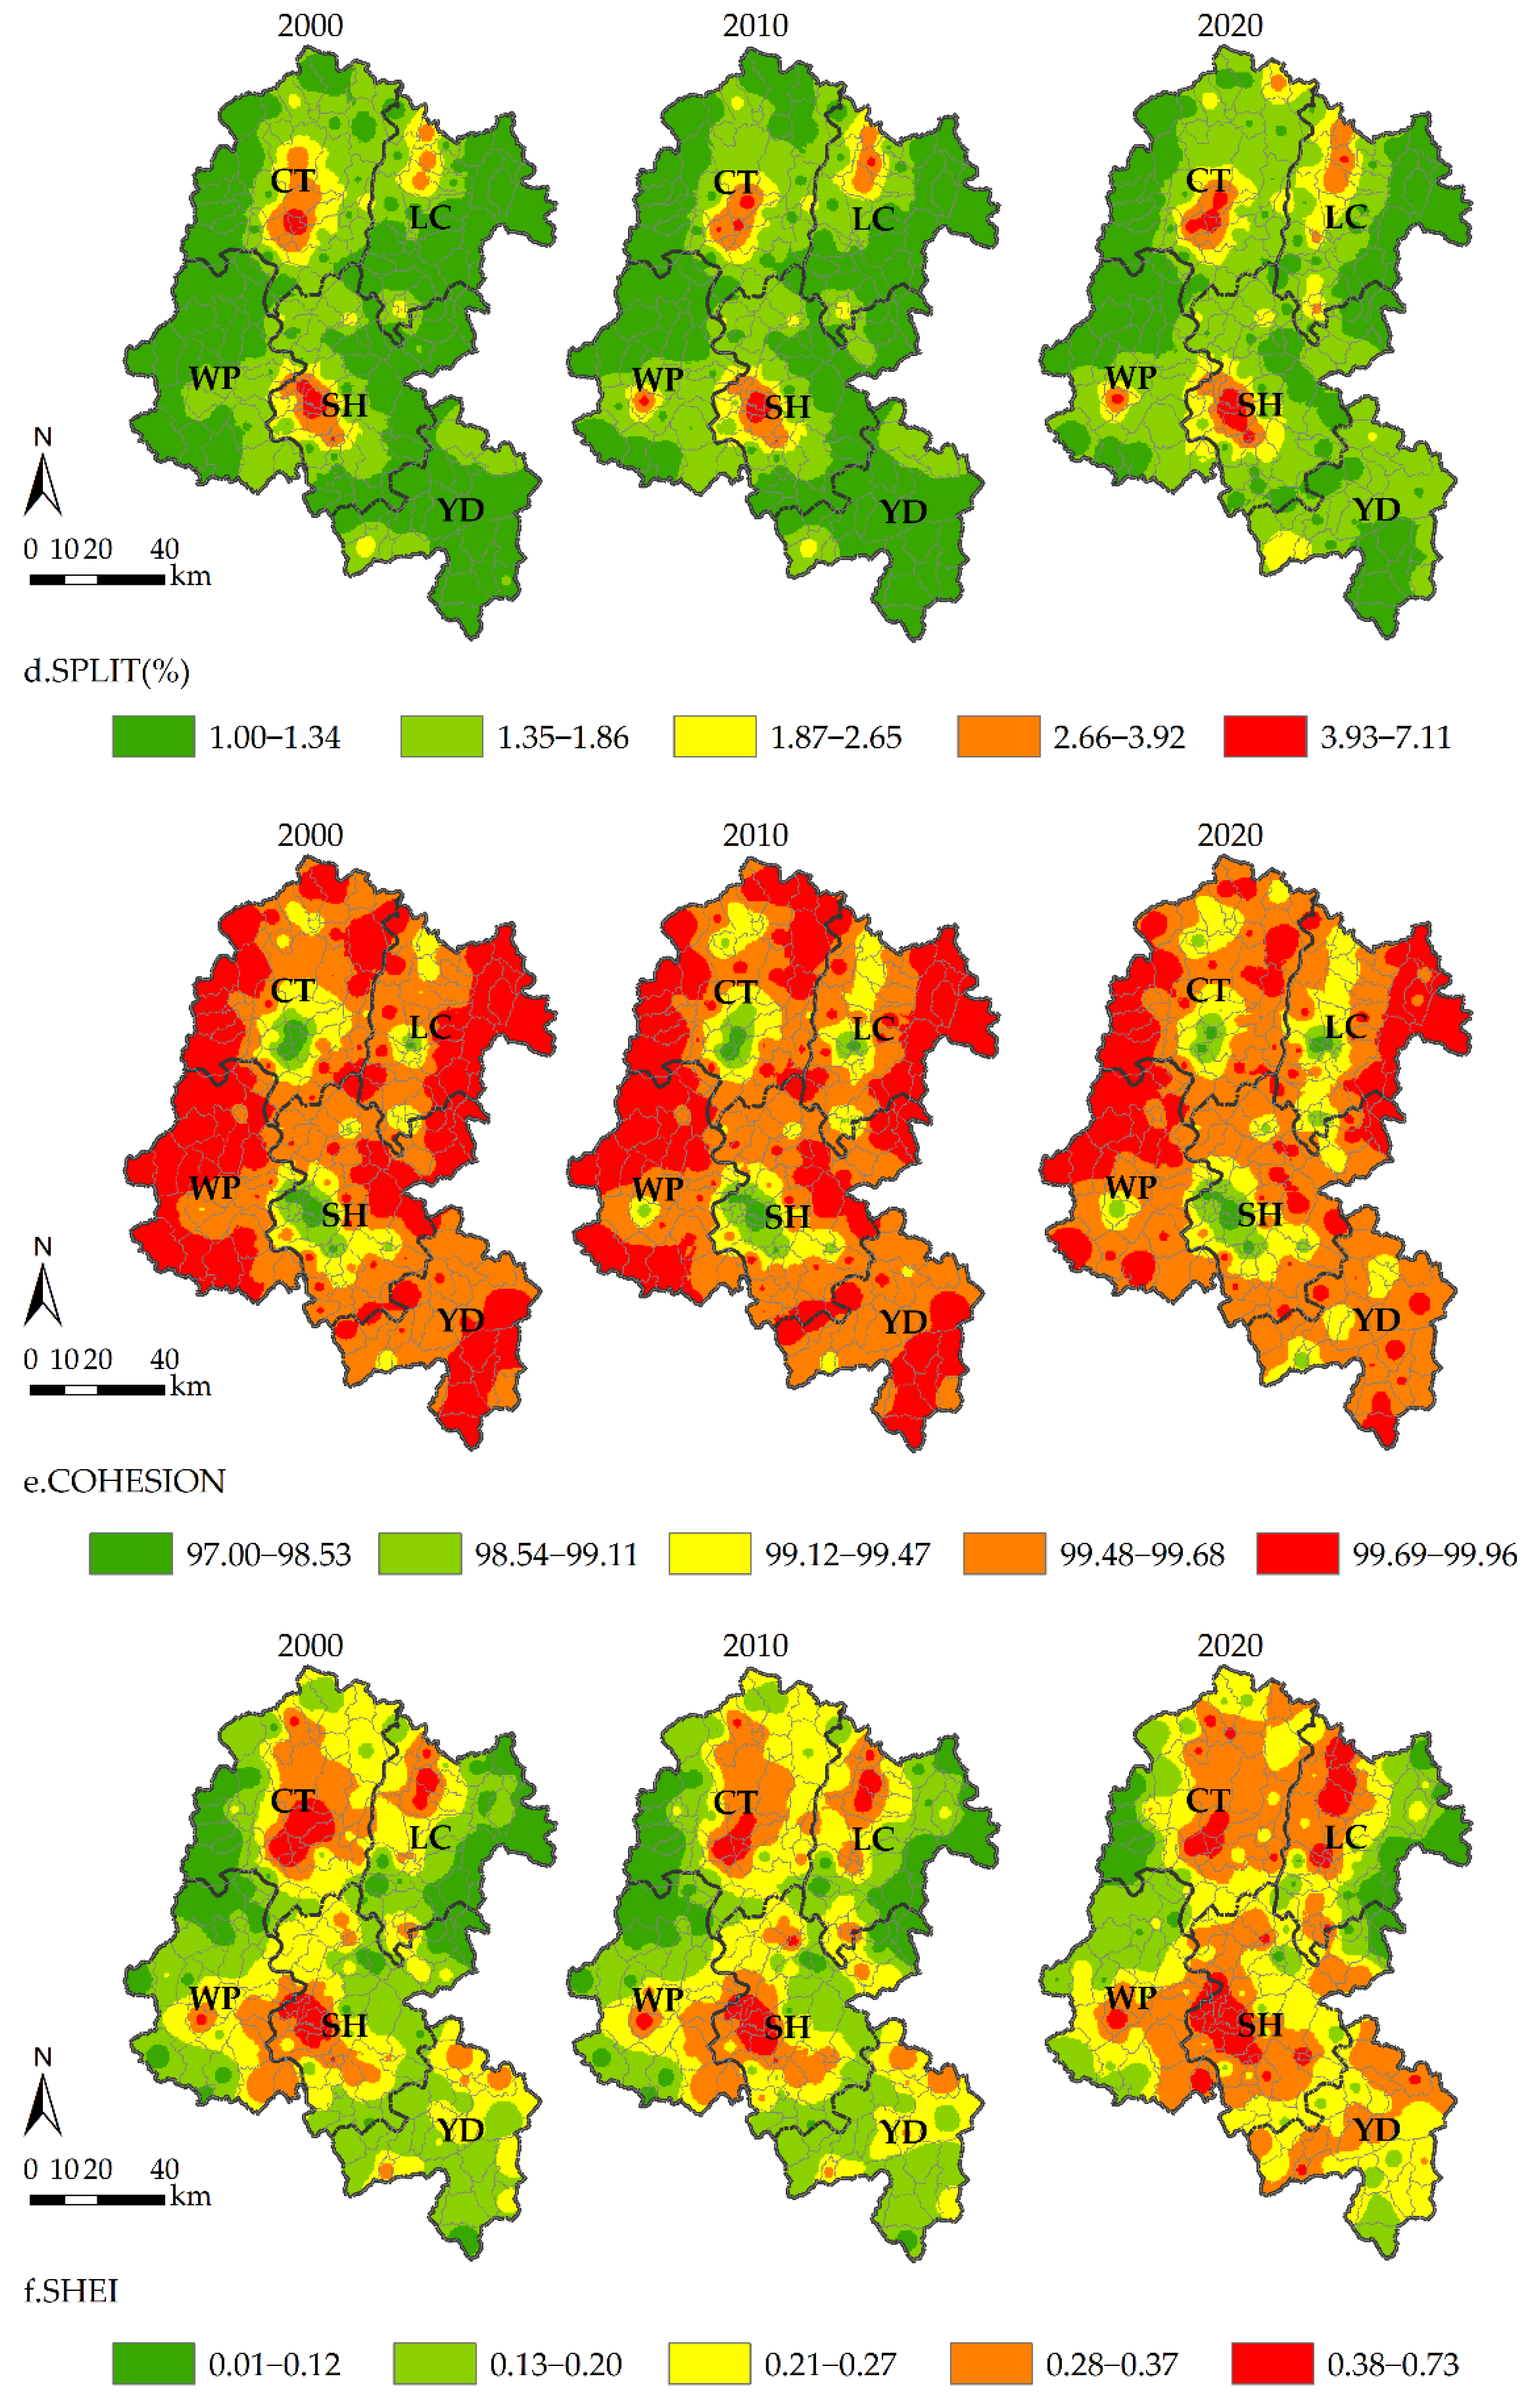
4.2. Characteristics of Spatial and Temporal Changes in Watershed Landscape Patterns

The six landscape indices (PD, LSI, AREA_MN, SPLIT, COHENSION, and SHEI) showed variability in the changes of spatial distribution characteristics during 2000–2020 (Figure 6). For PD, from 2000 to 2010, the increased high value areas were distributed in the western part of Shanghang and Liancheng County, indicating that the landscape heterogeneity and fragmentation increased in this region. From 2010 to 2020, the increased high-value areas of the PD index were distributed in Shanghang County, Wuping County, the western part of Liancheng County, and Yongding County, indicating increased fragmentation of the landscape in this region, while the increase in the low-value areas was distributed in the southern part of Changting County, indicating increased connectivity of the region.
For LSI, from 2000 to 2010, the high value areas were distributed in the southern part of Changting County and the western part of Shanghang County. From 2010 to 2020, the high value areas of LSI were distributed in the southeastern part of Changting County, and the high value areas were distributed in the western part of Shanghang County and Liancheng County, indicating that the dispersion of patches decreased in Changting County and tended to increase in Shanghang and Liancheng Counties during this decade. The complexity of the landscape increased, as did the degree of dispersion.
For AREA_MN, the high-value areas were distributed on both sides of the watershed; from 2000 to 2010, the increased high-value areas were distributed in Shanghang County, characterizing the increased fragmentation in this area. From 2010 to 2020, the increased low-value areas of AREA_MN were distributed on the border between Shanghang and Liancheng Counties, characterizing the increased fragmentation in this part of the landscape.
For SPLIT, from 2000 to 2010, the increased high value areas were distributed in the western part of Shanghang County and the northern part of Liancheng County, indicating increased spatial complexity of the landscape in the region. From 2010 to 2020, the high value areas of SPLIT were distributed at the junction of Shanghang and Liancheng Counties and the northern part of Yongding District, indicating increased spatial complexity in the region.
For COHESION, the high value areas were distributed on both sides of the watershed; from 2000 to 2010, the increased high-value areas were distributed in the south of Changting County, and the decreased high-value areas were distributed in the west of Liancheng County, indicating the dispersion of patches in the south of Changting County decreased and the dispersion of patches in Liancheng County increased. From 2010 to 2020, the increased high-value areas of the COHESION were distributed in Changting County, and the decreased high-value areas were distributed in the west of Liancheng County. The decreased areas are distributed in the western part of Liancheng County, the western part of Yongding County, and Wuping County.
For SHEI, the high-value areas were distributed in the main flowing area of the watershed; from 2000 to 2010, the increased high-value areas were distributed in the southern part of Shanghang County, the western part of Liancheng County, and the central part of Wuping County, indicating that the dominance of this part of the landscape decreased and the patch types tended to be homogenized. From 2010 to 2020, the increased high-value areas of SHEI were distributed in the western parts of Liancheng and Shanghang Counties and the northern part of Yongding District, indicating that the landscape types in this area tended to be homogeneous.
In summary, combining the trends of land use types and changes in landscape pattern indices from 2000 to 2020, the degree of patch dispersion and homogeneity in Changting County decreased and landscape fragmentation weakened, while landscape heterogeneity increased and landscape homogeneity was enhanced in Shanghang, Liancheng and Yongding Counties. The transformation of land types within the Tingjiang Watershed was manifested in the following aspects: There was an increase in impervious surface of 90.7 km². The grassland decreased by a total of 9.58 km². Cropland showed a decreasing trend followed by an increasing trend, with an overall increase of 215.09 km². Shrubland showed a decreasing trend, decreasing by 1.14 km² in total. Forest first increased by 38.78 km² and then decreased by 300.90 km². Bare land showed an increasing trend, with an overall increase of 0.21 km². Water bodies showed an increase and then a decrease, with an overall increase of 6.29 km² (Figure 7, Table 3). The growth of bare land in the study area was likely the result of anthropogenic disturbance of forested land such as clear-cutting operations or the result of long periods of abandonment of cultivated land. Among the counties with obvious changes in landscape pattern indices, Changting County, a typical mountainous county with “eight mountains and one water and one field”, has serious soil erosion problems [62]. Soil erosion in Changting County was very serious before 2000. The county government has vigorously promoted the return of cultivated land to forests and the implementation of policies closely related to soil and water management; thus, the forest area increased and the cultivated land area decreased from 2000 to 2010, and so the soil erosion problem was alleviated in this period. However, in the past two decades, the urbanization rate has almost doubled with rapid economic growth, for example, from 18.45 to 51.47% in Shanghang County and 28.93 to 49.72% in Liancheng County. As a result, the connectivity between patches in the Tingjiang Watershed has decreased significantly, the landscape type tends to be homogeneous, and the landscape shape and spatial complexity have increased.

4.3. Spatial Correlation between Soil Conservation and Landscape Index at Sub-Watershed Scale

4.3.1. Global Autocorrelation Analysis

The global spatial autocorrelation between soil conservation and each landscape pattern index in 167 sub-watersheds in the Tingjiang Watershed in 2000, 2010, and 2020 was analyzed in GeoDA software. The results indicate that the landscape indices for all three years showed significant spatial correlations with soil conservation. Meanwhile, the absolute value of Moran’s index tended to decrease first and then increase (passing the significance test of p ≤ 0.05), indicating that the influence of landscape pattern changes on soil conservation gradually became stronger. From the trend of Moran index changes in the three periods from 2000 to 2020 (Table 4), soil conservation showed a significant negative correlation with the landscape indices (PD, LSI, SPLIT, and SHEI), indicating that the higher the patch fragmentation, boundary complexity, dispersion, and uniformity of the landscape in the sub-watershed, the lower the soil conservation. In addition, soil conservation showed a positive spatial correlation with AREA_MN and COHESON, indicating that the higher the connectivity of dominant patches in the sub-watershed, the higher the soil conservation. Therefore, sub-watersheds with high soil conservation correspond to landscape pattern characteristics such as low patch fragmentation and low landscape dispersion.

4.3.2. Local Spatial Autocorrelation Analysis

The spatial aggregation characteristics between four landscape indices (PD, LSI, SPLIT, and SHEI) and soil conservation were largely similar. They mainly show aggregation patterns of low–high (LH, characterized as the aggregation of the high value area of soil conservation with the low value area of the landscape indices) and high–low (HL, characterized as the aggregation of the low value area of soil conservation with the high value area of the landscape indices) (Figure 8). Combined with the land use distribution map, it was found that the LH aggregation areas were distributed in areas with large vegetation cover (Figure 3), such as woodlands in the eastern part of Liancheng County, where high values of soil conservation were clustered with low values of the four landscape indices. This characterizes areas with higher soil conservation as having higher landscape connectivity, shape complexity, and patch dominance, and lower fragmentation. The HL aggregation areas were distributed in the southern part of Changting County and the western part of Shanghang County, where there are higher concentrations of cultivated land and impervious surfaces. Low soil conservation areas in the region correspond to landscape pattern characteristics such as severe fragmentation, regularized boundaries, and homogenization.
In addition, the trends of spatial extent changes between four landscape indices (PD, SPLIT, LSI, and SHEI) and soil conservation aggregation were roughly similar. In Shanghang County, the change in the number of HL aggregation areas showed an increasing and then decreasing trend, indicating that the influence of the landscape indices on soil conservation was first enhanced and then weakened. In Changting County, the number of HL aggregation areas decreased and then increased, indicating that the influence of the four landscape indices on soil conservation was weakened and then strengthened.
In terms of the spatial aggregation characteristics between the two landscape indices (AREA_MN and COHESION) and soil conservation, the high–high (HH, characterized as the aggregation of the high value area of soil conservation with high value areas of landscape indices) aggregation areas were all distributed in the eastern part of Liancheng County. This characterizes low landscape heterogeneity and patchy dispersion in areas with high values of soil conservation in the region. The low–low (LL) aggregation areas were distributed in the south of Changting County and the west of Shanghang County; the proportion of LL aggregation areas of AREA_MN were large and relatively concentrated, while the proportion of LL aggregation areas of COHESION were small and scattered. This shows that the landscape fragmentation of low value areas of soil conservation in this region is large.
In addition, the trends of spatial aggregation characteristics of the two landscape indices (AREA_MN and COHESION) and soil conservation were generally similar. In Shanghang County, the number of LL aggregation areas first increased and then decreased, indicating that soil conservation within the region was enhanced and then weakened by the two landscape indices. In Changting County, the change in the number of LL aggregation areas decreased and then increased, indicating that soil conservation within the region was weakened and then enhanced by the two landscape indices. The above analysis found that the influence of all landscape indices (PD, SPLIT, LSI, SHEI, AREA_MN, and COHESION) on soil conservation in Shanghang County showed an enhancing and then a weakening trend, while the influence on Changting County showed a weakening and then an enhancing trend.

4.4. Response of Soil Conservation to Changes in Landscape Pattern Indices in Tingjiang Watershed from 2000 to 2020

The above analysis mainly explores the spatial correlations between soil conservation and specific landscape pattern indices in sub-watersheds; it ignores the effects between the different landscape indices. In view of this, a regression analysis of soil conservation and all six landscape indices (PD, LSI, AREA_MN, SPLIT, COHESION, and SHEI) was carried out from the perspective of landscape patterns using relevant spatial regression models with sub-watersheds as units. The results of constructing non-spatial linear regression models (OLS) in GeoDA software (Table 5) show that AREA_MN in 2000, 2010, and 2020 passed the significance test of 5%, and its explanation of soil conservation was 43, 44, and 46%. At the 5% level, the effect of SHEI on soil conservation showed that the significant effect changed to a non-significant effect and then became significant again. Four landscape indices (PD, LSI, COHESION, and SPLIT) were not significant in all three years, since there may have been spatial spillover effects on soil conservation between sub-watersheds. For this reason, the spatial weight matrix was added to the OLS model, and then the Lagrange multipliers (LMLAG and LMERR) with their robustness (R-LMLAG and R-LMERR), goodness-of-fit (R2), log-likelihood function value (LogL), Akaike information criterion (AIC), and Schwartz criterion (SC) were used to diagnose the results of the OLS model. Finally, more reasonable spatial regression models were selected from the spatial lag model (SLM), spatial error model (SEM), and non-spatial linear regression model (OLS).
(1)
LMLAG and LMERR can be used to identify which is more applicable, the spatial lag model or the spatial error model. If both indicators are significant, R-LMLAG and R-LMERR are further used to diagnose; if R-LMLAG is significant, the SLM model is used, and if R-LMERR is significant, the SEM model is used. The LMLAG and LMERR values for the three years are significant at the 1% level (Table 6), but R-LMLAG is insignificant for all three years (p2000 = 0.45, p2010 = 0.14, and p2020 = 0.16); thus, the SEM model is better than the SLM model at the current time. Second, if the R2 and log-likelihood function value (LogL) are larger and the AIC and SC are smaller, it means that the model was chosen appropriately [63]. The R2 values of the SEM model for 2000, 2010, and 2020 are 0.65, 0.67, and 0.65, respectively, which are significantly larger than the 0.45, 0.46, and 0.48 of the OLS model. Additionally, the AIC and SC values are lower than those of the OLS model, and the LogL values of the SEM difference model are −1990.75, −1999.29, and −1938.97, respectively. These values are all bigger than the −2018.06, −2029.41, and −1964.47 of the OLS model. In summary, the SEM model fitting results are better than the SLM and OLS models.
(2)
The analysis of the SEM model results revealed that the factors affecting soil conservation in the Tingjiang Watershed shifted over two decades (Table 7). In 2000, 2010, and 2020, soil conservation in the watershed was significantly (p ≤ 0.05) affected by AREA_MN and SHEI. Notably, soil conservation was significantly negatively correlated with SHEI and significantly positively correlated with PD and AREA_MN. The higher the accumulation of landscape heterogeneity, fragmentation, and single site class in a sub-watershed, the lower the soil conservation. In addition, the lambda values of the spatial error model were significant and positive in 2000, 2010, and 2020. This indicates that the soil conservation amount in sub-watersheds in the Tingjiang Watershed is positively correlated with the soil conservation amount in neighboring sub-watersheds. The main conclusion is that for each 1% increase in soil conservation in neighboring sub-watersheds, the soil conservation in the given sub-watershed increases by 65, 66, and 63%. In summary, the landscape indices AREA_MN, PD, and SHEI are important indicators affecting soil conservation in the Tingjiang Watershed, and there is some spatial correlation in soil conservation among the sub-watersheds in the study area.

5. Discussion

5.1. Why Soil Conservation Responds to the Evolution of Landscape Pattern Indices

Changes in landscape composition and spatial arrangements within landscape patterns can affect surface interception and nutrient storage, thus reducing soil water conservation and sand conservation as well as productivity. Li et al. and Mirghaed et al. found a high correlation between the landscape pattern index and soil conservation under land use change [64,65]. In this study, areas with higher landscape indices PD and SHEI had lower soil conservation, while areas with smaller AREA_MN had higher soil conservation. Usually, high values of PD and SHEI correspond to landscape pattern characteristics such as high heterogeneity and low patch dominance, while the high value of AREA_MN corresponds to landscape pattern characteristics such as low landscape fragmentation.
The high-value areas of soil conservation were distributed in the south and north of Changting County and the east of Liancheng County and Yongding District. These areas have high cover of forest, grassland, and shrubs and low impact of urbanization. At the same time, the uniformity and fragmentation of the landscape in these areas are low. The transformation of land use types in the central part of Shanghang County and Liancheng County shows a significant transfer of impervious surfaces and arable land and a significant transfer out of grassland, woodland, and shrubland. In addition, the impervious area in the watershed increased by 145% during the past two decades. Cropland, which is the second-largest area after forest land, increased by 19%. The urbanization process and the food required for population growth are driving a shift in land use types and increasing the risk of soil erosion [66]. Soil conservation in this area is relatively lower and corresponds to a pattern characterized by low landscape dominance and high overall heterogeneity. Therefore, the conservation of woodlands, shrublands, and grasslands is important, which is consistent with a study by Gong et al., who reported that forested landscapes play an important role in soil conservation in mountainous watersheds [67].

5.2. Significance of This Study and Application Strategy of Soil Conservation Measures

The soil conservation problems in Changting County have greatly improved since soil and water management was improved in 2000 [68,69]. This is due to the implementation of ecological projects such as reforestation projects; soil and water conservation and the socio-economics of the region have developed a positive trend [70]. Therefore, it becomes particularly important to investigate the response mechanism of soil conservation under the changing landscape pattern of the Tingjiang Watershed. According to the user manual of the SDR module, soil conservation is mainly influenced by factors such as rainfall, topography, soil, and land use type. Among these factors, rainfall and land use type are the ones that vary significantly, and their changes largely affect soil conservation. As an important component of hydro-ecology, the vegetation canopy of a forest can intercept rainwater and thus reduce soil erosion caused by the kinetic energy of rainfall. In addition, its well-developed roots have strong soil and sand conservation functions. In terms of land use type transformation in the watershed (Table 3), the total area of forested land shrank by 2.6%. This change pattern is similar to the change pattern of soil conservation per unit area, which increased and then decreased. Therefore, soil erosion in the watershed can be reduced by increasing the area of forested land.
Combining the annual rainfall data for the three periods with the soil conservation per unit area data (Figure 9) shows that the higher the annual rainfall of the region, the higher the soil conservation per unit area. In addition, the high–low (HL) aggregation areas of the landscape pattern index and soil conservation were distributed in Shanghang and Changting Counties. These areas correspond to high landscape fragmentation, uniformity, heterogeneity, and low soil conservation. Human activities are among the main reasons for the intensification of landscape fragmentation. Shanghang County, which includes the largest gold-producing mining site in China, has a series of problems, such as sewage seepage and improper preservation of industrial solid waste. Therefore, environmental testing and management of the mine site need to be strengthened [13].
In summary, when managing degraded and severely eroded areas, the feasibility, scientificity, and sustainability of the means of management should be considered. For example, mountain tea and fruit gardens [71], which can effectively reduce soil erosion, need to be constructed in a scientific manner appropriate to the location and with improved farming methods, such as compound management models and no-till methods [72,73]. At the same time, it is also necessary to strengthen the protection of woodlands, grasslands, and shrublands, to strictly develop and implement management mechanisms for deforestation, and to put in place policies such as returning farmland to forests.

5.3. Model Comparison, Application, and Future Goals

The universal soil loss equation (USLE), RUSLE, and InVEST models are common methods in soil conservation research. Chen et al. used the USLE model to investigate the degree of soil erosion in ecologically green heart areas of urban clusters [74]. Song et al. used the USLE model to discuss soil conservation effects under different landscape pattern characteristics [75]. He et al. used the RUSLE model to quantitatively assess the soil erosion rate in the karst region of southwest China [76]. In addition, the SDR module in the InVEST model quantifies the sediment conservation rate compared to the USLE and RUSLE models, and Zhai et al. found that the InVEST model was more applicable to the Yanhe River watershed than the RUSLE model [77]. Matomela et al. investigated the spatial and temporal variation of soil erosion under different land use types using the InVEST model [78]. In this study, the spatial correlation between landscape patterns and soil conservation under long time series variation was investigated using the SDR model with sub-watershed units. Due to the complexity of the natural environment and the availability of data, the accuracy of the data source of the SDR module and the rationality of the selection of landscape indicators should to be explored in future studies. In this study, by comparing the multi-year average sediment export from the model output with the multi-year average sand transport, it was found that the two data differ by 5%. The multi-year average sand transport is from the announcement “Environmental Impact Report for the Tailings Reservoir Project in Yu Tian Keng of Zijinshan Gold and Copper Mine of Zijinshan Mining Group Corporation (Public Version)” released by the official website of Shanghang County Government in 2021. The report showed that the multi-year average sand transport in the Tingjiang Watershed was 1.37 million t. The sediment export in our study was 1.015 million t in 2000, 1.3518 million t in 2010, and 1.545 million t in 2020, with an average annual sand transport of 1.2995 million. It is likely to be influenced by the data with time effect, such as for precipitation and vegetation cover. Wang et al., in their study of red soil erosion areas in southern China, found a strong correlation between precipitation and soil retention. This is similar to the results of this study, where the rainfall in 2020 (17% below the normal level) corresponds to lower soil retention [79].
Second, the spatial weights used in this paper are the adjacency criteria, and the influence on the results should be considered when applying other spatial weight matrices such as distance weights. Other factors, such as topographic, climatic, and socio-economic factors, will be included in future studies. In the meantime, the evaluation method has to take into account how different sizes of the landscape pattern relate to soil conservation. Therefore, a future study may analyze the geographical correlations between soil conservation and landscape indices at various landscape scales, as well as the correlations among various weights, by adding representative indicators.

6. Conclusions

Due to the influence of natural factors and human activities, the landscape components within the Tingjiang Watershed have changed significantly, causing a non-negligible impact on the watershed ecosystem. In this study, the spatial and temporal change characteristics of the landscape pattern indices and soil conservation and the spatial relationship between them were analyzed using land use maps from 2000 to 2020, and the results are as follows:
(1)
From 2000 to 2020, the total soil conservation decreased by 4.15 × 10⁸ t. Spatially, soil conservation in the Tingjiang Watershed showed an upward and then a downward trend in the north, a downward trend in the south, and the most obvious downward trend in the southeast and the northeast. The change trend may have been influenced by topographical factors and soil texture.
(2)
The overall landscape pattern of the watershed shows increased fragmentation, mainly manifested by decreased patch dispersion and homogeneity in Changting County and increased landscape heterogeneity and homogeneity in Shanghang, Liancheng, and Yongding Counties.
(3)
Soil conservation was negatively spatially correlated with four landscape indices (PD, SPLIT, SHEI, and LSI) and spatially positively correlated with two landscape indices (AREA_MN and COHESON). In addition, sub-watersheds with lower soil conservation showed the characteristics of high landscape fragmentation, high landscape dispersion, high patch type richness, and high boundary complexity, mainly distributed in the southern part of the watershed. Sub-watersheds with higher soil conservation were characterized by low patch fragmentation and strong connectivity of dominant patches, mainly located in the northern part of the watershed.
(4)
The spatial error model (SEM) fits better for 2000, 2010, and 2020 than the spatial lag model (SLM) and least squares regression (OLS). There is a significant spatial spillover effect on soil conservation. The diagnostic results of the SEM model show that PD, SHEI, and AREA_MN are the main influencing factors among the six landscape indices, all of which affected soil conservation in the watershed to different degrees.

Author Contributions

Conceptualization, X.L.; Methodology, X.X.; Software, X.W.; Formal analysis, H.L. and Z.S.; Investigation, Z.W. and X.H.; Writing—original draft, X.X.; Visualization, H.X.; Supervision, X.L.; Funding acquisition, X.L. All authors have read and agreed to the published version of the manuscript.

Funding

This study was supported by the National Natural Science Foundation of China (32071578) and the Science and Technology Innovation Project of Fujian Province (KY-090000-04-2021-012) and Subject Cross-Integration Project of College of Landscape Architecture, Fujian Agriculture and Forestry University (No. YSYL-xkjc-2).

Institutional Review Board Statement

Not applicable.

Informed Consent Statement

Not applicable.

Data Availability Statement

Not applicable.

Conflicts of Interest

The authors declare no conflict of interest.

References

  1. Fu, B.J.; Liang, D.; Lu, N. Landscape Ecology: Coupling of Pattern, Process, and Scale. Chin. Geogr. Sci. 2011, 21, 385–391. [Google Scholar] [CrossRef]
  2. Wiens, J. Riverine landscapes: Taking landscape ecology into the water. Freshw. Biol. 2002, 47, 501–515. [Google Scholar] [CrossRef]
  3. Tagil, S.; Gormus, S.; Cengiz, S. The Relationship of Urban Expansion, Landscape Patterns and Ecological Processes in Denizli, Turkey. J. Indian. Soc. Remote Sens. 2018, 46, 1285–1296. [Google Scholar] [CrossRef]
  4. Li, H.B.; Wu, J.G. Use and misuse of landscape indices. Landscape Ecol. 2004, 19, 389–399. [Google Scholar] [CrossRef] [Green Version]
  5. Dong, J.H.; Dai, W.T.; Shao, G.Q.; Xu, S.J. Ecological Network Construction Based on Minimum Cumulative Resistance for the City of Nanjing, China. ISPRS. Int. J. Geo-Inform. 2015, 4, 2045–2060. [Google Scholar] [CrossRef] [Green Version]
  6. Zhang, X.M.; Du, H.M.; Wang, Y.; Chen, Y.; Ma, L.; Dong, T.X. Watershed landscape ecological risk assessment and landscape pattern optimization: Take Fujiang River Basin as an example. HERA 2021, 27, 2254–2276. [Google Scholar] [CrossRef]
  7. Lu, S.Z. The Design of Urban Green Space Based on the Landscape Pattern Optimization. In Proceedings of the 2010 ASME International Conference on Optimization Design (ICOD 2010), Wuhan, China, 18–20 March 2010; pp. 376–379. [Google Scholar]
  8. Zhao, Q.; Wen, Z.; Chen, S.; Ding, S.; Zhang, M. Quantifying land use/land cover and landscape pattern changes and impacts on ecosystem services. Int. J. Environ. Res. Public Health 2020, 17, 126. [Google Scholar] [CrossRef] [Green Version]
  9. Yin, C.Y.; Zhao, W.W.; Pereira, P.L. Soil conservation service underpins sustainable development goals. Glob. Ecol. Conserv. 2022, 33, 967–977. [Google Scholar] [CrossRef]
  10. Rao, E.M.; Xiao, Y. Spatial characteristics and effects of soil conservation service in Sichuan Province. Acta. Ecologica. Sinica 2018, 38, 8741–8749. [Google Scholar]
  11. Juan, A.J.; Elvira, D.P.; Joris, D.V. Eco-Holistic Soil Conservation to support Land Degradation Neutrality and the Sustainable Development Goals. Catena 2021, 196, 104823. [Google Scholar]
  12. Duan, X.; Rong, L.; Bai, Z.; Gu, Z.; Ding, J.; Tao, Y.; Li, J.; Li, J.; Wang, W.; Yin, X. Effects of soil conservation measures on soil erosion in the Yunnan Plateau, southwest China. J. Soil Water Conserv. 2020, 75, 131–142. [Google Scholar] [CrossRef]
  13. Cao, J.; Xie, C.Y.; Hou, Z.R. Transport patterns and numerical simulation of heavy metal pollutants in soils of lead-zinc ore mines. J. Mat. Sci. 2021, 18, 2345–2356. [Google Scholar] [CrossRef]
  14. Rahman, M.R.; Shi, Z.H.; Cai, C.F. Soil erosion hazard evaluation-An integrated use of remote sensing, GIS and statistical approaches with biophysical parameters towards management strategies. Ecol. Modell. 2009, 220, 1724–1734. [Google Scholar] [CrossRef]
  15. Quine, T.A.; Van Oost, K. Insights into the future of soil erosion. Proc. Natl. Acad. Sci. USA 2020, 117, 23205–23207. [Google Scholar] [CrossRef] [PubMed]
  16. Jha, M.K. Impacts of landscape changes on water resources. Water 2020, 12, 10–15. [Google Scholar] [CrossRef]
  17. Li, Q.; Zhou, Y.; Wang, L.; Zuo, Q.; Yi, S.Q.; Liu, J.Y.; Su, X.P.; Xu, T.; Jiang, Y. The Link between Landscape Characteristics and Soil Losses Rates over a Range of Spatiotemporal Scales: Hubei Province, China. Int. J. Env. Res. Public Health 2021, 18, 11044. [Google Scholar] [CrossRef]
  18. Senanayake, S.; Pradhan, B.; Huete, A.; Brennan, J. A Review on Assessing and Mapping Soil Erosion Hazard Using Geo-Informatics Technology for Farming System Management. Remote Sens. 2020, 12, 4063. [Google Scholar] [CrossRef]
  19. Svorin, J. A test of three soil erosion models incorporated into a geographical information system. Hydrol. Process. 2003, 17, 967–977. [Google Scholar] [CrossRef]
  20. Sterk, G. A hillslope version of the revised Morgan, Morgan and Finney water erosion model. Int. Soil. Water. Conserv. Res. 2021, 9, 319–332. [Google Scholar] [CrossRef]
  21. Safwan, M.; Alaa, K.; Omran, A.; Quoc, B.P.; Nguyen, T.T.L.; Van, N.T.; Duong, T.A.; Endre, H. Predicting soil erosion hazard in Lattakia Governorate (W Syria). Int. J. Sediment. Res. 2021, 36, 207–220. [Google Scholar] [CrossRef]
  22. Lajili-Ghezal, L. Estimation of sediment yield in a Tunisian semi-arid zone with the help of a soil water erosion model on a plane (PLAG). Hydrolog. Sci. J. 2007, 52, 1285–1297. [Google Scholar] [CrossRef]
  23. Pandey, S.; Kumar, P.; Zlatic, M.; Nautiyal, R.; Panwar, V.P. Recent advances in assessment of soil erosion vulnerability in a watershed. Int. Soil. Water. Conserv. Res. 2021, 9, 305–318. [Google Scholar] [CrossRef]
  24. Halecki, W.; Kruk, E.; Ryczek, M. Loss of topsoil and soil erosion by water in agricultural areas: A multi-criteria approach for various land use scenarios in the Western Carpathians using a SWAT model. Land Use Policy 2018, 73, 363–372. [Google Scholar] [CrossRef]
  25. Pang, G.W.; Yao, Z.; Xie, H.X.; Yang, Q.K.; Li, R.; Xie, M.L. Soil erosion dynamic changes and its impact factors in Zhifanggou watershed of the Loess Plateau, China. J. Food Agric. Environ. 2013, 11, 822–831. [Google Scholar]
  26. Rao, E.M.; Ouyang, Z.Y.; Yu, X.X.; Xiao, Y. Spatial patterns and impacts of soil conservation service in China. Geomorphology 2014, 207, 64–70. [Google Scholar] [CrossRef]
  27. Bouguerra, S.; Jebari, S.; Tarhouni, J. Spatiotemporal analysis of landscape patterns and its effect on soil loss in the Rmel river basin, Tunisia. Soil Water Res. 2021, 16, 39–49. [Google Scholar] [CrossRef]
  28. Chen, S.F.; Liu, W.; Bai, Y.H.; Luo, X.Y.; Li, H.F.; Zha, X. Evaluation of watershed soil erosion hazard using combination weight and GIS: A case study from eroded soil in Southern China. Nat. Hazards. 2021, 109, 1603–1628. [Google Scholar] [CrossRef]
  29. Ji, J.Y.; Zhao, Y.G.; Zhang, W.T.; Gu, K.M.; Li, W. Quantitative assessment of biocrust distribution patterns using landscape indices benefits the study of their soil conservation functions. Geoderma 2023, 429, 116257. [Google Scholar] [CrossRef]
  30. Luo, H.; Hu, X.N.; Xie, Y.S.; Wang, J.J.; Guo, M.C. Constructions of an evaluation framework for soil and water conservation techniques. Catena 2020, 186, 104378. [Google Scholar] [CrossRef]
  31. An, Y.M.; Zhao, W.W.; Li, C.J.; Ferreira, C.S.S. Temporal changes on soil conservation services in large basins across the world. Catena 2022, 209, 105793. [Google Scholar] [CrossRef]
  32. Xin, Y.; Wang, X.K.; Xie, X.Q.; Wang, Z.F.; Lin, H.; Liu, Y.; Xie, H.L.; Liu, X.Z. Construction and Optimization of an Ecological Security Pattern Based on the MCR Model: A Case Study of the Minjiang River Basin in Eastern China. Int. J. Env. Res. Public Health 2022, 19, 8370. [Google Scholar]
  33. Pierik, M.E.; Dell’ Acqua, M.; Confalonieri, R.; Bocchi, S.; Gomarasca, S. Designing ecological corridors in a fragmented landscape: A fuzzy approach to circuit connectivity analysis. Ecol. Indic. 2016, 67, 807–820. [Google Scholar] [CrossRef]
  34. Chen, J.; Li, Z.W.; Xiao, H.B.; Ning, K.; Tang, C.J. Effects of land use and land cover on soil erosion control in southern China: Implications from a systematic quantitative review. J. Environ. Manag. 2021, 28, 111924. [Google Scholar] [CrossRef] [PubMed]
  35. Sourn, T.; Pok, S.; Chou, P.; Nut, N.; Theng, D.; Prasad, P.V.V. Assessment of Land Use and Land Cover Changes on Soil Erosion Using Remote Sensing, GIS and RUSLE Model: A Case Study of Battambang Province, Cambodia. Sustainability 2022, 14, 4066. [Google Scholar] [CrossRef]
  36. Xu, Q.S.; Wang, J.M.; Shi, W.T. Influence of Landscape Pattern Changes in Large-scale Open-pit Coal Mining Area on Soil Erosion: A Case Study on Pingshuo Mining Area in Shanxi Province. China Land Sci. 2022, 36, 96–106. [Google Scholar]
  37. Liu, J.; Liu, X.; Wang, Y.; Li, Y.; Jiang, Y.; Fu, Y.; Wu, J. Landscape composition or configuration: Which contributes more to catchment hydrological flows and variations? Landscape Ecol. 2020, 35, 1531–1551. [Google Scholar] [CrossRef]
  38. Yohannes, H.; Soromessa, T.; Argaw, M.; Dewan, A. Impact of landscape pattern changes on hydrological ecosystem services in the Beressa watershed of the Blue Nile Watershed in Ethiopia. Sci. Total. Environ. 2021, 793, 148559. [Google Scholar] [CrossRef]
  39. Zhu, Z.J.; Yang, Z.B.; Liu, B.J. Analysis of Spatio-temporal Evolution of Land Use and Landscape Patternin Liuxi River Basin Driven by Rapid Urbanization. Pearl River 2020, 41, 11–18, 31. [Google Scholar]
  40. Wang, Z.Y.; Yu, Q.R.; Guo, L. Quantifying the Impact of the Grain-for-Green Program on Ecosystem Health in the Typical Agro-Pastoral Ecotone: A Case Study in the Xilin Gol League, Inner Mongolia. Int. J. Env. Res. Public Health. 2020, 17, 5631. [Google Scholar] [CrossRef]
  41. Dang, H.; Ge, L.J.; Zhao, C.Y.; Qi, J.Y.; Zhao, Y.H. Soil conservation function of Chenggou River Basin based on the InVEST model. J. Lanzhou Univ. (Nat. Sci. Educ.) 2018, 54, 633–639. [Google Scholar]
  42. Wang, H.L. Characteristics of water discharge and sediment load variability of Tingjiang River by wavelet analysis. J. Sediment. Res. 2012, 02, 61–67. [Google Scholar]
  43. Wang, Z.P.; Wang, X.Q.; Lin, J.L.; Chen, S.M. Evolution of Runoff and Sediment Load in Changting Segment of Tingjiang River Watershed from 1998 to 2014. J. Yangtze River Sci. Res. Inst. 2018, 35, 8–12+50. [Google Scholar]
  44. Chen, Z.Q. Desertification Induced by water erosion and its combat of Hetian town in Changding county, Fujian province. Prog. Phys. Geogr. 1998, 02, 67–72. [Google Scholar]
  45. Huanf, T.; Yu, D.Y.; Qiao, J.M.; Hao, R.F. Landscape pattern change and soil conservation in Xilingol League, Inner Mongolia. Resour Sci. 2018, 40, 1256–1266. [Google Scholar]
  46. Yang, J.; Huang, X. The 30 m annual land cover dataset and its dynamics in China from1990 to 2019. Earth Syst. Sci. Data 2021, 13, 3907–3925. [Google Scholar] [CrossRef]
  47. Yang, J.L.; Dong, J.W.; Xiao, X.M.; Dai, J.H.; Wu, C.Y.; Xia, J.Y.; Zhao, G.S.; Zhao, M.M.; Li, Z.L.; Zhang, Y.; et al. Divergent shifts in peak photosynthesis timing of temperate and alpine grasslands in China. Remote Sens. Environ. 2019, 233, 111395. [Google Scholar] [CrossRef]
  48. Wieder, W.R.; Boehnert, J.; Bonan, G.B.; Langseth, M. Regridded Harmonized World Soil Database v1.2; Oak Ridge National Laboratory Distributed Active Archive Center: Oak Ridge, TN, USA, 2014. [Google Scholar]
  49. Meng, X.; Wang, H. Soil Map Based Harmonized World Soil Database (v1.2); National Tibetan Plateau Data Center: Beijing, China, 2018. [Google Scholar]
  50. Li, J.; Zhou, J.X. Coupled analysis on landscape pattern and hydrological processes in Yanhe watershed of China. Sci. Total. Environ. 2015, 505, 927–938. [Google Scholar] [CrossRef]
  51. Zhao, X.Y.; Wang, J.F.; Li, Q.; Li, W. The function of soil conservation in Beisan River Basin based on InVEST model. J. Shihezi Univ. (Nat. Sci. Educ.) 2022, 40, 1–10. [Google Scholar]
  52. Chen, Z.; Fu, W.C.; Huang, Y.L.; Que, C.X.; Zheng, Q.Q.; Dong, J.W. On Landuse Landscape Pattern Change and Driving Forces in Fuzhou. J. South Chin. Norm. Univ. Nat. Sci. Ed. 2020, 45, 99–107. [Google Scholar]
  53. Wan, L.H.; Wang, S.W.; Chen, X.H. GeoDA-based spatial correlation analysis of GDP in Hadaqi industrial corridor. Geogr. Res. 2011, 30, 977–984. [Google Scholar]
  54. Fan, C.; Myint, S. A comparison of spatial autocorrelation indices and landscape metrics in measuring urban landscape fragmentation. Landsc. Urban Plan. 2014, 121, 117–128. [Google Scholar] [CrossRef]
  55. DeWitt, T.J. A simplified perspective on the index of spatial autocorrelation. Landscape Ecol. 2022, 37, 657–661. [Google Scholar] [CrossRef]
  56. Wang, H.R.; Zhang, M.D.; Wang, C.; Wang, K.Y.; Wang, C.; Li, Y.; Bai, X.L.; Zhou, Y.K. Spatial and Temporal Changes of Landscape Patterns and Their Effects on Ecosystem Services in the Huaihe River Basin, China. Land 2022, 11, 513. [Google Scholar] [CrossRef]
  57. Mander, U.; Uuemaa, E.; Roosaare, J.; Aunap, R.; Antrop, M. Coherence and fragmentation of landscape patterns as characterized by correlograms: A case study of Estonia. Landscape Urban Plan. 2009, 94, 31–37. [Google Scholar] [CrossRef]
  58. Wagner, H.H.; Fortin, M.J. Spatial Analysis of Landscapes: Concepts and Statistics. Ecology 2005, 86, 1975–1987. [Google Scholar] [CrossRef] [Green Version]
  59. Pearson, D.M. The application of local measures of spatial autocorrelation for describing pattern in north Australian landscapes. J. Environ. Manag. 2002, 64, 85–95. [Google Scholar] [CrossRef] [PubMed]
  60. Qi, G.Z.; Wang, Z.H.B.; Zhao, N.N. Research on spatiotemporal evolution and driving factors of population aging in the Yellow River Basi. J. Xi’an Univ. Technol. 2022, 38, 301–310. [Google Scholar]
  61. Zhang, J.X.; Liu, D.Q.; Gong, J.; Ma, X.C.; Cao, E.J. Impact of landscape fragmentation on watershed soil conservation service——A case study on Bailongjiang Watershed of Gansu. Resour. Sci. 2018, 40, 1866–1877. [Google Scholar]
  62. Suo, A.N.; Hong, J.; Lin, Y.; Ge, J.P. Relationships between soil and water loss and landscape pattern on Loess Plateau. J. Chin. Appl. Ecol. 2005, 16, 1719–1723. [Google Scholar]
  63. Lai, R.W.; Lai, M.H.; Su, Y.Q. Temporal and spatial differentiation of soil and water loss sensitivity in Changting County. J. Ecolo. Sci. 2021, 40, 116–124. [Google Scholar]
  64. Li, J.Z.; Yong, L.Q.; Yi, S.Q.; Peng, L.A. Exploring the Effects of Land Use Changes on the Landscape Pattern and Soil Erosion of Western Hubei Province from 2000 to 2020. Int. J. Env. Res. Public Health 2022, 19, 1571. [Google Scholar] [CrossRef] [PubMed]
  65. Mirghaed, F.A.; Souri, B. Effect of landscape fragmentation on soil quality and ecosystem services in land use and landform types. Environ Earth Sci. 2022, 81, 330. [Google Scholar] [CrossRef]
  66. Kemp, D.B.; Sadler, P.M.; Vanacker, V. The human impact on North American erosion, sediment transfer, and storage in a geologic context. Nat. Commun. 2020, 11, 1. [Google Scholar] [CrossRef]
  67. Gong, J.; Zhang, J.X.; Zhang, Y.X.; Zhu, Y.H.; Jin, T.T.; Xu, C.X. Do Forest Landscape Pattern Planning and Optimization Play a Role in Enhancing Soil conservation Services in Mountain Areas of Western China? Chin. Geogr. Sci. 2021, 31, 848–866. [Google Scholar] [CrossRef]
  68. Yang, C.C.H. Analysis on the Vegetation Change in Hetian Town and its Surrounding Area of Changting County by Soil Erosion Control. J. Soil Water Conserv. 2021, 33, 9–12, 26. [Google Scholar]
  69. Xu, H.Q.; He, H.; Huang, S.L. Analysis of fractional vegetation cover change and its impact on thermal environment in the Hetian basinal area of County Changting, Fujian province, China. Acta Ecol. Sin. 2013, 33, 2954–2963. [Google Scholar]
  70. Zhang, Z. Research on the evaluation of the economic and social benefits of the returned farmland forestry project based on the portfolio evaluation method--Taking 10 typical counties in southern China as an example. Probe 2013, 05, 106–110. [Google Scholar]
  71. Cui, H.W.; Wang, Z.; Yan, H.; Li, C.; Jiang, X.; Wang, L.; Liu, G.; Hu, Y.C.; Yu, S.X.; Shi, Z.H. Production-Based and Consumption-Based Accounting of Global Cropland Soil Erosion. Environ. Sci. Technol. 2022, 56, 10465–10473. [Google Scholar] [CrossRef]
  72. He, S.L.; He, X.W.; Li, F.Y.; Guo, X.J. Causes of undergrowth erosion and its control in southern red soil regions. Soil and Water Conserv. China 2017, 03, 16–19. [Google Scholar]
  73. Dai, T.Y.; Wang, L.Q.; Li, T.N.; Qiu, P.P.; Wang, J. Study on the Characteristics of Soil Erosion in the Black Soil Area of Northeast China under Natural Rainfall Conditions: The Case of Sunjiagou Small Watershed. Sustainability 2022, 14, 8284. [Google Scholar] [CrossRef]
  74. Chen, X.L.; Wen, S.H.Z.; Yang, L.L.; He, X.G.; Zhou, Q.; Xia, Y. A study on soil and water loss in ecological green heart area of Changsha Zhuzhou Xiangtan urban agglomeration based on USLE model. Bull. Soil Water Conserv. 2020, 40, 118–124. [Google Scholar]
  75. Song, S.; Wang, S.H.; Shi, M.x.; Hu, S.H.; Xu, D.W. Influence of Landscape Pattern Type on Soil Erosion. Res. Soil Water Convers. 2022, 29, 85–92. [Google Scholar]
  76. He, M.L.; Zhang, Y.S.; Gao, J.Y.; Wu, Q.L.; Li, R. Synergistic Evolution and Interaction of Soil Erosion and Rocky Desertification in Karst Area. J. Soil Water Conserv. 2022, 37, 1–11. [Google Scholar]
  77. Zhai, R.J.; Zhao, W.W.; Jia, L.Z. A comparative study of soil erosion estimation based on RUSLE, InVEST and USPED models: A case study of the Yanhe River Basin in Northern Shaanxi. Res. Agric. Mod. 2020, 41, 1059–1068. [Google Scholar]
  78. Matomela, N.; Li, T.; Ikhumhen, H.O.; Raimundo Lopes, N.D.; Meng, L. Soil erosion spatio-temporal exploration and Geodetection of driving factors using InVEST-Sediment Delivery Ratio and Geodetector models in Dongsheng, China. Geocarto. Int. 2022. [Google Scholar] [CrossRef]
  79. Wang, P.J.; Liu, Q.; Sun, H.; Lin, X.L.; Fan, S.L. Temporal and Spatial Variation of Ecosystem Service Values in Red Soil Erosion Areas in South China. TCSAE 2021, 52, 219–228. [Google Scholar]
Figure 1. Geographical location of the Tingjiang Watershed. (a) the geographical location of the study area, (b) the 167 sub-watersheds in the study area, (c) the river network and the elevation map of the Tingjiang Watershed.
Sustainability 15 01612 g001
Figure 2. The framework of this study.
Sustainability 15 01612 g002
Figure 3. Soil conservation per unit area in Tingjiang Watershed from 2000 to 2020 (t/km2).
Sustainability 15 01612 g003
Figure 4. Variation of soil conservation per unit area in Tingjiang Watershed from 2000 to 2020 (t/km2).
Sustainability 15 01612 g004
Figure 5. Soil potential erosion per unit area from 2000 to 2020 (t/km2).
Sustainability 15 01612 g005
Figure 6. Temporal and spatial variation of landscape indices in Tingjiang Watershed from 2000 to 2020: (a) PD, (b) LSI, (c) AREA_MN, (d) SPLIT, (e) COHESION, (f) SHEI.
Sustainability 15 01612 g006aSustainability 15 01612 g006b
Figure 7. Spatial distribution of land cover types in Tingjiang Watershed from 2000 to 2020.
Sustainability 15 01612 g007
Figure 8. Local spatial autocorrelation between landscape indices and soil conservation in Tingjiang Watershed from 2000 to 2020: (a) PD, (b) LSI, (c) AREA_MN, (d) SPLIT, (e) COHESION, (f) SHEI.
Sustainability 15 01612 g008
Figure 9. Average annual precipitation in Tingjiang Watershed (mm), 2000–2020.
Sustainability 15 01612 g009
Table 1. Description and unit of landscape pattern index.
IndexAbbreviation
(Unit)
Description
Patch densityPD
(km2)
Reflects characteristics of number of patches, responds to overall heterogeneity and fragmentation of landscape, and is proportional to fragmentation of patches.
Landscape shape indexLSIReflects degree of landscape heterogeneity and is directly proportional to complexity of landscape shape and fragmentation.
Mean patch areaAREA_MN
(km2)
Reflects degree of landscape fragmentation, and its trend is inversely proportional to degree of landscape fragmentation.
Patch cohesion indexCOHESIONReflects degree of aggregation of different patches and is inversely proportional to patch dispersion.
Splitting indexSPLIT
(%)
Reflects fragmentation and spatial complexity of landscape.
Shannon evenness indexSHEIInversely proportional to dominance of patches and indicates complexity of landscape. Each patch type is equally dispersed, and there is no evident dominant patch in landscape when value is close to 1; when value is close to 0, dominance is strong, and landscape is impacted by numerous dominant patch kinds.
Table 2. Variance inflation factor (VIF) of landscape indices from 2000 to 2020.
YearPDLSIAREA_MNSPLITCOHESIONSHEI
20007.225.971.616.238.695.64
20106.934.781.994.618.196.36
20207.225.971.616.238.695.64
Table 3. Dynamic variation of land cover type in Tingjiang Watershed from 2000 to 2020.
Land Cover Type2000 (km2)2010 (km2)2020 (km2)Changed Area
2000–2010 (km2)
Changed Area
2010–2020 (km2)
Changed Area
2000–2020 (km2)
Impervious62.0198.06152.0836.0554.0290.07
Grassland14.978.655.39−6.32−3.26−9.58
Cropland1128.371052.301343.46−76.07291.16215.09
Shrub3.092.921.95−0.17−0.97−1.14
Forest11,421.3111,460.0911,120.4138.78−339.68−300.91
Barren0.000.050.210.050.160.21
Water30.1537.8436.447.69−1.406.29
Table 4. Moran’s I between landscape pattern indices and soil conservation in Tingjiang Watershed from 2000 to 2020.
YearPDLSIAREA_MNSplitCohesionSHEI
2000−0.305−0.2920.276−0.2400.227−0.286
2010−0.292−0.2930.299−0.2170.212−0.265
2020−0.278−0.2820.278−0.2300.209−0.279
Table 5. Results of OLS model estimation for 2000 to 2020.
Variable200020102020
CoefficientTpCoefficientTpCoefficientTp
Constant−1,458,430.00−0.630.53−49,260.90−0.020.98365,561.000.200.84
PD−2002.96−0.490.63−4400.35−1.790.08−2042.92−1.060.29
LSI−1024.53−0.490.63−1406.48−0.590.56−2147.25−0.680.50
AREA_MN380.713.90.00523.481.180.00271.293.420.00
SPLIT7982.400.850.391379.320.160.88−2948.79−0.560.58
COHESION16,125.600.690.492035.370.080.94−2338.5−0.130.90
SHEI−127,416.00−2.010.05−54,773.30−0.750.46−92,733.9−2.140.03
R20.45 0.46 0.48
Adjusted R20.43 0.44 0.46
LogL−2018.06 −2029.41 −1964.47
AIC4050.12 4072.83 3942.94
SC4071.94 4094.65 3964.77
Table 6. Land use types in Tingjiang Watershed from 2000 to 2020.
Test200020102020
ValuepValuepValuep
Lagrange multiplier (lag)51.790.0061.070.0050.930.00
Robust LM (lag)0.580.452.160.142.030.16
Lagrange multiplier (error)62.200.0068.460.0057.550.00
Robust LM (error)10.990.009.550.008.640.00
Table 7. SEM model estimation results for 2000 to 2020.
Variable200020102020
Spatial Lag Model (SEM)Spatial Lag Model (SEM)Spatial Lag Model (SEM)
CoefficientZpCoefficientZpCoefficientZp
Lambda0.659.480.000.6610.040.000.639.070.00
Constant−447,563−0.240.81848,6600.440.66380,4410.260.79
PD−2896.10−1.820.07−4614.31−2.280.02−1888.49−1.130.26
LSI−199.87−0.120.91358.540.20.84−72.64−0.060.65
AREA_MN297.293.820.00383.2284.010.00230.963.660.00
SPLIT 9183.061.270.22001.450.290.78−1149.61−0.260.80
COHESION6012.260.330.74−6939.04−0.360.72−2545.78−0.180.86
SHEI−153,601−3.10.00−115,615−2.110.04−110,064−3.200.00
R20.65 0.67 0.65
LogL−1990.75 −1999.29 −1938.97
AIC3995.50 4012.59 3891.94
SC4017.32 4034.41 3913.77
Disclaimer/Publisher’s Note: The statements, opinions and data contained in all publications are solely those of the individual author(s) and contributor(s) and not of MDPI and/or the editor(s). MDPI and/or the editor(s) disclaim responsibility for any injury to people or property resulting from any ideas, methods, instructions or products referred to in the content.

