Abstract
This study quantitatively analyses the impacts that recent unprecedent events have had on the Saudi economy and environment using the Global Trade Analysis Project (GTAP) model. These events include: the global outbreak of COVID-19 and the associated disruption to the global supply chain, the alarming rate of climate change, and various political conflicts. These events have affected global food and energy prices. The results of this study revealed a decline in Saudi GDP, household income, purchase ability, and welfare. A trade deficit was indicated in the Saudi trade balance because of higher food prices and a reduction in two of the main Saudi exports (oil and petroleum products). A decrease in the output of most Saudi industries was shown, despite the increase in exports for most sectors. This was because of the reduction in Saudi households’ domestic consumption. Regarding the environmental impact, the Input–Output Life Cycle Assessment (IO-LCA) approach was used to estimate the total CO2 emissions of the Saudi economy. In total, approximately 740.6 million metric tons of CO2 emissions were estimated. By using a recently published specific carbon intensity for Saudi oil, total Saudi CO2 emissions were 24.59% less than the non-specific measure.
1. Introduction
The objectives of the 2030 Sustainable Development Agenda (SDA 2030) and Saudi Vision 2030 (SV 2030) intersect, directly and indirectly, in terms of multiple goals regarding raising the quality of living without compromising the pillars of sustainability (economy, environment, and society). In order to improve quality of life, SDA 2030 aims to eradicate poverty and hunger, ensure good health and well-being for the population, improve the quality of education, ensure access to clean water and sanitation, ensure access to affordable energy, create decent jobs, and improve standards of living. For SV 2030, the target is to improve quality of life through improving healthcare services, promoting healthy lifestyles, improving the cities’ liveability, diversifying opportunities for entertainment, and empowering and improving the welfare system for citizens [1,2].
In terms of environmental sustainability, SDA 2030 aims to expand the use of clean energy, improve energy efficiency, create sustainable cities and communities, ensure sustainable patterns of production and consumption, limiting climate change and its impacts, conserving marine life, managing deforestation, limiting desertification, and halting the loss of biodiversity. For SV 2030, the improvement in environmental sustainability is being pursued by reducing all types of pollution, protecting the natural landscape and marine life, the Saudi green initiatives where 450 million trees will be planted across the country by 2030, the expansion of clean energy, and the creation of multiple smart sustainable cities, e.g., Neom, The Line, and Alnama [1,2].
Toward economic sustainability, SDA 2030 aims to promote economic growth, build resilient infrastructure, support industrialization, foster innovation, and revitalize global partnerships. For SV 2030, the improvements to economic sustainability will be achieved by growing and diversifying the economy, attracting foreign investments, integrating the Saudi economy regionally and globally, and supporting innovation and entrepreneurship.
To improve social sustainability, SDA 2030 seeks to achieve gender equality by empowering women, reduce inequality within countries, and promote peaceful and inclusive societies. For SV 2030, the improvements in social sustainability are to be achieved by preparing youth for the labour market, increasing the participation of women in the labour market, enabling people with disabilities to integrate in the labour market, empowering non-profit sector, and attracting foreign talent [1,2].
The last few years have seen a number of unprecedented events that might affect the speed at which of some of these sustainability goals can be achieved. These events include: the global outbreak of COVID-19 and the associated disruption to the global supply chain, the alarming rate of climate change, and various political conflicts. For example, the Russia–Ukraine conflict has driven up the prices of staple foods, as the two countries are suppliers of approximately 30% of globally traded wheat and major exporters of corn and sunflower oil [3], which puts the security of global food supplies at risk. Climate change has affected the intensity and frequency of extreme weather events such as droughts, temperature levels, floods, and the deterioration of crop yields. For example, the frequency of droughts is 70% higher than in the preindustrial era. Furthermore, there is an estimated 3.1% to 7.4% reduction in crop yields for each degree Celsius increase in the global average temperature [4].
All these factors threaten many of Saudi Arabia’s sustainability goals. According to the United Nations, food and agriculture are associated with most SDA goals [5], which are affected by food production, food security, and the price of food. Food is a necessity, which means that consumers will buy it regardless of any change in their income or change in the prices of goods. In other words, the demand for food is inelastic, meaning it is not affected by a change in its price; when its price increases, purchasing power for other goods is affected. This negatively affects other industries, which might lead to job losses. Countries that are highly dependent on food and energy imports are the most vulnerable to the high food prices. Saudi Arabia is a highly dependent country when it comes to food, where its food imports represent 80% of the overall consumed food [6]. Additionally, the productivity of the local agriculture sector is limited [6]. On the other hand, the country is a top exporter of energy. Saudi households spend on average about 15% of their consumption expenditure on food [7]. As food is a necessity good that consumers will buy regardless of price, the share of consumption expenditure spent on food will increase with an increase in food prices, taking away from the share of other goods.
There is a lack of research on how big the impact of these recent events will be on the ambitious sustainable targets of countries, especially for a country with unique economic aspects such as Saudi Arabia. Therefore, the focus of this study is the effects of these events on Saudi Arabia. To achieve this, global food prices were modelled. The aim of this study is to project the impact of these events (COVID-19, supply chain disruption, climate change, and political conflict) on the economic and environmental conditions in Saudi Arabia. For example, what changes there have been in Saudi households’ consumption habits, how this consumption shift affects the industry structure and trade in Saudi Arabia, and whether the welfare of Saudis will rise or fall. The environmental sustainability will be examined from the perspective of CO2 emissions. These questions are answered using a well-known computable general equilibrium (CGE) model, the Global Trade Analysis Project (GTAP) model. CGE models have been proposed to analyse a variety of research questions. These include the effects on multiple variables, e.g., macroeconomic variables, industry variables, regional variables, technological variables, and policies variables [8]. The CGE model was chosen over the regression models proposed by [9,10] since it can explicitly specify the optimizing behaviour of supply and demand in a competitive market. On the other hand, the role of optimizing theories in the regression models is restricted to certain suggested variables [8]. In addition, the CGE model has the capability of generating forecasts of prospects of different economic sectors to be fed into investment plans. The impact of global price disruption on food markets and the economy caused by these factors were simulated. Energy prices were not changed as in 2011, the reference year of the database, prices were as high as have been seen recently, as shown in Figure 1. In the figure, the brent oil price [11] is used as a proxy for energy prices. The remainder of the paper is organized as follows. Section 2 presents the modelling framework, database, and the simulation scenarios. In Section 3, the economic and environmental results are presented. Finally, conclusions are drawn in Section 4.
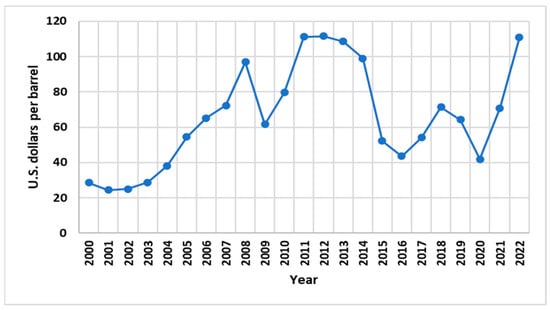
Figure 1.
Yearly brent oil price.
2. Methodology, Database, and Scenario Description
The standard multi-region applied computable general equilibrium model, GTAP, is used in this study. In the model, as shown in Figure 2, all the regional income is captured by one account, called a ‘regional household’. The sources of this income are taxes and by providing the factors of production (labour, capital, land, and natural resources) to firms. The regional household allocates this income, according to a Cobb–Douglas function, to the following three agents: private households, the government, and savings, with savings being subsequently used for investment. The optimizing behavioural equations for the three agents are described for each region. The behaviour of firms is governed by the profit maximization condition, according to a Cobb–Douglas production function. In this function, firms produce goods through combining production factors and intermediate inputs. The Cobb–Douglas function and a constant difference of elasticity function govern the demand behaviour of government and private households, respectively. For the Cobb–Douglas function, the shares of expenditure across goods are constant. For the constant difference of elasticity function, consumers’ demand for goods is affected by the change in their income; for example, consumers spend more on luxury goods when their income increases. In trade, the choice between domestic and international goods is governed by the Armington assumption [12]. More details on the GTAP model can be found in Hertel [13].
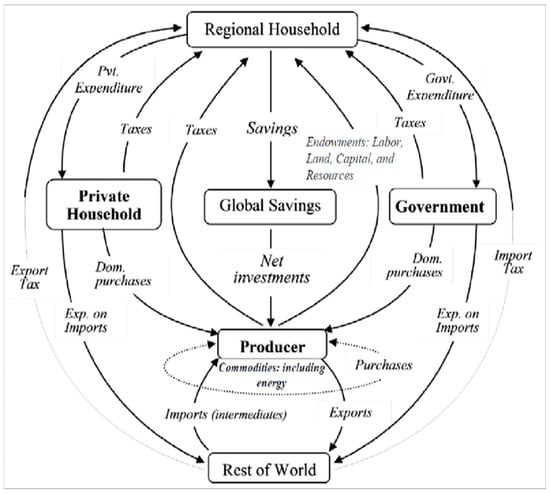
Figure 2.
Graphical representation of the standard GTAP model [13].
This study uses the GTAP 9 database, which represents a snapshot of the global economy in the year 2011 for 140 regions and 57 GTAP commodities [7]. As this study focuses on and aims to analyse the effect of recent unprecedented events on the ambitious Saudi sustainable goals, the GTAP regions were aggregated into two: Saudi Arabia and the Rest of World (ROW). In addition, the GTAP commodity sectors were aggregated into 18 sectors, according to the sectors most impacted by those events. The production factors were classified as follows: land, unskilled labour, skilled labour, capital, and natural resources. The GTAPAgg programme was used for the aggregation [14]. Table 1 presents a description of the regions, sectors, and production factors.

Table 1.
Description of the regions, sectors, and production factors used in the GTAP model.
As the effects of the events modelled in this work took place in a later year than the reference year of the database, 2011, the database needed to be updated for the year of this study, 2022. To do that, several structural macroeconomic changes had to be taken into account. In addition, new fiscal policies that have been implemented between the reference year and the year of this study were incorporated. The macroeconomic variables reflect the growth of the economy, while the fiscal policies include the VAT taxes that were imposed by the Saudi government in 2018 and raised in 2020. Several sources were used to determine the changes in macroeconomic variables. The Saudi and global population growth, change in gross domestic product (GDP), and capital growth were obtained from the World Bank data [15]. For the ROW, the skilled and unskilled labour growth figures were obtained from the human capital index reports published by the World Economic Forum [16]. For Saudi Arabia, the skilled and unskilled labour growth figures were calculated using the following method: based on the GTAP classification, the skilled and unskilled labour were classified according to their education levels [17]; the Saudi labour types were classified using the labour force education status published by the Saudi General Authority of Statistics [18]. In this method, labourers with a bachelor’s degree or higher were classified as skilled labour, while the remainder were classified as unskilled. These changes and policies were incorporated in a recursive dynamic approach as is depicted in Figure 3. The 2011–2022 period was divided into four sub-periods according to the economic changes that took place. The first sub-period (2011–2015) was simulated by implementing growth in the following macroeconomic variables: population, GDP, capital, and labour. The solution of the previous simulation (sub-period) was used as an updated database for the next simulation, using the RunGTAP software’s [19] “use updated database from last simulation” feature. The second sub-period (2015–2018) was simulated by modelling the macroeconomic variables. The third sub-period (2018–2020) was simulated by including the macroeconomic variables and the 5% VAT tax that Saudi Arabia imposed for most goods in 2018. The fourth sub-period (2020–2022) was then simulated, in which the macroeconomic variables and the new 15% VAT tax were implemented. Before simulating the effect of the recent unprecedented events on the ambitious Saudi sustainable goals, the updated database should be validated by a comparison between the resulting GDP and the actual latest GDP. The final step simulates the disruption to global food prices compared to the database reference year; the changes in the food prices were taken from different sources [20,21]. Figure 3 shows the steps followed for updating the database and the configured scenarios.
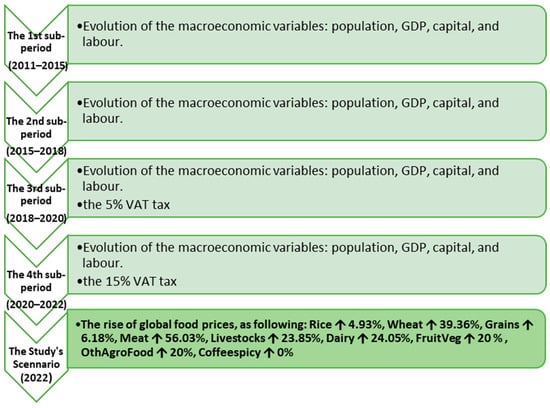
Figure 3.
The steps for updating the database and the configured scenarios.
3. Results and Discussion
Explaining the results of the computable general equilibrium model is not straightforward, as it requires understanding and bringing together different pieces of detailed information, such as databases, model equations, parameters, and simulation results. AnalyseGE, a piece of software designed to assist modellers to move between different information details [22], is used in this study to overcome this difficulty.
3.1. Economic Impacts
Table 2 shows the impacts of the scenario on different economic elements. The Saudi real GDP, which measures the value of all goods and services the economy produces after adjusting for inflation, declined by 0.39%. The nominal GDP, which does not account for inflation, decreased by 1.27%. This deterioration was caused by the reduction in household demand, as a result of the higher food prices. It is important to understand that food sectors represent approximately 15.3% of Saudi households’ budget, as shown in Figure 4. This deterioration in Saudi households’ demand for composite, domestic, and imported goods, and their prices, are shown in Figure 5 and Figure 6, respectively. A reduction in households’ demand for higher-priced food is clear. The magnitude of the reduction depends on two factors: the magnitude of the price increase, and the own-price demand elasticity. The own-price demand elasticity shows how sensitive consumers are to the price changes. The influence of the first factor can be seen in the “meat” and “dairy” sectors, while the effect of the second factor can be clearly seen in the “wheat” sector, where the reduction in consumer demand was not as high (sensitive), considering the soaring price. Observing the share of each sector in the country’s total output value and in consumption value is critical to the interpretation of the results. In addition, knowing the percentage of the domestic, exported, and imported products in these values is important to understand the significance of the results. For example, a large percentage increase/decrease of a sector with a small output share is less important than a small or medium percentage increase/decrease in a sector with a large share of the economy. The same applies to consumption, exports, and imports. Thus, the 18% reduction in the household demand for domestic rice, as shown in Figure 5, is not critical, as the domestic production of rice represents just 0.82% of the total rice production; the remaining 99.18% of household demand is for imported rice, as shown in Figure 7. Additionally, the large reduction in household demand for imported wheat (34%) affects the 28.77% imported share, while the 2.59% reduction in household domestic demand is for the 71.23% domestic share, as wheat is a major crop produced in Saudi Arabia. For the “Coffeespicy” sector, global prices were not changed in the scenario, as the 2011 prices, the year of database, were the highest this sector has reached. It is important to note that 62.07% and 37.93% of the “Coffeespicy” are domestic production and imported, respectively. Thus, the sector’s total household demand decreased very little (0.44%), even with a 4.22% increase in households’ domestic demand. This domestic rise was offset by the 6.88% decrease in households’ imported demand. For other commodities, the household demand fell for both domestic and imported goods; the reason behind this is obvious—as shown in Table 2, the Saudi household income has decreased by about 0.93%. As food commodities are necessity goods, their budget share increases because their prices rise. This led to a decrease in demand for the other commodities, even though their prices fell, as shown in Figure 5. The other commodities are less necessary based on their elasticity of income parameters.
Table 2.
The impacts of the scenario on different economic elements.
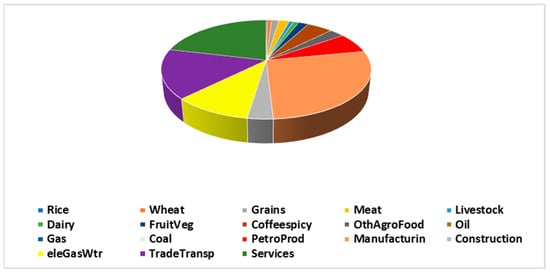
Figure 4.
Saudi households’ budget.
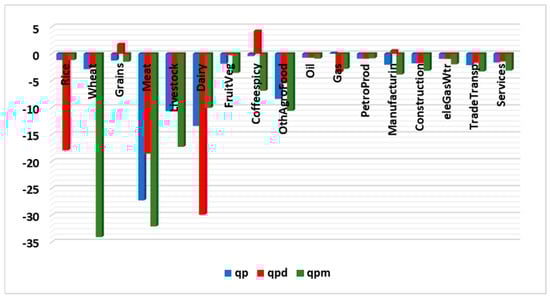
Figure 5.
Saudi households’ demand for composite, domestic, and imported goods.
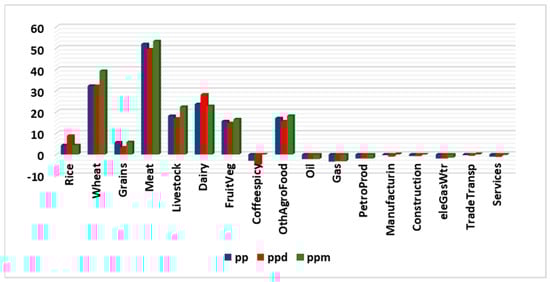
Figure 6.
Prices of composite, domestic, and imported goods for Saudi households.
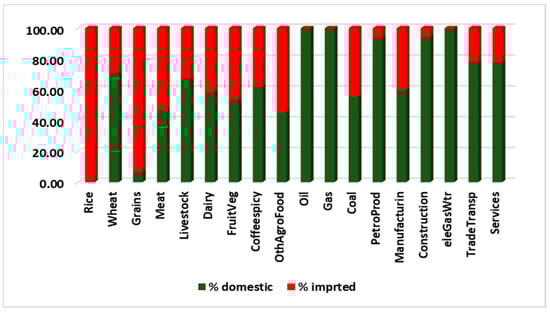
Figure 7.
The share of the domestic and imports in the sectors’ consumption.
The impact of the scenario on the output of different sectors is shown in Figure 8. The figure illustrates that higher food prices would decrease the output of most sectors. This occurs despite the clear increase in the exports of most sectors and decline in the imports of most commodities, as depicted in Figure 9 and Figure 10, respectively. As mentioned previously, it is important to note the share of each sector’s output, exports, and imports to be able to understand and interpret the results without exaggerating large percentage changes or underestimating small percentage changes. For example, as shown in Figure 8, the 18.04% decline in rice output is less important than the 2.63% reduction in the wheat sector. That is because, as shown in Figure 7, the domestic production share of rice is only 0.82% while the domestically produced share of wheat is 71.23%. In addition, the 50% increase in wheat exports, as depicted in Figure 9, is not critical, as the share of wheat exports is just 0.44% of the Saudi wheat production, as shown in Figure 11. Moreover, as a result of the reduction in the household demand for meat (shown in Figure 5), the meat output decreased by approximately 8.5% (shown in Figure 8), even with the 19.89% increase in meat exports (shown in Figure 9). That is because exported meat represents only a 9.2% share of Saudi meat production, as depicted in Figure 11. In addition, the reduction in meat demand led to a 25.22% decrease in the meat imports, as shown in Figure 10. The impact on the dairy sector is similar to the meat sector regarding the reduction in output (8.08%, shown in Figure 8) and imports (23.55%, shown in Figure 10). The dairy exports, which represent 21.06% of Saudi dairy production, decreased by 6.27%, as shown in Figure 9. For the “coffeespicy” sector, the domestic production increased by about 5.19% (shown in Figure 8) as a result of the 21.92% increase in its exports, as shown in Figure 9. The oil and PetroProd (refined petroleum products) sectors are crucial sectors for the Saudi economy, as they represent 84% of the total Saudi exports value, as shown in Figure 12. Both sector outputs decreased, by 0.26% and 0.56%, respectively, because of the reduction in their exports by 0.2% and 0.94%, respectively. Moreover, manufacturing is a crucial sector in the Saudi economy as its exports represents 11.09% of the total exports value, which includes petrochemical, metals, and minerals products. The sector output increased by 1.52% as a result of a 5.66% rise in its exports.
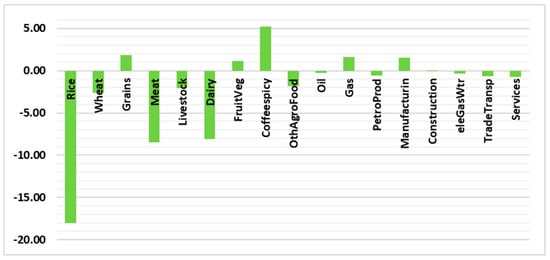
Figure 8.
The change in output of different sectors.
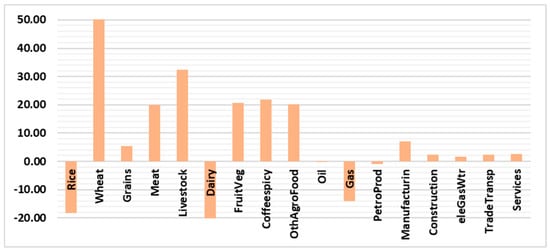
Figure 9.
The change in exports of different sectors.
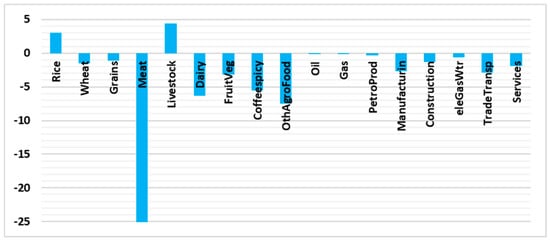
Figure 10.
The change in imports of different sectors.
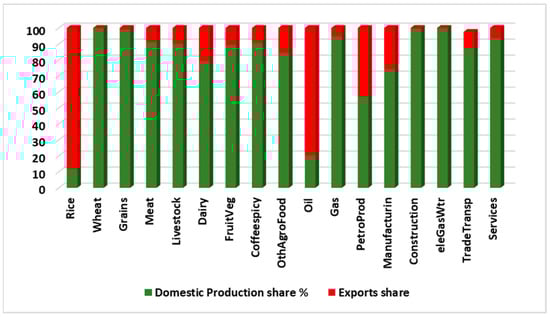
Figure 11.
The share of domestic production and exports in each sector.
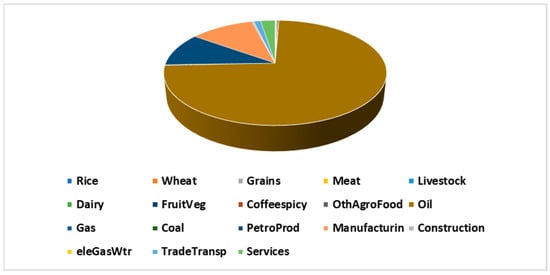
Figure 12.
The composition of Saudi exports.
In general, the outputs of most sectors were affected negatively by the higher global food prices. This is because of the effects that higher prices of necessity commodities have on consumers’ budget, which results in a reduction of their purchasing ability. This can be seen in the reduction in private household expenditure (ypev), as shown in Table 2. This translates into a decrease in real GDP (which measures the outputs of sectors after adjustment for inflation) for Saudi Arabia, as shown in Table 2. The change in trade balance for Saudi Arabia indicates that the increase in imports exceeds the increase in exports, as shown by the negative value in Table 2. This was mainly caused by the more expensive imported food commodities and a reduction in two of the main Saudi exports (oil and PertoProd). The change in the welfare in GTAP is indicated by the equivalent variation (EV), which measures the income equivalent that an individual needs in order to have the same level of utility, before the changes in food prices. As depicted in Table 2, Saudi welfare declined.
3.2. Impact on CO2 Emissions, Using the Input–Output Life Cycle Assessment Approach (IO-LCA)
The total carbon emissions for the Saudi economy resulting from the tested scenario were calculated using the Input–Output Life Cycle Assessment Approach (IO-LCA). The approach is a holistic methodology to quantify the environmental impacts occurring during a product or service life cycle. This product or service is either purchased by the final consumer (a private household, government, importers, and investment) or used as an intermediate input by other industries [23]. Following Mattila [24], the total production output for the economy (X) is a vector, calculated as follows:
where I is the identity matrix; A is the technology matrix including the coefficients of intermediary inputs required to produce one unit of output for each sector; and F is the final demand vector (in US$). The final demand (F) from GTAP was calculated as a summation of domestic purchases made by private households, the government, exports, firms, and investment, for Saudi Arabia. A common problem with the IO-LCA approach is the double counting of environmental emissions. This occurs in firms where assessing the full supply chain of their products leads to overlaps with other industries’ life cycles. In other words, assuming that the final product of industry A is an intermediate input for industry B, by accounting for the full supply chain emissions for industries A and B, industry A emissions would be accounted for twice: for the industry itself, and for its input for industry B. Ignoring this problem will lead to a serious overestimation of emissions [25,26,27]. Moreover, it is crucial to account only for domestic purchases, either by final consumers or firms. Accounting for all purchases (domestic and imports) will lead to an overseas double counting, where the emissions of a country’s imports are counted more than once (in the country itself, and in the country of export). In this work, the double counting problem was avoided by subtracting the intermediary inputs of sectors that were accounted for in the sectors previously modelled. The embodied carbon emissions (G) are calculated using the following equation:
where B is a matrix of carbon emissions multiplier for each economic sector (in CO2 kg emissions/$) [24]. The carbon emission multipliers are taken from Steen-Olsen et al. [28]. All the IO-LCA analyses were performed in Microsoft Excel using matrix functions. In this work, the total calculated emissions of CO2 for Saudi Arabia were approximately 740.6 million metric tonnes, covering emissions of the updated data year (2022).
A global team from Stanford University recently published a comprehensive study about the carbon intensity of oil fields worldwide [29]. The study found that the carbon intensity of Saudi oil is one of the lowest in the world, approximately 55.34% less than the average global carbon intensity. According to the study, this is caused by multiple factors, including the continuous implementation of best practices in reservoir and greenhouse gas emissions management, minimization of flare, and the programme of detecting and repairing methane leaks. Recalculating the total CO2 emissions for Saudi Arabia based on the revised carbon intensity showed that Saudi carbon emissions were approximately 594.4 million metric tonnes per year (24.59% less than the first value). This implies that investing in implementing best practices in management of reservoirs will have a great impact in the context of mitigating greenhouse gas emissions. In addition, it is worthwhile for countries with large fossil fuel investments to specifically reassess the carbon intensity of their fossil fuels and not simply depend on the emission factors reported by international agencies. For example, Liu et al. [30] assessed the emissions factor of coal in China and found that it is approximately 40% less than was reported by the Intergovernmental Panel on Climate Change (IPCC), which is the data used by most emissions inventories. Figure 13 shows the most recent published estimations of CO2 emissions for Saudi Arabia from different international agencies and from this study. These agencies are EDGAR [31], IEA [32], PB [33], EIA [34], the World Bank [35], UNFCCC [36], and Global Carbon Atlas [37]. There are different reasons behind the variations in these agencies’ estimations, for example the studies’ boundaries and what they include, the emission factors, whether land use is included, and the estimation year. This study gave a higher estimation because it covers a wider boundary (the whole economy). The UNFCCC is the agency, with a similar boundary but using a different methodology and an earlier year. It is crucial to note that economic development plays a major role in the increase in emissions [38].
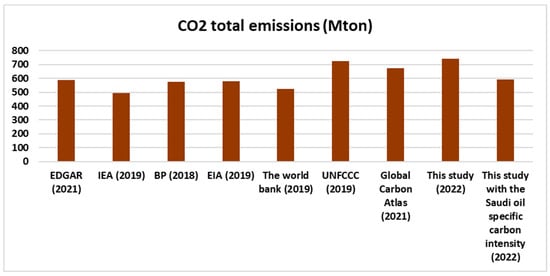
Figure 13.
Estimations of CO2 emissions for Saudi Arabia from different international agencies and from this study.
4. Conclusions
Recent years have seen several unprecedented events that might threaten the pursuit and achievement of some of Saudi Arabia’s sustainable targets. These events include: the global outbreak of COVID-19, the consequent disruption to the global supply chain, the alarming rate of climate change, and various political conflicts. Global food and energy prices have been affected by these events. This study aimed to demonstrate the impacts that the recent events have had on the Saudi economy and CO2 emissions. A well-known computable general equilibrium model, the Global Trade Analysis Project (GTAP) model, was used as a research method to achieve the objectives of the study. As the reference year of the GTAP database, 2011, is earlier than the year of the recent events that were modelled, the database was updated and tested for the year of the study. Several structural macroeconomic changes and fiscal policies were incorporated to update the database.
This study found that the Saudi GDP, household income, and purchase ability were negatively affected. the Saudi trade balance indicates a trade deficit as a result of the higher prices of imported agricultural goods, and a reduction in two of the main Saudi exports (oil and PetroProd). In addition, Saudi welfare, which is measured by equivalent variation (EV), declined. Regarding the structure of the Saudi industries, most Saudi industries showed an output decrease despite an increase in the exports of most sectors, and a decrease in imported goods. Regarding the environmental impacts, the total CO2 emissions resulting from the Saudi economy were estimated using the Input–Output Life Cycle Assessment (IO-LCA) approach. The total estimated CO2 emissions were approximately 740.6 million metric tonnes. Compared to other international agencies’ CO2 estimations, the CO2 emissions estimation of this study differs. This variation is understandable for multiple reasons, including that the study covers and includes a larger boundary, the carbon intensity factors used, and the year of estimation. Moreover, this study recalculated the total CO2 emissions using a specific carbon intensity for Saudi oil, which has been identified and published recently. Based on the specific carbon intensity, the total recalculated CO2 emissions for Saudi Arabia is 24.59% lower (approximately 594.4 million metric tonnes per year). This implies that a specific fossil fuel carbon intensity reassessment is worthwhile, especially for countries with significant fossil fuel investments. Future research could consider multipronged food scarcity solutions and their economic and environmental impacts. Examples of such solutions are raising the agricultural productivity, using genetically modified food, and considering reducing the diversion of corn use to produce ethanol. In addition, and specifically for Saudi Arabia, the Saudi green initiatives are worth studying. These initiatives include the development of CO2 capture technology, planting billions of trees, and investment in hydrogen and renewable energy.
Author Contributions
Conceptualization, K.A.; methodology, K.A. and R.A.; software, K.A. and R.A.; validation, K.A. and R.A.; formal analysis, K.A. and R.A.; investigation, K.A. and R.A.; resources, K.A. and R.A.; data curation, K.A. and R.A.; writing—original draft preparation, K.A.; writing—review and editing, R.A. All authors have read and agreed to the published version of the manuscript.
Funding
This research received no external funding.
Institutional Review Board Statement
Not applicable.
Informed Consent Statement
Not applicable.
Data Availability Statement
Not applicable.
Acknowledgments
This study was supported by the Ministry of Education in Saudi Arabia through Taibah University. Any opinions, findings, recommendations, and conclusions expressed herein are those of the authors and are not necessarily those of the Ministry of Education.
Conflicts of Interest
The authors declare no conflict of interest.
References
- United Nations Development Programme. Transforming Our World: The 2030 Agenda for Sustainable Development. 2015. Available online: https://sdgs.un.org/2030agenda (accessed on 8 December 2022).
- Saudi_Vision 2030. 2016. Available online: https://www.vision2030.gov.sa/ (accessed on 8 December 2022).
- Colussi, J.; Schnitkey, G.; Cabrini, S. Wheat Outlook after Five Months of War in Ukraine. Farmdoc Daily, 1 August 2022; p. 112. [Google Scholar]
- Mitigation of Climate Change Climate Change 2022 Working Group III Contribution to the Sixth Assessment Report of the Intergovernmental Panel on Climate Change. Available online: https://www.ipcc.ch/site/assets/uploads/2018/05/uncertainty-guidance-note.pdf. (accessed on 8 December 2022).
- Boylan, S.M.; Thow, A.M.; Tyedmers, E.K.; Malik, A.; Salem, J.; Alders, R.; Raubenheimer, D.; Lenzen, M. Using Input-Output Analysis to Measure Healthy, Sustainable Food Systems. Front. Sustain. Food Syst. 2020, 4, 93. [Google Scholar] [CrossRef]
- Alrobaish, W.S.; Vlerick, P.; Luning, P.A.; Jacxsens, L. Food safety governance in Saudi Arabia: Challenges in control of imported food. J. Food Sci. 2021, 86, 16–30. [Google Scholar] [CrossRef] [PubMed]
- Aguiar, A.; Narayanan, B.; Mcdougall, R. An Overview of the GTAP 9 Data Base. JGEA 2016, 1, 181–208. [Google Scholar] [CrossRef]
- Munasinghe, M. Computable general equilibrium modelling applications. Sustain. Dev. Pract. 2010, 1, 269–310. [Google Scholar] [CrossRef]
- Chang, L.; Lu, Q.; Ali, S.; Mohsin, M. How does hydropower energy asymmetrically affect environmental quality? Evidence from quantile-based econometric estimation. Sustain. Energy Technol. Assess. 2022, 53, 102564. [Google Scholar] [CrossRef]
- Zhang, D.; Mohsin, M.; Taghizadeh-Hesary, F. Does green finance counteract the climate change mitigation: Asymmetric effect of renewable energy investment and R&D. Energy Econ. 2022, 113, 106183. [Google Scholar] [CrossRef]
- Energy Information Administration (EIA). 2022. Available online: http://www.eia.gov/dnav/pet/pet_pri_spt_s1_a.htm (accessed on 8 December 2022).
- Burfisher, M.E. Introduction to Computable General Equilibrium Models; Cambridge University Press: Cambridge, UK, 2021. [Google Scholar]
- Corong, E.L.; Hertel, T.W.; Mcdougall, R.A.; Tsigas, M.E.; Van Der Mensbrugghe, D. The Standard GTAP Model, Version 7. JGEA 2017, 2, 1–119. [Google Scholar]
- Horridge, M. Chapter 5 GTAPAgg: Data Aggregation Program. 2015. Available online: https://www.researchgate.net/profile/Jonathan-Horridge/publication/265409625_GTAPAgg_Data_Aggregation_Program/links/54d0cc720cf20323c219a9f0/GTAPAgg-Data-Aggregation-Program.pdf (accessed on 8 December 2022).
- The World Bank. 2022. Available online: https://data.worldbank.org/ (accessed on 8 December 2022).
- The World Economic Forum. 2022. Available online: https://www.weforum.org/ (accessed on 8 December 2022).
- Tsigas, M. ILO Statistics and the GTAP Labor Module. 2013. Available online: www.gtap.agecon.purdue.edu (accessed on 8 December 2022).
- The Saudi General Authority of Statistics. 2022. Available online: https://www.stats.gov.sa/en/814 (accessed on 8 December 2022).
- Pearson, K.; Horridge, M.; Corong, E. Hands-On Computing with RunGTAP and WinGEM to Introduce GTAP and Gempack. 2010. Available online: http://www.copsmodels.com/gempack.htm (accessed on 8 December 2022).
- World Food Price Index. 2022. Available online: https://tradingeconomics.com/world/food-price-index (accessed on 8 December 2022).
- Macrotrends—The Long Term Perspective on Markets. Available online: https://www.macrotrends.net/futures/ (accessed on 8 December 2022).
- Pearson, K.R.; Hertel, T.W.; Horridge, J.M. AnalyseGE: Software Assisting Modellers in the Analysis of Their Results; Center for Global Trade Analysis, Purdue University: Lafayette, IN, USA, 2002. [Google Scholar]
- Hendrickson, C.T.; Lave, L.B.; Matthews, H.S. Environmental Life Cycle Assessment of Goods and Services an Input-Output Approach; Routledge: London, UK, 2006. [Google Scholar]
- Tuomas, J. Mattila Use of Input–Output Analysis in LCA. In Life Cycle Assessment; Springer: Cham, Switzerland, 2017. [Google Scholar]
- Lenzen, M. Double-counting in life cycle calculations. J. Ind. Ecol. 2008, 12, 583–599. [Google Scholar] [CrossRef]
- Cabernard, L.; Pfister, S.; Oberschelp, C.; Hellweg, S. Growing environmental footprint of plastics driven by coal combustion. Nat. Sustain. 2022, 5, 139–148. [Google Scholar] [CrossRef]
- Xu, X.; Wang, Q.; Ran, C.; Mu, M. Is burden responsibility more effective? A value-added method for tracing worldwide carbon emissions. Ecol. Econ. 2021, 181, 106889. [Google Scholar] [CrossRef]
- Steen-Olsen, K.; Owen, A.; Hertwich, E.G.; Lenzen, M. Effects of sector aggregation on CO2 multipliers in multiregional input–output analyses. Econ. Syst. Res. 2014, 26, 284–302. [Google Scholar] [CrossRef]
- Masnadi, M.S.; El-Houjeiri, H.M.; Schunack, D.; Li, Y.; Englander, J.G.; Badahdah, A.; Monfort, J.C.; Anderson, J.E.; Wallington, T.J.; Bergerson, J.A.; et al. Global carbon intensity of crude oil production. Science 2018, 361, 851–853. [Google Scholar] [CrossRef] [PubMed]
- Liu, Z.; Guan, D.; Wei, W.; Davis, S.J.; Ciais, P.; Bai, J.; Peng, S.; Zhang, Q.; Hubacek, K.; Marland, G.; et al. Reduced carbon emission estimates from fossil fuel combustion and cement production in China. Nature 2015, 524, 335–338. [Google Scholar] [CrossRef] [PubMed]
- EDGAR—Emissions Database for Global Atmospheric Research. CO2 Emissions of All World Countries. 2022. Available online: https://edgar.jrc.ec.europa.eu/report_2022#emissions_table (accessed on 8 December 2022).
- International Energy Agency, Saudi Arabia. 2020. Available online: https://www.iea.org/countries/saudi-arabia (accessed on 8 December 2022).
- bp. bp Statistical Review of World Energy. 2020. Available online: www.bp.com/statisticalreview (accessed on 8 December 2022).
- The U.S. Energy Information Administration Saudi Arabia Emissions. Available online: https://www.eia.gov/international/data/country/SAU/other-statistics/emissions-by-fuel (accessed on 8 December 2022).
- The World Bank Carbon Dioxide (CO2) Emissions. 2020. Available online: https://data.worldbank.org/indicator/EN.ATM.CO2E.KT?end=2019&locations=SA&start=2015 (accessed on 8 December 2022).
- United Nations Framework Convention on Climate Change (UNFCCC). What Climate Commitments Has Saudi Arabia submitted? 2020. Available online: https://www.climatewatchdata.org/countries/SAU?end_year=2019&start_year=1990 (accessed on 8 December 2022).
- Global Carbon Atlas. Fossil Fuels Emissions. 2021. Available online: http://www.globalcarbonatlas.org/en/CO2-emissions (accessed on 8 December 2022).
- Dandres, T.; Gaudreault, C.; Tirado-Seco, P.; Samson, R. Assessing non-marginal variations with consequential LCA: Application to European energy sector. Renew. Sustain. Energy Rev. 2011, 15, 3121–3132. [Google Scholar] [CrossRef]
Disclaimer/Publisher’s Note: The statements, opinions and data contained in all publications are solely those of the individual author(s) and contributor(s) and not of MDPI and/or the editor(s). MDPI and/or the editor(s) disclaim responsibility for any injury to people or property resulting from any ideas, methods, instructions or products referred to in the content. |
© 2023 by the authors. Licensee MDPI, Basel, Switzerland. This article is an open access article distributed under the terms and conditions of the Creative Commons Attribution (CC BY) license (https://creativecommons.org/licenses/by/4.0/).