
Application of Probabilistic Seismic Hazard Assessment to Understand the Earthquake Hazard in Attock City, Pakistan: A Step towards Linking Hazards and Sustainability

 ,
,
Abstract
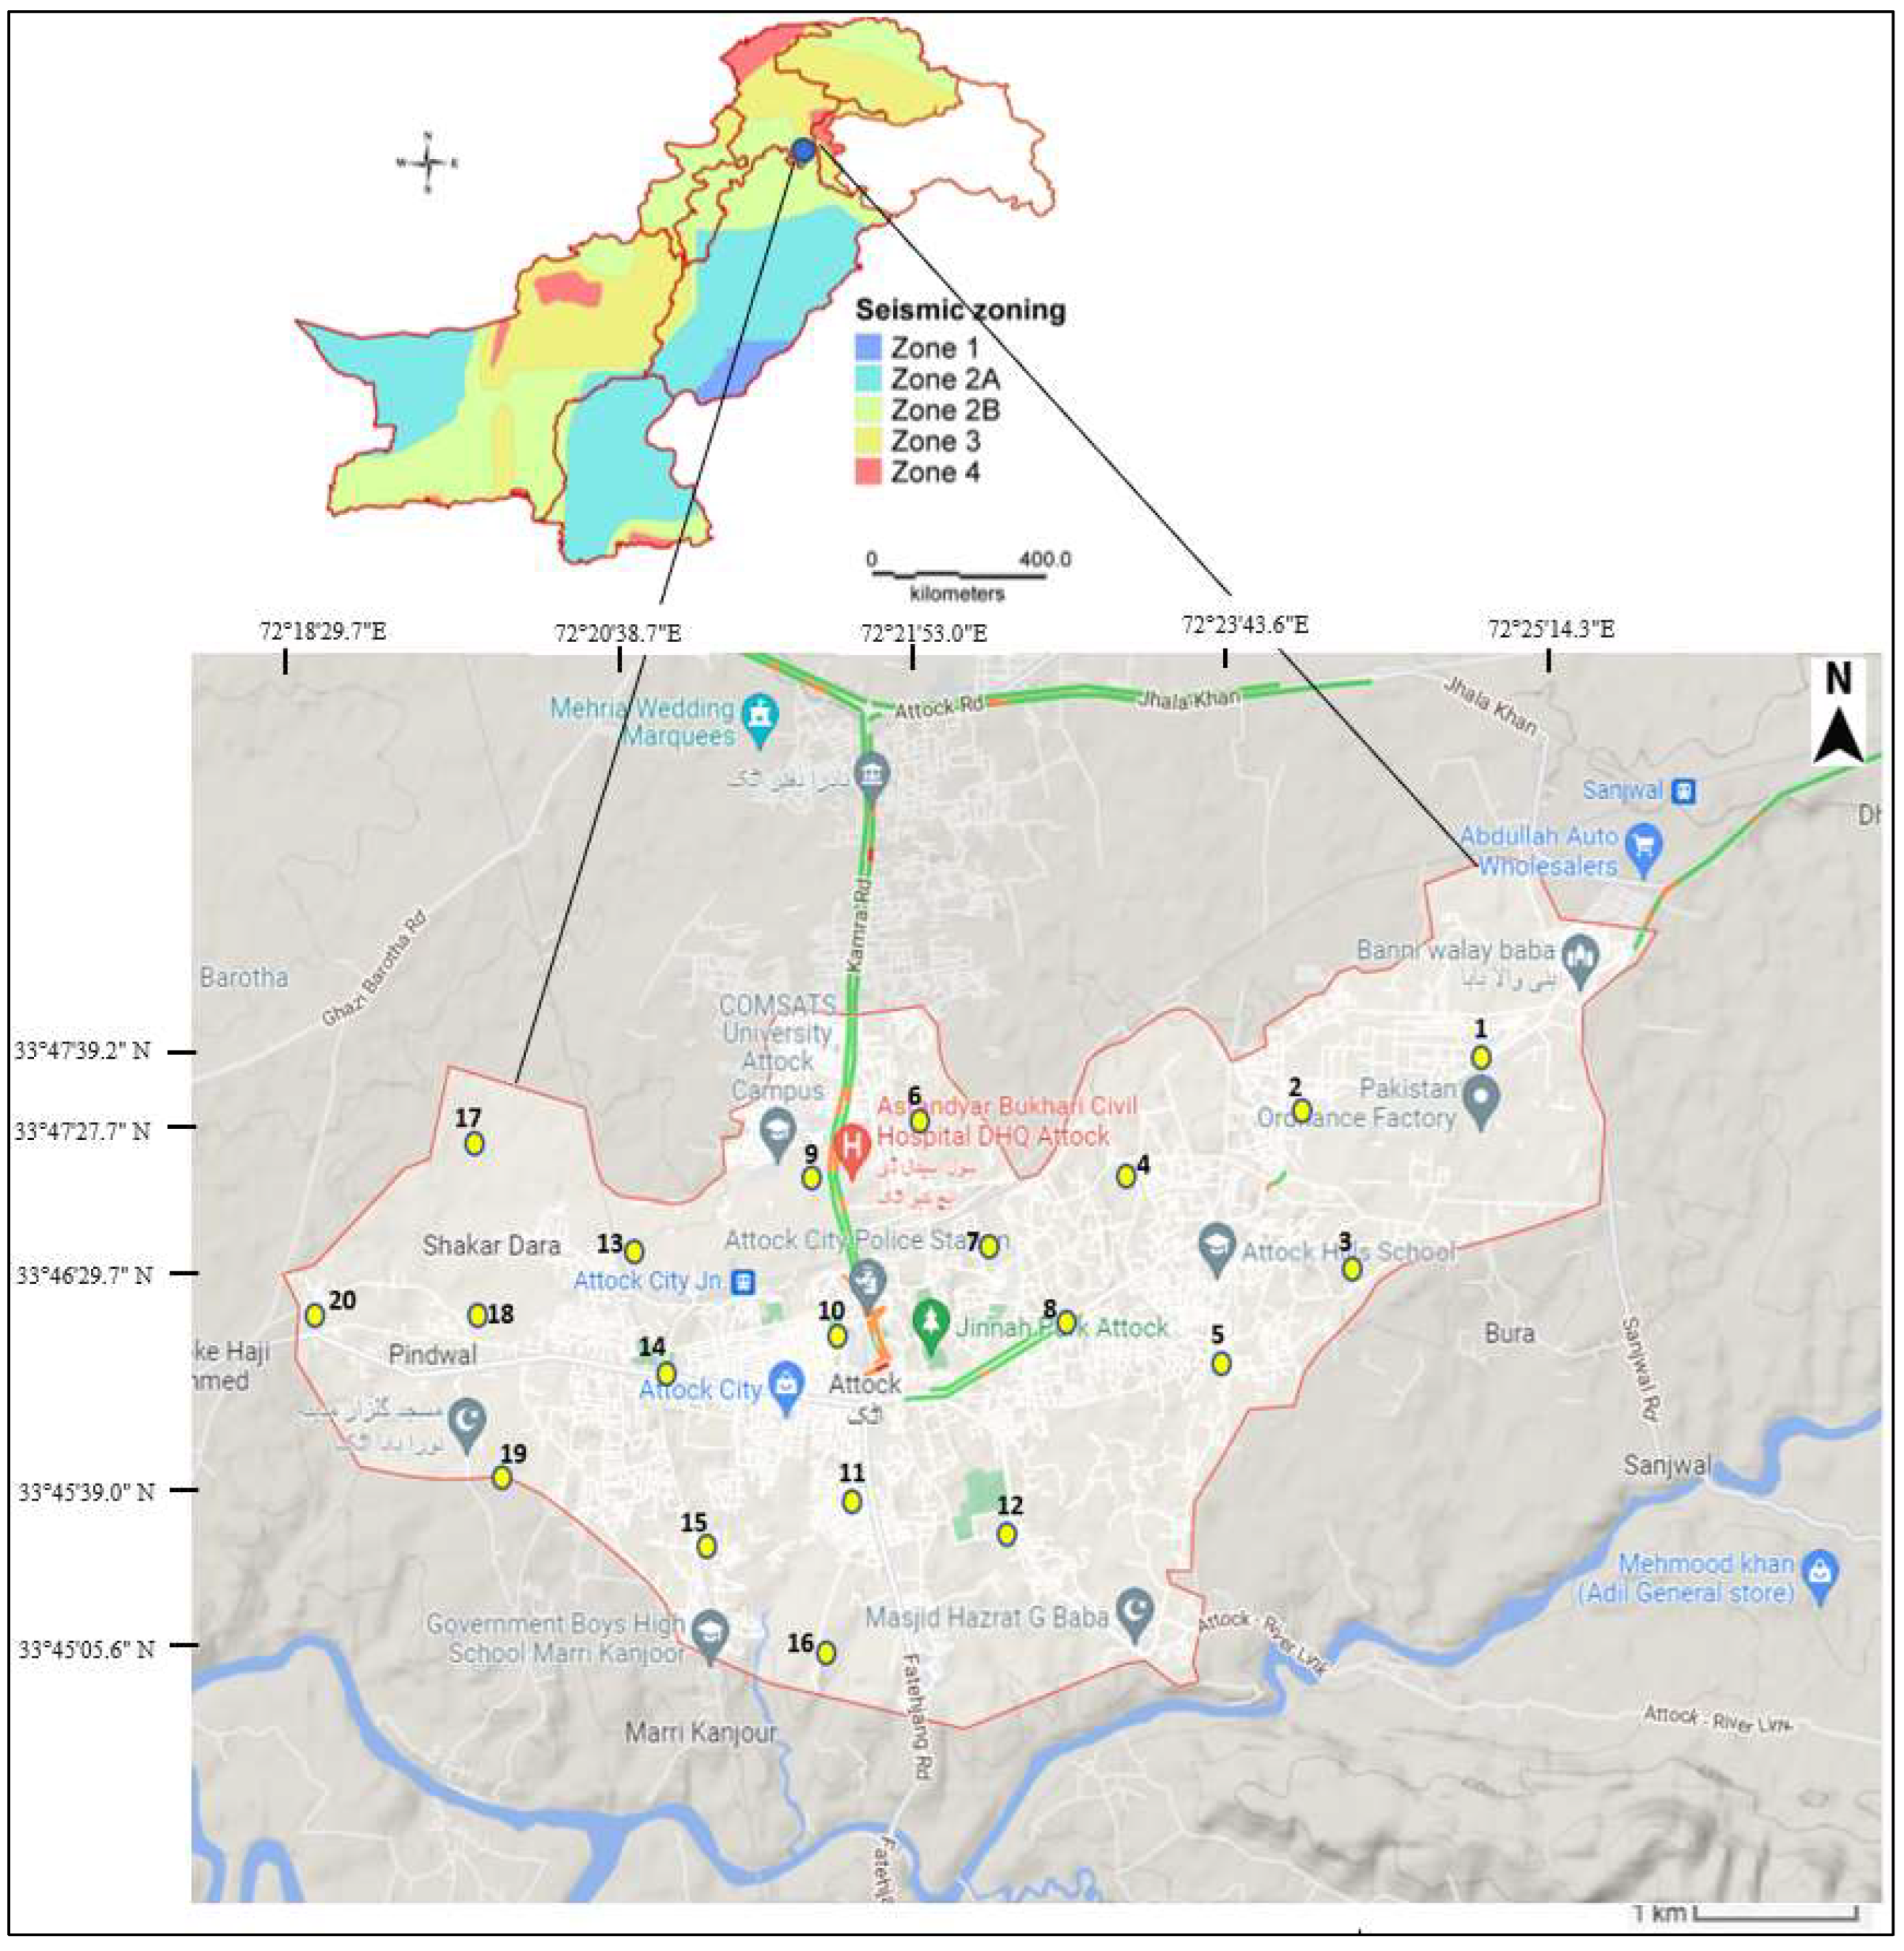
1. Introduction
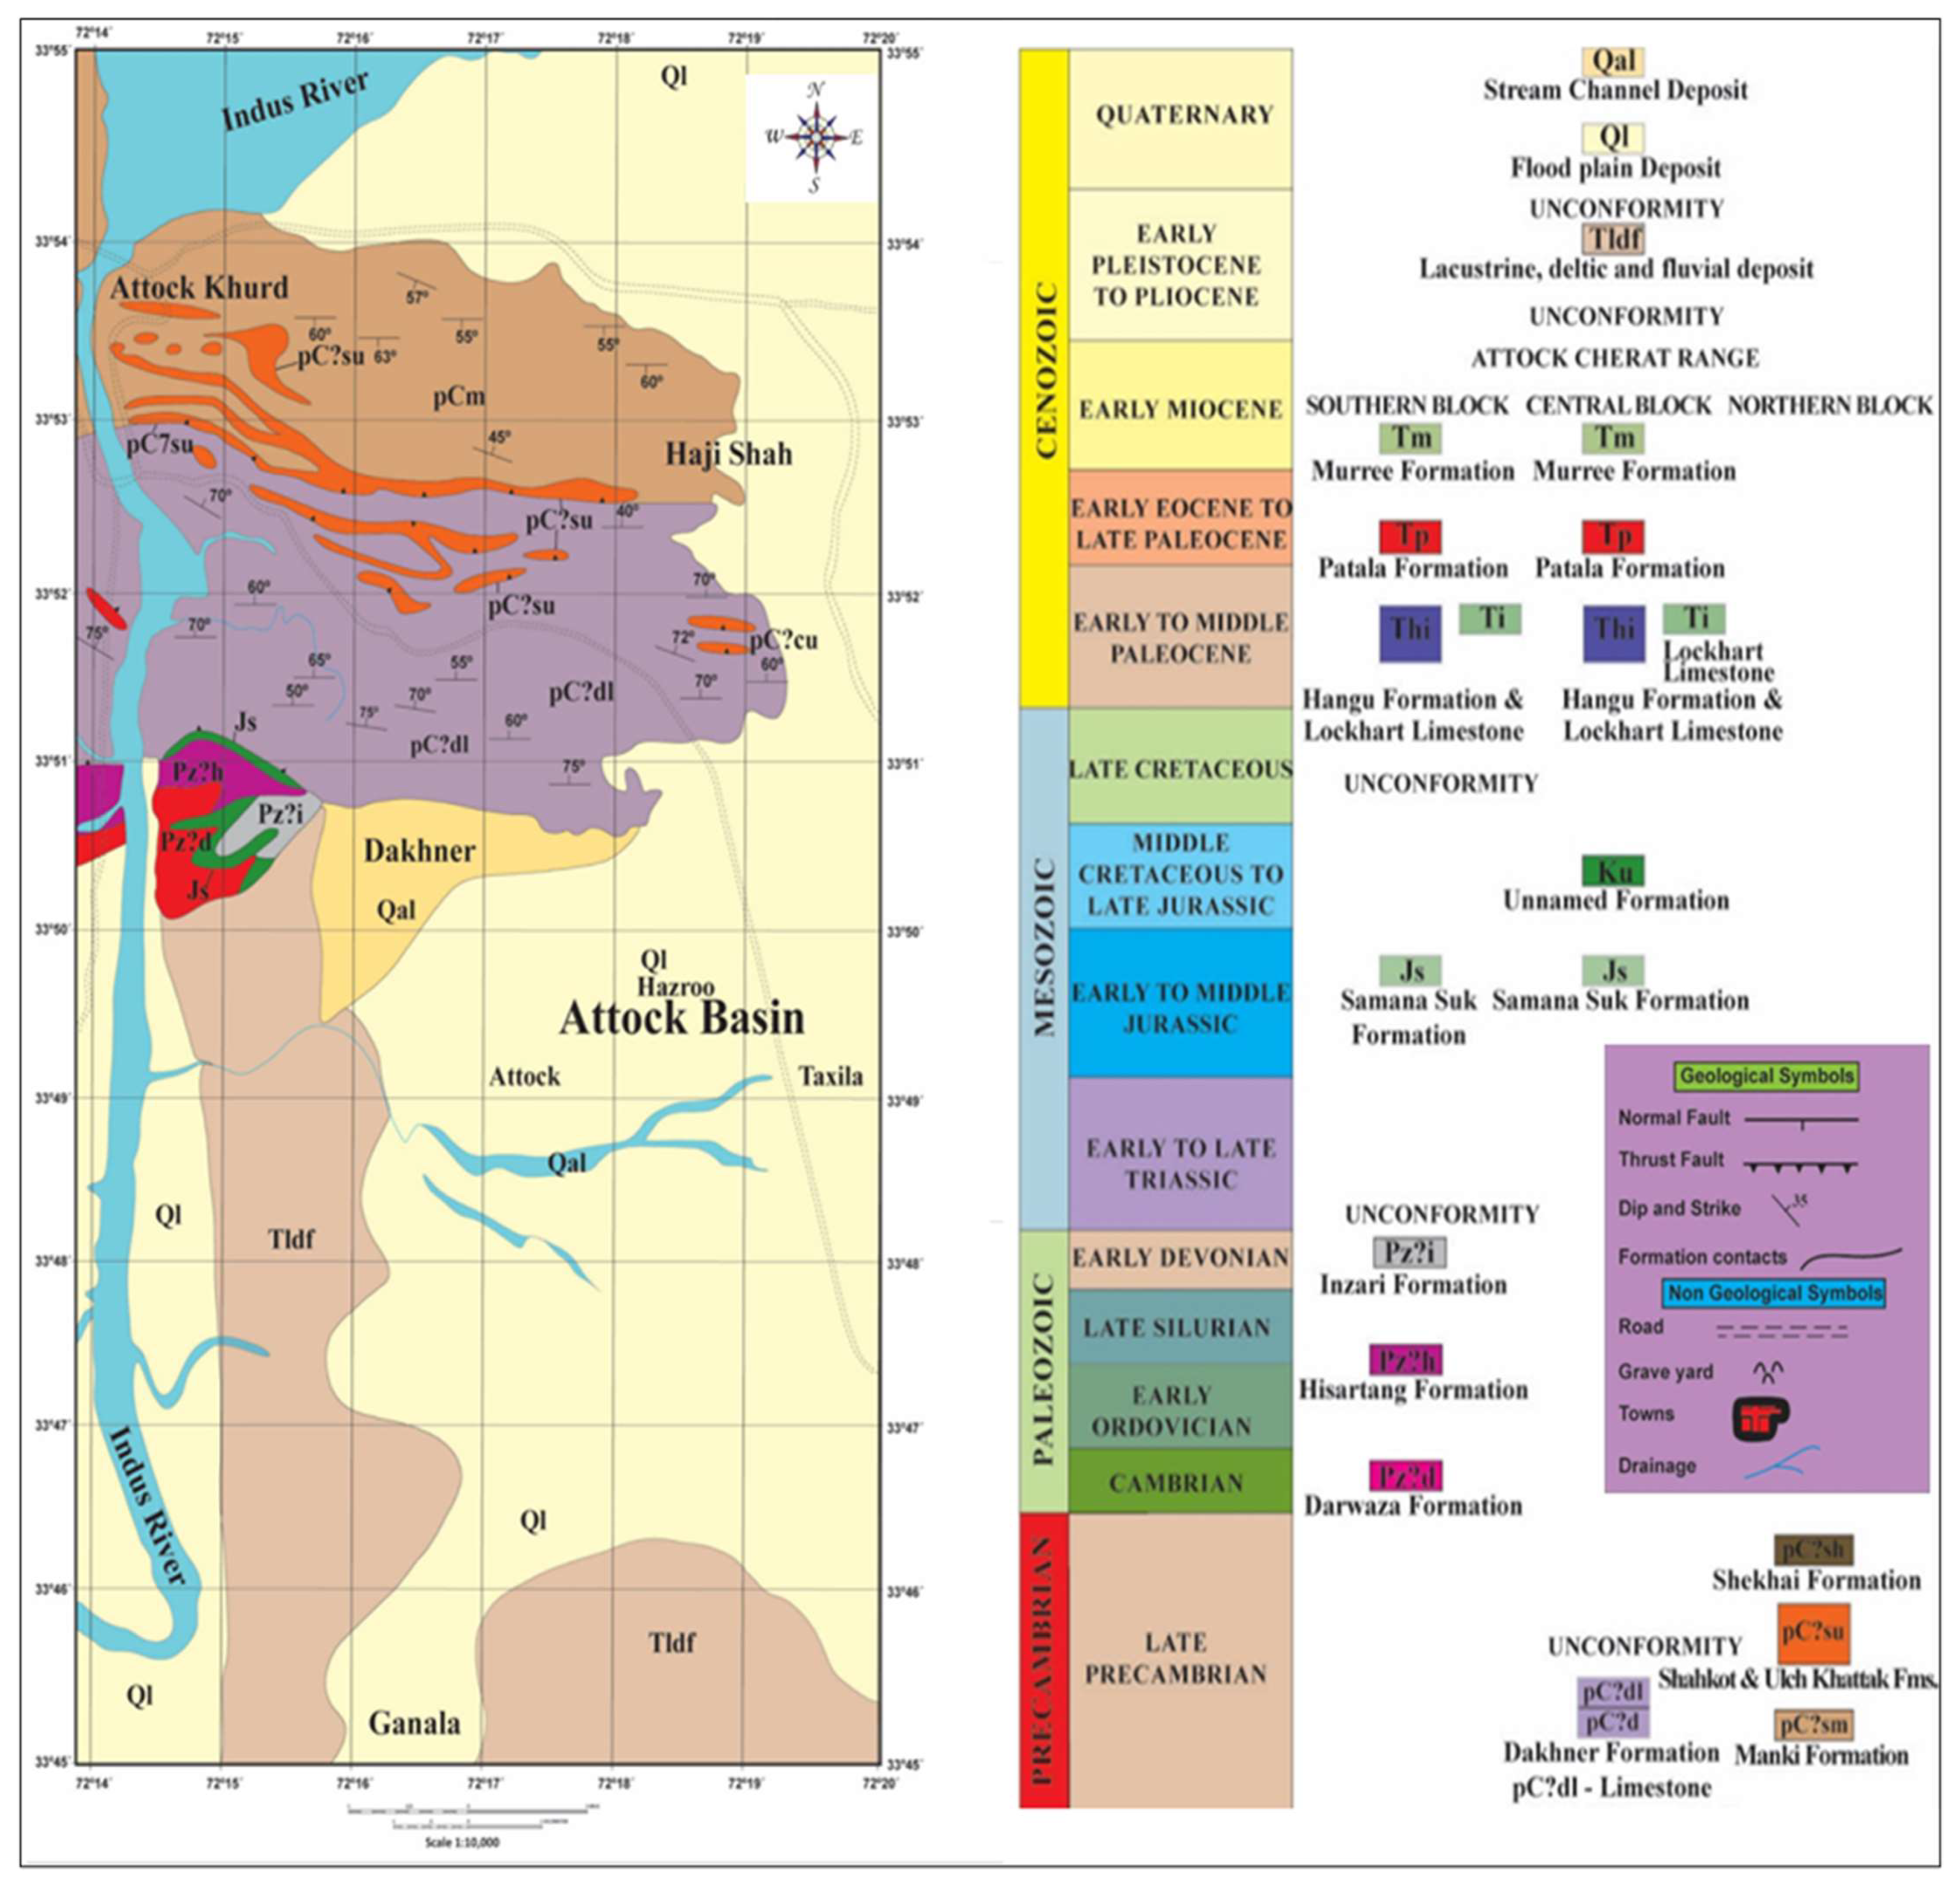
2. Geological Settings
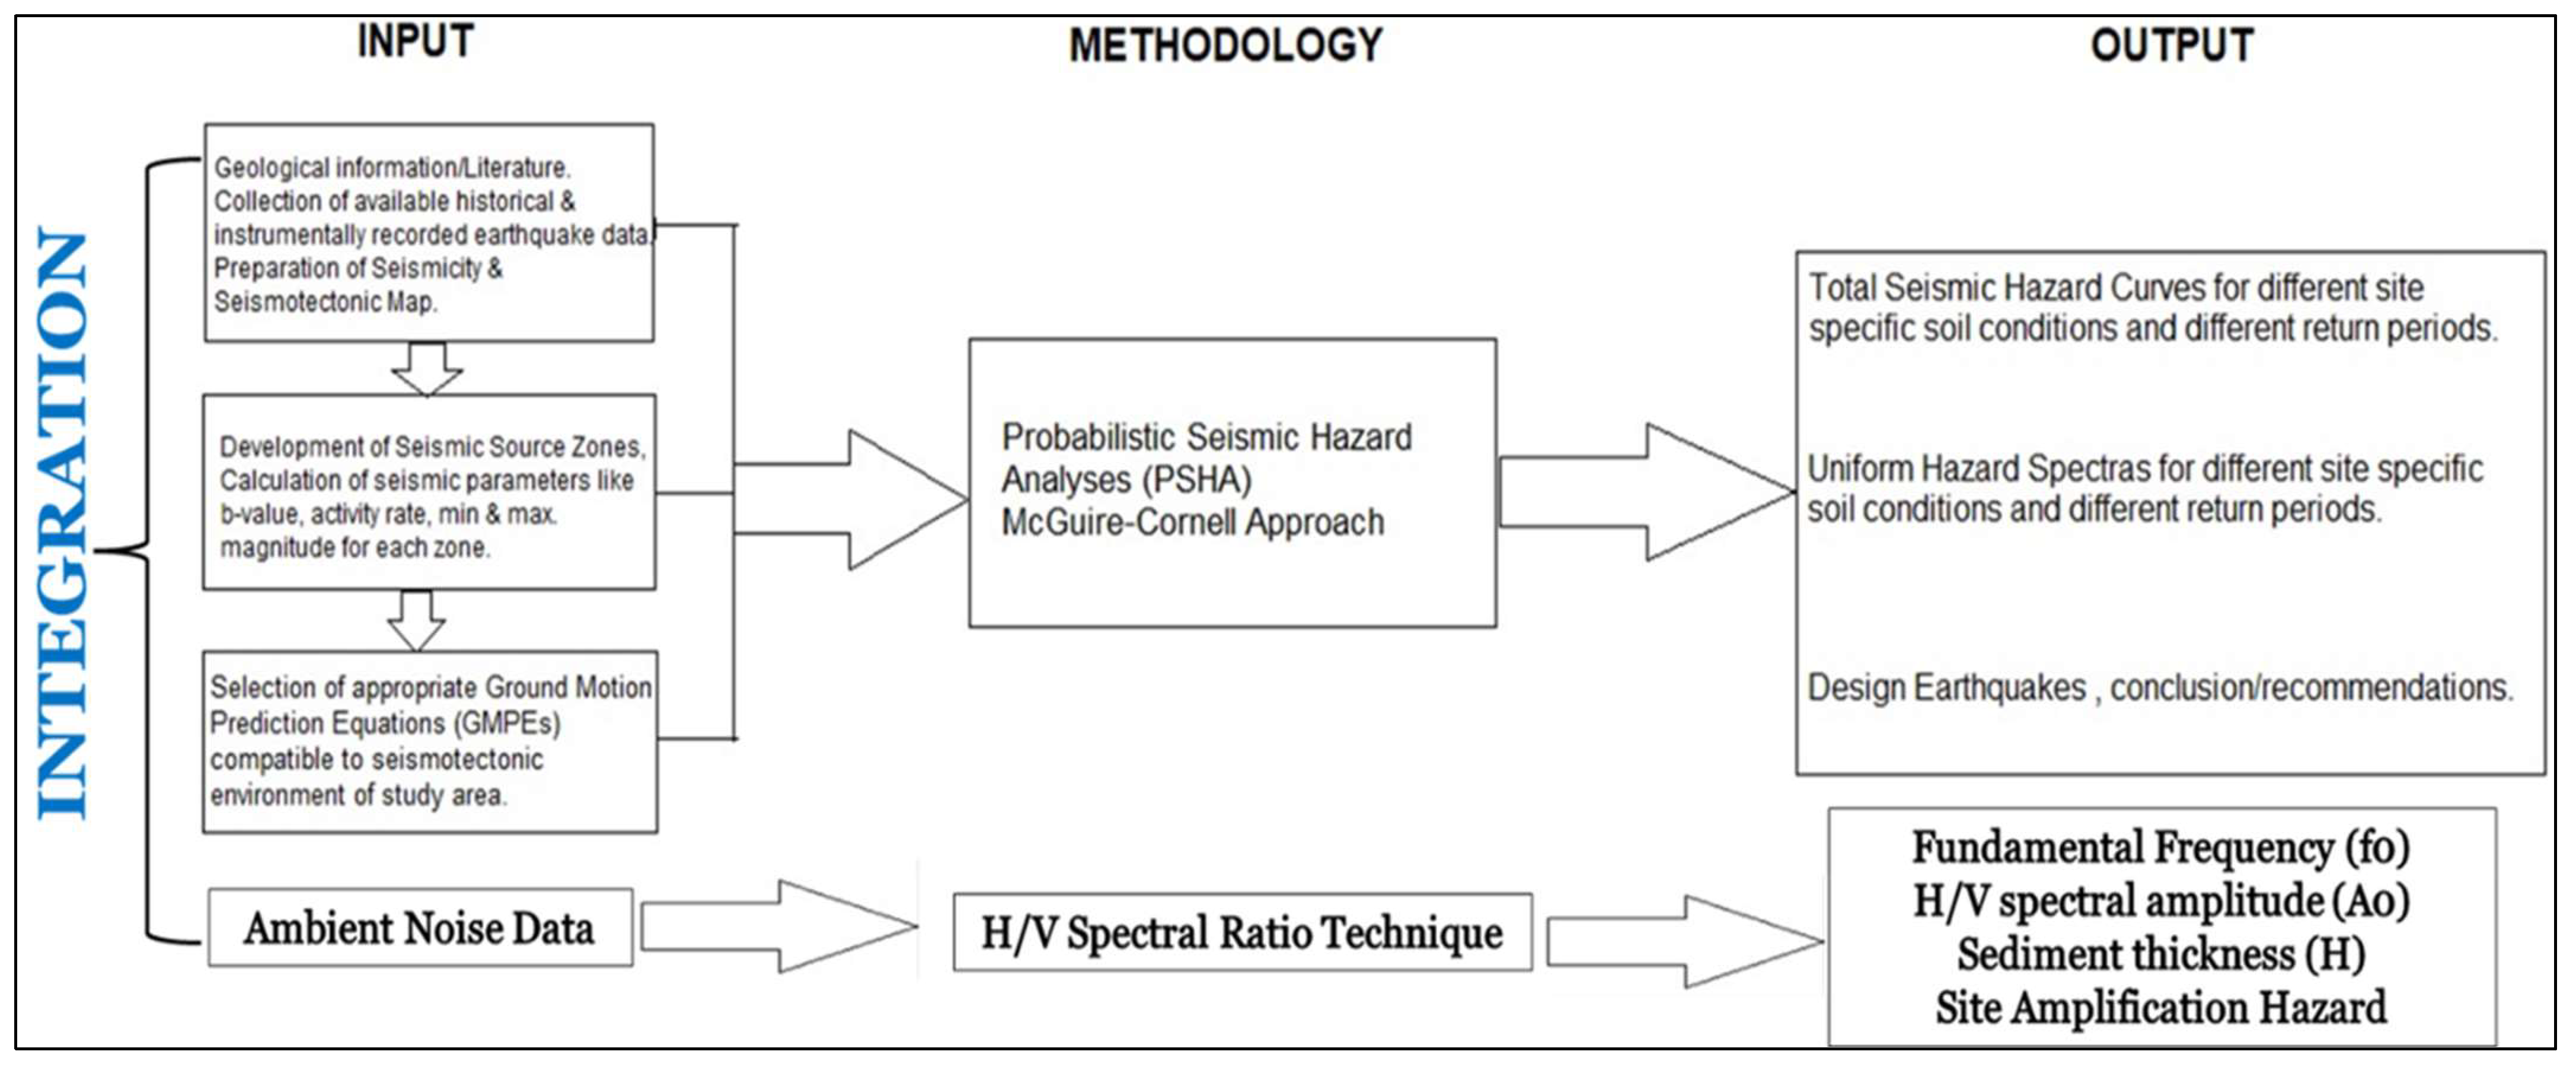
3. Probabilistic Seismic Hazard Analysis (PSHA)
- (a)
- Reliable earthquake catalogue
- (b)
- Seismotectonic model
- (c)
- Ground Motion Prediction Equations (GMPEs)
- (d)
- Microtremor data
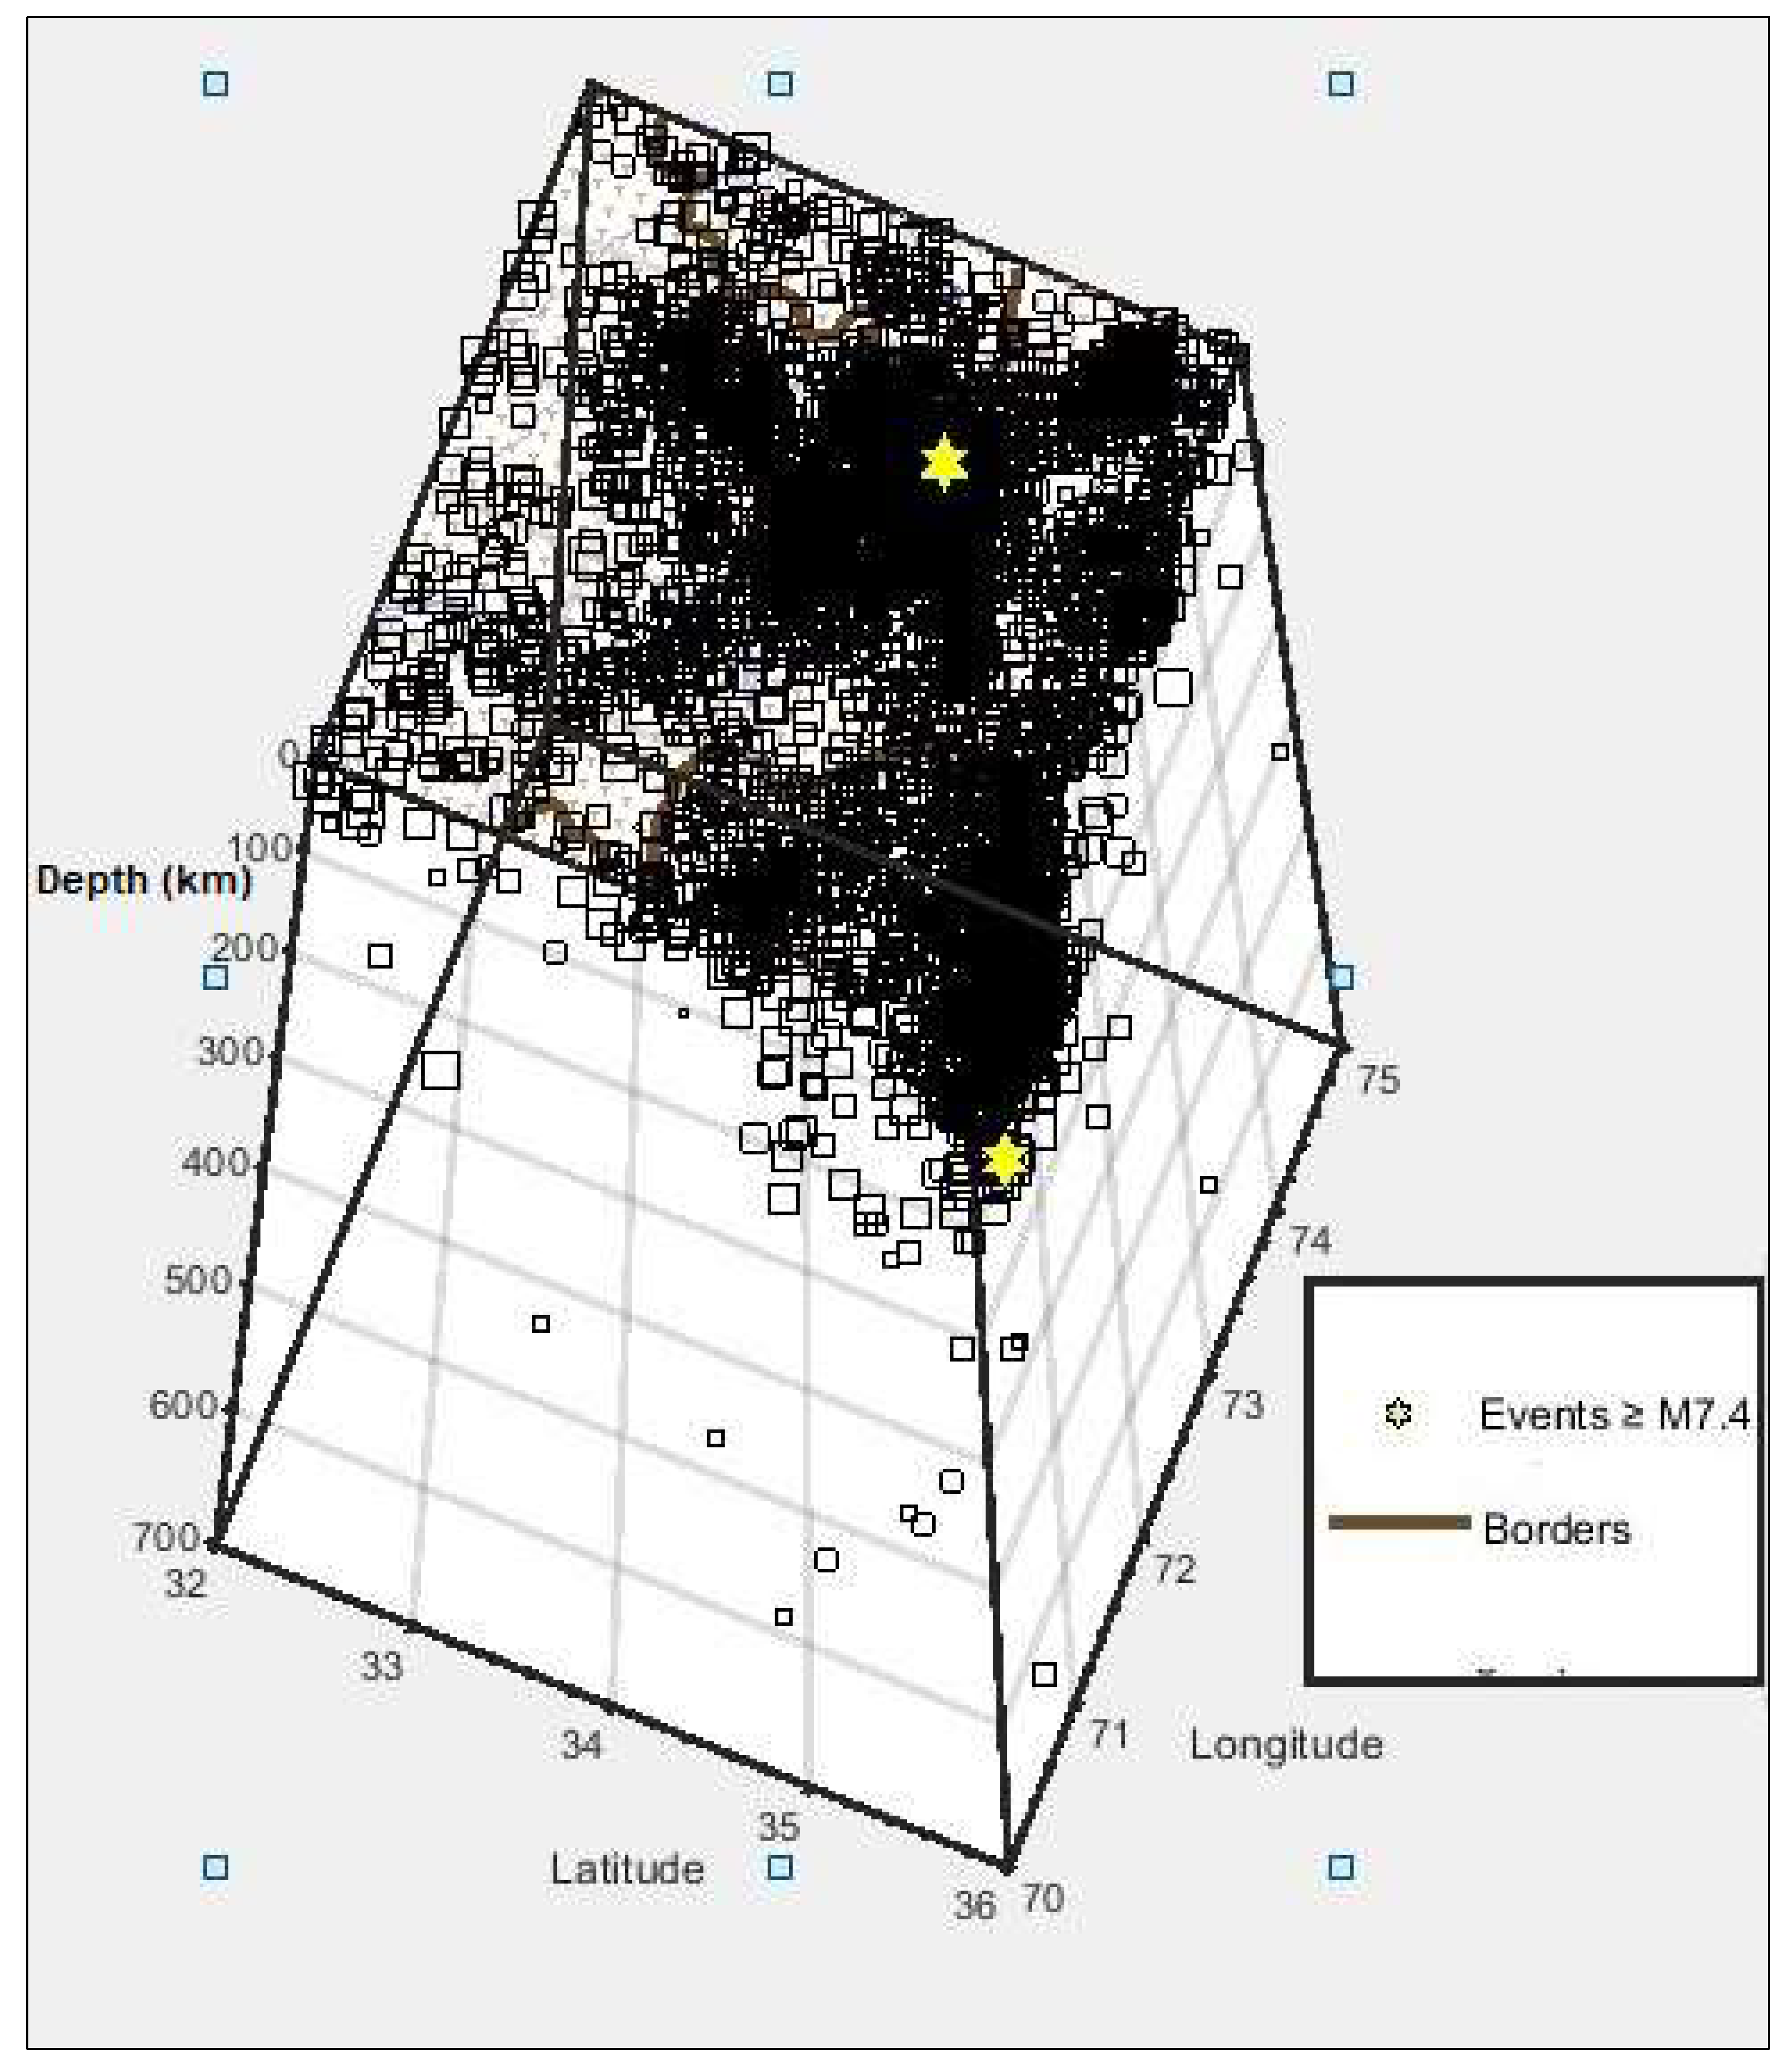
3.1. Earthquake Catalogue Compilation
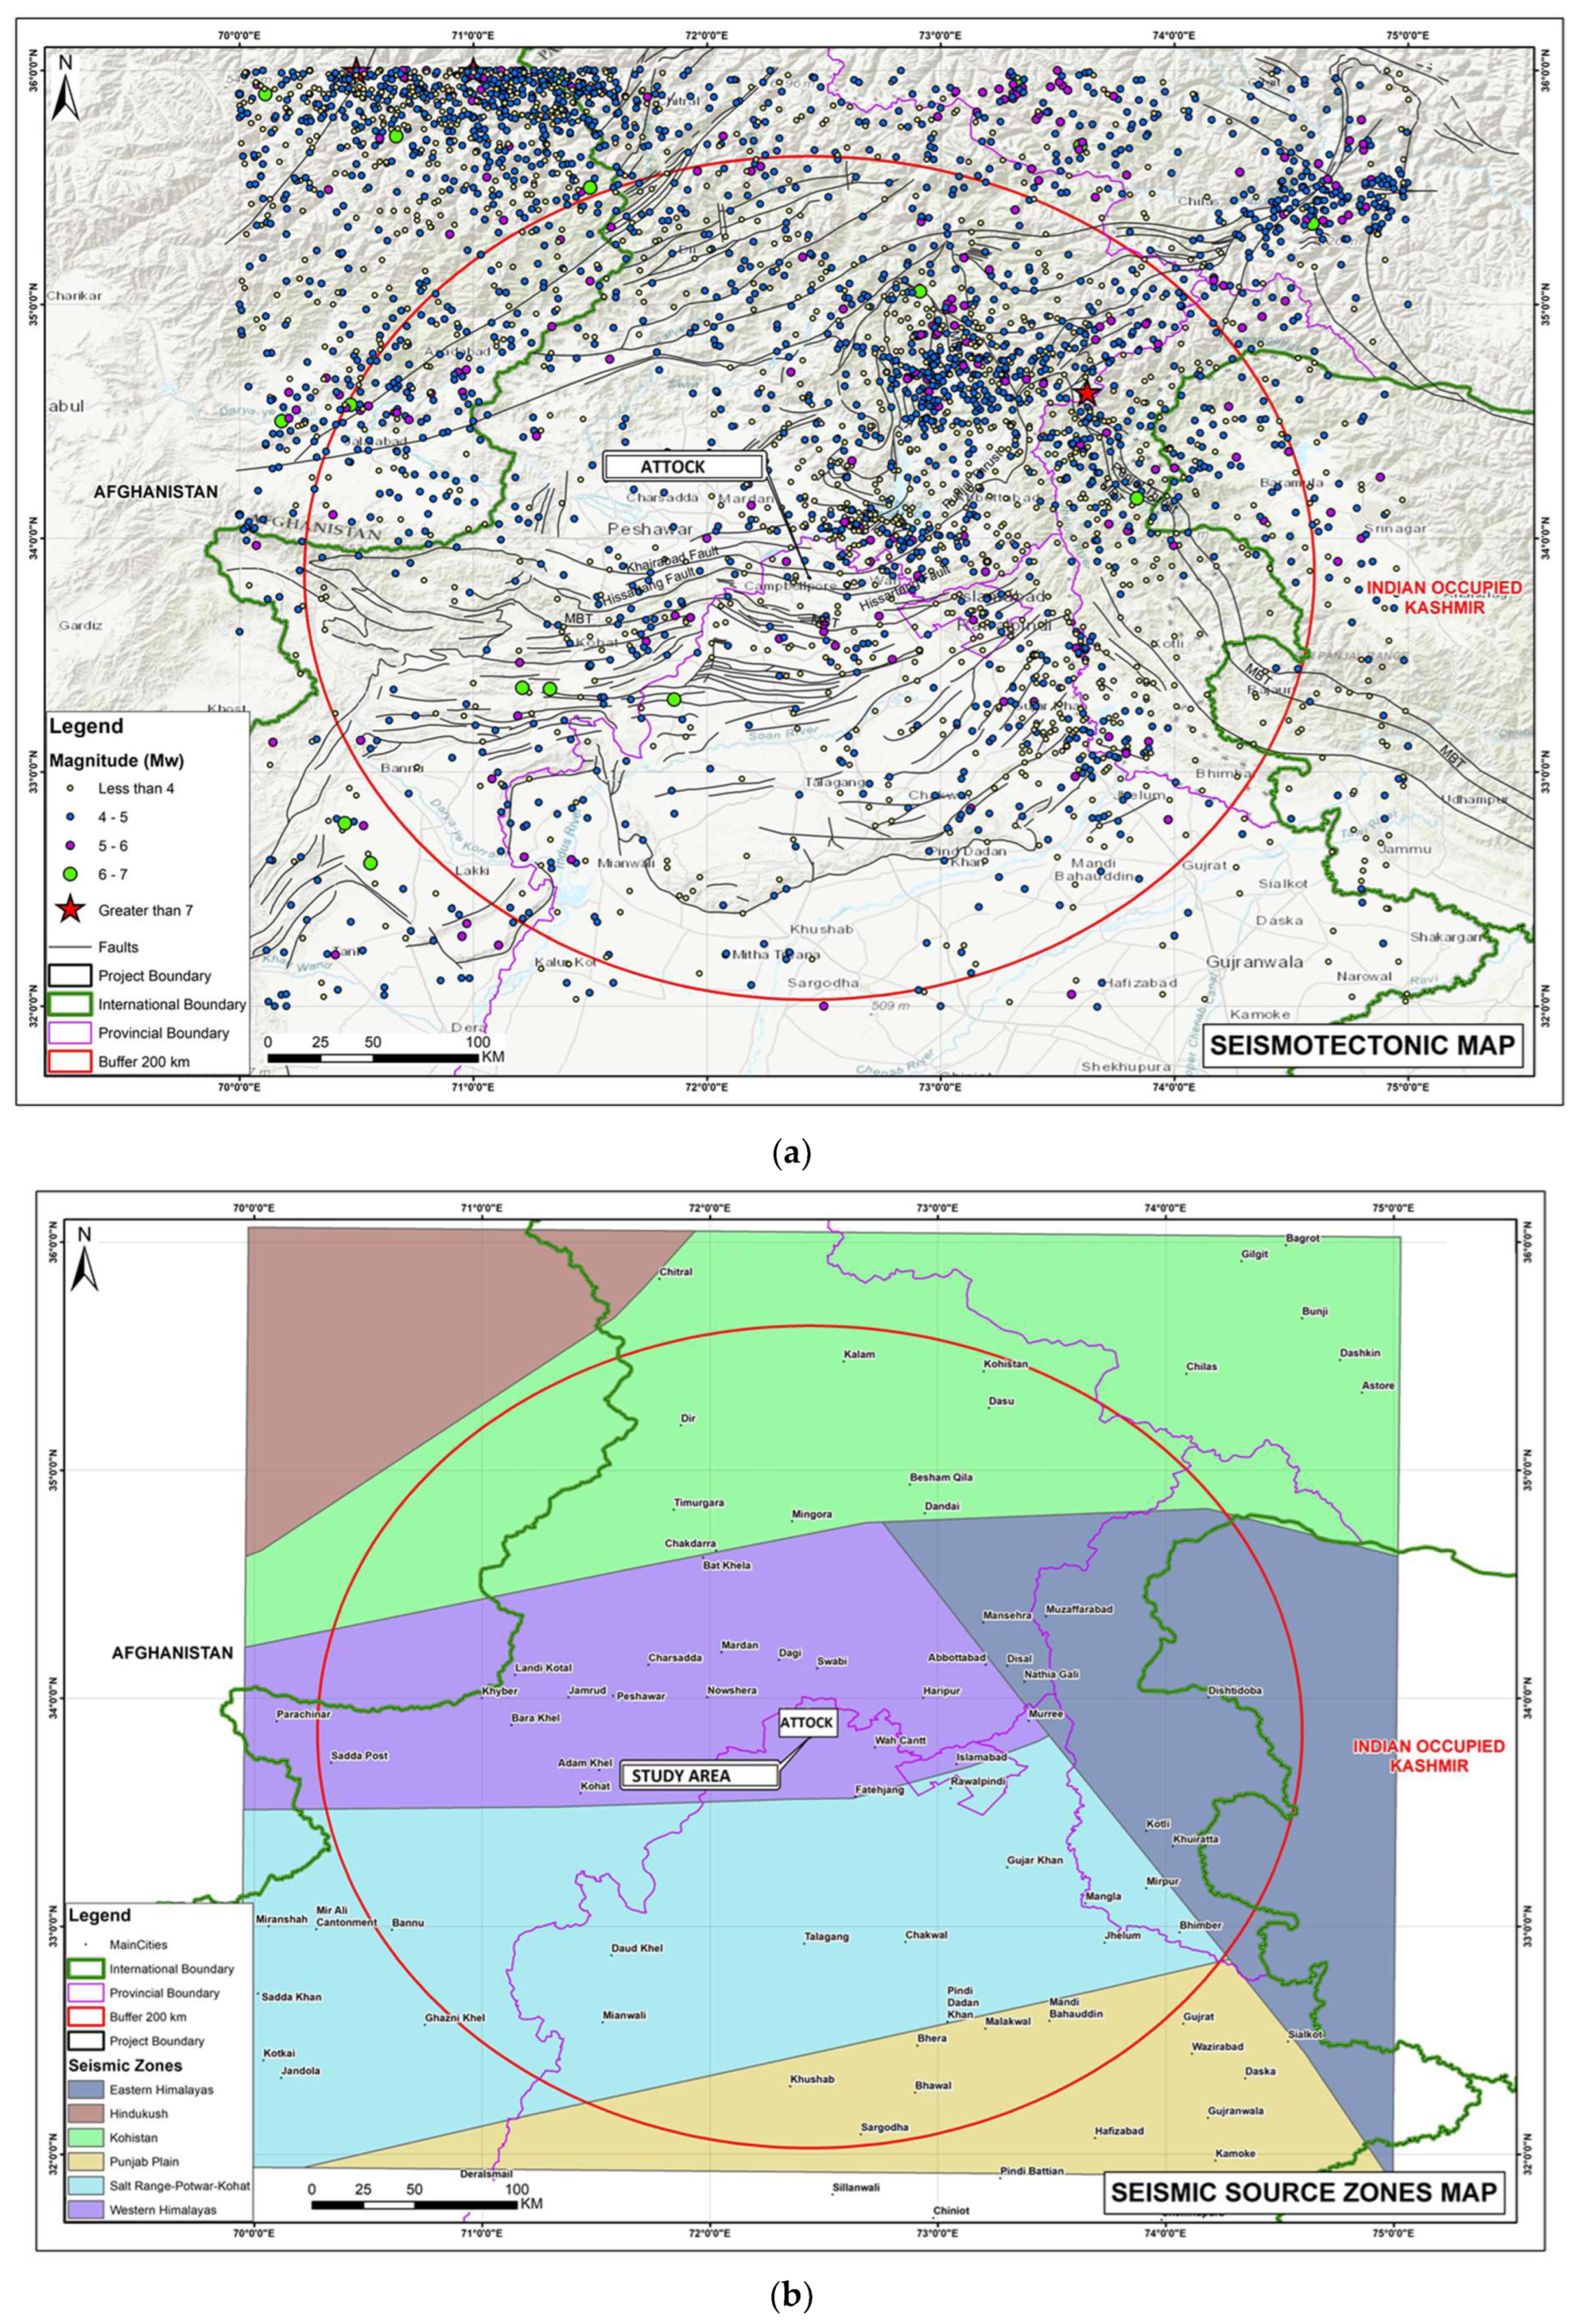
3.2. Seismotectonic Modelling
- i.
- The Panjal-Khairabad Fault
- ii.
- The Hissartang Fault
- iii.
- The Main Boundary Thrust
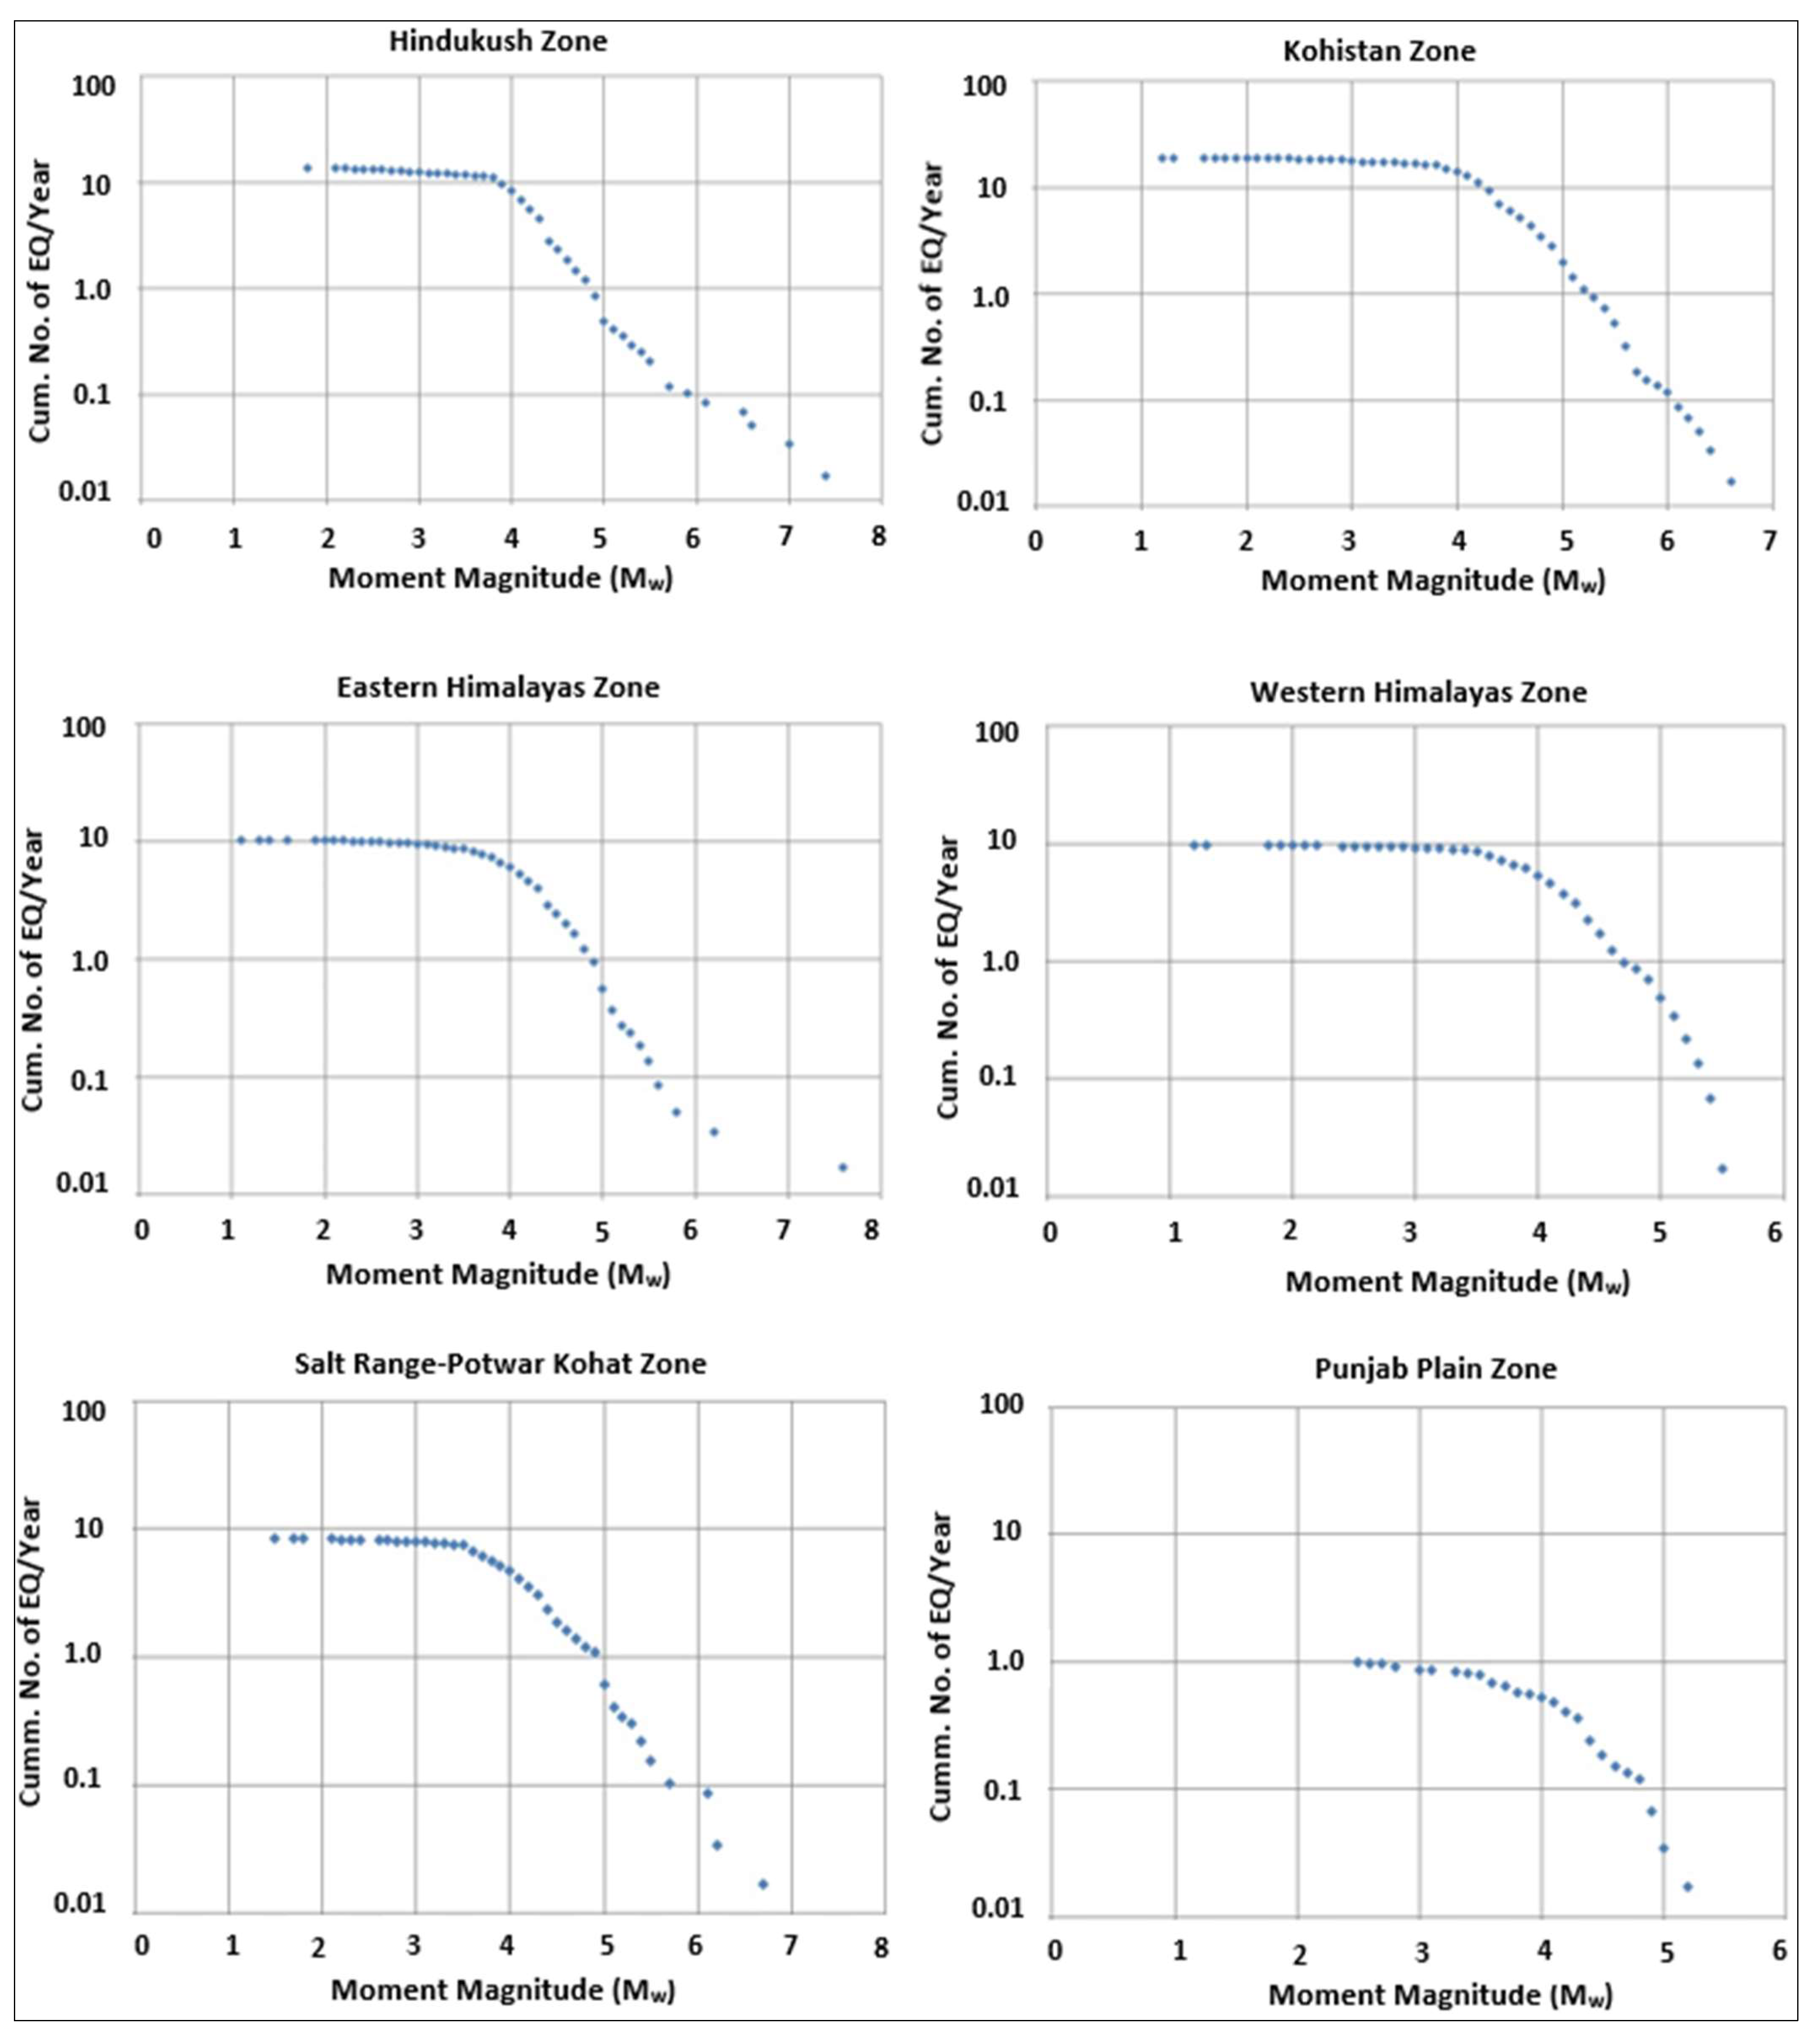
3.2.1. Hindukush Seismic Zone
3.2.2. Kohistan Seismic Zone
3.2.3. Eastern Himalayas Zone
3.2.4. Western Himalayas Zone
3.2.5. Salt Range-Potwar Kohat
3.2.6. Punjab Plain Zone
3.3. Modelling Earthquake Recurrence
3.4. Ground Motion Prediction Equations (GMPEs)
3.5. Microtremor Analysis
4. Results and Discussions
5. Conclusions
Author Contributions
Funding
Institutional Review Board Statement
Informed Consent Statement
Data Availability Statement
Conflicts of Interest
References
- Sajjad, S.H.; Waheed, S.A.; Khan, T.; Qadri, S.M.T.; Gilani, N. Natural Hazards and related contents in curriculum of Geography in Pakistan. Asian J. Nat. Appl. Sci. 2014, 3, 40–48. [Google Scholar]
- Chen, Z.; Burchfiel, B.C.; Liu, Y.; King, R.W.; Royden, L.H.; Tang, W.; Wang, E.; Zhao, J.; Zhang, X. Global positioning system measurements from eastern Tibet and their implications for India/Eurasia intercontinental deformation. J. Geophys. Res. 2000, 105, 16215–16228. [Google Scholar] [CrossRef]
- Apel, E.; Bürgmann, R.; Banerjee, P.; Nagarajan, B. Geodetically constrained Indian Plate motion and implications for plate boundary deformation, EOS, Transactions American Geophysical Union. Fall Meet. Suppl. 2006, 85, T51B-1524. [Google Scholar]
- Qadri, S.M.T.; Malik, O.A. Establishing site response based Microzonation by applying machine learning techniques on ambient noise data: A case study from Northern Potwar Region, Pakistan. Environ. Earth Sci. 2021, 80, 53. [Google Scholar] [CrossRef]
- Khaliq, A.H.; Waseem, M.; Khan, S.; Ahmed, W.; Khan, M.A. Probabilistic seismic hazard assessment of Peshawar District, Pakistan. J. Earth Syst. Sci. 2019, 128, 6. [Google Scholar] [CrossRef]
- BCP-SP 07; Building Code of Pakistan. Ministry of Housing. Islamic Republic of Pakistan: Islamabad, Pakistan, 2007.
- MonaLisa; Khwaja, A.A.; Jan, M.Q. Seismic hazard assessment of the NW Himalayan fold-and-thrust belt, Pakistan, using probabilistic approach. J. Earthq. Eng. 2007, 11, 257–301. [Google Scholar] [CrossRef]
- MonaLisa Khan, S.A.; Khwaja, A.A. Focal Mechanism Studies of North Potwar Deformed Zone (NPDZ), Pakistan. Acta Seism. Sin. China 2004, 17, 255–261. [Google Scholar]
- Shah, A.A.; Qadri, S.M.T. Segmentation of Main Boundary Thrust and Main Central Thrust in Western Himalaya for assessment of seismic Hazard by Mridula Nat Hazards (2016) 84:383–403. Nat. Hazards 2017, 87, 1245–1249. [Google Scholar] [CrossRef]
- Shah, A.A.; Qadri, T.; Khwaja, S. Living with earthquake hazards in South and Southeast Asia. ASEAN J. Commun. Engag. 2018, 2, 15–37. [Google Scholar] [CrossRef]
- Waseem, M.; Khan, S.; Khan, M.A. Probabilistic Seismic Hazard Assessment of Pakistan Territory Using an Areal Source Model. Pure Appl. Geophys. 2020, 177, 3577–3597. [Google Scholar] [CrossRef]
- Yaghmaei-Sabegh, S.; Pavel, F.; Shahvar, M.; Qadri, S.M.T. Empirical frequency content models based on intermediate-depth earthquake ground-motions. Soil Dyn. Earthq. Eng. 2021, 155, 107173. [Google Scholar] [CrossRef]
- Rahman, A.u.; Najam, F.A.; Zaman, S.; Rasheed, A.; Rana, I.A. An updated probabilistic seismic hazard assessment (PSHA) for Pakistan. Bull. Earthq. Eng. 2021, 19, 1625–1662. [Google Scholar] [CrossRef]
- Qadri, S.M.T.; Nawaz, B.; Sajjad, S.H.; Sheikh, R.A. Ambient noise H/V spectral ratio in site effects estimation in Fatehjang area Pakistan. Earthq. Sci. 2015, 28, 87–95. [Google Scholar] [CrossRef]
- Qadri, S.M.T.; Sajjad, S.H.; Sheikh, R.A.; Rehman, K.; Rafi, Z.; Nawaz, B.; Haider, W. Ambient noise measurements in Rawalpindi–Islamabad, twin cities of Pakistan: A step towards site response analysis to mitigate impact of natural hazard. Nat. Hazards 2015, 78, 1111–1123. [Google Scholar] [CrossRef]
- Khan, S.; Khan, M.A. Mapping sediment thickness of Islamabad city using empirical relationships: Implications for seismic hazard assessment. J. Earth Syst. Sci. 2016, 125, 623–644. [Google Scholar] [CrossRef]
- Khan, S.; Khan, M.A. Seismic Microzonation of Islamabad-Rawalpindi Area, Pakistan. Pure Appl. Geophys. 2018, 175, 149–164. [Google Scholar] [CrossRef]
- Khan, S.; Waseem, M.; Khan, M.A. Seismic Hazard Map Based on Geology and Shear Wave Velocity of Rawalpindi-Islamabad, Pakistan. Acta Geol. Sin. 2020, 95, 659–673. [Google Scholar] [CrossRef]
- Maqsoom, A.; Aslam, B.; Khalil, U.; Kazmi, Z.A.; Azam, S.; Mehmood, T.; Nawaz, A. Landslide susceptibility mapping along the China Pakistan Economic Corridor (CPEC) route using multi-criteria decision making method. Model Earth Syst. Environ. 2021, 7, 1519–1533. [Google Scholar] [CrossRef]
- Khan, M.Y.; Turab, S.A.; Ali, L.; Shah, M.T.; Qadri, S.M.T.; Latif, K.; Kanli, A.I.; Akhter, M.G. The dynamic response of coseismic liquefaction-induced ruptures associated with the 2019 Mw 5.8 Mirpur, Pakistan, earthquake using HVSR measurements. Lead Edge. 2021, 40, 590–600. [Google Scholar] [CrossRef]
- Shah, A.A.; Sahari, S.; Navakanesh, B.; Nurhafizah, A.M.; Fui, F.; Ashwini, R.; Talha, Q. Tectonic geomorphology of the Jhelum fault zone & its contiguous regions in western Himalaya. Bull. Geol. Soc. Malays. 2022, 73, 119–138. [Google Scholar]
- Qadri, S.M.T.; Shah, A.A.; Sahari, S.; Raja, A.; Yaghmaei-Sabegh, S.; Khan, M.Y. Tectonic Geomorphology-Based Modeling Reveals Dominance of transpression in Taxila and the Contiguous Region in Pakistan: Implications for Seismic Hazards. Model. Earth Syst. Environ. 2022, in press. [Google Scholar] [CrossRef]
- Khan, S.; Waseem, M.; Khalid, S.; Kontoni, D.P.N.; Ahmad, M.; Keawsawasvong, S. Fuzzy Clustering Analysis of HVSR Data for Seismic Microzonation at Lahore City. Shock. Vib. 2022, 2022, 3109609. [Google Scholar] [CrossRef]
- Cornell, C.A. Engineering seismic risk analysis. Bull. Seism. Soc. Am. 1968, 58, 1583–1606. [Google Scholar] [CrossRef]
- Reiter, L. Earthquake Hazard Analysis, Issues and Insights; Columbia University Press: New York, NY, USA, 1990. [Google Scholar]
- Nath, S.K.; Thingbaijam, K.K.S. Seismic hazard assessment—A holistic microzonation approach. Nat. Hazards Earth Syst. Sci. 2009, 9, 1445–1459. [Google Scholar] [CrossRef]
- Qadri, S.M.T.; Islam, A.; Shalaby, M.R.; Khattak, K.R.; Sajjad, S.H. Characterizing site response in the Attock Basin, Pakistan, using microtremor measurement analysis. Arab. J. Geosci. 2017, 10, 267. [Google Scholar] [CrossRef]
- Qadir, A.; Tufail, M.; Qadir, A.; Khandaker, M.U. Indoor radon concentration in hydrocarbon and non-hydrocarbon pertaining areas across the Main Boundary Thrust in Attock district of Pakistan. Indoor Built Environ. 2016, 25, 838–847. [Google Scholar] [CrossRef]
- Jabeen, S. Environmental Geochemistry of Attock and Haripur Basins, Pakistan. Ph.D. Thesis, University of Peshawar, Peshawar, Pakistan, 2013. [Google Scholar]
- Yeats, R.S.; Hussain, A. Timing of structural events in the Himalayan foothills of north-western Pakistan. Geol. Soc. Am. Bull. 1987, 99, 161–176. [Google Scholar] [CrossRef]
- Armbruster, J.; Seeber, L.; Jacob, K.H. The northern termination of the Himalayan mount front: Active tectonics from microearthquakes. J. Geophys. Res. 1978, 83, 269–282. [Google Scholar] [CrossRef]
- Cotter, G.P. The geology of the part of the Attock district west of longitude 72°45′ E. Mem. Geol. Surv. India 1933, 55, 63–161. [Google Scholar]
- Pivinik, D.A.; Johnson, G.D. Depositional response to Pliocene-Pliestcene foreland portioning in northwest Pakistan. Bull. Geol. Soc. Am. 1995, 107, 895–922. [Google Scholar] [CrossRef]
- Fatmi, A.N. Lithostratigraphic units of Kohat-Potwar Province, Indus Basin Pakistan. Geol. Surv. Pak. Mem. 1973, 10, 1–80. [Google Scholar]
- McGuire, R.K. Fortran Computer Program for Seismic Risk Analysis; Open-File Report Series 76-67; US Geological Survey: Reston, VA, USA, 1976; p. 90. [Google Scholar]
- Oldham, T. A catalogue of Indian Earthquakes. Mem. Geol. Surv. India 1893, 19, 163–215. [Google Scholar]
- Quittmeyer, R.C.; Jacob, K.H. Historical and modern seismicity of Pakistan, Afghanistan, northwestern India and southeastern Iran. Bull. Seismol. Soc. Am. (BSSA) 1979, 69, 773–823. [Google Scholar]
- Ambraseys, N.; Bilham, R. Earthquakes and associated deformation in northern Baluchistan 1892–2001. Bull. Seismol. Soc. Am. 2003, 93, 1573–1605. [Google Scholar] [CrossRef]
- Ambraseys, N.; Bilham, R. The Tectonic Setting of Bamiyan and Seismicity in and Near Afghanistan for the Past Twelve Centuries. In After the Destruction of Giant Buddha Statues in Bamiyan (Afghanistan) in 2001. Natural Science in Archaeology; Margottini, C., Ed.; Springer: Berlin/Heidelberg, Germany, 2014. [Google Scholar] [CrossRef]
- Scordilis, E.M. Empirical global relations converting Ms and m b to moment magnitude. J. Seismol. 2006, 10, 225–236. [Google Scholar] [CrossRef]
- Gardner, J.K.; Knopoff, L. Is the sequence of earthquakes in southern California, with aftershocks removed, Poissonian? Bull. Seismol. Soc. Am. 1974, 64, 1363–1367. [Google Scholar] [CrossRef]
- Li, C.; Peng, Z.; Yao, D.; Guo, H.; Zhan, Z.; Zhang, H. Abundant aftershock sequence of the 2015 Mw7.5 Hindu Kush intermediate-depth earthquake. Geophys. J. Int. 2018, 213, 1121–1134. [Google Scholar] [CrossRef]
- Sippl, C.; Schurr, B.; Yuan, X.; Mechie, J.; Schneider, F.; Gadoev, M.; Orunbaev, S. Geometry of the Pamir-Hindu Kush intermediate depth earthquake zone from local seismic data. J. Geophys. Res. 2013, 118, 1438–1457. [Google Scholar] [CrossRef]
- Ni, J.; Ibenbrahim, A.; Rocker, S.W. 3 Dimensional velocity structure and hypocenters of earthquakes beneath the Hazara arc, Pakistan: Geometry of the underthrusting Indian plate. J. Geophys. Res. 1991, 96, 865–877. [Google Scholar] [CrossRef]
- Dasgupta, S.; Mukhopadhyay, B.; Mukhopadhyay, M.; Pande, P. Geo- and seismo- tectonics of Eastern Himalaya: Exploring earthquake source zones from foredeep to Tibetan hinterland. Phys. Chem. Earth. Parts A/B/C 2021, 123, 103013. [Google Scholar] [CrossRef]
- Ambraseys, N.; Bilham, R. A note on the Kangra Ms = 7.8 earthquake of 4 April 1905. Curr. Sci. 2000, 79, 45–50. [Google Scholar]
- Williams, V.S.; Pasha, M.K.; Sheikh, I.M. Geologic Map of the Islamabad–Rawalpindi Area, Punjab, Northern Pakistan; US Geological Survey Open-File Report 99–0047; US Geological Survey: Reston, VA, USA, 1999; p. 16. Available online: https://pubs.usgs.gov/of/1999/0047/report.pdf (accessed on 15 November 2022).
- MonaLisa; Jan, M.Q. 8 August 2010, Sheikhupura, Pakistan earthquake: Seismotectonic investigation using focal mechanism solution and gravity data. Nat. Hazards 2012, 64, 397–403. [Google Scholar] [CrossRef]
- Farah, A.; Mirza, M.A.; Ahmad, M.A.; Butt, M.H. Gravity field of the buried shield in the Punjab Plain, Pakistan. Geol. Soc. Am. Bull. 1977, 88, 1147–1155. [Google Scholar] [CrossRef]
- Anbazhagan, P.; Bajaj, K.; Matharu, K.; Moustafa, S.S.R.; Al Arifi, S.N.S. Probabilistic Seismic Hazard Analysis Using Logic Tree Approach Patna District (India). Nat. Hazards Earth Syst. Sci. Discuss. 2019, 19, 2097–2115. [Google Scholar] [CrossRef]
- Abrahamson, N.A.; Silva, W.J.; Kamai, R. Summary of the ASK14 ground-motion relation for active crustal regions. Earthq. Spectra. 2014, 30, 1025–1055. [Google Scholar] [CrossRef]
- Boore, D.M.; Stewart, J.P.; Seyhan, E.; Atkinson, G.M. NGA-West2 equations for predicting PGA, PGV, and 5% damped PSA for shallow crustal earthquakes. Earthq. Spectra 2014, 30, 1057–1085. [Google Scholar] [CrossRef]
- Campbell, K.W.; Bozorgnia, Y. NGA-West2 Ground Motion Model for the Average Horizontal Components of PGA, PGV, and 5%-Damped Linear Acceleration Response Spectra. Earthq. Spectra 2014, 30, 1087–1115. [Google Scholar] [CrossRef]
- Bommer, J.J.; Douglas, J.; Scherbaum, F.; Cotton, F.; Bungum, H.; Fah, D. On the selection of ground-motion prediction equations for seismic hazard analysis. Seismol. Res. Lett. 2010, 81, 783–793. [Google Scholar] [CrossRef]
- Zhao, J.X.; Zhang, J.; Asano, A.; Ohno, Y.; Oouchi, T.; Takahashi, T.; Ogawa, H.; Irikura, K.; Thio, H.K.; Somerville, P.G.; et al. Attenuation relations of strong ground motion in Japan using site classification based on predominant period. Bull. Seismol. Soc. Am. 2006, 96, 898–913. [Google Scholar] [CrossRef]
- Fugro. EZ-FRISK™-Software for In-Depth Seismic Hazard Analysis, User’s Manual; Fugro USA Land, Inc.: Walnut Creek, CA, USA, 2015. [Google Scholar]
- SESAME. Guidelines for the Implementation of the H/V Spectral Ratio Technique on Ambient Vibrations: SESAME, European Project, WP12, Deliverable D23.12. 2004. Available online: http://sesame.geopsy.org/Papers/HV_User_Guidelines.pdf (accessed on 15 November 2022).
- Dunand, F.; Bard, P.; Chatelain, J.-L.; Guéguen, P.; Vassail, T.; Farsi, M. Damping and frequency from Randomdec method applied to in situ measurements of ambient vibrations: Evidence for effective soil structure interaction. In Proceedings of the 12th European Conference on Earthquake Engineering, London, UK, 9–13 September 2002; p. 869. [Google Scholar]
- Mohammed, M.A.; Abudeif, A.M.; Omar, K.K.; Attia, M.M. Estimation of site effect using microtremor technique at 15th May City, Helwan, Egypt. Arab. J. Geosci. 2018, 11, 16. [Google Scholar] [CrossRef]
- Wathelet, M.; Chatelain, J.L.; CCornou, C.; Giulio, G.D.; Guillier, B.; Ohrnberger, M.; Savvaidis, A. Geopsy: A User-Friendly OpenSource Tool Set for Ambient Vibration Processing. Seismol. Res. Lett. 2020, 91, 1878–1889. [Google Scholar] [CrossRef]
- Mohamed, A.; Ali, S.M.; Mostafa, A. Estimation of seismic site effect at the new Tiba City proposed extension, Luxor, Egypt. NRIAG J. Astron. Geophys. 2020, 9, 499–511. [Google Scholar] [CrossRef]


| Zone No. | Seismic Source Zone | No. of Earthquakes above Min. Magnitude | Minimum Magnitude (Mw) | Activity Rate /Year | b-Value | Maximum Magnitude (Mw) |
|---|---|---|---|---|---|---|
| 1 | Hindukush | 488 | 4 | 8.3 | 0.85 | 8.0 |
| 2 | Kohistan | 649 | 4.2 | 11 | 1.18 | 7.8 |
| 3 | Eastern Himalayas | 315 | 4.1 | 5.34 | 1.18 | 8.1 |
| 4 | Western Himalayas | 319 | 4 | 5.41 | 1.26 | 7.5 |
| 5 | Salt Range-Potwar-Kohat | 280 | 4.1 | 4.80 | 0.95 | 7.0 |
| 6 | Punjab Plain | 28 | 4.1 | 0.47 | 1.27 | 6.0 |
| Site No. | Latitude and Longitude | f0 | A0 | Kg |
|---|---|---|---|---|
| 1 | 33°47′26.6″ N 72°25′07.7″ E & 33.790716, 72.418794 | 7.9 | 2.1 | 0.6 |
| 2 | 33°47′20.6″ N 72°24′19.7″ E & 33.789064, 72.405479 | 6.1 | 1.4 | 0.3 |
| 3 | 33°46′27.9″ N 72°24′09.3″ E & 33.774424, 72.402587 | 8.2 | 1.4 | 0.24 |
| 4 | 33°46′59.9″ N 72°23′00.3″ E & 33.783291, 72.383413 | 1.4 | 4.2 | 12.6 |
| 5 | 33°45′59.9″ N 72°23′31.4″ E & 33.766649, 72.392059 | 0.6 | 2.3 | 9 |
| 6 | 33°47′15.4″ N 72°22′01.0″ E & 33.787618, 72.366939 | 0.7 | 2.5 | 9 |
| 7 | 33°46′42.2″ N 72°22′09.2″ E & 33.778390, 72.369215 | 1.0 | 2.95 | 8.7 |
| 8 | 33°46′26.3″ N 72°22′46.8″ E & 33.773979, 72.379663 | 1.2 | 3.1 | 8.0 |
| 9 | 33°46′55.5″ N 72°21′18.9″ E & 33.782076, 72.355248 | 0.85 | 2.8 | 9.6 |
| 10 | 33°46′16.7″ N 72°21′33.7″ E & 33.771317, 72.359348 | 0.8 | 3.9 | 20 |
| 11 | 33°45′27.3″ N 72°21′30.4″ E & 33.757576, 72.358449 | 1.3 | 3.0 | 7.0 |
| 12 | 33°45′26.9″ N 72°22′24.4″ E & 33.757468, 72.373439 | 0.7 | 2.93 | 12.2 |
| 13 | 33°46′34.0″ N 72°20′22.6″ E & 33.776111, 72.339614 | 2.7 | 2.3 | 2.0 |
| 14 | 33°46′02.0″ N 72°20′24.0″ E & 33.767217, 72.339999 | 2.9 | 2.3 | 1.8 |
| 15 | 33°45′15.9″ N 72°20′48.5″ E & 33.754403, 72.346805 | 2.3 | 2.3 | 2.3 |
| 16 | 33°44′51.0″ N 72°21′28.0″ E & 33.747486, 72.357787 | 2.3 | 2.7 | 3.2 |
| 17 | 33°47′03.0″ N 72°19′27.5″ E & 33.784168, 72.324317 | 9.0 | 2.5 | 0.7 |
| 18 | 33°46′17.0″ N 72°19′39.3″ E & 33.771380, 72.327579 | 6.4 | 2.0 | 0.6 |
| 19 | 33°45′40.7″ N 72°19′34.9″ E & 33.761298, 72.326347 | 6.9 | 2.5 | 0.9 |
| 20 | 33°46′20.3″ N 72°18′39.5″ E & 33.772308, 72.310957 | 7.2 | 2.4 | 0.8 |
Disclaimer/Publisher’s Note: The statements, opinions and data contained in all publications are solely those of the individual author(s) and contributor(s) and not of MDPI and/or the editor(s). MDPI and/or the editor(s) disclaim responsibility for any injury to people or property resulting from any ideas, methods, instructions or products referred to in the content. |
© 2023 by the authors. Licensee MDPI, Basel, Switzerland. This article is an open access article distributed under the terms and conditions of the Creative Commons Attribution (CC BY) license (https://creativecommons.org/licenses/by/4.0/).
Share and Cite
Qadri, S.M.T.; Mirza, M.Q.; Raja, A.; Yaghmaei-Sabegh, S.; Hakimi, M.H.; Ali, S.H.; Khan, M.Y. Application of Probabilistic Seismic Hazard Assessment to Understand the Earthquake Hazard in Attock City, Pakistan: A Step towards Linking Hazards and Sustainability. Sustainability 2023, 15, 1023. https://doi.org/10.3390/su15021023
Qadri SMT, Mirza MQ, Raja A, Yaghmaei-Sabegh S, Hakimi MH, Ali SH, Khan MY. Application of Probabilistic Seismic Hazard Assessment to Understand the Earthquake Hazard in Attock City, Pakistan: A Step towards Linking Hazards and Sustainability. Sustainability. 2023; 15(2):1023. https://doi.org/10.3390/su15021023
Chicago/Turabian StyleQadri, S. M. Talha, M. Qasim Mirza, Afia Raja, Saman Yaghmaei-Sabegh, Mohammed Hail Hakimi, Syed Haroon Ali, and Mohammad Younis Khan. 2023. "Application of Probabilistic Seismic Hazard Assessment to Understand the Earthquake Hazard in Attock City, Pakistan: A Step towards Linking Hazards and Sustainability" Sustainability 15, no. 2: 1023. https://doi.org/10.3390/su15021023
APA StyleQadri, S. M. T., Mirza, M. Q., Raja, A., Yaghmaei-Sabegh, S., Hakimi, M. H., Ali, S. H., & Khan, M. Y. (2023). Application of Probabilistic Seismic Hazard Assessment to Understand the Earthquake Hazard in Attock City, Pakistan: A Step towards Linking Hazards and Sustainability. Sustainability, 15(2), 1023. https://doi.org/10.3390/su15021023