Article

Improved Prediction Model and Utilization of Pump as Turbine for Excess Power Saving from Large Pumping System in Saudi Arabia

by
Zeyad Al-Suhaibani
1,2,
Syed Noman Danish
2,3,*,
Ziyad Saleh Al-Khalaf
1 and
Basharat Salim
1
1
Mechanical Engineering Department, King Saud University, P.O. Box 800, Riyadh 11421, Saudi Arabia
2
K.A.CARE Energy Research and Innovation Center at Riyadh, King Saud University, P.O. Box 800, Riyadh 11421, Saudi Arabia
3
Sustainable Energy Technologies Center, King Saud University, P.O. Box 800, Riyadh 11421, Saudi Arabia
*
Author to whom correspondence should be addressed.
Sustainability 2023, 15(2), 1014; https://doi.org/10.3390/su15021014
Submission received: 17 November 2022 / Revised: 26 December 2022 / Accepted: 30 December 2022 / Published: 5 January 2023
(This article belongs to the Special Issue Smart Grid Technologies and Renewable Energy Applications)

Abstract

:
The throttling process is frequently encountered in many industrial practices utilizing Pressure Reducing Valves (PRVs). This process is typically used to control pressure and flow in pipeline networks. The practice of utilizing PRVs is considered simple and cheap in terms of installation cost and control. It dissipates the excess fluid energy that can be used for other purposes. This paper studies the feasibility of utilizing the Pump as Turbine (PAT) concept to partially recover the excess power dissipated from PRVs located at the discharge lines of refined product shipping pumps at one of the hydrocarbon distribution facilities in Saudi Arabia. Multiple PAT installation layouts have been studied to achieve this goal, selecting the optimum option to maximize the power recovery. The final selection of PAT was conducted to achieve a reasonable payback period. A new method for predicting the pump performance in reverse mode was developed depending on the manufacturer’s pump performance curves. The comparison of the proposed model with experimental data and previous models for three modes of operation reveals that the proposed model in this paper’s results either have the minimum deviation or the second minimum deviation out of all models. In the case of flow ratio prediction, the predicted deviation is merely 3.83%, −1.14%, and 1.35% in three modes of operation. For power prediction, the proposed model is the best and the only reliable model out of all with the least deviation of −7.48%, 0.07%, and −3.16% in three modes of operation. The economic analysis reveals the Capital Payback Time (CPP) for five optimum PATs is around 5 years. The new method was also validated against previous models showing more precise performance prediction of multistage centrifugal pumps running in turbine mode.

1. Introduction

Almost all aspects of human and commercial activities depend heavily on energy. In many industrial applications, several operational modes have a huge potential for energy losses [1]. In light of this, even though it is receiving considerable attention, the significant value of recovering extra energy in modern industrial process applications is not being given the attention it merits. A significant amount of energy is lost during the throttling process, which is a necessary component of many industrial process applications [2]. Many water utilities have implemented a pressure control policy in recent years to manage the Water Distribution System (WDS) by installing Pressure Reducing Valves (PRVs) [3]. From an energy perspective, these PRVs lose pressure energy and introduce a localized head loss into the system, which goes against the idea of energy conservation. As a result, in recent years, the use of conventional hydraulic turbines or Pumps operating as Turbines (PATs) concepts has been demonstrated to be a sustainable solution for handling Water Distribution Networks (WDNs) by combining leakage reduction and pressure control with hydropower generation.
Knowing the operation of a centrifugal pump, PAT is a standard centrifugal pump, similar to a Francis turbine that lacks a flow control device, in which a centrifugal pump transforms the mechanical work of the impeller into water’s kinetic energy and pressure energy. On the other hand, a Francis turbine transforms water’s kinetic and pressure energy into a runner’s mechanical energy. Since pumps have been widely available in most emerging economies since 1930 and are very inexpensive and use simple equipment with low maintenance costs, several studies have looked into the idea of using pumps in the reverse mode as hydraulic turbines. This idea is known as PAT, and the literature that follows makes it obvious that using it can be thought of as a good substitute for traditional hydraulic turbines for power recovery applications.
The PAT concept and operation have been investigated by many authors. Thoma [4] initially demonstrated that pumps can function well in reverse mode as turbines in 1931 when mapping the complete operational characteristics of a centrifugal pump [5]. Derakhshan and Nourbakhsh [6] tested four industrial centrifugal pumps. These pumps could deliver up to 30 kW of input power, 25 m of the head, and 0.15 m3/s of flow. The experiments unmistakably demonstrated that there are no mechanical issues when using a centrifugal pump as a turbine with various rotational speeds, heads, and flow rates. Additionally, relationships were created using experimental data in order to forecast the Best Efficiency Point (BEP) for a number of centrifugal pumps with low specific speeds (Ns < 60). The Method of Characteristics (MOC) was used to forecast the water head and flow rate in WDN, and Marchis et al. [1] examined the potential energy recovery using PAT in WDN by establishing a numerical model that could replicate the PATs analyzed by Derakhshan and Nourbakhsh [6]. The proposed numerical model was adopted on one of the seventeen distribution networks of Italy (Palermo city). In order to determine the best option for energy production without sacrificing the hydraulic performance of the network, the study examined four distinct scenarios using PATs at various WDN locations. The investigation revealed that installing PATs in pipes adjacent to the water supply node can result in a desirable Capital Payback Time (CPP) of 2.5 years.
In order to replace PRVs in water supply networks, Lima et al. [7] developed a new approach for choosing PATs. The strategy focuses on increasing energy production while keeping system pressure restrictions in mind. Particle Swarm Optimization (PSO) was employed to solve the selection problem, while complete pump curves were used to simulate the PATs. Where the PATs should be deployed on the network might be determined using the provided method. A four loops laboratory WDN was used in an experiment by Pugliese et al. [8]. At the inlet node in southern Italy, Carravetta et al. [9] completed a small hydropower project of a really large water distribution network. The head dissipation was necessary to produce the optimal pressure distribution in the network at that node. As a result, it was advised to set up two different PATs (A and B) at that node. A rough estimate of 592.5 kWh per day was found to be the computed theoretical energy consumption. Nevertheless, PAT (A) was able to convert 47.8% of the available energy at 1250 RPM, while PAT (B) was only able to do so at 1450 RPM. The analysis suggests that adding small hydropower plants can have interesting economic advantages and should be taken into account as a viable choice in a network’s optimal design.
In their comprehensive literature review of PAT, Binama et al. [10] discussed technical issues such as PAT selection, performance prediction, and flow stability. According to some findings from the literature research, axial flow PATs work best at sites with low heads and high flow rates, while multistage radial flow PATs fit sites with high heads and low flow rates. In contrast, Danish et al. [11] and Sharma [12] claim that all centrifugal pumps, regardless of whether they have a single- or multistage configuration, are radially or axially split, require horizontal or vertical installation, are in-line, or have double suction capabilities, can be employed in reverse mode. Yang et al. [13] carried out theoretical, computational, and experimental investigations to anticipate PAT performance. First, utilizing theoretical analysis and empirical correlations, the relationship between pump and PAT performance was examined theoretically. The performance of a single-stage centrifugal pump was predicted using Computational Fluid Dynamics (CFD) models in both direct and reverse modes in the next phase. However, the pump was constructed and put through testing on a PAT open test rig to confirm the reliability of theoretical and numerical prediction methodologies. In terms of head and flow ratios, both theoretical and numerical calculations demonstrated a relatively strong agreement with their two modes of experimental data.
A single-stage centrifugal pump was put to the test by Stefanizzi et al. [14] in both direct and reverse modes. The mechanics, mathematics, and management department at the Polytechnic University of Bari built a closed-loop test rig for pumps and turbines, which was used by the researchers. Researchers created new correlations to forecast turbine mode performance at BEP, which mostly depend on the pump-specific speed during pump mode. Giosio et al. [5] created a turbine based on PAT theory, employing an off-the-shelf pump impeller in a bespoke casing. A power of 6.2 kW was produced, and experimental testing in the steady state across the whole operating range revealed a maximum overall efficiency of 79%, which is well in line with PAT theory. Using PAT, Du et al. [15] looked at the production of micro-hydropower from high-rise buildings’ water supply systems. Based on the supplied working conditions in one typical high-rise building in Hong Kong, empirical formulae were used to determine PAT initially. In order to evaluate the performance of the chosen PAT, CFD modeling and laboratory experiments were conducted. Both the simulated and measured results demonstrate that the chosen PAT is practical for power production and water head reduction.
Using CFD models, Buono et al. [16] and Frosina et al. [17] verified the operation of the pump and PAT. When the outcomes were compared to the pump manufacturer’s data sheet, the model was able to validate the pump operation. By comparing the findings to the specific experimental outcomes in a full-scale hydraulic network, the model was validated for PAT mode. To forecast pump performance in turbine mode, researchers Nautiyal et al. [18], Stepanoff [19], Childs [20], Sharma [21], Yang et al. [13], and Alatorre and Thomas [22] created models and correlations.
Williams [23] examined eight different prediction techniques using 35 pumps in his comparison analysis. All of the assessed approaches were unreliable, but Sharma’s [21] method performed the best overall and is hence the most strongly advised. Additionally, it was advised that in order to confirm the validity of theoretical prediction methods during PAT installation, experimental ones should be used alongside them. In three case studies of PRVs in the WDN of Dublin, Ireland, Lydon et al. [24] described the design and selection procedures for PAT to recover energy and regulate the pressure. The findings of this study show that a PAT can convert up to 40% of the total power potential of an existing PRV into electrical energy while simultaneously managing pressure. Reversing the action of a stainless steel pump was studied by Kramer et al. Data on the pump’s characteristics were gathered in turbine mode at various speeds. It was determined that experimental investigations are still necessary if precise information on the properties of a turbine is needed for design purposes.
For choosing PAT in micro-hydroplants, Barbarelli et al. [25] suggested a hybrid strategy utilizing statistical and numerical models. Motwani et al. [26] conducted a cost analysis of a 3 kW pico-hydropower project taking into account PAT and Francis turbine. Results indicate that Francis turbines can achieve up to 80% total efficiency, compared to PAT’s maximum efficiency of about 60%. The cost of the Francis turbine, however, may be 6–8 times more in the pico-hydro range than the centrifugal pump. Patelis et al.’s [27] investigation of the potential for a PAT to take the place of a PRV in a genuine water distribution network. The goal of the project was to see whether PAT could create a large quantity of energy as well as reduce pressure to acceptable levels. The results of the case study network using the water distribution system of Kozani City indicate that the adoption of PAT can be a good replacement for the PRV. A brand new strategy for choosing PAT in the water supply network was put forth by Lima et al. [28]. The approach is centered on increasing the benefit embodied in the produced energy and decreasing the leakage volume. They used a set of comprehensive characteristic curves for pumps that were published in the literature [29]. The simulation of the network using the chosen machine reveals that the amount of energy produced is dependent on the flow rate via the chosen PAT, with low flow producing no energy. As a result, using more PAT during the night is necessary to recover energy during low-flow hours.
Derakhshan and Nourbakhsh [30] used a theoretical analysis to determine the optimal efficiency point of an industrial centrifugal pump operating as a turbine. By using direct pump mode, the study’s calculations attempted to predict the hydraulic components of the reverse turbine mode. Complete characteristic curves for the pump and PAT were generated using numerical results. The pump was put through a test rig as a turbine for experimental verification. Experimental data and various approaches were compared to the theoretical and numerical findings. While numerical findings were not in an acceptable level of agreement with experimental data for turbine mode, CFD results for pump mode were found to be in good agreement with those data not only at the best efficiency point but also in part-load and overload zones.
The literature review reveals that the concept of PAT is thoroughly investigated by the researchers; however:
  • It was never introduced to the refined product industry as presented here.
  • The models proposed in the literature are extensive but their accuracy and percentage deviation from the experimental data are higher in different modes and applications. It is the need of the day to develop a new model which predicts the PAT performance with better accuracy.
  • None of the models proposed in the literature are able to predict the power output of the PAT. A new model is needed which is able to predict the power output correctly while predicting the other performance parameters closely.
This paper is an endeavor to fill this research gap.
The current practice in the studied facility in Saudi Arabia utilizes PRVs as the only method to control a 16-inch refined product pipeline pressure and flow rates. However, this pumping facility has no other means of control, such as Variable Frequency Drivers (VFDs) for the existing pumps, conventional hydraulic turbines, or PATs, to control the pumping energy or recover it. Therefore, the proposed system layout in this research will ensure meeting the facility operating parameters without compromising the system performance. The proposed system will also target a considerable payback period for such capital investments. The average opening percentage of the installed PRVs in the studied facility ranges between 65–75%, whereas the remaining valve-designed operating percentage of 25–35% dissipates the pumping energy by means of throttling. The authors’ attention is attracted by the yearly average power consumption cost due to its higher value in terms of electrical power consumption which could affect the facility’s energy efficiency. The average yearly power consumption is about 29 GWh, which requires USD 2.32 M only for operating this pumping facility. The cost of power dissipation due to PRVs utilization is theoretically around USD 0.66 M per year, which represents 28.5% of the total cost. Consequently, these high consumptions and power dissipation made the power recovery concept feasible and worthy of investigation.

2. Methodology

The main objective of this research is to come up with the most efficient selection to recover the dissipated power across the installed PRVs. In order to comprehend the performance of the pump in reverse mode, the research will be expanded to provide a novel prediction methodology.

2.1. The Facility Layout

The studied pumping facility is designed to continuously pump refined products (Diesel oil, Premium Gasoline 91 and Super Premium Gasoline 95) with specific gravities ranging from 0.70 to 0.85 and operating temperature of 20–50⁰C. The layout of the facility is shown in Figure 1. The facility consists of three electrically driven Flowserve 12QL-18 [31] vertical multistage booster-pumps installed in parallel. These booster-pumps are connected to a 20-inch carbon steel common suction line supplying refined products directly from the tank farm area. Subsequently, a 20-inch carbon steel common discharge line downstream of the three booster-pumps feeds three electrically driven Flowserve 8X13-DMX [31] axial-split six-stage shipper-pumps installed also in parallel. The shipper-pumps are steadily supplied by an available Net-Positive Suction Head (NPSH) of 75 m coming from the upstream booster-pumps. After that, each shipper-pump is discharged through a 12-inch carbon steel discharge line fitted with an 8-inch PRV before combining all into one 16-inch common line downstream and extended over 331 km up to the receiving plant. The operating parameters of the pumps are summarized in Table 1, which are taken from Saudi Arabia’s pumping facility.
Different operating modes of the studied pumping facility are listed in Table 2 based on the bulk plant product demands.

2.2. Pumping Cost

Average power consumption by the pumps may be calculated as [32]:
P a v g = 3 . I a v g . V . P F
where
Pavg = Average power consumption of the equipment (W).
Iavg = Equipment average electrical current (A).
V = Voltage (V).
PF = Power factor.
Once the total power consumption of all the pumps is calculated, the pumping cost may be calculated as:
Cost   of   Pumping   ( U S D ) = P T o t a l . C C R . t . D 3.75
where
PTotal = Total power consumption by all the pumps under consideration in any mode (kW).
CCR = Electricity commercial cost rate (SAR/kWh).
t = Equipment running time (h).
D = Number of running days per year.

2.3. PRVs Theoretical Available Throttling Power

The pressure-reducing valve theoretical available power due to the throttling effect is calculated using the following equation [15]:
P t h = ρ g Q H 3600
where Pth is the theoretical available power across the PRV, ρ is the density of the fluid, Q is the flow rate, g is the gravitational acceleration (9.81 m/s2), and H is the available head.

2.4. System Layout

Five PAT installation layouts are investigated in this paper. The final selection was made based on the following:
  • Maximum power recovery compared to the overall theoretical available power across the system-installed PRVs.
  • Full compliance with the design operating parameters without compromising the overall system performance.
  • Minimal capital payback period for the selected PATs installation layout.
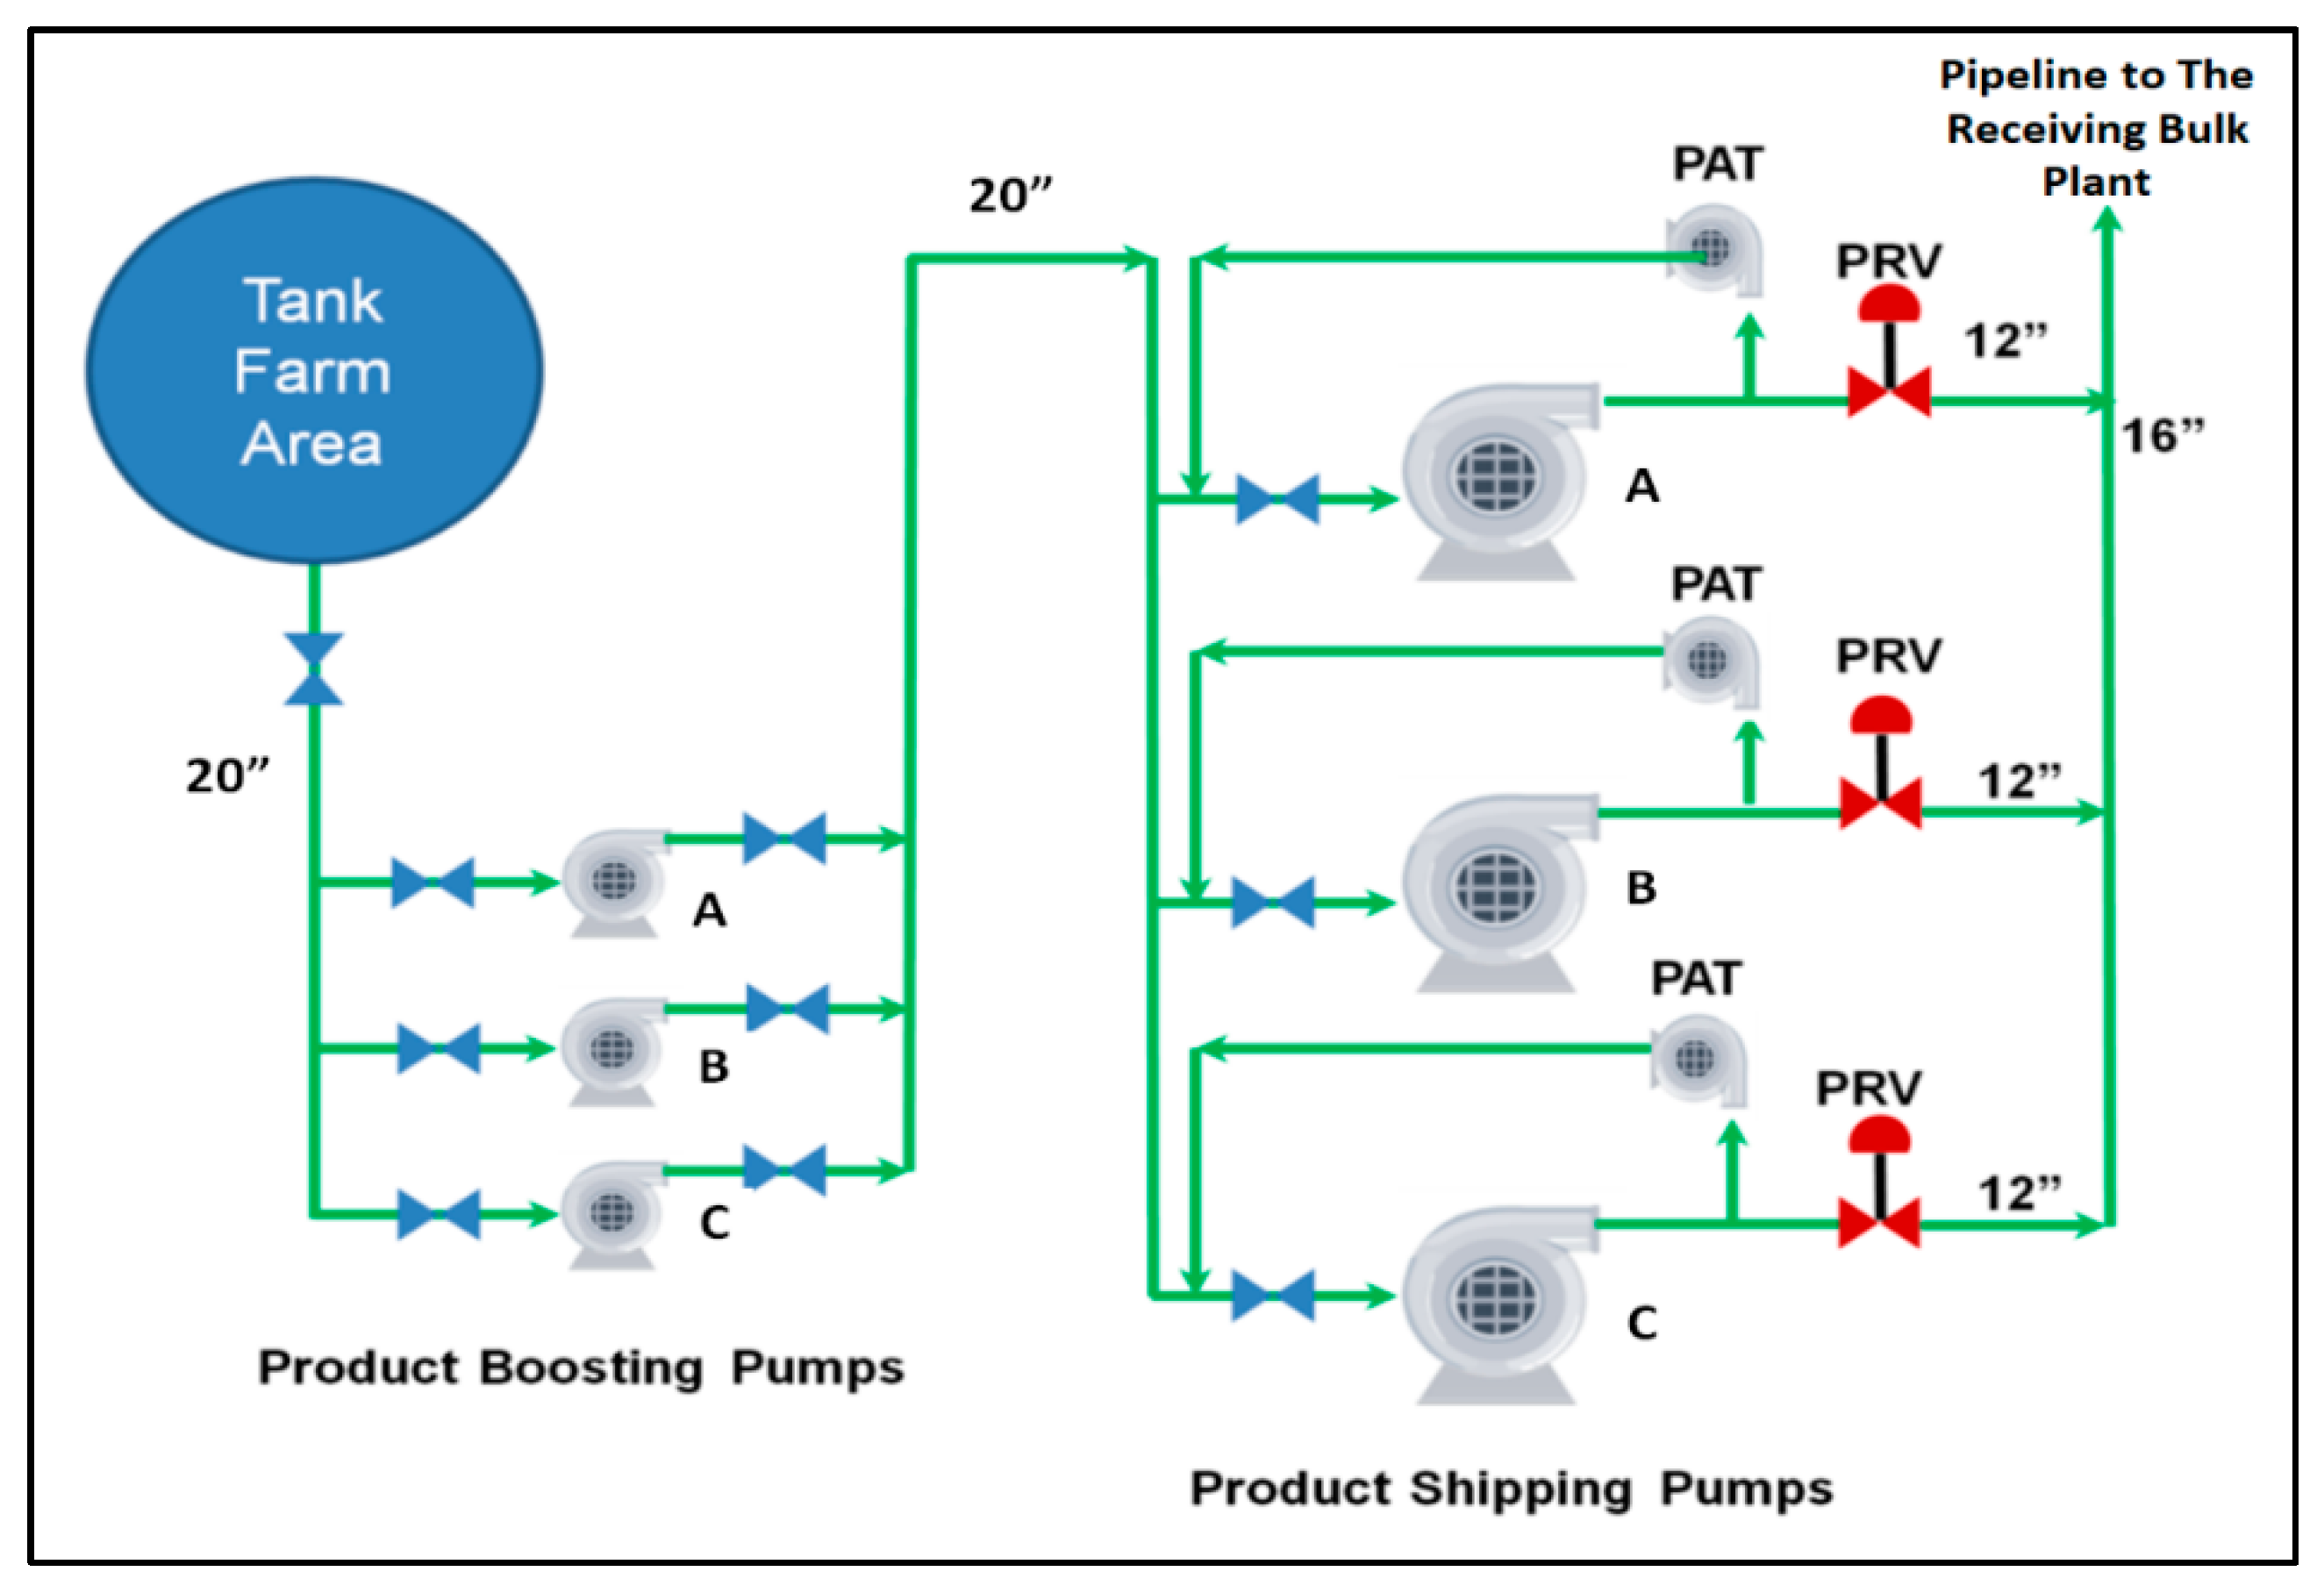
In option#1, PAT is to be installed in the PRVs’ upstream branch line. PATs’ outlet flow is recirculated to the shipper-pump suction considering multiple parallel/series installations for the power-generating devices, as indicated in Figure 2. This option was eliminated since it will deteriorate the system performance by recirculating partial flow to the pump suction, which will affect the pipeline flow rate. In addition to that, continuous recirculation to the pump suction at high-pressure values could create cavitation due to the product thermal expansion effect, especially for gasoline service.
In option#2, PAT is to be installed in the PRVs’ upstream branch line. The PATs’ outlet flow is recirculated to the booster-pump suction considering multiple parallel/series installations for the power-generating devices, as indicated in Figure 3. This option was also eliminated since it will deteriorate the system performance by recirculating partial flow to the pump suction, which will affect the pipeline flow rate. In addition to that, booster-pump hydraulics will be affected due to high suction pressure coming from the shipper-pump discharge recirculation even after the pressure drop across the proposed PATs.
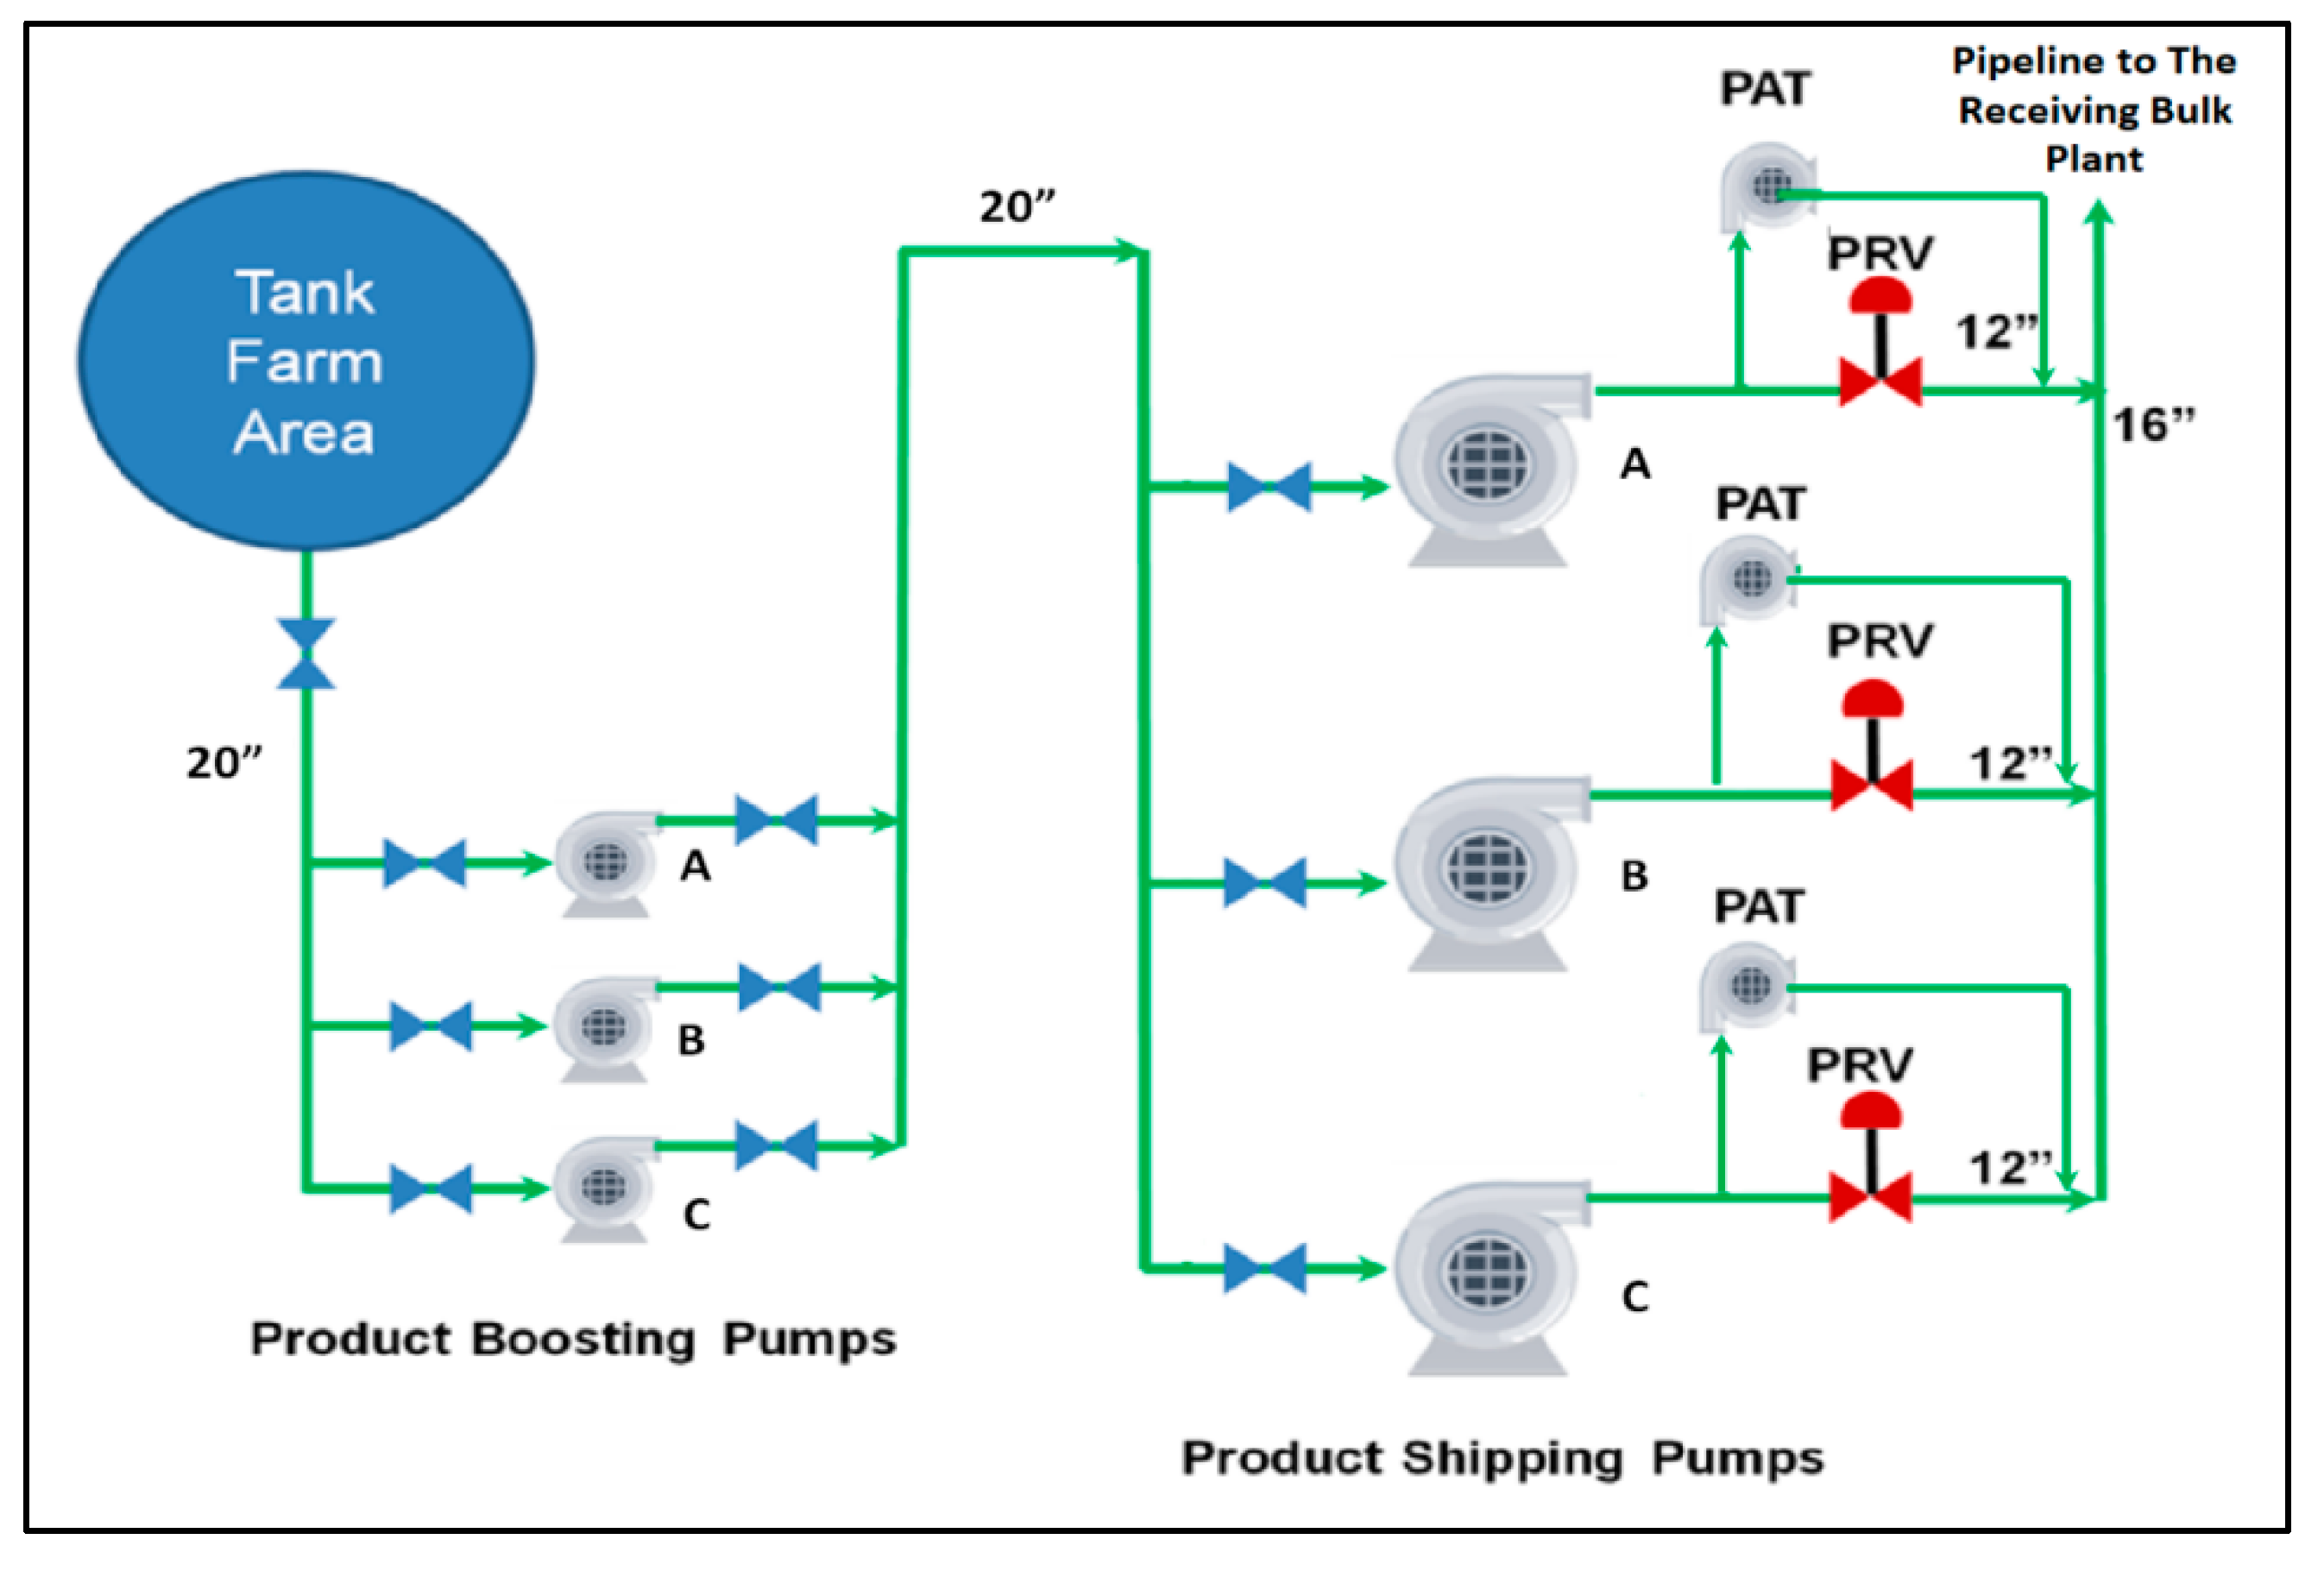
In option#3, PAT is to be installed in the PRVs’ bypass line and direct the outlet flow downstream of the PRVs considering multiple parallel/series installation for the power-generating devices, as indicated in Figure 4. As shown in Figure 4, the PRV bypass line downstream of PATs shall have enough pressure to overcome the PRVs’ downstream pressure. The pressure drop across the PATs shall be less than the pressure drop across the PRV to achieve these operating points and avoid internal recirculation for the PATs, provided that the inlet pressure for both devices is the same. Therefore, in this case, partial power will be recovered across the proposed PATs since the PRVs are still dissipating the pump discharge power.
Based on the literature review, this layout and equipment arrangement are used to control the PATs’ inlet flow for water distribution networks where the demand is highly fluctuating on a frequent basis. However, in this research, the flow rate and pressure values are steady, with no fluctuation for all operating modes where this option may be superseded by option #5.
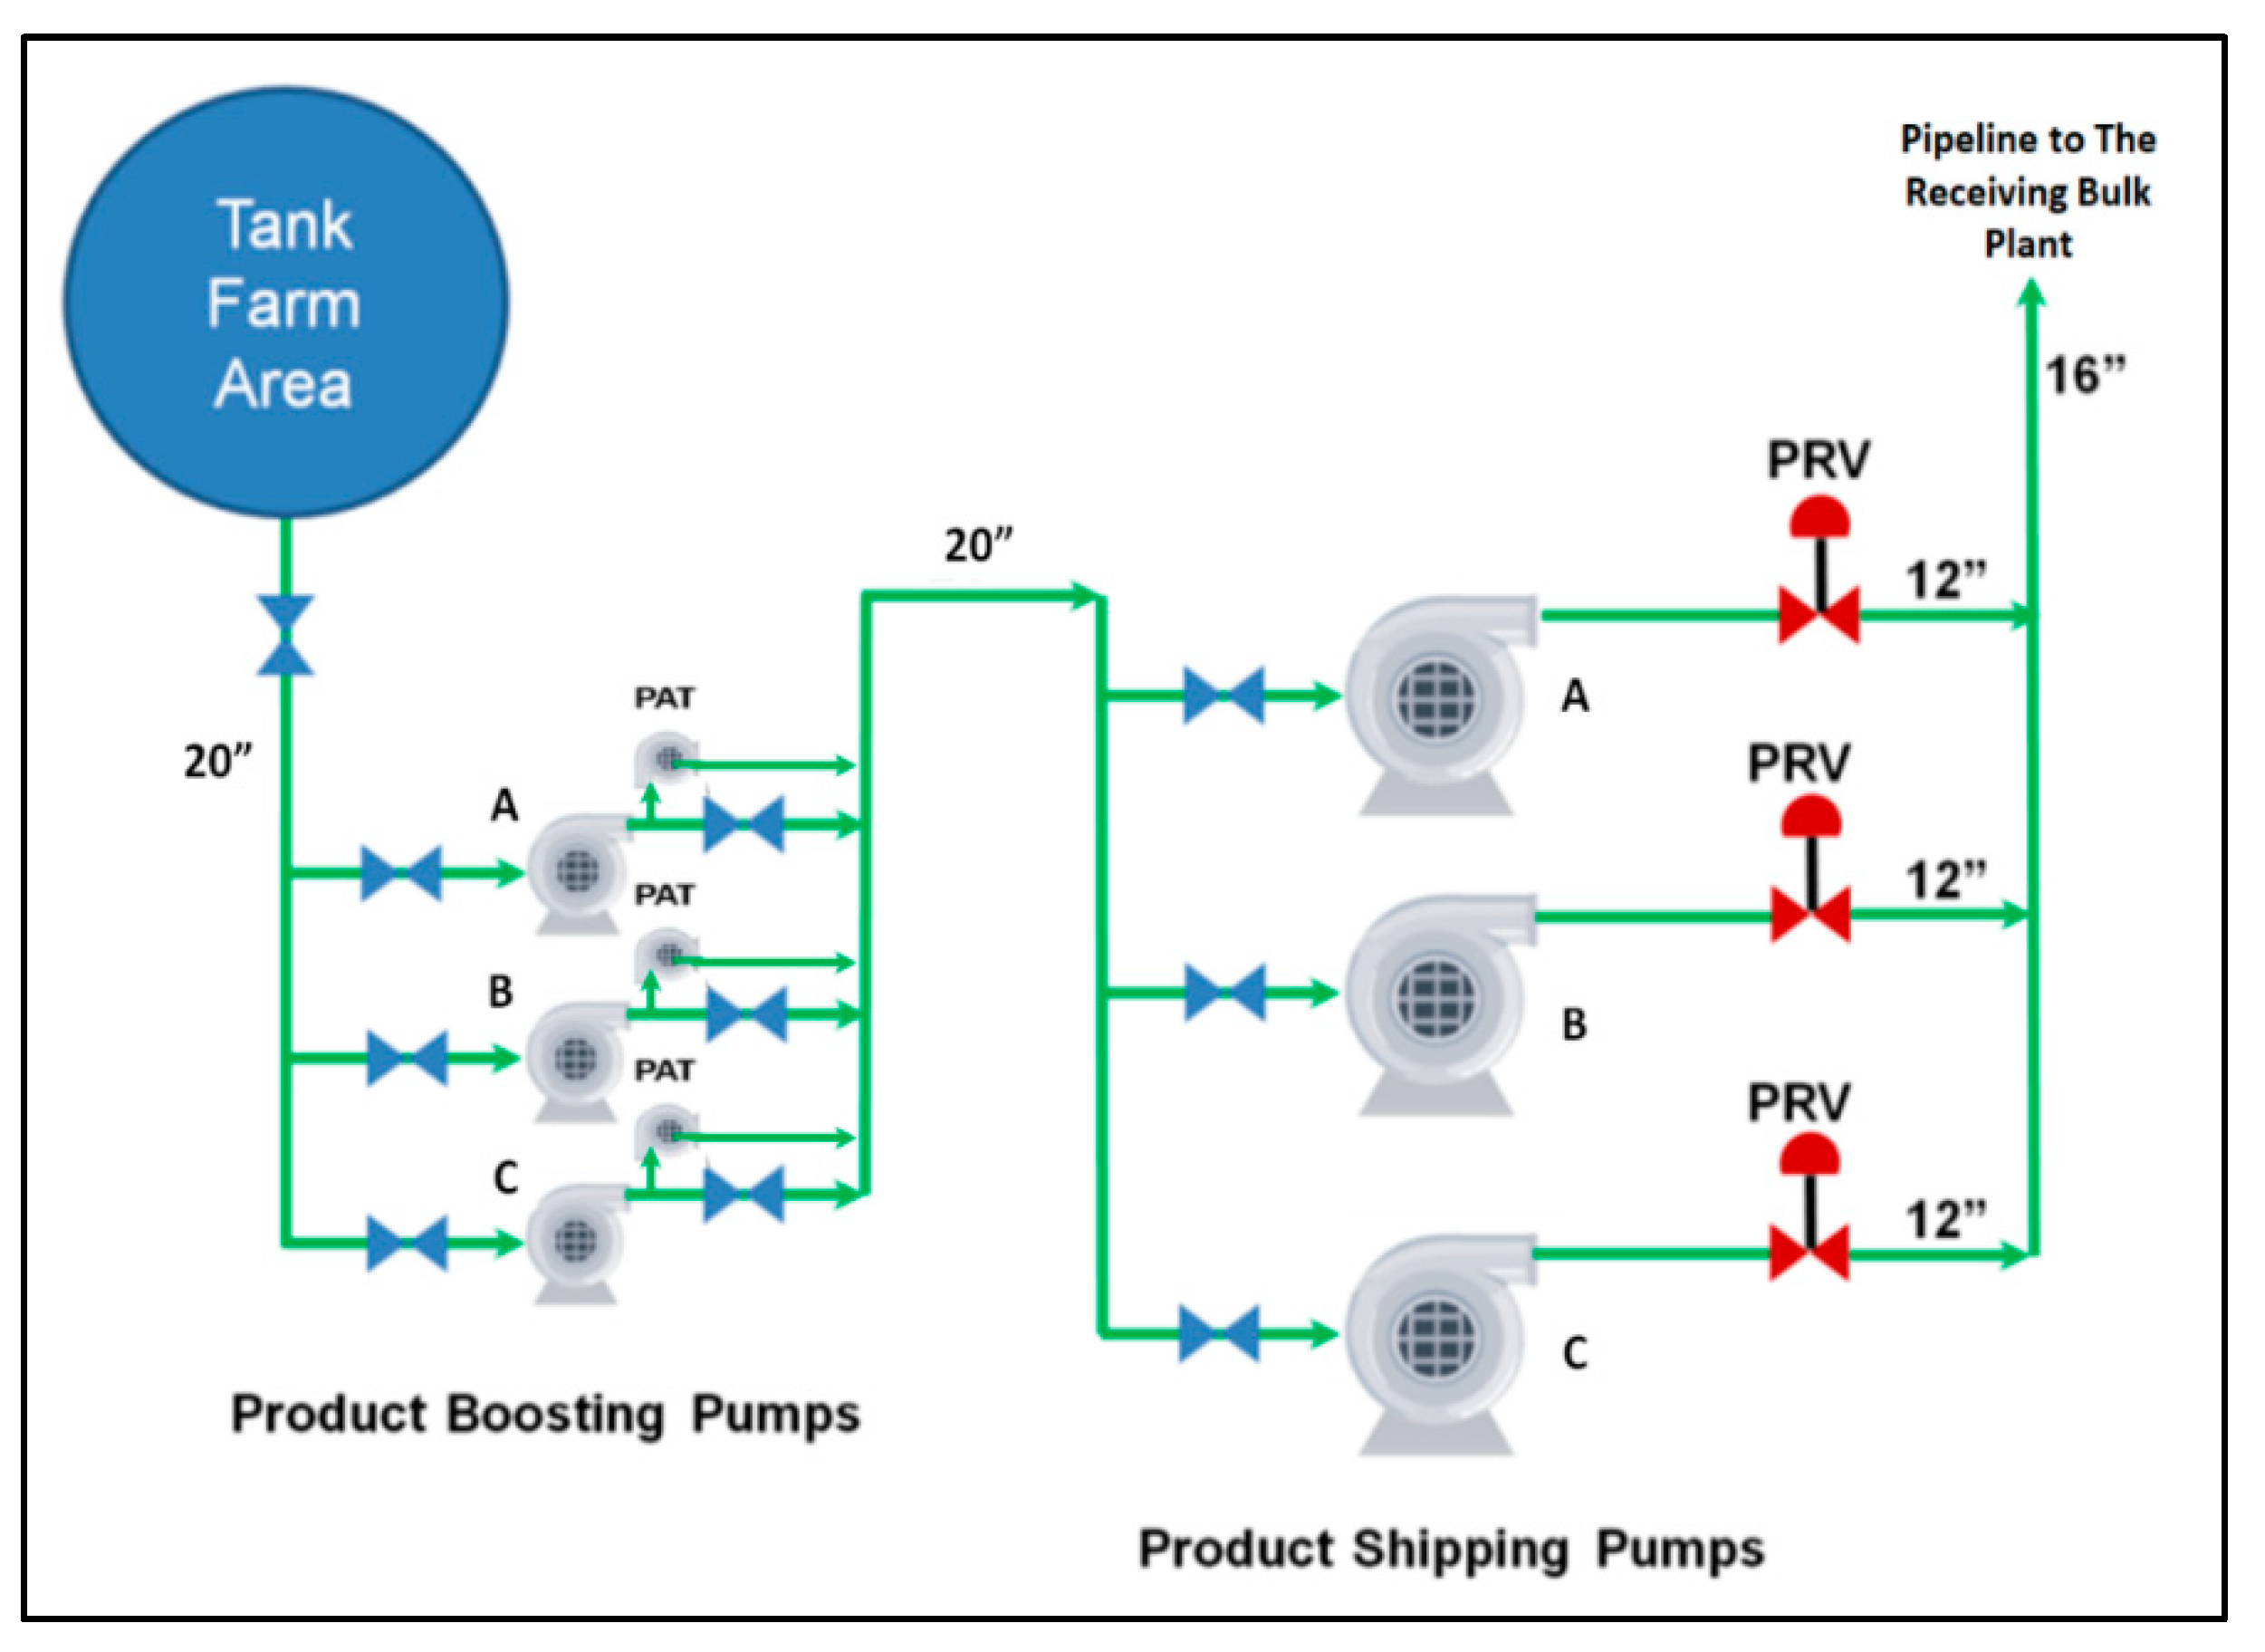
In option #4, PAT is to be installed downstream of each booster-pump considering multiple parallel/series installation for the power-generating devices, as indicated in Figure 5. This option will provide the shipper-pump’s common suction with the required flow and pressure to maintain the pipeline’s intended flow for each operational mode. This option was eliminated since the recovered power will be minimal compared to the power dissipation across the PRVs. Furthermore, providing shipper-pumps with lower NPSH available from the booster’s discharge may deteriorate the shipper-pump operations and cause cavitation.
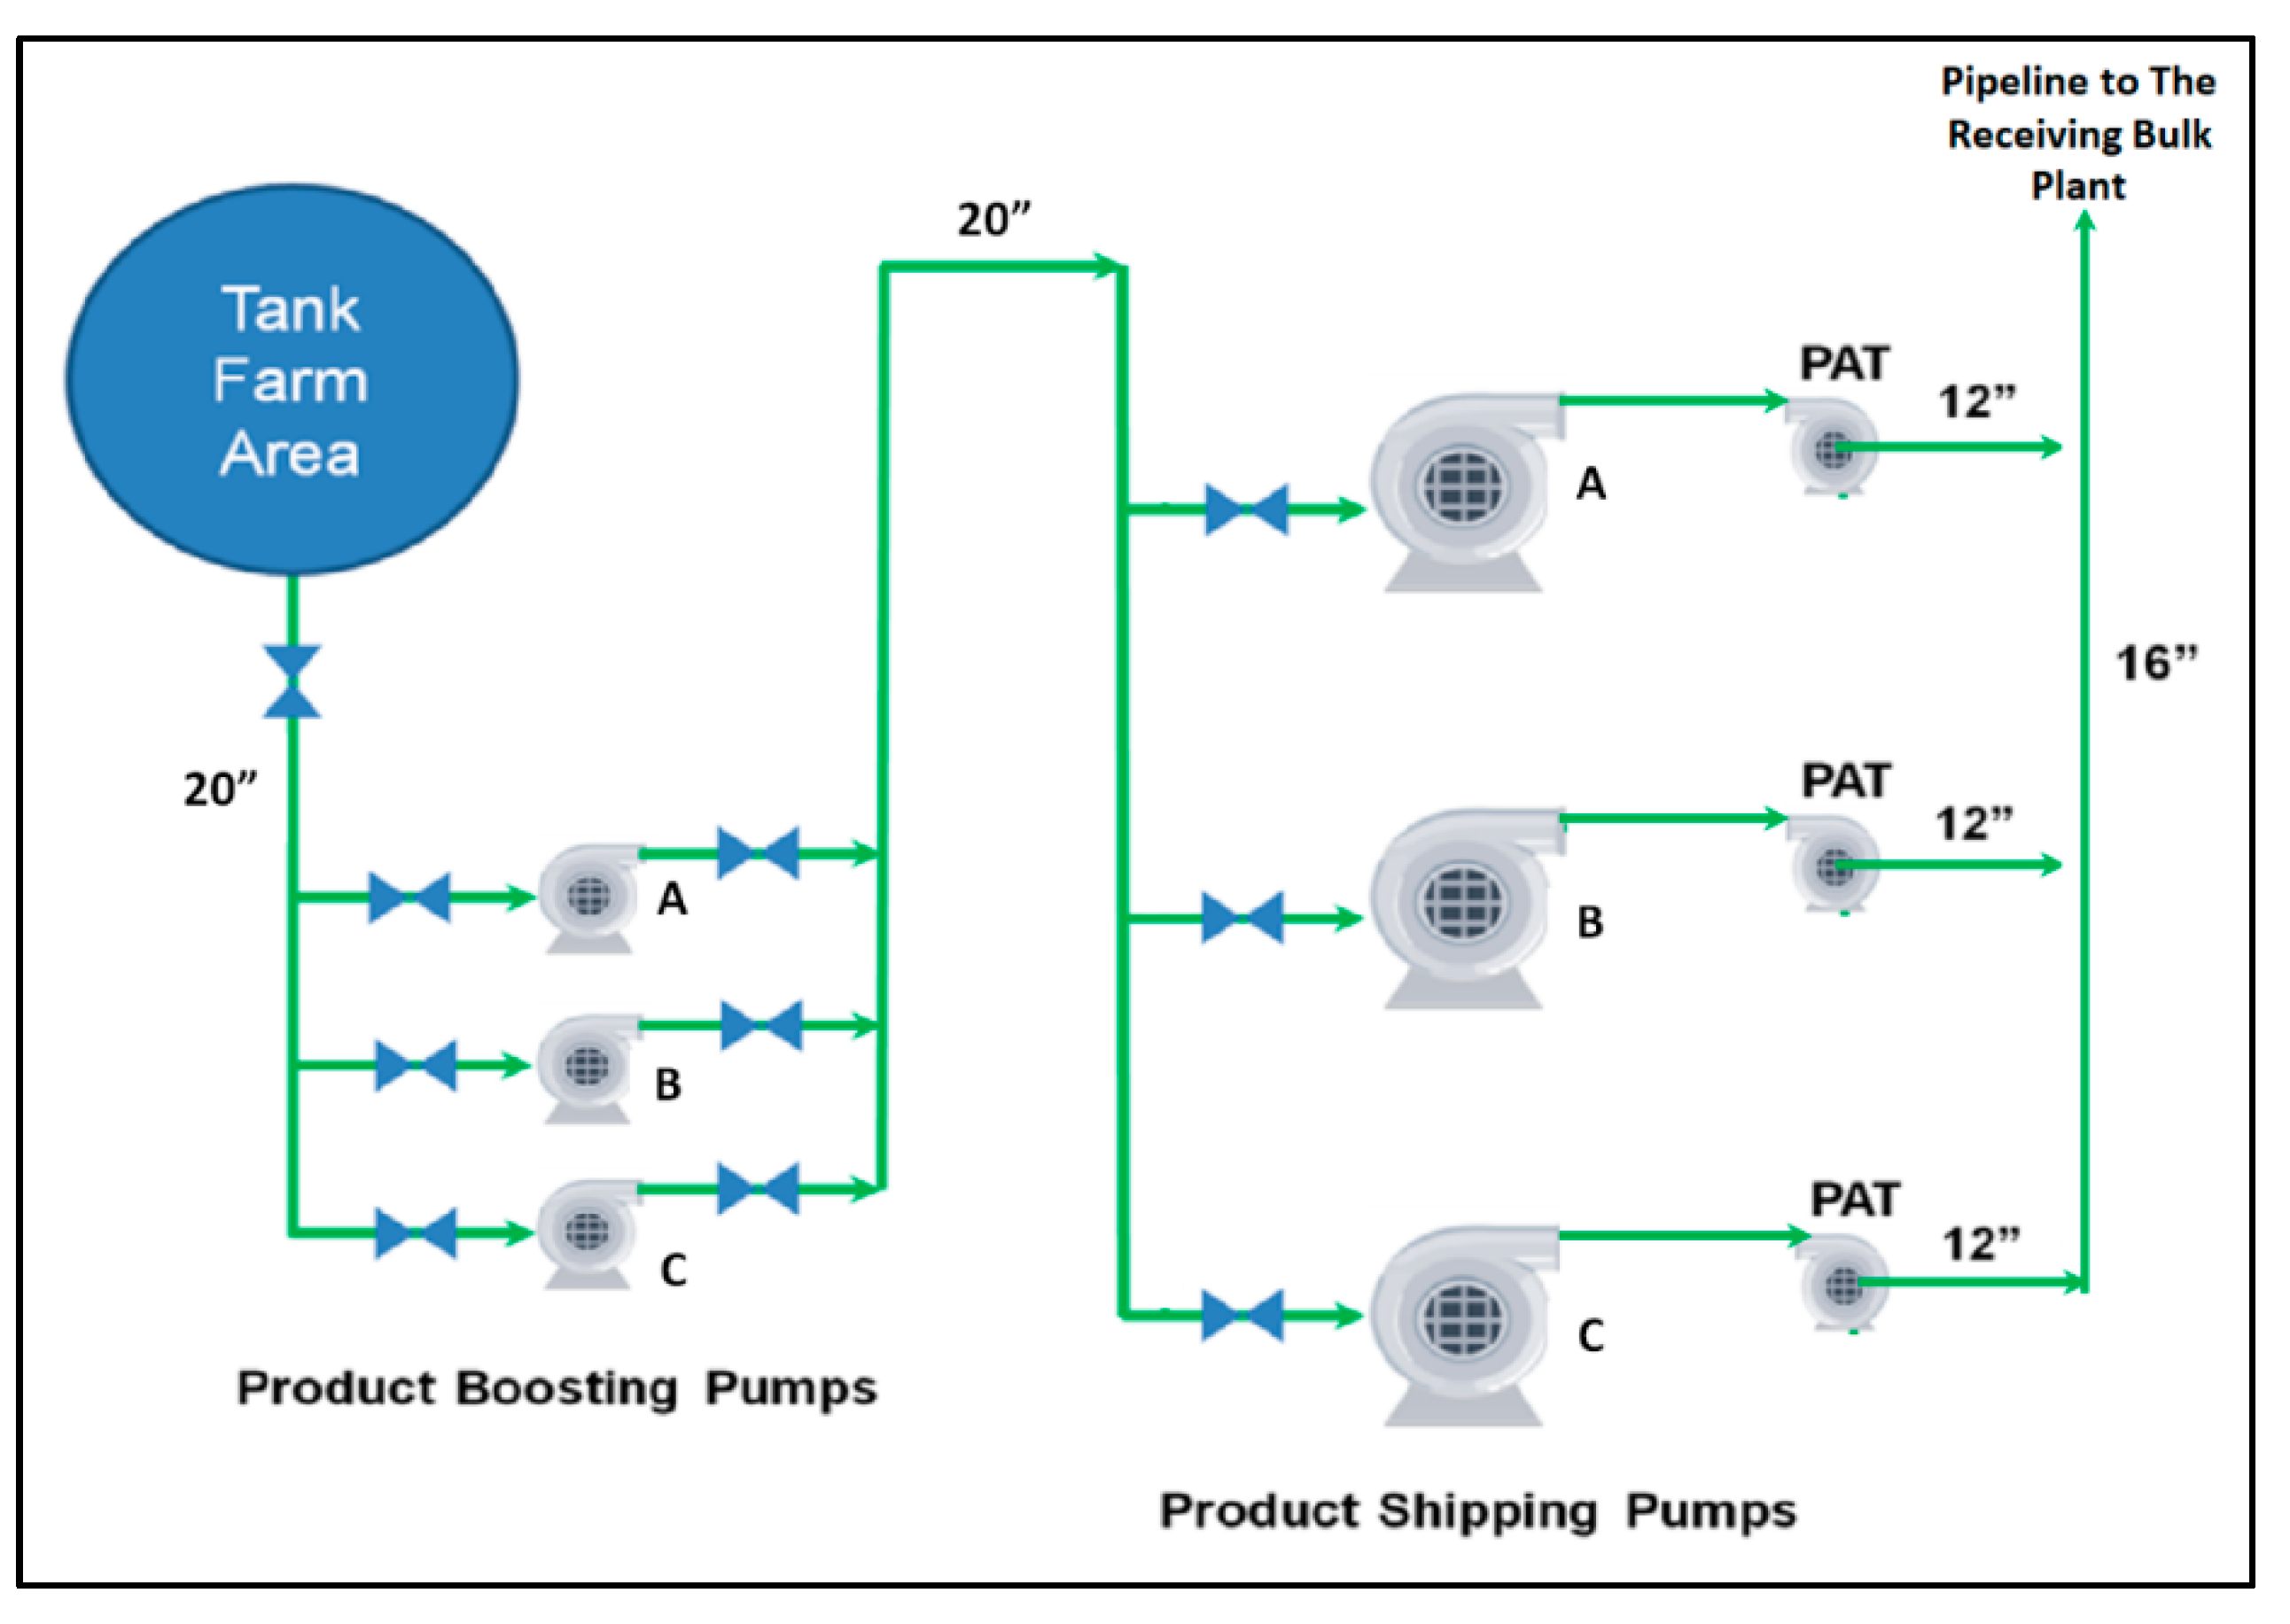
In option #5, PAT is to be installed in place of the PRVs considering multiple parallel/series installations for the power-generating devices, as indicated in Figure 6. The pipeline flow rate will be controlled through the receiving bulk plant flow control system to ensure running the pipeline at the design points for all operating modes. As per the literature review, substituting the PRVs with PATs at the nearest point to the pumping source will maximize the energy recovery. However, the most important and challenging factor in this option is the operating pressure of the facility. Therefore, the proposed PAT shall have extreme hydraulic properties and materials to sustain the existing pressure and achieve the PRVs’ design operating points.
For this option, the developed literature models will be used to select suitable PATs based on a pump mode BEP and specific speed. Each literature model will be tested individually for each mode of operation to predict the performance of the PATs and calculate the power recovery.
Considering the above-proposed options and their validations, option #5 is used throughout this research.

2.5. PAT Selection

PATs are selected based on the characteristic curves provided by various manufacturers in the market to ensure suitable selection with the available operating parameters across the existing PRVs. The selection is conducted for each mode of operation as follows.

2.5.1. Single Mode

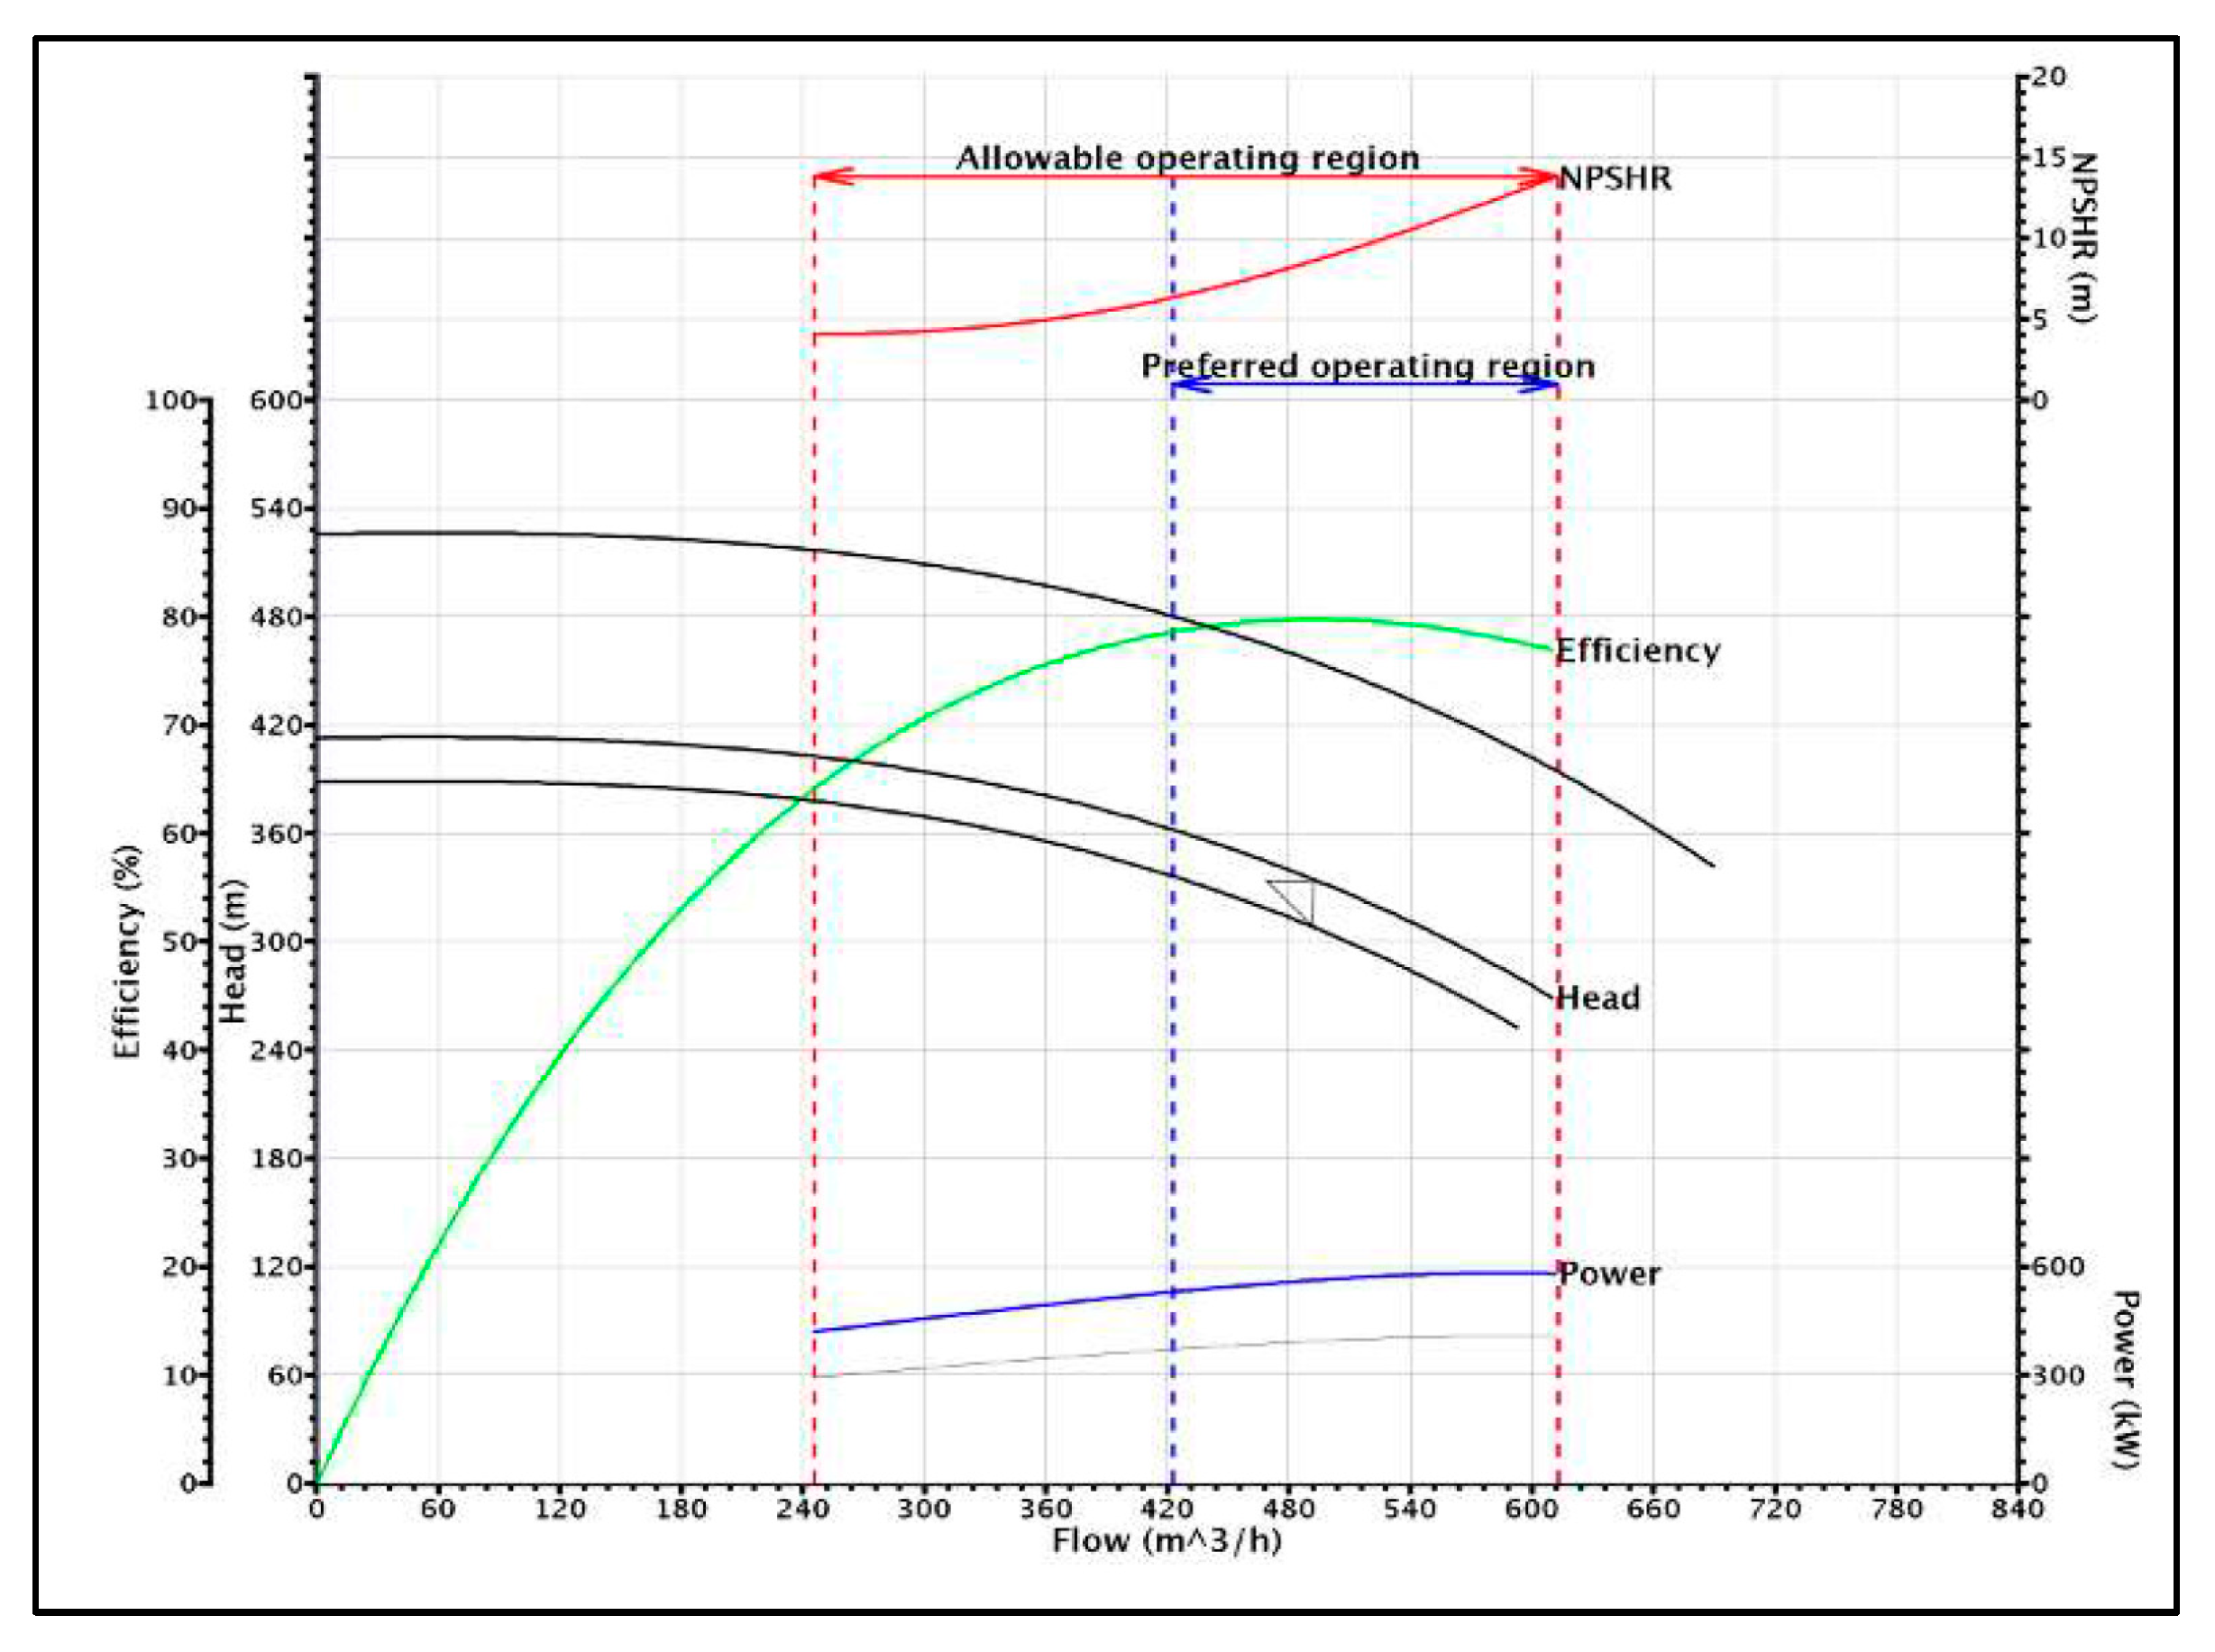
In this mode, the shipping operation runs with a single shipper (B/C) and single booster-pumps (A/B/C), providing a flow rate of 662.45 m3/h and an average head drop of 500 m across the PRV. The Flowserve manufacturer pumps division [31] in Saudi Arabia was first contacted and several pump design options were discussed that can fulfill the operating parameter requirements in this mode of operation. However, their pumps cannot be operated in reverse mode, as they are not designed for this type of operation. Alternatively, Baker Hughes [33], one of GE’s companies, was contacted to check the availability of pumps that can be operated as turbines at the above flow rate and head drop requirements. The provided option was three stages with a bearing axial-split centrifugal pump (6X11-D MSN). The pump characteristic curves are shown in Figure 7. Furthermore, the PAT curves are also available, as shown in Figure 8. The selected pump is designed to work as a Hydraulic Power Recovery Turbine (HPRT), and this new design was recently released by the Baker Hughes pumps division to satisfy both pump and PAT operating philosophy.

2.5.2. Semiparallel Mode

In this mode, the shipping operation runs with a single upgraded shipper- (A) and two booster-pumps providing a flow rate of 828 m3/h and an average head drop of 500 m across the PRV. Similarly, after conducting several market surveys, Flowserve proposed that pumps were satisfying the operating parameters, but they are not designed to run under this operation. Alternatively, Baker Hughes [33] HPRT provided options that were validated, and the option containing three stages with a bearing axial-split centrifugal pump (8X13-D MSN) was selected.

2.5.3. Parallel Mode

In this mode, the shipping operation runs with two shipper-pumps (B and C) and two booster-pumps, providing a flow rate of 530 m3/h and an average head drop of 500 m across the PRV on each train. Baker Hughes HPRT options were validated, and a four-stage bearing axial-split centrifugal pump (6X11-D MSN) was selected.
The performance curves provided by Baker Hughes [33] are based on water. However, the gray line in the performance curves (Figure 7 and Figure 8) represents the power in gasoline mode having Specific Gravity (SG) of 0.7. The power values in terms of diesel mode can be calculated based on the diesel-to-gasoline specific gravity ratio of 1.214 multiplied by the power values at gasoline mode, as indicated in Table 3.
As indicated by the manufacturer, the pumps’ and PATs’ best efficiency points are almost the same, provided that the mass flow rate and head in turbine mode are much higher than the pump mode, which is in line with the recent results of Carravetta et al. [34].

2.6. Proposed Model

Based on the manufacturer data, each characteristic is modeled using a second-order polynomial equation. As an example, Table 4 provides that curve fits for head vs. the mass flow rate for all modes of operation.
These equations follow the normal second-order polynomial format: f ( Q ) = a Q 2 + b Q + c , where a, b, and c are constants. Consequently, following a similar approach for the provided turbine mode head vs. flow rate gives similar equations representing symmetrical polynomials and curves around the horizontal axis H = λ, where λ represents the head value at the maximum pump flow rate provided by the manufacturer. The related flow rate for the identified λ can be calculated as follows:
Flow Rate at λ = Maximum Flow Rate in Pump Mode − MCSF
where MCSF represents the manufacture-provided Minimum Continuous Stable Flow that must be maintained through the pump operation to avoid excessive recirculation at the impeller inlet. Therefore, the above-identified flow rate at λ is the turbine MCSF where the performance curves start. The related efficiency of the turbine at this point can be found as:
ηt @ λ = ηp @ λ − MCSF
As indicated in the above steps, the new prediction polynomials for head vs. flow rate in turbine mode are given in Table 5.
The following is observed from the provided curves:
  • Pump and PAT efficiencies at the BEP are almost equal, provided that the pump is running in reverse mode at the required higher flow rate and head.
  • Pump consumed power and PAT generated power are almost the same at the BEP.
Considering the above points and approach, the PAT flow rate and head at BEP can be predicted using the following equation [8]:
P t b = η t b ρ g Q t b H t b
where P t b = P p b , and η t b = η p b .
Knowing the values of P P b   and   η P b from the pump curves and manufacturer data and substituting H t b with the identified second-order polynomial will give the related turbine flow rate at the BEP. Hence, resubstituting the identified flow rate value in the derived second-order polynomial will give the related head of the turbine at BEP. Furthermore, the power generated in turbine mode can be also predicted by identifying the power and flow rate values at the following three points:
  • Point #1: zero power where the efficiency is equal to zero (at pump MCSF).
  • Point #2: related power at the identified turbine MCSF.
Point #3: related power at turbine BEP considering η t b = η P b .
Therefore, the power vs. turbine flow rate curve can be fitted using the second-order polynomial equation for each mode of operation, as shown in Table 6.
Hence, substituting any flow rate value on the fitted second-order polynomial will give the related power at that operating point.

2.7. Economic Analysis

The cost of the selected Energy Generation Equipment (EGE), which includes all the components (PAT, generator, electrical, and control systems), was provided by Baker Hughes [33], as shown in Table 7.
According to Fontana et al. [35], the civil work (CW) portion of the EGE expenses is estimated to be 30%. Maintenance Costs (MC) must be taken into account in order to do a basic but comprehensive study of the Capital Payback Period (CPP) [1]. In the literature, it is advised to utilize a range between 10 and 15% of the overall cost (EGE + CW). As a result, using the manufacturer data provided and taking into account PATs Annual Cost Saving (ACS), CPP may be determined using the following relation [1]:
C P P = E G E + C W A C S M C
Knowing that the operation is continuous, ACS (in USD/Year) based on Saudi Electricity Company’s Commercial Cost Rate (CCR) can be calculated using the following relation:
A C S   ( USD Year ) = Total   Power   Production   ( kW ) 24 365 C C R   ( SAR kW . hr ) 3.75 .

3. Results and Discussion

3.1. Power Consumption and Pumping Cost

Power consumption and pumping costs in USD and USD/m3 are presented in Table 8 against the flow rates for all modes of operation. Knowing the gasoline-to-diesel specific gravity ratio of 0.824, the same results could be calculated for gasoline batches.
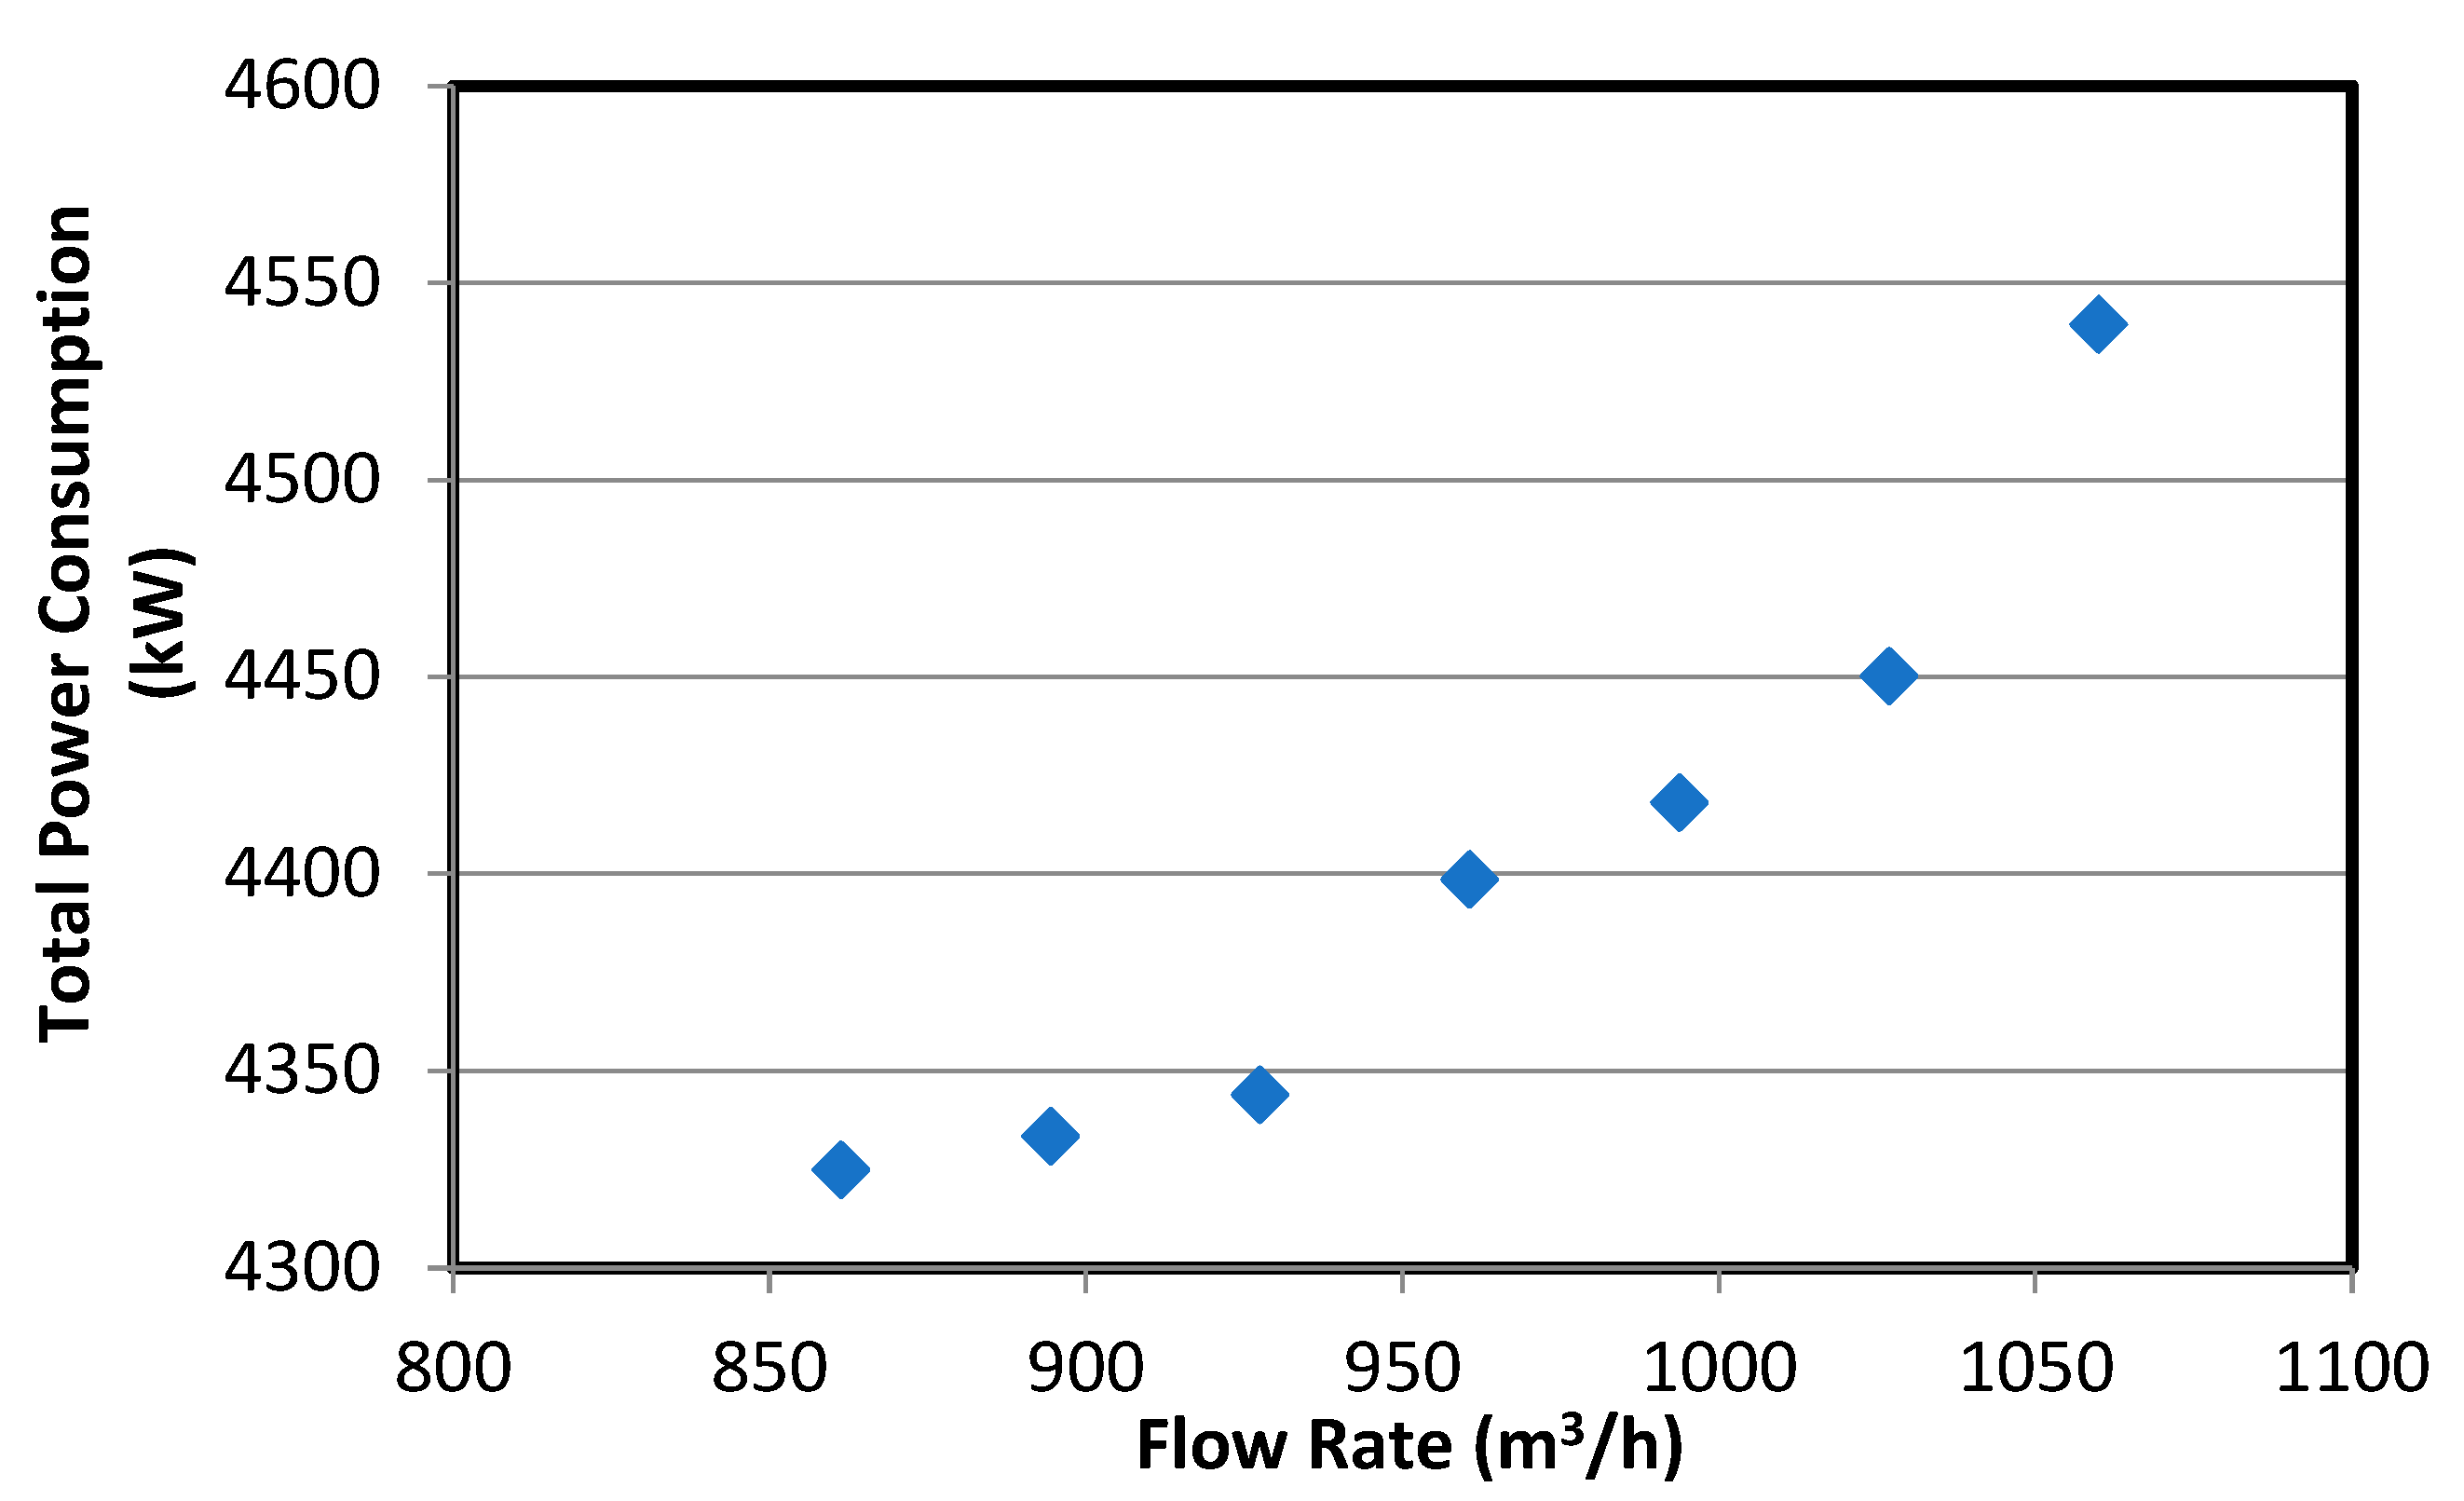
The total average power consumption of all shipper- and booster-pumps is plotted vs. the pipeline flow rate in Figure 9. As indicated in the figure, the change in total average power consumption is insignificant in the flow range of 861–927 m3/h, where the flow is improved by 7.7% at 927 m3/h compared to the base flow rate of 861 m3/h. The change in total average power consumption becomes significant after a flow rate of 927 m3/h.
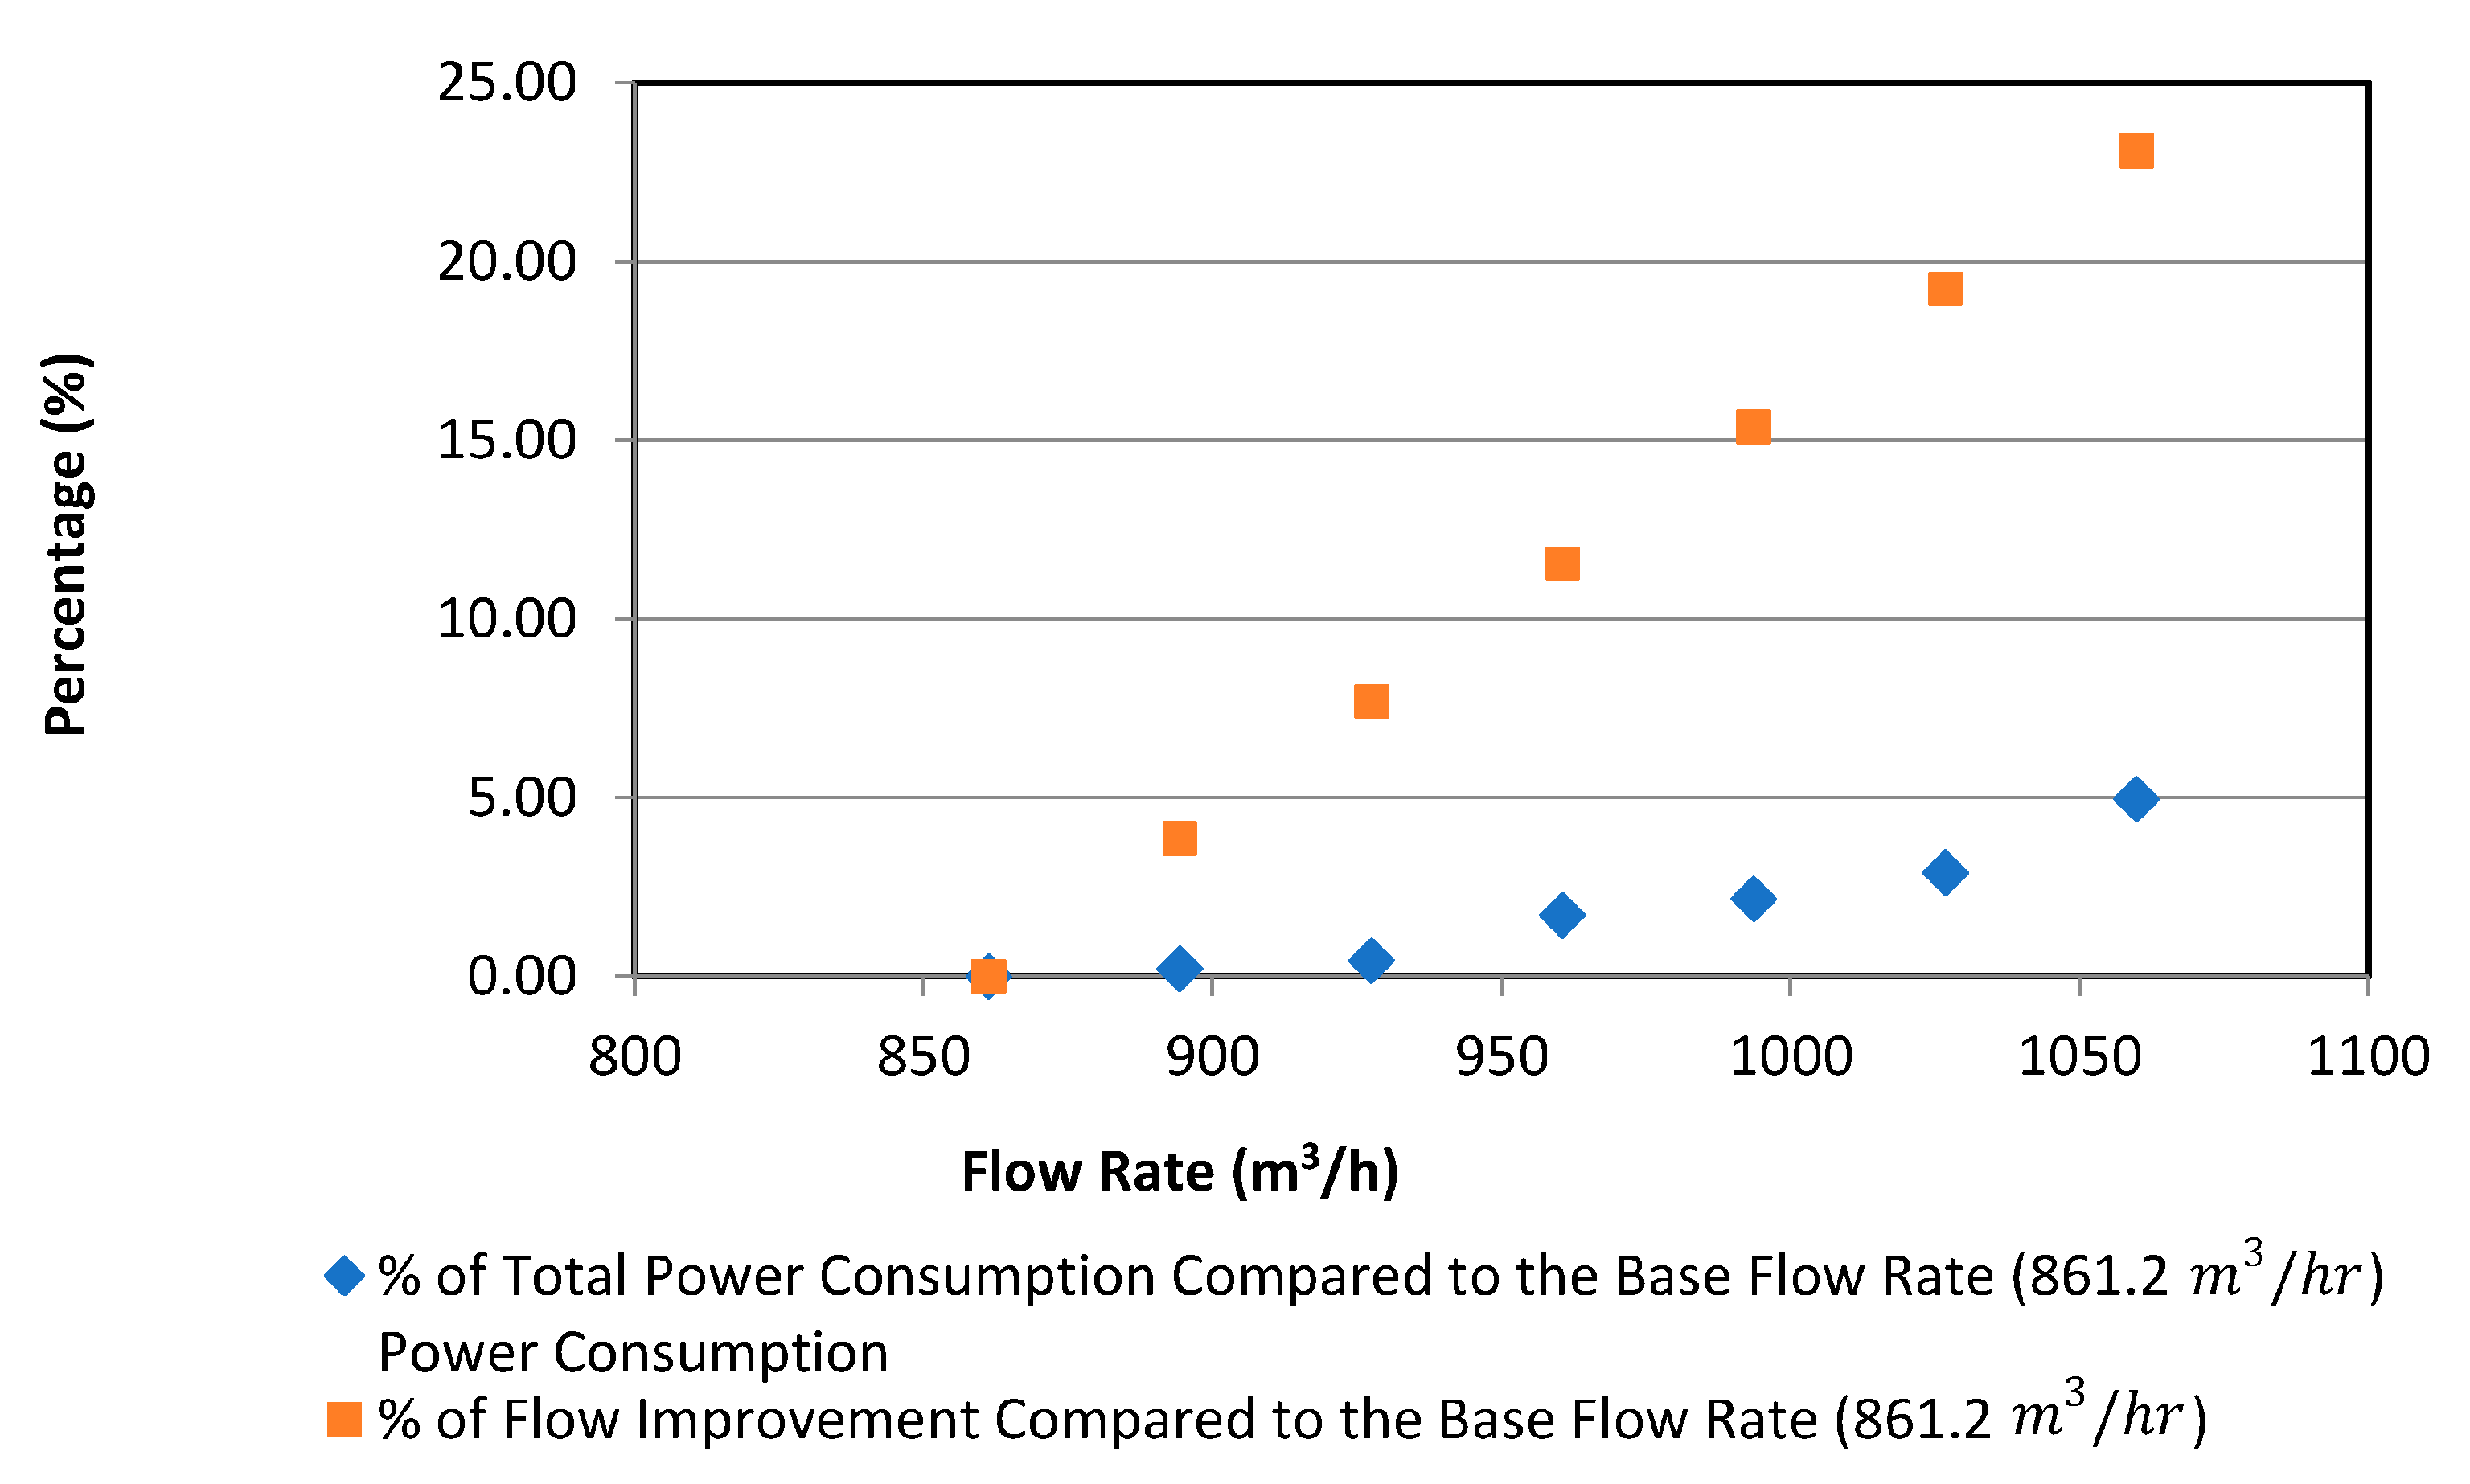
The percentage of total power consumption is compared against the pipeline flow rate in Figure 10. The baseline flow rate was considered to be 861 m3/h for comparison purposes. The figure shows that the increase in flow rate by 23% causes the total average power consumption to be increased only by 4.94%. Consequently, this considerable improvement is highly preferable in order to optimize the pipeline pumping facility power consumption. Therefore, the flow rate of 1060 m3/h is considered in this research analysis.

3.2. PRVs Theoretical Available Throttling Power

The available mass flow rate and average head drop across the pumping facility PRVs are given in the Table 9.
Knowing these operating points at each mode of operation, the theoretical available throttling power across the PRVs is calculated in Table 10.

3.3. Percentage of Power Recovered using PAT

Knowing the PAT power generation value at the design flow, the percentage of power recovery compared to the theoretical dissipated power stated in Table 3 during both diesel and gasoline modes can be calculated, as shown in Table 11.

3.4. Comparison of Proposed Model with Experimental Data and Previous Models

After selecting the suitable PAT for each mode of operation, pump mode data at BEP indicated in Table 3 are used to calculate the following:
  • Turbine flow rate at BEP.
  • Turbine head at BEP.
  • Turbine head drop at the design flow rate.
  • Turbine power at the design flow rate.
Using the correlations developed by researchers to predict pump performance in turbine mode, the above parameters are calculated again and compared to the proposed model and manufacturer data. Deviations from the actual operating points of each PAT provided by the manufacturer are calculated to find out the studied model’s accuracy in terms of flow and head ratio prediction. Further analysis was conducted to predict the head drop and amount of power generated by each PAT for both gasoline and diesel modes at the design flow in order to compare with the manufacturer data. The deviation percentage was also calculated to identify the most accurate model correlation.
Table 12, Table 13 and Table 14 provide a comparison of the proposed model with experimental data and previous models for three modes of operation. Blue-colored readings represent the minimum deviation for a certain characteristic, whereas the red-colored reading is for the second minimum deviation. It is clear from Table 12, Table 13 and Table 14 that the proposed model results either have the minimum deviation or the second minimum deviation (with reasonable accuracy) out of all models. For power prediction, the proposed model is the best and the only reliable model out of all, as the deviation in the prediction of power is quite high for other models.
In single mode operation (Table 12), Sharma [21] provides the most accurate prediction for flow rate, head ratio, and head drop with a deviation within ±1.82%, whereas the proposed model is reasonable with the second-lowest deviation within ±5.2%. However, in the case of power prediction, the proposed model comes out to be the best choice, with a minimum deviation of −7.67%, whereas all the other models could not be relied on, for power prediction as the second-nearest deviation is −27.63%, which is huge.
Table 12. Characteristics of the System in Single-Mode.
ModelFlow Ratio (q)Dev.
(%)
Head Ratio (h)Dev.
(%)
Head Drop *
(m)
Dev.
(%)
Power *
(kW)
Dev.
(%)
Power
+
(kW)
Dev.
(%)
Nautiyal et al. [18]1.3815.561.5717.14477.1−4.58262.5−45.91318.8−45.80
Stepanoff [19]1.12−6.351.26−6.18528.45.68251.7−48.14305.6−48.04
Childs [20]1.264.901.26−6.18440.6−11.88192.1−60.42233.2−60.34
Sharma [21]1.200.241.31−1.82494.9−1.02240.1−50.52291.6−50.42
Alatorre and Thomas [22]1.5126.041.5213.56411.6−17.68193.3−60.17234.7−60.09
Yang et al. [13]1.3613.651.5415.16480.2−3.96262.5−45.91318.7−45.80
Derakhshan and Nourbakhsh [6]1.5126.021.9344.18522.74.54351.2−27.63426.5−27.48
Proposed Model1.243.831.27−5.20434.9−3.03448.1−7.67544.1−7.48
Manufacturer Data1.2001.3405000485.30588.10
Blue and red colors represent the first and second minimum deviation, respectively; * Gasoline Mode; +Diesel Model.
In Semiparallel mode operation (Table 13), the proposed model is found to be the best choice for all predictions, with the second-nearest being the Childs [20] for flow rate, Sharma for head ratio, Yang et al. [13] for head drop, and Derakhshan and Nourbakhsh [6] for power prediction. However, none of the models other than the proposed model could be considered for power prediction, as the second-nearest deviation is within −36%, which is quite high.
In parallel mode operation (Table 14), the proposed model is found to be the second-best choice (with reasonably acceptable deviations) for the flow rate, head ratio, and head drop, with the most accurate being Sharma [21] for flow rate and head ratio and Stepanoff [19] for head drop. None of the models other than the proposed model could be considered for power prediction, as the second-nearest deviation is within −42%, which is quite high.
Table 13. Characteristics of the System in Semiparallel Mode.
ModelFlow Ratio (q)Dev.
(%)
Head Ratio (h)Dev.
(%)
Head Drop *
(m)
Dev.
(%)
Power *
(kW)
Dev.
(%)
Power
+
(kW)
Dev.
(%)
Nautiyal et al. [18]1.6538.591.9352.33518.83.76320.2−50.68388.9−50.62
Stepanoff [19]1.10−7.671.21−5.00543.08.60297.9−54.12361.8−54.06
Childs [20]1.211.351.21−5.00472.2−5.56236.5−63.58287.1−63.54
Sharma [21]1.16−2.361.25−1.40517.63.52282.0−56.56346.1−56.05
Alatorre and Thomas [22]1.3210.981.399.54480.6−3.88266.5−58.95323.7−58.90
Yang et al. [13]1.3311.841.4716.13504.50.90302.2−53.45367.0−53.40
Derakhshan and Nourbakhsh [6]1.5126.941.9351.92567.013.4415.5−36.00504.6−35.93
Proposed Model1.18−1.141.24−1.22501.60.32649.0−0.05788.10.07
Manufacturer Data1.1901.270500.00649.30787.50
Blue and red colors represent the first and second minimum deviation respectively; * Gasoline Mode; +Diesel Model.
Table 14. Characteristics of the System in Parallel Mode.
ModelFlow Ratio (q)Dev.
(%)
Head Ratio (h)Dev.
(%)
Head Drop *
(m)
Dev.
(%)
Power *
(kW)
Dev.
(%)
Power
+
(kW)
Dev.
(%)
Nautiyal et al. [18]1.4723.951.6924.20491.3−1.74119.4−67.67145.0−67.56
Stepanoff [19]1.11−6.301.24−8.94494.0−1.20123.7−66.49150.3−66.38
Childs [20]1.244.381.24−8.94431.1−13.7892.2−75.02112.0−74.94
Sharma [21]1.19−0.031.30−4.92474.3−5.14115.8−68.63140.6−68.53
Alatorre and Thomas [22]1.4622.551.488.88435.2−12.9689.1−75.86108.2−75.79
Yang et al. [13]1.3513.661.5211.67480.7−3.86119.8−67.54145.5−67.44
Derakhshan and Nourbakhsh [6]1.4017.992.0147.67612.022.40215.0−41.77261.1−41.58
Proposed Model1.211.351.28−6.22508.11.63356.4−3.47432.8−3.16
Manufacturer Data1.1901.360500.00369.20446.90
Blue and red colors represent the first and second minimum deviation, respectively; *Gasoline Mode; +Diesel Model.

3.5. Validation of Proposed Model for Other Pumps

In order to validate the applicability of the proposed model for pump designs from other manufacturers, the method was applied to previously selected and tested pumps in the literature. As an example, the proposed model was used for the multistage centrifugal pump tested by Pugliese et al. [8]. The results of the analysis are shown in Table 15 for a comparison of the proposed model with experimental data and with other models from the literature.
As indicated in Table 15, the proposed model gave the best prediction accuracy in terms of flow ratio at BEP. However, Stepanoff’s [19] and Childs’s [20] models gave the most accurate prediction for the head ratio at BEP, whereas the proposed model is still giving reasonable accuracy with a small deviation of 4.32%.
Furthermore, the proposed model was implemented on the Pugliese et al. [8] single-stage pump, and the results are shown in Table 16.
Again, the proposed model gave one of the best prediction accuracies in terms of flow ratio at BEP following the models of Derakhshan and Nourbakhsh [6] and Nautiyal et al. [18]. For head ratio prediction at BEP, none of the models could be considered accurate, as the least deviation predicted by Yang et al. [3] model is −15.96%, which is quite high. The proposed model is still close to Yang et al.’s prediction, with a deviation of −16.98%. It is clear from the discussion that in the prediction of head ratio at BEP, all the models fail to give a reasonable prediction. This could be attributed to some error itself in the experimental results presented by [8], as it is highly unlikely that none of the models give a reasonable prediction. So, it is necessary to apply the proposed model to other pumps as well.
The results after extending the implementation of the proposed model to the experiment conducted by Yang et al. [13] on a single-stage centrifugal pump are compared in Table 17.
Based on the results from Table 17, the proposed model gave the most accurate results related to the flow ratio and head ratio, with only 5.42% and −5.2% deviation from the experimental results. So, summarizing the results from Table 15, Table 16 and Table 17, it is clearly evident that the proposed model predicts the best performance among all proposed models in the literature, even for the other pumps tested by Pugliese et al. [8] and Yang et al. [13]. However, the model is to be tested extensively for other pumps to see its applicability in different modes of operation.

3.6. Economic Analysis

Considering 10% MC and average EGE cost, CPP can be calculated for both gasoline and diesel modes, as shown in Table 18 and Table 19, respectively.
Based on the receiving bulk plant demands, the pipeline is operated around one-third of the year on each mode of operation considering 75% of the time on diesel service, while the other 25% is operated on both gasoline grades. Knowing that, the overall CPP for each mode of operation is calculated in Table 20.
In light of the above economic analysis, the overall project will require the installation of the following PATs:
  • One PAT in place of either shipper-pump B or C discharge PRVs for the single-shipper single-booster operating mode.
  • One PAT in place of shipper-pump A discharge PRV for the semiparallel operating mode.
  • One PAT in place of shipper-pump B and C discharge PRVs for the parallel operating mode.
A total number of five PATs is the optimum selection for the proposed project, where the overall CPP for these five PATs is around 5 years.

4. Conclusions and Future Work

In this research, the possibility of utilizing PATs for power recovery purposes in place of PRVs in hydrocarbon services was discussed. The selection of suitable machines was conducted based on pump BEP so they could be operated in a reverse mode. The manufacturer-provided data and calculated results show that the utilization of PATs is feasible in such applications. Different literature models and correlations were implemented in order to predict the pump performance in reverse mode. A new method for predicting the pump performance in reverse mode was developed depending on the manufacturer’s pump performance curves. The new predicted method shows an excellent agreement with the manufacturer data in terms of flow rate, head ratios at the BEP, head drop, and power generated at different flow rates in turbine mode. The new method was also validated against previous models showing more precise performance prediction of multistage centrifugal pumps running in turbine mode. It is found that increasing the mass flow rate by 23% only increases power consumption by 4.94%. Therefore, an increase in the flow rate for such an application is highly recommended. PAT is found to be feasible and recommended to be used for large-scale hydropower generation in place of PRV considering multistage centrifugal pumps that can sustain high-pressure values.
The proposed model is recommended to be used for head and flow ratio prediction as well as the power generation value for multistage centrifugal pumps at the BEP and other flow ranges. In single-mode operation, the proposed model is reasonable, with the second-lowest deviation within ±5.2%. However, in the case of power prediction, the proposed model comes out to be the best choice, with a minimum deviation of −7.67%, whereas all the other models could not be relied on, for power prediction as the second nearest deviation is as high as −27.63%. In semiparallel mode operation, the proposed model was found to be the best choice for predictions of flow rate, head ratio, head drop, and power prediction. However, none of the models other than the proposed model could be considered for power prediction, as the second-nearest deviation is within −36%, which is quite high. In parallel mode operation, the proposed model is found to be the second-best choice (with reasonably acceptable deviations) for the flow rate, head ratio, and head drop. None of the models other than the proposed model could be considered for power prediction, as the second-nearest deviation is within −42%, which is quite high. The proposed model predicts the best performance among all models in the literature even for the other pumps manufactured by other companies. The economic analysis reveals that a total number of five PATs is the optimum selection for the studied project, where the overall CPP for these five PATs is around 5 years.
In the future, the proposed model is to be tested extensively for various pump manufacturers to see its applicability to all PATs in different modes of operation. It is found that many manufacturers of pumps are not using their pumps in reverse mode. So, they are to be requested to test their pumps in the reverse mode so that their experimental results can be utilized in the future for validating the proposed model.

Author Contributions

Conceptualization, Z.A.-S. and B.S.; methodology, Z.A.-S., S.N.D., Z.S.A.-K. and B.S.; software, Z.S.A.-K.; validation, Z.A.-S., S.N.D., Z.S.A.-K. and B.S.; formal analysis, Z.A.-S., Z.S.A.-K. and B.S.; investigation, Z.A.-S. and Z.S.A.-K.; resources, Z.A.-S. and S.N.D.; data curation, Z.S.A.-K. and B.S.; writing—original draft preparation, S.N.D. and Z.S.A.-K.; writing—review and editing, S.N.D.; visualization, Z.S.A.-K. and B.S.; supervision, Z.A.-S. and B.S.; project administration, Z.A.-S. and B.S.; funding acquisition, Z.A.-S. and S.N.D. All authors have read and agreed to the published version of the manuscript.

Funding

This research was funded by the Deputyship for Research and Innovation, Ministry of Education in Saudi Arabia—project number IFKSURG-2-1746.

Institutional Review Board Statement

Not applicable.

Informed Consent Statement

Not applicable.

Data Availability Statement

Not applicable.

Conflicts of Interest

The authors declare no conflict of interest.

Abbreviations

ACSAnnual cost saving
BEPBest efficiency point
CCRElectricity commercial cost rate
CFDComputational fluid dynamics
CPPCapital payback time
CWCivil work
EGEEnergy generation equipment
HPRTHydraulic power recovery turbine
MOCMethod of characteristics
MCMaintenance cost
MCSFManufacture-provided minimum continuous stable flow
NPSHNet-positive suction head
PATPump as turbine
PRVsPressure reducing valves
SGSpecific gravity
VFDsVariable frequency drivers
WDNWater distribution networks
WDSWater distribution system
Symbols
DNumber of running days per year
gGravitational Acceleration; m/s2
HHead; m
IavgEquipment average electrical current; A
PFPower factor
P p b PAT power at BEP; W
PthTheoretical available power; W
P a v g Average power consumption; W
P t b Turbine power at BEP; W
PTotalTotal power consumption; W
QFlow rate; m3/s
TEquipment running time; h
VVoltage; V
ρDensity of fluid; kg/m3
λHead value at the maximum pump flow rate; m
ηpPump efficiency
ηtTurbine efficiency

References

  1. De Marchis, M.; Fontanazza, C.M.; Freni, G.; Messineo, A.; Milici, B.; Napoli, E.; Notaro, V.; Puleo, V.; Scopa, A. Energy Recovery in Water Distribution Networks. Implementation of Pumps as Turbine in a Dynamic Numerical Model. Procedia Eng. 2014, 70, 439–448. [Google Scholar] [CrossRef] [Green Version]
  2. Singh, P. The choice between turbine expanders and variable speed pumps as replacement for throttling devices in non-thermal process applications. Energy 2017, 123, 198–217. [Google Scholar] [CrossRef]
  3. Darvini, G.; Soldini, L. Pressure control for WDS management. A case study. Procedia Eng. 2015, 119, 984–993. [Google Scholar] [CrossRef] [Green Version]
  4. Thoma, D.; Kittredge, C.P. Centrifugal pumps operated under abnormal conditions. J. Power Sources 1931, 73, 881–884. [Google Scholar]
  5. Giosio, D.; Henderson, A.; Walker, J.; Brandner, P.; Sargison, J.; Gautam, P. Design and performance evaluation of a pump-as-turbine micro-hydro test facility with incorporated inlet flow control. Renew. Energy 2015, 78, 1–6. [Google Scholar] [CrossRef]
  6. Derakhshan, S.; Nourbakhsh, A. Experimental study of characteristic curves of centrifugal pumps working as turbines in different specific speeds. Exp. Therm. Fluid Sci. 2008, 32, 800–807. [Google Scholar] [CrossRef]
  7. Lima, G.M.; Luvizotto, E.; Brentan, B.M. Selection and location of Pumps as Turbines substituting pressure reducing valves. Renew. Energy 2017, 109, 392–405. [Google Scholar] [CrossRef]
  8. Pugliese, F.; De Paola, F.; Fontana, N.; Giugni, M.; Marini, G. Experimental characterization of two Pumps as Turbines for hydropower generation. Renew. Energy 2016, 99, 180–187. [Google Scholar] [CrossRef]
  9. Carravetta, A.; Fecarotta, O.; Sinagra, M.; Tucciarelli, T. Cost-Benefit Analysis for Hydropower Production in Water Distribution Networks by a Pump as Turbine. J. Water Resour. Plan. Manag. 2014, 140, 04014002. [Google Scholar] [CrossRef]
  10. Binama, M.; Su, W.-T.; Li, X.-B.; Li, F.-C.; Wei, X.-Z.; An, S. Investigation on pump as turbine (PAT) technical aspects for micro hydropower schemes: A state-of-the-art review. Renew. Sustain. Energy Rev. 2017, 79, 148–179. [Google Scholar] [CrossRef]
  11. Danish, S.N.; Qureshi, S.R.; Imran, M.M.; Khan, S.U.-D.; Sarfraz, M.M.; El-Leathy, A.; Al-Ansary, H.; Wei, M. Effect of tip clearance and rotor–stator axial gap on the efficiency of a multistage compressor. Appl. Therm. Eng. 2016, 99, 988–995. [Google Scholar] [CrossRef]
  12. Sharma, R.L. Pumps as turbines (PAT) for small hydro. Indian J. Power River Vall. Dev. 1998, 49, 44–48. [Google Scholar]
  13. Yang, S.-S.; Derakhshan, S.; Kong, F.-Y. Theoretical, numerical and experimental prediction of pump as turbine performance. Renew. Energy 2012, 48, 507–513. [Google Scholar] [CrossRef]
  14. Stefanizzi, M.; Torresi, M.; Fortunato, B.; Camporeale, S. Experimental investigation and performance prediction modeling of a single stage centrifugal pump operating as turbine. Energy Procedia 2017, 126, 589–596. [Google Scholar] [CrossRef]
  15. Du, J.; Yang, H.; Shen, Z.; Chen, J. Micro hydro power generation from water supply system in high rise buildings using pump as turbines. Energy 2017, 137, 431–440. [Google Scholar] [CrossRef]
  16. Buono, D.; Frosina, E.; Mazzone, A.; Cesaro, U.; Senatore, A. Study of a Pump as Turbine for a Hydraulic Urban Network Using a Tridimensional CFD Modeling Methodology. Energy Procedia 2015, 82, 201–208. [Google Scholar] [CrossRef] [Green Version]
  17. Frosina, E.; Buono, D.; Senatore, A. A Performance Prediction Method for Pumps as Turbines (PAT) Using a Computational Fluid Dynamics (CFD) Modeling Approach. Energies 2017, 10, 103. [Google Scholar] [CrossRef] [Green Version]
  18. Nautiyal, H.; Varun, V.; Kumar, A.; Yadav, S. Experimental investigation of centrifugal pump working as turbine for small hydropower systems. Energy Sci. Technol. 2011, 1, 79–86. [Google Scholar]
  19. Stepanoff, A.J. Centrifugal and Axial Flow Pumps: Theory, Design, and Application, 2nd ed.; Krieger Publishing Company: Malabar, FL, USA, 1957. [Google Scholar]
  20. Childs, S. Convert pumps to turbine and recover HP. Hydrocarb. Process. Pet. Refin. 1962, 41, 173–174. [Google Scholar]
  21. Sharma, K. Small Hydroelectric Project-use of Centrifugal Pumps as Turbines: Technical Report; Kirloskar Electric Co.: Bangalore, India, 1985. [Google Scholar]
  22. Alatorre-Frenk, C.; Thomas, T.H. The pumps as turbines approach to small hydropower. In Proceedings of the World Congress on Renewable Energy, Reading, UK, 23–28 September 1990; Volume 5, pp. 2914–2918. [Google Scholar]
  23. Williams, A. The turbine performance of centrifugal pumps: A Comparison of prediction methods. Proc. Inst. Mech. Eng. Part A J. Power Energy 1994, 208, 59–66. [Google Scholar] [CrossRef]
  24. Lydon, T.; Coughlan, P.; Mcnabola, A. Pressure management and energy recovery in water distribution networks: Development of design and selection methodologies using three pump-as-turbine case studies. Renew. Energy 2017, 114, 1038–1050. [Google Scholar] [CrossRef]
  25. Barbarelli, S.; Amelio, M.; Florio, G.; Scornaienchi, N. Procedure Selecting Pumps Running as Turbines in Micro Hydro Plants. Energy Procedia 2017, 126, 549–556. [Google Scholar] [CrossRef]
  26. Motwani, K.; Jain, S.; Patel, R. Cost Analysis of Pump as Turbine for Pico Hydropower Plants–A Case Study. Procedia Eng. 2013, 51, 721–726. [Google Scholar] [CrossRef] [Green Version]
  27. Patelis, M.; Kanakoudis, V.; Gonelas, K. Pressure Management and Energy Recovery Capabilities Using PATs. Procedia Eng. 2016, 162, 503–510. [Google Scholar] [CrossRef]
  28. Lima, G.M.; Junior, E.L.; Brentan, B.M. Selection of Pumps as Turbines Substituting Pressure Reducing Valves. Procedia Eng. 2017, 186, 676–683. [Google Scholar] [CrossRef]
  29. Torley, A.R.D.; Chaudhry, M.H. Pump characteristics for transient flow analysis. In Proceedings of the 7th International Conference on Pressure Surges and Fluid Transients in Pipelines and Open Channels, Harrogate, UK, 16–18 April 1994; pp. 461–476. [Google Scholar]
  30. Derakhshan, S.; Nourbakhsh, A. Theoretical, numerical and experimental investigation of centrifugal pumps in reverse operation. Exp. Therm. Fluid Sci. 2008, 32, 1620–1627. [Google Scholar] [CrossRef]
  31. Flowserve Corporation | Home. Available online: https://www.flowserve.com/en (accessed on 21 October 2022).
  32. Chapman, S.J. Electric Machinery Fundamentals; McGraw-Hill: New York, NY, USA, 1998. [Google Scholar]
  33. Baker Hughes. A GE Company | BHGE | Full stream Oil & Gas. Available online: https://www.bakerhughes.com/ (accessed on 29 December 2022).
  34. Carravetta, A.; Houreh, S.D.; Ramos, H.M. Pumps as Turbines: Fundamentals and Applications; Springer: Cham, Switzerland, 2018. [Google Scholar]
  35. Fontana, N.; Giugni, M.; Portolano, D. Losses Reduction and Energy Production in Water-Distribution Networks. J. Water Resour. Plan. Manag. 2012, 138, 237–244. [Google Scholar] [CrossRef]
Figure 1. Pumping Facility Layout.
Sustainability 15 01014 g001
Figure 2. Installation Layout—Option#1.
Sustainability 15 01014 g002
Figure 3. Installation Layout—Option#2.
Sustainability 15 01014 g003
Figure 4. Installation Layout—Option#3.
Sustainability 15 01014 g004
Figure 5. Installation Layout—Option #4.
Sustainability 15 01014 g005
Figure 6. Installation Layout—Option #5.
Sustainability 15 01014 g006
Figure 7. Model 6X11-D MSN Three Stage Pump Characteristics Curves.
Sustainability 15 01014 g007
Figure 8. Model 6X11-D MSN Three Stage PAT Characteristics Curves.
Sustainability 15 01014 g008
Figure 9. Average Total Power Consumption.
Sustainability 15 01014 g009
Figure 10. Percentage of Total Power Consumption vs. Pipeline Flow Rate Improvement.
Sustainability 15 01014 g010
Table 1. Shipper and Booster Pumps Operating Parameters Taken from the Studied Pumping Facility.
Pump InformationBooster-Pumps A/B/CShipper-Pump AShipper-Pumps B/C
Rated Flow (m3/h)736736563
Discharge Head (m)7513201297
Flow at BEP (m3/h)550736643
Discharge Head at BEP (m)9113201206
Rotational Speed (RPM)178835803580
Efficiency (%)798281
Table 2. Pumping Facility Operation Modes.
Operating ModePumps UsedFlow Rate (m3/h)
Single Mode
(single shipper and single booster pump)
Booster-Pump B
Shipper-Pump B
662
Semiparallel Mode
(single shipper and two booster pumps)
Booster-Pump A and B
Shipper-Pump B
828
Parallel Mode
(two shipper and two booster pumps)
Booster-Pump A and B
Shipper-Pump B and C
1060
Table 3. Pump and PAT Manufacturer Specifications.
Manufacturer DataPumping Facility Operating Modes
SingleSemiparallelParallel
Pump Model6X11-D MSN8X13-D MSN6X11-D MSN
Number of Stages334
Impeller Diameter (mm)260.4295.7267.9
Inlet nozzle size101210
Outlet nozzle size686
Rotational Speed (RPM)360036003600
Pump Efficiency at BEP (%)79.783.080.6
Pump Flow at BEP (m3/h)510715530
Pump Head at BEP (m)329410458
Turbine Efficiency at BEP (%)8082.980
Turbine Flow at BEP (m3/h)610850630
Turbine Head at BEP (m)440520624
Pump Power at BEP and SG = 0.70 (W)401,580673,715574,475
Pump Power at BEP and SG = 0.85 (W)487,633818,083697,576
Turbine Power at BEP and SG = 0.70 (W)409,578698,942599,901
Turbine Power at BEP and SG = 0.85 (W)497,345848,716728,451
Turbine Power at design and SG = 0.70 (W)485,300649,300369,200
Turbine Power at design and SG = 0.85 (W)588,100787,500446,900
Table 4. Fitted Pump Head vs. Flow Rate Based on Proposed Model.
Mode of OperationHead vs. Flow Rate
Single Mode H = 7358.31 Q 2 + 447.3298 Q + 408.2533
Semiparallel Mode H = 3615.85 Q 2 + 216.1031 Q + 513.0638
Parallel Mode H = 9650.97 Q 2 + 577.6382 Q + 585.2832
Table 5. PAT Head vs. Flow Rate Based on Proposed Model.
Mode of OperationHead vs. Flow Rate
Single Mode H = 7358.31 Q 2 447.3298 Q + 268
Semiparallel Mode H = 3615.85 Q 2 216.1031 Q + 360
Parallel Mode H = 9650.97 Q 2 577.6382 Q + 384
Table 6. PAT Power vs. Flow Rate Based on Proposed Model.
Mode of OperationPAT Power vs. Flow Rate
Single Mode P = 17 , 419.90 Q 2 522.50 Q 45.63
Semiparallel Mode P = 17 , 780.62 Q 2 893.29 Q 86.27
Parallel Mode P = 24 , 384.40 Q 2 681.72 Q 71.76
Table 7. Selected PATs Cost (USD).
Mode of OperationPAT Selected ModelEGE Cost (USD)
Single Mode6X11-D MSN350,000–500,000
Semiparallel Mode8X13-D MSN350,000–500,000
Parallel Mode6X11-D MSN350,000–500,000
Table 8. Power Consumption and Pumping Costs in Different Modes.
Flow Rate (m3/h)Operating ModePower Consumption (kW)Pumping Cost (USD)Pumping Cost (USD/m3)
662Single Mode24341,705,9120.29
828Semiparallel Model34052,386,1200.33
1060Parallel Mode45403,181,2670.34
Table 9. Available Flow Rate and Head Drop across the PRVs at Different Operating Modes.
Operating ModeAvailable Flow Rate (m3/h)Available Average Head (m)
Single Mode
(single shipper and single booster pump)
662500
Semiparallel Mode
(single shipper and two booster pumps)
828500
Parallel Mode
(two shipper and two booster pumps)
1060
(530 across each PRV)
500
(across each PRV)
Table 10. Theoretical Available Power at the PRVs.
Operating ModeTheoretical Available Power Diesel Pumping (kw)Theoretical Available Power
Gasoline Pumping (kW)
Single Mode
(single shipper and single booster pump)
767632
Semiparallel Mode
(single shipper and two booster pumps)
959790
Parallel Mode
(two shipper and two booster pumps)
1228
for both PRVs
1011
for both PRVs
Table 11. Percentage of PAT Recovered Power Vs Theoretical Available Power.
Operating ModePercentage of Power Recovered during Diesel Pumping (%)Percentage of Power Recovered during Gasoline Pumping (%)
Single Mode76.776.8
Semiparallel Mode82.182.2
Parallel Mode72.873.0
Table 15. Proposed Model Vs Experimental Data and Other Models for multistage pump of Pugliese et al. [8].
ModelFlow Ratio (q)Deviation
%
Head Ratio
(h)
Deviation
%
Nautiyal et al. [18]0.98−19.591.02−21.59
Stepanoff [19]1.14−6.601.310.53
Childs [20]1.316.781.310.53
Sharma [21]1.241.211.386.07
Alatorre and Thomas [22]1.6837.151.6526.56
Yang et al. [13]1.3913.591.6123.92
Derakhshan and Nourbakhsh [6]1.5224.581.7433.76
Proposed Model1.230.451.394.32
Experimental Results [8]1.2201.300
Table 16. Proposed Model Vs Experimental Data and Other Models for single stage pump of Pugliese et al. [8].
ModelFlow Ratio (q)Deviation
%
Head Ratio (h)Deviation
%
Nautiyal et al. [18]1.37−6.311.56−16.25
Stepanoff [19]1.13−23.181.27−31.62
Childs [20]1.27−13.411.27−31.62
Sharma [21]1.21−17.461.33−28.27
Alatorre and Thomas [22]1.566.521.56−16.13
Yang et al. [13]1.37−6.711.56−15.96
Derakhshan and Nourbakhsh [6]1.39−5.081.54−16.98
Proposed Model1.37−6.431.18−16.89
Experimental Results [8]1.4701.860
Table 17. Proposed Model Vs Experimental Data and Other Models for single stage pump of Yang et al. [13].
ModelFlow Ratio (q)Deviation
%
Head Ratio (h)Deviation
%
Sharma [21]1.45−12.71.74−7.9
Stepanoff [19]1.26−24.11.58−16.4
Proposed Model1.755.421.44−5.2
Experimental Results [13]1.6601.890
Table 18. CPP for Gasoline Mode.
Mode of OperationEGE (USD)CW (USD)ACS (USD)MC (USD)CPP (Years)
Single Mode425,000127,500340,098.2455,2501.94
Semiparallel Mode425,000127,500455,029.4455,2501.38
Parallel Mode425,000127,500258,735.3655,2502.72
Table 19. CPP for Diesel Mode.
Mode of OperationEGE (USD)CW (USD)ACS (USD)MC (USD)CPP (Years)
Single Mode425,000127,500412,140.4855,2501.55
Semiparallel Mode425,000127,500551,88055,2501.11
Parallel Mode425,000127,500313,187.5255,2502.14
Table 20. Overall CPP.
Mode of OperationEGE (USD)CW (USD)ACS (USD)MC (USD)CPP (Years)
Single Mode425,000127,500394,129.9255,2501.63
Semiparallel Mode425,000127,500527,667.3655,2501.17
Parallel Mode850,000255,000599,148.96110,5002.26
Disclaimer/Publisher’s Note: The statements, opinions and data contained in all publications are solely those of the individual author(s) and contributor(s) and not of MDPI and/or the editor(s). MDPI and/or the editor(s) disclaim responsibility for any injury to people or property resulting from any ideas, methods, instructions or products referred to in the content.