
Research on Performance Optimization of Novel Sector-Shape All-Vanadium Flow Battery
 ,
, 
Abstract
:1. Introduction
2. Model
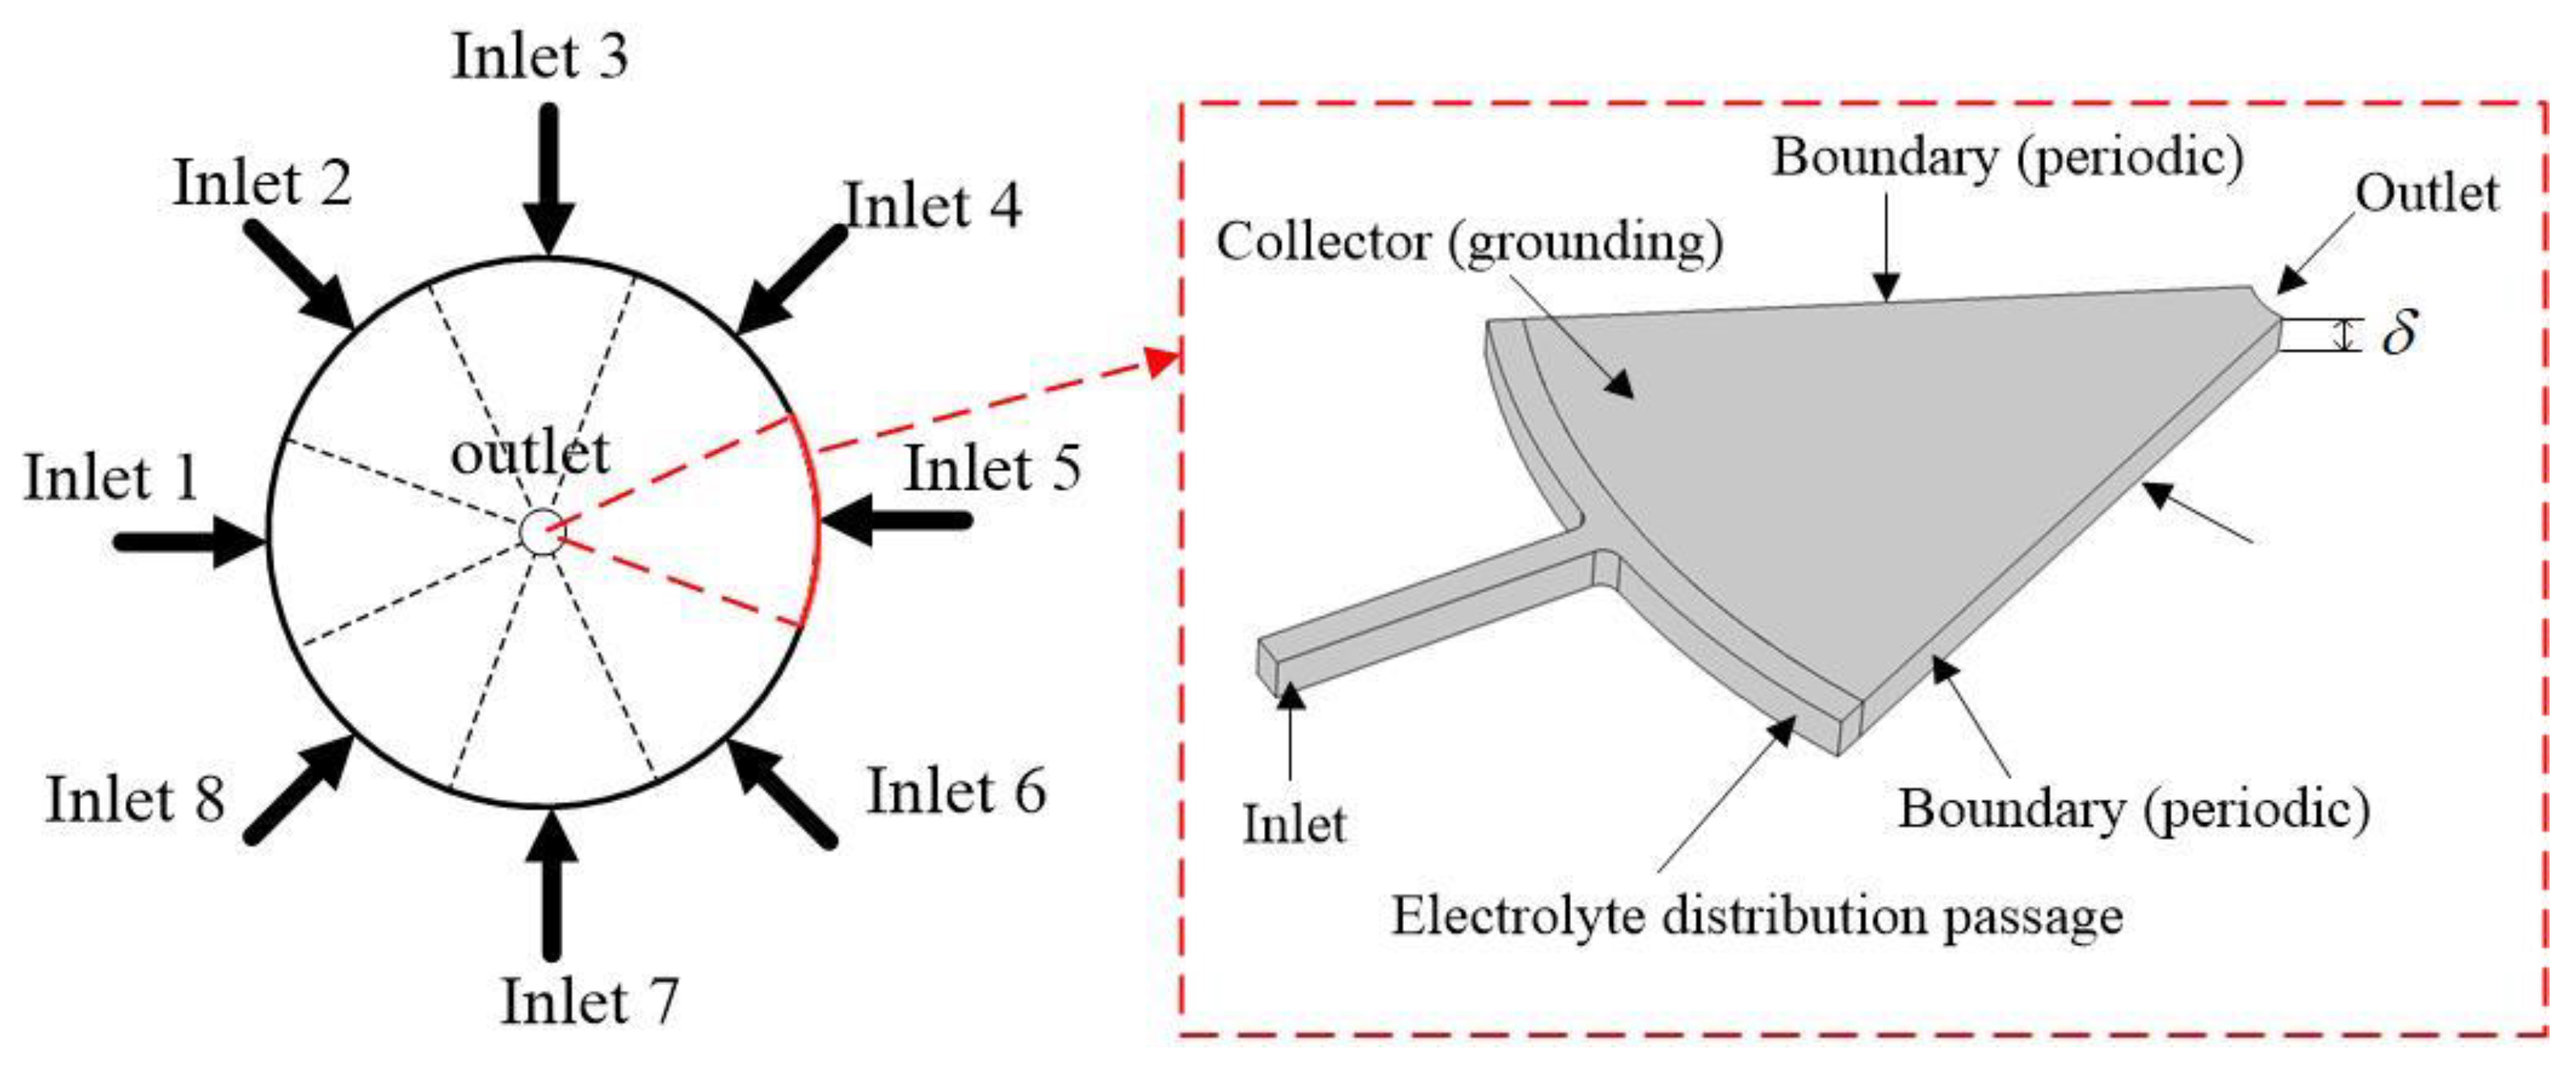
2.1. Physical Model
2.2. Mathematical Model
2.2.1. Assumptions
2.2.2. Electrochemical Reactions
2.2.3. Governing Equations
2.2.4. Boundary Conditions
2.2.5. Battery Performance Parameters
2.3. Grid Independence Verification
2.4. Model Validation
3. Results and Discussions
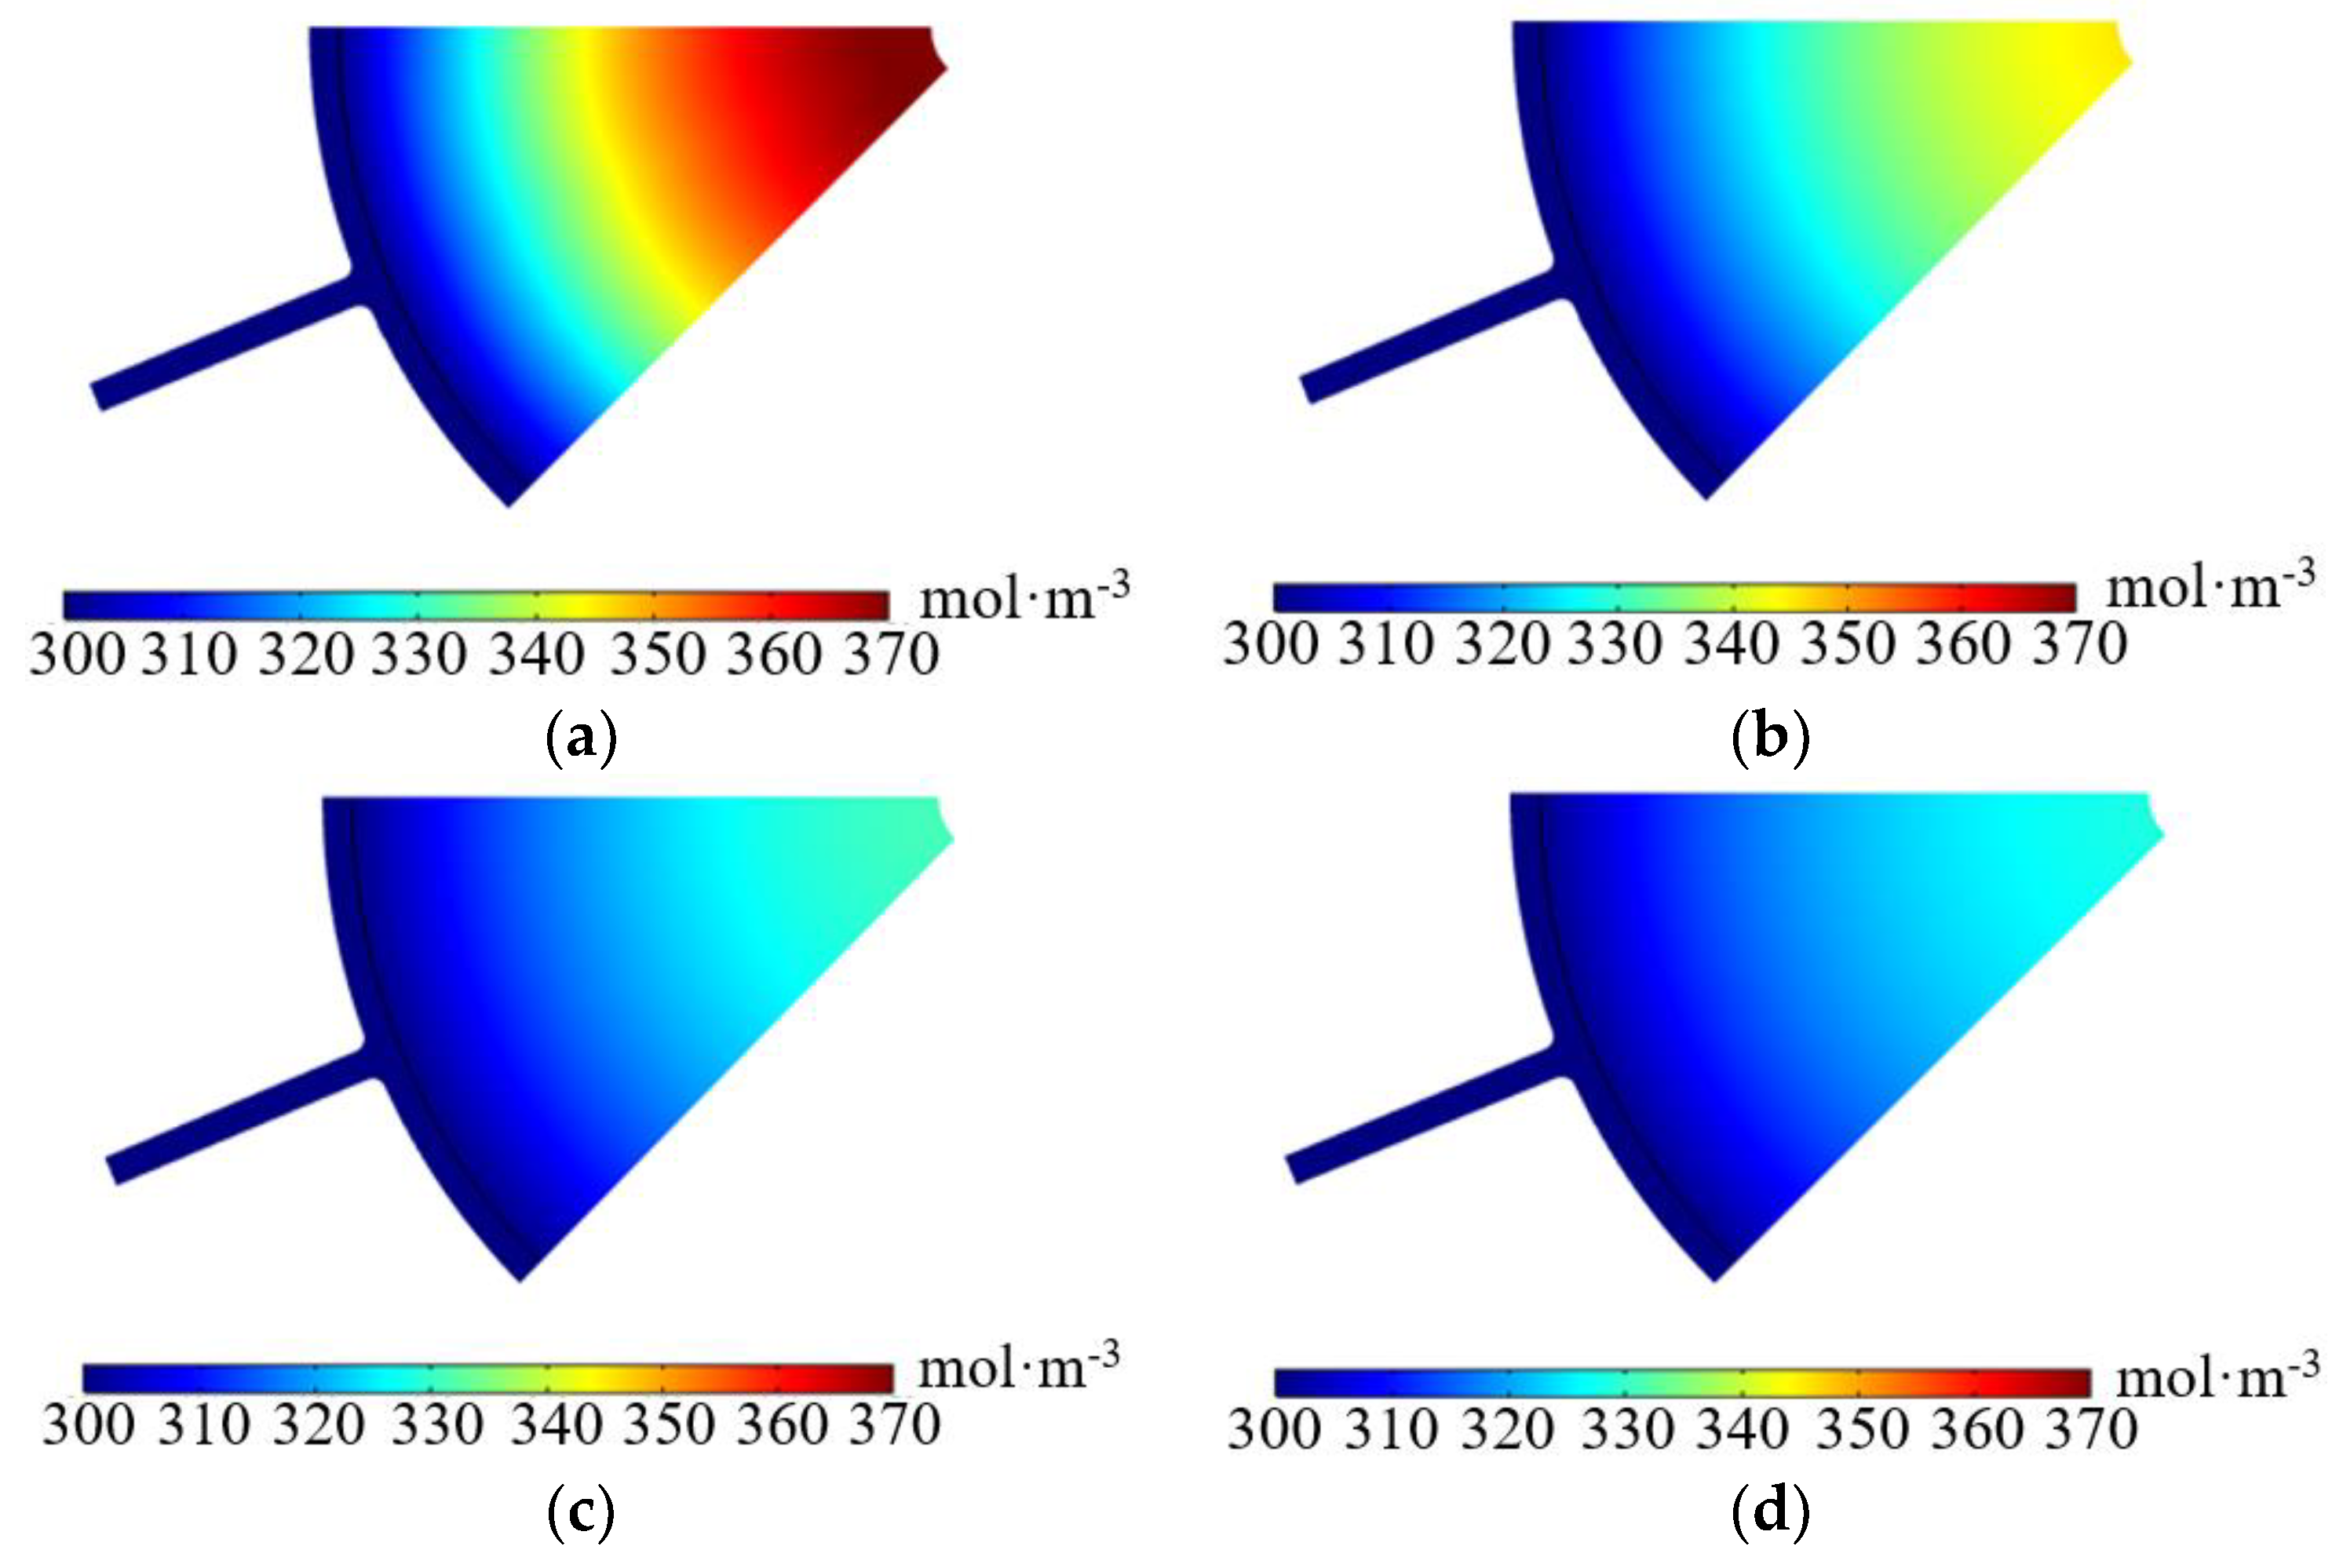
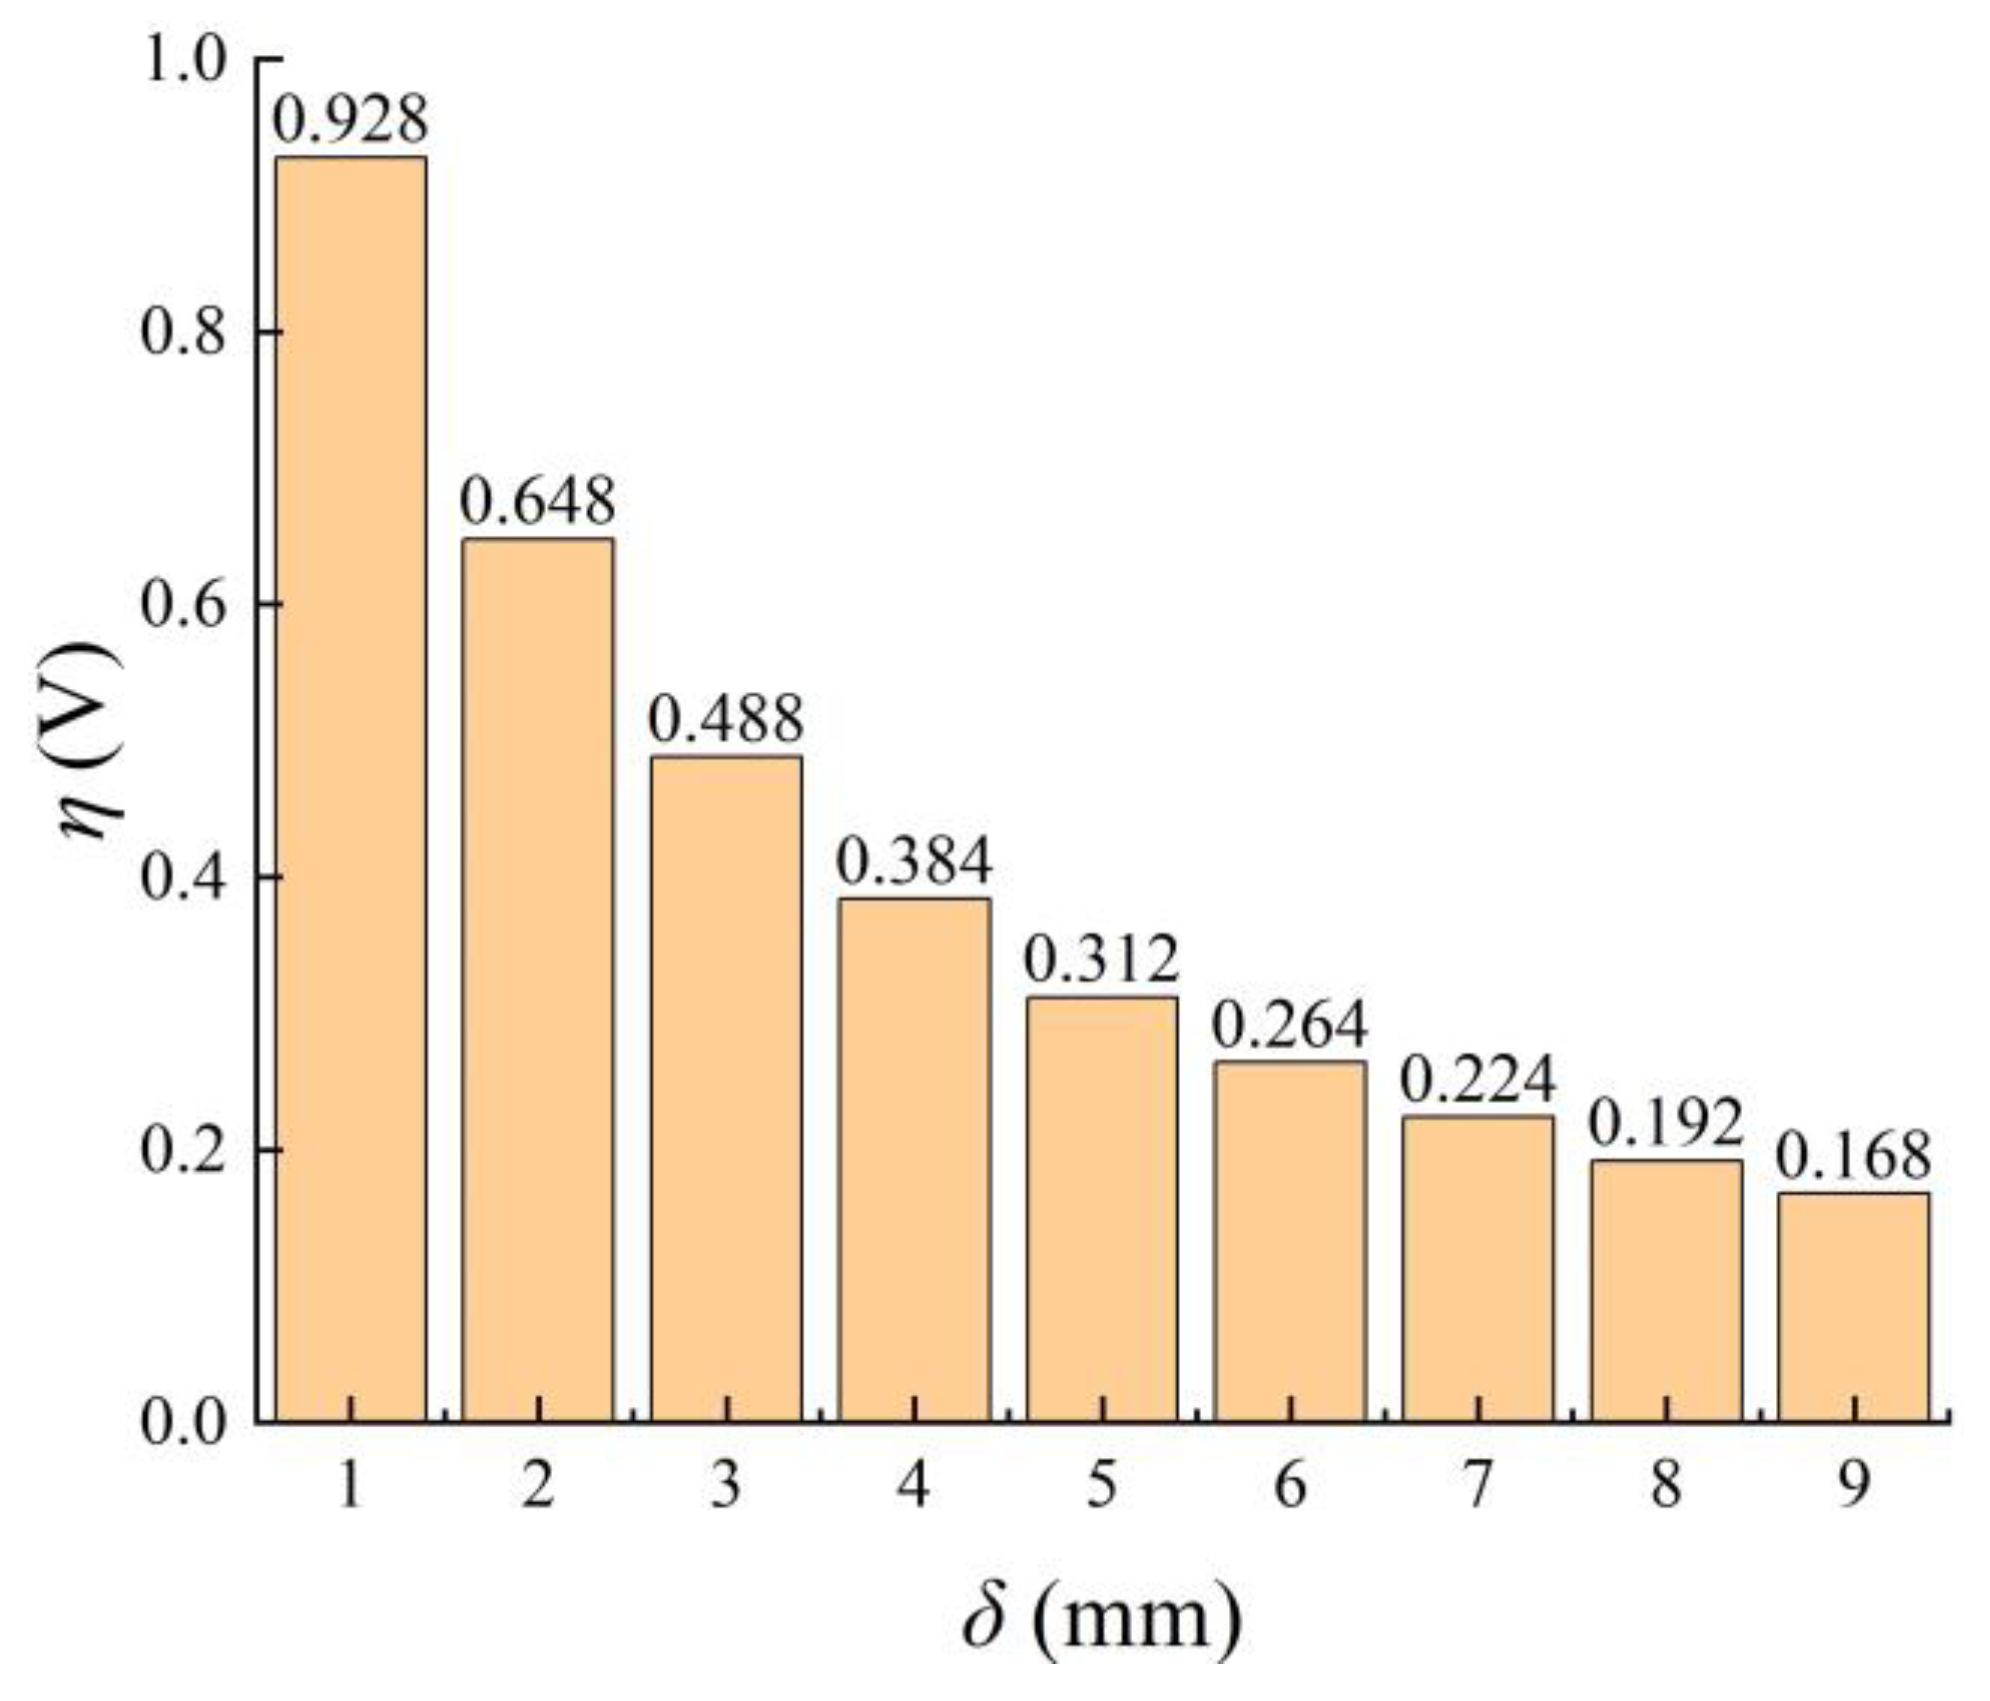
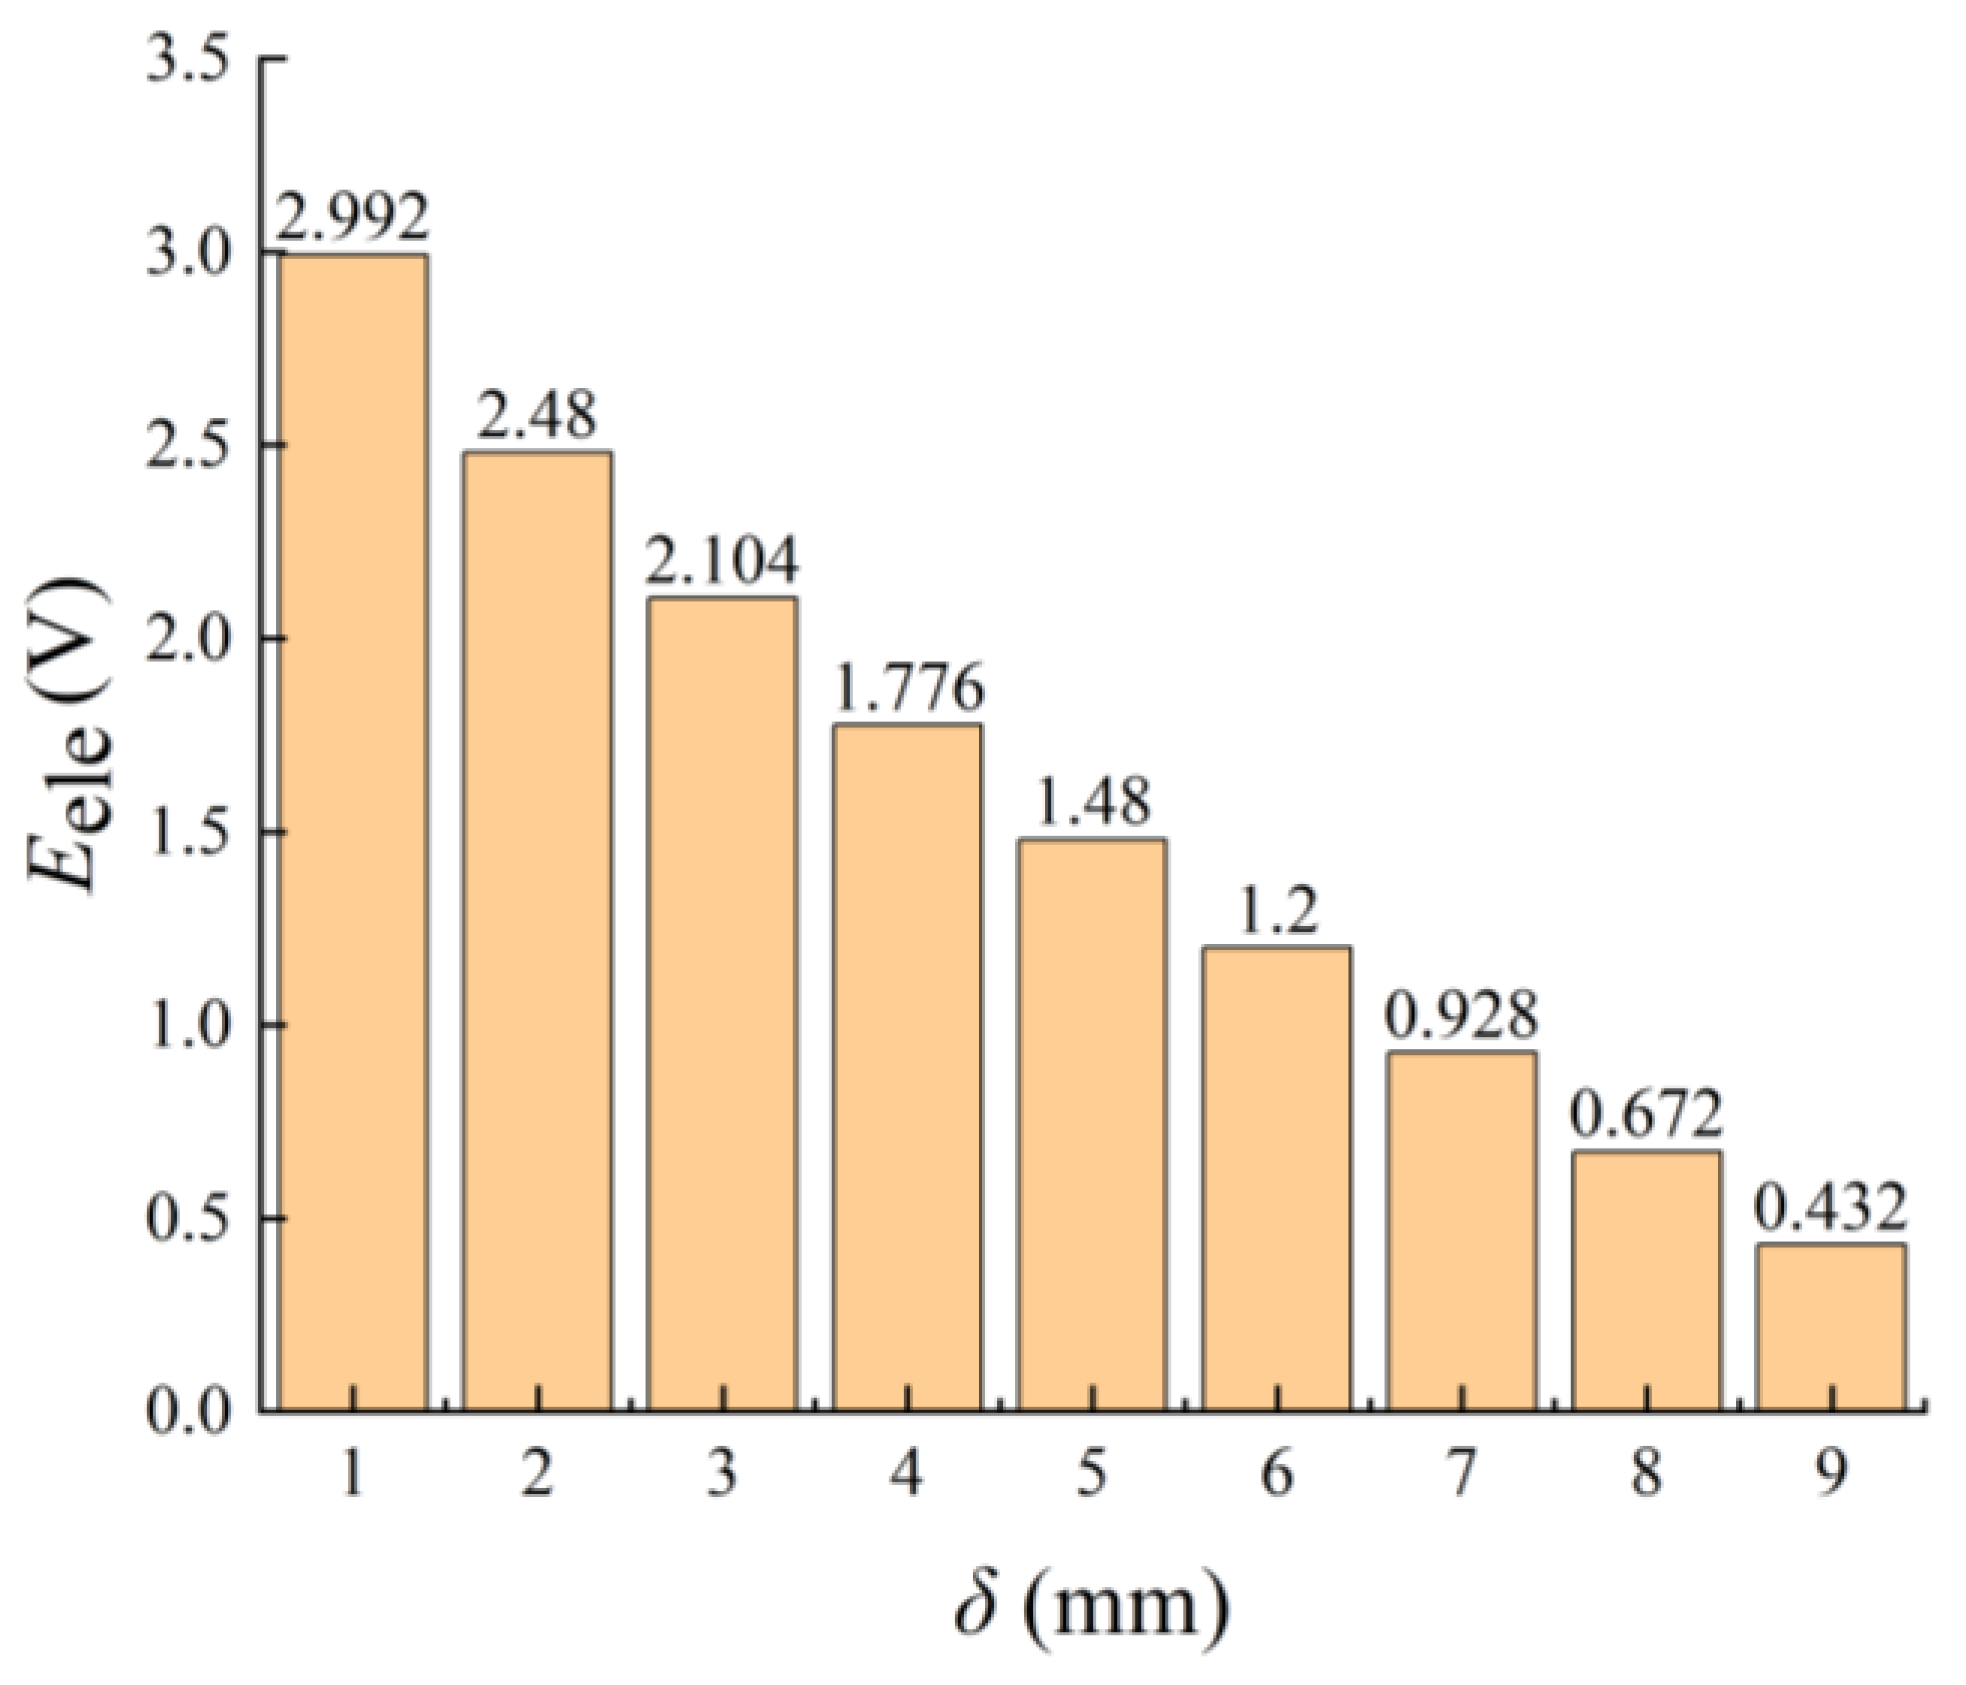
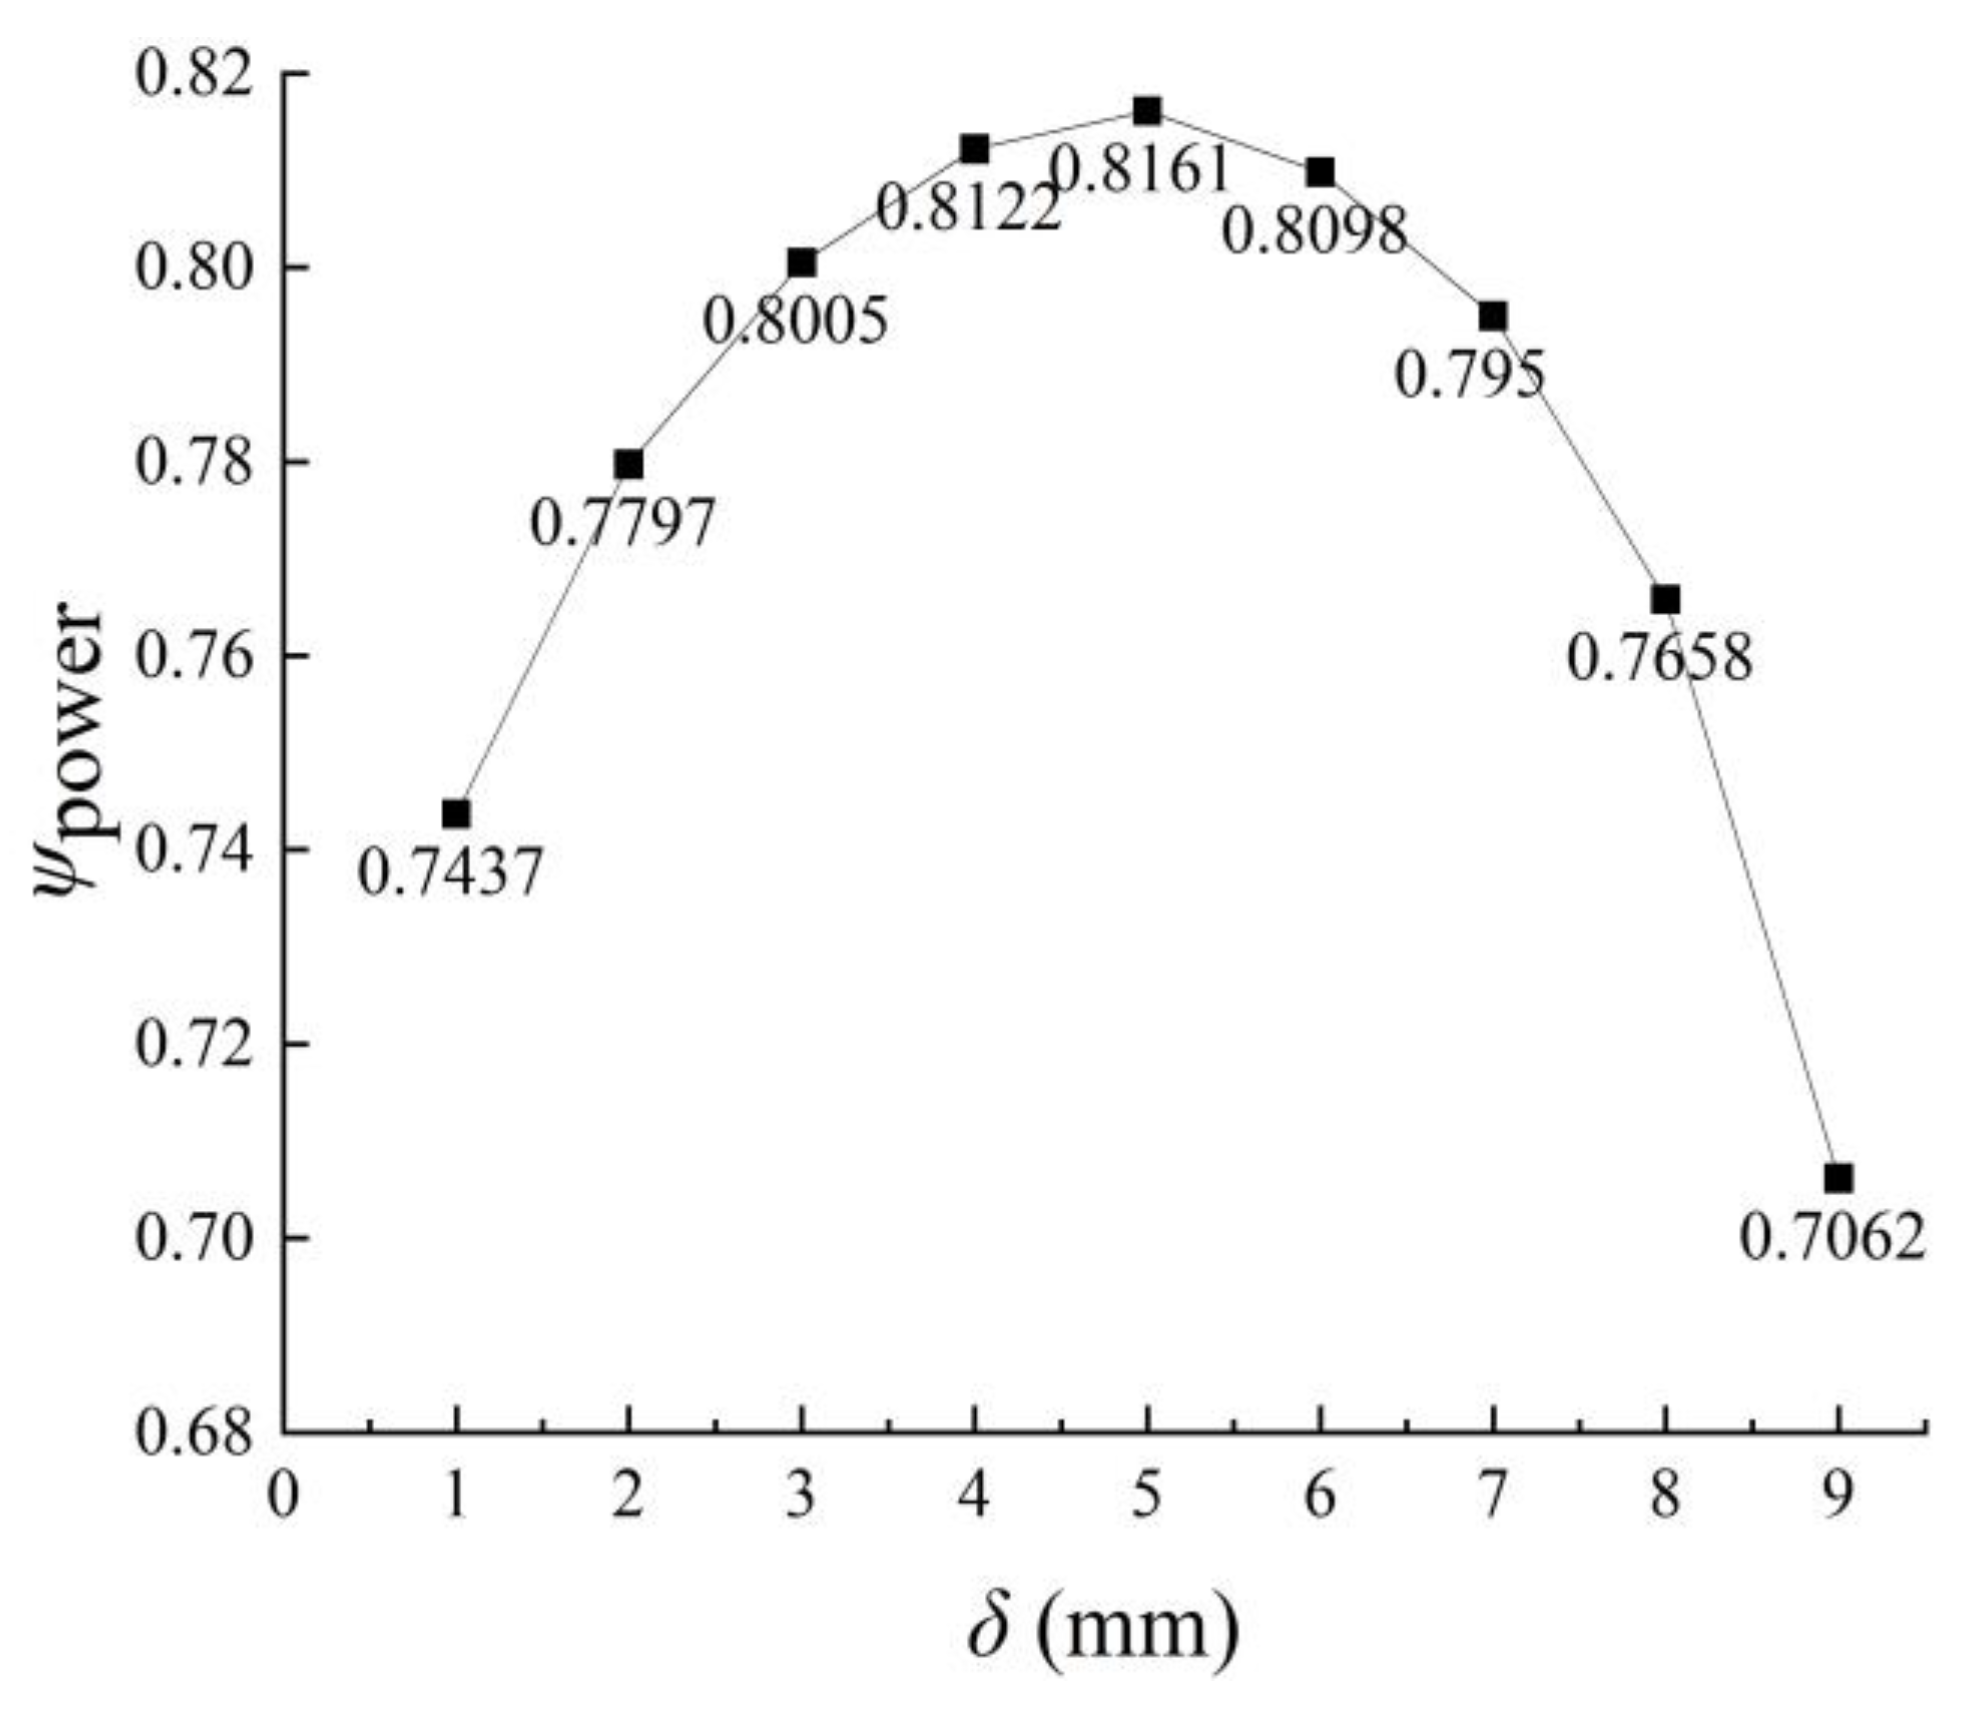
3.1. Electrode Thickness Optimization Analysis
3.1.1. Variations
3.1.2. Performance Parameters
3.2. Operating Characteristics Analysis
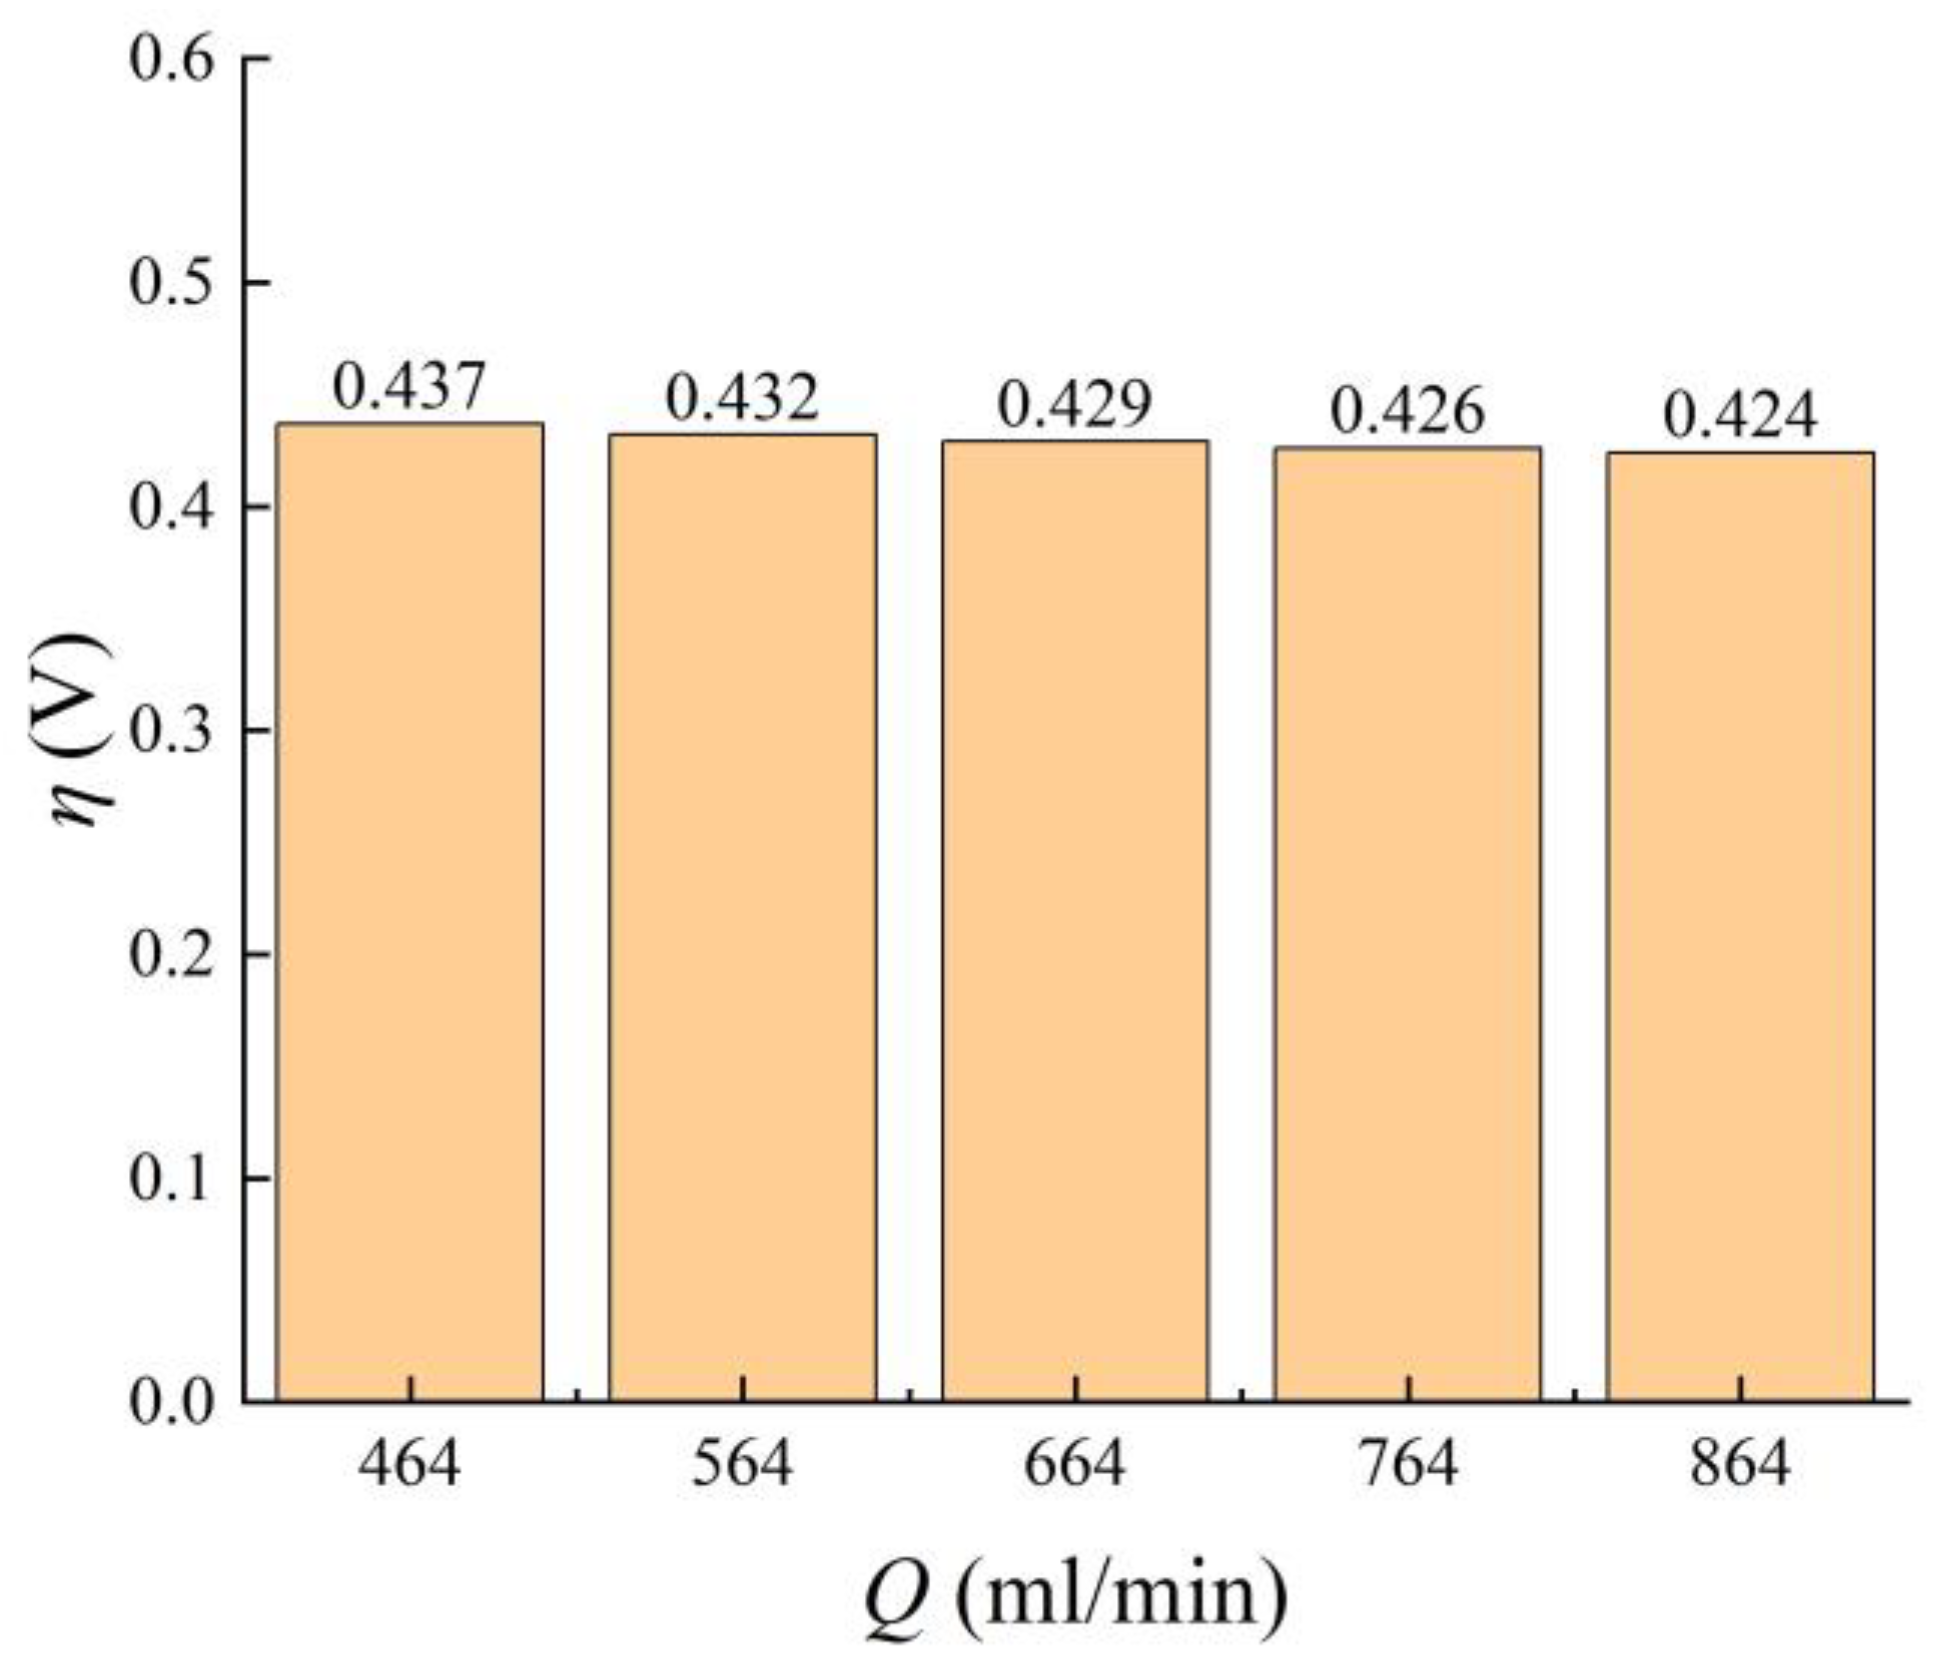
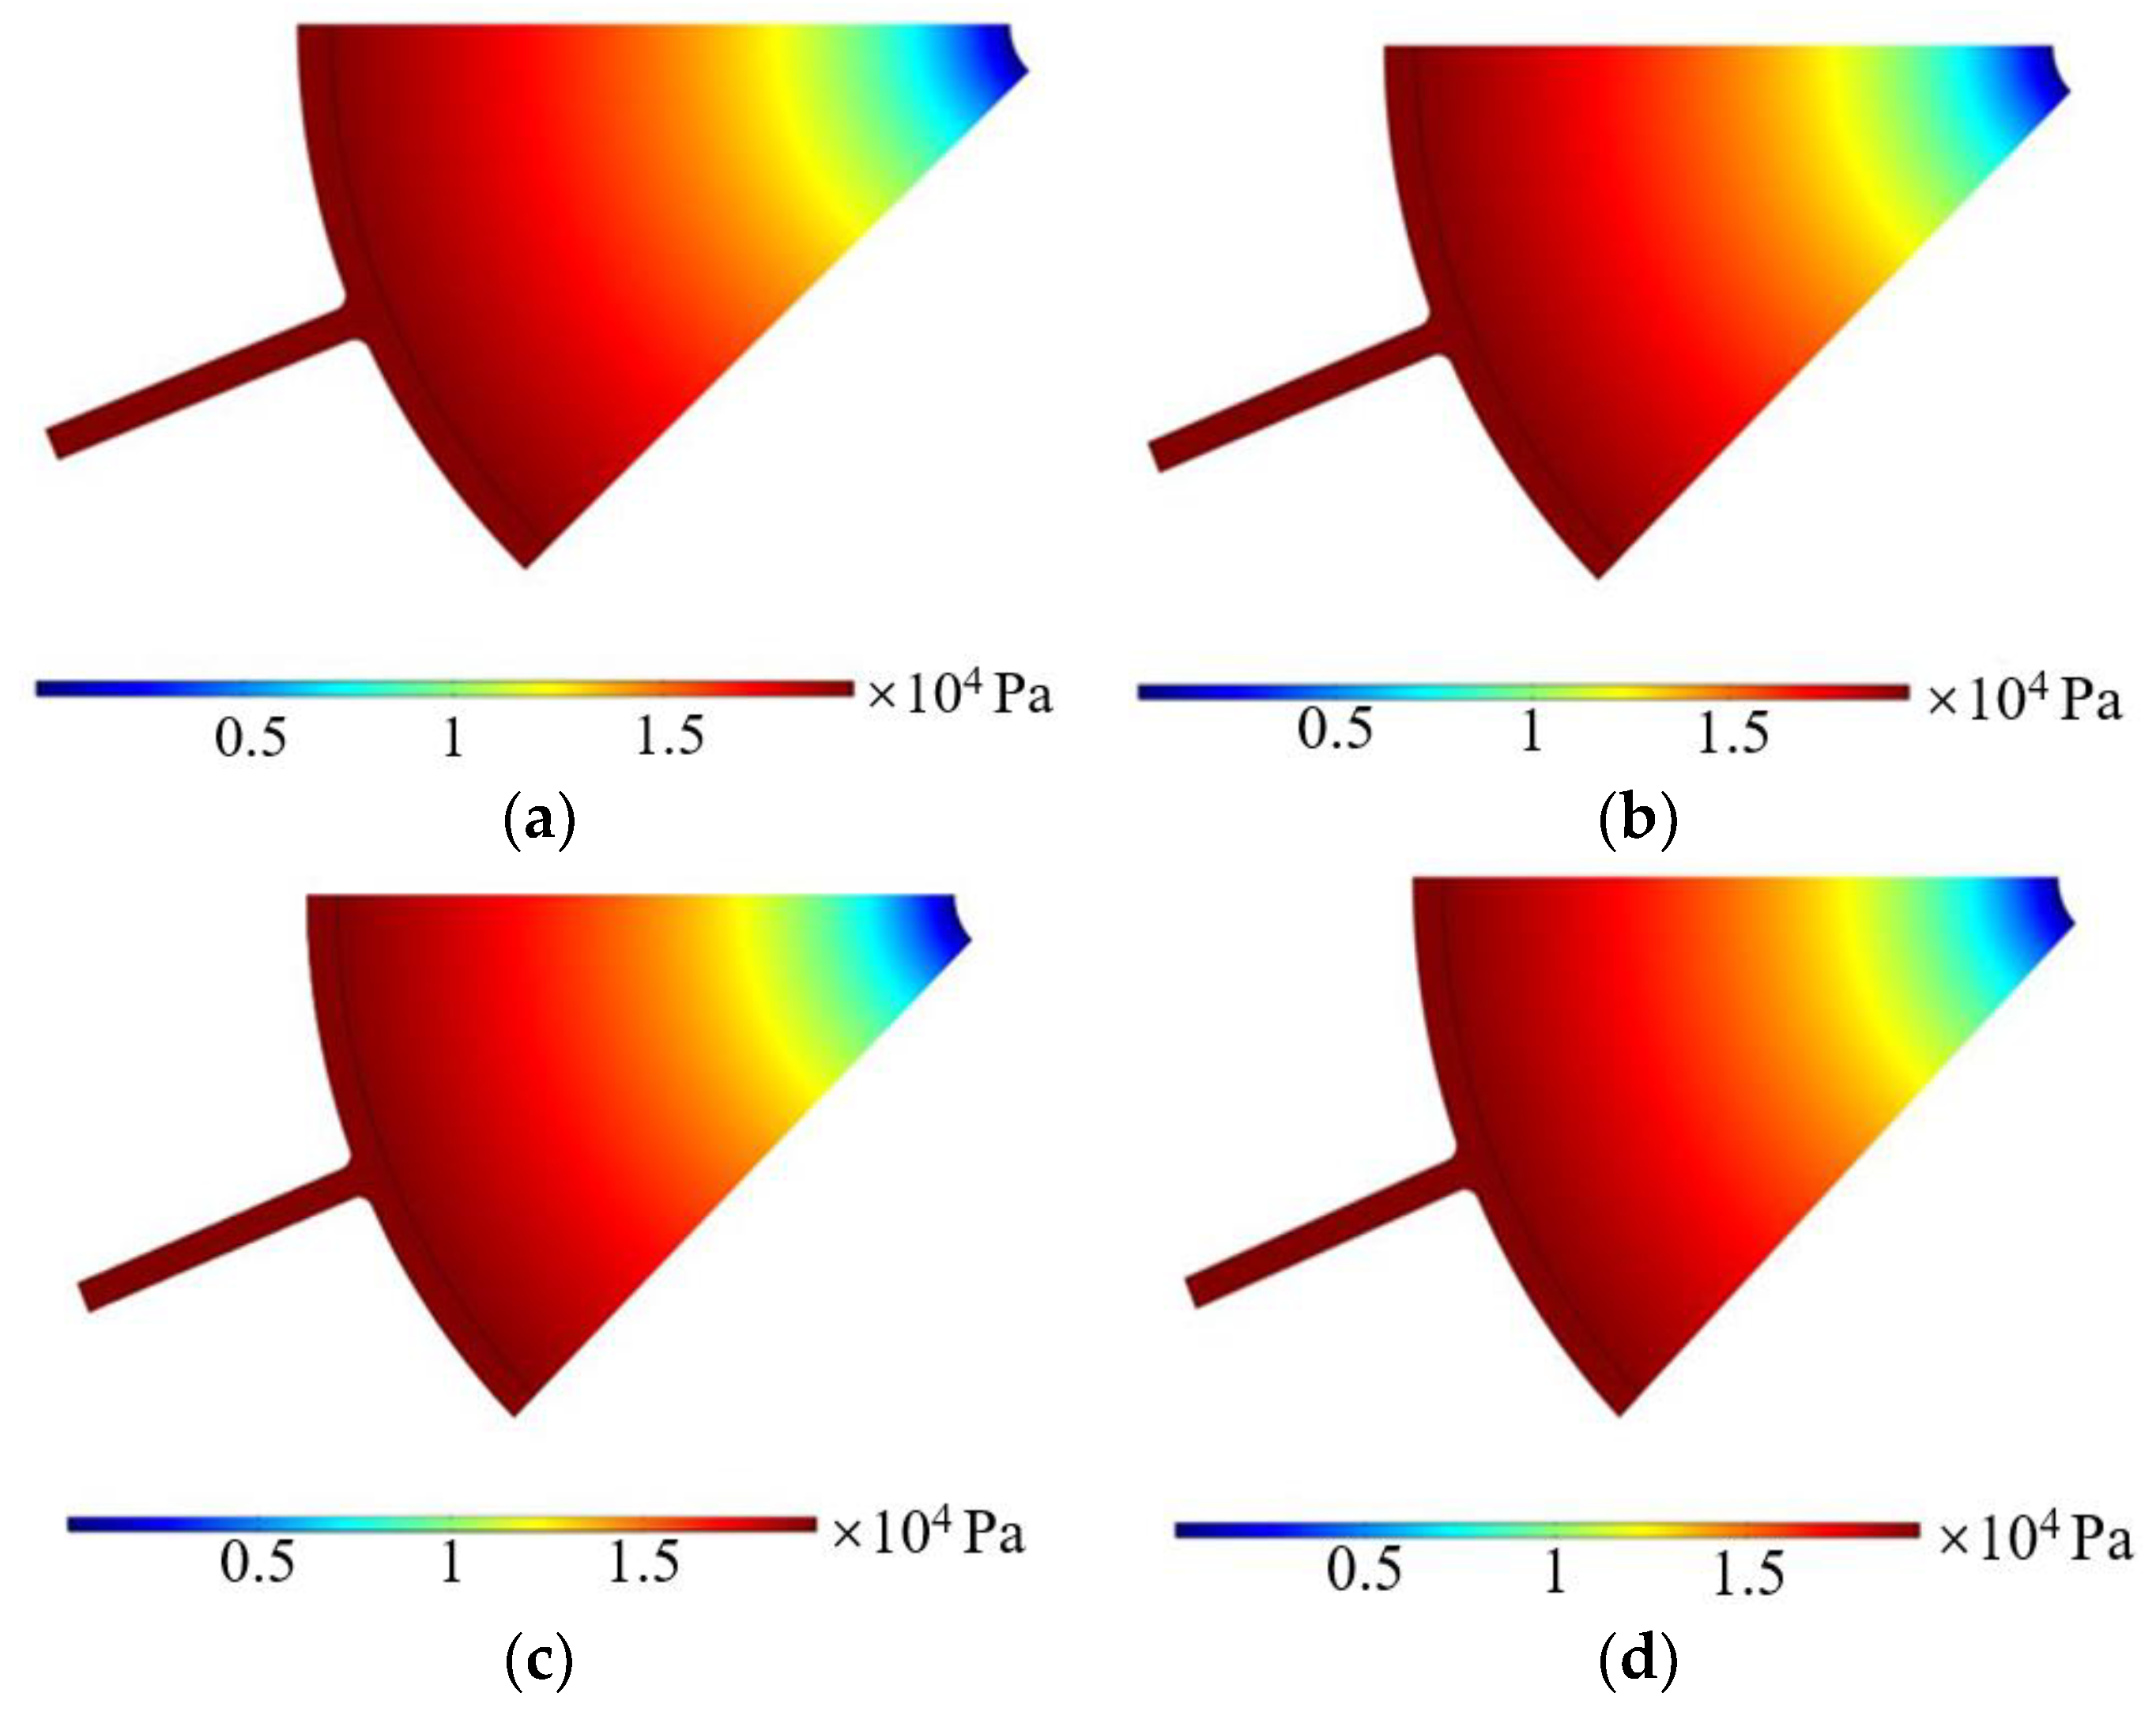
3.2.1. Imported Electrolyte Flow Rate
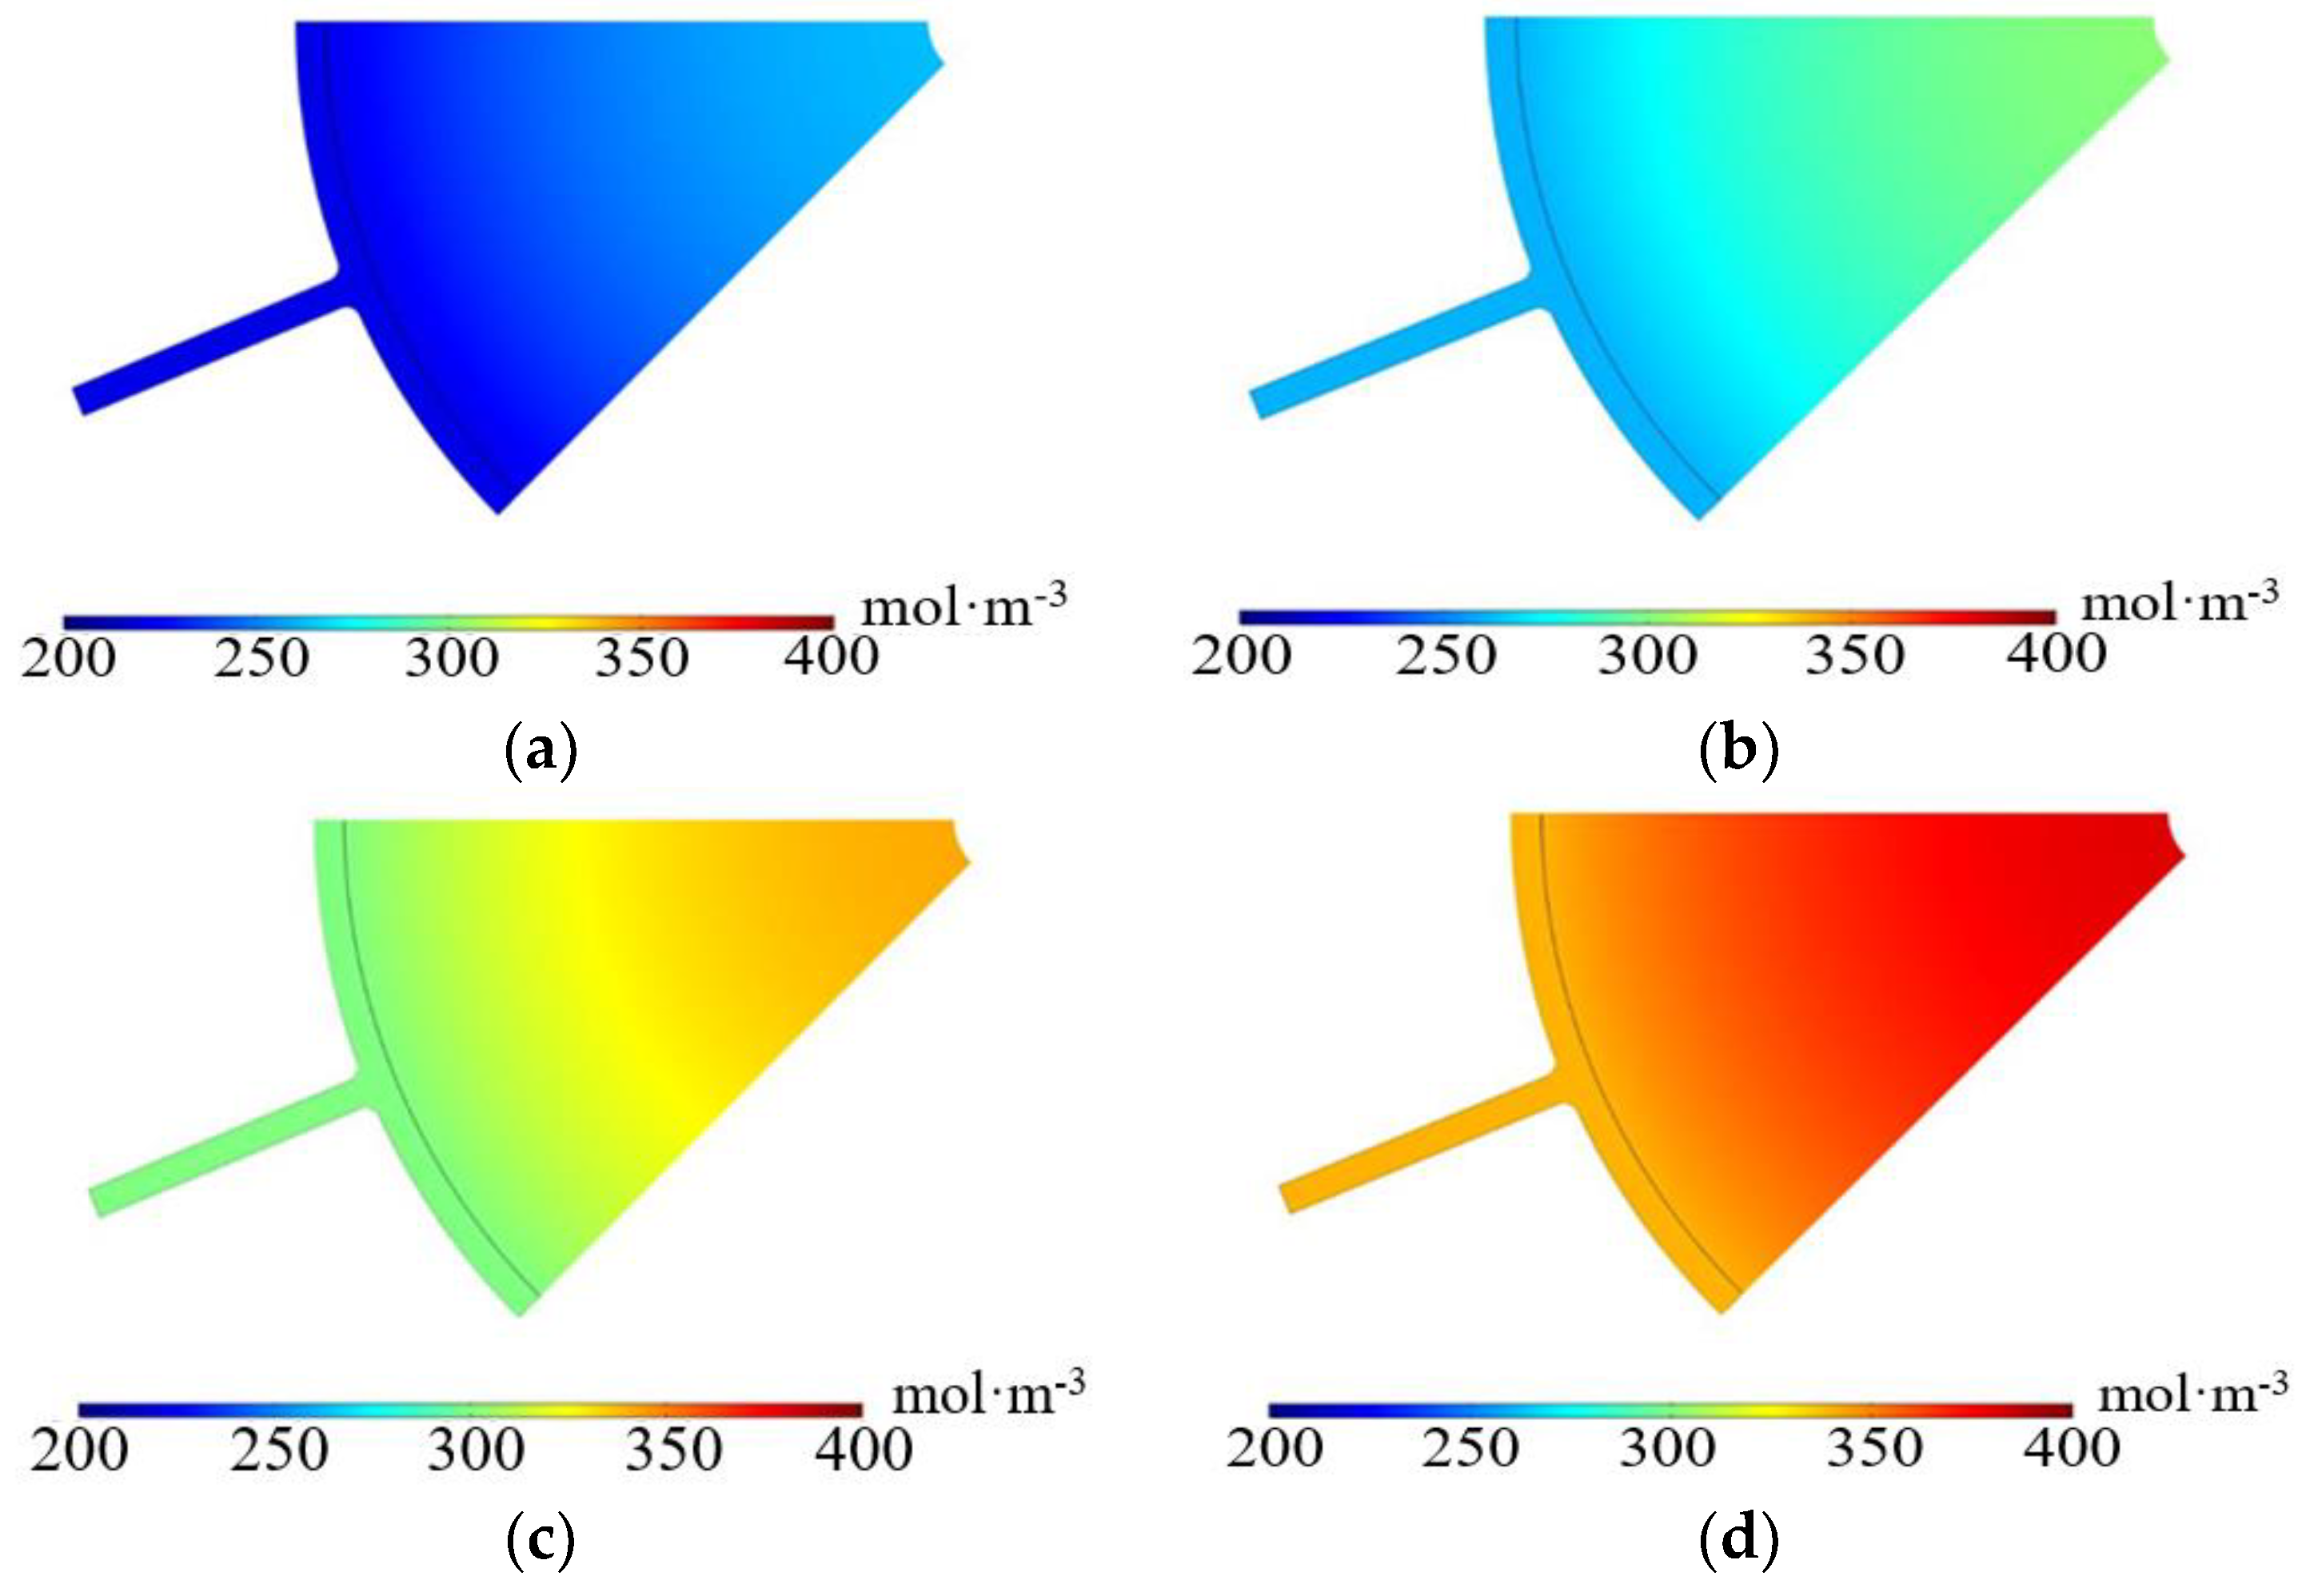
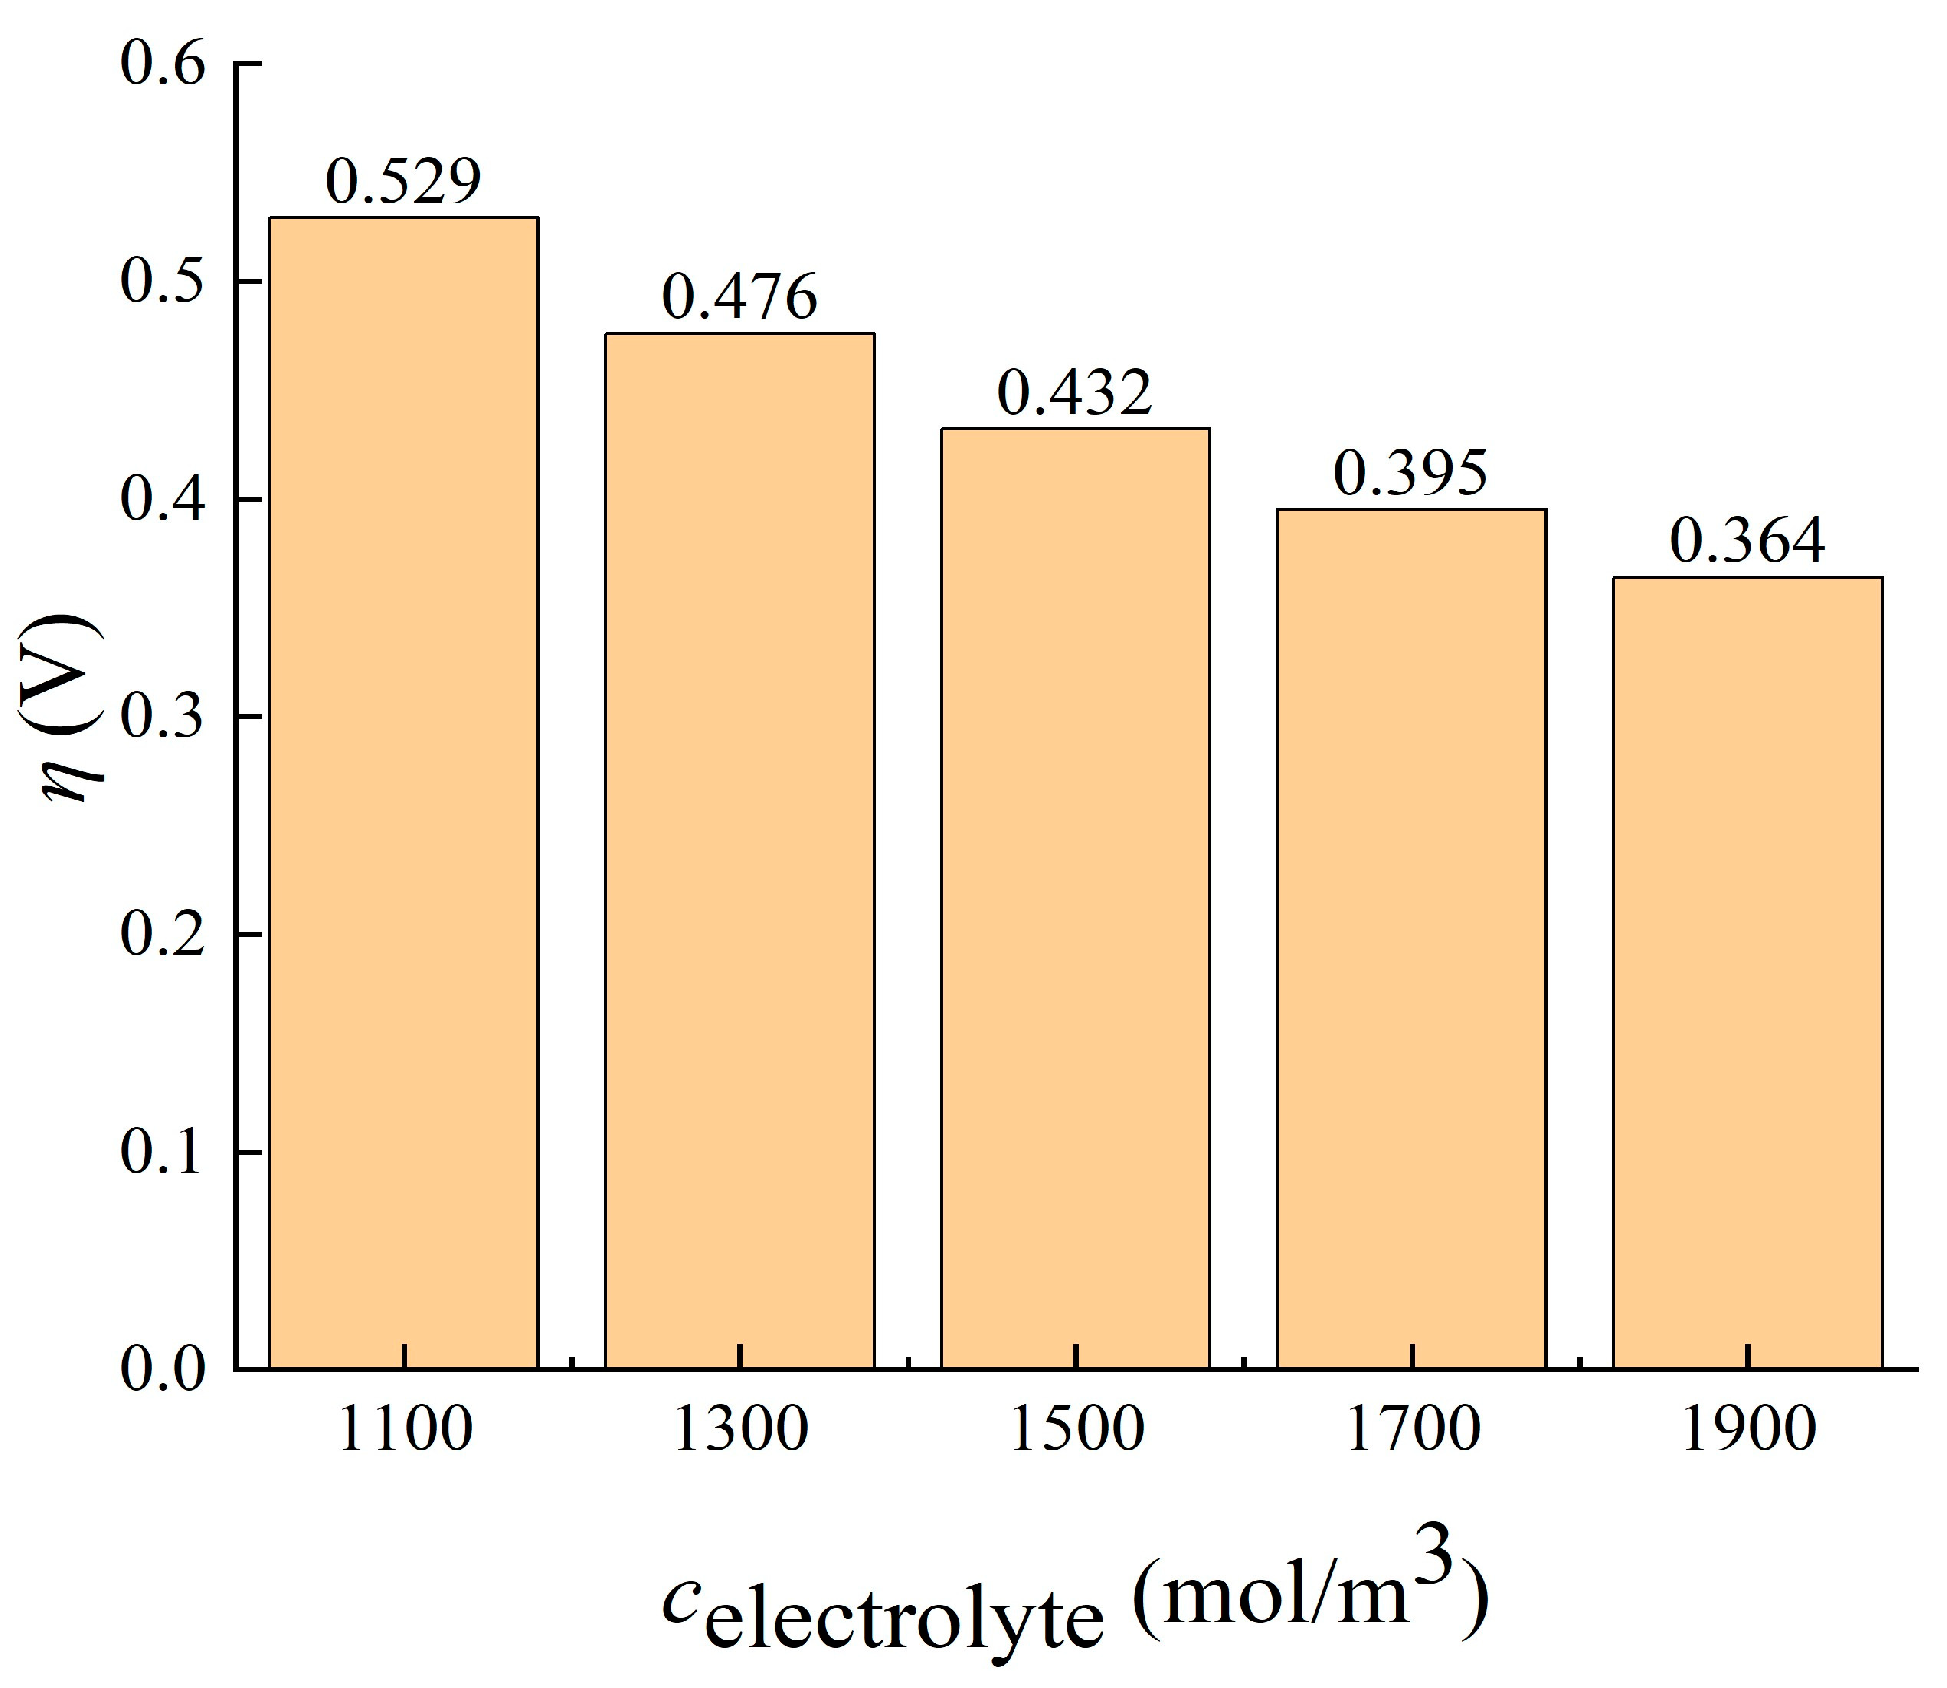
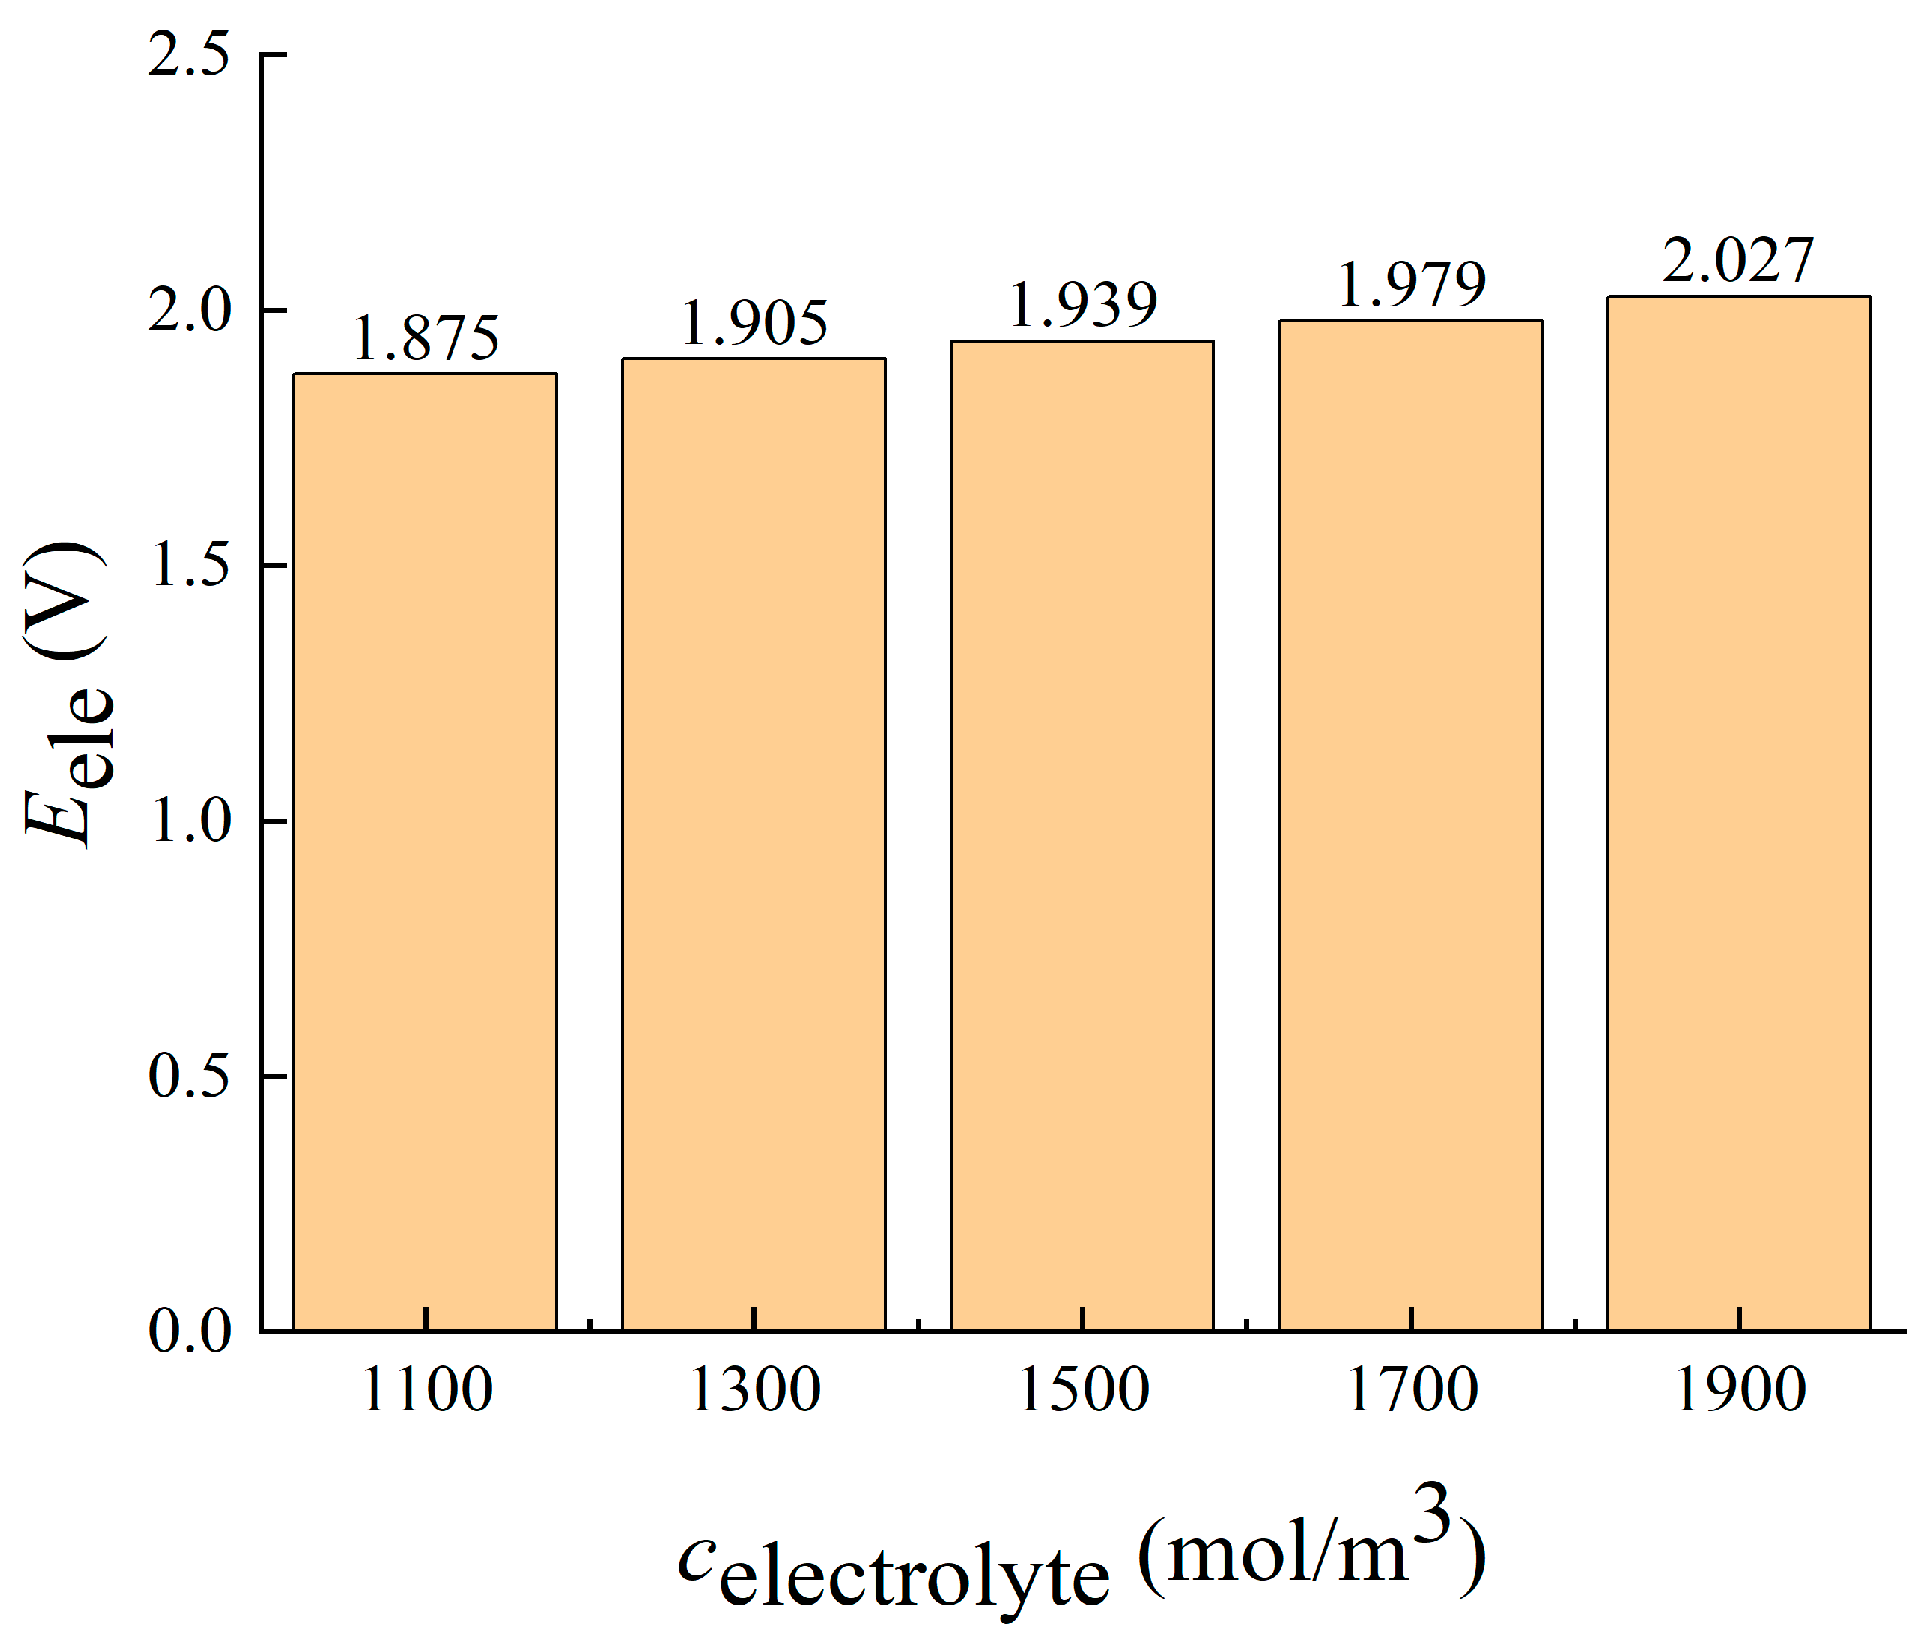
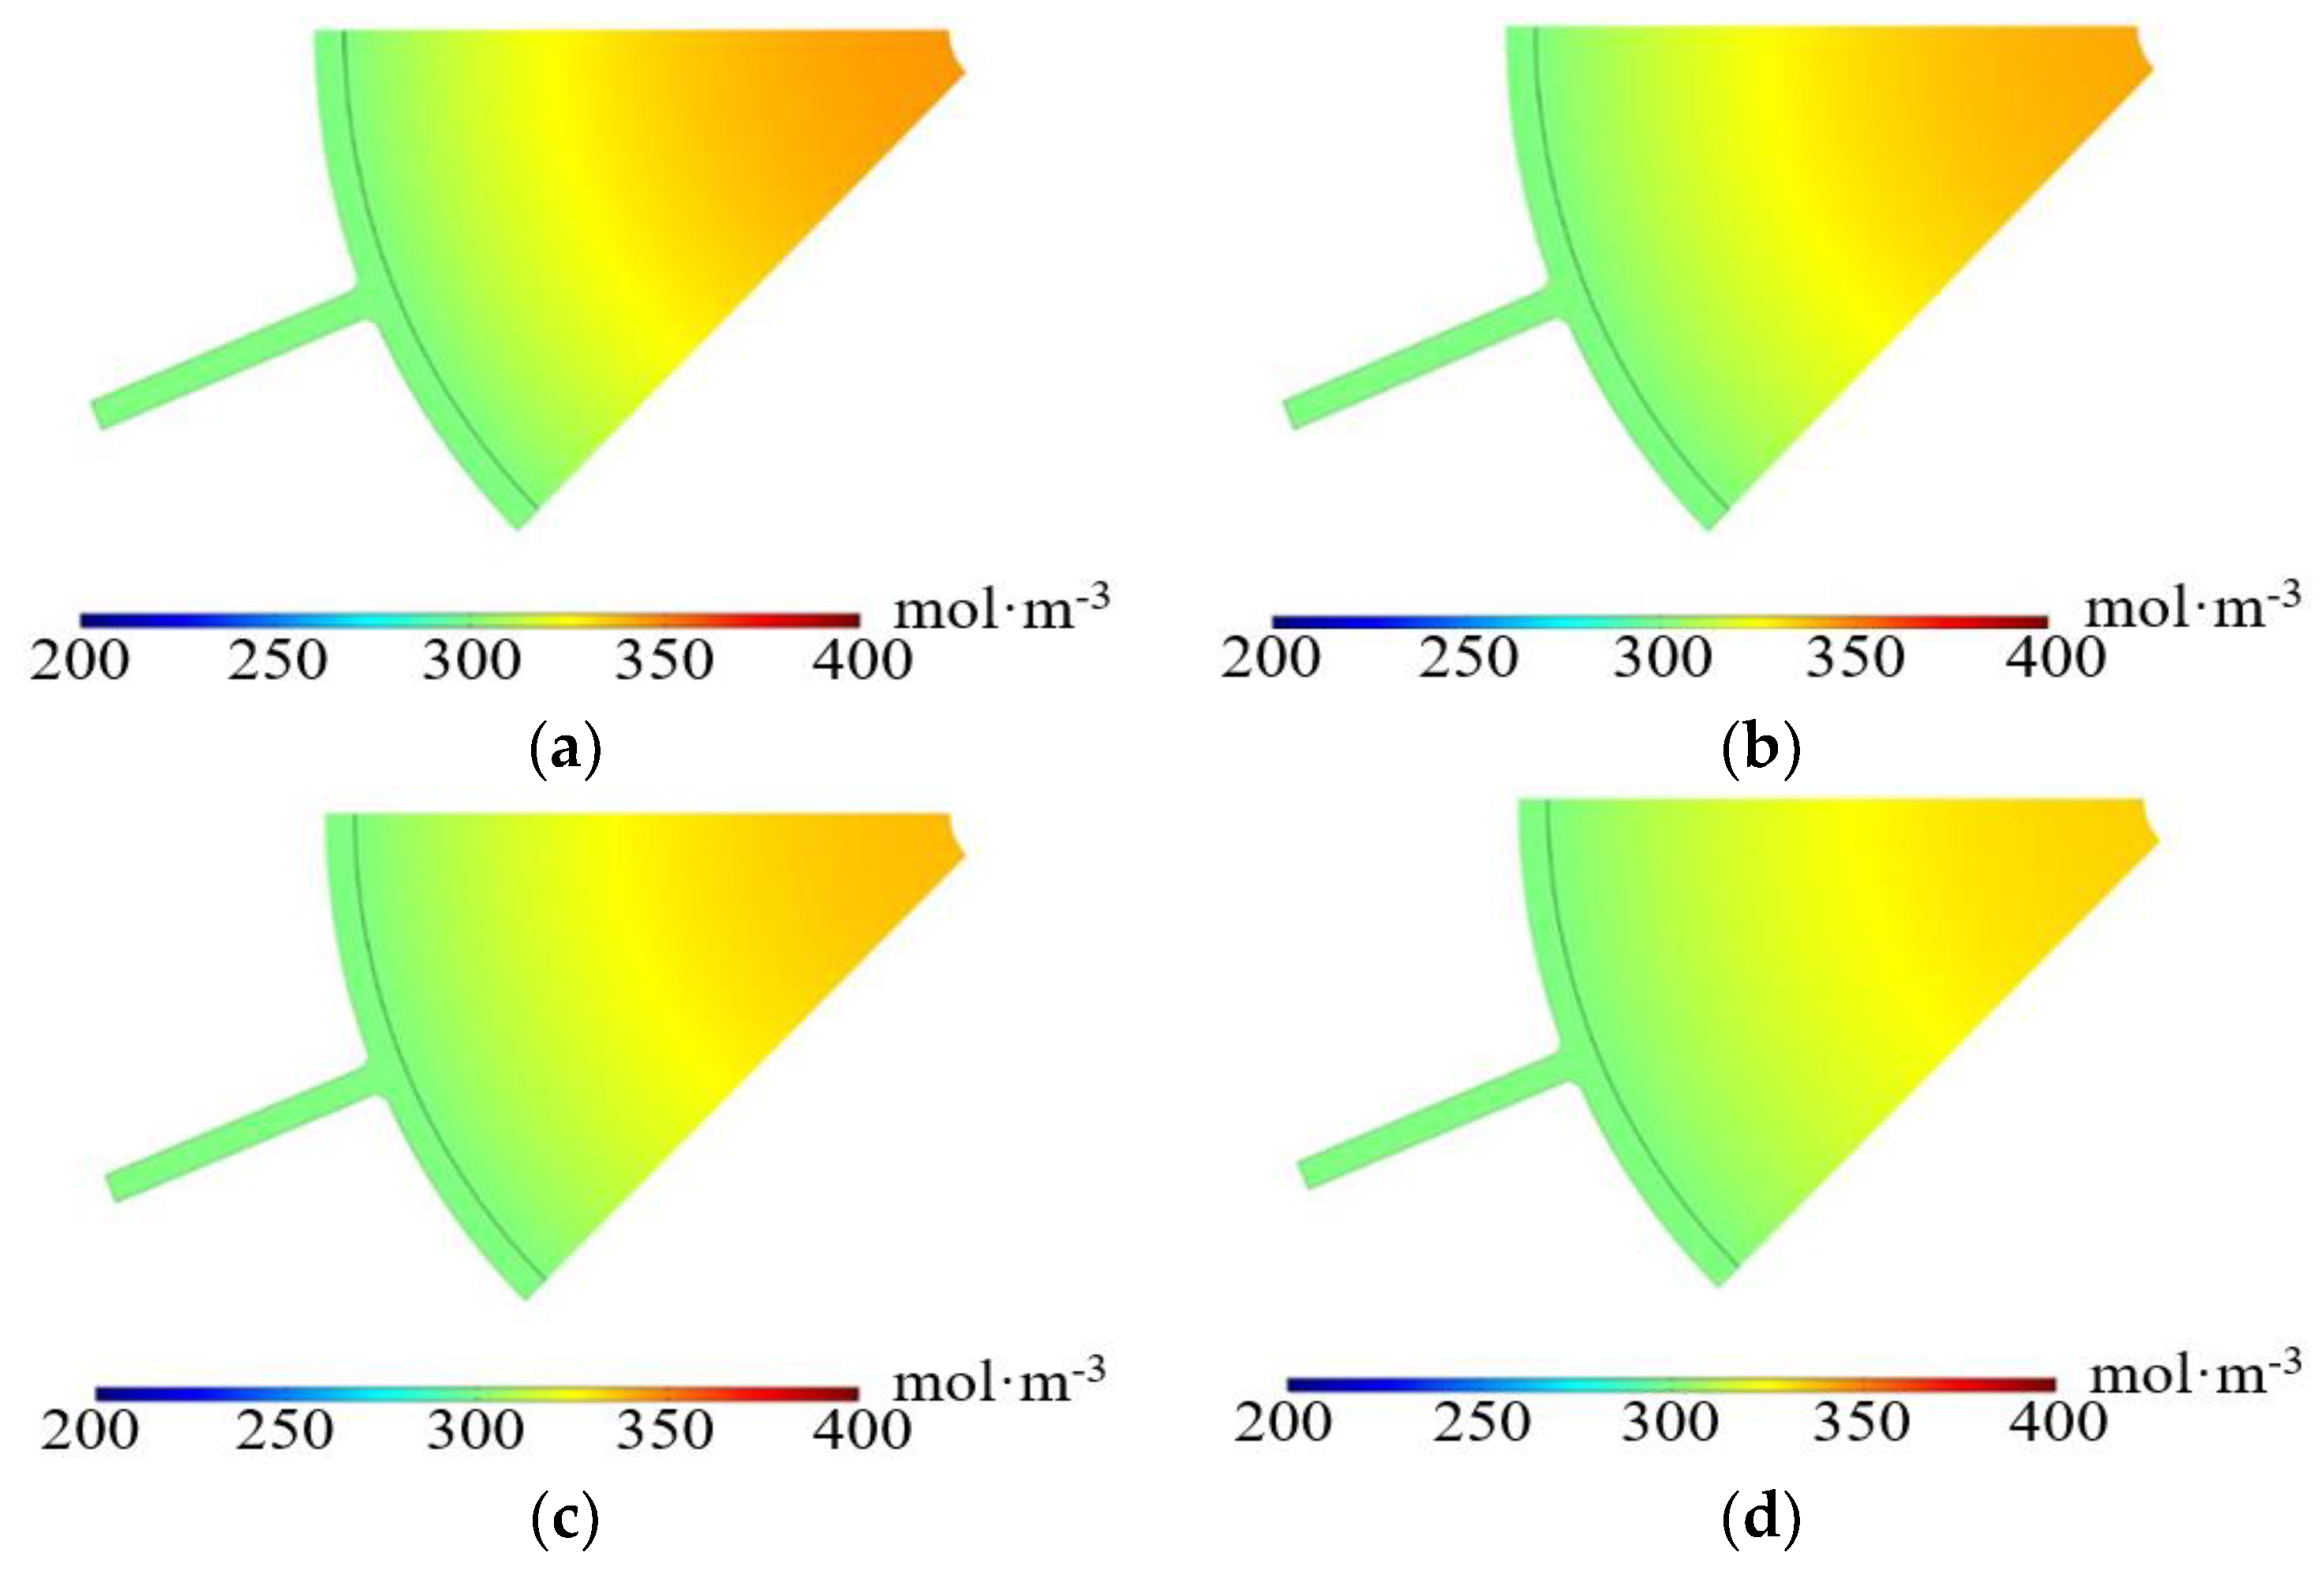
3.2.2. Imported Electrolyte Concentration
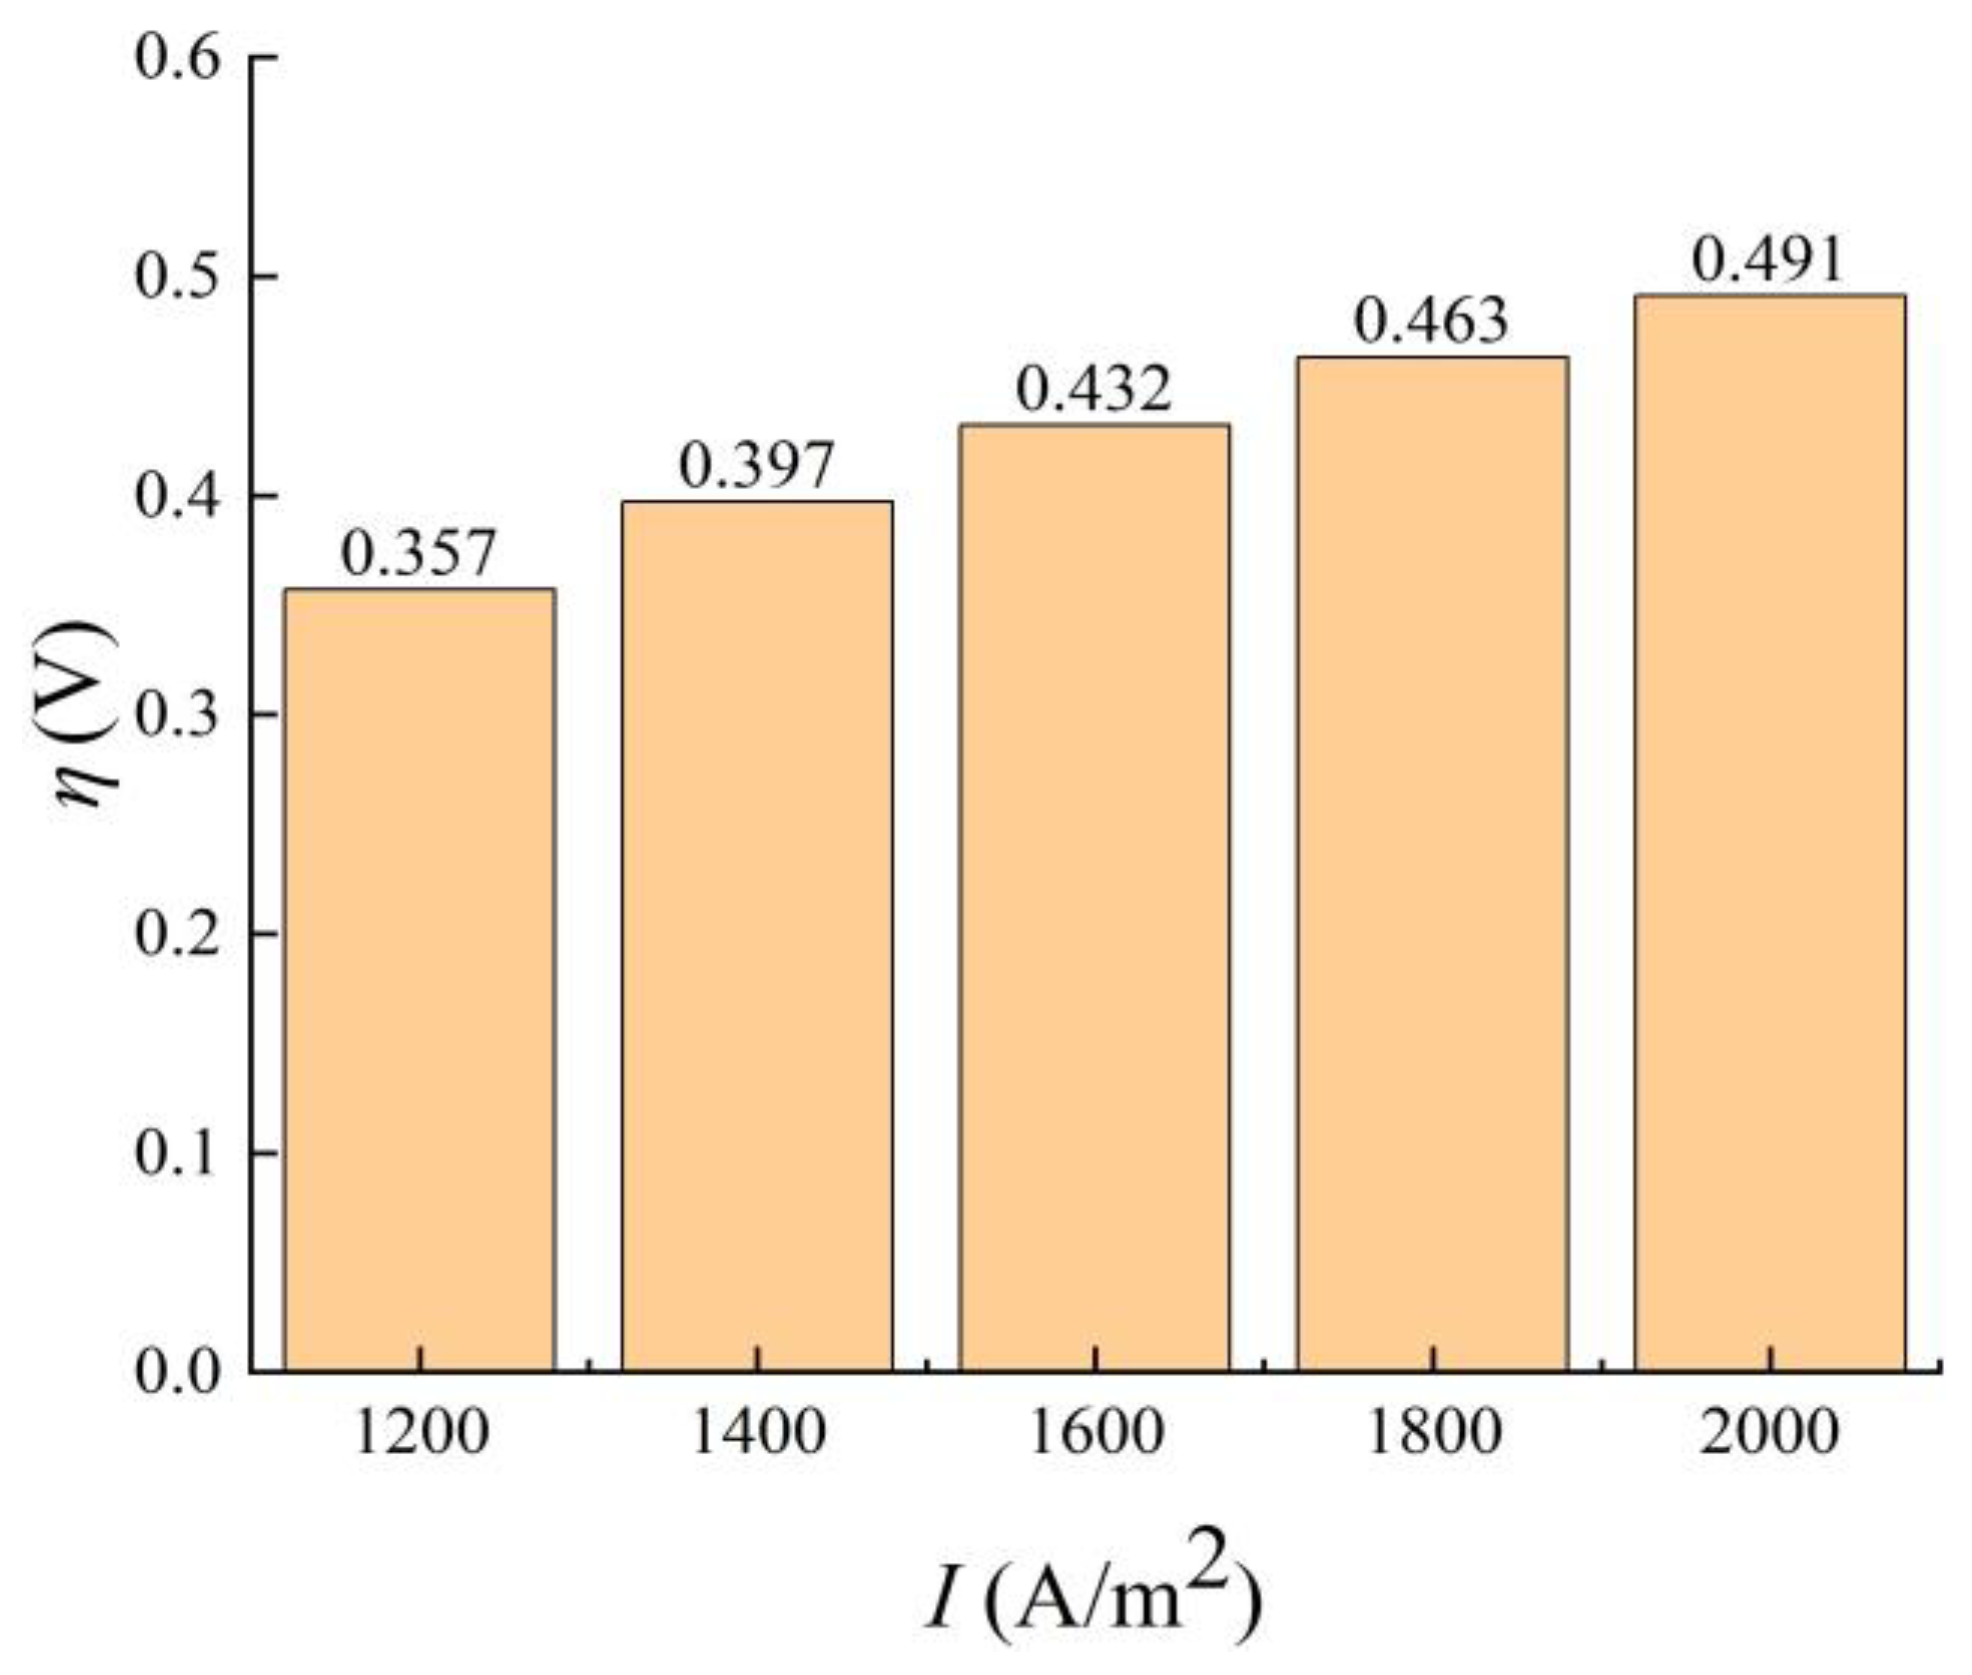
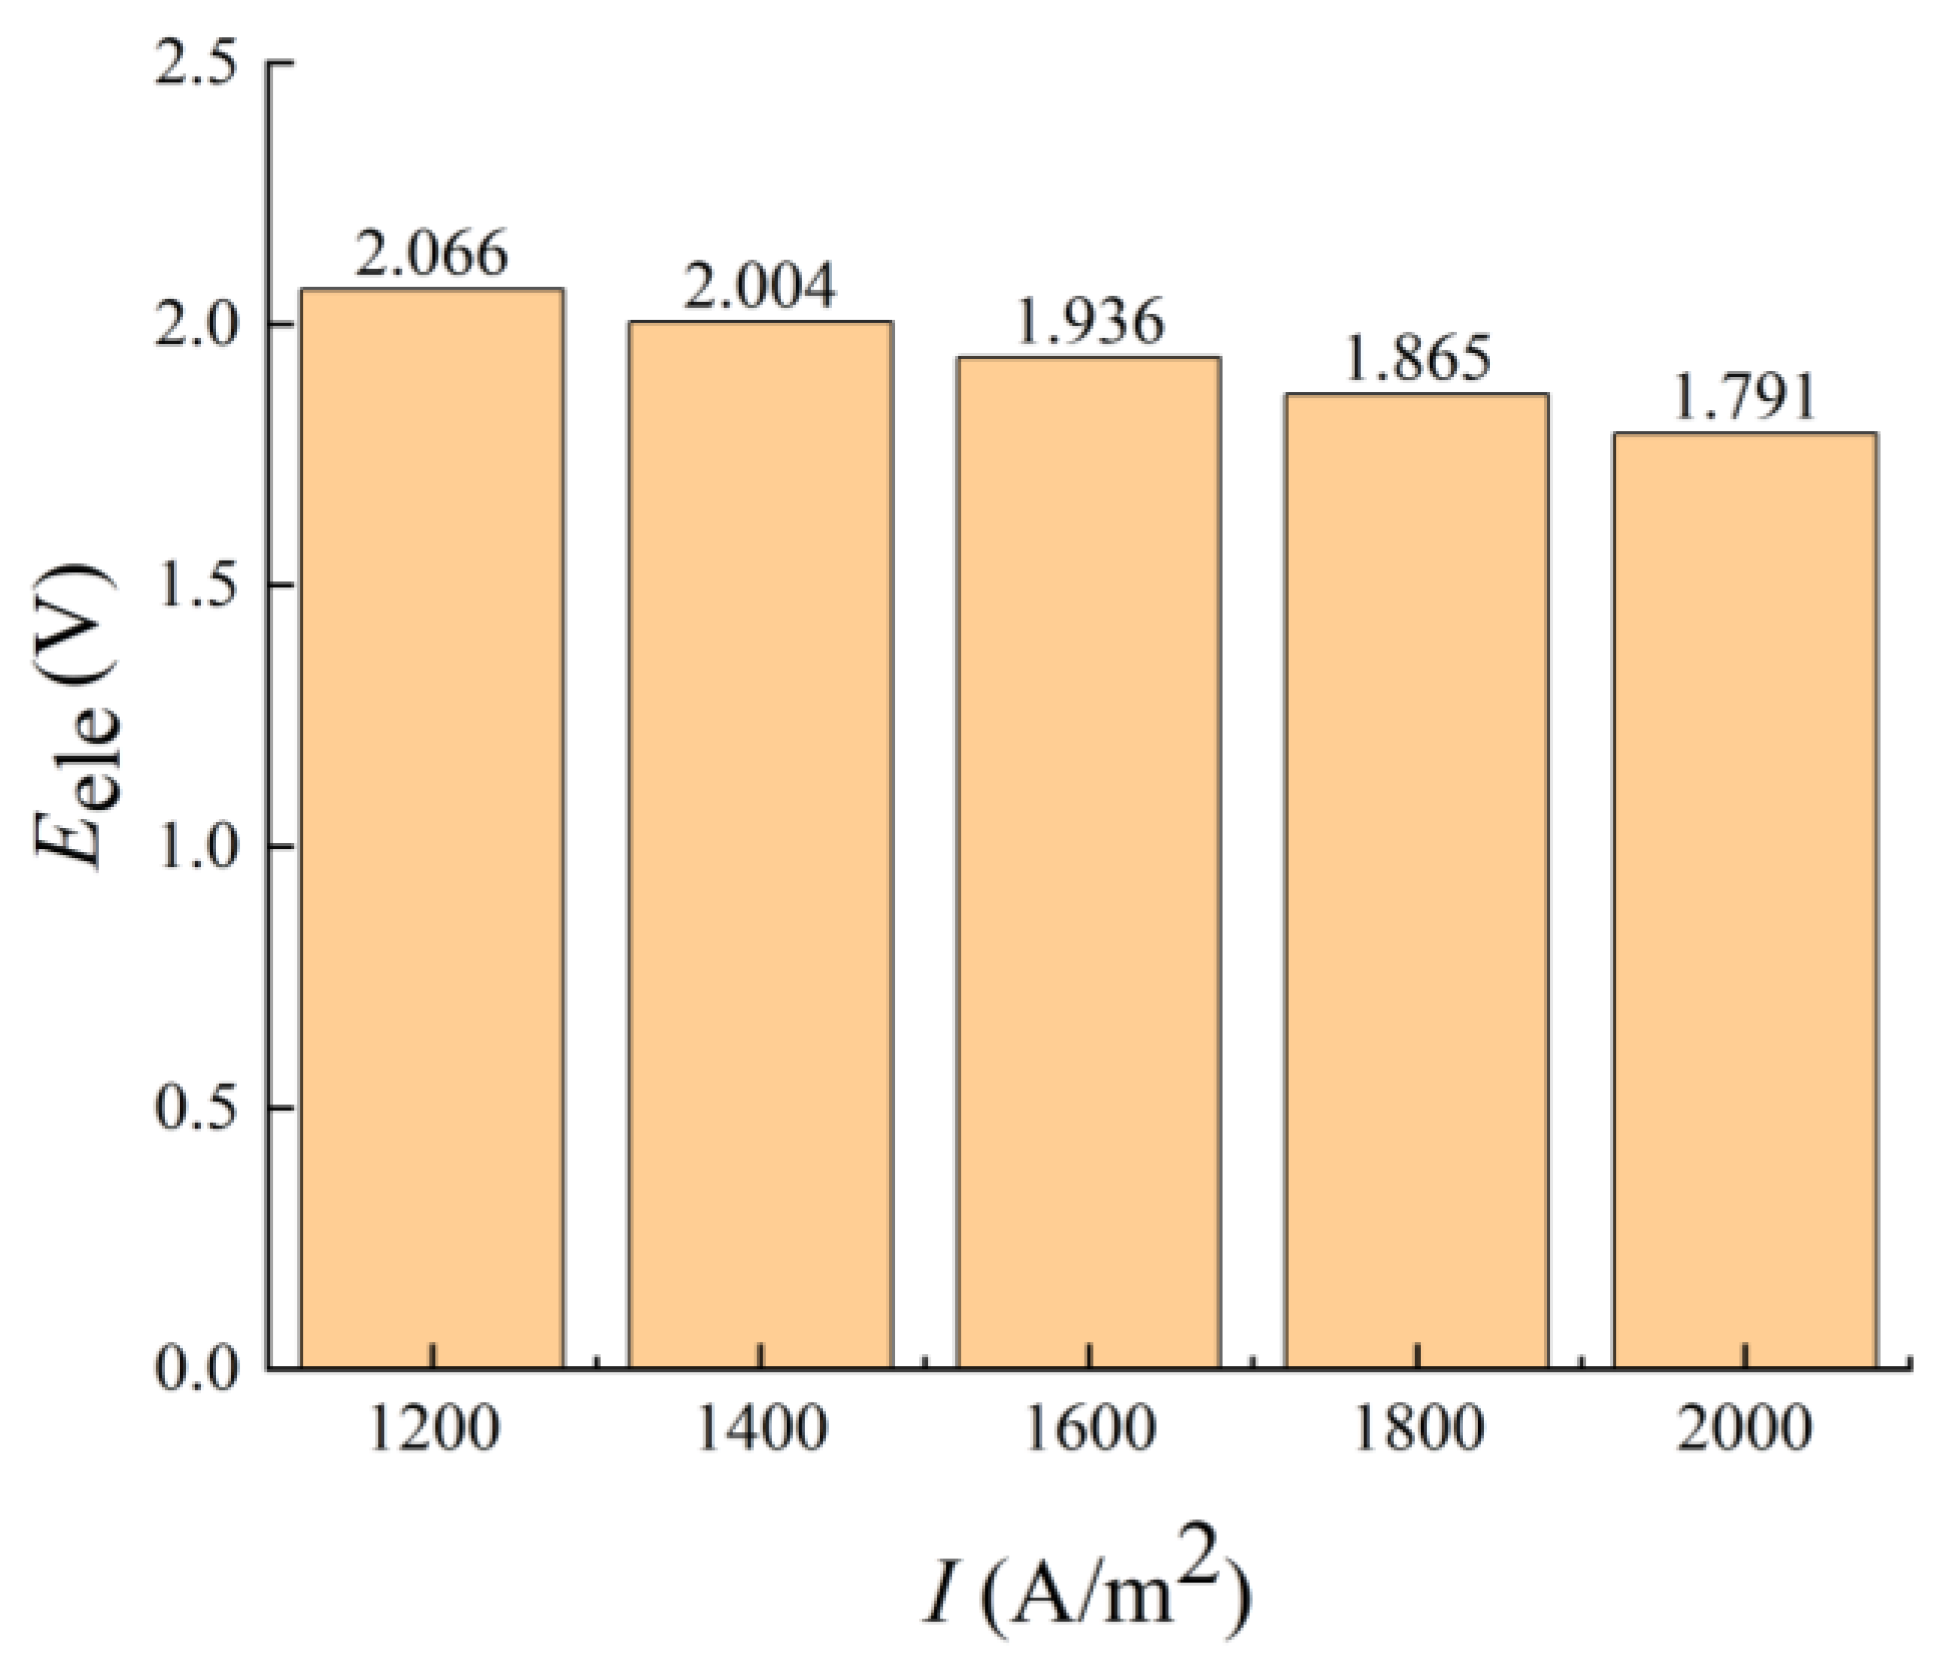
3.2.3. Electrode Current Density
4. Conclusions
Author Contributions
Funding
Institutional Review Board Statement
Informed Consent Statement
Data Availability Statement
Conflicts of Interest
References
- Chen, H.S.; Liu, C.; Xu, Y.J. The strategic position and role of energy storage in the context of the carbon neutrality objective of carbon peaking. Energy Storage Sci. Technol. 2021, 10, 1477–1485. [Google Scholar] [CrossRef]
- Zhang, H.; Sun, C.Y.; Ge, M.M. Review of the Research Status of Cost-Effective Zinc–Iron Redox Flow Batteries. Batteries 2022, 8, 202. [Google Scholar] [CrossRef]
- Liu, B.; Tang, C.W.; Zhang, C.; Jia, G.C.; Zhao, T. Cost-effective, High-Energy-Density, Nonaqueous Nitrobenzene Organic Redox Flow Battery. Chem. Mater. 2021, 33, 978–986. [Google Scholar] [CrossRef]
- Lu, Z.Y.; Jiang, S.; Li, Q.L. Open circuit voltage variation of an all-vanadium liquid flow battery during the end-of-charge shelving phase. Energy Storage Sci. Technol. 2022, 11, 2046–2050. [Google Scholar] [CrossRef]
- Tao, W.Q. Multi-Scale Numerical Simulation of Heat Transfer and Flow Problems: Methods and Applications; Beijing Science and Technology Press: Beijing, China, 2009; pp. 15–45. ISBN 9787030231130. [Google Scholar]
- Li, Q.; Wang, J.N.; Sun, H. MWCNTs-COOH-NS modification of graphite felt electrodes for vanadium liquid flow batteries. Energy Storage Sci. Technol. 2021, 10, 2097–2105. [Google Scholar] [CrossRef]
- Zhang, H.; Zhao, S.; Bai, F.; Zeng, L.; Wei, L. A highly active biomass-derived electrode for all vanadium redox flow batteries. Electrochim. Acta 2017, 248, 197–205. [Google Scholar] [CrossRef]
- Huang, X.L.; Ma, G.Q. Graphite felt modified-graphene oxide/graphene as novel vanadium battery electrode material. Ferroelectrics 2021, 579, 12–22. [Google Scholar] [CrossRef]
- Ji, J.Y.; Non, C.H.; Shin, M.Y.; Oh, S.; Chung, Y.; Kwon, Y.; Kim, D.-H. Vanadium redox flow batteries using new mesoporous nitrogen-doped carbon coated graphite felt electrode. Appl. Surf. Sci. 2023, 611, 155665. [Google Scholar] [CrossRef]
- Zhang, Y.X.; Zheng, L.Y.; Liu, B.; Wang, H.X.; Shi, H.F. Sulfonated polysulfone proton exchange membrane influenced by a varied sulfonation degree for vanadium redox flow battery. J. Membr. Sci. 2019, 584, 173–180. [Google Scholar] [CrossRef]
- Sun, C.; Negro, E.; Vezzù, K.; Pagot, G.; Cavinato, G.; Nale, A.; Bang, Y.H.; Di Noto, V. Hybrid inorganic-organic proton-conducting membranes based on SPEEK doped with WO3 nanoparticles for application in vanadium redox flow batteries. Electrochim. Acta 2019, 309, 311–325. [Google Scholar] [CrossRef]
- Shin, J.M.; Kim, C.Y.; Jeong, B.S.; Vaz, N.; Ju, H. New operating strategy for allvanadium redox flow batteries to mitigate electrolyte imbalance. J. Power Sources 2022, 526, 231144. [Google Scholar] [CrossRef]
- Wang, X.; Ye, Q. Localized undersupply of liquid in all-vanadium liquid flow battery reactors leading to increased side reactions. Energy Storage Sci. Technol. 2022, 11, 1455–1467. [Google Scholar] [CrossRef]
- Qu, D.W.; Yang, F.; Fan, L.Y. Vanadium Redox Flow Battery Technology Review. J. Jilin Univ. 2022, 52, 1–24. [Google Scholar] [CrossRef]
- Jiang, H.; Guo, Y.S.; Qin, Y. Advances in the study of anode electrolytes for vanadium redox liquid flow batteries. Contemp. Chem. Ind. 2021, 50, 712–715. [Google Scholar] [CrossRef]
- Shripad, T.R.; Hitesh, B.; Shripad, R. Techno-Economic Integration of Renewable and Nuclear Energy; Academic Press: Cambridge, MA, USA, 2019; pp. 177–227. ISBN 978-0-12-813975-2. [Google Scholar]
- Nemani, V.P.; Smith, K.C. Uncovering the role of flow rate in redox-active polymer flow batteries: Simulation of reaction distributions with simultaneous mixing in tanks. Electrochim. Acta 2017, 247, 475–485. [Google Scholar] [CrossRef]
- Ryan, M.; Li, Y.F.; Bao, J.; Skyllas-Kazacos, M. Electrolyte flow rate control for vanadium redox flow batteries using the linear parameter varying framework. J. Process Control 2022, 115, 36–47. [Google Scholar] [CrossRef]
- Charvát, J.; Mazúr, P.; Dundálek, J.; Pocedič, J.; Vrána, J.; Mrlík, J.; Kosek, J.; Dinter, S. Performance enhancement of vanadium redox flow battery by optimized electrode compression and operational conditions. J. Energy Storage 2020, 30, 101468. [Google Scholar] [CrossRef]
- Banerjee, R.; Bevilacqua, N.; Mohseninia, A.; Wiedemann, B.; Wilhelm, F.; Scholta, J.; Zeis, R. Carbon felt electrodes for redox flow battery: Impact of compression on transport properties. J. Energy Storage 2019, 26, 100997. [Google Scholar] [CrossRef]
- Yoon, S.J.; Kim, S.; Kim, D.K. Optimization of local porosity in the electrode as an advanced channel for all-vanadium redox flow battery. Energy 2019, 172, 26–35. [Google Scholar] [CrossRef]
- Lourenssen, K.; Williams, J.; Ahmadpour, F.; Clemmer, R.; Tasnim, S. Vanadium redox flow batteries: A comprehendsive review. J. Energy Storage 2019, 25, 100844. [Google Scholar] [CrossRef]
- Ke, X.; Alexande, J.I.D.; Prahl, J.M.; Savinell, R.F. Flow distribution and maximum current density studies in redox flow batteries with a single passage of the serpentine flow channel. J. Power Sources 2014, 270, 646–657. [Google Scholar] [CrossRef]
- Ke, X.; Prahl, J.M.; Alexander, J.I.D.; Savinell, R.F. Redox flow batteries with serpentine flow fields: Distributions of electrolyte flow reactant penetration into the porous carbon electrodes and effects on performance. J. Power Sources 2018, 384, 295–302. [Google Scholar] [CrossRef]
- Jienkulsawad, P.; Jirabovornwisut, T.; Chen, Y.-S.; Arpornwichanop, A. Effect of battery material and operation on dynamic performance of a vanadium redox flow battery under electrolyte imbalance conditions. Energy 2023, 268, 126708. [Google Scholar] [CrossRef]
- Shan, A.A.; Watt-smith, M.J.; Walsh, F.C. A dynamic performance model for redox flow batteries involving soluble species. Electrochim. Acta 2008, 53, 8087–8100. [Google Scholar] [CrossRef]
- Guo, Y.S. Study on the physicochemical properties of vanadium battery cathode electrolyte and the mechanism of its influence on stability. Liaoning Shenyang Univ. Chem. Technol. 2021. [Google Scholar] [CrossRef]
- Praphulla, R.; Ravendre, G.; Sreenivas, J. Assessment of hydrodynamic performance of vanadium redox flow batteries at low temperatures. J. Energy Storage 2022, 55, 105746. [Google Scholar] [CrossRef]
- Lu, M.Y.; Deng, Y.M.; Yang, W.W.; Ye, M.; Jiao, Y.-H.; Xu, Q. A novel rotary serpentine flow field with improved electrolyte penetration and species distribution for vanadium redox flow battery. Electrochim. Acta 2020, 361, 137089. [Google Scholar] [CrossRef]
- You, X.; Ye, Q.; Cheng, P. Scale-up of high power density redox flow batteries by introducing interdigitated flow fields. Int. Commun. Heat Mass Transf. 2016, 75, 7–12. [Google Scholar] [CrossRef]
- Sun, Y.Z.; Liu, S.; Luo, L.J. Progress in the study of the effect of operating conditions on the performance of vanadium batteries. Battery Bimon. 2022, 52, 578–582. [Google Scholar] [CrossRef]
- Sergei, P.; Mikhail, P.; Andrey, P.; Ibáñez, F. Analysis of flow factor control strategy in vanadium redox flow batteries. IFAC-PapersOnLine 2022, 55, 187–192. [Google Scholar] [CrossRef]
- Huang, Z.B.; Mu, A.L.; Wu, L.X.; Wang, H. Vanadium redox flow batteries: Flow field design and flow rate optimization. J. Energy Storage 2022, 45, 103526. [Google Scholar] [CrossRef]
- Sun, Z.W.; Duan, Z.N.; Bai, J.Q.; Wang, Y. Numerical study of the performance of all vanadium redox flow battery by changing the cell structure. J. Energy Storage 2020, 29, 101370. [Google Scholar] [CrossRef]
- Wang, Z.Y.; Guo, Z.X.; Fan, X.Z. Comparison of serpentine and finger inserted flow paths in all-vanadium liquid flow batteries. Energy Storage Sci. Technol. 2022, 11, 1121–1130. [Google Scholar] [CrossRef]
- Ali, E.; Kwon, H.; Kim, J.; Park, H. Numerical study on serpentine design flow channel configurations for vanadium redox flow batteries. J. Energy Storage 2020, 32, 101802. [Google Scholar] [CrossRef]
- Skyllas-kazacos, M.; Menictas, C.; Lim, T. Redox flow batteries for medium-to largescale energy storage. In Electricity Transmission, Distribution and Storage Systems; Woodhead Publishing: Sawston, UK, 2013; pp. 398–441. [Google Scholar] [CrossRef]
- Kear, G.; Shan, A.A.; Walsh, F.C. Development of the all-vanadium redox flow battery for energy storage: A review of technological, financial and policy aspects. Int. J. Energy Res. 2012, 36, 1105–1120. [Google Scholar] [CrossRef]
- Qi, M.Y.; Hou, Y.C.; Chen, L.; Yang, L.J. Numerical simulation of a new sector-shape all-vanadium liquid flow battery cell. Energy Storage Sci. Technol. 2022, 11, 3209–3220. [Google Scholar] [CrossRef]
- Shao, J.K.; Li, X.; Mo, Y.Q. Modeling and Flow Characterization of All-Vanadium Liquid Flow Batteries. Energy Storage Sci. Technol. 2020, 9, 645–655. [Google Scholar] [CrossRef]
- Zhou, H.; Zhang, H.; Zhao, P. A comparative study of carbon felt and activated carbon based electrodes for sodium polysulfide/bromine redox flow battery. Electrochim. Acta 2006, 51, 6304–6312. [Google Scholar] [CrossRef]
- You, D.J.; Zhang, H.M.; Chen, J. A simple model for the vanadium redox battery. Electrochim. Acta 2009, 54, 6827–6836. [Google Scholar] [CrossRef]
- Yamamura, T.; Watanabe, N.; Yano, T.; Shiokawa, Y. Electron-transfer kinetics of Np3+/Np4+, NpO2+/NpO22+, V2+/V3+, and VO2+/VO2+ at carbon electrodes. J. Electrochem. Soc. 2005, 152, A830. [Google Scholar] [CrossRef]
- Ma, X.K.; Zhang, H.M.; Xing, F. A three-dimensional model for negative half-cell of the vanadium redox flow battery. Electrochim. Acta 2011, 58, 238–246. [Google Scholar] [CrossRef]
- Sum, E.; Skyllas-kazacos, M. A study of the V(II)/V(III) redox couple for redox flow cell applications. J. Power Sources 1985, 15, 179–190. [Google Scholar] [CrossRef]
- Pourbaix, M. Atlas of electrochemical equilibria in aqueous solution. J. Electroanal. Chem. 1974, 13, 471. [Google Scholar] [CrossRef]
- Gurieff, N.; Cheung, C.Y.; Timchenko, V.; Menictas, C. Performance enhancing stack geometry concepts for redox flow battery systems with flow through electrodes. J. Energy Storage 2019, 22, 219–227. [Google Scholar] [CrossRef]


| Parameters | Symbols | Value | Unit |
|---|---|---|---|
| Electrode thickness | δ | 3.5 | mm |
| Inlet cross-sectional area | Sin | 17.5 | mm2 |
| Radial electrode inner radius | r | 10 | mm |
| Radial electrode outer radius | R | 112.5 | mm |
| Source | Negative | |
| Si | V2+ | a*j/F |
| V3+ | −a*j/F | |
| Sϕ | ϕs | a*j |
| ϕl | −a*j |
| Parameters | Symbols | Value | Unit |
|---|---|---|---|
| Temperature | T | 298 | K |
| Electrolyte flow | Q | 663.6 | ml/min |
| Outlet pressure | Pout | 0 | Pa |
| Electrode current density | I | 1600 | A/m2 |
| State of Charge | SOC | 80 | % |
| Parameters | Symbols | Value | Unit | Source |
|---|---|---|---|---|
| Porosity | εp | 0.929 | - | Literature [41] |
| Specific surface area | a | 1.62 × 10⁴ | m−1 | Literature [41] |
| Carbon fiber diameter | dp | 1.76 × 10⁻⁵ | m | Literature [41] |
| Electrical conductivity | σs | 1000 | S/m | Literature [42] |
| Kornitze–Kalman coefficient | kCK | 4.28 | - | Literature [42] |
| Viscosity | M | 4.928 × 10⁻³ | Pa·s | Literature [42] |
| Initial proton concentration at the negative electrode | CH_0_neg | 4500 | mol/m3 | Literature [42] |
| Cathodic transfer coefficient | αc | 0.5 | - | Literature [42] |
| Anode transfer coefficient | αa | 0.5 | - | Literature [42] |
| Diffusion coefficient of V2+ | DV2 | 2.4 × 10⁻¹⁰ | m2/s | Literature [43] |
| Diffusion coefficient of V3+ | DV3 | 2.4 × 10⁻¹⁰ | m2/s | Literature [43] |
| Initial concentration of water | CH2O | 46,500 | mol/m3 | Literature [44] |
| Negative standard reaction rate constant | kneg | 1.7 × 10⁻⁷ | m2/s | Literature [45] |
| Standard equilibrium potential | Eeq | −0.255 | V | Literature [46] |
| Number of Grid Cells | 42,556 | 61,893 | 86,532 |
| Average ion concentration of V3+ (mol/m3) | 259.6 | 263.2 | 265.8 |
Disclaimer/Publisher’s Note: The statements, opinions and data contained in all publications are solely those of the individual author(s) and contributor(s) and not of MDPI and/or the editor(s). MDPI and/or the editor(s) disclaim responsibility for any injury to people or property resulting from any ideas, methods, instructions or products referred to in the content. |
© 2023 by the authors. Licensee MDPI, Basel, Switzerland. This article is an open access article distributed under the terms and conditions of the Creative Commons Attribution (CC BY) license (https://creativecommons.org/licenses/by/4.0/).
Share and Cite
Sun, K.; Qi, M.; Guo, X.; Wang, W.; Kong, Y.; Chen, L.; Yang, L.; Du, X. Research on Performance Optimization of Novel Sector-Shape All-Vanadium Flow Battery. Sustainability 2023, 15, 14520. https://doi.org/10.3390/su151914520
Sun K, Qi M, Guo X, Wang W, Kong Y, Chen L, Yang L, Du X. Research on Performance Optimization of Novel Sector-Shape All-Vanadium Flow Battery. Sustainability. 2023; 15(19):14520. https://doi.org/10.3390/su151914520
Chicago/Turabian StyleSun, Kai, Mengyao Qi, Xinrong Guo, Weijia Wang, Yanqiang Kong, Lei Chen, Lijun Yang, and Xiaoze Du. 2023. "Research on Performance Optimization of Novel Sector-Shape All-Vanadium Flow Battery" Sustainability 15, no. 19: 14520. https://doi.org/10.3390/su151914520
APA StyleSun, K., Qi, M., Guo, X., Wang, W., Kong, Y., Chen, L., Yang, L., & Du, X. (2023). Research on Performance Optimization of Novel Sector-Shape All-Vanadium Flow Battery. Sustainability, 15(19), 14520. https://doi.org/10.3390/su151914520