Article

Assessing the Potential of Hybrid-Based Metaheuristic Algorithms Integrated with ANNs for Accurate Reference Evapotranspiration Forecasting

by
Hadeel E. Khairan
1,
Salah L. Zubaidi
1,2,*,
Mustafa Al-Mukhtar
3,
Anmar Dulaimi
2,4,
Hussein Al-Bugharbee
5,
Furat A. Al-Faraj
6 and
Hussein Mohammed Ridha
7
1
Department of Civil Engineering, Wasit University, Wasit 52001, Iraq
2
College of Engineering, University of Warith Al-Anbiyaa, Karbala 56001, Iraq
3
Civil Engineering Department, University of Technology-Iraq, Baghdad 10066, Iraq
4
School of Civil Engineering and Built Environment, Liverpool John Moores University, Liverpool L3 2ET, UK
5
Department of Mechanical Engineering, Wasit University, Wasit 52001, Iraq
6
School of Engineering, University of Bolton, Bolton BL3 5AB, UK
7
Department of Computer Engineering, University of Al-Mustansiriyah, Baghdad 10001, Iraq
*
Author to whom correspondence should be addressed.
Sustainability 2023, 15(19), 14320; https://doi.org/10.3390/su151914320
Submission received: 8 August 2023 / Revised: 30 August 2023 / Accepted: 2 September 2023 / Published: 28 September 2023
(This article belongs to the Special Issue Sustainable Water Resources Management and Sustainable Environment)

Abstract

:
Evapotranspiration (ETo) is one of the most important processes in the hydrologic cycle, with specific application to sustainable water resource management. As such, this study aims to evaluate the predictive ability of a novel method for monthly ETo estimation, using a hybrid model comprising data pre-processing and an artificial neural network (ANN), integrated with the hybrid particle swarm optimisation–grey wolf optimiser algorithm (PSOGWO). Monthly data from Al-Kut City, Iraq, over the period 1990 to 2020, were used for model training, testing, and validation. The predictive accuracy of the proposed model was compared with other cutting-edge algorithms, including the slime mould algorithm (SMA), the marine predators algorithm (MPA), and the constriction coefficient-based particle swarm optimisation and chaotic gravitational search algorithm (CPSOCGSA). A number of graphical methods and statistical criteria were used to evaluate the models, including root mean squared error (RMSE), Nash–Sutcliffe model efficiency (NSE), coefficient of determination (R2), maximum absolute error (MAE), and normalised mean standard error (NMSE). The results revealed that all the models are efficient, with high simulation levels. The PSOGWO–ANN model is slightly better than the other approaches, with an R2 = 0.977, MAE = 0.1445, and RMSE = 0.078. Due to its high predictive accuracy and low error, the proposed hybrid model can be considered a promising technique.

1. Introduction

Reference evapotranspiration (ETo), introduced by the Food and Agricultural Organisation of the United Nations (FAO) in 1977, is a crucial component when estimating evapotranspiration (ET) [1]. Worldwide, ET exceeds runoff and returns more than 60% of land precipitation to the atmosphere; this process uses up more than 50% of the solar energy reaching the Earth’s surface [2]. ETo is the estimated ET of a hypothetical reference grass with a 0.12 m plant height, a surface resistance of 70 s/m, and an albedo of 0.23 [3].
In the literature, many methods have been reported for estimating ET, such as Priestley–Taylor [4], the Hargreaves equation [5], and the FAO 56 Penman–Monteith model (FAO 56 PM) [3]. FAO 56 PM is recommended as a global standard approach to compute ETo because of its accuracy under a variety of climatic conditions, and because it takes into account both aerodynamic and thermodynamic factors [6,7]. According to Allen, et al. [3], the key climatic factors that affect the evapotranspiration process are ambient temperature (Tmax and Tmin), global solar radiation (Rs), wind speed (U2), and relative humidity (RH). However, the FAO 56 PM model’s primary disadvantage is that a sizable number of meteorological variables are needed as input data. Unfortunately, certain meteorological variables are either unavailable or insufficient in most developing countries [8]. Consequently, it is vital to apply artificial intelligence models to streamline the computation and reduce the number of input factors required to produce an accurate estimate of ETo, and hence minimise the data collection cost and time [9].
Accurate ETo estimation plays an important role in many areas, including agricultural water management, crop simulation, the design of irrigation projects, and hydrological modelling [10]. With reference to accuracy, more recent attention has focused on using machine learning methods (ML) to predict ETo, owing to their superior performance as an alternative to empirical models [11]. Artificial neural networks (ANN), adaptive neuro-fuzzy inference systems (ANFIS), support vector machines (SVM), and fuzzy logic (FL) approaches are among the categories of ML models that have been successfully used, now regarded as the best methods for handling a number of scientific tasks related to hydrology, such as modelling, forecasting, and prediction [12]. The ML can achieve a noticeably higher accuracy if the proper hyperparameter adjustment is carried out [13,14]. These appropriate hyperparameters can be selected in two ways: either the parameters are set in the software packages by default or manually based on personal experience or by trial and error [15]. However, ML models display some weaknesses, including issues with overfitting or trapping in local minima while looking for the global optimum during the training process [16].
Accordingly, the current study attempts to combine metaheuristic algorithms with ML models to circumnavigate these restrictions. The hybridisation of this ML with several metaheuristic algorithms has attracted considerable attention, as metaheuristic algorithms seek the best viable answer within an optimisation problem [17]. Metaheuristic optimisation methodologies are frequently used to address engineering challenges, due to their simplicity and adaptability, as well as their ability to tackle highly computational tasks with substantial efficacy [18]. Algorithms such as particle swarm optimisation (PSO), the grey wolf optimiser algorithm (GWO), and the gravitational search algorithm (GSA) have been effectively applied in hydrology and water resources areas [1,19,20,21,22].
As a brief literature review, Zhu, et al. [2] proposed a hybrid model that combines extreme learning machine (ELM) and the PSO algorithm to estimate daily ETo in Northwest China. According to statistical results, the hybrid ELM–PSO model outperformed the other stand-alone ELM, random forest (RF), and ANN models. Maroufpoor, et al. [22] improved the ANN model for daily estimations of ETo using the GWO method. Based on the results, it was clear that the ANN–GWO method outperformed the ANN method used alone. This study also confirmed that the GWO algorithm was a useful tool for optimising ANN’s structure. Roy, et al. [23] used the ANFIS method with four optimisation techniques: PSO, the firefly algorithm (FA), teaching–learning-based optimisation (TLBO), and biogeography-based optimisation (BBO), to estimate daily ETo. Their performance was compared to that of the standard ANFIS model. The outcomes demonstrated that all the hybrid techniques were superior to the single method, showing that ANFIS–FA generated the most accurate ETo estimates. By merging the PSO approach and the extreme gradient boosting (XGB) model, Yu, et al. [1] produced a different hybrid approach. Data from a greenhouse in Beijing, China, was applied in the prediction approach. The outcomes showed that the XGB–PSO technique could accurately estimate ETo, and the PSO approach helped to stabilise the parameter optimisation of the XGB model. Mehdizadeh, et al. [24] used the shuffled frog-leaping algorithm (SFLA) and invasive weed optimisation (IWO), along with the ANFIS, to build and apply two novel hybrid models in Iran. Four empirical models and a stand-alone ANFIS were compared to the suggested hybrid models. The hybrid techniques outperformed the conventional ANFIS and empirical methods, with the ANFIS–SFLA outperforming the ANFIS–IWO, according to the evaluation results.
In a review of ETo prediction models by Krishnashetty, et al. [25], it was found that the artificial neural network (ANN) technique outperformed other machine learning techniques when simulating reference evapotranspiration. Jing, et al. [9] also carried out a literature review on the application of evolutionary computing techniques to model evapotranspiration, finding that there is still room to improve the accuracy of models used to predict evapotranspiration, through the use of advanced optimisation algorithms such as the PSO algorithm.
Given the relevance of ETo in hydro-climatological research, accurate estimations and modelling using a variety of novel methodologies remain desirable in light of the above. It should be noted that this study is a follow-up to Khairan, et al. [26], who systematically reviewed ML techniques refined by metaheuristic algorithms to predict ETo data over the last five years. They concluded that both single-based and hybrid-based algorithms successfully increased the efficiency of ML models. However, new research into the function of metaheuristic algorithms would be valuable because there is space for improvement by examining single- and hybrid-based metaheuristic techniques.
This study aims to investigate the performance accuracy between single- and hybrid-based metaheuristic algorithms by developing an overarching framework to forecast ETo data. In light of this, the objectives of this study are to:
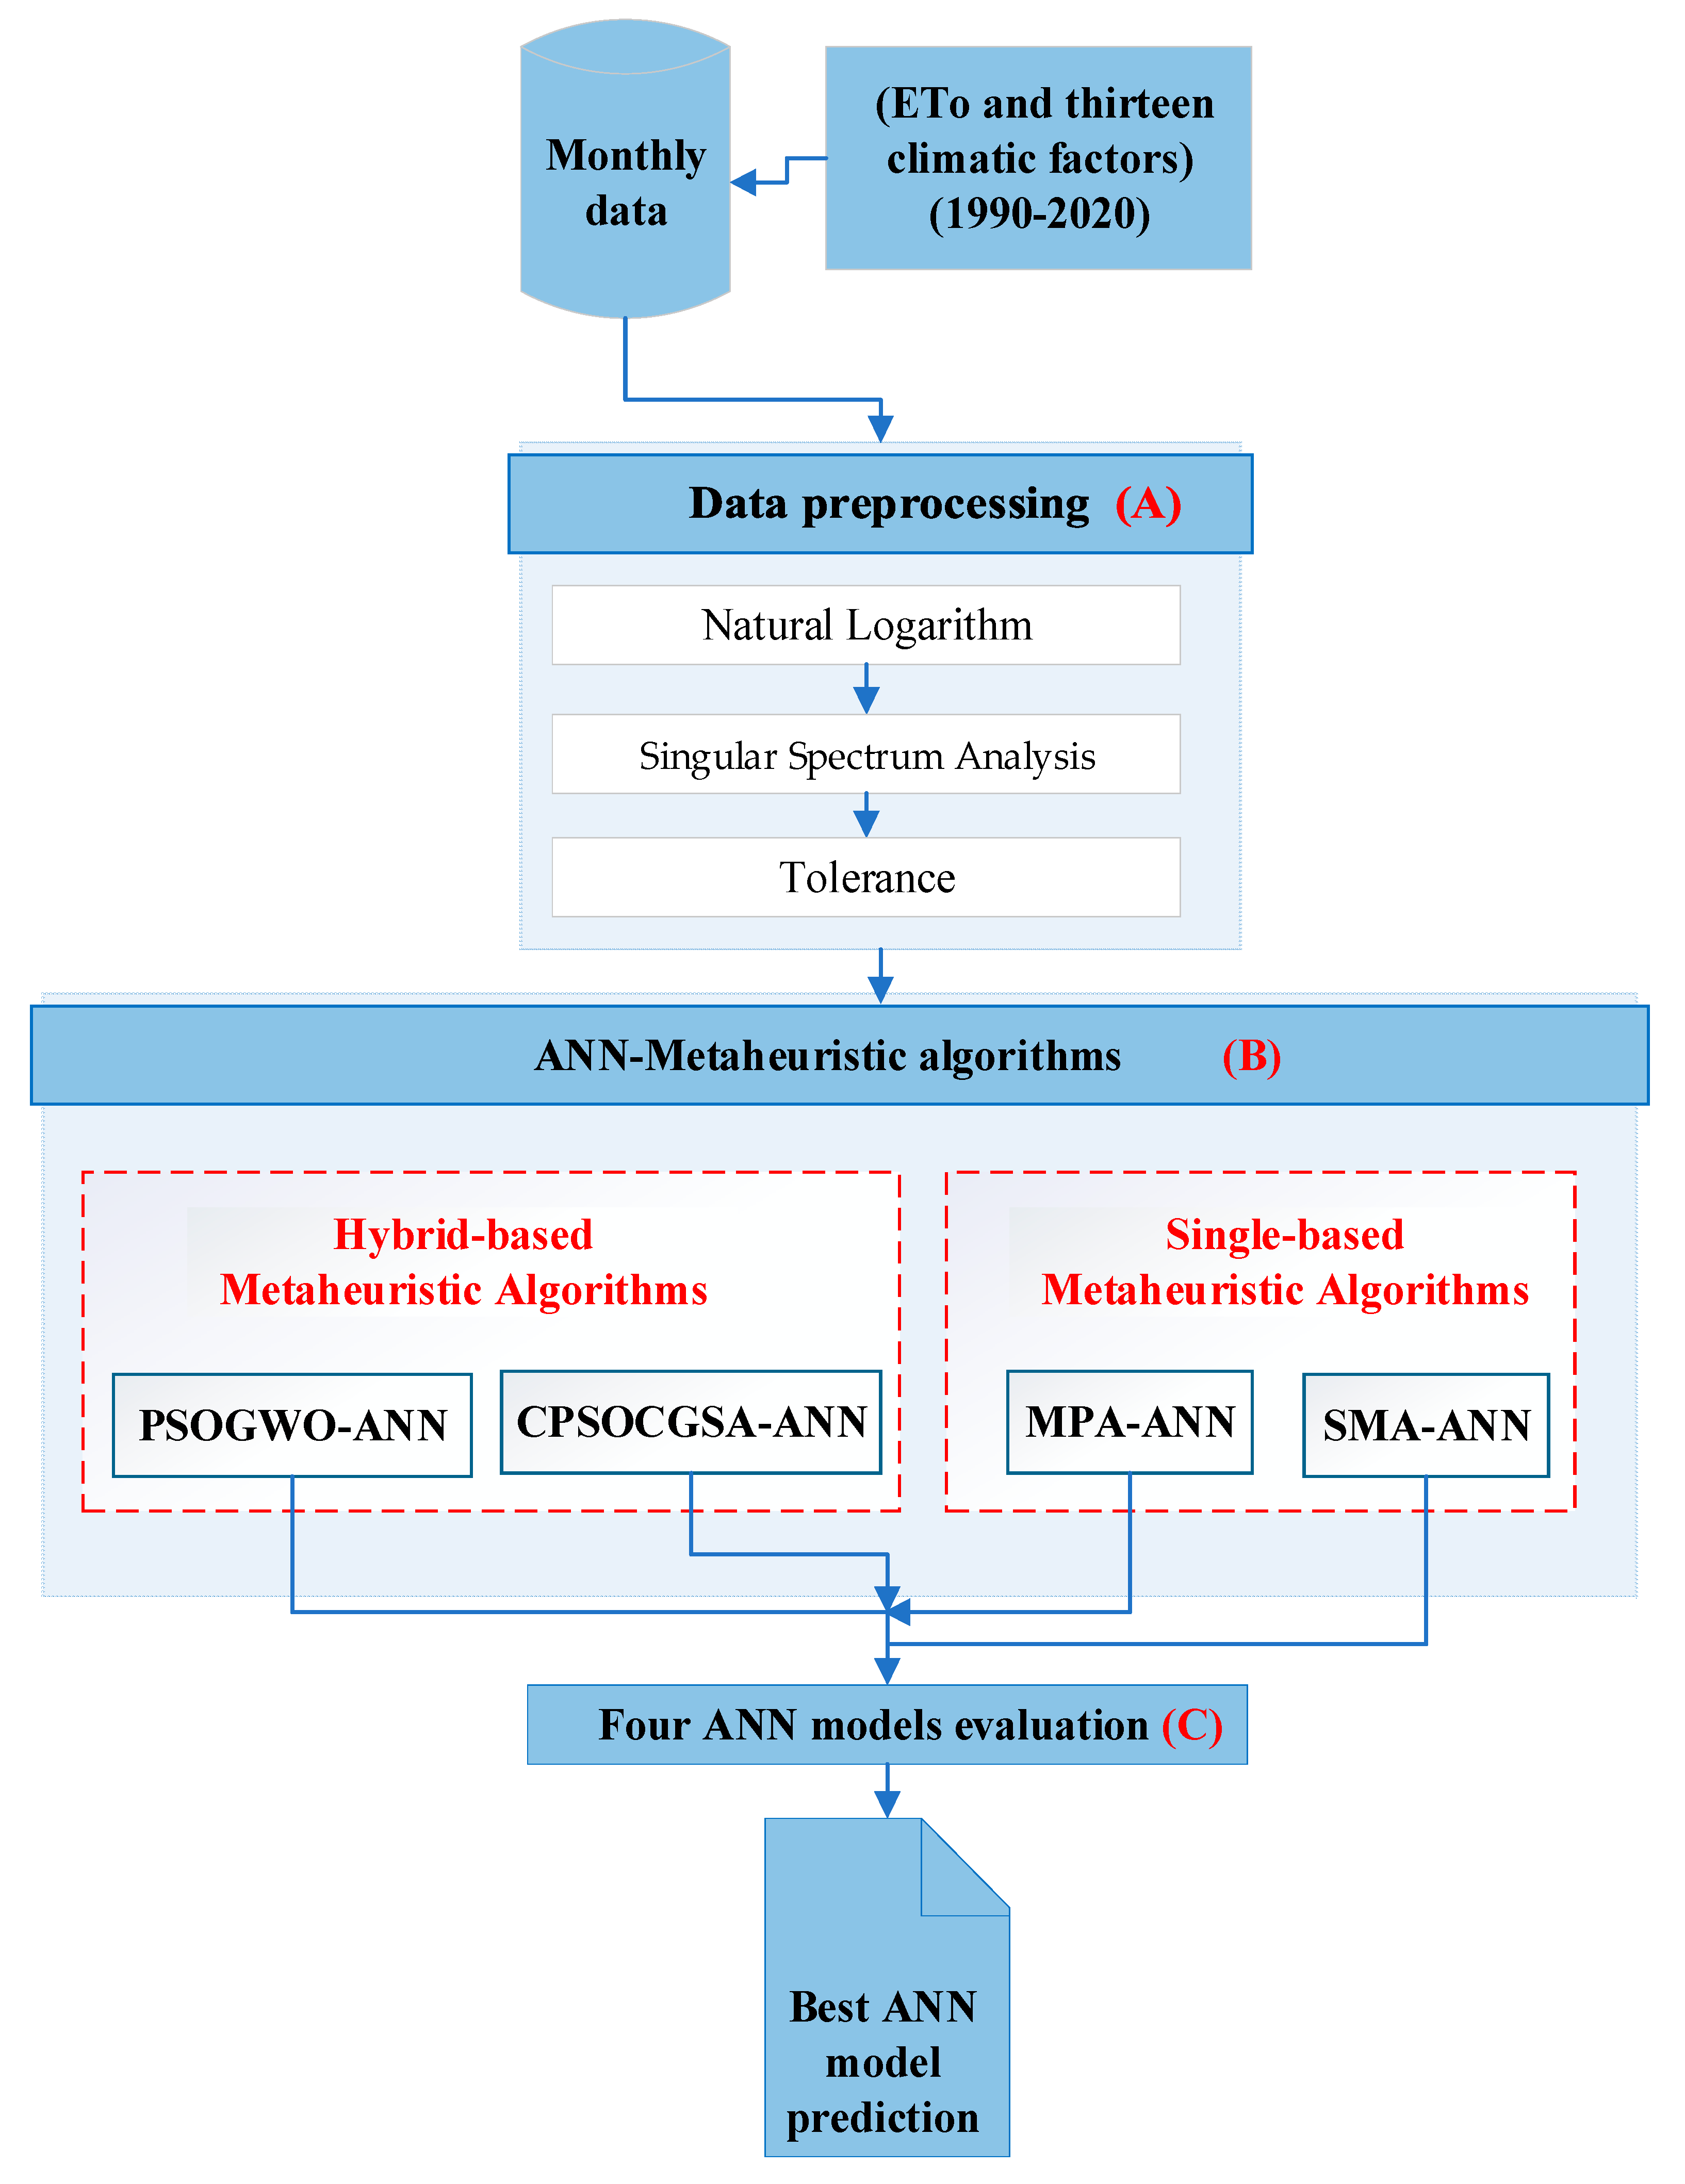
  • Use multiple preprocessing techniques, such as singular spectrum analysis (SSA) to clean noise from the data, and the tolerance method to find the optimum input model scenario.
  • Examine PSOGWO, hybrid-based, in conjunction with ANN as a predictive tool for ETo, which represents the novelty of this study.
  • Apply three other algorithms: CPSOCGSA, hybrid-based; and MPA, single-based, and SMA, single-based, integrated with ANN, to assess and confirm the PSOGWO model. Multiple error indicators were employed to compare the performance of the applied techniques.
The work presented here provides one of the first investigations into how a PSOGWO–ANN hybrid model has been developed and compared to three other hybrid models that simulate multi-variate ETo on a monthly basis. This study will help fill a need in the literature, as well as provide a more in-depth understanding and more refined knowledge of single- and hybrid-based metaheuristic algorithms to select ML models’ hyperparameters.
The results of this study are important for agriculture and irrigation as an alternative modelling technique, especially in developing countries where there are difficulties around the availability of meteorological data.

2. Materials

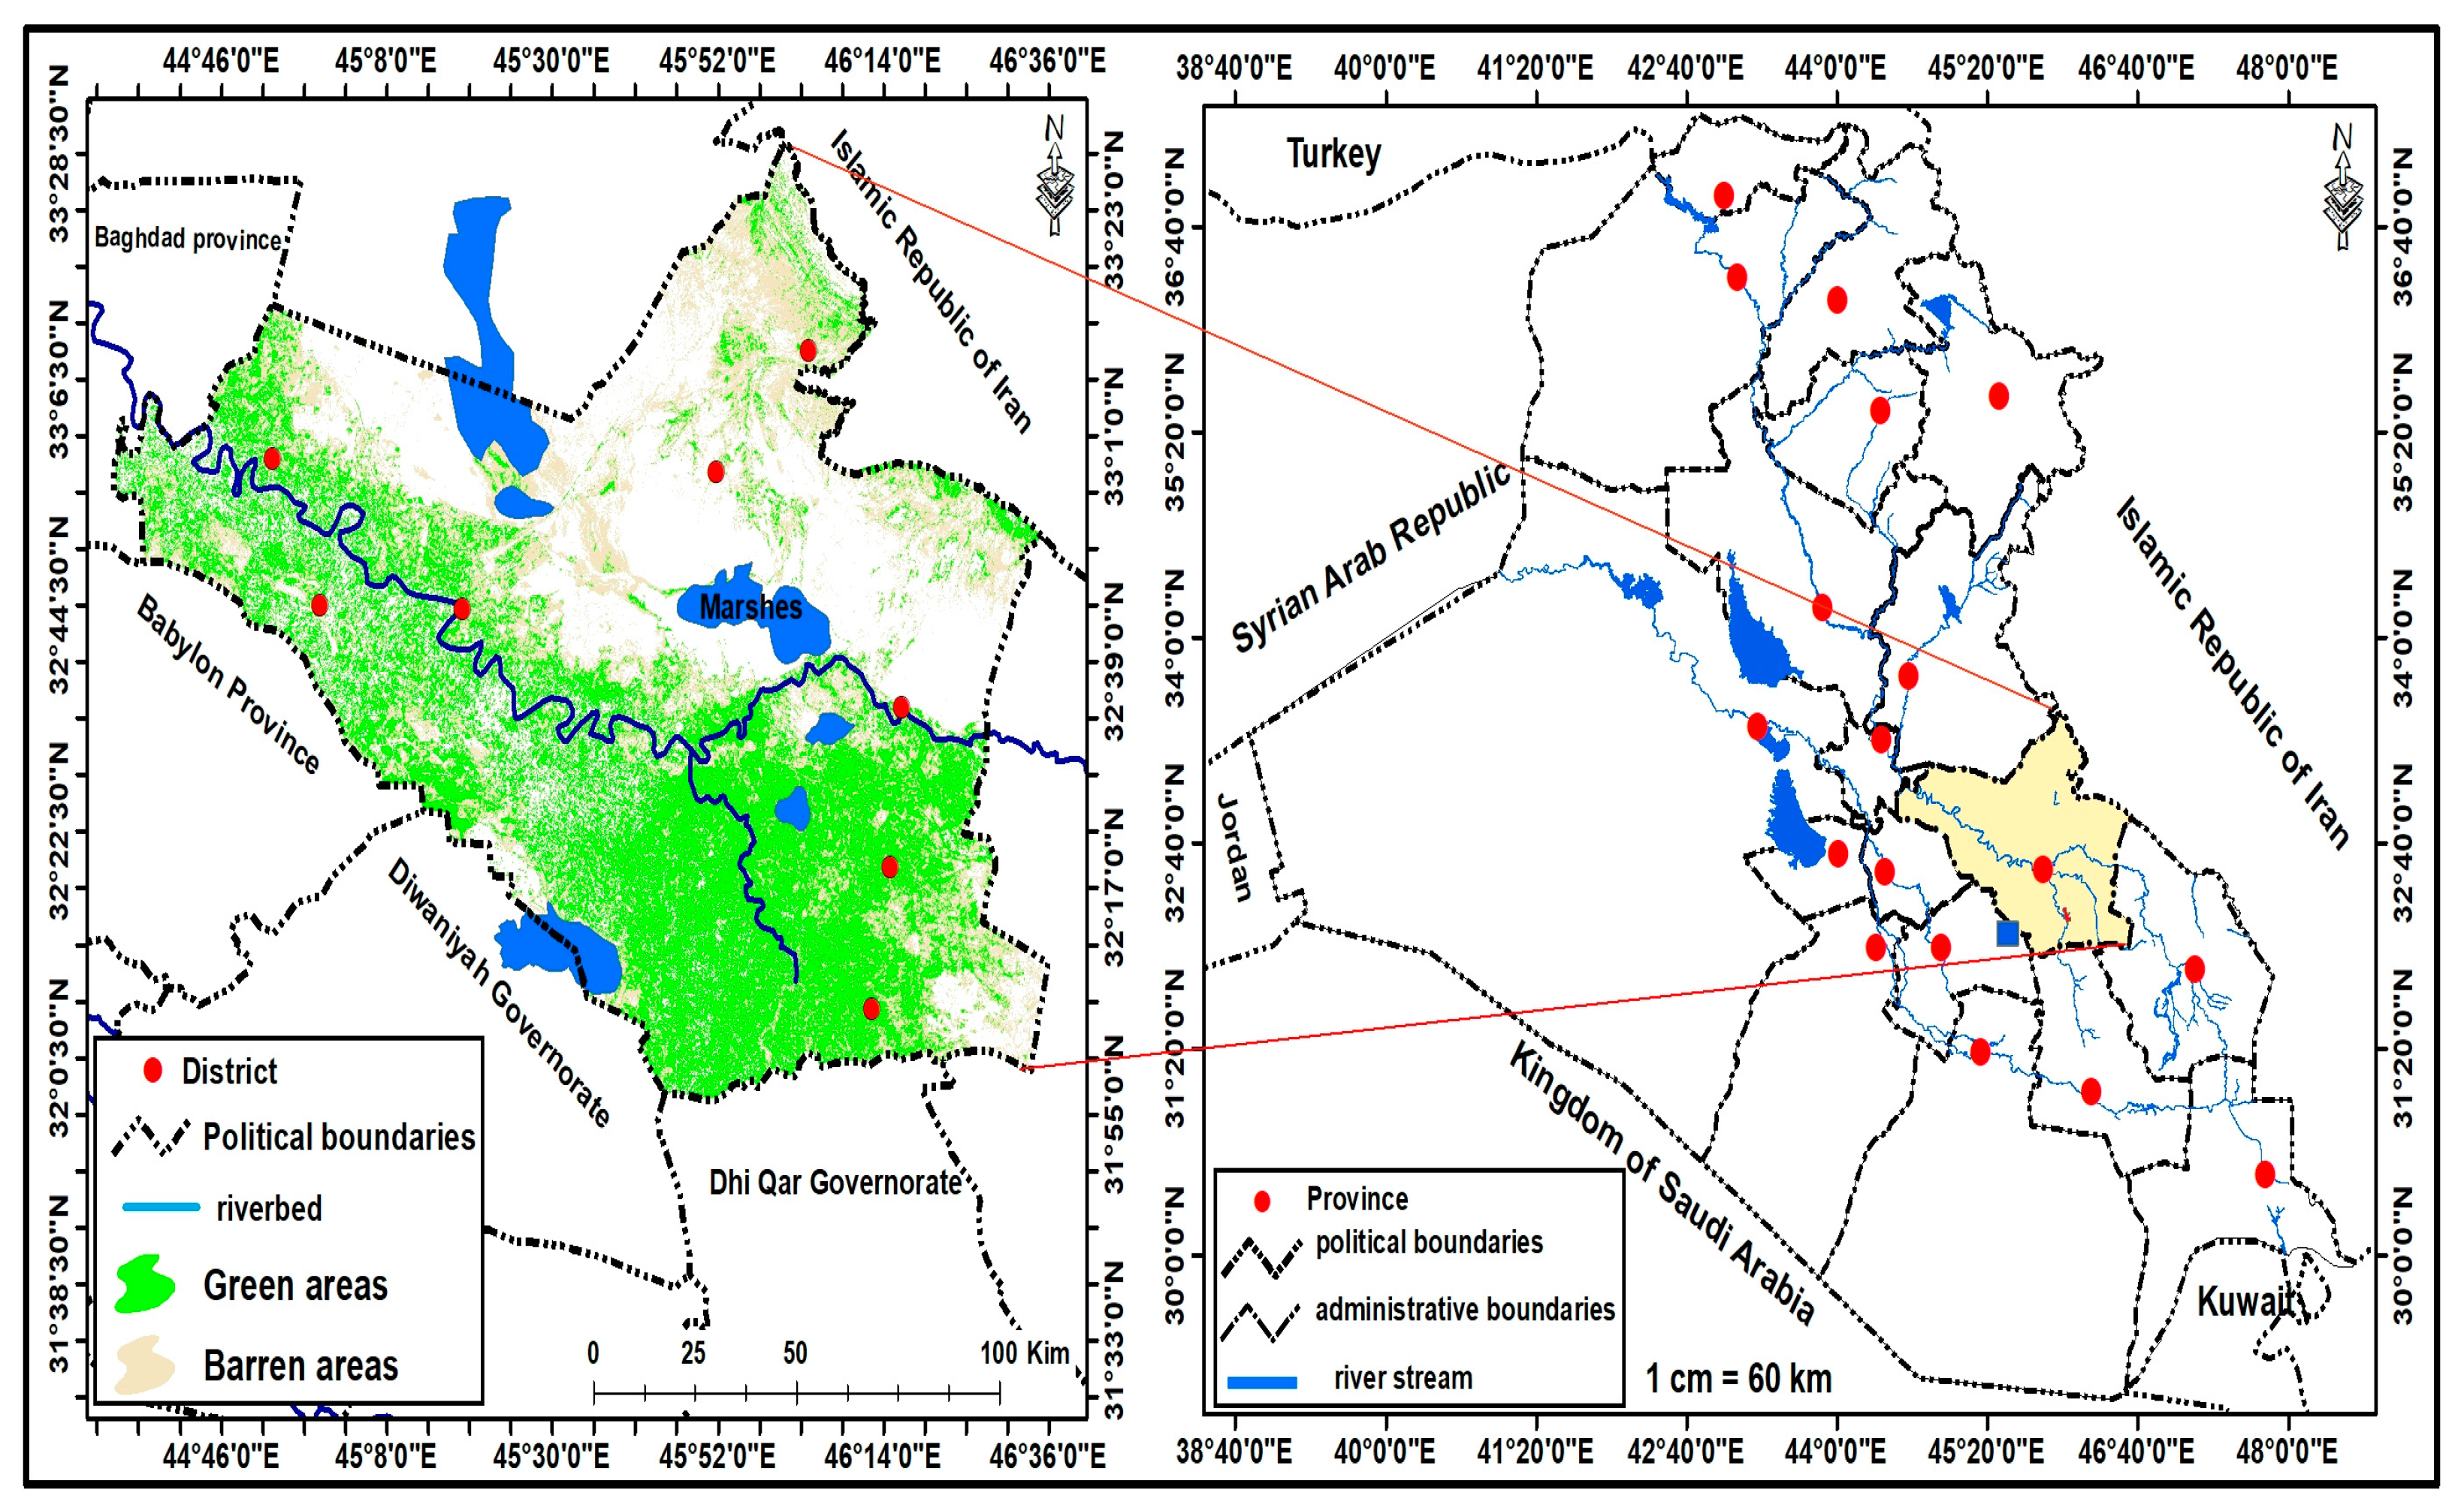
2.1. Study Area and Data Used

Al-Kut City, which is situated on the Tigris River in southern Iraq (Figure 1), was selected as the case study [27]. The predominant climate of Al-Kut City is continental and semi-arid [28], with the weather cold in the winter, and dry and scorching in the summer [29]. The average daily temperature in July and August can reach 51 °C [30]. The total annual precipitation is between 150 and 300 mm [31]. Al-Kut City covers around 40 square kilometres and is recognised as an agricultural region, notable for its wheat output [32].
Data collection from on-site ground stations is often expensive and challenging [33]. Jing et al. [7] mentioned that both the management of water resources and the application of hydrological models have benefited greatly from the use of satellite data. This kind of modelling could be beneficial in areas with few climate stations or a shortage of data.
Observation data is scarce in the study area. Specifically, data from the years 1990 to 2020 are missing as a result of war and the unstable security environment [32]. Therefore, this study used monthly meteorological data collected between 1 January 1990 and 30 December 2020, provided by the National Aeronautics and Space Administration (NASA) [32,34]. These data include the minimum temperature (Tmin, °C), maximum temperature (Tmax, °C), dew point temperature (Tdew, °C), wet bulb temperature (Twet, °C), precipitation (P, mm/day), relative humidity (RH, per cent), surface pressure (Ps, kPa), specific humidity (SH, g/kg), maximum wind speed (Wmax, m), wind speed (W, m), range wind speed (Wrange, m), minimum wind speed (Wmin, m), and solar radiation (Rs, MJ/m2/day). Tayyeh and Mohammed [33] compared precipitation and air temperature data from various weather stations across Iraq with NASA data, the results revealing that both sets of data were consistent and in agreement across all parameters.

2.2. FAO 56 PM Method

The FAO 56 PM methodology developed by Allen, et al. [3] was used as a reference approach to estimate ETo in this study, as shown by Equation (1):
E T o = 0.408 R n G + γ 900 T a v e + 273 U 2 ( e s e a ) + γ ( 1 + 0.34 U 2 )
where Rn is net surface radiation (MJ m2 day−1), G is soil heat flux (MJ m2 day−1), T the monthly mean temperature (°C), es the mean saturation vapour pressure (kPa), ea the actual vapour pressure (kPa), the slope of the vapour pressure function (kPa/°C), and γ the psychometric constant (kPa/°C).

3. Methodology

This study proposes the following five procedures (Figure 2) for predicting monthly ETo in consideration of climatic factors: The five steps are as follows: (1) data preprocessing, (2) PSOGWO, (3) ANN, and (4) model performance assessment. The following are elaborated explanations of various measures:

3.1. Pre-Processing Methods

In this study, the first step was to normalise the data using the natural logarithm to speed up data convergence. The data were then cleaned to treat outliers, and the box and whisker method was applied using SPSS version 24. This action has been known to significantly improve the accuracy of the prediction model [35]. The normalised and cleaned data were then denoised using the SSA technique, a reliable method of time series analysis that may be used to identify key predictive characteristics in both linear and nonlinear time series [36].
Finally, the more strongly correlated variables were abstracted using both correlational analysis and the tolerance technique, resulting in an optimal set of input variables. According to Mohammadi and Mehdizadeh [37], the selection of appropriate model input sets and appropriate training are major factors for an increase in the predictive accuracy of any nonlinear model. A correlational analysis determined the optimal-fitting input set of climate factors influencing ETo [38]. Pallant [39] advised selecting model input with a tolerance coefficient of 0.1 or higher, so any parameter with a tolerance coefficient of 0.1 or above was considered relevant in this study.

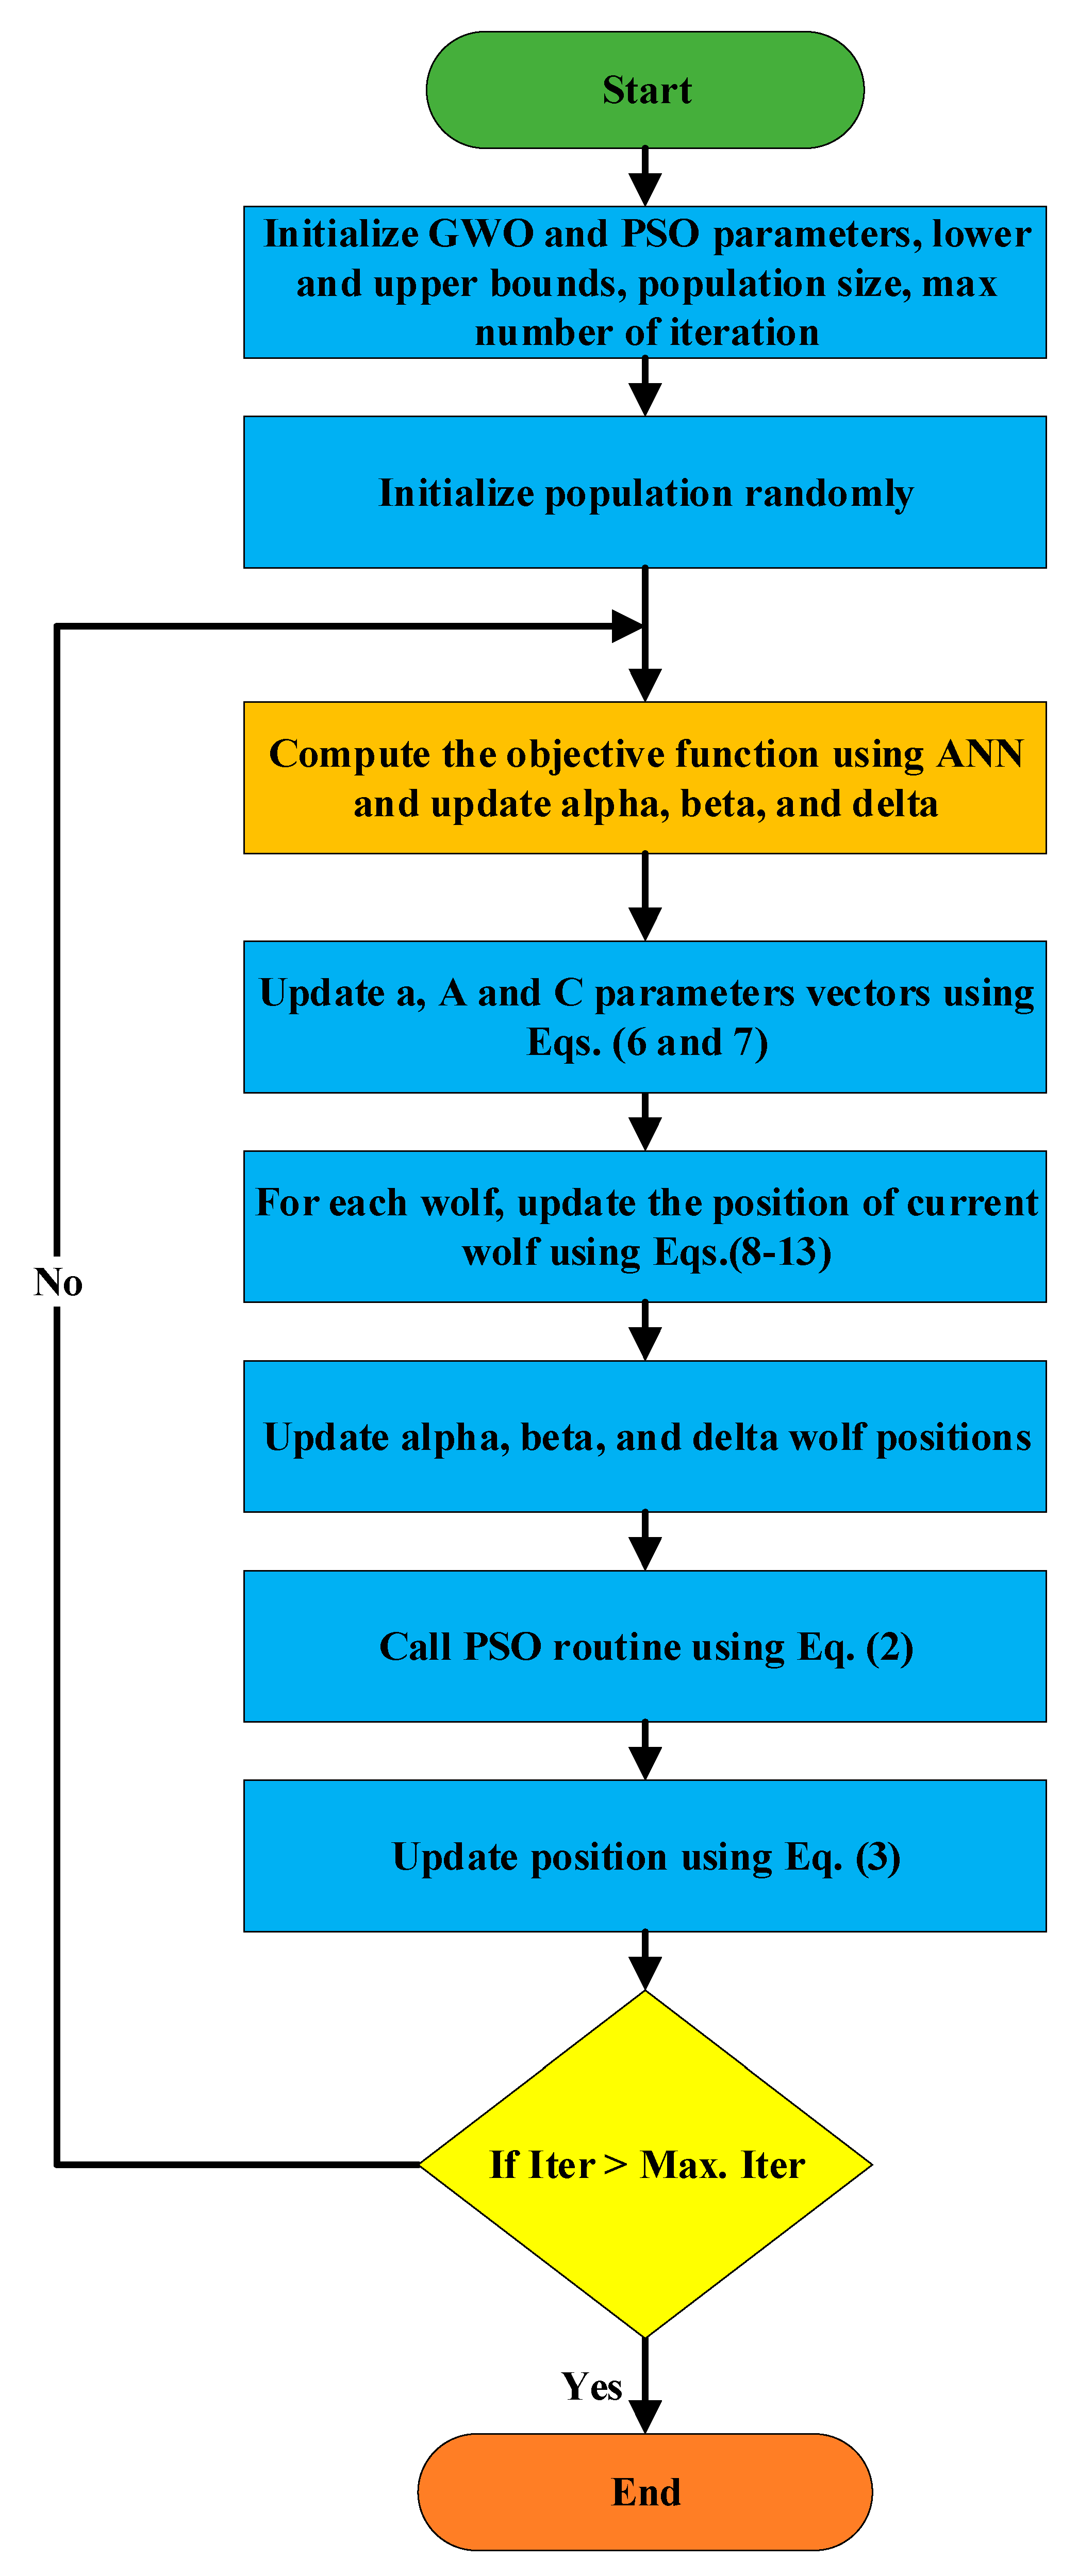
3.2. The Hybrid Particle Swarm Optimisation–Grey Wolf Optimiser Algorithm (PSOGWO)

Kennedy and Eberhart [40] created the metaheuristic optimisation method known as particle swarm optimisation (PSO) at the end of the 20th century. It quickly gained popularity due to its impressive performance in a variety of engineering sectors [41]. PSO is based on two major elements of the flocking behaviour of birds: position and velocity. Position denotes the direction of the particle’s motion, while velocity denotes its speed [42]. Each particle independently explores the search space for the best solution; the entire particle swarm then share this unique extremum. The present global optimal solution for the entire particle swarm is the best individual extremum. [1]. The positions and velocities of particles in the search space are randomly initialised; each particle’s updated velocity and position was expressed as follows:
V n + 1 i = ω V n i + C 1 r 1 0,1 P n i X n i + C 2 r 2 0,1 P n g X n i + C 3 r 3 ( 0,1 ) ( P n g X n i )
X n + 1 i = X n i + V n + 1 i
where i refers to a particular swarm particle, the values r1 and r2 represent random numbers between 0 and 1, and n represents the number of iterations. The inertia weight parameter’s symbol is ω , the three variables being position (X), velocity (V), and best positional estimate (Pi) for the particle in question. The coefficients C1 and C2 denote the optimisation parameters, while Pg represents the best position information available in the swarm.
The grey wolf optimisation (GWO) algorithm was proposed by Mirjalili, et al. [43]. GWO has high estimation accuracy and fast processing speeds, allowing it to find the best nonlinear function solution effectively [44]. The five stages of the GWO modelling process are social hierarchy, encircling prey, tracking and searching for prey, attacking prey, and hunting [42]. Wolves live in packs with a hierarchy of alpha, beta, delta, and omega [45]. The beta wolves, who are the alphas’ subordinates, assist the alpha wolves, the top members of the hierarchy, in making final decisions for the pack. The omega wolves always surrender to the other dominant wolves, whereas the delta wolves always submit to the alpha and beta wolves [42]. The GWO’s alpha, beta, and delta agents work together to arrive at the optimal solution. The grey wolf’s propensity to circle its prey can be computed as follows:
D = C × X p ( t ) X ( t )
X ( t + 1 ) = X p ( t ) A · D
where t denotes the number of immediate iterations. The coordinates of the prey are given by Xp, the location of the grey wolves is given by X, and the vector coefficients are given by A and C. The coefficients A and C formulas are as follows:
A = 2 a · r 1 a
C = 2 · r 2
Equations (6) through (11) demonstrate how grey wolves can modify their positions in accordance with the locations of the α, β, and δ wolves.
D α = C 1 × X α ( t ) X
D β = C 2 × X β ( t ) X
D δ = C 3 × X δ ( t ) X
X ( 1 ) = X α ( t ) A 1 · D α
X ( 2 ) = X β ( t ) A 2 · D β
X ( 3 ) = X δ ( t ) A 3 · D δ
It is anticipated that Equations (9)–(11) will produce the following expected outcomes:
X ( t + 1 ) = X ( 1 ) + X ( 2 ) + X ( 3 ) 3
The location for the following iteration is X(t + 1).
The GWO algorithm discovers the best answer by continuously updating the location search solution space throughout the optimisation process.
Şenel, et al. [46] proposed a new hybrid algorithm that combines the exploration ability of GWO with the exploitation capacity of PSO. The strategy is to combine the two approaches by substituting a PSO particle, which has low probability, with a GWO particle that has been somewhat modified. According to Şenel et al., the hybrid approach successfully integrates the two algorithms and outperforms them as individuals. The technique also converges to more optimal solutions with fewer repetitions. The optimisation process in PSOGWO (Figure 3) is controlled by PSO, whereby some of the particles in the PSO are replaced by the best agents in the GWO algorithm [42]. When a random integer is reached that is smaller than the selected possibility rate, the process transitions from PSO to GWO. The adjusted position is then updated after the GWO algorithm has been run. The transition from PSO to GWO ensures that solutions do not enter local minima. The procedure then transitions to PSO before ending when the number of iterations is reached [41]. The PSOGWO optimizers start with the initialization of the population randomly and evaluate each solution set by storing their values in a specific matrix. Then, α, β, and δ agents are updated, along with their positions. After that, a new position set is conducted and evaluated using Equation (2) by updating the particles’ positions and their velocities. This procedure will continue until the maximum number of iterations is reached. The pseudocode of the PSOGWO is demonstrated below:
Algorithm 1 defines the hybrid optimisation method.
Algorithm 1: Hybrid PSOGWO
The user-specified: maximum number of iterations (MAXi),
number of population sizes (PS),
small possibility rate (prob),
   Small population Size = psizesmall, Possibility rate = prob.
1      Initialise population
2      For Iteration = 1 to Max. Iteration do
3        for iteration count do
4        for population size do
5        r1 = rand; r2 = rand;
6        Update a, A and C vectors
7        Update alfa, beta, and delta
8        Call PSO routine
9        Update PSO position
10        end
11        end
12      end
13  end

3.3. Artificial Neural Network (ANN)

ANN is an ML model that takes inspiration from how the human brain works. Multilayer perceptron (MLP) is a popular ANN architecture that features input, hidden, and output layers [20]. In keeping with the work of Gocić and Arab Amiri [47], this study used four layers to make up the MLP structure. The input layer contains climatic variables (P, Tmin, and WSmax); the hidden layers have tansigmoidal activation functions to handle nonlinearity, while the output layer contains a linear activation function to predict ETo. MLP employs feed-forward back-propagation, which uses Bayesian regularization (BR) to train the ANN model. The error-correction learning rule, which uses two main network pathways, is the foundation of the back-propagation training procedure. Input vectors are applied to the network in a forward direction, and the result is obtained in the output layer after passing through the hidden layer. The second path is from the output layer back to the input layer [22]. It should, however, be noted that the trial-and-error process is time-consuming and may fall into local minima instead of global solutions. For that reason, ANN was integrated with metaheuristic methods by choosing the best learning rate (Lr) and number of neurons (N1 and N2) for the hidden layers.
The data for this study are split into three groups: training (70%), testing (15%), and validation (15%).

3.4. Model Performance Assessment

The current study used five statistical metrics to measure the proposed hybrid techniques’ accuracy, PSOGWO–ANN, CPSOCGSA–ANN, MPA–ANN, and SMA–ANN, when estimating the ETo time series, namely the root mean squared error (RMSE), Nash–Sutcliffe model efficiency (NSE), coefficient of determination (R2), maximum absolute error (MAE), and normalised MSE (NMSE), as shown below:
R M S E = i N R i P i 2 N
N S E = 1 i = 1 N R i P i 2 i = 1 N R i R i ¯ 2
R 2 = i = 1 N ( R i R i ¯ ) ( P i P i ¯ ) ( R i R i ¯ ) 2 ( P i P i ¯ ) 2 ˆ 2
N M S E = log i = 1 N R i P i 2 i = 1 N R i 2
M A E = max [ R i P i ]
where R i is the calculated ETo, P i the predicted ETo, R i ¯ the mean of the calculated ETo, P i ¯ the mean of the predicted ETo, and N the data length. Graphs such as the Bland–Altman plot were used to assess the prediction efficacy of the proposed methodology.

4. Results

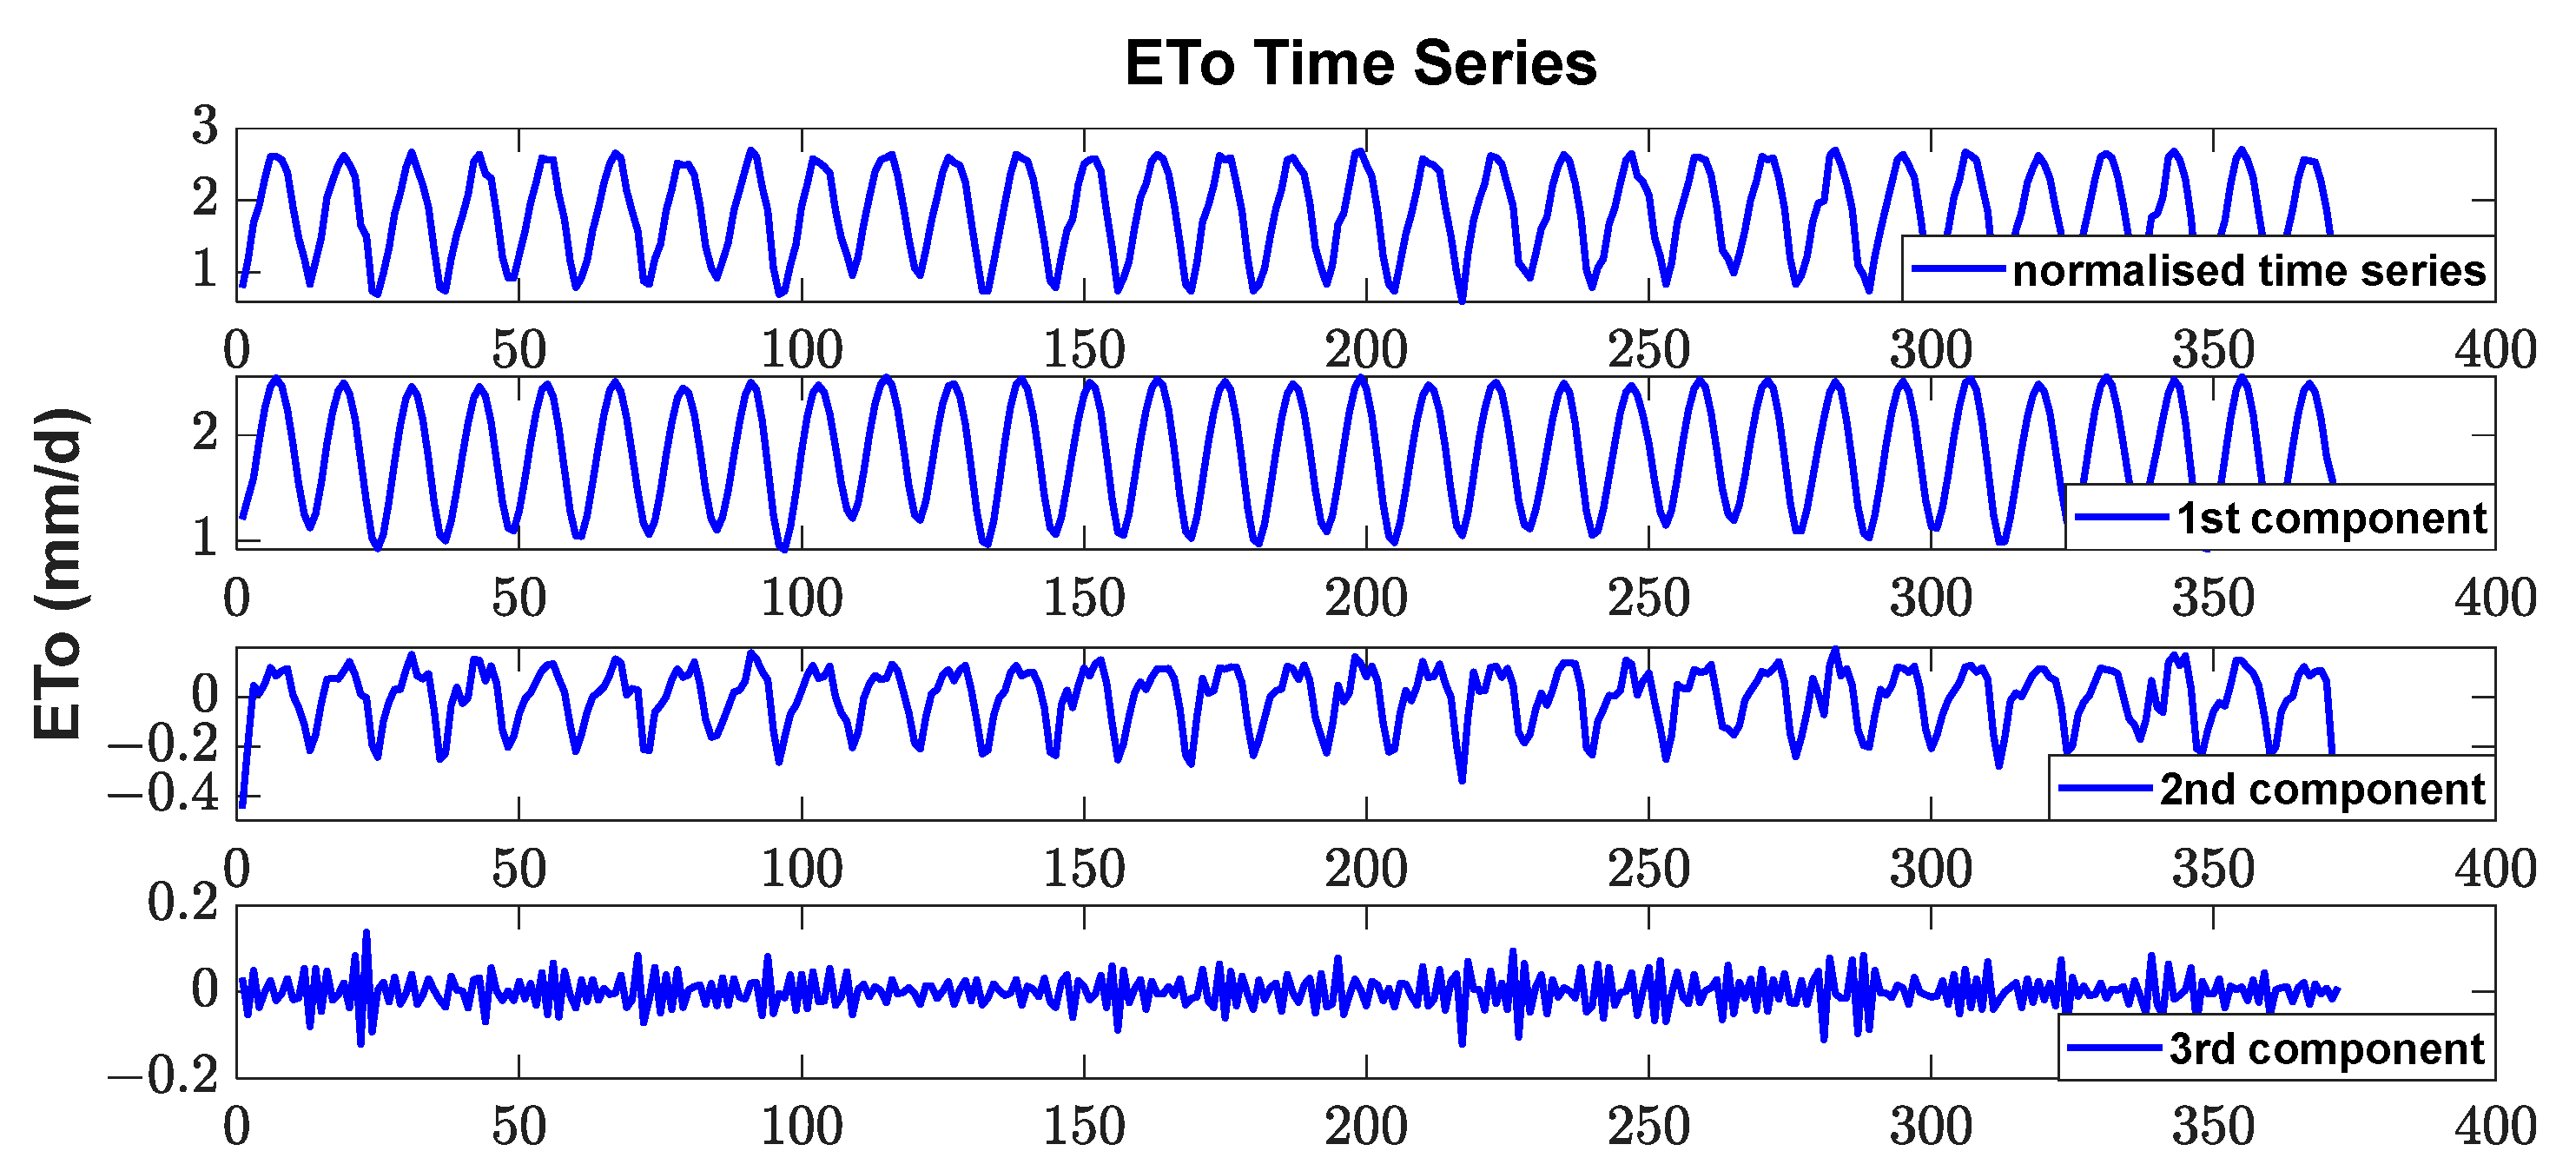
4.1. Input Data Analysis

This part corresponds to Figure 2’s Step A. The data were first normalised using the natural logarithm to minimise the influence of extreme values and bring the distribution of the time series closer to normal [48], with the outliers then corrected. Following this, the SSA method was used to acquire noise-free ETo time series data, this was achieved by analysing the normalised time series into three components. Figure 4 displays the normalised time series and the first three elements of the ETo parameters.
The ideal set of climate factors to precisely simulate ETo data and prevent multicollinearity was determined using the tolerance method as the final step in the data preprocessing procedure. Since the initial tolerance coefficient values were below the minimum threshold of 0.1, a series of scenarios was run to increase the tolerance coefficient values of the selected predictor. The optimal scenario was chosen, as shown in Table 1, with P, Tmin, and WSmax as the best model inputs.
Table 2 shows the correlation coefficients (CCs) between the optimal scenario of predictors (climatic factors) and ETo, at both the original and pre-processed data phases. The table shows how the data pretreatment approaches enhanced the data quality by improving the CCs between ETo and WSmax, and Tmin and P. As can be seen, the CC increased between the input climatic parameters (WSmax, Tmin, and P) and the output (ETo) from 0.898 to 0.942, 0.946 to 0.956, and 0.61 to 0.853, respectively. These CC values confirm the relationships between the meteorological variables and ETo.

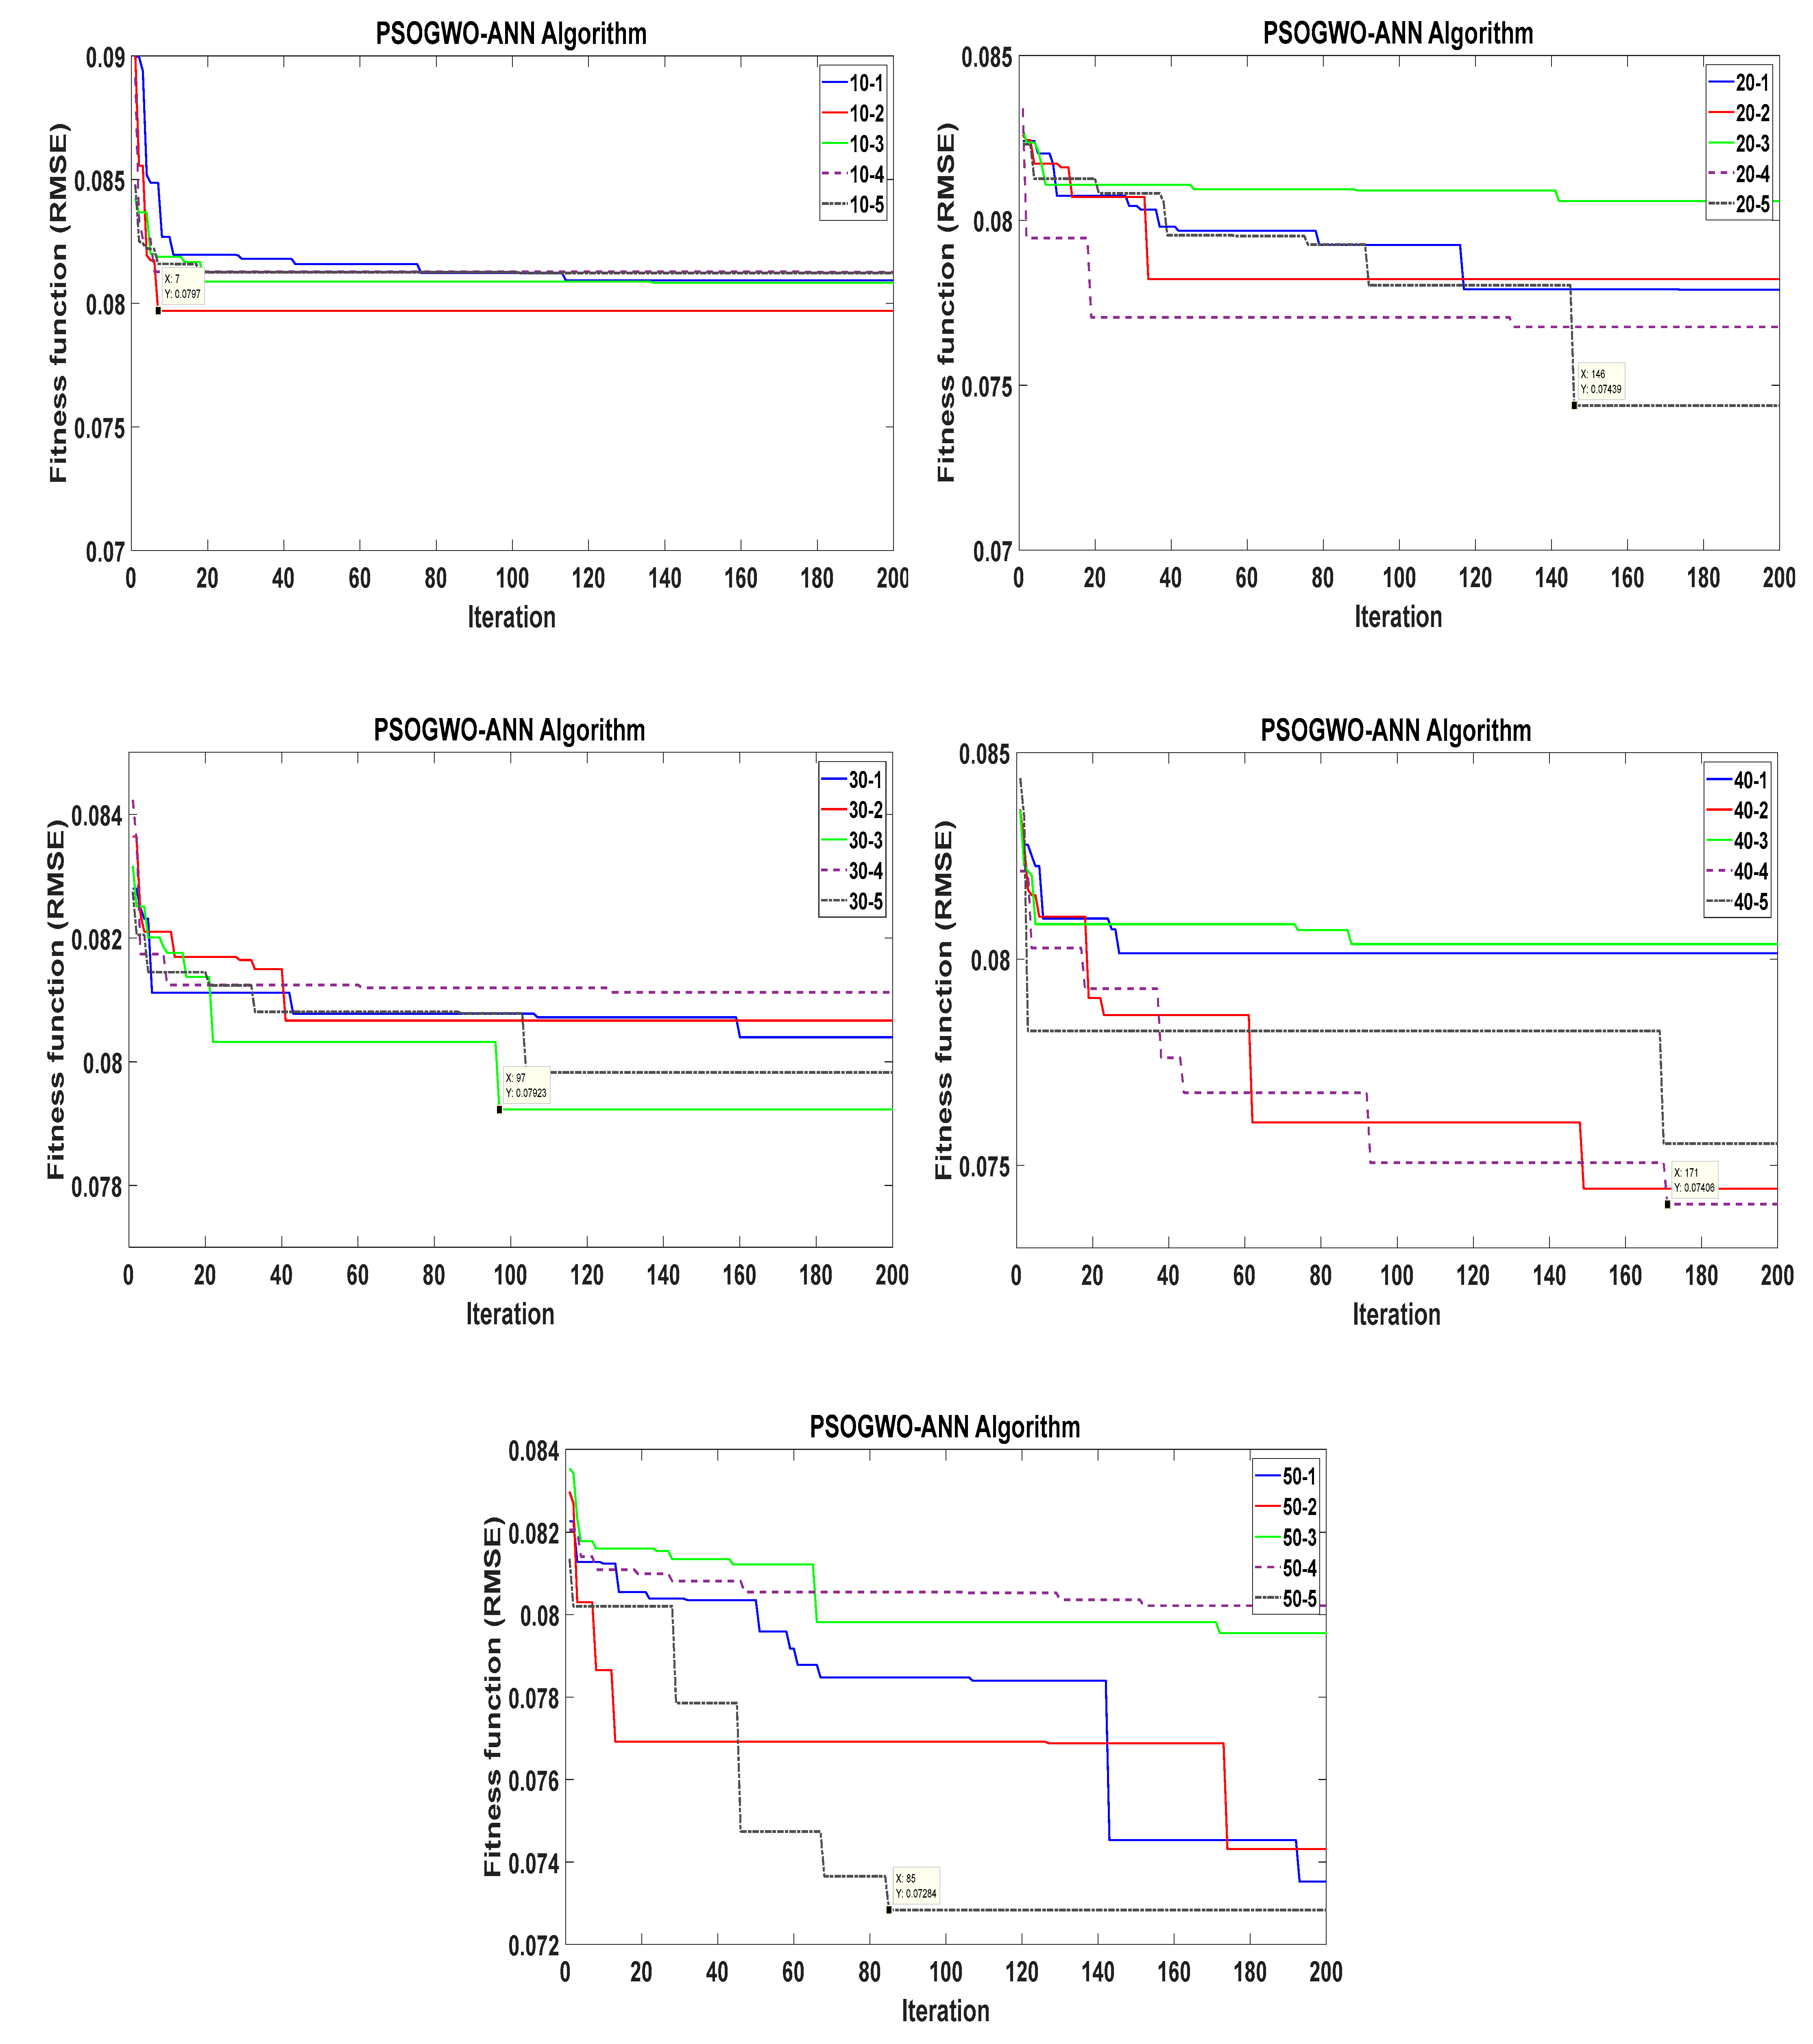
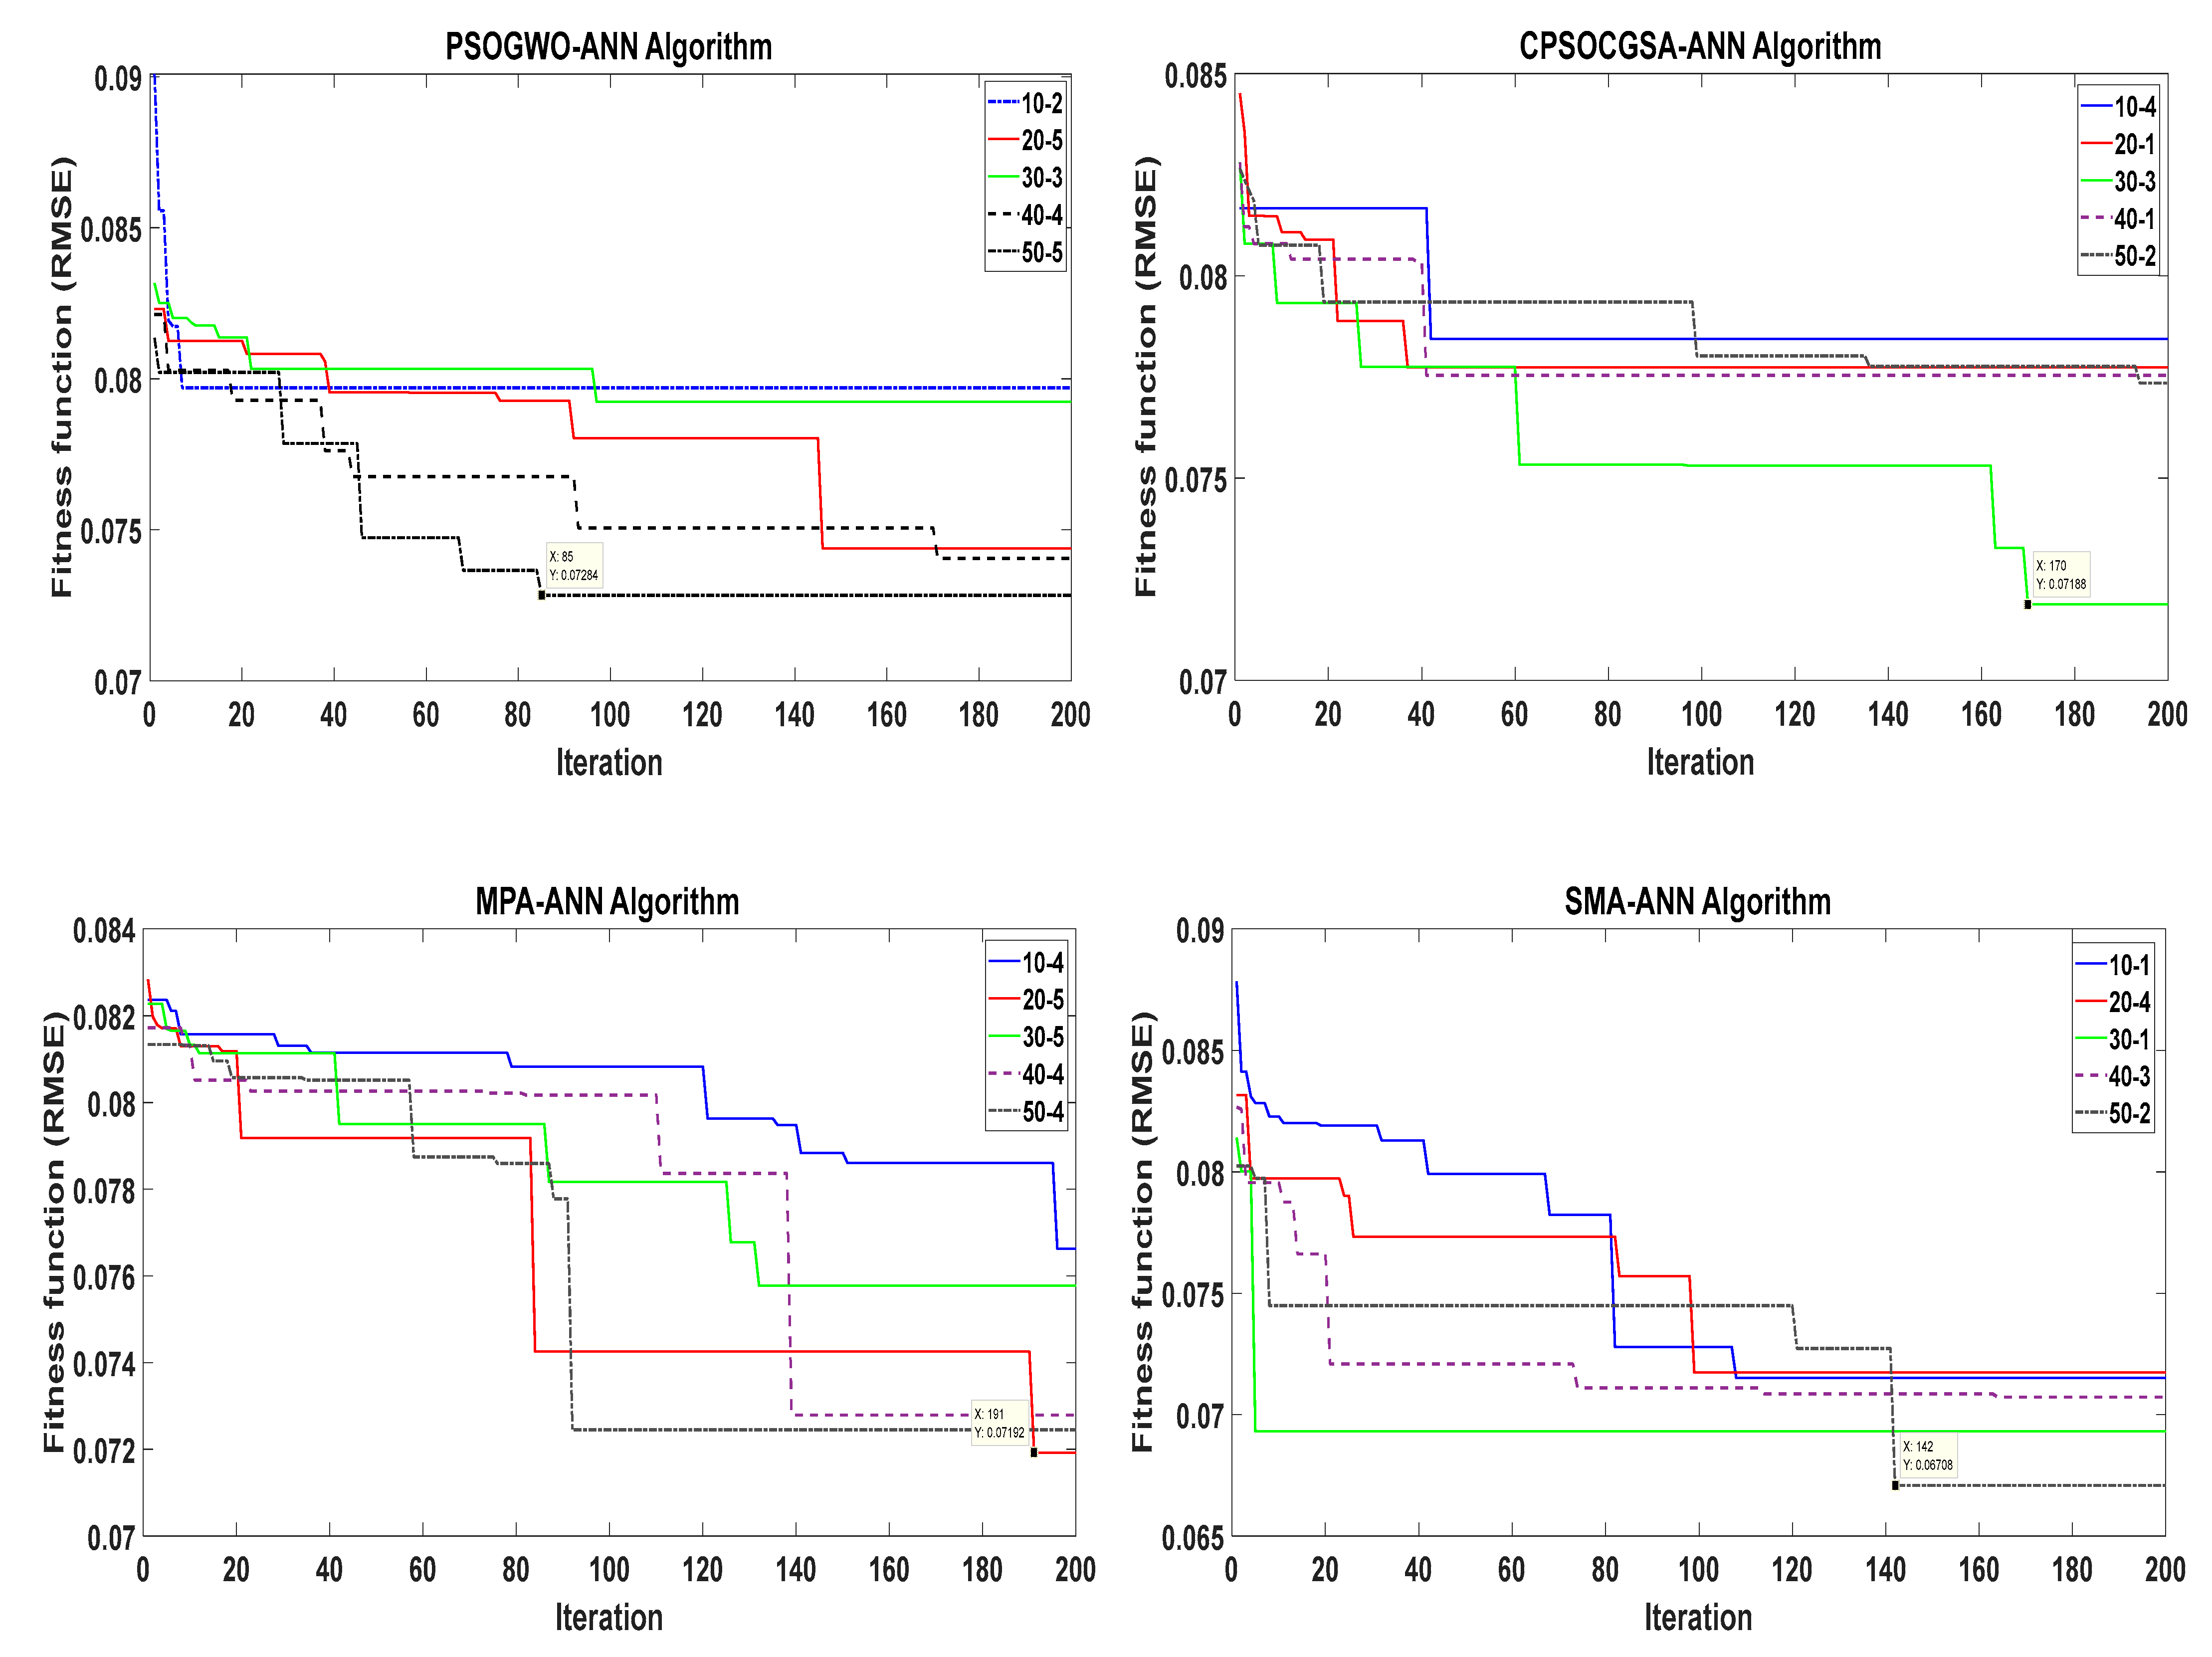
4.2. Configuring the Model

This part corresponds to Figure 2’s Step B. Before configuring the prediction model, the data were split into three sets: training, testing, and validation. In order to evaluate the optimal values for the ANN model’s learning rate coefficient (Lr) and the number of hidden neurons (N1, N2), ANN was integrated with the metaheuristic method. The PSOGWO–ANN, CPSOCGSA–ANN, MPA–ANN, and SMA–ANN models were all performed using the MATLAB toolbox. Each algorithm used five PopSizes: 10, 20, 30, 40, and 50. Five repetitions were made for each size to reduce uncertainty and broaden the range of predictions. The models were run to get a minimal fitness function (RMSE) with 200 iterations. Figure 5 below shows the optimal trial for each PopSize of the PSOGWO–ANN algorithm, 10-2, 20-5, 30-3, 40-4, and 50-5, over five runs. This process broadens the potential applications of the solution while simultaneously reducing the amount of uncertainty.
The best PopSize for each algorithm was then chosen after comparing it to other PopSizes for the same algorithm. According to Figure 6, the best PopSizes are 50-2 for SMA–ANN (RMSE = 0.06708, after 142 iterations), 30-3 for CPSOCGSA–ANN (RMSE = 0.07188, after 170 iterations), 20-5 for MPA–ANN (RMSE = 0.07192, after 191 iterations), and 50-5 for PSOGWO–ANN (RMSE = 0.07284, after 85 iterations). In order to integrate the ANN model, the optimal hyperparameters were realised in four different scenarios that have the ability to accurately simulate ETo data.
The optimal ANN hyperparameters obtained by the suggested algorithms are summarised in Table 3.

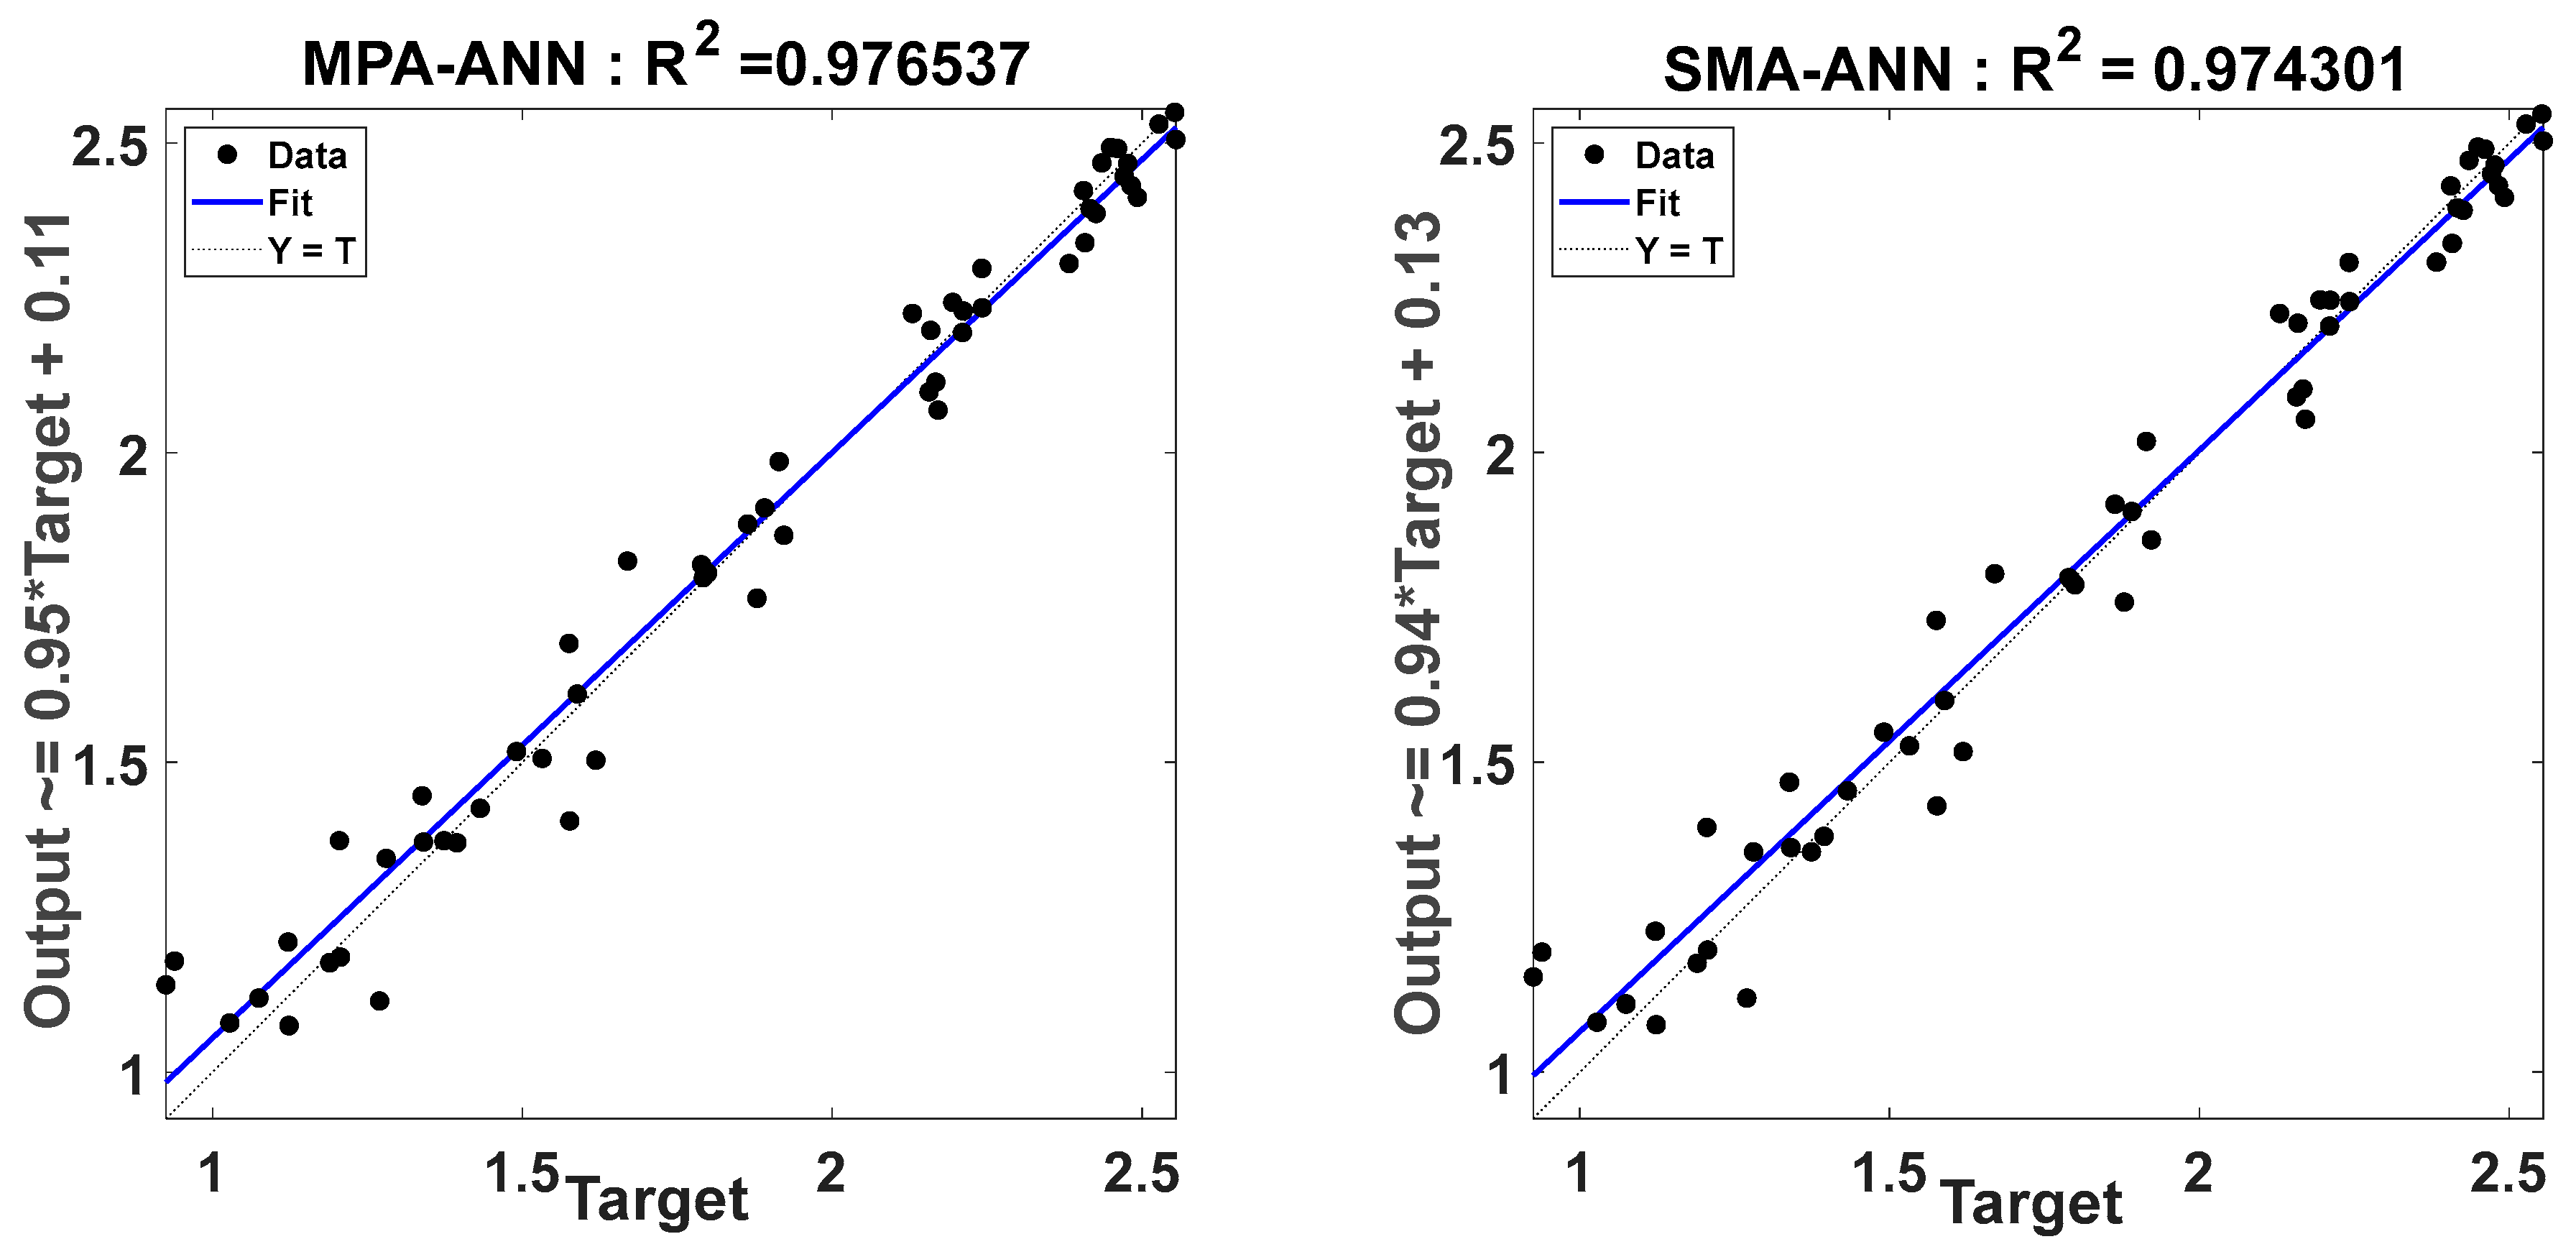
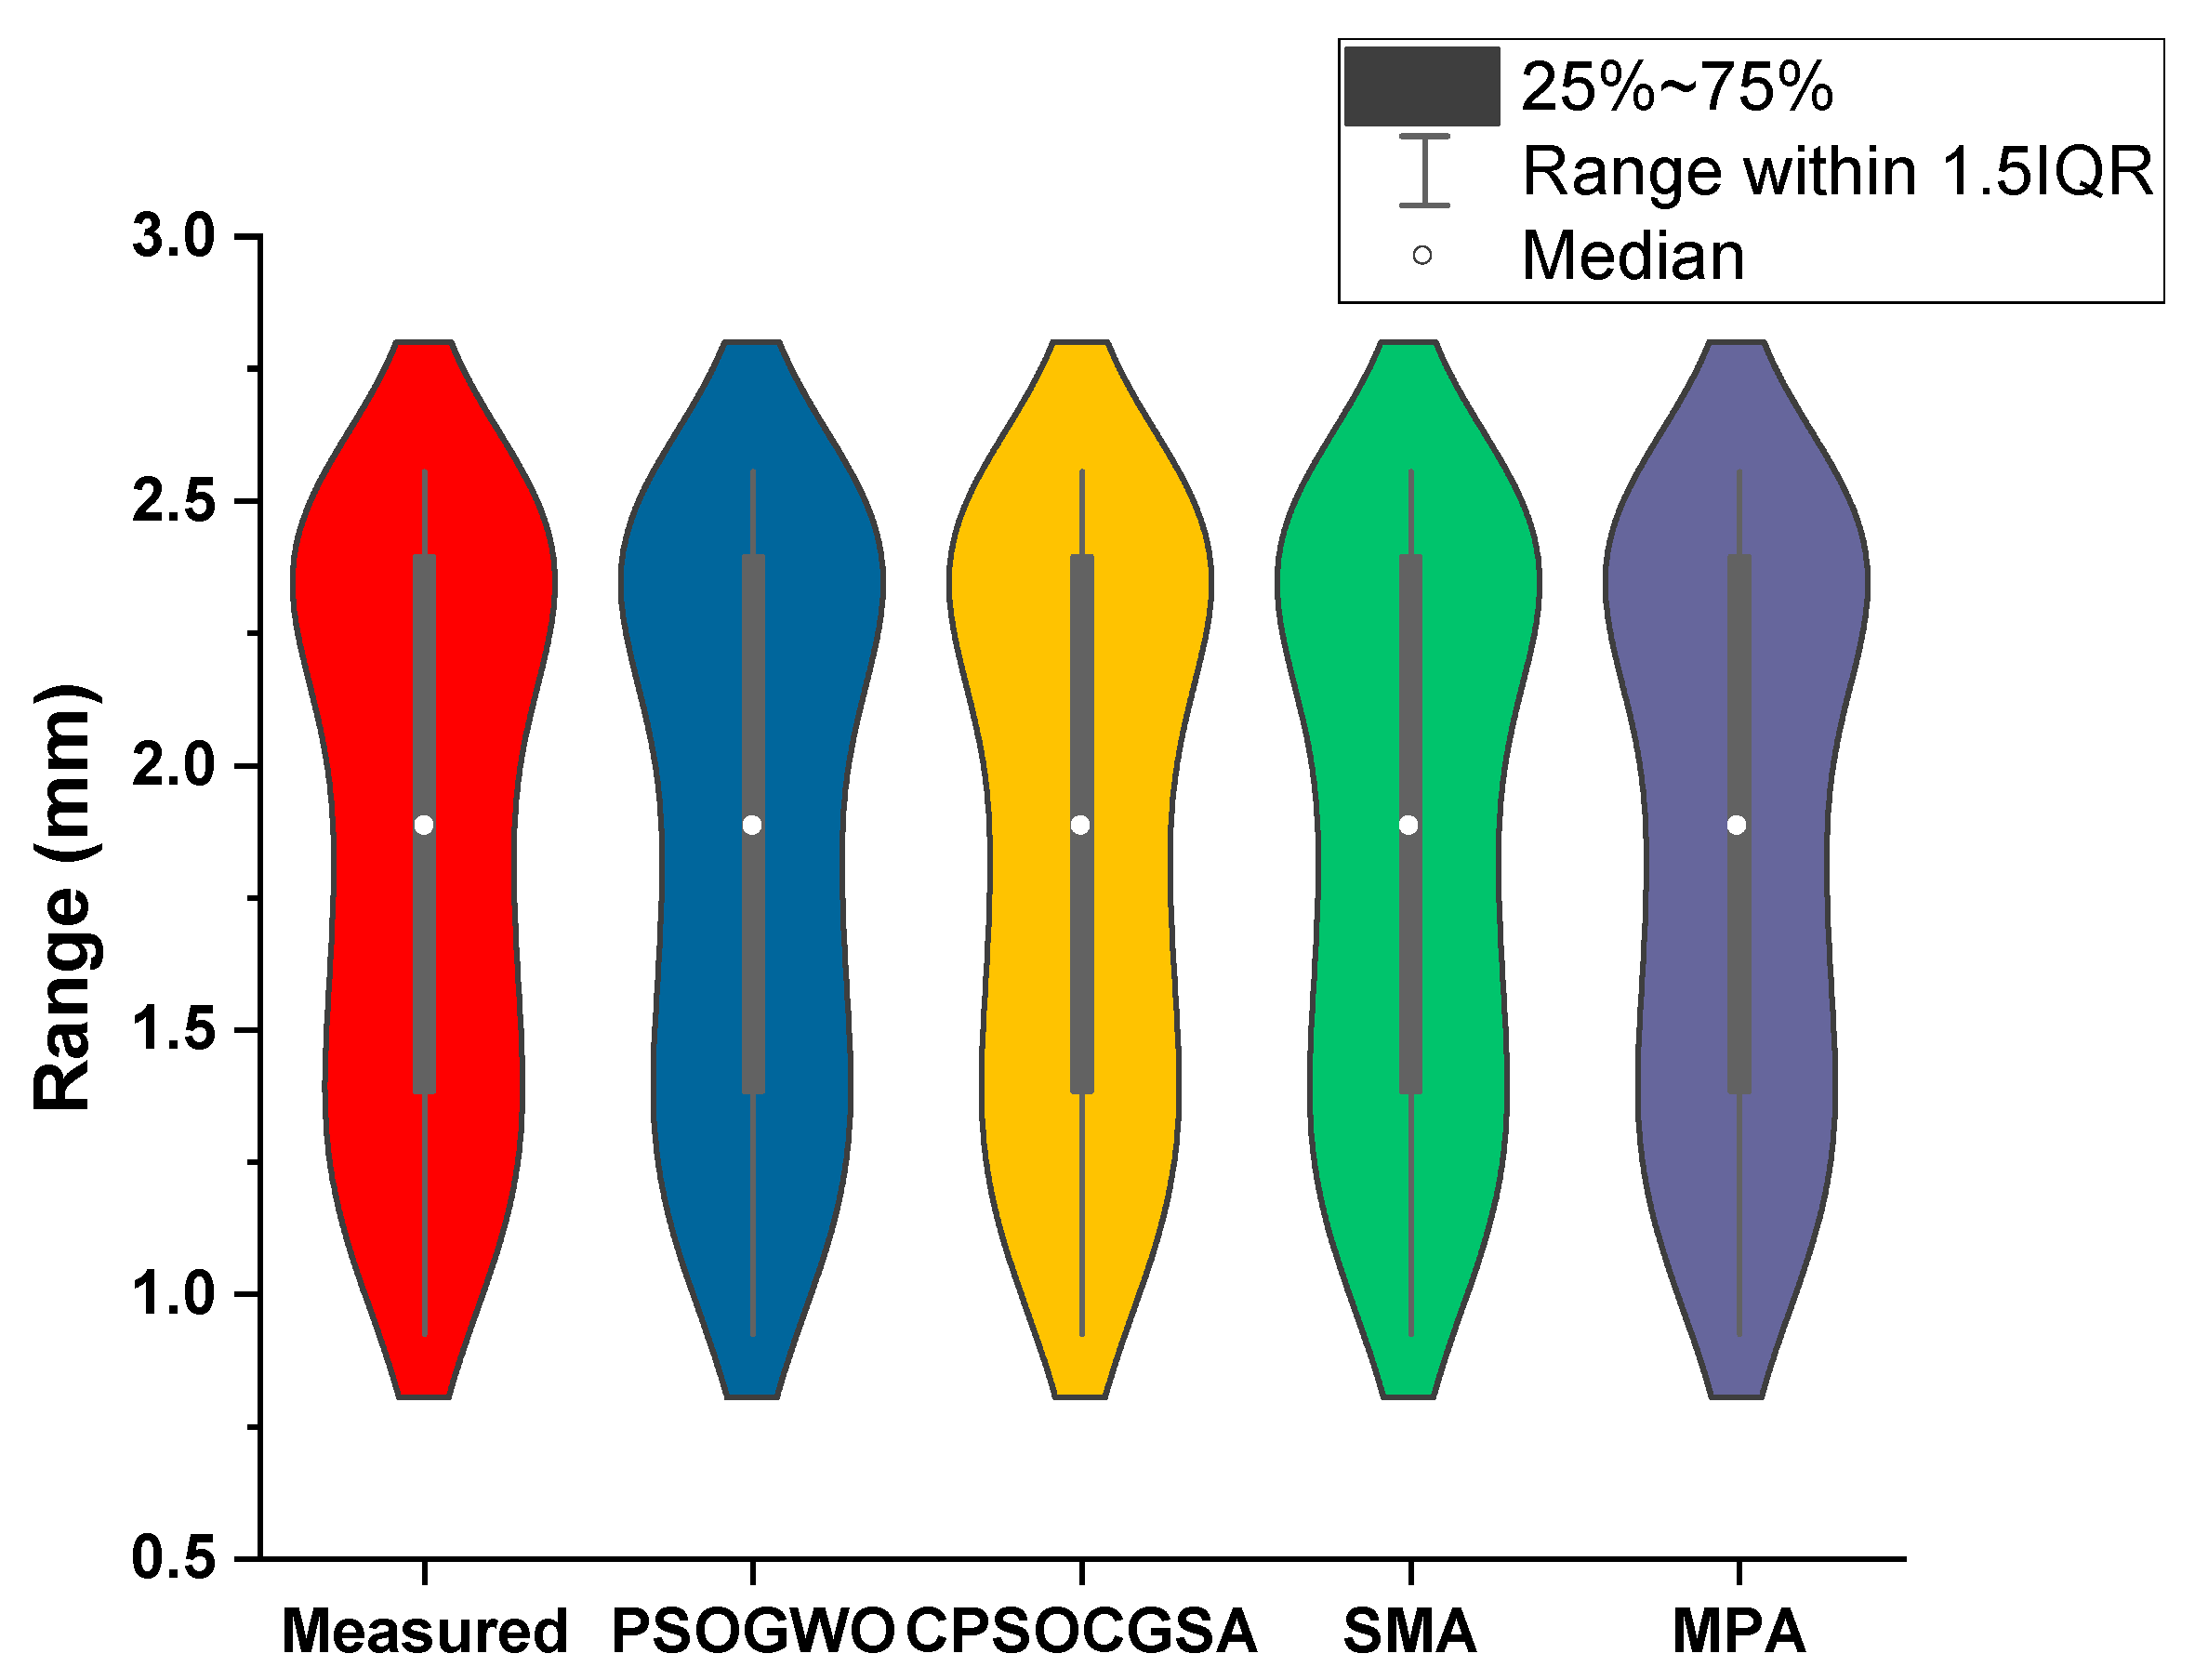
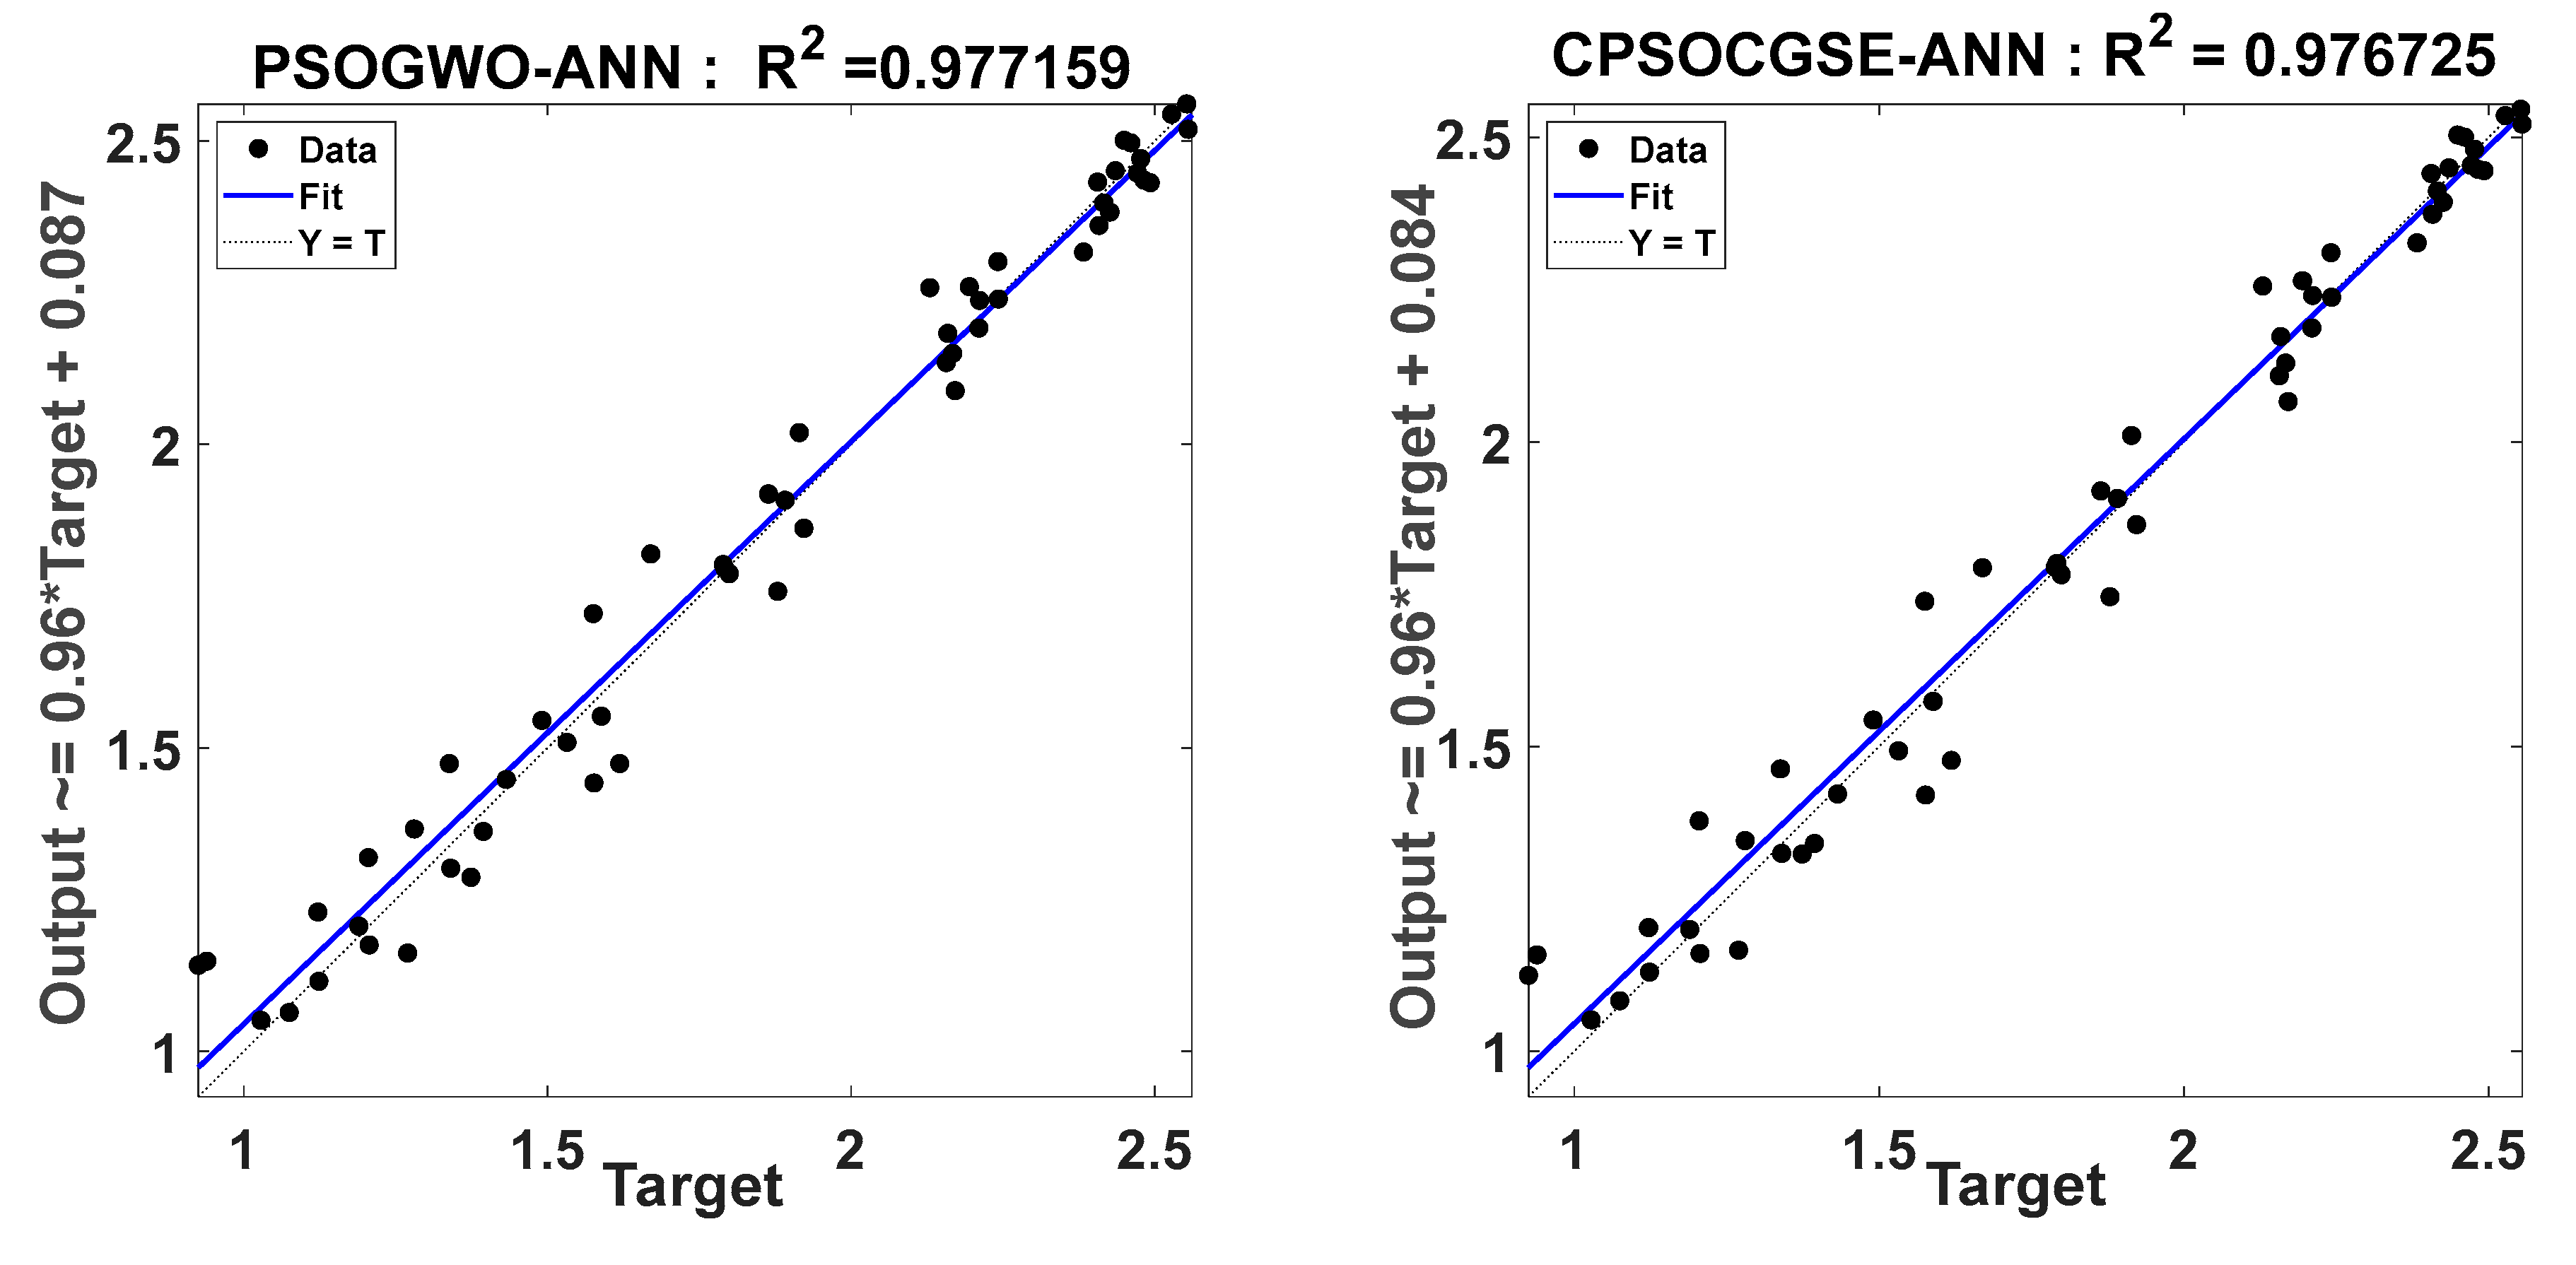
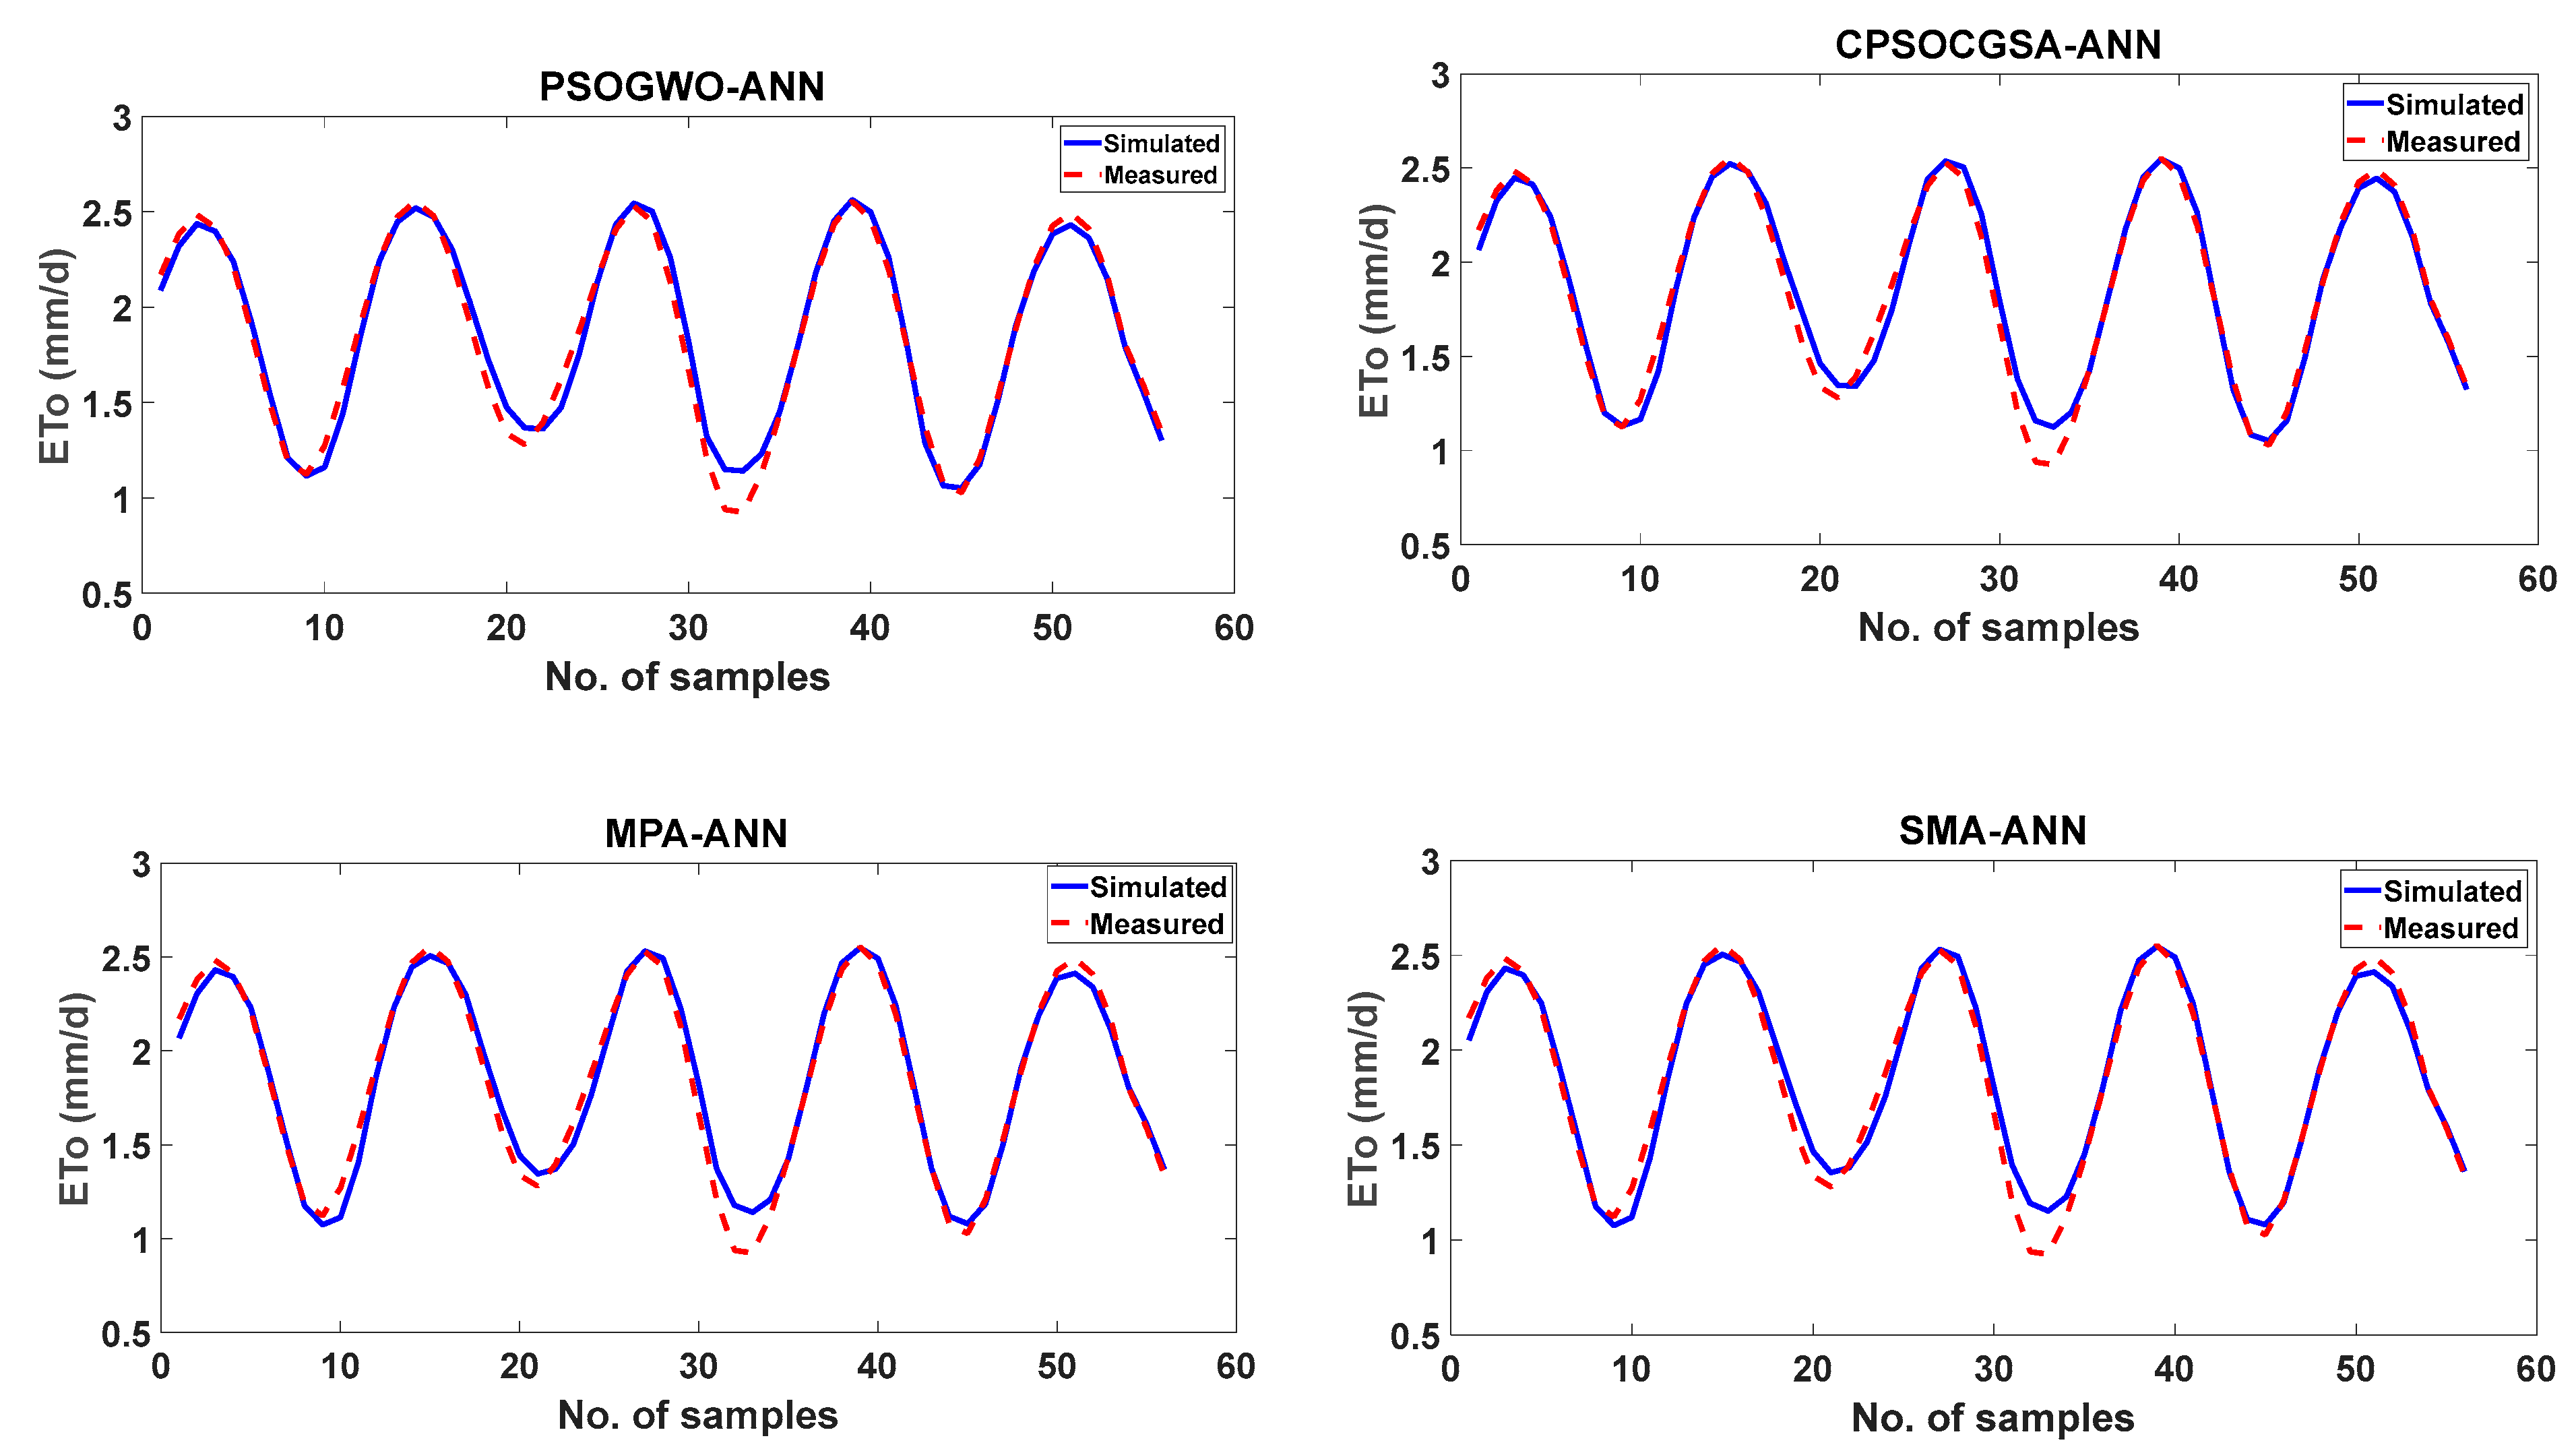
4.3. Performance Evaluation

This part corresponds to Figure 2’s Step C. The established strategies were evaluated and compared using a variety of statistical measures (for more information, see Section 3.4). The outcomes of RMSE, MAE, NSC, and R2 for each approach are shown in Table 4. The comparative results obtained from the statistical analysis revealed that all the models performed well, according to Dawson, et al. [49]. However, the PSOGWO–ANN model outperformed the other models and had the highest NSE, NMSE, and R2 and the lowest RMSE and MAE.
The models were then evaluated by comparing their ETo values against those calculated using FAO 56, which is calculated from the observed climatological parameters. The coefficient of determination was used to determine the relationship between both datasets as, according to Dawson, et al. [49], the findings of all the models show good simulation levels for the ETo time series based on R2. The coefficients of determination for each model are shown in Figure 7. There was a remarkable agreement between the observed data and the simulated data, and there were no anomalous data points or obvious pattern trends.
A visual comparison of calculated and simulated ETo was made in order to evaluate the correctness of all the models. These comparisons are shown in Figure 8, where an excellent fit between the simulated and the calculated ETo time series is illustrated.
The distribution of the observed and predicted ETo datasets has been compared using violin diagrams over the validation period, as shown in Figure 9. Violin diagrams combine a traditional box plot with a density trace, displaying data density as smoothed histograms along the data points [50]. As in a box plot, the minimum, first quartile, median, third quartile, and maximum are the five main components of a violin plot, each of which represents one of the five qualities of a data set [51]. As can be observed from the diagrams, the violin’s curvature for simulated values is extremely similar to the violin’s curvature for calculated values, indicating that all the suggested methods have performed well and were similar in their performance.

5. Discussion

Hyperparameter optimisation and preprocessing data have been proven to improve the predictive power of ML models in a variety of subfields of hydrology, including drought [52], water quality [53], and water level [54]. This study optimised ANN hyperparameters by combining ANN with metaheuristic techniques. This was carried out to screen the potential impact of a range of combinations on the accuracy of ANN in predicting monthly ETo.
In order to maximise prediction accuracy, the input and output time series were subject to three preprocessing techniques, namely normalisation (natural logarithm), a cleaning technique (SSA), and selecting the best predictors’ scenario (cross-correlation and tolerance methods). This pretreatment step, i.e., the SSA technique, helps clean the series of unstructured noise and increases the correlations between the model input and output. Accordingly, the quality of the data was improved, thereby raising the correlation coefficients between ETo and WSmax, Tmin, and P. The correlation coefficients increased from 0.898 to 0.942, 0.946 to 0.956, and 0.61 to 0.853, respectively, between the input climatic parameters WSmax, Tmin, and P and the output (ETo). The present research results are consistent with those of Khan et al. [4] and Pham et al. [5].
Also, systematically selecting the predictors will take all the possible design space solutions that help improve prediction performance and provide an understanding of which metrological factors influence the output response most. As a result, only three of the thirteen climate factors were selected, based on the tolerance method to avoid multicollinearity among predictors. These factors have tolerance coefficients equal to 0.271 for precipitation, 0.185 for minimum temperature, and 0.246 for maximum wind speed. ETo is mainly affected by these three factors, without any violation of multicollinearity assumptions. As indicated in the introduction, wind speed and air temperature are two major climatic factors that influence the ETo process; many studies provide evidence to substantiate this argument [55,56]. These factors influence the balance of energy in the atmosphere and, therefore, evapotranspiration. Taken together, this is unmistakable proof of the methods’ efficacy, as the weather factors that directly affect evapotranspiration were selected. These results are consistent in a good agreement with other studies [57,58], which have shown that selecting the predictors based on systematic procedure instead of the trial and error approach can speed up computation time and improve the accuracy of ML models.
Since the metaheuristic techniques used follow different strategies during optimisation, the hybridisation process leads to different hyperparameter values, which means different model scenarios are obtained. All of the forecasting models performed excellently, and several possible explanations might be argued. A possible explanation for this superiority might be that the data preprocessing technique increased the quality of the data and, then, the prediction accuracy. Also, a likely explanation is the best answer was reached after running each algorithm’s swarm five times, which led to a wider prediction range and lower degree of uncertainty.
Despite the diversity of the model configurations, they showed excellent performance when predicting monthly ETo; the hybrid-based algorithms (PSOGWO and CPSOCGSA) somewhat outperformed the single-based algorithms (SMA and MPA). These findings of the current study do support the previous research [10,45] that hybrid-based metaheuristic algorithms are better than single-based algorithms. However, the best model was found to be the hybrid metaheuristic PSOGWO–ANN. This is evidenced via the results from RMSE, MAE, NSE, NSME, and R2, with a fewer number of iterations during the optimisation process (Figure 6), and is also further supported by the literature [23,37,56,59].
These findings further support the hypothesis reported in the literature [60,61] that hybrid-based algorithms can achieve higher accuracy, better stability, and dependability for addressing real-world issues without getting stuck in local minima. Further research should be done to investigate the hybrid-based metaheuristic algorithms with other ML models such as RF and ELM.

6. Conclusions

The current study looked into the viability of a new hybrid approach, PSOGWO–ANN, to model monthly ETo. The FAO 56 PM equation, in addition to the four hybrid ANN methods, PSOGWO–ANN CPSOCGSA–ANN, MPA–ANN, and SMA–ANN, were applied to calculate monthly ETos using data collected over a 30-year period for Al-Kut City in Iraq.
The proposed procedure included preprocessing methods such as the natural logarithm for normalisation, the SSA technique for cleaning, and cross-correlation and tolerance techniques that helped to identify the most consequential variables for use in the ANN model inputs scenario. Based on the results and the discussion, the primary findings of this study can be summarised as follows:
  • The preprocessing method revealed that the WSmax, P, and Tmin are the best set of inputs for the model. This was deduced based on the tolerance coefficients.
  • ANN is a powerful prediction tool; its use in conjunction with metaheuristic algorithms has the benefit of overcoming overfitting restrictions, as well as enhancing performance and saving time by selecting the optimal Lr coefficient and N1 and N2 for the hidden layers.
  • All of the forecasting models performed excellently. However, hybrid-based algorithms (PSOGWO and CPSOCGSA) somewhat outperformed the single-based algorithms (SMA and MPA).
  • The PSOGWO–ANN algorithm was the best, which had the following metrics: R2 = 0.977, RMSE = 0.07809, MAE = 0.14456, NSE = 0.9763, and NMSE = 0.97492, demonstrating that this methodology is a reliable approach for predicting monthly ETo.
The findings of this study are of utmost importance for estimating ETo in semi-arid subtropical regions (especially for developing nations), where meteorological data are either unavailable or incomplete for technological reasons. This study may also be helpful in advising decision-makers on how to distribute water resources in Al-Kut City.
The PSOGWO–ANN hybrid model is a promising technique for estimating monthly ETo. So, it is crucial that the PSOGWO algorithm be investigated in conjunction with other ML models, such as ELM and RF, in future studies. Future research is also highly recommended in other regions of the world with humid climates to compare to the results of this study.

Author Contributions

Conceptualization, S.L.Z. and F.A.A.-F.; Methodology, H.E.K., S.L.Z. and A.D.; Software, M.A.-M., A.D. and H.M.R.; Validation, H.A.-B. and H.M.R.; Formal analysis, H.E.K., S.L.Z. and H.M.R.; Investigation, M.A.-M. and A.D.; Resources, H.M.R.; Data curation, H.E.K. and H.A.-B.; Writing—original draft, H.E.K.; Writing—review & editing, H.E.K., S.L.Z., M.A.-M., H.A.-B. and F.A.A.-F.; Visualization, F.A.A.-F.; Supervision, S.L.Z.; Project administration, S.L.Z. All authors have read and agreed to the published version of the manuscript.

Funding

This research received no external funding.

Institutional Review Board Statement

Not applicable.

Informed Consent Statement

Not applicable.

Data Availability Statement

Data were obtained from the National Oceanic and Atmospheric Administration (NASA) https://www.ncdc.noaa.gov/cdo-web/datatools/findstation (accessed on 27 July 2022).

Conflicts of Interest

The authors declare no conflict of interest.

References

  1. Yu, J.; Zheng, W.; Xu, L.; Zhangzhong, L.; Zhang, G.; Shan, F. A PSO-XGBoost Model for Estimating Daily Reference Evapotranspiration in the Solar Greenhouse. Intell. Autom. Soft Comput. 2020, 26, 989–1003. [Google Scholar] [CrossRef]
  2. Zhu, B.; Feng, Y.; Gong, D.; Jiang, S.; Zhao, L.; Cui, N. Hybrid particle swarm optimization with extreme learning machine for daily reference evapotranspiration prediction from limited climatic data. Comput. Electron. Agric. 2020, 173, 105430. [Google Scholar] [CrossRef]
  3. Allen, R.G.; Pereira, L.S.; Raes, D.; Smith, M. Crop Evapotranspiration-Guidelines for Computing Crop Water Requirements-FAO Irrigation and Drainage Paper 56; FAO: Rome, Italy, 1998; Volume 300, p. D05109. [Google Scholar]
  4. Ding, Z.; Ali, E.F.; Elmahdy, A.M.; Ragab, K.E.; Seleiman, M.F.; Kheir, A.M.S. Modeling the combined impacts of deficit irrigation, rising temperature and compost application on wheat yield and water productivity. Agric. Water Manag. 2021, 244, 106626. [Google Scholar] [CrossRef]
  5. Gavilán, P.; Lorite, I.; Tornero, S.; Berengena, J. Regional calibration of Hargreaves equation for estimating reference ET in a semiarid environment. Agric. Water Manag. 2006, 81, 257–281. [Google Scholar] [CrossRef]
  6. Yan, S.; Wu, L.; Fan, J.; Zhang, F.; Zou, Y.; Wu, Y. A novel hybrid WOA-XGB model for estimating daily reference evapotranspiration using local and external meteorological data: Applications in arid and humid regions of China. Agric. Water Manag. 2021, 244, 106594. [Google Scholar] [CrossRef]
  7. Wu, L.; Zhou, H.; Ma, X.; Fan, J.; Zhang, F. Daily reference evapotranspiration prediction based on hybridized extreme learning machine model with bio-inspired optimization algorithms: Application in contrasting climates of China. J. Hydrol. 2019, 577, 123960. [Google Scholar] [CrossRef]
  8. Tikhamarine, Y.; Malik, A.; Souag-Gamane, D.; Kisi, O. Artificial intelligence models versus empirical equations for modeling monthly reference evapotranspiration. Environ. Sci. Pollut. Res. Int. 2020, 27, 30001–30019. [Google Scholar] [CrossRef]
  9. Jing, W.; Yaseen, Z.M.; Shahid, S.; Saggi, M.K.; Tao, H.; Kisi, O.; Salih, S.Q.; Al-Ansari, N.; Chau, K.-W. Implementation of evolutionary computing models for reference evapotranspiration modeling: Short review, assessment and possible future research directions. Eng. Appl. Comput. Fluid Mech. 2019, 13, 811–823. [Google Scholar] [CrossRef]
  10. Zeinolabedini Rezaabad, M.; Ghazanfari, S.; Salajegheh, M. ANFIS Modeling with ICA, BBO, TLBO, and IWO Optimization Algorithms and Sensitivity Analysis for Predicting Daily Reference Evapotranspiration. J. Hydrol. Eng. 2020, 25, 04020038. [Google Scholar] [CrossRef]
  11. Wu, L.; Peng, Y.; Fan, J.; Wang, Y.; Huang, G. A novel kernel extreme learning machine model coupled with K-means clustering and firefly algorithm for estimating monthly reference evapotranspiration in parallel computation. Agric. Water Manag. 2021, 245, 106624. [Google Scholar] [CrossRef]
  12. Adnan, R.M.; Mostafa, R.R.; Islam, A.R.M.T.; Kisi, O.; Kuriqi, A.; Heddam, S. Estimating reference evapotranspiration using hybrid adaptive fuzzy inferencing coupled with heuristic algorithms. Comput. Electron. Agric. 2021, 191, 106541. [Google Scholar] [CrossRef]
  13. Elgeldawi, E.; Sayed, A.; Galal, A.R.; Zaki, A.M. Hyperparameter tuning for machine learning algorithms used for arabic sentiment analysis. Informatics 2021, 8, 79. [Google Scholar] [CrossRef]
  14. Kheir, A.M.; Elnashar, A.; Mosad, A.; Govind, A.J.H. An improved deep learning procedure for statistical downscaling of climate data. Heliyon 2023, 9, e18200. [Google Scholar] [CrossRef]
  15. Kheir, A.M.; Ammar, K.A.; Amer, A.; Ali, M.G.; Ding, Z.; Elnashar, A.J.C.; Agriculture, E.i. Machine learning-based cloud computing improved wheat yield simulation in arid regions. Comput. Electron. Agric. 2022, 203, 107457. [Google Scholar] [CrossRef]
  16. Ahmed, A.N.; Van Lam, T.; Hung, N.D.; Van Thieu, N.; Kisi, O.; El-Shafie, A.J.A.S.C. A comprehensive comparison of recent developed meta-heuristic algorithms for streamflow time series forecasting problem. Appl. Soft Comput. 2021, 105, 107282. [Google Scholar] [CrossRef]
  17. Lai, V.; Essam, Y.; Huang, Y.F.; Ahmed, A.N.; El-Shafie, A. Investigating dam reservoir operation optimization using metaheuristic algorithms. Appl. Water Sci. 2022, 12, 280. [Google Scholar] [CrossRef]
  18. Adetunji, K.E.; Hofsajer, I.W.; Abu-Mahfouz, A.M.; Cheng, L.J.I.A. A review of metaheuristic techniques for optimal integration of electrical units in distribution networks. IEEE Access 2020, 9, 5046–5068. [Google Scholar] [CrossRef]
  19. Muhammad Adnan, R.; Chen, Z.; Yuan, X.; Kisi, O.; El-Shafie, A.; Kuriqi, A.; Ikram, M. Reference Evapotranspiration Modeling Using New Heuristic Methods. Entropy 2020, 22, 547. [Google Scholar] [CrossRef]
  20. Tikhamarine, Y.; Malik, A.; Kumar, A.; Souag-Gamane, D.; Kisi, O. Estimation of monthly reference evapotranspiration using novel hybrid machine learning approaches. Hydrol. Sci. J. 2019, 64, 1824–1842. [Google Scholar] [CrossRef]
  21. Tikhamarine, Y.; Malik, A.; Pandey, K.; Sammen, S.S.; Souag-Gamane, D.; Heddam, S.; Kisi, O. Monthly evapotranspiration estimation using optimal climatic parameters: Efficacy of hybrid support vector regression integrated with whale optimization algorithm. Environ. Monit. Assess 2020, 192, 696. [Google Scholar] [CrossRef]
  22. Maroufpoor, S.; Bozorg-Haddad, O.; Maroufpoor, E. Reference evapotranspiration estimating based on optimal input combination and hybrid artificial intelligent model: Hybridization of artificial neural network with grey wolf optimizer algorithm. J. Hydrol. 2020, 588, 125060. [Google Scholar] [CrossRef]
  23. Roy, D.K.; Barzegar, R.; Quilty, J.; Adamowski, J. Using ensembles of adaptive neuro-fuzzy inference system and optimization algorithms to predict reference evapotranspiration in subtropical climatic zones. J. Hydrol. 2020, 591, 125509. [Google Scholar] [CrossRef]
  24. Mehdizadeh, S.; Mohammadi, B.; Pham, Q.B.; Duan, Z. Development of Boosted Machine Learning Models for Estimating Daily Reference Evapotranspiration and Comparison with Empirical Approaches. Water 2021, 13, 3489. [Google Scholar] [CrossRef]
  25. Krishnashetty, P.H.; Balasangameshwara, J.; Sreeman, S.; Desai, S.; Kantharaju, A.B.J.C.S.R. Cognitive computing models for estimation of reference evapotranspiration: A review. Cogn. Syst. Res. 2021, 70, 109–116. [Google Scholar] [CrossRef]
  26. Khairan, H.E.; Zubaidi, S.L.; Muhsen, Y.R.; Al-Ansari, N. Parameter Optimisation Based Hybrid Reference Evapotranspiration Prediction Models A Systematic Review of Current Implementations and Future Research Directions. Atmosphere 2022, 14, 77. [Google Scholar] [CrossRef]
  27. Eiben, A.E.; Schippers, C.A. On evolutionary exploration and exploitation. Fundam. Informaticae 1998, 35, 35–50. [Google Scholar] [CrossRef]
  28. Al-Ansari, N. Topography and climate of Iraq. J. Earth Sci. Geotech. Eng. 2021, 11, 1–13. [Google Scholar] [CrossRef]
  29. Muter, S.A.; Nassif, W.G.; Al-Ramahy, Z.A.; Al-Taai, O.T. Analysis of seasonal and annual relative humidity using GIS for selected stations over Iraq during the period (1980–2017). J. Green Eng. 2020, 10, 9121–9135. [Google Scholar]
  30. Sheina, S.; Muhsin, M.; Girya, L. Application technology solar thermal power plant in Al-Kut. E3S Web Conf. 2021, 263, 05019. [Google Scholar] [CrossRef]
  31. Al-Abadi, A.; Al-Aboodi, A.H.D. Optimum rain-gauges network design of some cities in Iraq. J. Babylon Univ./Eng. Sci. 2014, 22, 946–958. [Google Scholar]
  32. Alawsi, M.A.; Zubaidi, S.L.; Al-Ansari, N.; Al-Bugharbee, H.; Ridha, H.M. Tuning ANN Hyperparameters by CPSOCGSA, MPA, and SMA for Short-Term SPI Drought Forecasting. Atmosphere 2022, 13, 1436. [Google Scholar] [CrossRef]
  33. Tayyeh, H.K.; Mohammed, R. Analysis of NASA POWER reanalysis products to predict temperature and precipitation in Euphrates River basin. J. Hydrol. 2023, 619, 129327. [Google Scholar] [CrossRef]
  34. Capt, T.; Mirchi, A.; Kumar, S.; Walker, W.S. Urban water demand: Statistical optimization approach to modeling daily demand. J. Water Resour. Plan. Manag. 2021, 147, 04020105. [Google Scholar] [CrossRef]
  35. Singh, D.; Singh, B. Investigating the impact of data normalization on classification performance. Appl. Soft Comput. 2020, 97, 105524. [Google Scholar] [CrossRef]
  36. Espinosa, F.; Bartolomé, A.B.; Hernández, P.V.; Rodriguez-Sanchez, M. Contribution of Singular Spectral Analysis to Forecasting and Anomalies Detection of Indoors Air Quality. Sensors 2022, 22, 3054. [Google Scholar] [CrossRef]
  37. Mohammadi, B.; Mehdizadeh, S. Modeling daily reference evapotranspiration via a novel approach based on support vector regression coupled with whale optimization algorithm. Agric. Water Manag. 2020, 237, 106145. [Google Scholar] [CrossRef]
  38. Ruiming, F.; Shijie, S. Daily reference evapotranspiration prediction of Tieguanyin tea plants based on mathematical morphology clustering and improved generalized regression neural network. Agric. Water Manag. 2020, 236, 106177. [Google Scholar] [CrossRef]
  39. Pallant, J. SPSS Survival Manual: A Step by Step Guide to Data Analysis Using IBM SPSS; McGraw-Hill Education: London, UK, 2020. [Google Scholar]
  40. Kennedy, J.; Eberhart, R. Particle swarm optimization. In Proceedings of the ICNN’95-International Conference on Neural Networks, Perth, Australia, 27 November–1 December 1995; pp. 1942–1948. [Google Scholar]
  41. Suman, G.K.; Guerrero, J.M.; Roy, O.P. Optimisation of solar/wind/bio-generator/diesel/battery based microgrids for rural areas: A PSO-GWO approach. Sustain. Cities Soc. 2021, 67, 102723. [Google Scholar] [CrossRef]
  42. Adnan, R.M.; Mostafa, R.R.; Kisi, O.; Yaseen, Z.M.; Shahid, S.; Zounemat-Kermani, M. Improving streamflow prediction using a new hybrid ELM model combined with hybrid particle swarm optimization and grey wolf optimization. Knowl.-Based Syst. 2021, 230, 107379. [Google Scholar] [CrossRef]
  43. Mirjalili, S.; Mirjalili, S.M.; Lewis, A. Grey wolf optimizer. Adv. Eng. Softw. 2014, 69, 46–61. [Google Scholar] [CrossRef]
  44. Dong, J.; Liu, X.; Huang, G.; Fan, J.; Wu, L.; Wu, J. Comparison of four bio-inspired algorithms to optimize KNEA for predicting monthly reference evapotranspiration in different climate zones of China. Comput. Electron. Agric. 2021, 186, 106211. [Google Scholar] [CrossRef]
  45. El-Kenawy, E.M.; Zerouali, B.; Bailek, N.; Bouchouich, K.; Hassan, M.A.; Almorox, J.; Kuriqi, A.; Eid, M.; Ibrahim, A. Improved weighted ensemble learning for predicting the daily reference evapotranspiration under the semi-arid climate conditions. Environ. Sci. Pollut. Res. Int. 2022, 29, 81279–81299. [Google Scholar] [CrossRef]
  46. Şenel, F.A.; Gökçe, F.; Yüksel, A.S.; Yiğit, T. A novel hybrid PSO–GWO algorithm for optimization problems. Eng. Comput. 2019, 35, 1359–1373. [Google Scholar] [CrossRef]
  47. Gocić, M.; Arab Amiri, M. Reference Evapotranspiration Prediction Using Neural Networks and Optimum Time Lags. Water Resour. Manag. 2021, 35, 1913–1926. [Google Scholar] [CrossRef]
  48. Tabachnick, B.G.; Fidell, L.S.; Ullman, J.B. Using Multivariate Statistics; Pearson: Boston, MA, USA, 2013; Volume 6. [Google Scholar]
  49. Dawson, C.W.; Abrahart, R.J.; See, L.M. HydroTest: A web-based toolbox of evaluation metrics for the standardised assessment of hydrological forecasts. Environ. Model. Softw. 2007, 22, 1034–1052. [Google Scholar] [CrossRef]
  50. Potter, K. Methods for presenting statistical information: The box plot. In Visualization of Large and Unstructured Data Sets, GI-Edition Lecture Notes in Informatics (LNI); Hagen, H., Kerren, A., Dannenmann, P., Eds.; 2006; Volume S-4, pp. 97–106. Available online: https://www.sci.utah.edu/~kpotter/publications/potter-2006-MPSI.pdf (accessed on 1 September 2023).
  51. Hu, K. Become competent within one day in generating boxplots and violin plots for a novice without prior R experience. Methods Protoc. 2020, 3, 64. [Google Scholar] [CrossRef]
  52. Alawsi, M.A.; Zubaidi, S.L.; Al-Bdairi, N.S.S.; Al-Ansari, N.; Hashim, K. Drought Forecasting: A Review and Assessment of the Hybrid Techniques and Data Pre-Processing. Hydrology 2022, 9, 115. [Google Scholar] [CrossRef]
  53. Khudhair, Z.S.; Zubaidi, S.L.; Ortega-Martorell, S.; Al-Ansari, N.; Ethaib, S.; Hashim, K. A Review of Hybrid Soft Computing and Data Pre-Processing Techniques to Forecast Freshwater Quality’s Parameters: Current Trends and Future Directions. Environments 2022, 9, 85. [Google Scholar] [CrossRef]
  54. Mohammed, S.J.; Zubaidi, S.L.; Ortega-Martorell, S.; Al-Ansari, N.; Ethaib, S.; Hashim, K. Application of hybrid machine learning models and data pre-processing to predict water level of watersheds: Recent trends and future perspective. Cogent Eng. 2022, 9, 2143051. [Google Scholar] [CrossRef]
  55. Jiao, P.; Hu, S.-J. Optimal Alternative for Quantifying Reference Evapotranspiration in Northern Xinjiang. Water 2021, 14, 1. [Google Scholar] [CrossRef]
  56. Ahmadi, F.; Mehdizadeh, S.; Mohammadi, B.; Pham, Q.B.; Doan, T.N.C.; Vo, N.D. Application of an artificial intelligence technique enhanced with intelligent water drops for monthly reference evapotranspiration estimation. Agric. Water Manag. 2021, 244, 106622. [Google Scholar] [CrossRef]
  57. Shah, M.I.; Javed, M.F.; Alqahtani, A.; Aldrees, A. Environmental assessment based surface water quality prediction using hyper-parameter optimized machine learning models based on consistent big data. Process Saf. Environ. Prot. 2021, 151, 324–340. [Google Scholar] [CrossRef]
  58. Karbasi, M.; Jamei, M.; Ali, M.; Malik, A.; Yaseen, Z.M. Forecasting weekly reference evapotranspiration using Auto Encoder Decoder Bidirectional LSTM model hybridized with a Boruta-CatBoost input optimizer. Comput. Electron. Agric. 2022, 198, 107121. [Google Scholar] [CrossRef]
  59. Alizamir, M.; Kisi, O.; Muhammad Adnan, R.; Kuriqi, A. Modelling reference evapotranspiration by combining neuro-fuzzy and evolutionary strategies. Acta Geophys. 2020, 68, 1113–1126. [Google Scholar] [CrossRef]
  60. Almubaidin, M.A.A.; Ahmed, A.N.; Sidek, L.B.M.; Elshafie, A. Using Metaheuristics Algorithms (MHAs) to Optimize Water Supply Operation in Reservoirs: A Review. Arch. Comput. Methods Eng. 2022, 29, 3677–3711. [Google Scholar] [CrossRef]
  61. Ridha, H.M.; Hizam, H.; Mirjalili, S.; Othman, M.L.; Ya’acob, M.E.; Abualigah, L. A Novel Theoretical and Practical Methodology for Extracting the Parameters of the Single and Double Diode Photovoltaic Models. IEEE Access 2022, 10, 11110–11137. [Google Scholar] [CrossRef]
Figure 1. Location map of the study area (Wasit Province).
Sustainability 15 14320 g001
Figure 2. A process flow depicting the actions needed to forecast ETo.
Sustainability 15 14320 g002
Figure 3. The hybrid-based (PSOGWO) algorithm flowchart.
Sustainability 15 14320 g003
Figure 4. Normalised data and the first three components, generated using the SSA method.
Sustainability 15 14320 g004
Figure 5. Performance of the PSOGWO algorithm.
Sustainability 15 14320 g005
Figure 6. Fitness function of all algorithms under five PopSizes.
Sustainability 15 14320 g006
Figure 7. Coefficients of determination of the calculated and simulated (by PSOGWO–ANN, CPSOCGSA–ANN, MPA–ANN, and SMA–ANN models) ETo.
Sustainability 15 14320 g007aSustainability 15 14320 g007b
Figure 8. Calculated and simulated ETo data comparison for suggested models for validation data stage.
Sustainability 15 14320 g008
Figure 9. Violin plot of observed and predicted monthly ETo in the validation period of all models.
Sustainability 15 14320 g009
Table 1. Statistics of collinearity with the suggested predictors.
Climatic FactorsTolerance
P0.271
Tmin0.185
WSmax0.246
Table 2. Correlation coefficients between the best model input and monthly ETo.
DatapTminWSmax
Raw−0.610 **0.946 **0.898 **
Preprocessed−0.853 **0.956 **0.942 **
** Correlation is significant at the 0.01 level (2-tailed).
Table 3. Hyperparameters of the ANN model, dependent on four metaheuristic techniques.
HyperparameterPSOGWO–ANNCPSOCGSA–ANNSMA–ANNMPA–ANN
N1 2 2 1 2
N2 12 17 8 20
LR0.78580.21910.78460.9780
N1 and N2 refer to the number of nodes in the first and second hidden layers, respectively, and Lr stands for learning rate.
Table 4. The performance of suggested hybrid models for validation data stage.
ModelRMSEMAENSENMSER2
PSOGWO–ANN0.07810.14460.97630.97490.9772
CPSOCGSA–ANN0.07870.15600.97600.97460.9767
SMA–ANN0.08440.15070.97240.97300.9743
MPA–ANN0.07990.17110.97530.96960.9765
Disclaimer/Publisher’s Note: The statements, opinions and data contained in all publications are solely those of the individual author(s) and contributor(s) and not of MDPI and/or the editor(s). MDPI and/or the editor(s) disclaim responsibility for any injury to people or property resulting from any ideas, methods, instructions or products referred to in the content.

