
Decoding Urban Archetypes: Exploring Mobility-Related Homogeneity among Cities

 , , and
Abstract
:1. Introduction
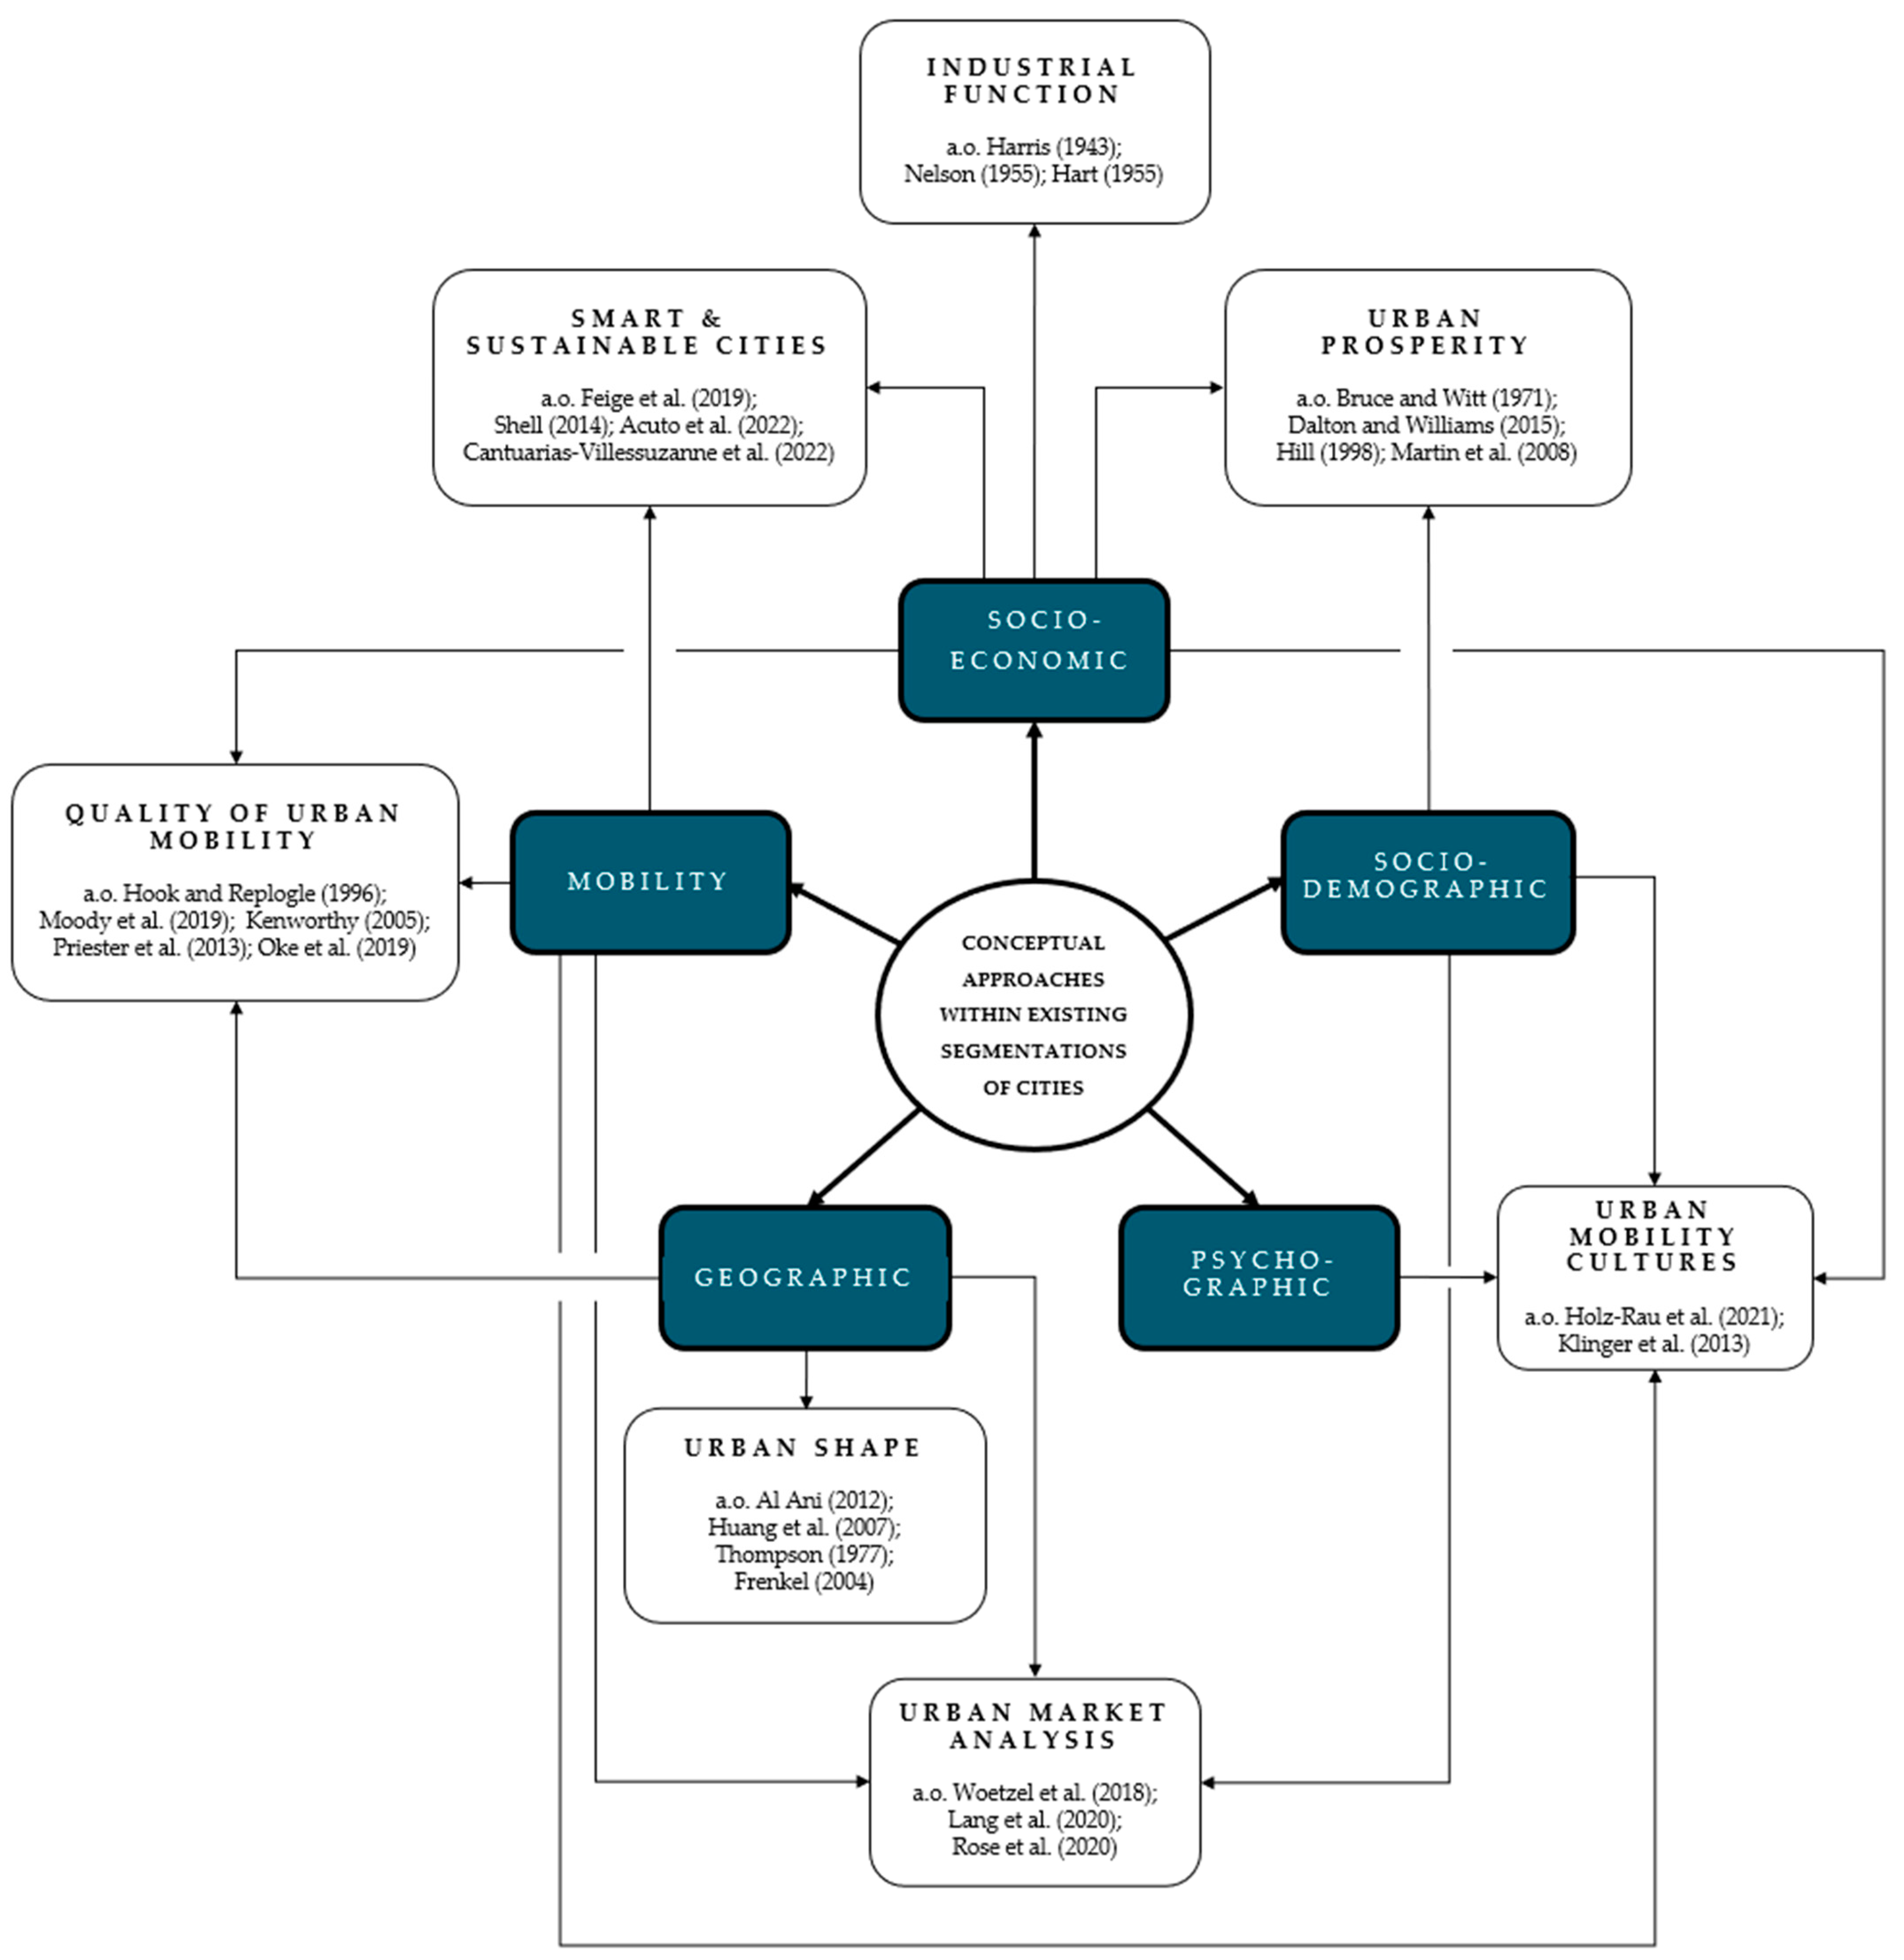
2. Literature Review
3. Data Collection
4. Methodology
4.1. Principal Component Analysis
4.2. Clustering
5. Results
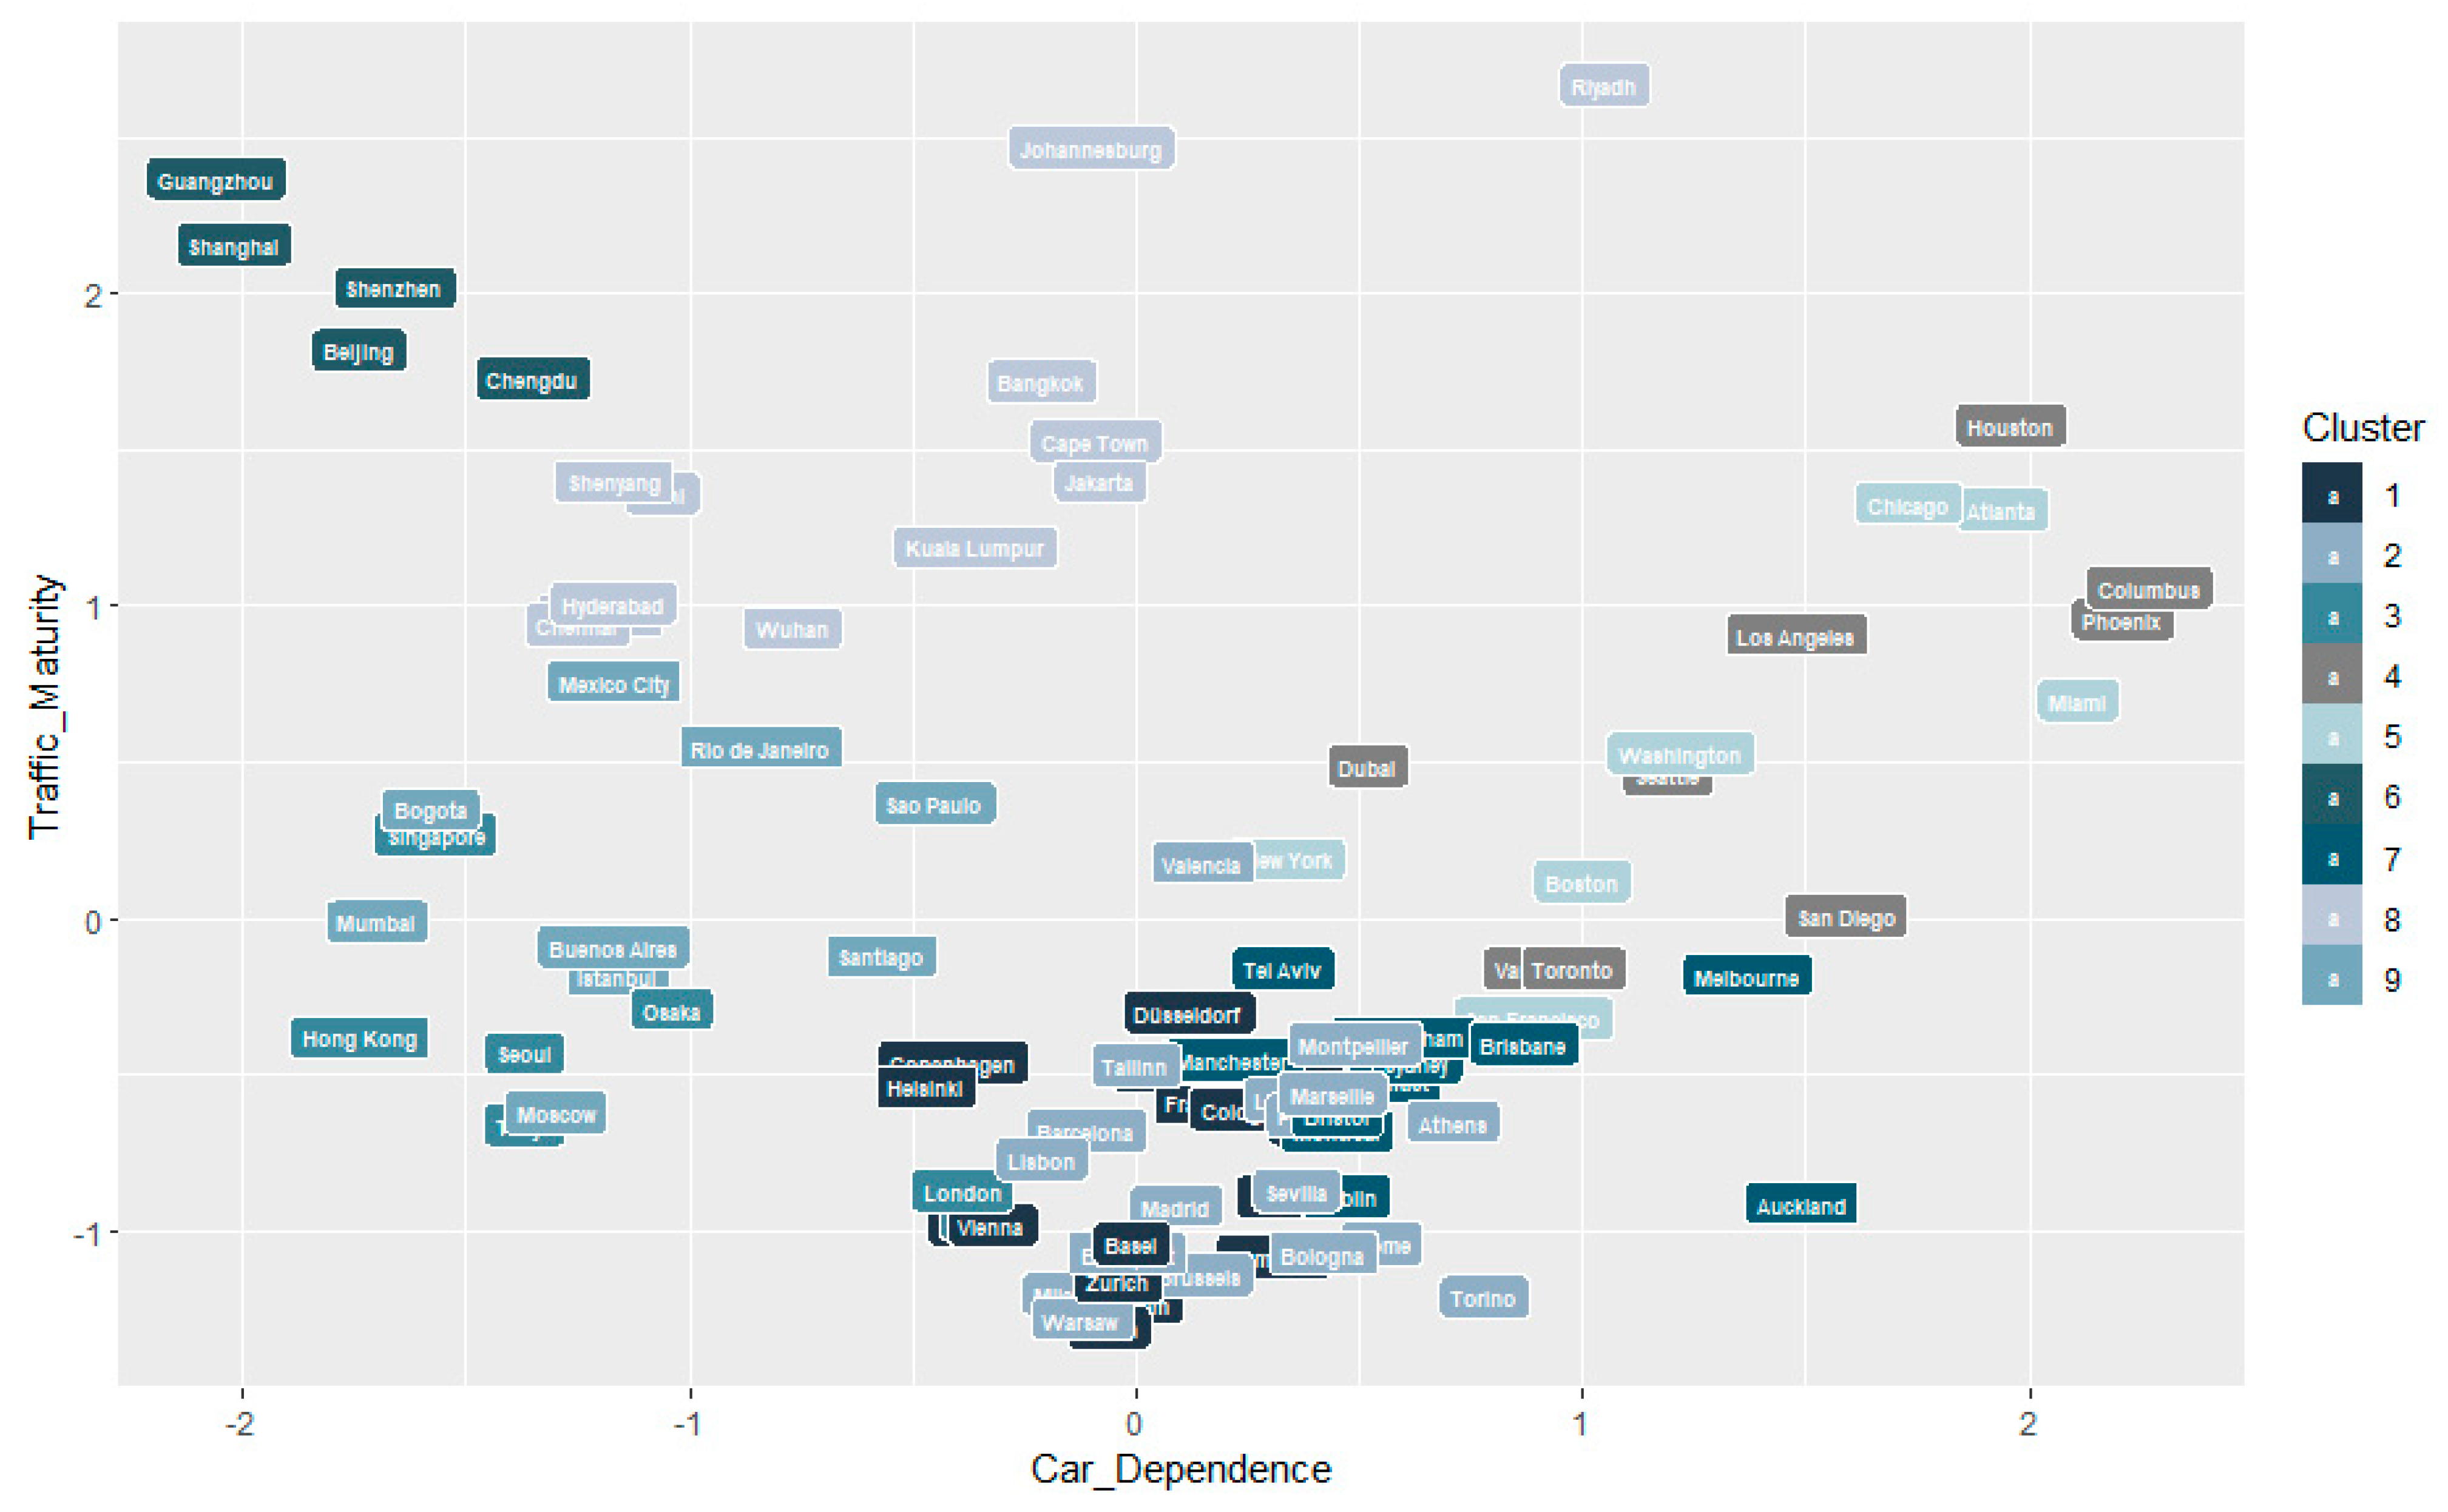
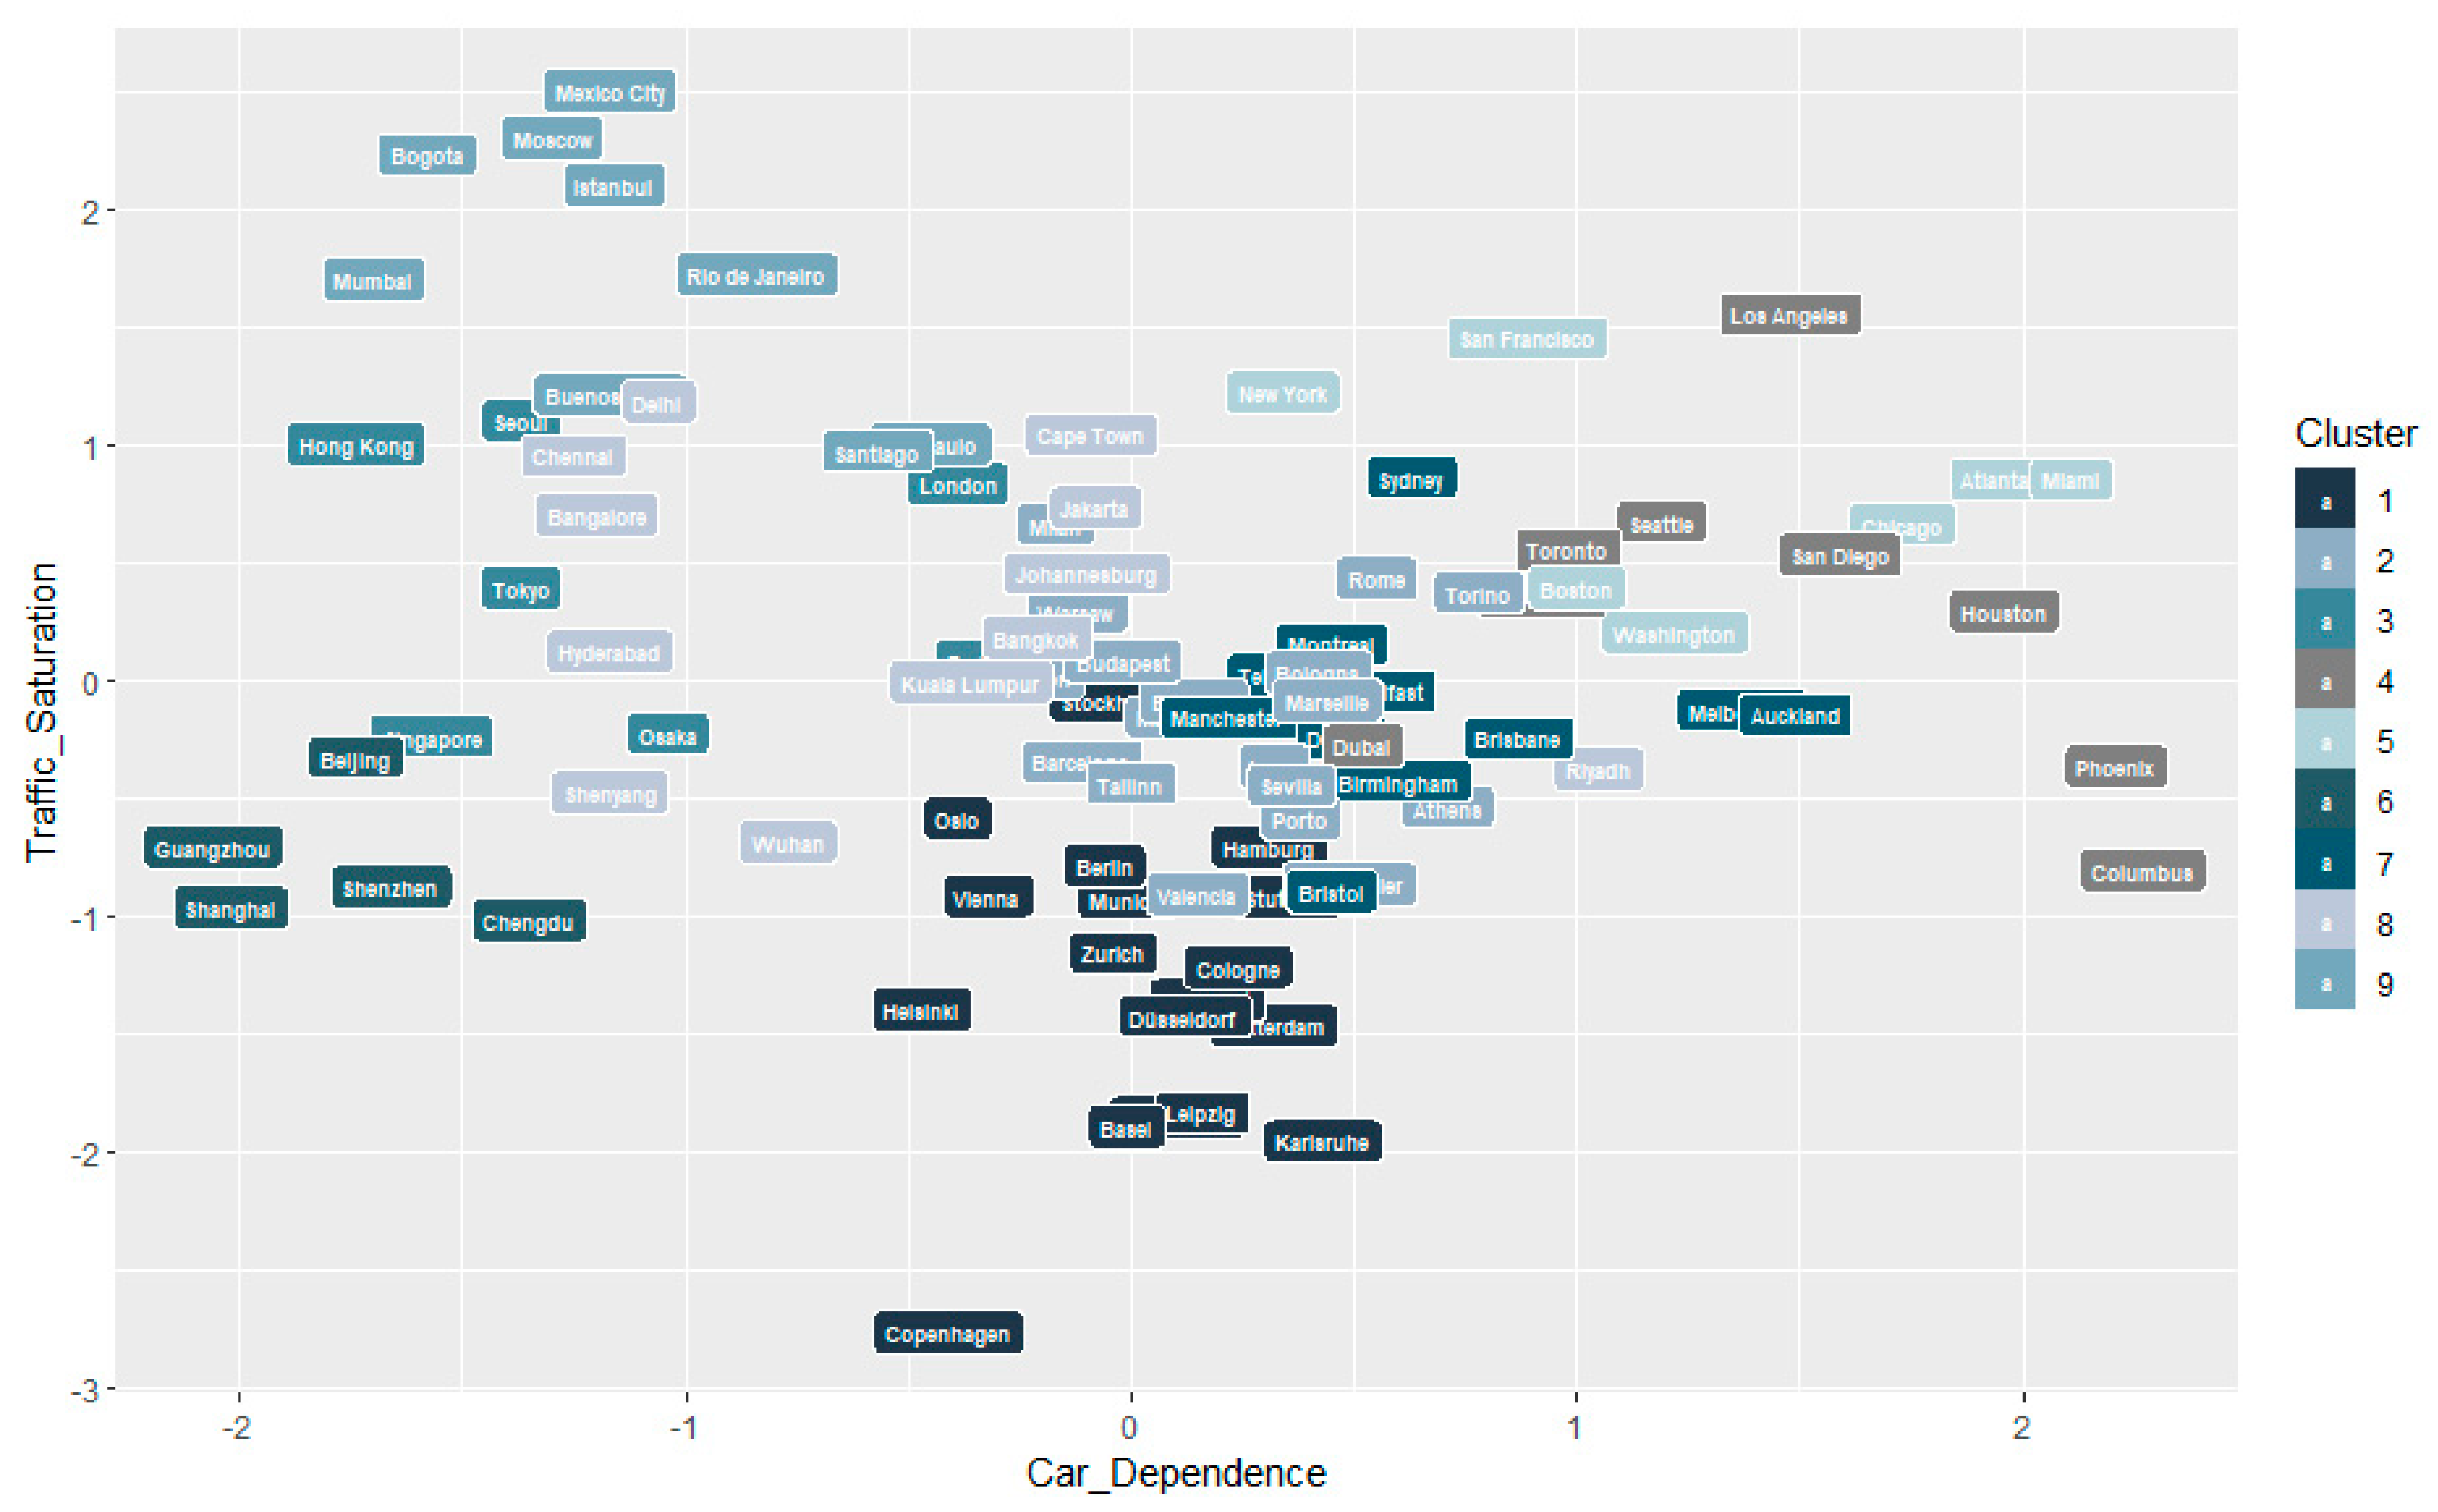
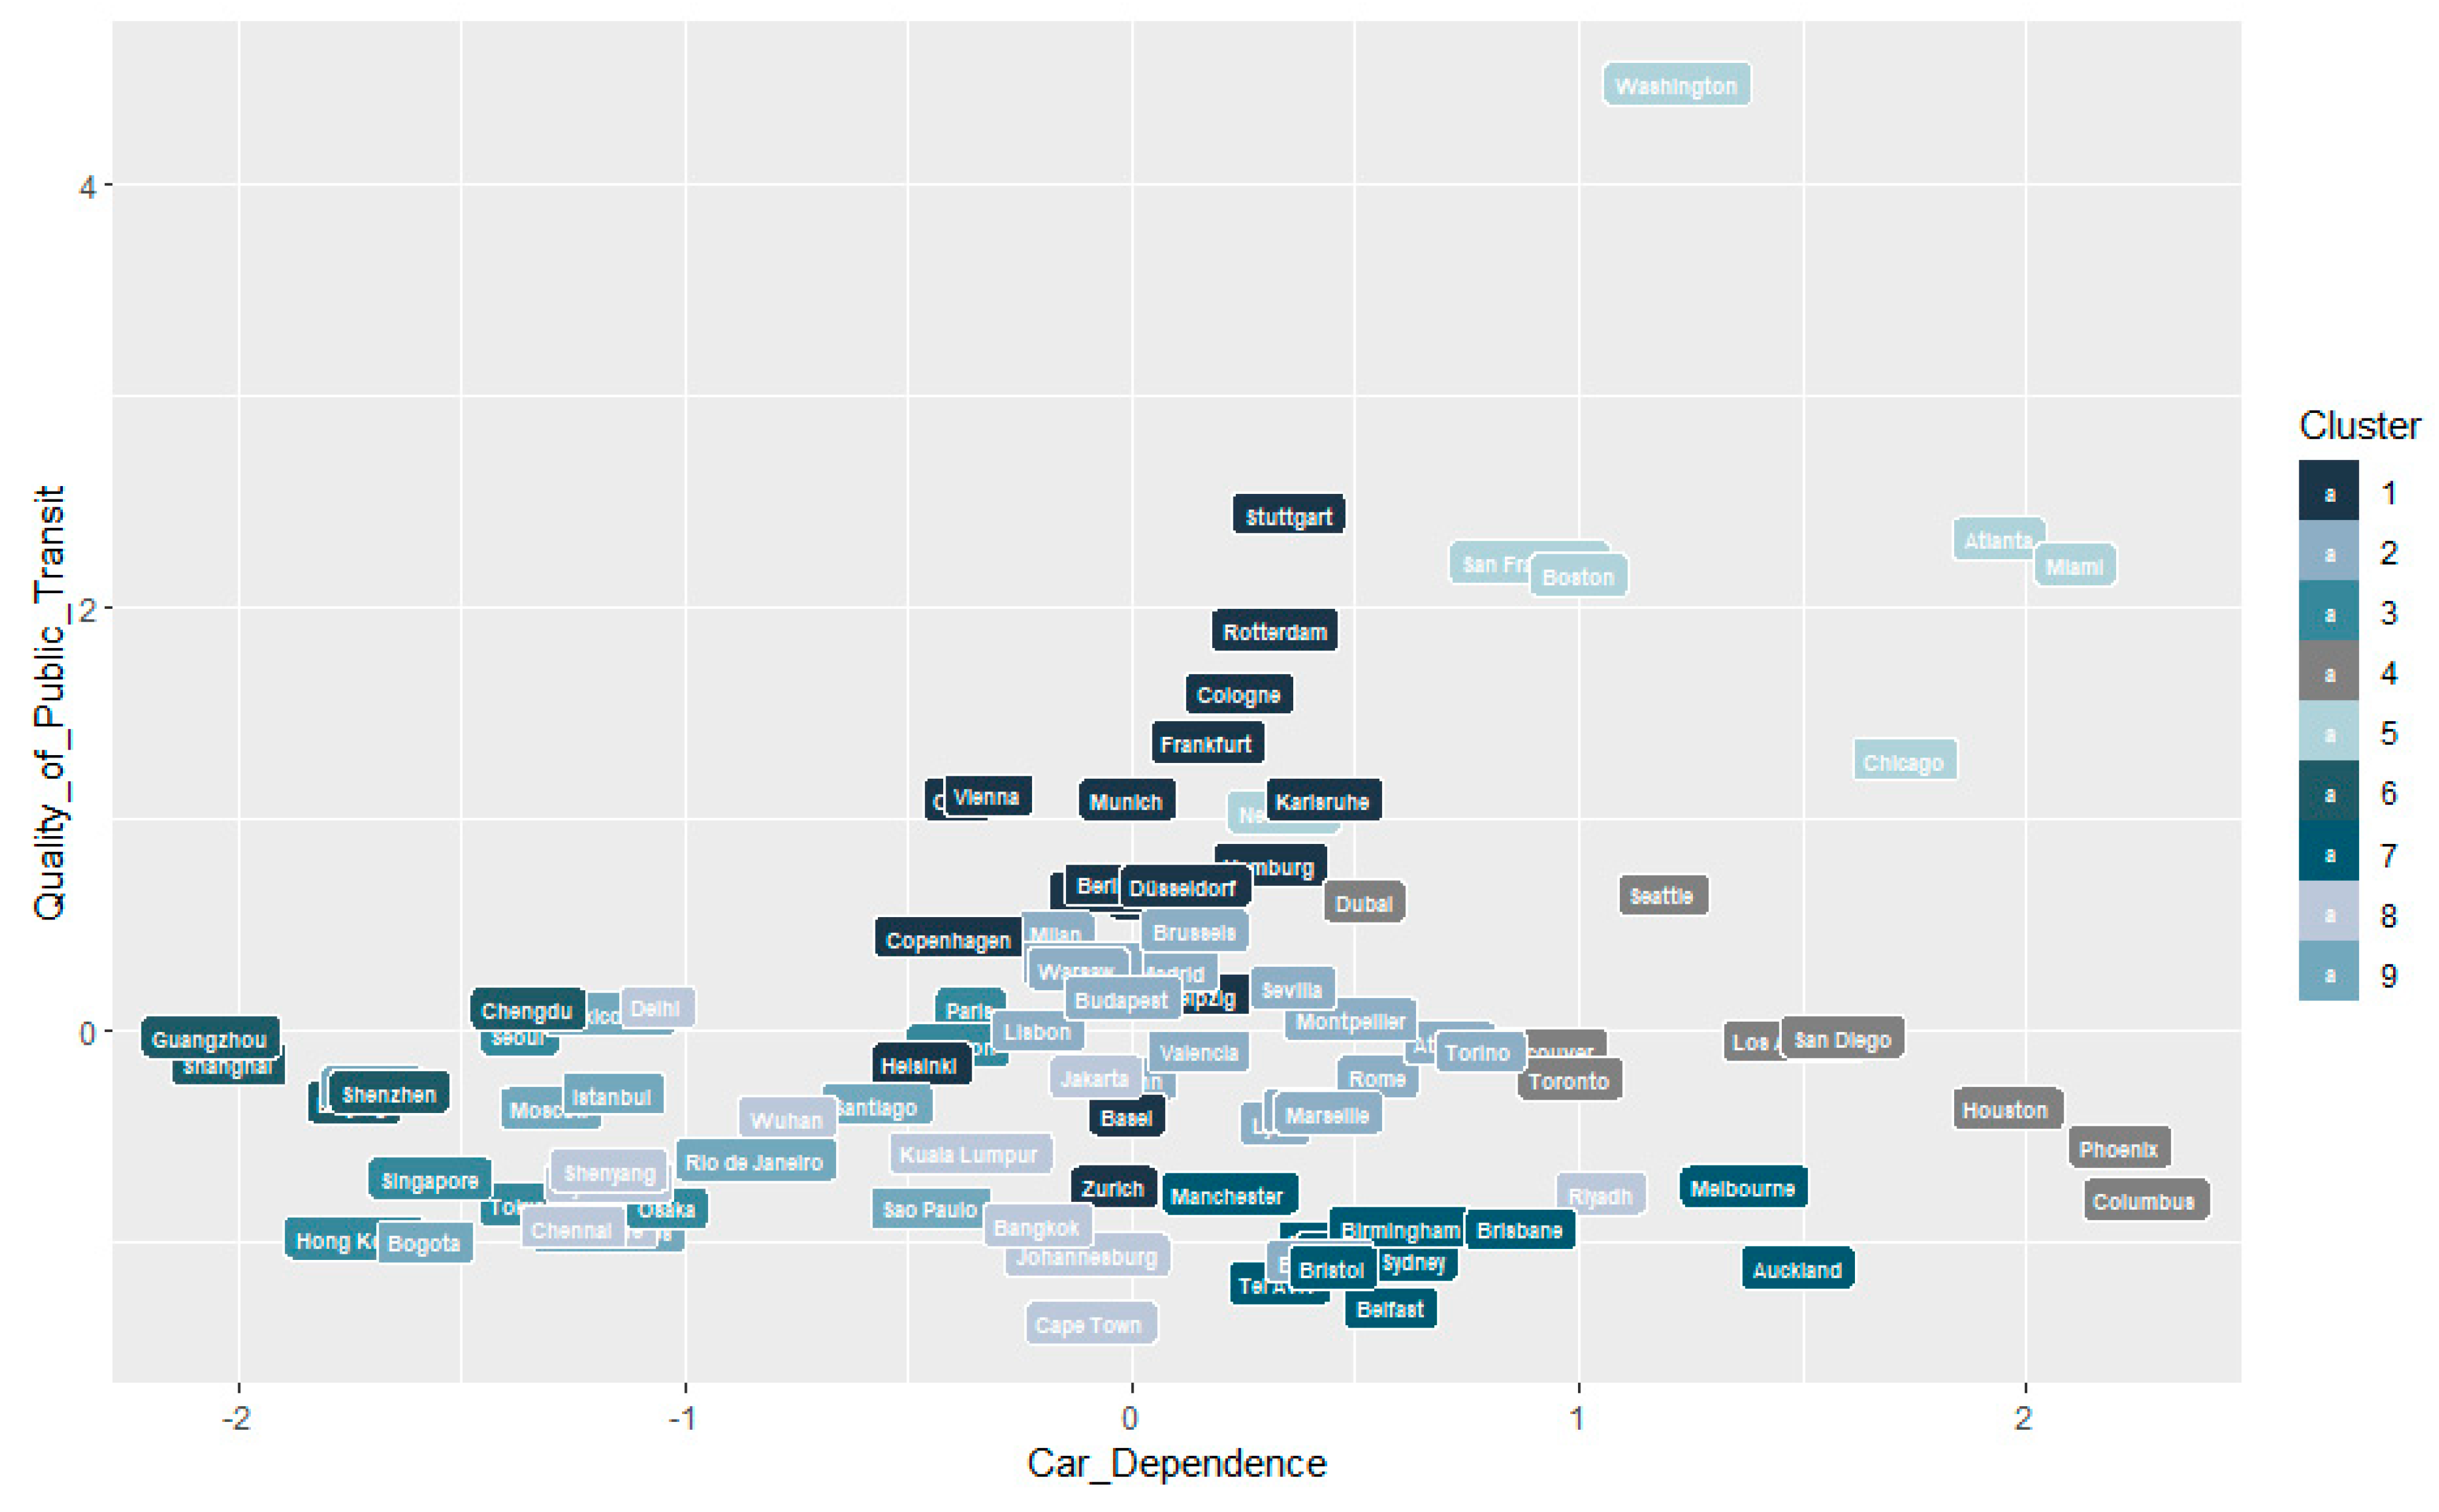
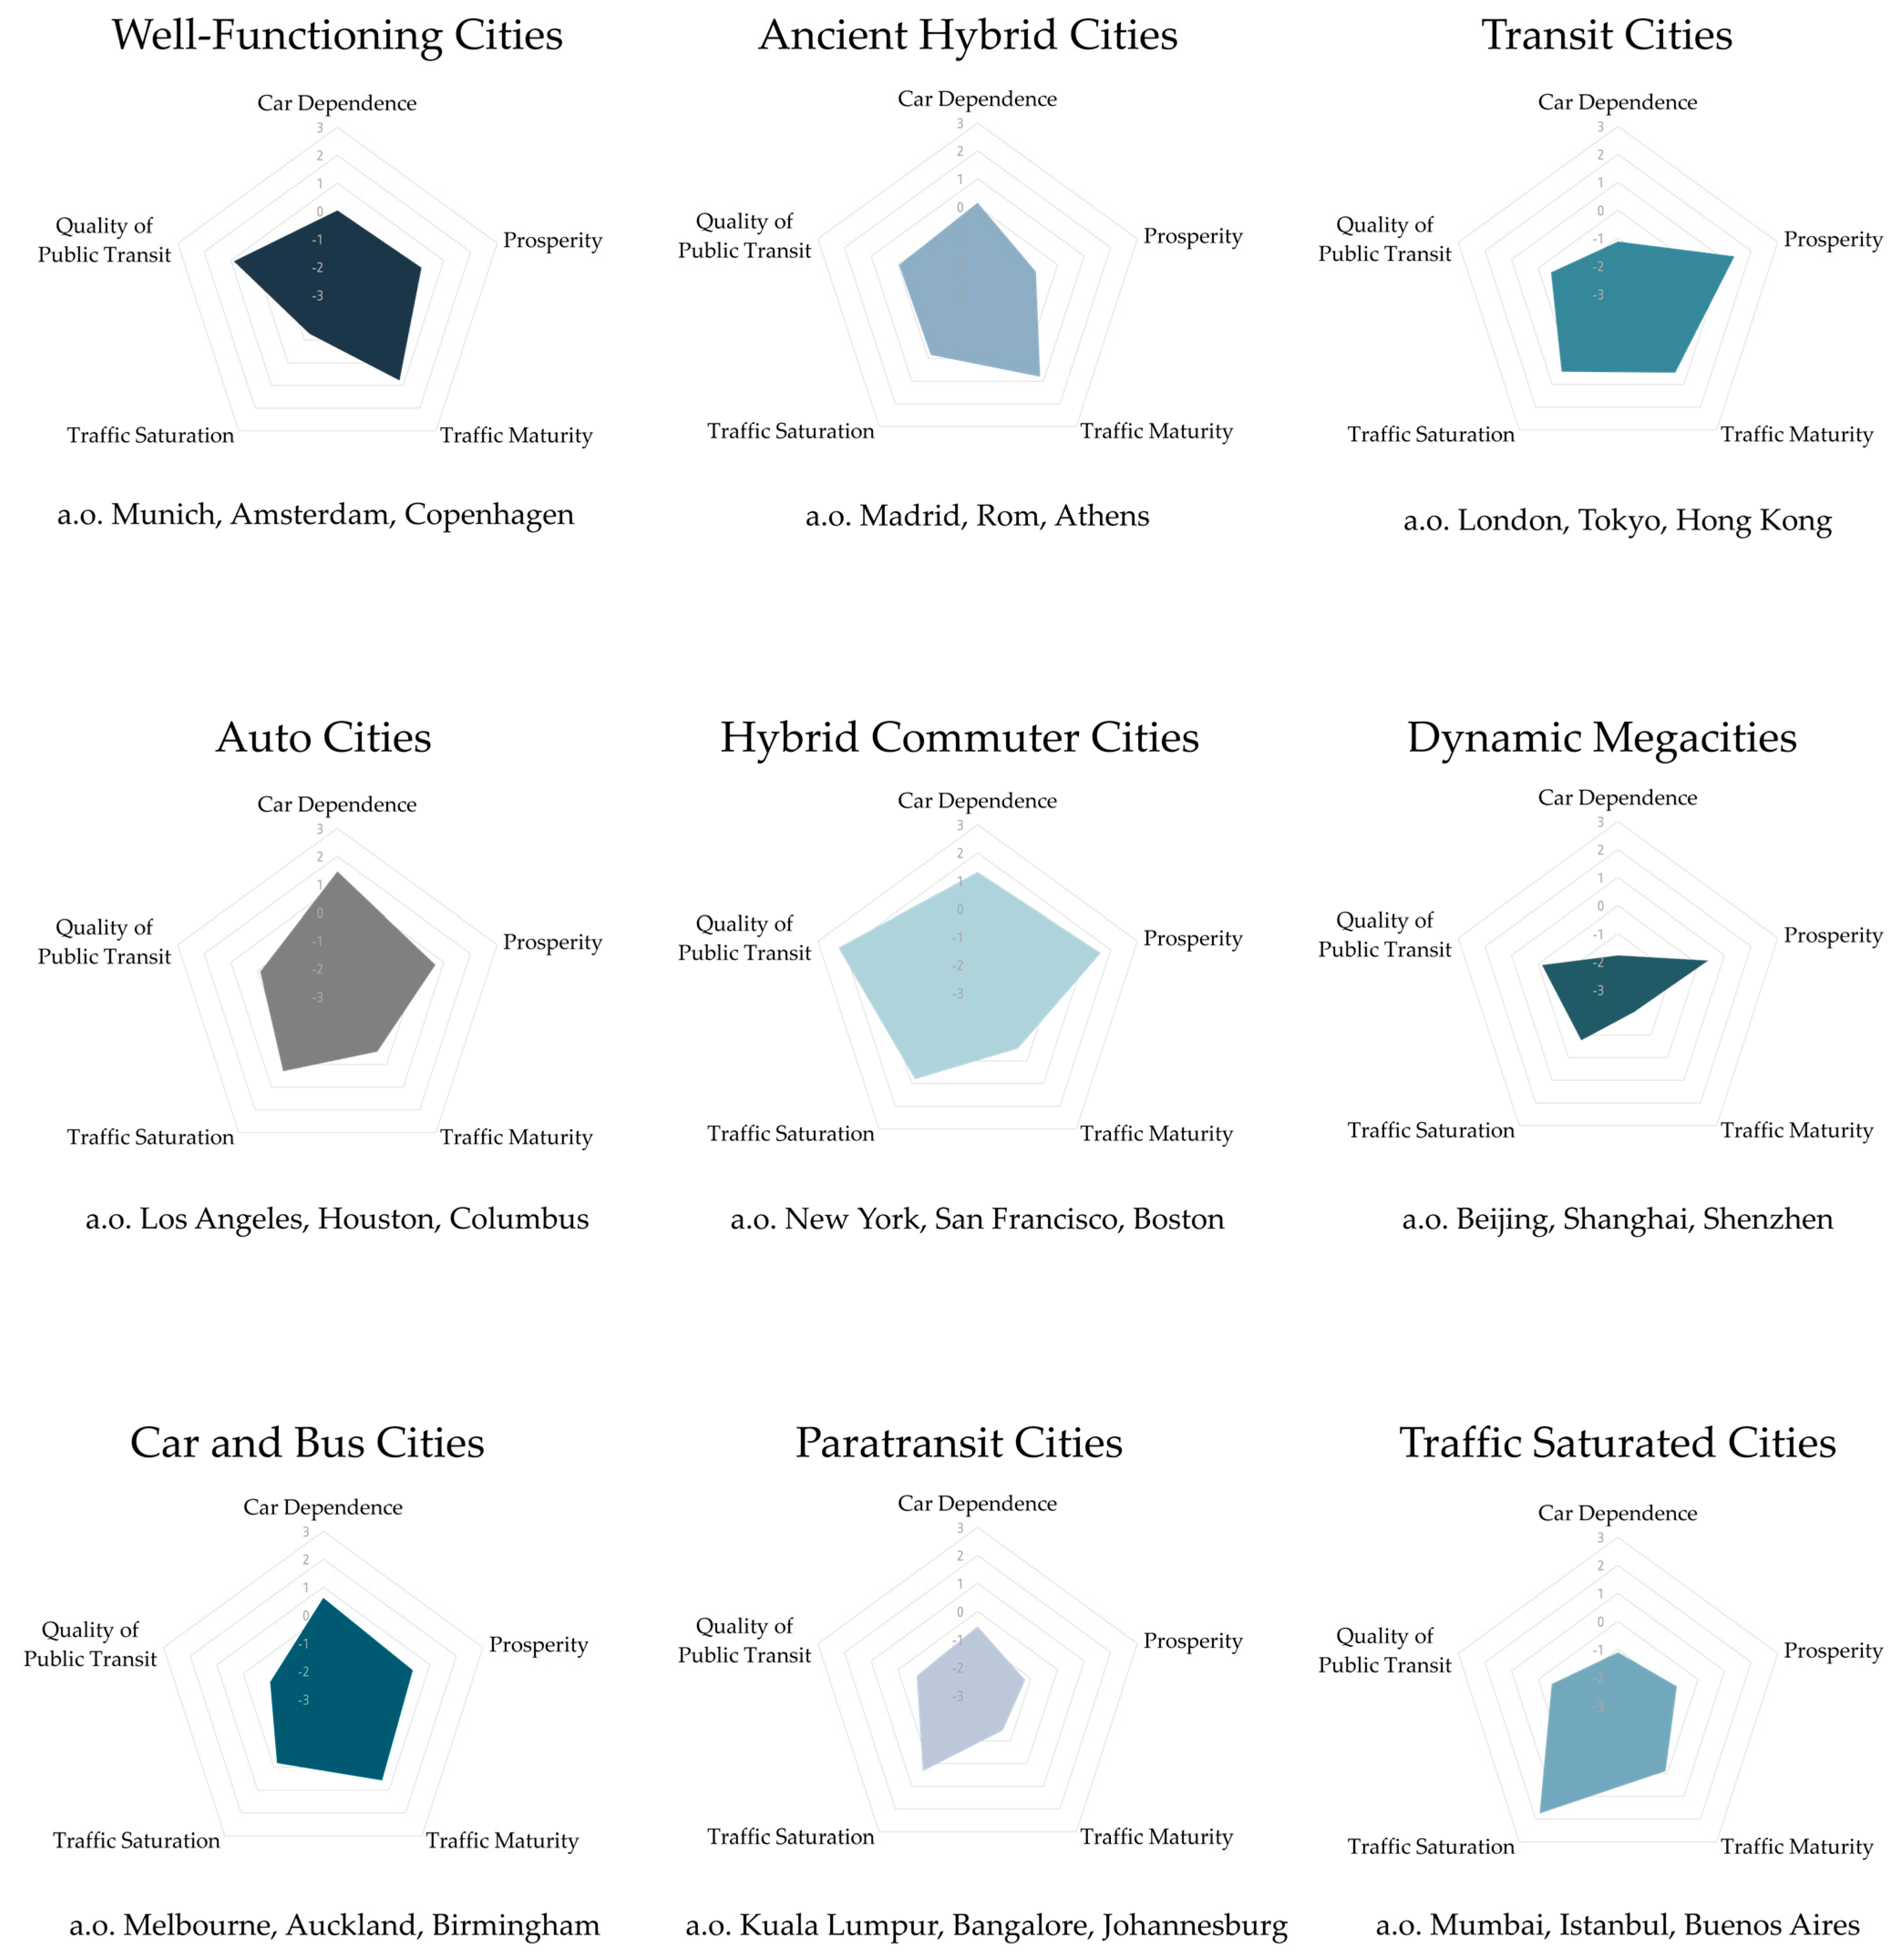
5.1. Cluster Description
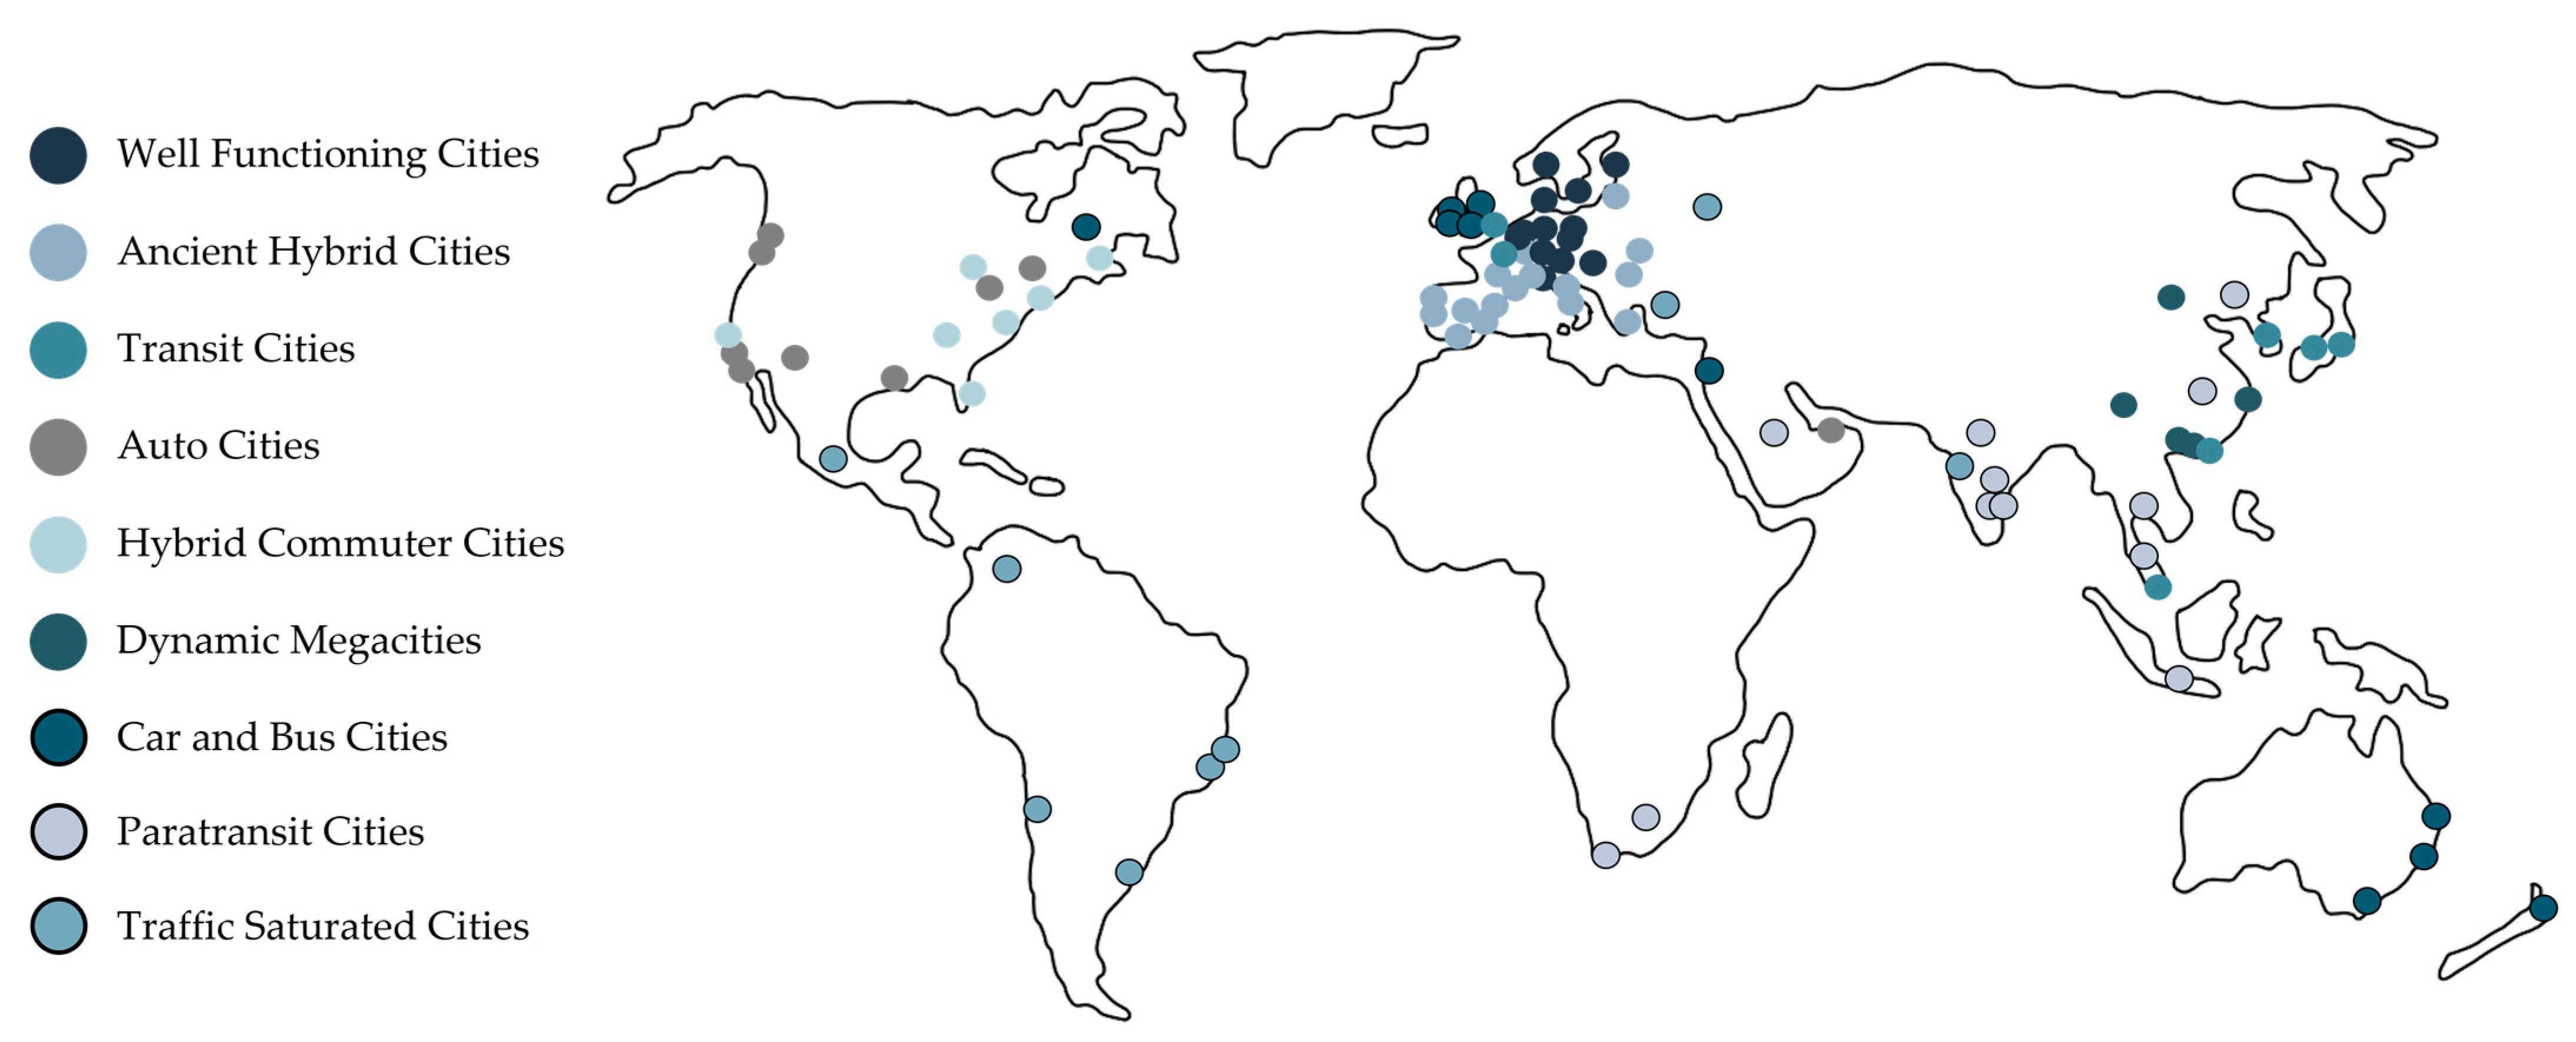
5.2. Geographical Location
5.3. Cluster Validation
6. Discussion
6.1. Future Trajectories of Urban Archetypes
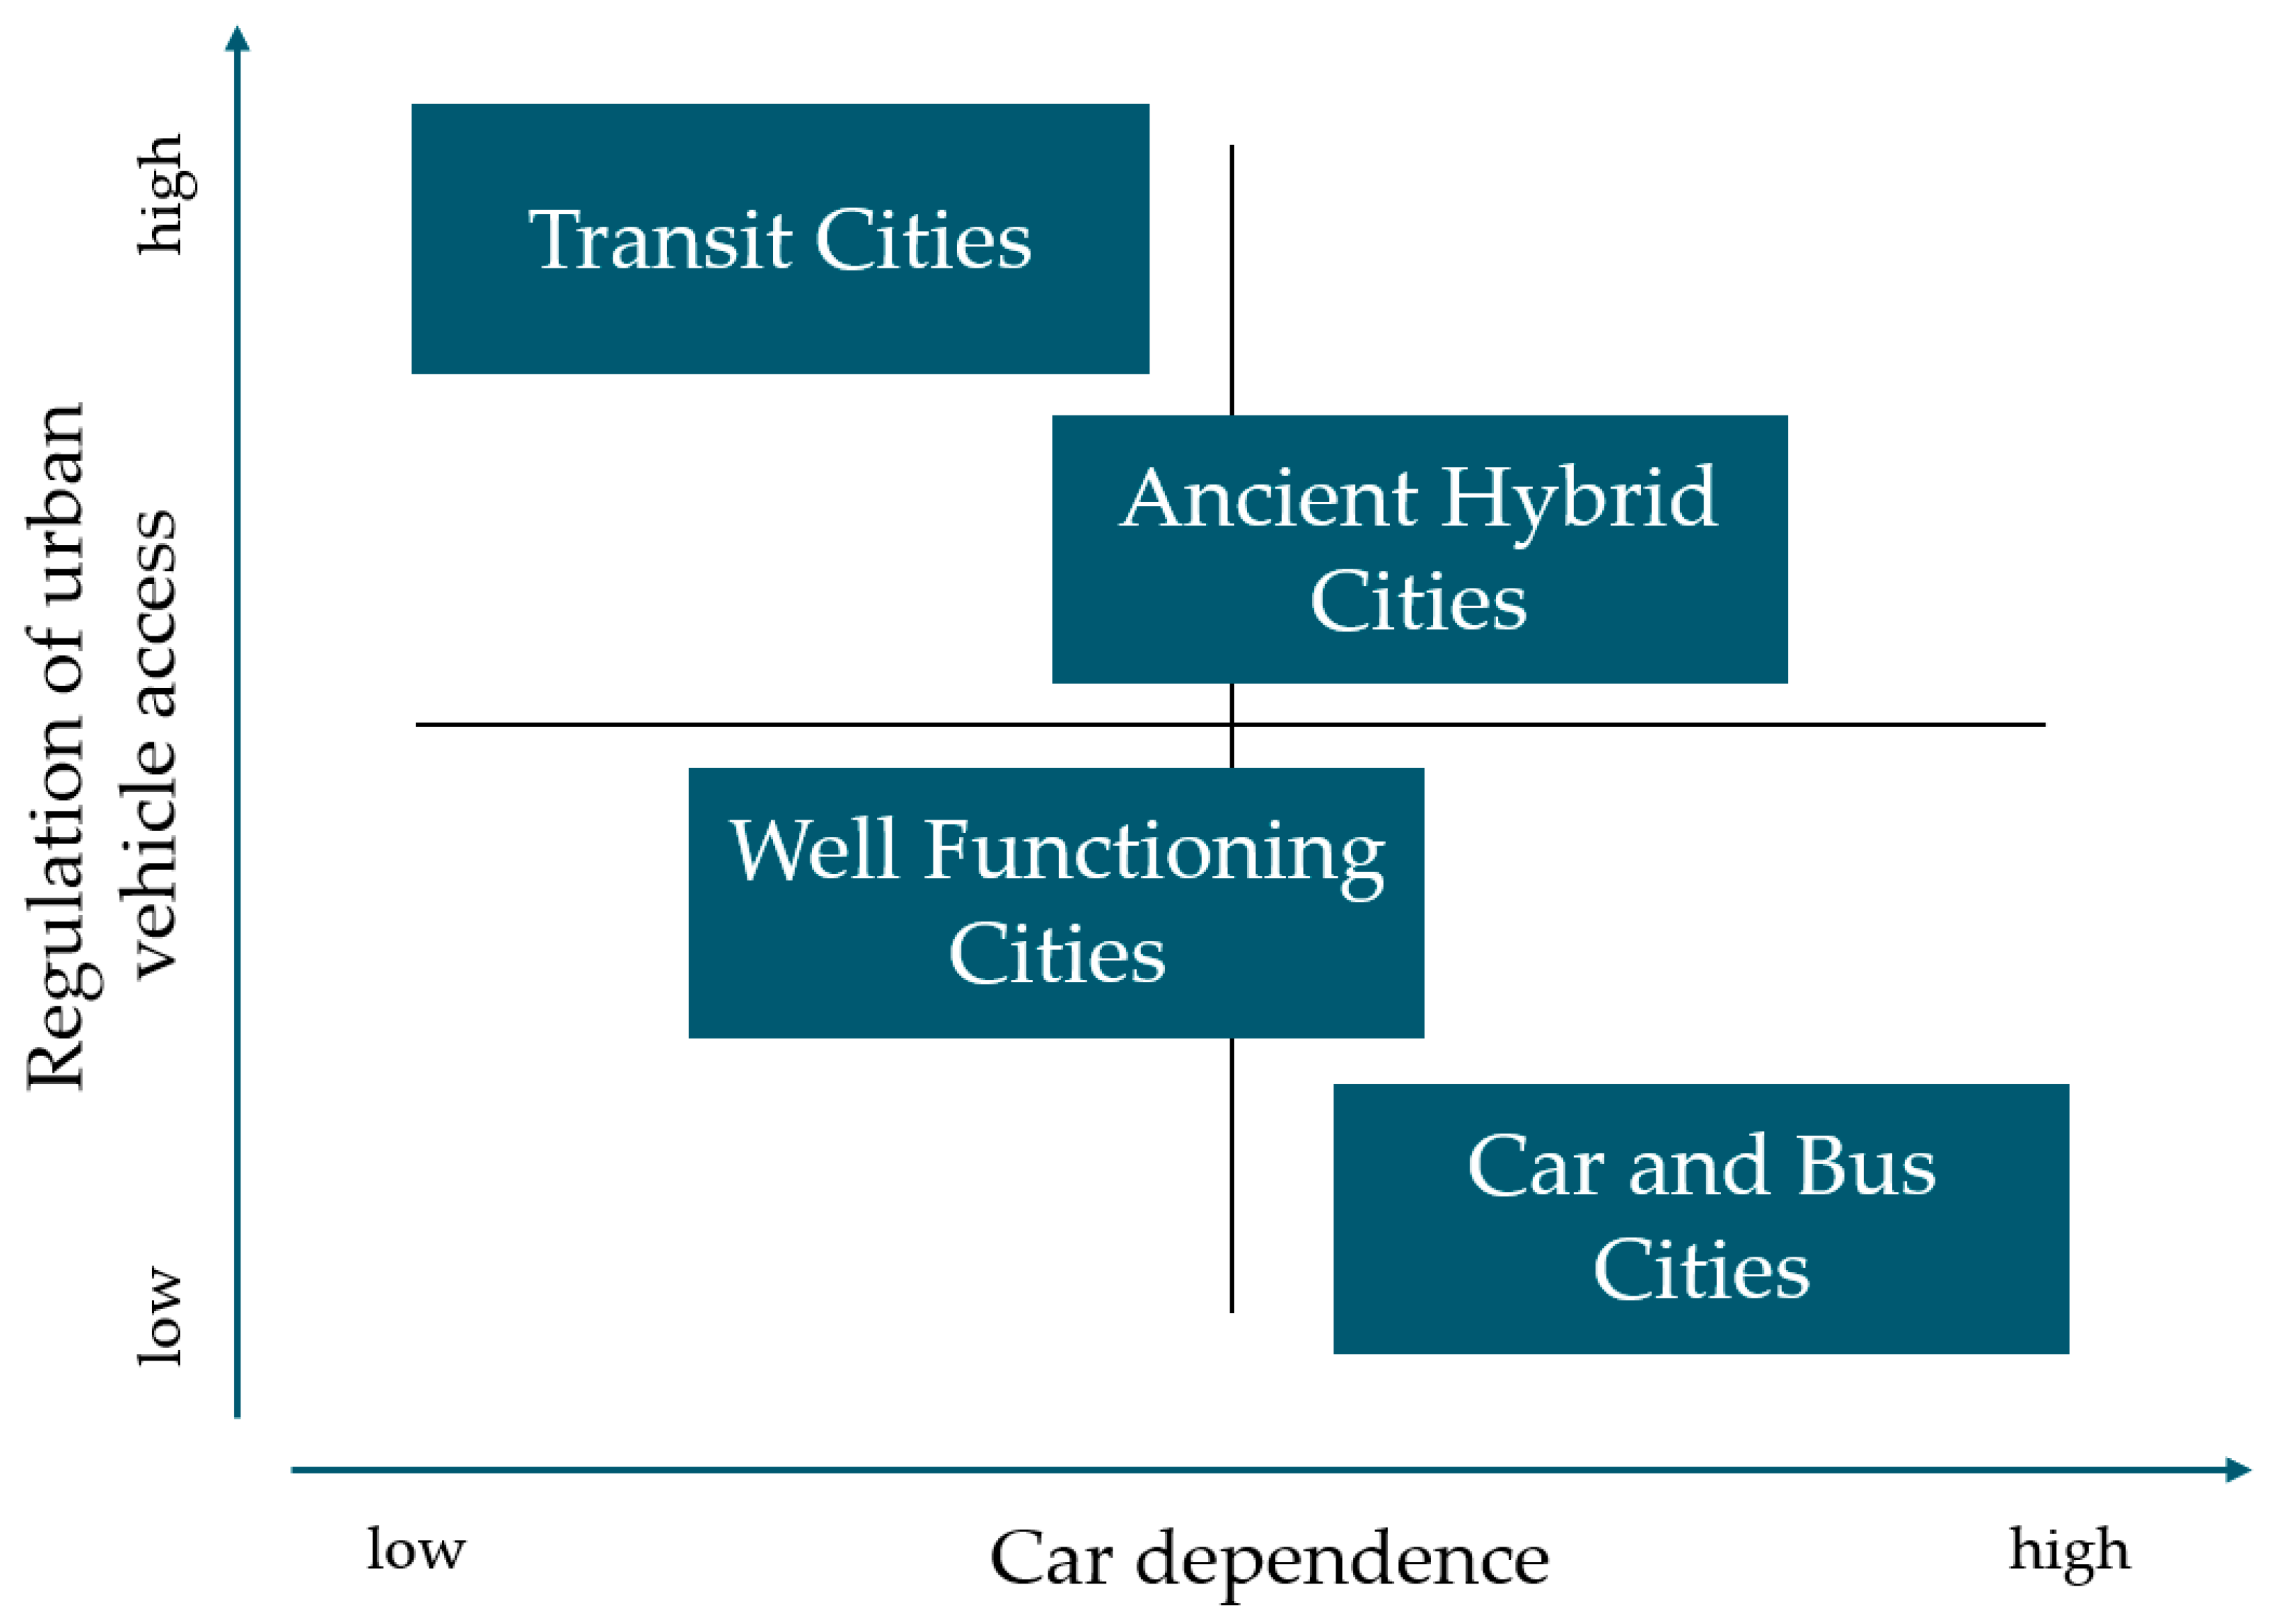
6.2. In-Depth Analysis of European Cities
7. Limitation of the Approach
8. Conclusions
Author Contributions
Funding
Institutional Review Board Statement
Informed Consent Statement
Data Availability Statement
Acknowledgments
Conflicts of Interest
Appendix A

| Well-Functioning Cities | Ancient Hybrid Cities | Transit Cities | Auto Cities | Hybrid Commuter Cities |
|---|---|---|---|---|
| Amsterdam | Athens | Hong Kong | Columbus | Atlanta |
| Basel | Barcelona | London | Dubai | Boston |
| Berlin | Bologna | Osaka | Houston | Chicago |
| Cologne | Brussels | Paris | Los Angeles | Miami |
| Copenhagen | Budapest | Seoul | Phoenix | New York |
| Düsseldorf | Lisbon | Singapore | San Diego | San Francisco |
| Frankfurt | Lyon | Tokyo | Seattle | Washington |
| Hamburg | Madrid | Toronto | ||
| Helsinki | Marseille | Vancouver | ||
| Karlsruhe | Milan | |||
| Leipzig | Montpellier | |||
| Munich | Porto | |||
| Oslo | Rome | |||
| Rotterdam | Sevilla | |||
| Stockholm | Tallinn | |||
| Stuttgart | Torino | |||
| Vienna | Valencia | |||
| Zurich | Warsaw | |||
| Dynamic Megacities | Car and Bus Cities | Paratransit Cities | Traffic-Saturated Cities | |
| Beijing | Auckland | Bangalore | Bogota | |
| Chengdu | Belfast | Bangkok | Buenos Aires | |
| Guangzhou | Birmingham | Cape Town | Istanbul | |
| Shanghai | Brisbane | Chennai | Mexico City | |
| Shenzhen | Bristol | Delhi | Moscow | |
| Dublin | Hyderabad | Mumbai | ||
| Manchester | Jakarta | Rio de Janeiro | ||
| Melbourne | Johannesburg | Santiago | ||
| Montreal | Kuala Lumpur | Sao Paulo | ||
| Sydney | Riyadh | |||
| Tel Aviv | Shenyang | |||
| Wuhan | ||||
Appendix B

Appendix C
| Overview of the Regulation of European Urban Archetypes for Vehicles < 3.5 t * | Road Pricing | Environmental Zones | Zero-Emissions Zones | Restricted Entry Zones | Emergency Measures | |
|---|---|---|---|---|---|---|
| Well-Functioning Cities | Amsterdam | x | (2025) | x | ||
| Basel | x | |||||
| Berlin | x | |||||
| Cologne | x | |||||
| Copenhagen | x | x | ||||
| Düsseldorf | x | |||||
| Frankfurt | x | |||||
| Hamburg | x | |||||
| Helsinki | ||||||
| Karlsruhe | x | |||||
| Leipzig | x | |||||
| Munich | x | |||||
| Oslo | x | x | x | x | ||
| Rotterdam | x | |||||
| Stockholm | x | x | x | |||
| Stuttgart | x | |||||
| Vienna | x | x | x | |||
| Zurich | ||||||
| Transit Cities | London | x | x | x | ||
| Paris | x | (2030) | x | x | ||
| Ancient Hybrid Cities | Athens | x | ||||
| Barcelona | x | x | x | |||
| Bologna | x | x | x | |||
| Brussels | x | x | x | x | ||
| Budapest | x | x | ||||
| Lisbon | x | x | ||||
| Lyon | x | x | ||||
| Madrid | x | x | x | |||
| Marseille | x | x | ||||
| Milan | x | x | x | x | ||
| Montpellier | x | |||||
| Porto | x | |||||
| Rome | x | x | x | |||
| Sevilla | x | x | x | |||
| Tallinn | ||||||
| Torino | x | x | x | |||
| Valencia | x | x | ||||
| Warsaw | ||||||
| Car and Bus Cities | Birmingham | x | ||||
| Bristol | x | |||||
| Dublin | x | |||||
| Belfast | ||||||
| Manchester | x | |||||
References
- United Nations. World Urbanization Prospects: The 2018 Revision; United Nations: New York, NY, USA, 2019; ISBN 978-92-1-148319-2. [Google Scholar]
- OECD Publishing. International Transport Forum ITF Transport Outlook 2021; OECD Publishing: Paris, France, 2021. [Google Scholar] [CrossRef]
- Harris, C. A Functional Classification of Cities in the United States. Geogr. Rev. 1943, 33, 86–99. [Google Scholar] [CrossRef]
- Nelson, H. A Service Classification of American Cities. Econ. Geogr. 1955, 31, 189–210. [Google Scholar] [CrossRef]
- Hart, J.F. Functions and Occupational Structures of Cities of the American South. Ann. Assoc. Am. Geogr. 1955, 45, 269–286. [Google Scholar] [CrossRef]
- Bruce, G.D.; Witt, R.E. Developing Empirically Derived City Typologies: An Application of Cluster Analysis. Sociol. Q. 1971, 12, 238–246. [Google Scholar] [CrossRef]
- Dalton, P.; Williams, S. Grouping Minnesota Cities: Using Cluster Analysis; Minnesota House Research Department: St. Paul, MN, USA, 2015; p. 58. Available online: https://www.house.mn.gov/hrd/pubs/groupmncity.pdf (accessed on 29 June 2023).
- Hill, E.; Brennan, J.; Wolman, H. What Is a Central City in the United States? Applying a Statistical Technique for Developing Taxonomies. Urban Stud. 1998, 35, 1935–1969. [Google Scholar] [CrossRef]
- Martin, M.; Carley, K.M.; Altman, N. 300 Cities—An Exploration in Characterizing US Cities 2008. Available online: https://papers.ssrn.com/sol3/papers.cfm?abstract_id=2726827 (accessed on 28 June 2023).
- Al Ani, M. Urban Types and Transformation of the City; Real Corp: Schwechat, Austria, 2012. [Google Scholar]
- Huang, J.; Lu, X.X.; Sellers, J. A Global Comparative Analysis of Urban Form: Applying Spatial Metrics and Remote Sensing. Landsc. Urban Plan. 2007, 82, 184–197. [Google Scholar] [CrossRef]
- Thomson, M. Great Cities and Their Traffic; Penguin: Harmondsworth, UK, 1978; ISBN 0-14-055127-1. [Google Scholar]
- Frenkel, A. Land-Use Patterns in the Classification of Cities: The Israeli Case. Environ. Plan. B Plan. Des. 2004, 31, 711–730. [Google Scholar] [CrossRef]
- Hook, W.; Replogle, M. Motorization and Non-Motorized Transport in Asia: Transport System Evolution in China, Japan and Indonesia. Land Use Policy 1996, 13, 69–84. [Google Scholar] [CrossRef]
- Feige, I.; Mischke, M.; Gropman, L. City Archetypes How Might Specific Needs of Cities Be Best Addressed in Considering Urban Mobility? 2020. Available online: https://population.un.org/wup/publications/Files/WUP2018-Report.pdf (accessed on 29 June 2023).
- Holz-Rau, C.; Heyer, R.; Schultewolter, M.; Aertker, J.; Wachter, I.; Klinger, T. Eine Verkehrstypologie deutscher Großstädte. Raumforschung und Raumordnung. Spat. Res. Plan. 2022, 80, 137–152. [Google Scholar] [CrossRef]
- Moody, J.; Wang, S.; Chun, J.; Ni, X.; Zhao, J. Transportation Policy Profiles of Chinese City Clusters: A Mixed Methods Approach. Transp. Res. Interdiscip. Perspect. 2019, 2, 100053. [Google Scholar] [CrossRef]
- Kenworthy, J.; Laube, F. The Millennium Cities Database for Sustainable Transport. Database 2001. Available online: https://trid.trb.org/view/708144 (accessed on 8 August 2023).
- Kenworthy, J. Sustainable Urban Transport: Developing Sustainability Rankings and Clusters Based on an International Comparison of Cities. In Handbook of Sustainability Research; Peter Lang Publishing: New York, NY, USA, 2005; ISBN 978-0-8204-7308-6. [Google Scholar]
- Karathodorou, N.; Graham, D.; Noland, R. Estimating the Effect of Urban Density on Fuel Demand. Energy Econ. 2010, 32, 86–92. [Google Scholar] [CrossRef]
- Joly, I.; Masson, S.; Petiot, R. The Determinants of Urban Public Transport: An International Comparison and Econometric Analysis; AET: London, UK, 2004; p. 25. [Google Scholar] [CrossRef]
- Priester, R.; Kenworthy, J.; Wulfhorst, G. The Diversity of Megacities Worldwide: Challenges for the Future of Mobility. In Megacity Mobility Culture: How Cities Move on in a Diverse World; Lecture Notes in Mobility; Springer: Berlin, Germany, 2013; pp. 23–54. ISBN 978-3-642-34735-1. [Google Scholar]
- Oke, J.; Aboutaleb, Y.; Akkinepally, A.; Azevedo, C.L.; Han, Y.; Zegras, C.; Ferreira, J.; Ben-Akiva, M. A Novel Global Urban Typology Framework for Sustainable Mobility Futures. Environ. Res. Lett. 2019, 14, 095006. [Google Scholar] [CrossRef]
- Klinger, T.; Kenworthy, J.; Lanzendorf, M. Dimensions of Urban Mobility Cultures—A Comparison of German Cities. J. Transp. Geogr. 2013, 31, 18–29. [Google Scholar] [CrossRef]
- Shell New Lenses on Future Cities: A New Lens Scenarios Supplement 2014. Available online: https://www.shell.com/energy-and-innovation/the-energy-future/scenarios/what-are-the-previous-shell-scenarios/new-lenses-on-future-cities/_jcr_content/root/main/section/text_407441365.multi.stream/1655892182865/4af0dbaee78537131e05449aaf5f63b3b953b52c/newlensesonfuturecities-june-2014.pdf (accessed on 28 June 2023).
- Acuto, M.; Davidson, K.; Mokhles, S. Reimagining Climate Networking between Cities: Clustering Cities Based on a Large Dataset of Mitigation Actions 2022. Available online: https://www.researchsquare.com/article/rs-1806235/v1 (accessed on 29 June 2023).
- Cantuarias-Villessuzanne, C.; Weigel, R.; Blain, J. Clustering of European Smart Cities to Understand the Cities’ Sustainability Strategies. Sustainability 2021, 13, 513. [Google Scholar] [CrossRef]
- Ismagilova, E.; Hughes, L.; Dwivedi, Y.; Raman, R. Smart Cities: Advances in Research—An Information Systems Perspective. Int. J. Inf. Manag. 2019, 47, 88–100. [Google Scholar] [CrossRef]
- Woetzel, J.; Lin, D.-Y.; Sridhar, M.; Yap, S.-E. Smart Cities in Southeast Asia; McKinsey Global Institute Discussion Paper; McKinsey & Company: New York, NY, USA, 2018; p. 44. Available online: https://www.mckinsey.com/capabilities/operations/our-insights/smart-cities-in-southeast-asia (accessed on 29 June 2023).
- Lang, N.; Herrmann, A.; Hagenmaier, M.; Richter, M.A. Can Self-Driving Cars Stop the Urban Mobility Meltdown? Boston Consulting Group: Boston, MA, USA, 2020. [Google Scholar]
- Rose, J.; Schellong, D.; Schaetzberger, C.; Hill, J. How E-Scooters Can Win a Place in Urban Transport; Boston Consulting Group: Boston, MA, USA, 2020; p. 10. Available online: https://web-assets.bcg.com/img-src/BCG-How-E-Scooters-Can-Win-a-Place-in-Urban-Transport-Jan-2020-rev_tcm9-237992.pdf (accessed on 29 June 2023).
- Shi, Z.; Silvennoinen, H.; Chadzynski, A.; Von Richthofen, A.; Kraft, M.; Cairns, S.; Herthogs, P. Defining Archetypes of Mixed-Use Developments Using Google Maps API Data. Environ. Plan. B Urban Anal. City Sci. 2022, 50, 1607–1623. [Google Scholar] [CrossRef]
- Kim, K. Identifying the Structure of Cities by Clustering Using a New Similarity Measure Based on Smart Card Data. IEEE Trans. Intell. Transp. Syst. 2020, 21, 2002–2011. [Google Scholar] [CrossRef]
- von Behren, S. Das Mobilitätsskelett—Ein Integrativer Ansatz zur Mehrdimensionalen Betrachtung von Urbaner Mobilität. Ph.D. Thesis, Karlsruher Institut für Technologie (KIT), Karlsruhe, Germany, 2021. [Google Scholar] [CrossRef]
- Magdolen, M.; von Behren, S.; Chlond, B.; Hunecke, M.; Vortisch, P. Combining Attitudes and Travel Behavior—A Comparison of Urban Mobility Types Identified in Shanghai, Berlin and San Francisco. In Proceedings of the TRB 98th Annual Meeting Compendium of Papers, Washington, DC, USA, 13–17 January 2019; p. 21. [Google Scholar]
- Murphy, K.P. Machine Learning: A Probabilistic Perspective; Adaptive Computation and Machine Learning Series; MIT Press: Cambridge, MA, USA, 2012; ISBN 978-0-262-01802-9. [Google Scholar]
- NUMO Micromobility Map. Available online: https://www.numo.global/new-mobility-atlas (accessed on 28 June 2023).
- UITP City Transit Data. Available online: https://citytransit.uitp.org/ (accessed on 28 June 2023).
- Dixon, S.; Bornstein, J.; Pankratz, D.M. The Deloitte City Mobility Index. Available online: https://www2.deloitte.com/us/en/insights/focus/future-of-mobility/deloitte-urban-mobility-index-for-cities.html (accessed on 28 June 2023).
- Eurostat Stock of Vehicles by Category and NUTS 2 Regions 2023. Available online: https://ec.europa.eu/eurostat/databrowser/view/tran_r_vehst/default/table?lang=en (accessed on 28 June 2023).
- Numbeo Cost of Living. Available online: https://www.numbeo.com (accessed on 28 June 2023).
- TomTom. TomTom Traffic Index Ranking 2022. Available online: https://www.tomtom.com/traffic-index/ranking/ (accessed on 28 June 2023).
- European Commission Global Human Settlement Layer- Urban Centre Database UCDB R2019A. Available online: https://ghsl.jrc.ec.europa.eu/ucdb2018visual.php (accessed on 28 June 2023).
- OpenStreetMap. Available online: https://www.openstreetmap.org/ (accessed on 28 June 2023).
- Boeing, G. Urban Spatial Order: Street Network Orientation, Configuration, and Entropy. Appl. Netw. Sci. 2019, 4, 1–19. [Google Scholar] [CrossRef]
- UN Habitat Urban Indicators Database 2021. Available online: https://data.unhabitat.org/datasets/GUO-UN-Habitat::11-2-1-percentage-access-to-public-transport/explore (accessed on 28 June 2023).
- Data-Driven EnviroLab the Urban Environment and Social Inclusion Index. Available online: https://datadrivenlab.org/urban (accessed on 28 June 2023).
- Skyscraper Source Media Database—SkyscraperPage.Com. Available online: https://skyscraperpage.com/cities/ (accessed on 28 June 2023).
- World Population Review World City Populations 2023. Available online: https://worldpopulationreview.com/world-cities (accessed on 28 June 2023).
- Moran, D.; Kanemoto, K.; Jiborn, M.; Wood, R.; Többen, J.; Seto, K. Carbon Footprints of 13 000 Cities. Environ. Res. Lett. 2018, 13, 064041. [Google Scholar] [CrossRef]
- The World Bank Gini Index 2022. Available online: https://data.worldbank.org (accessed on 28 June 2023).
- Neffke, F.; Li, Y.; White, A.; Leonard, B.; Tuzcu, N.; Kyle, S.; Barrios, D.; Morales-Arilla, J.R.; Hausmann, R. Metroverse|Harvard Growth Lab. Available online: https://metroverse.cid.harvard.edu/ (accessed on 28 June 2023).
- 2thinknow Innovation Cities Index. Available online: https://innovation-cities.com/city-data/ (accessed on 28 June 2023).
- Zhuge, C.; Wei, B.; Shao, C.; Shan, Y.; Dong, C. The Role of the License Plate Lottery Policy in the Adoption of Electric Vehicles: A Case Study of Beijing. Energy Policy 2020, 139, 111328. [Google Scholar] [CrossRef]
- Rohde, M. World Metro Database. Available online: http://mic-ro.com/metro/index.html (accessed on 28 June 2023).
- Sadler Consultants Urban Access Regulations in Europe. Available online: https://urbanaccessregulations.eu/ (accessed on 28 June 2023).
- Quacquarelli Symonds QS World University Rankings 2023. Available online: https://www.topuniversities.com/city-rankings/2023 (accessed on 28 June 2023).
- OECD. ITF Monitoring Progress in Urban Road Safety: 2022 Update; OECD: Paris, France, 2022; p. 42. [Google Scholar]
- Hofstede Insights Country Comparison Tool. Available online: https://www.hofstede-insights.com/country-comparison-tool (accessed on 28 June 2023).
- Backhaus, K.; Erichson, B.; Plinke, W.; Weiber, R. Multivariate Analysemethoden: Eine Anwendungsorientierte Einführung, 15th ed.; Springer: Berlin, Germany, 2018; ISBN 978-3-662-56655-8. [Google Scholar]
- Williams, B.; Onsman, A.; Brown, T. Exploratory Factor Analysis: A Five-Step Guide for Novices. JEPHC 2010, 8, 1–13. [Google Scholar] [CrossRef]
- Hair, J.; Black, W.; Babin, B.; Anderson, R. Multivariate Data Analysis. In Always Learning, 7th ed.; Pearson Education Limited: London, UK, 2013; ISBN 978-1-292-02190-4. [Google Scholar]
- Ketchen, D., Jr.; Shook, C. The Application of Cluster Analysis in Strategic Management Research: An Analysis and Critique. Strat. Mgmt. J. 1996, 17, 441–458. [Google Scholar] [CrossRef]
- Hunecke, M. Mobilitätsverhalten Verstehen Und Verändern: Psychologische Beiträge Zur Interdisziplinären Mobilitätsforschung; Springer: Wiesbaden, Germany, 2015; Volume 26, ISBN 3-658-08825-7. [Google Scholar]
- Reiffer, A.; Wörle, T.; Briem, L.; Soylu, T.; Kagerbauer, M.; Vortisch, P. Identifying Usage Profiles of Station-Based Car-Sharing Members Using Cluster Analyses. In Proceedings of the TRB 98th Annual Meeting Compendium of Papers, Washington, DC, USA, 13–17 January 2019; Transportation Research Board: Washington, DC, USA, 2019. [Google Scholar]
- Magdolen, M.; von Behren, S.; Burger, L.; Chlond, B. Mobility Styles and Car Ownership—Potentials for a Sustainable Urban Transport. Sustainability 2021, 13, 2968. [Google Scholar] [CrossRef]
- Rousseeuw, P. Silhouettes: A Graphical Aid to the Interpretation and Validation of Cluster Analysis. J. Comput. Appl. Math. 1987, 20, 53–65. [Google Scholar] [CrossRef]
- Syakur, M.A.; Khotimah, B.K.; Rohman, E.M.; Satoto, B.D. Integration K-Means Clustering Method and Elbow Method for Identification of the Best Customer Profile Cluster; IOP Publishing: Bristol, UK, 2018; Volume 336, p. 012017. [Google Scholar]
- CIVITAS. Introducing CIVITAS: Sustainable and Smart Mobility for All 2021. Available online: https://civitas.eu/sites/default/files/CIVITAS2030%20booklet.pdf (accessed on 8 August 2023).

| Indicator | Unit/Range | Description | Year | Source |
|---|---|---|---|---|
| Mobility Dimension | ||||
| Micromobility sharing options | 0–3 | Number of categorically different micromobility offerings within a city | 2023 | NUMO [37] |
| Modal split bike | % | Share of trips made by bicycle | 2017–2020 | UITP [38] Dixon et al. [39] |
| Modal split car | % | Share of trips made by car | 2017–2020 | UITP [38] Dixon et al. [39] |
| Modal split public transit | % | Share of trips made by public transit | 2017–2020 | UITP [38] Dixon et al. [39] |
| Motorization rate | 0–9999 | Average number of registered cars per 1000 inhabitants | 2018–2021 | Eurostat [40] Cities official statistics |
| Numbeo traffic index | 0–1000 | Composite index of time spent in transit and the corresponding dissatisfaction with time spent traveling | 2023 | Numbeo [41] |
| Time lost in traffic | % | Additional time spent on transport due to traffic compared to a city’s baseline conditions without congestion | 2022 | TomTom [42] |
| Geographic Dimension | ||||
| Built-up area per capita | m2 | Area built up by covered surfaces per capita | 2015 | European Commission [43] |
| Geographical agglomeration | % | Size of a city’s urban area, including connectivity to nearby cities and suburbs, with 100% indicating a densely populated area and 0% indicating an isolated location of the city | 2023 | OpenStreetMap [44] |
| Urban street network orientation | % | Quantifying a city’s adherence to a single-grid road network, with 100% indicating full adherence to geometric principles and 0% indicating no adherence at all | 2019 | Boeing [45] |
| Socio-economic Dimension | ||||
| Access to public transit | % | Share of population with access to a public transit stop within walking distance (500 m for buses and/or 1000 m for rail-based services) | 2020 | UN Habitat [46] Data-Driven EnviroLab [47] |
| Buildings over 35 m per 1,000,000 inh. | 0–1000 | Number of buildings with a height of more than 35 m in the urban area per 1,000,000 inhabitants (inh.) | 2023 | Skyscraper Source Media [48] World Population Review [49] |
| CO2 emissions per capita | t | A city’s carbon emissions per capita | 2018 | Moran et al. [50] |
| Cost-of-living index | 0–200 | Living cost compared with the average cost of living in New York City (=100); a city with a cost-of-living index of 120 is estimated to be 20% more expensive than New York City | 2023 | Numbeo [41] |
| Gini coefficient | % | Measure of statistical dispersion intended to represent income or wealth inequality | 2022 | The World Bank [51] |
| GRP per capita | USD | Monetary measure of the market value of all final goods and services produced and sold per resident | 2021 | Neffke et al. [52] |
| Innovation index rating | 0–60 | Assessment of the baseline conditions for innovation in a city, including digital transformation, technology applications, startups, sustainability, and others | 2022 | 2thinknow [53] |
| License caps | 0; 1 | Existence of regulatory policies limiting the issuance of new license plates to residents | 2020 | Zhuge et al. [54] |
| Metro stations per 1,000,000 inh. | 0–1000 | Number of metro stations per 1,000,000 inhabitants | 2023 | Rohde [55] World Population Review [49] |
| Monthly costs of public transit | USD | Cost of a monthly pass for the usage of public transit | 2023 | Numbeo [41] |
| Rail network length per 1000 inh. | m | Total length of all tracks of a city’s railway network (metro and tram) per 1000 inhabitants | 2023 | Rohde [55] World Population Review [49] |
| Road pricing | 0; 1 | Existence of charging mechanisms for the use of parts of the urban road network | 2023 | Sadler Consultants [56] |
| Student city index | 0–100 | Assessment of the best urban destinations for international students | 2023 | Quacquarelli Symonds [57] |
| Traffic fatalities per 100,000 inh. | 0–100,000 | Number of annual traffic fatalities per 100,000 inhabitants | 2022 | ITF [58] |
| Socio-demographic Dimension | ||||
| Population growth per year | % | Annual increase in the number of inhabitants within a city | 2023 | World Population Review [49] |
| Psychographic Dimension | ||||
| Individualism index * | 0–100 | Quantification of the preference for a loose social fabric in which the individual only cares for oneself and one’s immediate family | 2001–2020 | Hofstede Insights [59] |
| Principal Component | |||||
|---|---|---|---|---|---|
| 1 | 2 | 3 | 4 | 5 | |
| Indicator | Car Dependence | Prosperity | Traffic Maturity | Traffic Saturation | Quality of Public Transit |
| Cronbach-α | α = 0.83 | α = 0.88 | α = 0.81 | α = 0.63 | α = 0.72 |
| Motorization rate | 0.746 | −0.102 | 0.199 | 0.034 | −0.067 |
| Individualism index | 0.716 | 0.175 | 0.245 | 0.024 | 0.004 |
| Modal split public transit | −0.711 | 0.208 | 0.280 | 0.331 | −0.056 |
| Modal split car | 0.875 | 0.045 | −0.216 | 0.098 | −0.042 |
| Built-up area per capita | 0.785 | 0.190 | −0.146 | −0.025 | 0.018 |
| Urban street network orientation | 0.494 | 0.187 | −0.406 | 0.203 | 0.093 |
| License caps | −0.479 | 0.393 | −0.407 | −0.267 | −0.054 |
| Cost-of-living index | 0.246 | 0.674 | 0.377 | −0.229 | −0.104 |
| GRP per capita | 0.331 | 0.579 | 0.255 | −0.160 | 0.176 |
| CO2 emissions per capita | 0.294 | 0.618 | −0.150 | −0.007 | −0.061 |
| Monthly costs of public transit | 0.382 | 0.620 | 0.227 | −0.106 | −0.073 |
| Innovation index rating | −0.104 | 0.856 | 0.054 | 0.146 | 0.126 |
| Student city index | −0.146 | 0.783 | 0.438 | 0.053 | −0.206 |
| Geographic agglomeration | −0.239 | 0.465 | −0.317 | 0.067 | 0.274 |
| Access to public transit | −0.132 | 0.037 | 0.804 | −0.045 | 0.074 |
| Traffic fatalities per 100,000 inh. | 0.096 | −0.262 | −0.752 | −0.003 | −0.099 |
| Annual population growth | −0.114 | −0.132 | −0.673 | −0.075 | −0.067 |
| Gini coefficient | 0.169 | −0.074 | −0.560 | 0.426 | −0.079 |
| Modal split bike | −0.391 | 0.027 | 0.030 | −0.668 | 0.181 |
| Time lost in traffic | −0.486 | −0.049 | 0.038 | 0.595 | 0.009 |
| Numbeo traffic index | 0.052 | −0.029 | −0.380 | 0.722 | 0.053 |
| Road pricing | −0.239 | 0.244 | 0.254 | 0.566 | 0.022 |
| Metro stations per 1,000,000 inh. | −0.100 | 0.158 | 0.099 | 0.029 | 0.834 |
| Buildings over 35 m per 1,000,000 inh. | 0.247 | 0.371 | −0.134 | 0.188 | 0.518 |
| Micromobility sharing options | 0.067 | −0.211 | 0.373 | −0.012 | 0.550 |
| Rail network length per 1000 inh. | 0.023 | −0.095 | 0.154 | −0.212 | 0.733 |
| Cluster (CL) | 1 | 2 | 3 | 4 | 5 | 6 | 7 | 8 | 9 |
|---|---|---|---|---|---|---|---|---|---|
| Principal Components | |||||||||
| Car dependence | 0.03 | 0.15 | −1.12 | 1.46 | 1.32 | −1.77 | 0.62 | −0.53 | −1.10 |
| Prosperity | 0.16 | −0.81 | 1.37 | 0.68 | 1.63 | 0.39 | 0.36 | −1.21 | −0.79 |
| Traffic Maturity | 0.78 | 0.80 | 0.47 | −0.57 | −0.55 | −2.02 | 0.57 | −1.47 | −0.11 |
| Traffic Saturation | −1.29 | −0.16 | 0.43 | 0.29 | 0.81 | −0.77 | −0.19 | 0.33 | 1.76 |
| Quality of public transit | 0.89 | −0.04 | −0.48 | −0.10 | 2.24 | −0.14 | −1.00 | −0.71 | −0.51 |
| Cluster-forming Indicators * | |||||||||
| Motorization rate per 1000 inh. | 377 | 478 | 249 | 563 | 422 | 208 | 454 | 250 | 297 |
| Individualism index | 68.4 | 60.2 | 44.3 | 82.4 | 91.0 | 20.0 | 81.4 | 39.2 | 34.7 |
| Modal split public transit [%] | 22.6 | 26.8 | 51.9 | 13.7 | 14.9 | 30.1 | 18.9 | 25.2 | 48.2 |
| Modal split car [%] | 34.4 | 45.1 | 21.7 | 75.4 | 75.2 | 23.5 | 55.4 | 39.9 | 23.8 |
| Built-up area per capita [m2] | 170 | 131 | 88 | 333 | 335 | 74 | 211 | 72 | 61 |
| Urban street network orientation [%] | 4 | 7 | 5 | 44 | 42 | 20 | 9 | 11 | 9 |
| License caps [% of cluster] | 0 | 0 | 14 | 0 | 0 | 80 | 0 | 0 | 0 |
| Cost-of-living index | 77.8 | 59.9 | 82.2 | 73.5 | 85.0 | 47.9 | 82.0 | 38.0 | 35.9 |
| GRP per capita [USD] | 57,161 | 40,465 | 51,214 | 56,357 | 69,954 | 23,342 | 45,829 | 21,184 | 23,821 |
| CO2 emissions per capita [t] | 8.29 | 6.31 | 14.9 | 15.43 | 16.6 | 4.94 | 10.92 | 6.6 | 3.42 |
| Monthly costs of public transit [USD] | 82.1 | 40.1 | 69.5 | 81.5 | 100.8 | 34.0 | 100.2 | 23.8 | 30.1 |
| Innovation index rating | 44.9 | 41.2 | 51.1 | 47.6 | 52.0 | 47.8 | 44.4 | 37.7 | 42.8 |
| Student city index | 71.1 | 59.4 | 92.0 | 64.3 | 72.6 | 61.7 | 80.5 | 48.7 | 61.1 |
| Geographic agglomeration [%] | 41 | 26 | 76 | 51 | 81 | 86 | 28 | 30 | 44 |
| Access to public transit [%] | 93 | 91 | 86 | 61 | 76 | 53 | 91 | 50 | 80 |
| Traffic fatalities per 100,000 inh. | 1.72 | 2.53 | 2.07 | 6.39 | 5.04 | 11.84 | 3.02 | 18.73 | 7.38 |
| Annual population growth [%] | 0.69 | 0.47 | 0.4 | 1.01 | 0.9 | 2.17 | 1.12 | 2.22 | 0.94 |
| Gini coefficient [%] | 30.6 | 32.9 | 34.1 | 38 | 41.5 | 38.2 | 34.3 | 42.7 | 44.2 |
| Modal split bike [%] | 17.7 | 4.1 | 6.6 | 1.2 | 1.4 | 14.6 | 4 | 4.5 | 2.4 |
| Time lost in traffic [%] | 24.7 | 28.8 | 35.9 | 26.7 | 29.6 | 38.0 | 31.5 | 34.8 | 46.6 |
| Numbeo traffic index | 101.1 | 131.8 | 148.9 | 188.7 | 203.4 | 165.6 | 155 | 204.4 | 222.7 |
| Road pricing [% of cluster] | 12 | 17 | 71 | 11 | 43 | 0 | 8 | 8 | 67 |
| Metro stations per 1,000,000 inh. | 40.6 | 17.8 | 18 | 8.6 | 71.9 | 14.2 | 1.6 | 4.8 | 6.5 |
| Buildings over 35 m per 1,000,000 inh. | 140 | 54.2 | 100.9 | 274.5 | 630.4 | 27.8 | 69.8 | 22.7 | 35.4 |
| Micromobility sharing options | 2.12 | 2.11 | 1 | 1.22 | 1.71 | 1 | 1.17 | 0.67 | 1.11 |
| Rail network length per 1000 inh. [m] | 141.5 | 58.6 | 26.6 | 30.9 | 143.4 | 23.5 | 17.8 | 7.6 | 10.7 |
| Cluster/ Urban Archetype | Characteristics | Key Example Cities | |
|---|---|---|---|
| 1 | Well-Functioning Cities (n = 18) |
| Amsterdam, Copenhagen, Rotterdam, Munich |
| 2 | Ancient Hybrid Cities (n = 18) |
| Madrid, Rome, Barcelona, Athens |
| 3 | Transit Cities (n = 7) |
| Tokyo, Paris, Singapore, London |
| 4 | Auto Cities (n = 8) |
| Los Angeles, Toronto, Dubai, Houston |
| 5 | Hybrid Commuter Cities (n = 8) |
| New York, San Francisco, Chicago, Boston |
| 6 | Dynamic Megacities (n = 5) |
| Beijing, Shanghai, Shenzhen, Guangzhou |
| 7 | Car and Bus Cities (n = 11) |
| Montreal, Auckland, Sydney, Manchester |
| 8 | Paratransit Cities (n = 12) |
| Kuala Lumpur, Johannesburg, Bangalore, Delhi |
| 9 | Traffic-Saturated Cities (n = 9) |
| Mumbai, Istanbul, Mexico City, Buenos Aires |
Disclaimer/Publisher’s Note: The statements, opinions and data contained in all publications are solely those of the individual author(s) and contributor(s) and not of MDPI and/or the editor(s). MDPI and/or the editor(s) disclaim responsibility for any injury to people or property resulting from any ideas, methods, instructions or products referred to in the content. |
© 2023 by the authors. Licensee MDPI, Basel, Switzerland. This article is an open access article distributed under the terms and conditions of the Creative Commons Attribution (CC BY) license (https://creativecommons.org/licenses/by/4.0/).
Share and Cite
von Behren, S.; Turek, M.; Barthelmes, L.; Scholta, H.; Hansen, F.; Kagerbauer, M.; Eisenmann, C. Decoding Urban Archetypes: Exploring Mobility-Related Homogeneity among Cities. Sustainability 2023, 15, 14231. https://doi.org/10.3390/su151914231
von Behren S, Turek M, Barthelmes L, Scholta H, Hansen F, Kagerbauer M, Eisenmann C. Decoding Urban Archetypes: Exploring Mobility-Related Homogeneity among Cities. Sustainability. 2023; 15(19):14231. https://doi.org/10.3390/su151914231
Chicago/Turabian Stylevon Behren, Sascha, Maximilian Turek, Lukas Barthelmes, Hanna Scholta, Frank Hansen, Martin Kagerbauer, and Christine Eisenmann. 2023. "Decoding Urban Archetypes: Exploring Mobility-Related Homogeneity among Cities" Sustainability 15, no. 19: 14231. https://doi.org/10.3390/su151914231
APA Stylevon Behren, S., Turek, M., Barthelmes, L., Scholta, H., Hansen, F., Kagerbauer, M., & Eisenmann, C. (2023). Decoding Urban Archetypes: Exploring Mobility-Related Homogeneity among Cities. Sustainability, 15(19), 14231. https://doi.org/10.3390/su151914231