1. Introduction
As the world confronts the ever-mounting challenges of waste management, resource depletion, and the urgent need for sustainable energy solutions, innovative technologies are stepping onto the global stage, offering novel approaches to tackle these multifaceted issues. Among these transformative innovations, landfill gas-to-fuel (LFG) technology stands as a beacon of ingenuity, effectively merging the imperative to manage waste with the drive to generate clean, renewable energy [
1].
Traditionally relegated to the realm of environmental concern, landfills are now poised to become more than just repositories of refuse; they are emerging as potential sources of renewable energy. This remarkable paradigm shift is driven by the development of LFG technology, a solution that captures the potent mixture of gases arising from the decomposition of organic materials within landfills and converts them into valuable fuels capable of powering an array of applications [
2]. Through this technological alchemy, the seemingly overwhelming challenge of managing landfill emissions is reframed into a sustainable energy opportunity. At its core, landfill gas-to-fuel technology presents a symbiotic solution that addresses two of the most pressing global challenges: the necessity to mitigate the adverse impacts of greenhouse gas emissions and the urgency to transition away from fossil fuels [
3].
As organic waste materials decompose within landfills, the spread of a complex blend of gases, predominantly methane and carbon dioxide—both potent contributors to the greenhouse effect and climate change, occurs [
4]. Landfill gas-to-fuel technology captures these gases, preventing their uncontrolled release into the atmosphere and subsequently converting them into a range of usable energy products [
5]. By repurposing these emissions as a renewable energy source, this technology acts as a double-edged sword, cutting down on the emission of harmful pollutants while simultaneously reducing our reliance on non-renewable fossil fuels [
6]. Furthermore, the economic and environmental benefits of LFG technology extend far beyond emissions reduction and energy diversification. This type of technology also offers a tangible strategy for waste management, effectively repurposing landfills from passive storage sites to active energy production centers [
4].
LFG, formed through the anaerobic decomposition of organic matter, primarily consists of approximately 50 to 55% methane and 45 to 50% CO
2. This composition includes minimal non-methane organic compounds at less than 1%, alongside trace quantities of inorganic compounds. Methane, a potent greenhouse gas, exhibits a heat-trapping capability in the atmosphere that is 28 to 36 times more potent than that of carbon dioxide over a century-long timeframe [
7].
Upon initial deposition of municipal solid waste in a landfill, an aerobic (oxygen-rich) decomposition phase ensues, during which methane generation remains minimal. Subsequently, usually within a span of less than a year, anaerobic conditions take hold, prompting methane-generating bacteria to initiate the decomposition of the waste and consequently produce methane. In
Figure 1 the composition and production rates of LFG changes depending on time have been divided into four phases and visualized.
Bacterial decomposition of landfill waste occurs through four distinct phases, each characterized by shifting gas compositions. In a landfill, waste can concurrently undergo multiple decomposition phases, with the overall duration influenced by landfill-specific conditions.
Phase I: This phase involves aerobic bacteria, which thrive solely in oxygen-rich environments. They consume oxygen while breaking down complex carbohydrates, proteins, and lipids—the constituents of organic waste. Carbon dioxide is the principal byproduct. Phase I continues until available oxygen is exhausted.
Phase II: Anaerobic bacteria come into play in this phase, operating without the need for oxygen. These bacteria transform compounds previously generated by aerobic bacteria into acetic, lactic, and formic acids, as well as alcohols like methanol and ethanol. As the acids mix with landfill moisture and nitrogen gets consumed, the result is the production of carbon dioxide and hydrogen.
Phase III: Anaerobic bacteria proceed to consume the organic acids created during Phase II, leading to the formation of acetate—an organic acid. This transformation prompts the landfill to transition to a more neutral environment, which in turn supports the establishment of methane-producing bacteria. These bacteria consume carbon dioxide and acetate.
Phase IV: During this phase, the composition and production rates of landfill gas (LFG) remain relatively stable. LFG typically comprises around 50–55% methane by volume, 45–50% carbon dioxide, and 2–5% other gases like sulfides. Phase IV is characterized by a consistent LFG production rate, usually extending for approximately 20 years [
8].
As organic waste undergoes decomposition within landfills, it gives rise to methane—a highly potent greenhouse gas—with an approximately 80-fold greater heat-trapping capacity than carbon dioxide emissions over a 20-year span. Human-generated methane emissions contribute to nearly 45% of the ongoing net warming effect, and the levels of atmospheric methane are witnessing rapid escalation. The waste sector stands as the third-largest source of human-driven methane emissions, both within the United States and on a global scale [
9,
10,
11]. Inadequately managed landfills pose an immediate and critical threat to our climate, air quality, and public health. Within the United States, municipal solid waste (MSW) landfills discharge an estimated 3.7 million metric tons of methane, equivalent to roughly 295 million metric tons of carbon dioxide when measured over a 20-year timeframe. This emission magnitude is similar to the annual greenhouse gas emissions stemming from either 66 million gasoline-powered passenger cars or the operation of 79 coal-fired power plants [
12,
13].
In the landscape of landfill gas (LFG), energy projects geared towards electricity generation use three predominant technologies: internal combustion engines, gas turbines, and microturbines to demonstrate versatility across a wide spectrum of project sizes. Notably, in 2021, over 85% of LFG energy projects producing electricity relied on internal combustion engines, particularly in the 800-kilowatt (kW) to 3-megawatt (MW) range. For larger ventures exceeding 3 MW, multiple internal combustion engines can be employed together, while gas turbines are typically reserved for substantial undertakings, typically at the scale of 5 MW or greater. Beyond electricity generation, LFG can be transformed into renewable natural gas (RNG) through a process that removes CO
2 and other components. RNG has versatile applications, including vehicle fuel, electricity generation, thermal energy, and as a feedstock for chemical processes. RNG can be transported via various methods, including pipeline injection, CNG or LNG refueling stations, and tube trailers. However, challenges in RNG projects include managing wellfield operations to prevent oxygen and nitrogen ingress, which can increase costs. RNG projects can prioritize vehicle fuel production, particularly for larger landfills in proximity to natural gas pipelines, taking advantage of renewable transportation fuel incentives. RNG also finds applications as a vehicle fuel, available in both compressed natural gas (CNG) and liquefied natural gas (LNG) forms. On-site RNG vehicle fuel projects offer advantages in avoiding pipeline specifications and transport costs, but their success depends on consistent demand. Some projects align RNG production with vehicle fleets engaged in the same activities that generate the biogas, creating closed-loop or circular systems that highlight their self-sustaining nature [
14,
15,
16,
17].
According to the U.S. Department of Energy’s Alternative Fuels Data Center, as of March 2019, the nation boasted 914 public and 678 private CNG stations, along with 66 public and 55 private LNG stations. Notably, by March 2020, a significant majority (91%) of RNG projects utilizing pipeline injection were channeling at least a portion of the RNG into the vehicle fuel market through the pipeline. In these scenarios, fueling stations situated far from the biogas source received the RNG at the distant terminus of the pipeline network [
18].
Environmental Issues for LFG
The uncontrolled disposal of solid wastes may cause significant problems. These negativities which may occur are outlined below.
Leachate pollutes the sea, underground and surface water resources,
Uncontrolled gases harm the habitat and threaten the public health,
Formed methane gas may explode through a sparkle and may cause fires,
Bad odor discomforts the residents,
The areas may become a breeding ground for mice, flies, and other pests,
Animals entering the open area become carriers of various diseases,
Wastes may be spread around causing visual pollution.
Substituting fossil natural gas with RNG yields significant reductions in greenhouse gas GHG emissions, thus contributing to a positive impact on the climate. One approach to quantifying the climate advantage of a fuel involves evaluating its “carbon intensity” (CI) or “carbon footprint.” This assessment entails a comprehensive life cycle analysis, which estimates the full spectrum of GHG emissions linked to the entire process of producing and utilizing the fuel. In essence, the carbon intensity serves as a metric that encapsulates the environmental impact of a fuel in terms of its emissions across its entire lifecycle. Whether in its fossil form or as RNG, natural gas stands as a less carbon-intensive alternative compared to the other common fossil fuels it frequently displaces. This includes conventional transportation fuels such as gasoline and diesel in the majority of instances, and also coal or petroleum for electricity generation [
19,
20,
21]. An important distinction in favor of RNG is its added advantage of generally possessing a lower overall carbon footprint, encompassing emissions originating from fuel production, transportation, and utilization. This aspect further underscores the environmental benefits of RNG over fossil natural gas.
Furthermore, RNG’s carbon footprint can be even further diminished if a project factors in the direct reduction in CH
4 emissions stemming from the organic waste employed in the production of the fuel. This reflects the potential for a circular approach, where the waste’s methane emissions are effectively managed and converted into a lower-emission fuel source [
22,
23,
24].
Biogas primarily comprises methane (CH
4, approximately 50–60%) and carbon dioxide (CO
2, around 40%), accompanied by minor impurities like nitrogen (N
2), hydrogen sulfide (H
2S), and water vapor (H
2O). The proportions of these components vary based on the type of feedstock being utilized. To employ biogas as a vehicle fuel, a two-step process involving purification and upgrading (specifically, CO
2 removal) is imperative. This process serves two key purposes: mitigating the presence of hazardous elements and elevating the gas’s calorific value. This enables biogas to be seamlessly integrated as a substitute for conventional fuels, particularly natural gas [
25].
Lv et al. (2023) stated that CNG buses offer benefits in regard to fuel efficiency and emissions when compared to LNG and hybrid-CNG buses [
26]. Nanaki et al. (2014) [
27] showed a substantial decrease in CO
2 emissions in CNG buses in contrast to diesel-powered buses. Furthermore, CO
2 emissions can be curtailed by 7.85% with B10 blends and an impressive 78.45% with B100 blends when compared to diesel [
27]. Zhang et al. (2014) stated that hybrid and CNG/LNG technologies represent superior choices for mitigating NO
X emissions in urban buses compared to Euro V diesel engines [
28]. Carbon intensities for these fuels demonstrate that when expressed in terms of per-fuel energy, lifecycle GHG emissions for fossil CNG are 17% lower than for diesel. Notably, for both fuels, the majority of lifecycle GHG emissions are attributed to combustion, accounting for 83% for ultra-low sulfur diesel (ULSD) and 75% for fossil CNG [
29].
This article aims as an objective to investigate the intricacies of fuel technology derived from landfill gases, exploring the inner workings of this technology, its benefits, challenges, and its role in shaping the future of sustainable energy production and waste management. The specific objectives of this study include (1) to determine the LFG production from landfill areas and (2) to evaluate the environmental benefits of CNG buses compared to traditional diesel buses. Key research questions include: (1) What are the conversion rates from LFG? (2) What are the greenhouse gas emissions reductions achieved by using CNG buses compared to diesel buses?
To achieve these questions, a comprehensive study was conducted on the waste generated in residential areas, specifically focusing on the rural districts known as the Yedigoze Area in Adana Province. In this research, an extensive investigation was carried out regarding the waste produced in residential neighborhoods, particularly in the rural districts of Adana, commonly referred to as the Yedigoze region. The analysis encompassed an assessment of the gas potential obtainable from this waste and its potential environmental impacts when utilized in municipal buses.
2. Materials and Methods
For this study, primary data collection involves obtaining data on waste generation rates, composition, and demographic information from the Yedigoze region at Adana city. Sampling methods are utilized to ensure the representation of data. An estimation of potential landfill gas generation is performed by considering the organic content and decomposition rates of the waste. Appropriate models or equations are used for accurate estimation of gas generation. The methodology of this study contains the following information:
Data referring to municipal collected waste per year, types, composition of waste, served population, and means of transport,
Details of waste streams separately collected,
Referring to dumpsites: location, design capacity, surface area, covered surface, and disposed waste quantities.
2.1. Yedigoze Region
Various perspectives outline the concept of “rural” as encompassing communities reliant on the primary sector, regions characterized by restricted population size and density, a socio-ecological structure, or a fusion of natural, economic, and social constituents [
30,
31,
32,
33]. The worldwide occurrence of rural decline [
34] leads to a reduction in population, deindustrialization, and economic downturn in rural areas due to the migration of people to urban centers [
35]. This shift can result in poverty and exclusion [
36].
Rural revitalization aims to counteract the deterioration of rural regions through a unified and comprehensive process [
37], which involves fostering economic growth and enhancing the quality of life [
38]. The local economy, social milieu, cultural heritage, physical surroundings, and political context form the essential elements of a holistic approach that interlinks rural transformation and sustainable development [
39,
40]. An effective governance system and the enhancement of governance capacity also serve as pivotal foundations for rural revitalization [
41]. These aspects can be strengthened through a combination of top-down policies and grassroots participation [
42,
43].
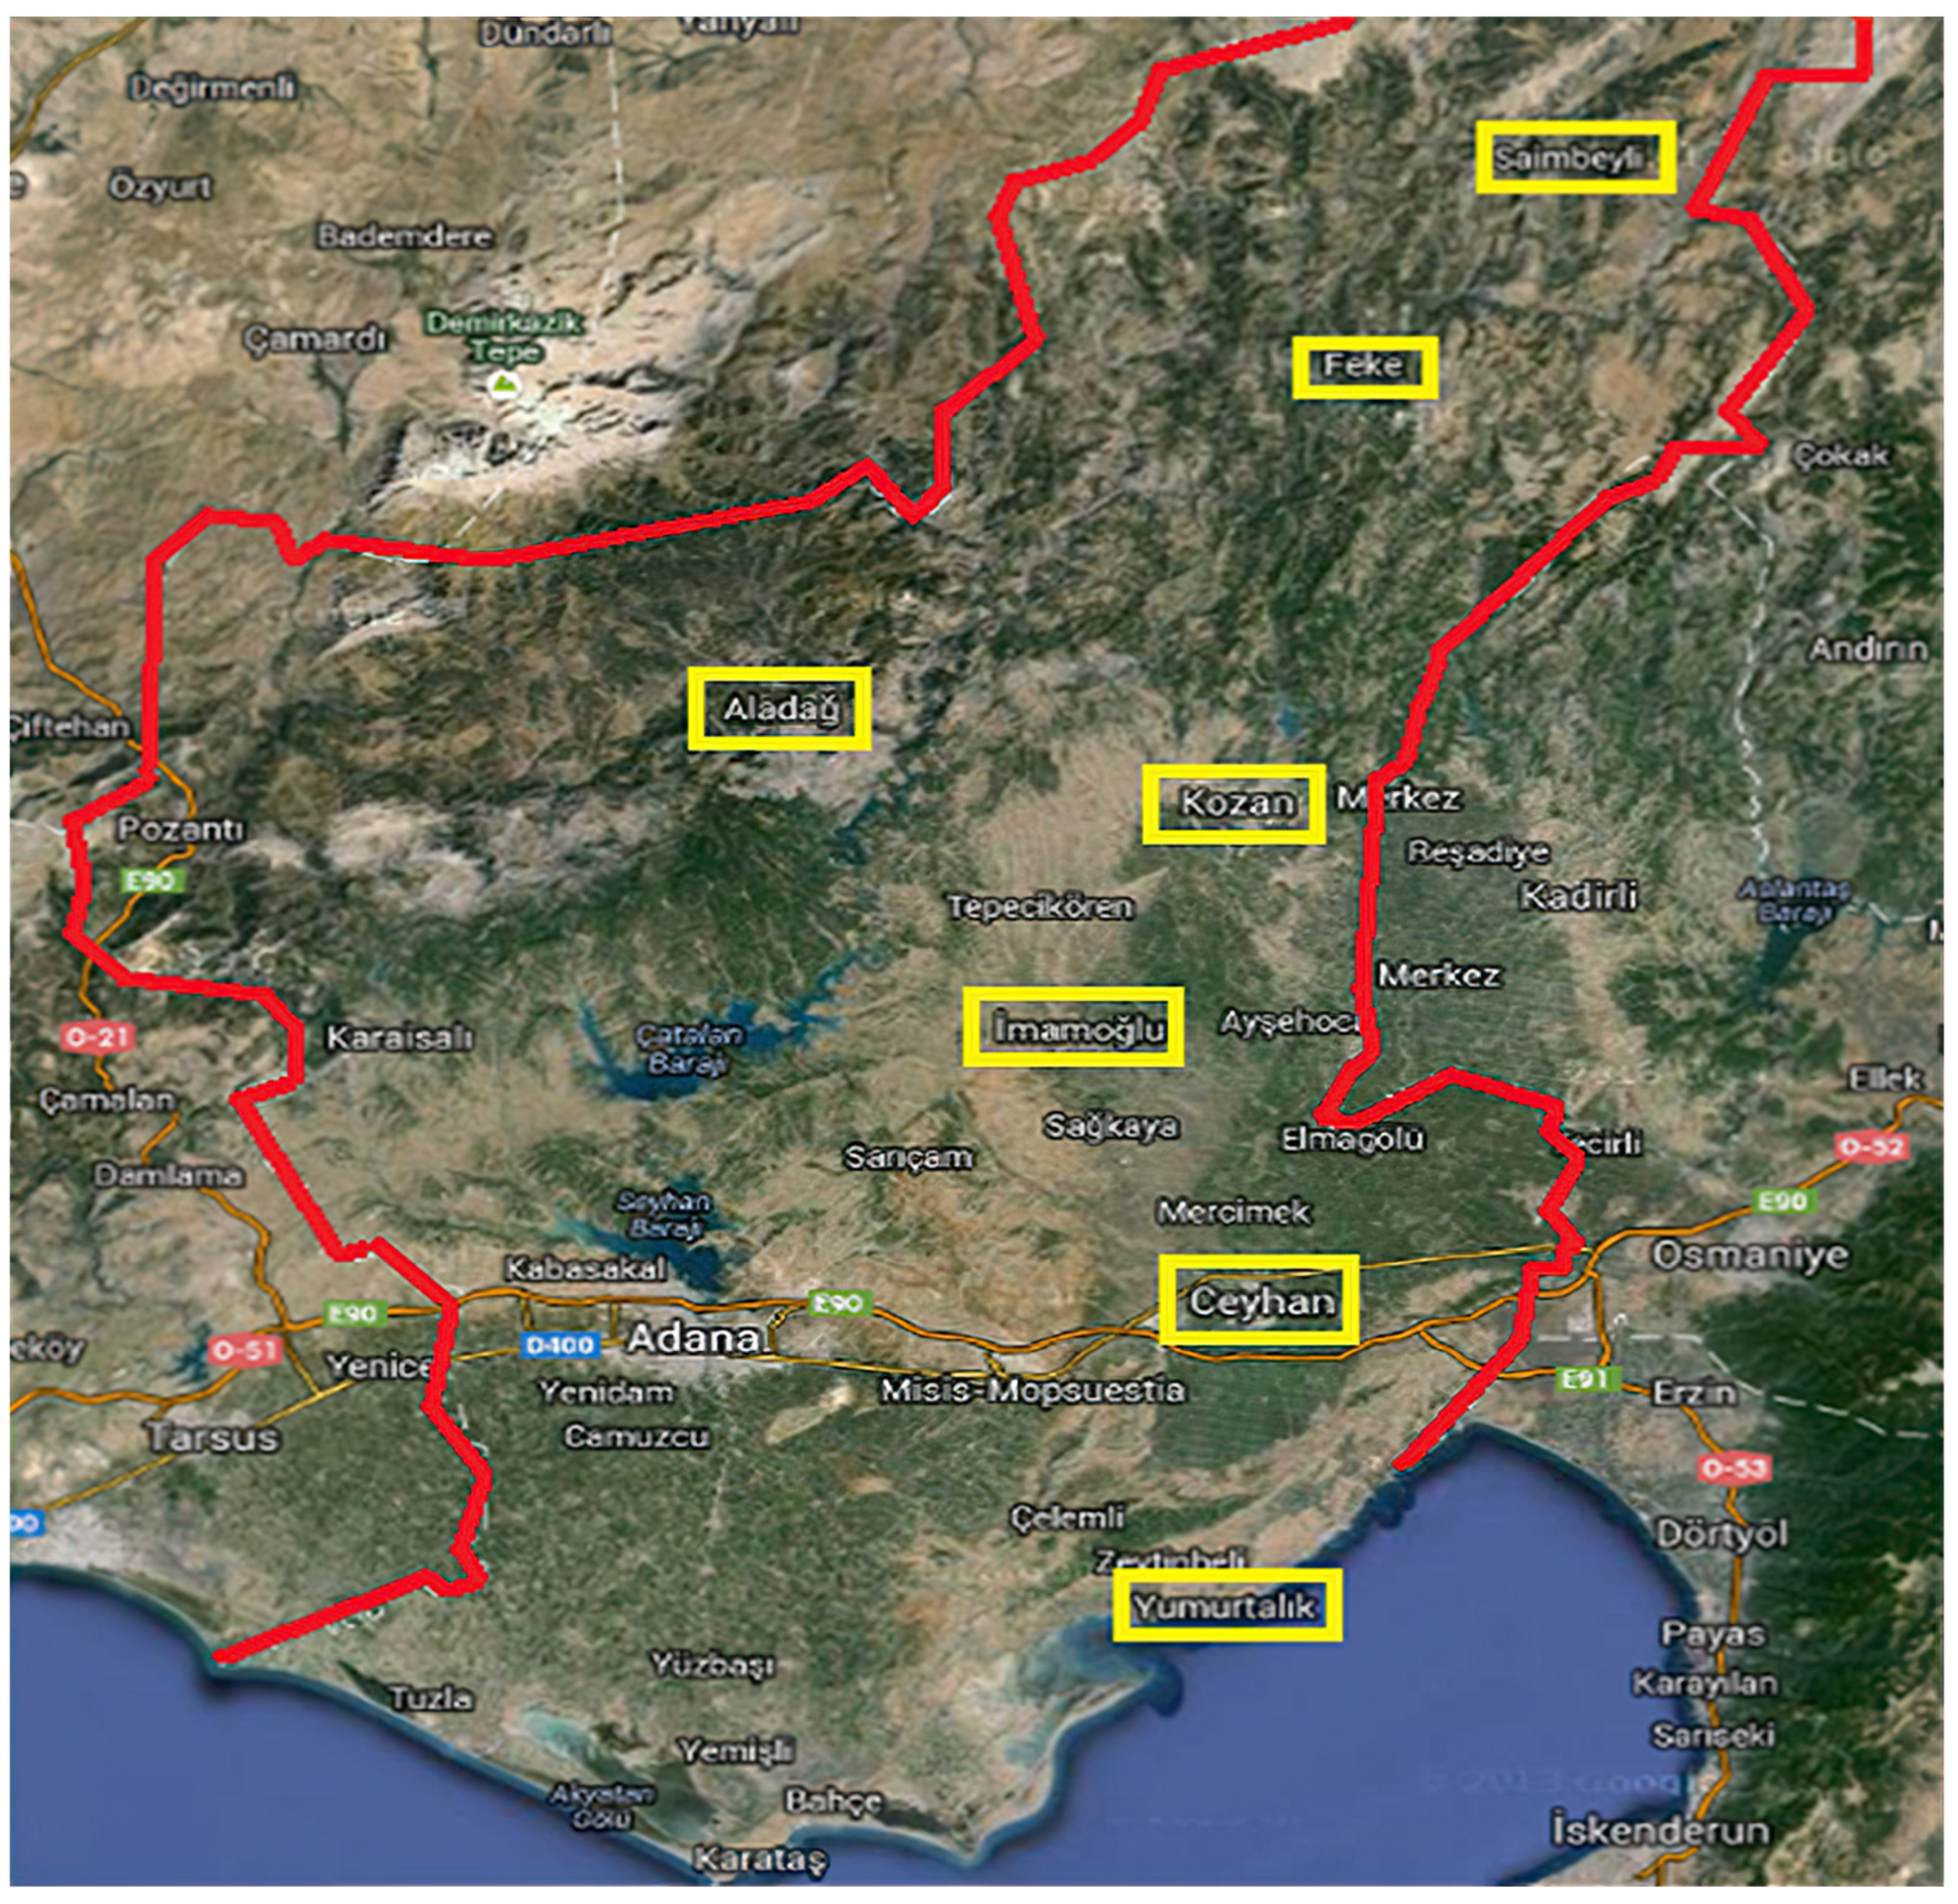
The Yedigoze region, which is the subject of this study, was established upon the unification of seven district municipalities that meet the rural definition above. Before 2014, in order to carry out municipal services quickly and effectively, seven districts established a union body. This decision was published in the Turkish Official Gazette on 1 May 2008. The union was responsible for the disposal of solid waste. The Yedigoze region had 381,667 inhabitants in 2022 and consists of seven districts: Ceyhan, Kozan, Imamoglu, Yumurtalik, Saimbeyli, Feke, and Aladag (
Figure 2). All these districts belong to Adana Province (See
Supplementary-S1). Adana Province comprises a total of 15 district municipalities. The total population of Adana Province was 2,274,106 in 2022 [
44]. However, after the new metropolitan municipality (MM) law came into force after 2014, sub-district municipalities became district municipalities and Provincial Special Administration was connected to these district municipalities. Also, after the MM law, Adana Metropolitan Municipality became the responsible authority for solid waste disposal management inside its borders. The Yedigoze region encompasses district and sub-district municipalities within the Adana Province. The Adana Province is situated within the Mediterranean Sea Region, positioned between 35 and 38 degrees northern latitude and 34 to 36 degrees eastern longitude. The province spans a surface area of 14,030 km
2, with an approximate elevation of 23 m. Notably, it boasts a coastline of 160 km along the Mediterranean Sea. The province is composed of 15 district municipalities [
45].
The composition of waste was carried out through the data of waste characterization studies in the Yedigoze region for the winter and summer seasons. The obtained data were complemented with historical data and data collected from municipalities to obtain the required design parameters and projections. The assessment of forthcoming demand for municipal waste management encompasses consideration of demographic expansion and pertinent patterns throughout the entirety of the analysis period (up to 2047, the conclusion of the analysis duration).
In addition, the development of waste composition, technical advances, and the legal framework are also factors influencing the evaluation. Many of these elements correlate with the quality of life, the upsurge in recycling endeavors, and ultimately, the volume of waste production. The approach utilized for forecasting will be expounded upon, including a clear elucidation of the methodology applied and the intricacies involved in preparing the forecasts.
Forest land accounts for around 39% of the total area within the province, while meadow land occupies roughly 3% of the entire region. The area features a diverse range of agricultural activities. Agricultural land constitutes approximately 38% of the total area, with an additional 19% of the region’s space allocated for other purposes [
46].
For this study, the population was calculated for the period of 30 years. Therefore, the capacity of the new waste management system proposed in this study is calculated based on the increasing requirements for the collection, treatment, and disposal of waste generated by both urban and rural populations over the next 30 years.
Member municipalities of the Yedigoze region collect solid waste from all urban locations. According to the determination ratios of all wastes collected in the region by cities, within the scope of the study about 35.8% of waste was collected from the Ceyhan municipality, 33.8% from the Kozan municipality, 13.9% from the Yumurtalik municipality, 6.4% from Imamoglu, 3.8% from the Feke municipality, 3.3% from the Saimbeyli municipality, and 3.3% from the Aladag Municipality.
Starting in 2015, wastes of the Yedigoze region have been sending their wastes to the Adana (Sofulu) Landfill. The Adana Sofulu Landfill is located northeast of Adana, approximately 13 km to Adana city center and 1 km to the residential area. The objective of this study is to redefine the approach to waste management. Rather than transporting solid waste from all districts of Adana to the city center, the focus is on implementing an on-site disposal method for rural district waste. This approach also entails the production of landfill gas from this waste and subsequently utilizing the generated gas as a fuel source for vehicles. The waste accumulated in residential areas necessitates transportation to the designated disposal site. If the distance between the waste collection points and the disposal site is relatively short, a more cost-effective approach is to directly transport the collected waste to the disposal site. However, when this distance exceeds a certain threshold, it becomes economically advantageous to utilize high-capacity vehicles for transporting the waste to transfer stations.
In the context of this study, the proposed collection site for waste from rural districts is situated in Kozan. As a result, waste from Kozan can be transported directly to the new landfill without involving a transfer station. For the other districts of the Yedigoze region, aside from Kozan, the distances between their existing transfer stations, the landfill, and residential areas are detailed in
Table 1.
After the new Metropolitan Law No 6360 came into force in March 2014, as the responsible body in force, Adana MM published a tender and with a contract 9 transfer stations have been constructed in Karataş, Tufanbeyli, Saimbeyli, Kozan, Imamoğlu, Ceyhan, Aladag, Yumurtalik, and Karaisalı for the transportation of all the collected wastes from the districts to the existing Adana landfill.
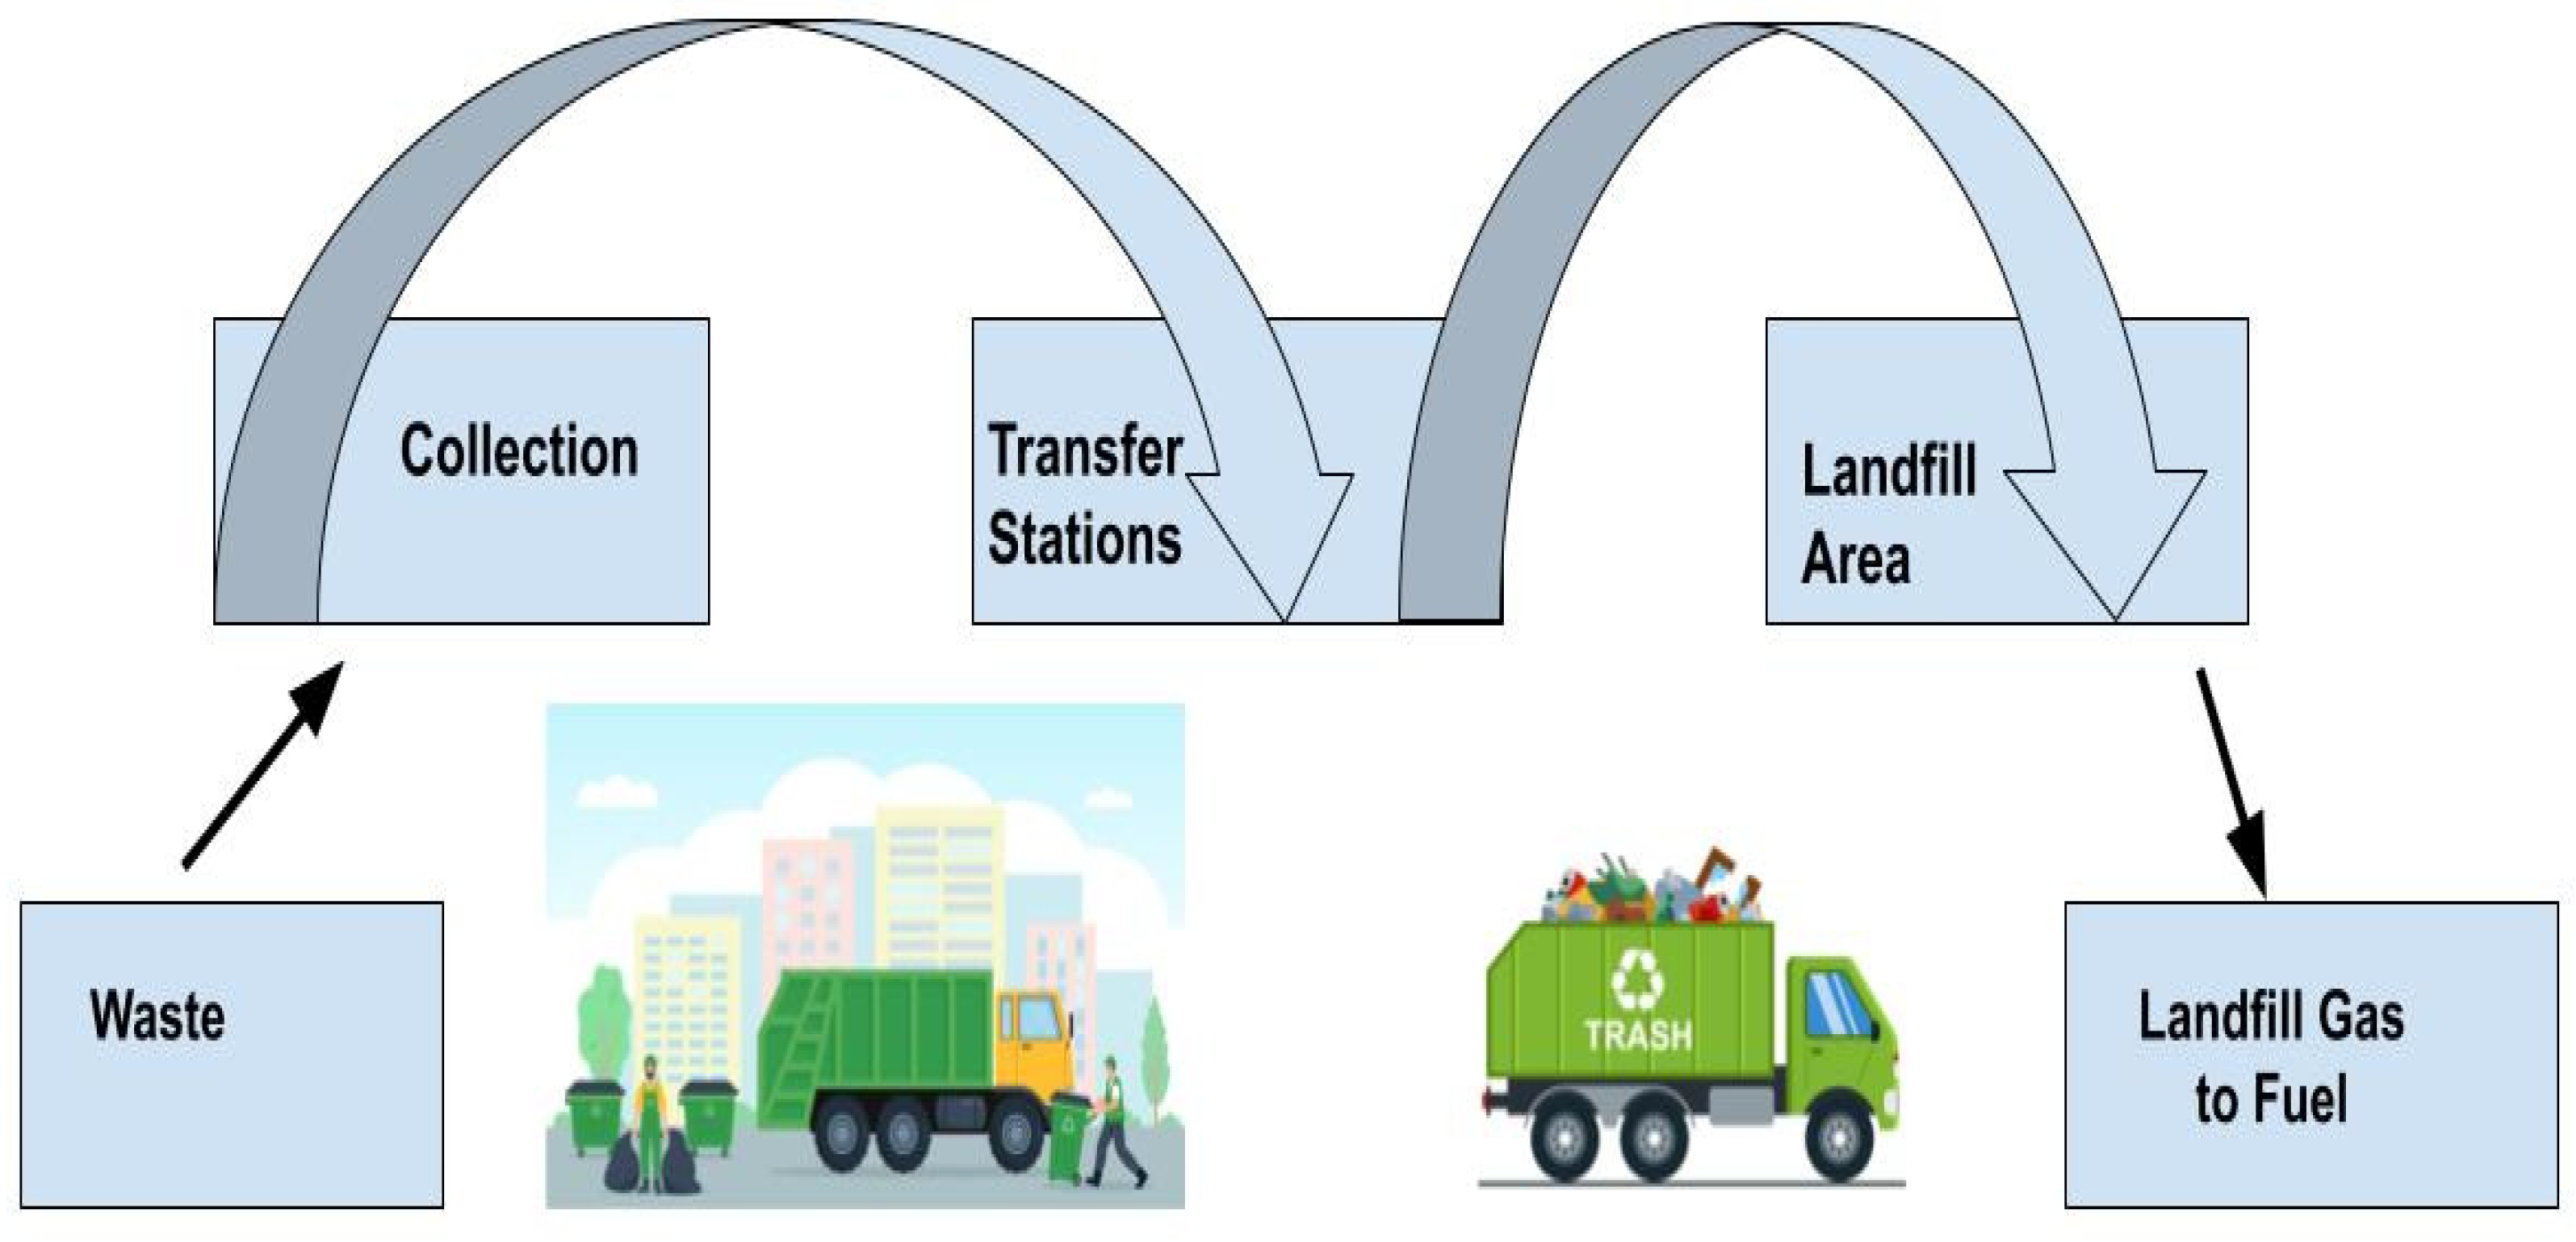
Waste collection is a fundamental component of municipal solid waste management systems, aimed at removing waste generated by households to maintain public health and environmental cleanliness. Typically conducted through curbside collection or communal dumpsters, the frequency varies by location, and some programs encourage waste separation for recycling. As seen in
Figure 3, waste is collected and then transported to transfer stations and intermediate facilities where it is sorted, compacted, and consolidated before being transported to landfills or recycling centers. Landfills, engineered to manage waste responsibly, include sanitary landfills with environmental safeguards like liners and leachate collection systems, and they play a crucial role in the waste management hierarchy, with waste reduction and recycling as preferred alternatives, requiring careful planning and post-closure care to ensure long-term environmental protection.
2.2. Landfill Gas Utilization
Gas generation is intricately linked to the organic content introduced into the landfill. Once an effective mechanism for organics recovery is established, gas production might diminish to levels that render gas exploitation economically unviable. The composition and flow of landfill gas predominantly hinge on factors such as the waste type deposited in the landfill, its age, and moisture content. An assessment has been conducted regarding the gas production stemming from the waste deposited at the proposed landfill site. A projection of gas production has been formulated using the Landfill Gas Emissions Model (LandGEM) EPA model, which is built upon the provided formula and parameters (
Supplementary Figure S1). LandGEM employs the initial-order decay formula provided below for approximating methane production. Projections for landfill gas generation rely on the methane composition within the LFG. The prevailing methane content of LFG, standing at 50 percent, aligns with the industry norm and is also endorsed as the preferred default value by the Landfill Methane Outreach Program (LMOP). LandGEM posits that methane generation reaches its peak shortly after the initial waste deposition, following a brief time lag during which anaerobic conditions establish themselves in the landfill. The model also presupposes that the pace of landfill methane generation subsequently diminishes exponentially, following the principles of first-order decay, as bacteria consume organic materials. User inputs are necessary for only three of the variables in the first-order decay equation:
Mi, L0, and
k. Their definitions and Equation (1) are given below.
k (Methane Generation Rate Constant): k measures how fast waste breaks down in landfills to produce methane. It is expressed as 1/year. Higher k values lead to faster methane production during landfill operation and quicker declines after closure. k depends on waste moisture, nutrient availability, pH, and temperature.
L0 (Potential Methane Generation Capacity): L0 represents the potential methane yield from a metric ton of decaying waste and varies from 56.6 to 198.2 m3 per metric ton. L0 is primarily determined by waste type, with higher organic content yielding higher L0. Dry organic waste content, not wet weight, determines L0. LandGEM defaults to 170 m3/Mg for conventional landfills.
Mi (Annual Waste Disposal Rates): Mi estimates annual waste disposal rates and is the key factor in LFG generation models. LandGEM does not adjust for waste composition, leaving those adjustments to L0 values [
47]
QCH4 = annual methane generation in the year of the calculation (m3/year),
i = 1 year time increment,
n = (year of the calculation)—(initial year of waste acceptance),
j = 0.1 year time increment,
k = methane generation rate (year−1),
L0 = potential methane generation capacity (m3/Mg),
Mi = mass of waste accepted in the ith year (Mg),
tij = age of the jth section of waste mass Mi accepted in the ith year (decimal years, e.g., 3.2 years).
For conventional landfill sites, k 0.05 year−1 was used. For L0 (potential methane generation capacity) 2 different values 170 m3/Mg and 100 m3/Mg were used and the average of these models were considered to take into account the reduction in methane potential due to increasing organic waste recovery in time. A 50% methane content was used.
In Yedigoze’s anaerobic environment, landfill gas typically consists of around 50 percent methane and 50 percent carbon dioxide, with minimal quantities (<1 percent) of nitrogen, oxygen, hydrogen sulfide, hydrogen, and non-methane organic compounds (NMOCs). The higher the quantity of organic waste and moisture in a landfill, the greater the quantity of landfill gas generated by bacteria during the decomposition process. Additionally, the greater the number of chemicals disposed of in a landfill, the higher the likelihood of volatile organic compounds and other gases being generated. Removing trace gases from landfill gas is a complex task, but several methods can be employed. These include adsorption with activated carbon, gas separation techniques like membrane separation, oxidation to convert gases like hydrogen sulfide, biological treatments for specific gases, chemical scrubbing, cryogenic separation, pressure swing adsorption, thermal oxidation, and chemical reactions. The choice of method depends on the composition of the gases and environmental regulations. A combination of these methods may be necessary to effectively treat landfill gas before release or utilization.
A sanitary landfill is fundamentally a site designed to ensure safe and environmentally responsible waste disposal. It typically includes essential features like a buffer zone, a well-maintained access road for trucks, a monitoring station, and an administrative building. Additionally, there’s a weighbridge, a laboratory for waste testing and leachate analysis, a vehicle maintenance workshop, a wheel washing unit, and a system for venting and possibly converting methane gas into electricity. Some landfills may even incorporate a pilot compost plant. Key operational tasks at a sanitary landfill involve:
Recording waste intake.
Ensuring strict control over the types of waste accepted.
Daily covering of waste with a 15 cm thick layer.
Compacting the surface covers.
Properly covering and closing cells as needed.
Periodic groundwater monitoring during and after closure.
The base of the disposal cell is made impermeable with a 50 cm layer of compacted clay, with a permeability coefficient below 1.10–9 m/s. A 2 mm thick HDPE membrane is placed over the clay, with protective geo-textile on top. Leachate is collected through drainage pipes laid on the geo-textile, with a 50 cm layer of gravel above the HDPE membrane. Perforated HDPE pipes are used for leachate collection. Wastewaters other than leachate and surface runoff are directed to API separators for treatment before discharge outside the landfill area. Four observation wells are used to detect any potential contamination caused by leachate. Statistical data related to landfill operations, such as waste quantities and gas production, are routinely recorded and stored electronically. Daily waste deliveries are compacted and spread, and a 15 cm thick daily cover is applied at day’s end. Cells are covered in accordance with relevant regulations once they are completely filled. Contaminants within landfill waste can escape via three pathways: surface water percolation, excess liquids within the waste, or groundwater contact with submerged waste. To prevent groundwater contact, employ controlled waste disposal above the water table and construct an impermeable bottom liner. Minimize surface water percolation by reducing water sources, achieved through a perimeter cut-off drain and final cell cover.
To manage long-term leachate generation, utilize a composite cover system. Address potential losses and leachate generation during active site operations with a composite base liner system, including a primary geo-membrane liner, leak detection system, and secondary base liner.
Install a leachate collection system at the landfill base comprising perforated pipes within a 0.5 m thick granular drainage layer. This system ensures minimal leachate accumulation and efficient collection. The core process involves breaking down carbohydrates, proteins, fats, biopolymers, and synthetic organic products into simple organic acids, carbon dioxide, and methane. The biological degradation of organic waste occurs in phases influenced by environmental conditions, although the phases’ consistency, intensity, and speed vary.
3. Results
The growth of waste generation depends on the population growth, and changes in the living standards of the Yedigoze Area. This study assumed that living standards will increase for citizens because people who live in rural areas migrate to the center of district municipalities or other cities which means people demand to increase their life conditions. Therefore, this aptitude will increase the recyclables ratio in the future. Also, this study assumed the country’s development, as it is known that Turkiye demands to improve its heating system to prevent environmental pollution. For this reason, the ratio of the ashes should be decreased in the coming years.
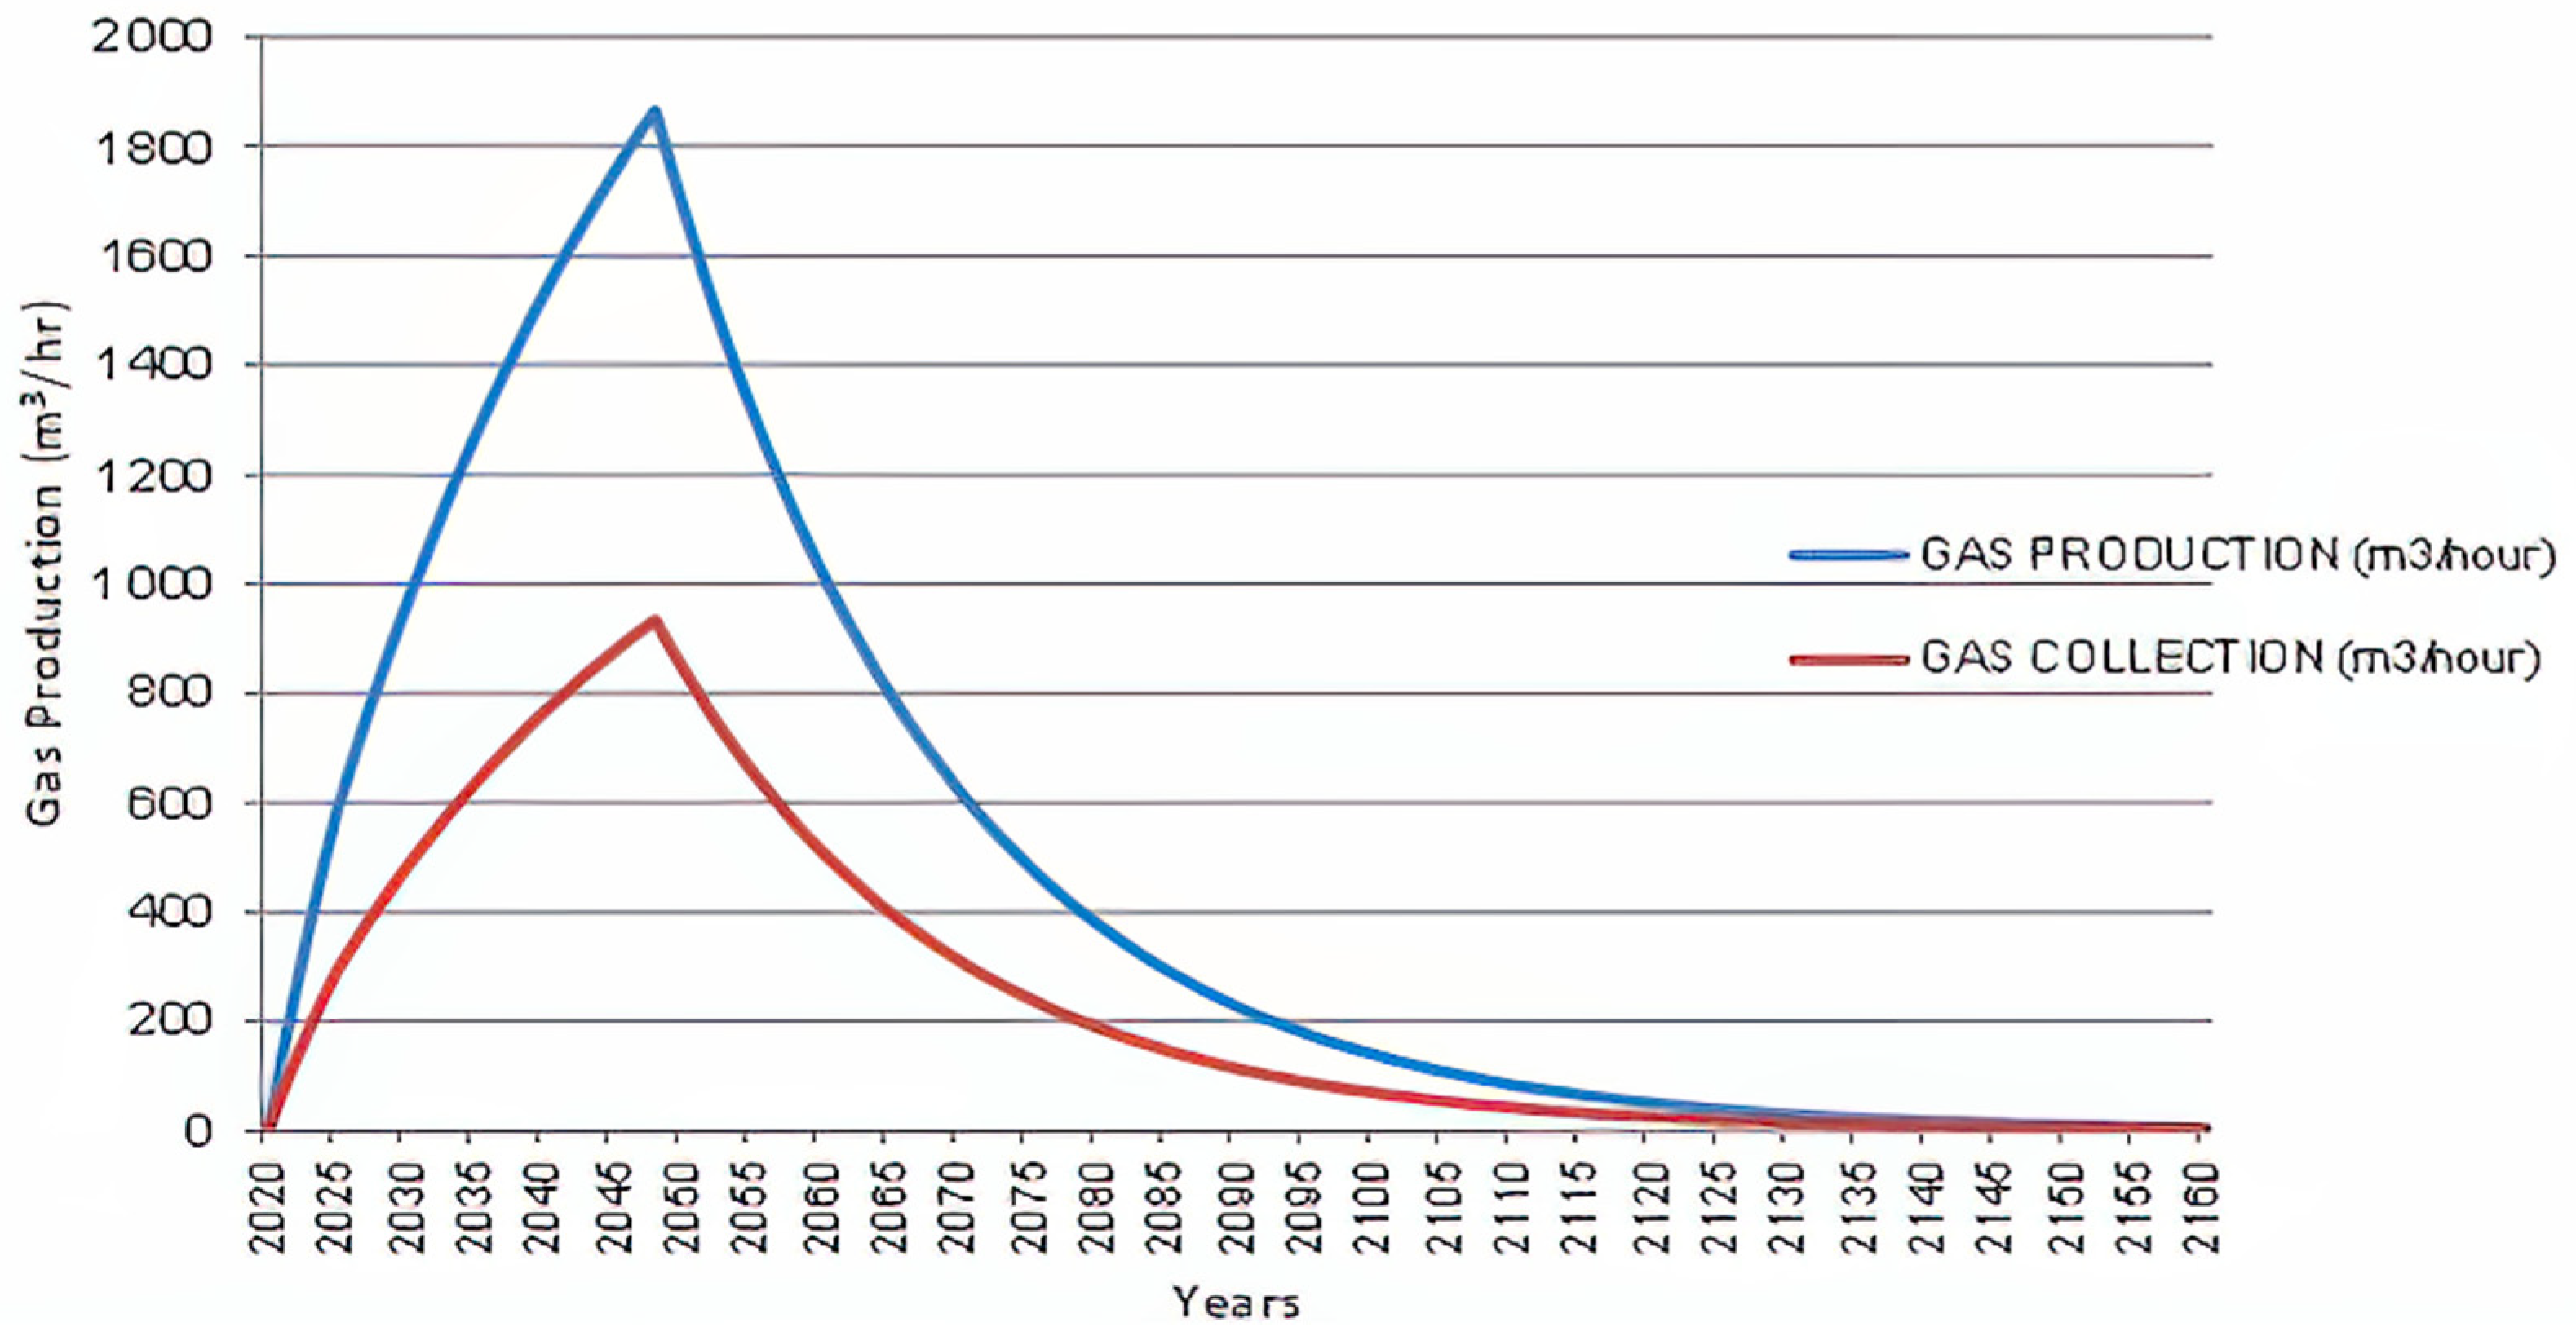
Figure 4 and
Supplementary Table S4 depict the generation of landfill gas per year in the Yedigoze Area. Maximum gas generation occurs in the year 2048. The maximum gas generation at the landfill will be 1865 m
3/h in 2048, while the amount of gas collected will be 933 m
3/h. The total amounts of gas to be generated and collected at the landfill are presented in
Figure 4.
Gas production in the Yedigoze Area exhibits a clear upward trend, increasing by approximately 1865 m3/h from 2020 to 2048. In 2048, the landfill is projected to reach its peak gas generation rate, producing 1865 m3/h, which is nearly 20 times the rate observed in 2020. However, despite this significant increase in gas production, the efficiency of gas collection appears to be a concern, as only 50% of the generated gas is collected in that peak year. Methane amount is a notable environmental issue. In 2048, approximately 932.5 m3/h of methane is expected to be released into the atmosphere, contributing substantially to greenhouse gas emissions. This underscores the importance of optimizing gas collection systems to mitigate the environmental impact of landfill gas. The observed increase in gas production is likely influenced by population growth and improvements in living standards.
As the population grows and people experience higher living standards, waste generation tends to rise. This suggests a need for waste management strategies that account for these demographic and economic changes. The data’s extension to 2100 enables long-term planning. If gas production continues to increase at the observed rate, it could exceed 4500 m3/h by 2100. This underscores the importance of forward-looking waste management strategies that consider changing waste composition, technological advancements, and the evolving environmental landscape. These quantitative insights emphasize the urgency of improving gas collection efficiency, reducing methane emissions, and addressing waste management challenges in the Yedigoze Area. Effective planning and investment in waste management infrastructure are critical to minimize environmental impact and maximize resource recovery.
Additionally, the efficiency of gas collection systems plays a pivotal role in realizing a valuable energy resource, specifically for powering CNG buses. As indicated by the data, only 50% of the generated gas is collected in the peak year of 2048. This highlights an area for improvement in the existing infrastructure to maximize the quantity of gas available for CNG production.
The correlation between population growth and living standards with waste generation is critical to consider. As populations migrate to urban centers and living standards improve, waste generation tends to increase. This is attributed to higher consumption, increased packaging, and changes in consumption patterns. Therefore, while the increase in living standards may be a positive social indicator, it also carries implications for waste management strategies and resource allocation.
Utilizing landfill gas as a fuel for vehicles involves a series of steps and considerations. Landfill gas contains impurities like CO2 and H2S. Prior to use, it must undergo treatment and upgrading to meet vehicular fuel quality standards. After treatment, the gas is compressed to higher pressure for efficient storage. Compressed natural gas (CNG) is the common form for vehicle use. Specialized tanks are necessary to store compressed gas safely under high pressure, typically installed within vehicles. Vehicle engines must be adapted to run on CNG. This may involve converting to dedicated CNG engines or retrofitting for bi-fuel capability. Establishing CNG refueling stations is crucial. These stations include compressors, storage, and dispensers, conveniently located for vehicle access. CNG use affects vehicle performance. Ensuring engine technology aligns with CNG and addressing performance changes is vital. Landfill gas as fuel is cleaner, reducing emissions and fossil fuel dependency. Its cost-effectiveness appeals to vehicle owners and municipalities. Adhering to fuel quality, safety, and emissions regulations is essential to meet local standards. Promoting landfill gas as vehicle fuel raises community awareness, supporting waste-to-energy initiatives. By addressing these aspects comprehensively, you can successfully incorporate landfill gas as an eco-friendly and sustainable vehicle fuel option.
The main factors affecting waste volumes are population growth, human settlement structures, economic development, and legislation. Selected approaches for estimating demographic trends in the Yedigoze region are shown in
Supplemantary Table S3. The total waste composition forecast in the Yedigoze region until 2047 was estimated with selected approaches, and the results are presented in
Table 2, providing valuable insights. Population growth affects the waste generation as the total waste generation can be seen as the result of individual generation multiplied by the relevant population. Typical waste generation analysis divides the generation areas according to human settlement structures: rural vs. urban. Several European countries have targeted or even achieved a decoupling, or relative decoupling, between gross domestic product (GDP) and waste generation. It is also recognized that economic activity impacts waste generation and correlations are frequently shown between GDP and waste generation. Although European or national legislation focuses mainly on re-use, recycling, and recovery, some legislative items are found regarding the weight of packaging waste units. In principle, this does not directly limit the waste generation, as the number of packaging units is not limited, but as a minimum contributes to the limitation of increase. However, external experience shows that, to a certain extent, the European packaging and packaging waste directive and national legislation contribute to the limitation or even reduction in waste generation but as an indirect result, the main purpose being to ensure the re-use recovery and recycling of packaging waste.
The potential greenhouse gas (GHG) emission reduction resulting from the transition of the 50 diesel bus fleet currently used in the Yedigoze region to the compressed natural gas (CNG) fleet has been calculated and indicated in
Table 3.
GHG emissions reduction was calculated as [Reduction] = [Diesel Emissions—CNG Emissions] = 950,625 kg. Transitioning diesel to CNG buses would result in a reduction of approximately 950,625 kg of CO
2 emissions over a year for the entire fleet. Also with the transfer of the waste from seven districts to the Yedigoze landfill area, will be achieved a total shortening of 137 km (See
Table 1). Transitioning to CNG buses would also reduce emissions of other harmful pollutants, such as nitrogen oxides (NOx) and particulate matter (PM). NOx and PM are both major contributors to air pollution, which can cause serious health problems, including respiratory infections, heart disease, and cancer. A study by the California Air Resources Board found that CNG buses produce 90% less NOx and 95% less PM than diesel buses [
50]. CNG is a less expensive fuel than diesel, so transitioning to CNG buses could save the Yedigoze region money on fuel costs. A study by the US Department of Energy found that CNG buses can save up to 30% on fuel costs compared to diesel buses [
51]. In addition to the emissions reduction and cost savings benefits, transitioning to CNG buses could also have other quantitative benefits, such as:
Reduced noise pollution: CNG buses are quieter than diesel buses, which could improve the quality of life for residents and businesses in the Yedigoze region,
Increased fuel efficiency: CNG buses are more fuel-efficient than diesel buses, which could help to reduce the Yedigoze region’s dependence on foreign oil,
Extended engine life: CNG buses have longer engine life than diesel buses, which could reduce maintenance and replacement costs [
52].
Biomethane and landfill gas (LFG) are renewable energy sources with the potential to mitigate climate change and improve air quality. However, their extraction and use also pose potential safety and environmental risks. One of the biggest safety concerns is the risk of methane leakage, which can lead to explosions and fires. Biomethane and LFG can also contain other hazardous gases, such as hydrogen sulfide and carbon monoxide, which can harm human health. Despite these challenges, biomethane and LFG have the potential to play a significant role in the transition to a clean energy economy. By developing and implementing advanced technologies and management practices, we can minimize the risks associated with biomethane and LFG production and use, while maximizing their environmental and economic benefits.
According to the data provided, the CNG bus concept outperforms the diesel bus concept in terms of total operating costs for one year. It is estimated to be ~31% more economical than the diesel bus concept for total operating cost annually (
Supplementary Figure S5).
The waste management profession often faces limited public acceptance. The general perception of waste is that it is a grim, unsightly matter that needs to be eliminated from view. Consequently, there is a heightened focus on the collection and transportation of waste from streets, yet the average citizen remains unaware of the intricacies and expenses involved beyond this basic service level. To enhance the system, it is imperative to involve waste generators in any decision-making process, especially when considering the potential costs they may incur. Promoting public awareness regarding the issue and the necessary resources for potential solutions should be communicated to waste producers to achieve a sustainable resolution.
The conversion of a diesel vehicle into a CNG system can be achieved relatively easily by integrating an additional fuel supply setup and storage cylinders designed for methane. A specialized gas engine refers to a spark-ignited engine that undergoes modification to exclusively utilize gas. It is worth noting that methane demonstrates higher resistance to knocking when compared to diesel. As a result, a specialized gas engine can attain an elevated compression ratio in contrast to a standard diesel engine. This characteristic contributes to a slightly improved energy efficiency during gas operation. Generally, these dedicated gas engines find application in light-duty commercial vehicles such as vans and urban buses. Multiple manufacturers offer gas buses, ranging from traditional two-axle buses to articulated ones (see
Supplementary Figures S2–S4).
Future research in this field should prioritize improving biomethane production efficiency, integrating it with renewables, and conducting comprehensive Life Cycle Assessments (LCA) to evaluate economic feasibility and environmental impact. Expanding infrastructure, addressing policy and regulation, and promoting public acceptance remain crucial. Exploring urban integration, global adaptability, and the role in a circular economy offers promising directions for sustainable energy solutions.
4. Conclusions
The research findings presented in this study have profound implications for sustainable development, particularly in the context of waste management and urban transportation. The interrelationship between these findings and sustainable development underscores their significance. Transitioning from diesel to compressed natural gas (CNG) buses not only offers substantial reductions in greenhouse gas emissions, aligning with climate action goals but also leads to improved air quality, addressing concerns about public health and healthcare costs. Moreover, the cost-effectiveness of CNG as a fuel source highlights the potential for balancing economic and environmental objectives, a crucial consideration in sustainable development. However, several barriers must be overcome, including infrastructure development, regulatory support, and public acceptance. In the real world, achieving these findings’ potential benefits involves strategic investments in CNG infrastructure, policy incentives, and public awareness campaigns. The consequences of such a transition extend to healthier communities, reduced carbon emissions, and progress toward achieving sustainability goals, making it a pivotal step toward a cleaner and more sustainable future.
In conclusion, the research findings presented in this study underscore the remarkable potential of biomethane in significantly reducing greenhouse gas (GHG) emissions in crucial transportation activities. The transition from 50 diesel buses to compressed natural gas (CNG) buses resulted in a substantial reduction of 950,625 kg of CO2 emissions, ~31% more economic, highlighting the efficacy of biomethane, derived from landfill gas (LFG), as a key player in combating climate change.
Moreover, the conversion of gasoline-fueled vehicles into bi-fuel gas systems offers a practical and accessible means to promote cleaner energy sources, particularly through specialized gas engines designed for use in light-duty commercial vehicles such as vans and urban buses. These engines contribute to enhanced energy efficiency during gas operation, making them a valuable asset in our efforts to reduce environmental impact.
The immediate consequences of our research are multifaceted. First, it addresses the pressing issue of GHG emissions from essential transportation activities, thereby contributing to global efforts to combat climate change. Additionally, it tackles road congestion problems associated with waste collection vehicles, potentially leading to smoother traffic flow and reduced urban congestion. From a financial perspective, our findings have significant implications, as they can result in cost savings related to personnel, maintenance, fleet acquisition, and fuel expenses within waste management systems. Furthermore, our research extends into societal realms, as it prompts discussions about public acceptance, fairness, and efficiency within the waste collection and transportation management systems. It emphasizes the importance of waste reduction and separate waste collection, promoting responsible disposal practices among residents. This not only mitigates environmental impacts but also enhances the overall efficiency of solid waste management services, benefitting communities at large.
In essence, this study represents a transformative opportunity to convert waste into a valuable resource, curbing GHG emissions by generating domestic, renewable fuel from waste. It also serves as a catalyst for raising awareness about waste reduction and responsible disposal practices. By integrating strategies outlined in this research, we can work towards creating an eco-friendly bus transport system, advancing environmental sustainability, and mitigating the impacts of climate change. This research offers a promising path forward for a cleaner and more sustainable future.


