
Experimental and Numerical Investigations on the Thermal Performance of Three Different Cold Plates Designed for the Electrical Vehicle Battery Module


Abstract
:1. Introduction
2. Materials and Methods
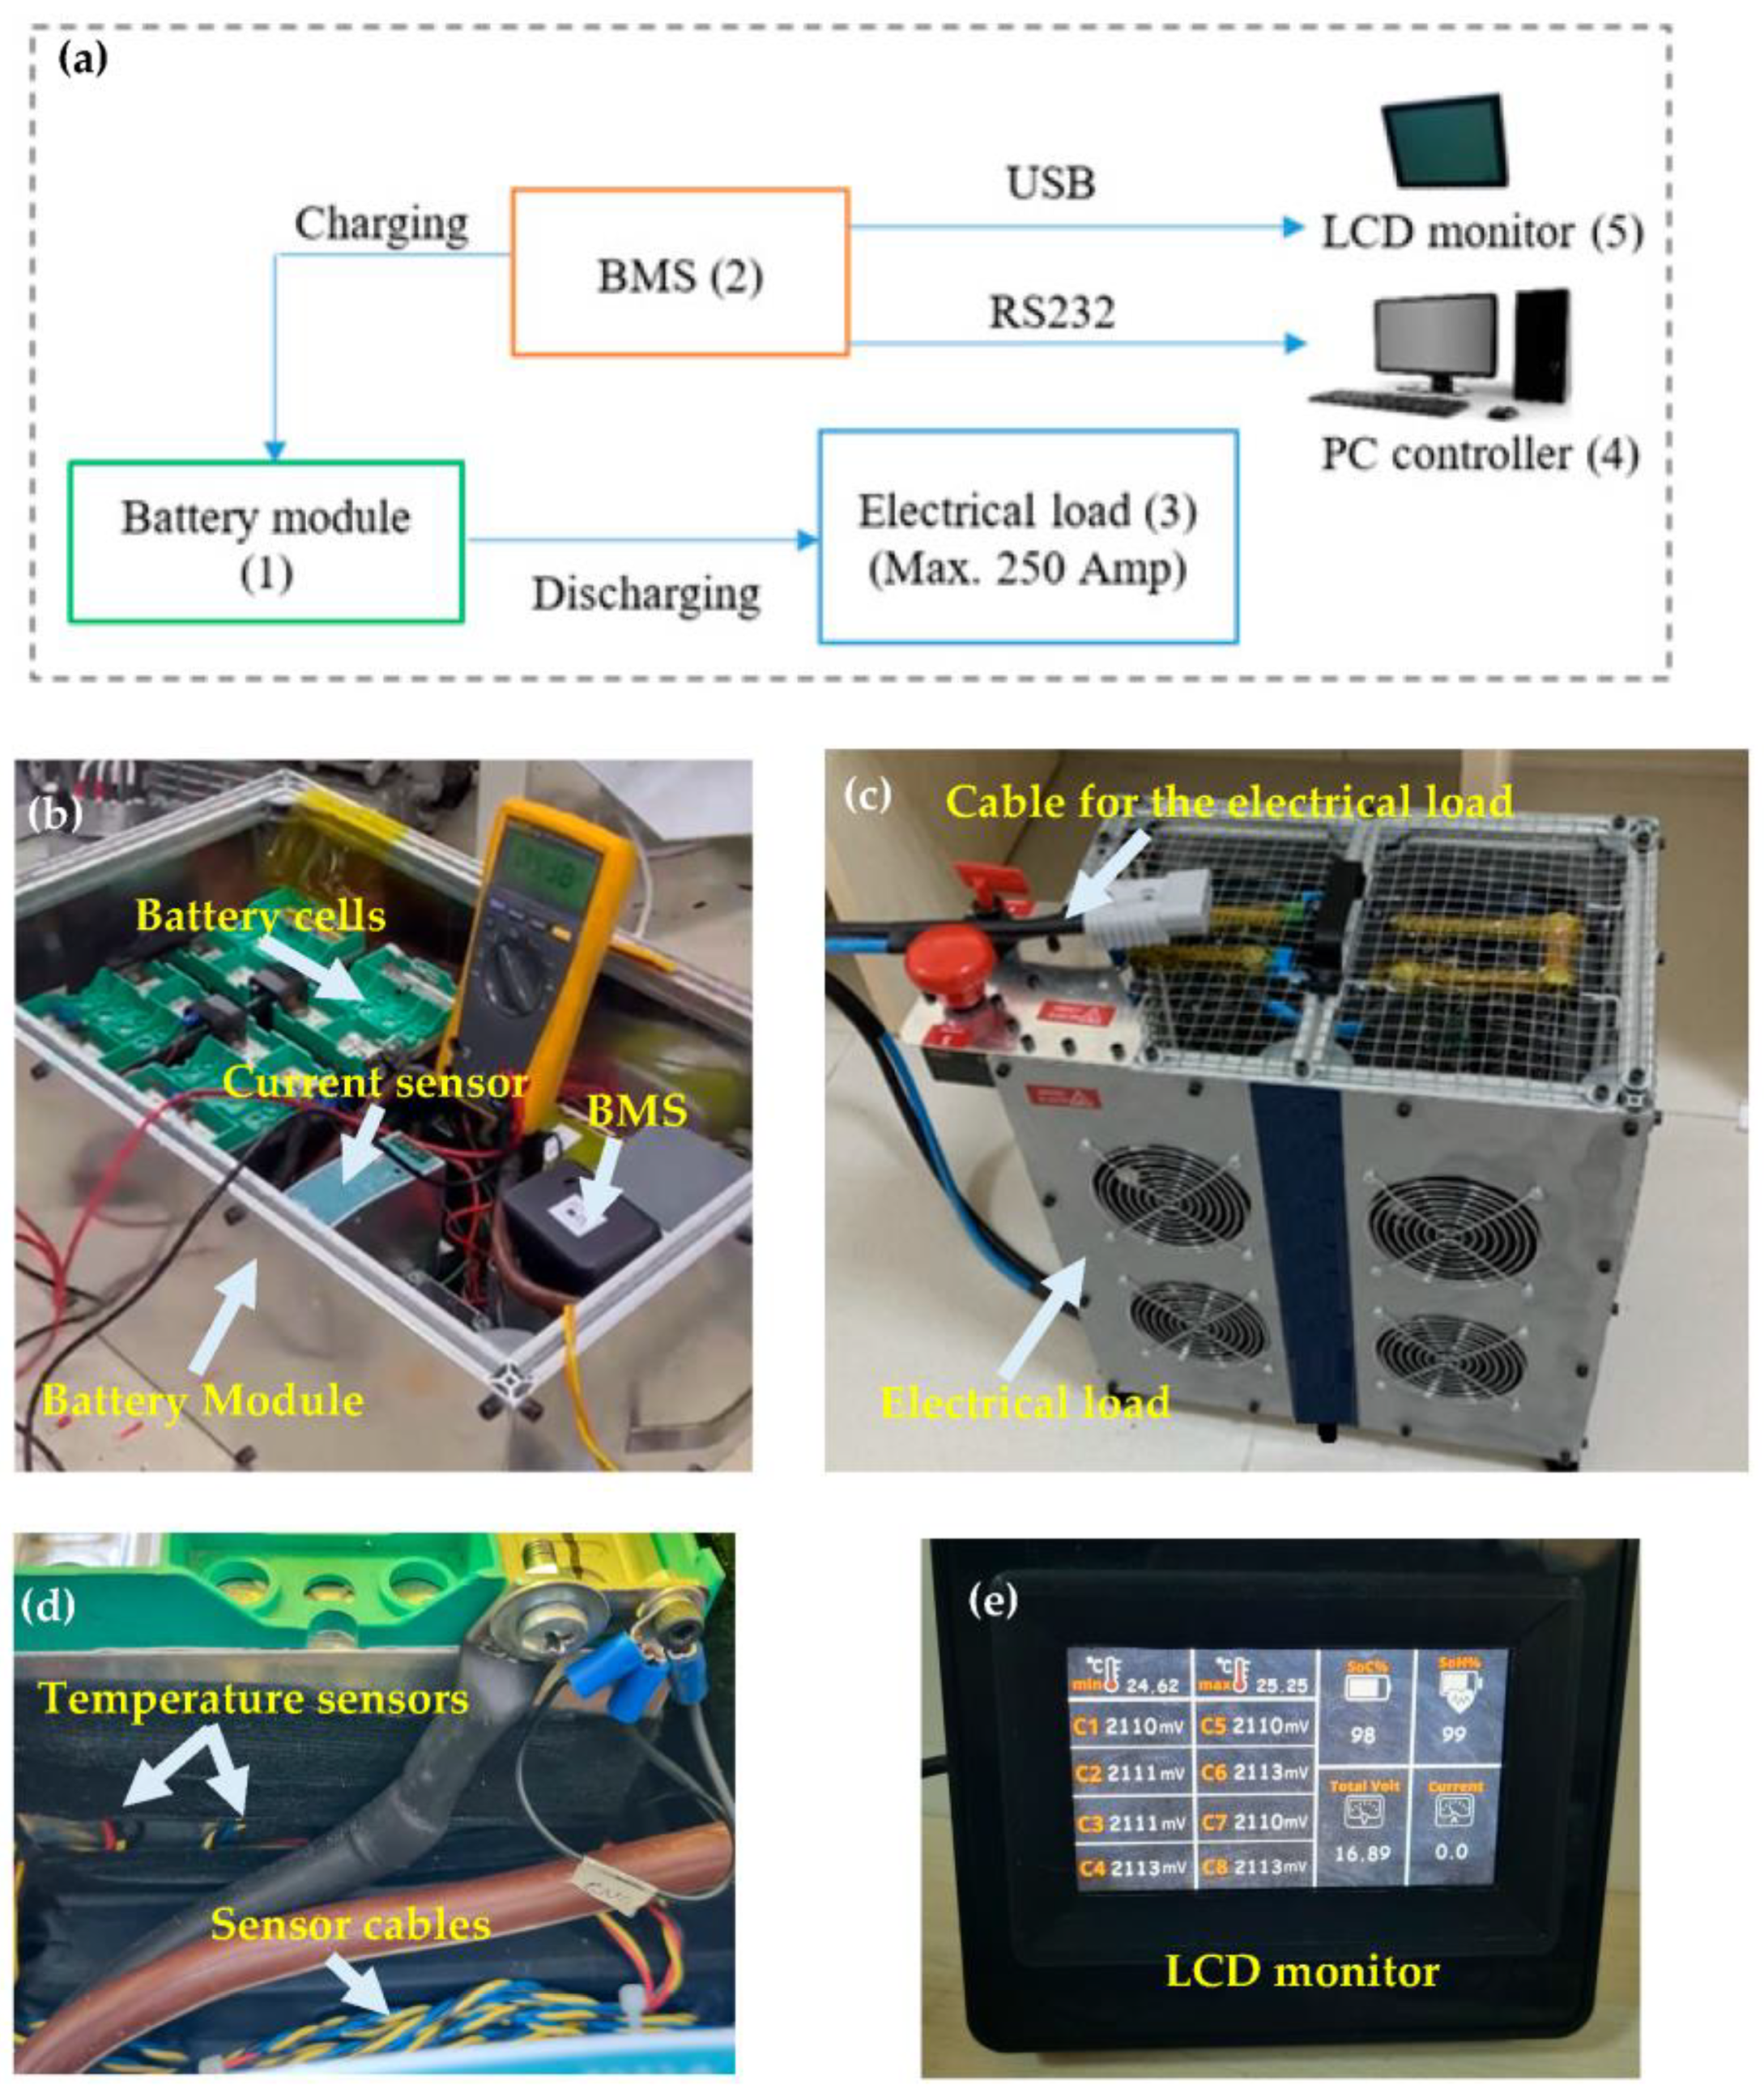
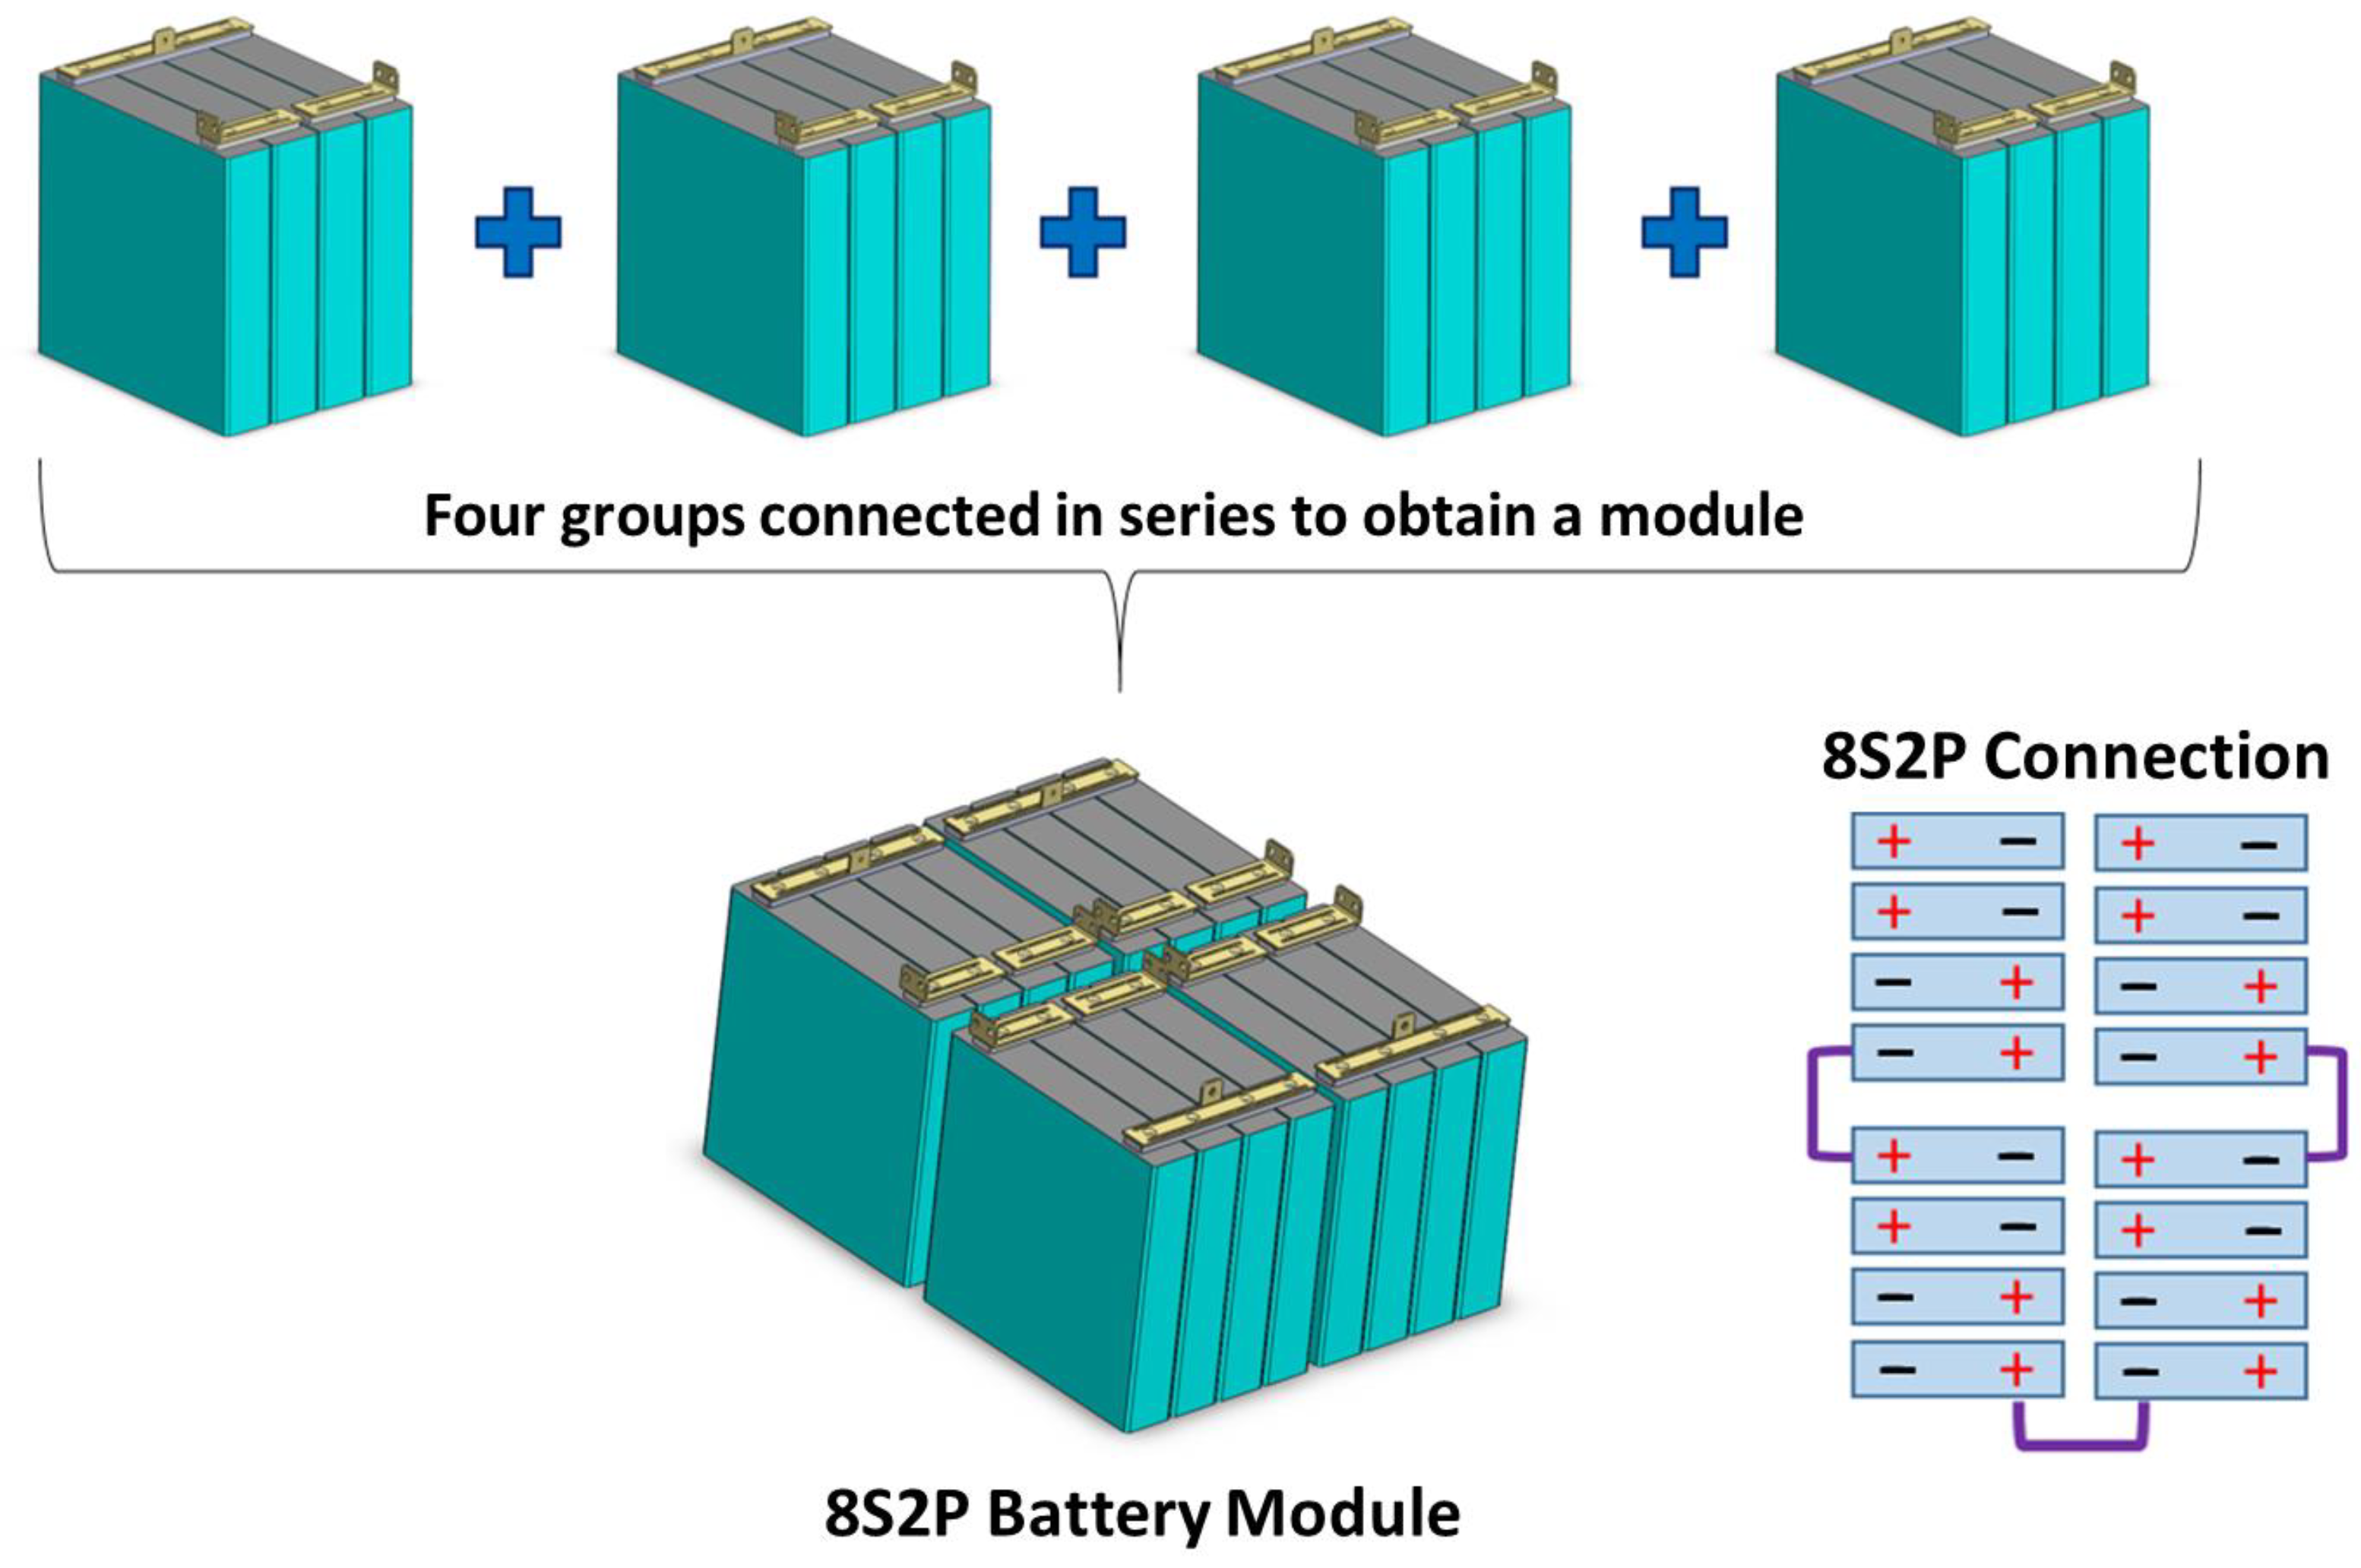
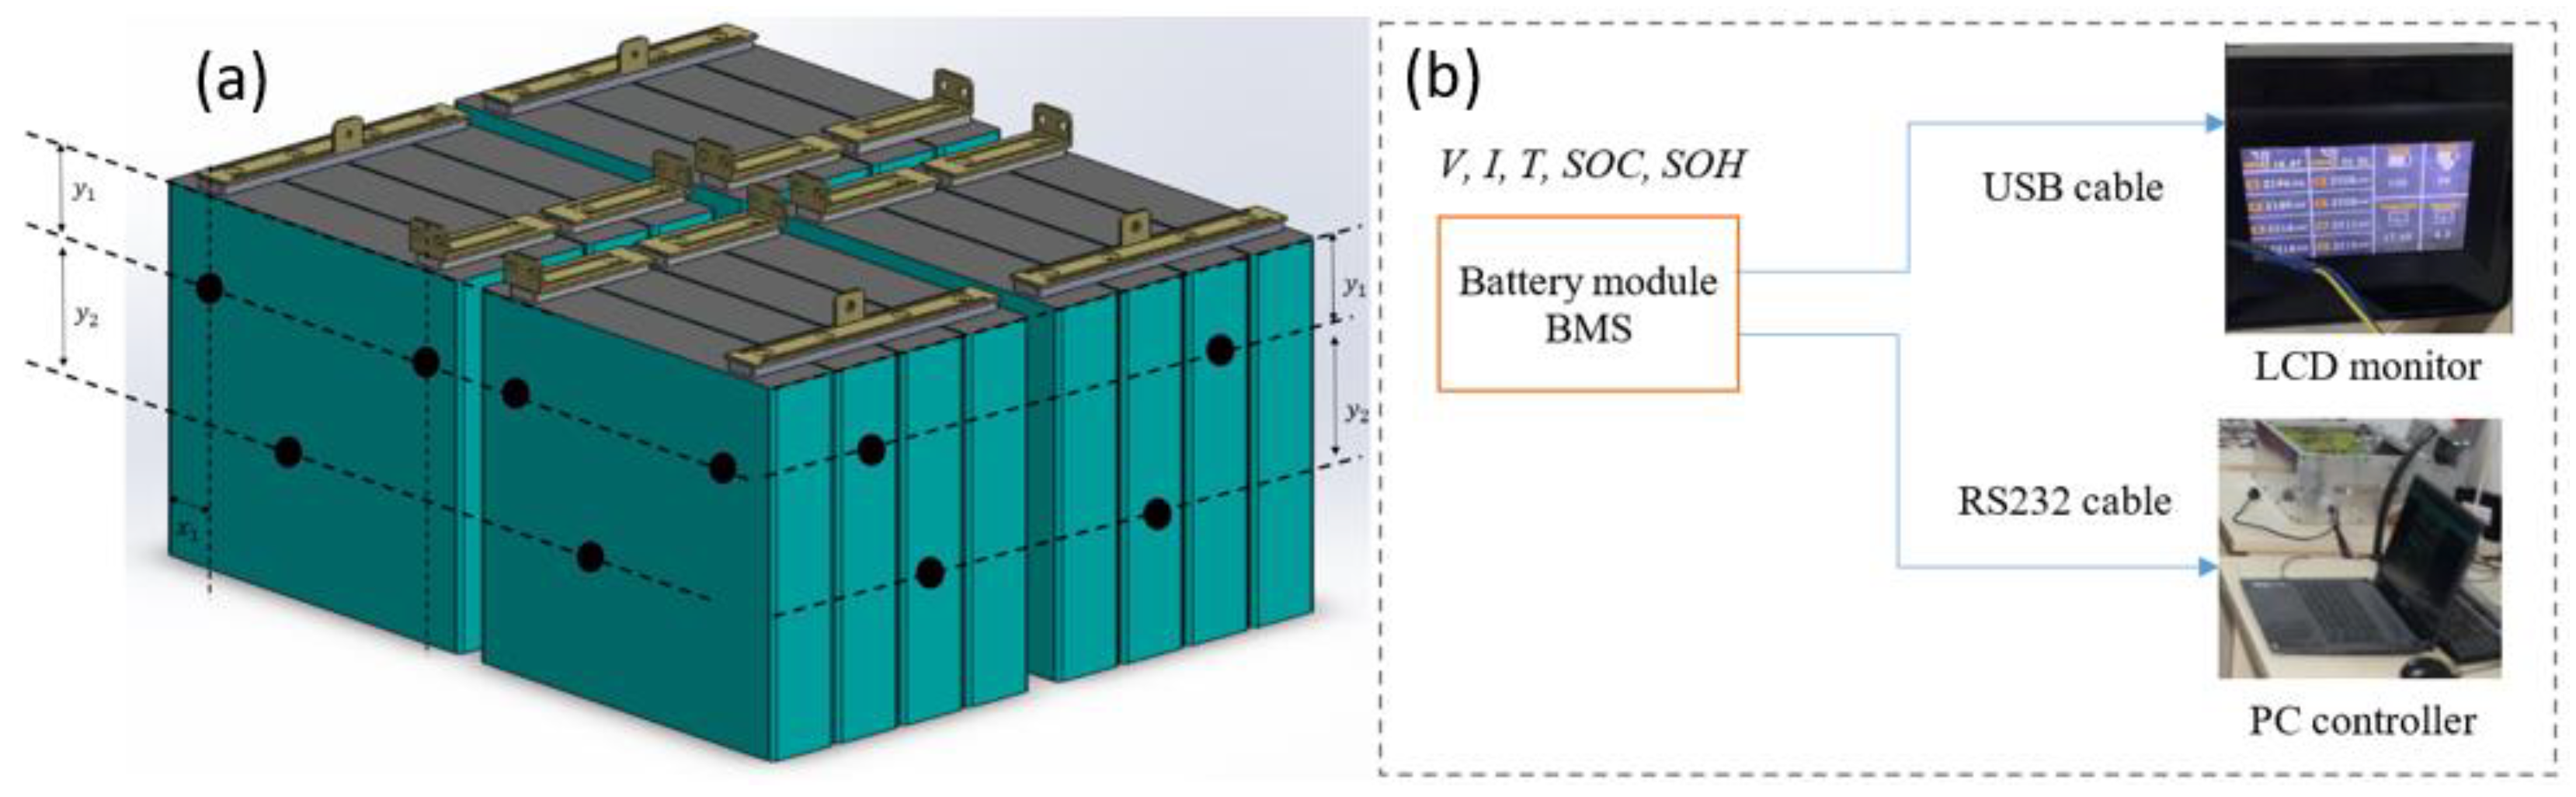
2.1. Description of the Battery Module and Experimental Setup
2.2. Measurement Devices and Data Acquisition System Used in the Experimental Study
2.3. Theoretical Calculations and Uncertainty Analysis
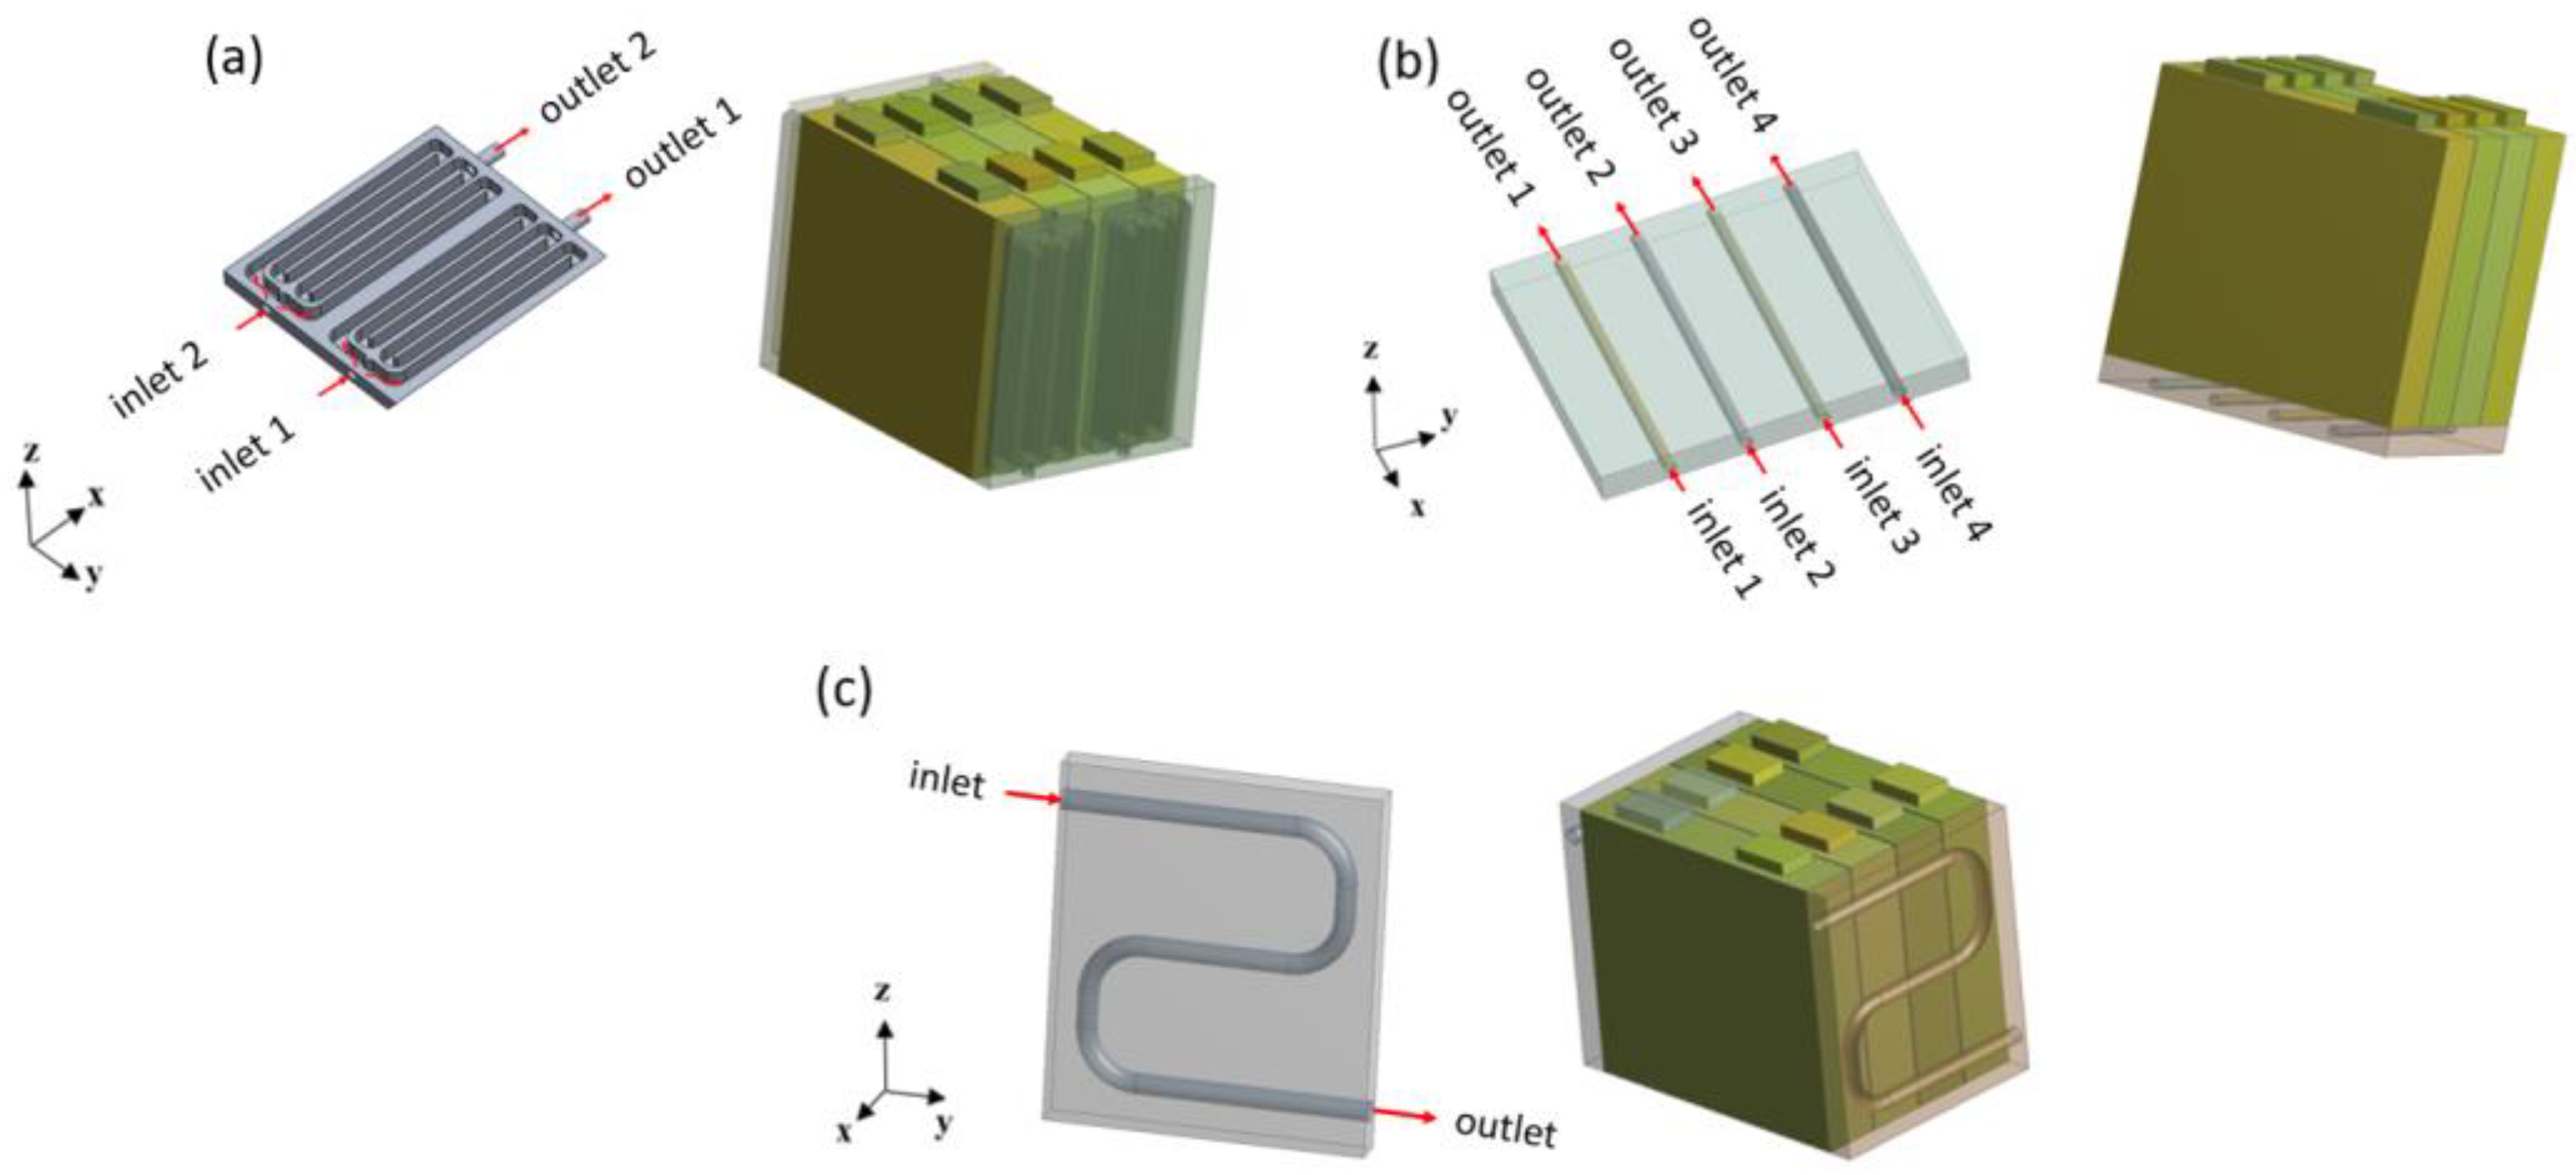
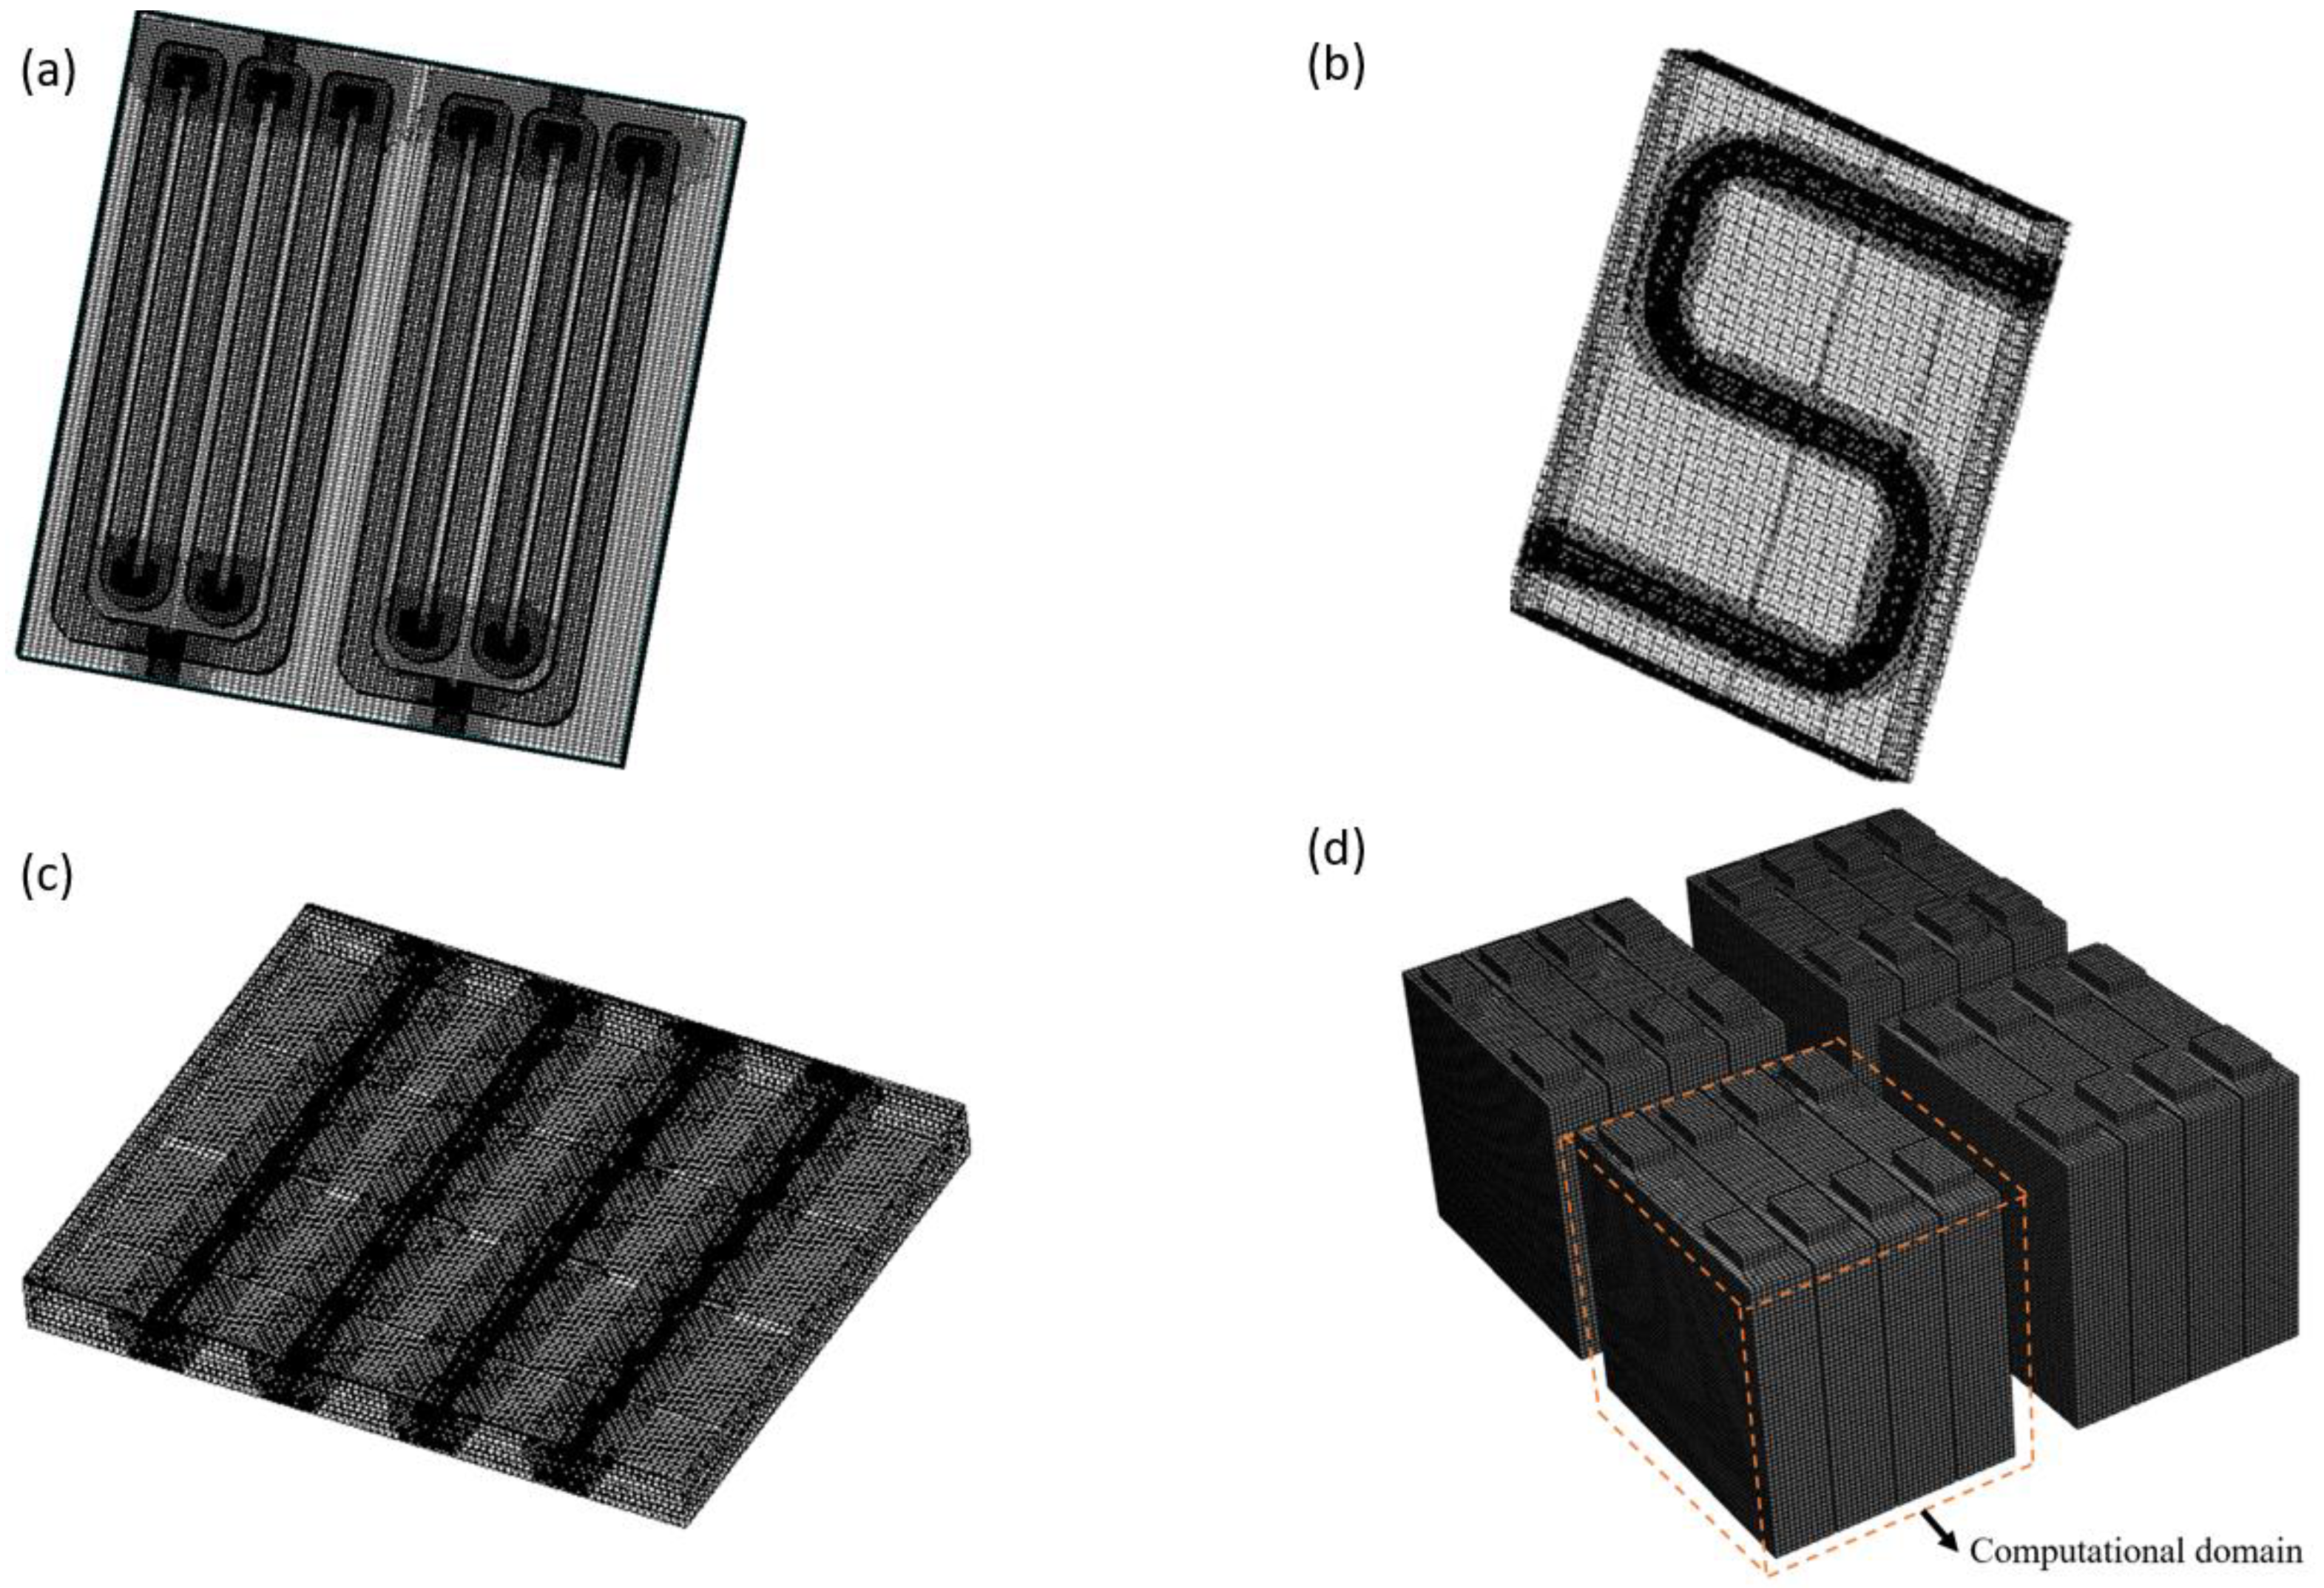
2.4. The Numerical Study
3. Results and Discussion
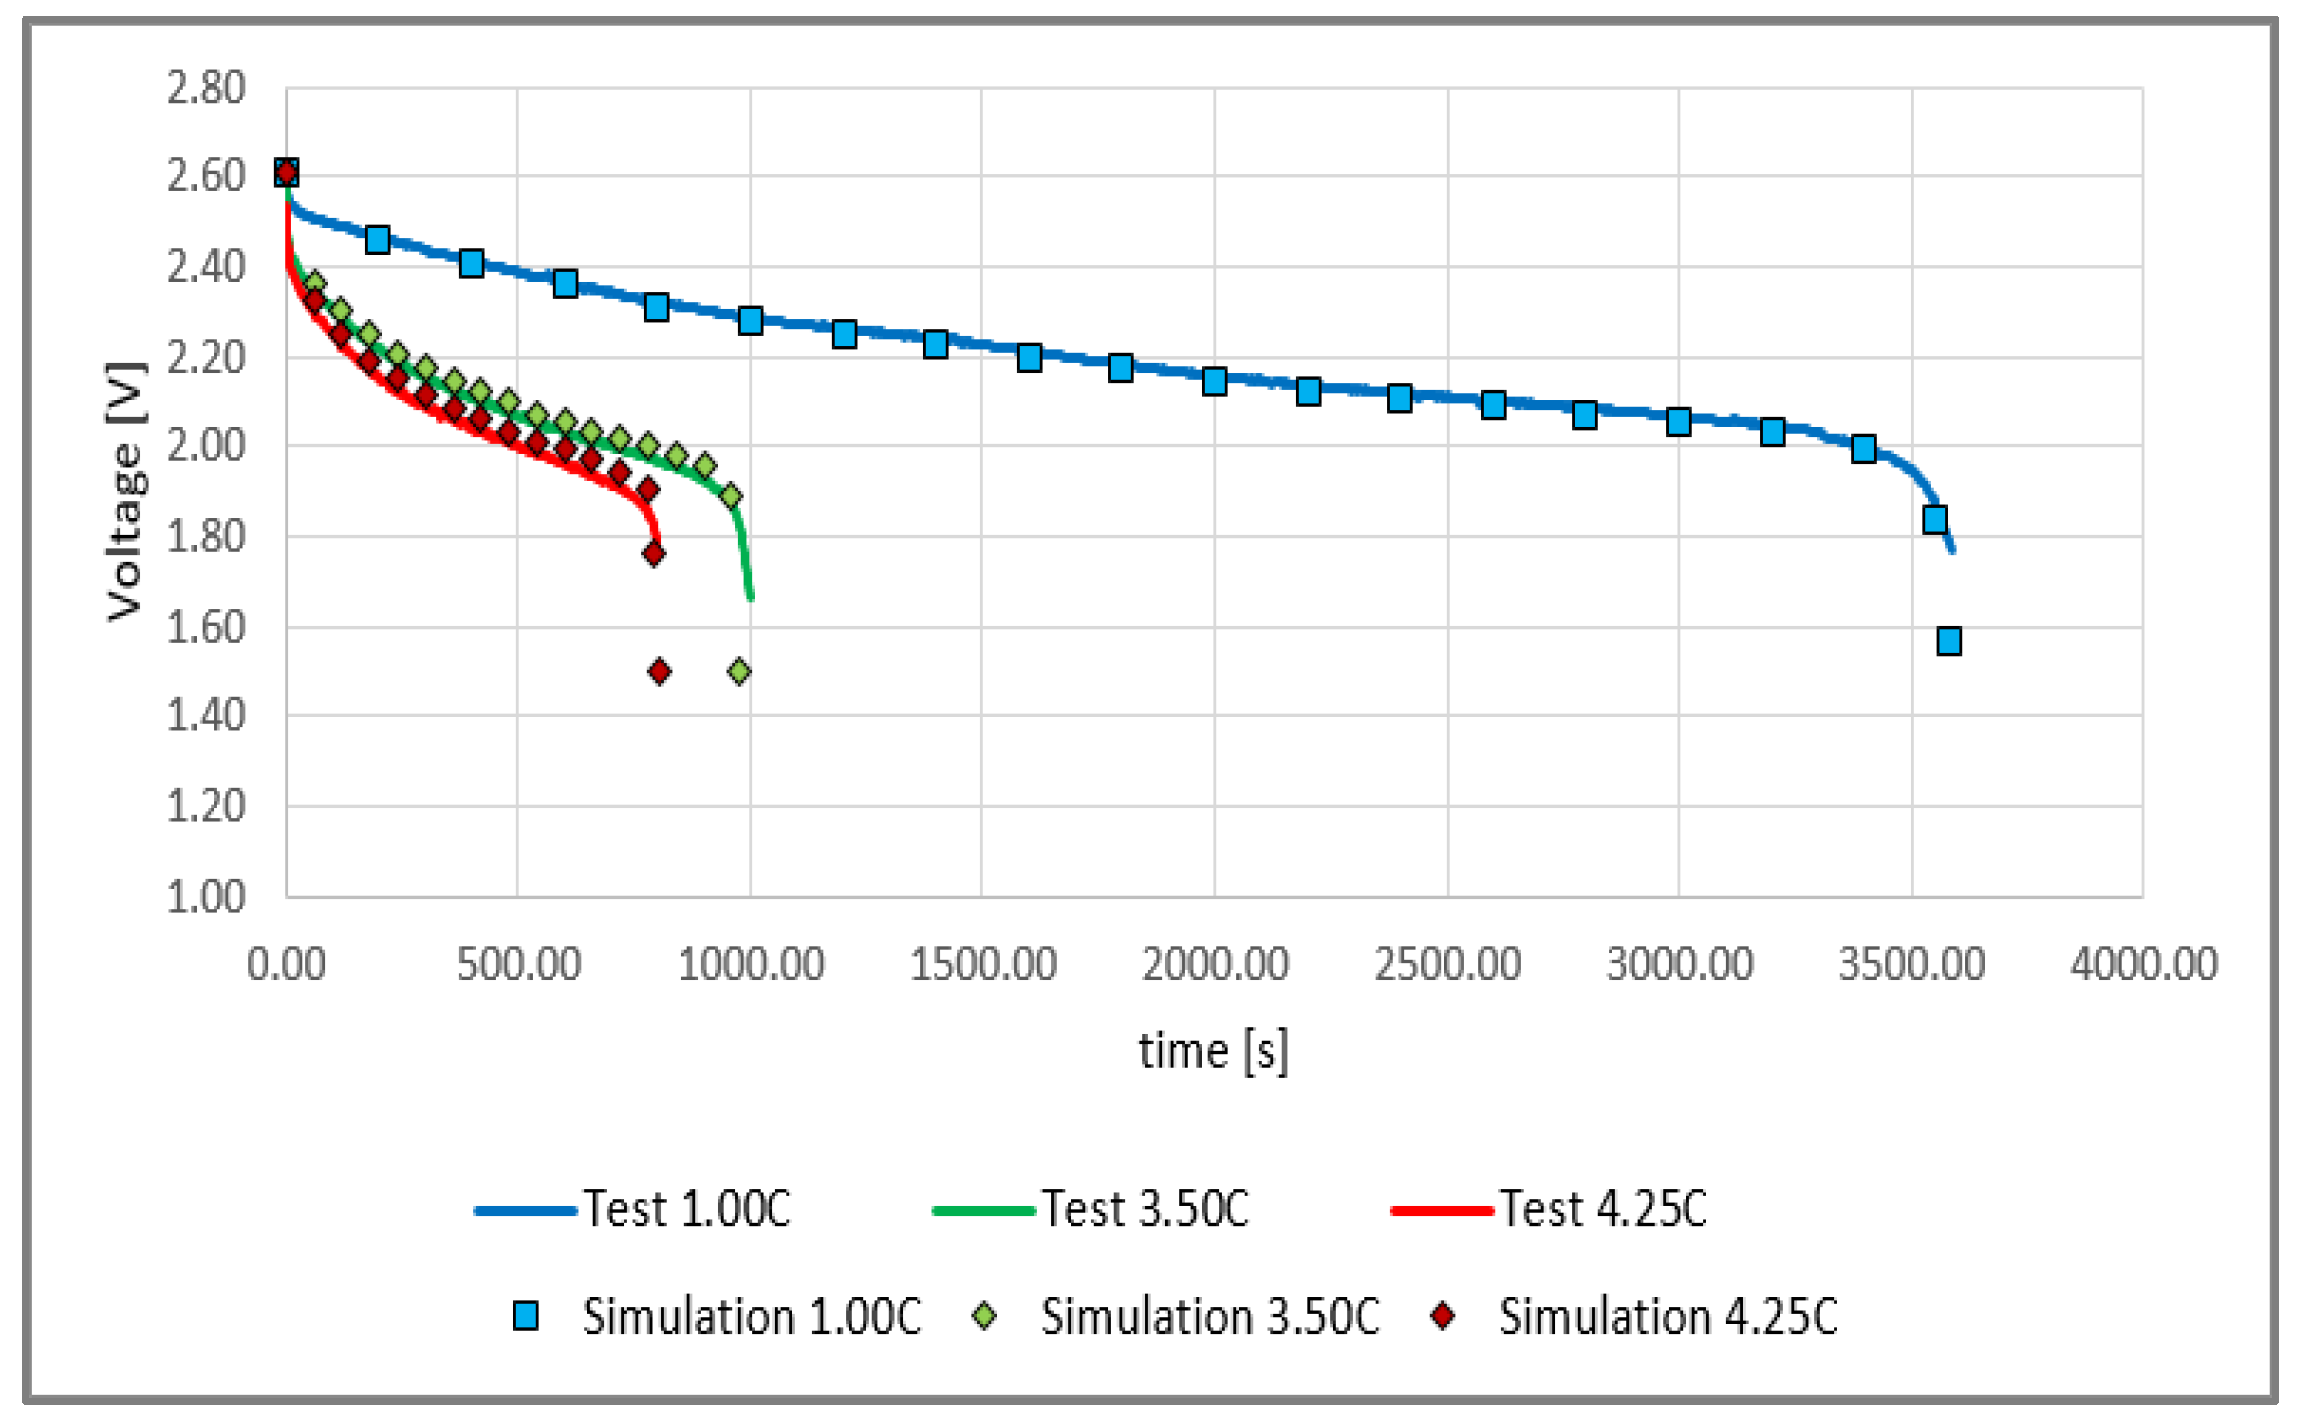
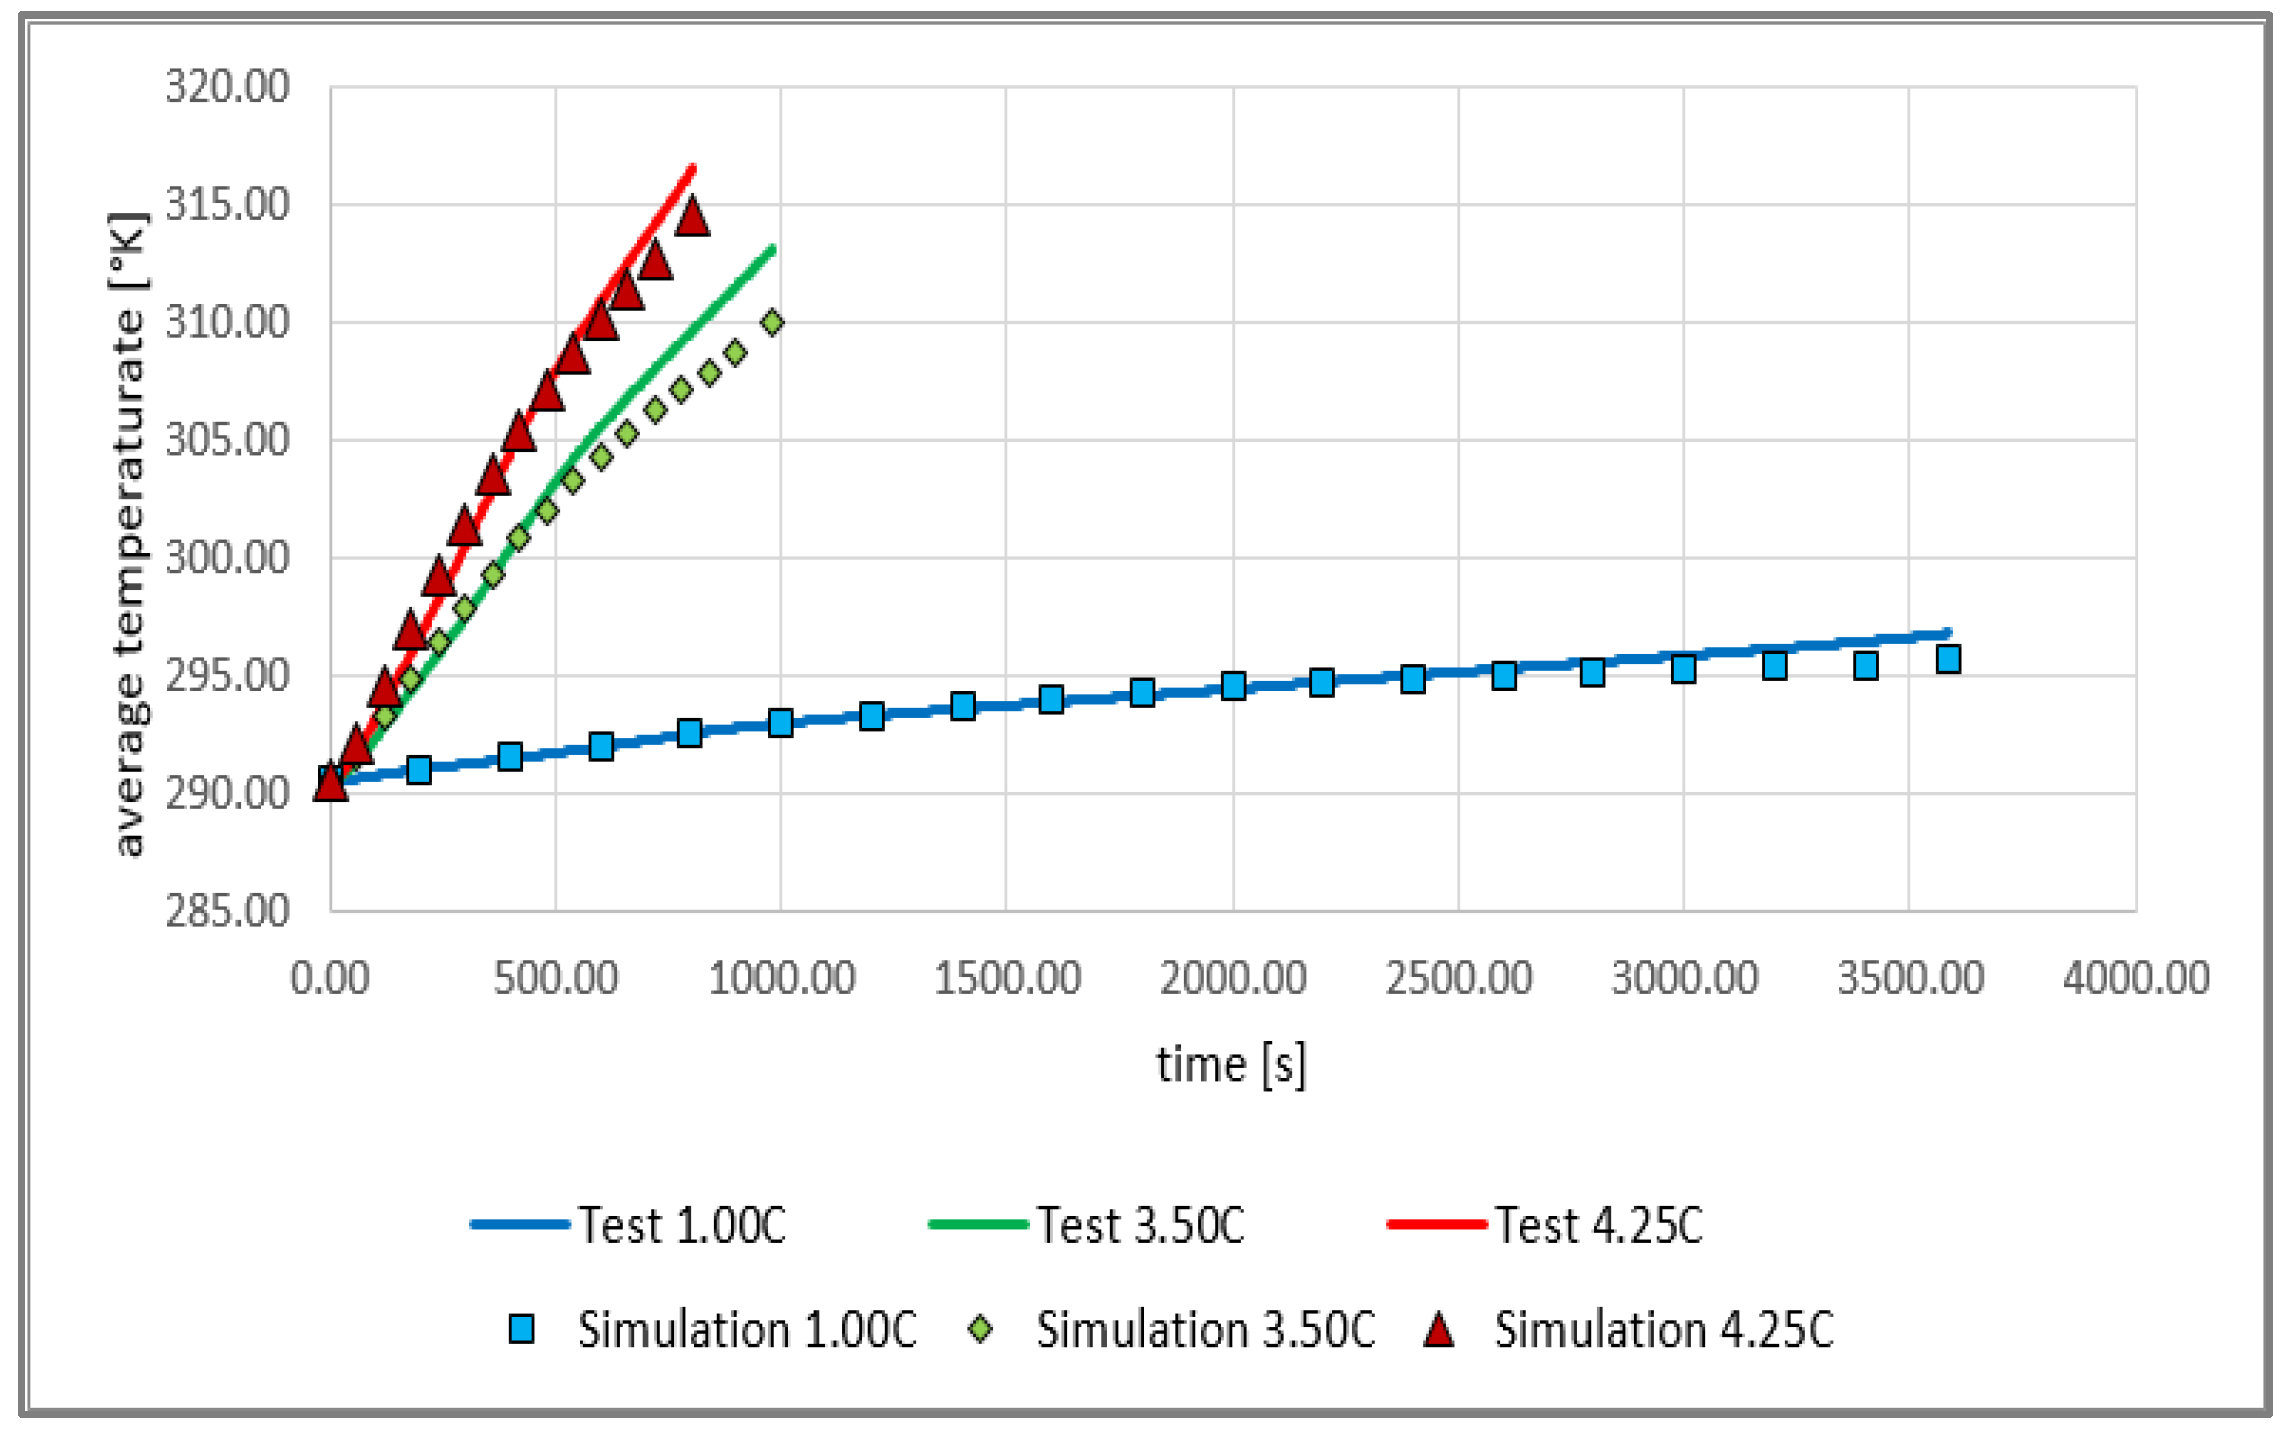
3.1. Comparisons of Experimental and Numerical Results
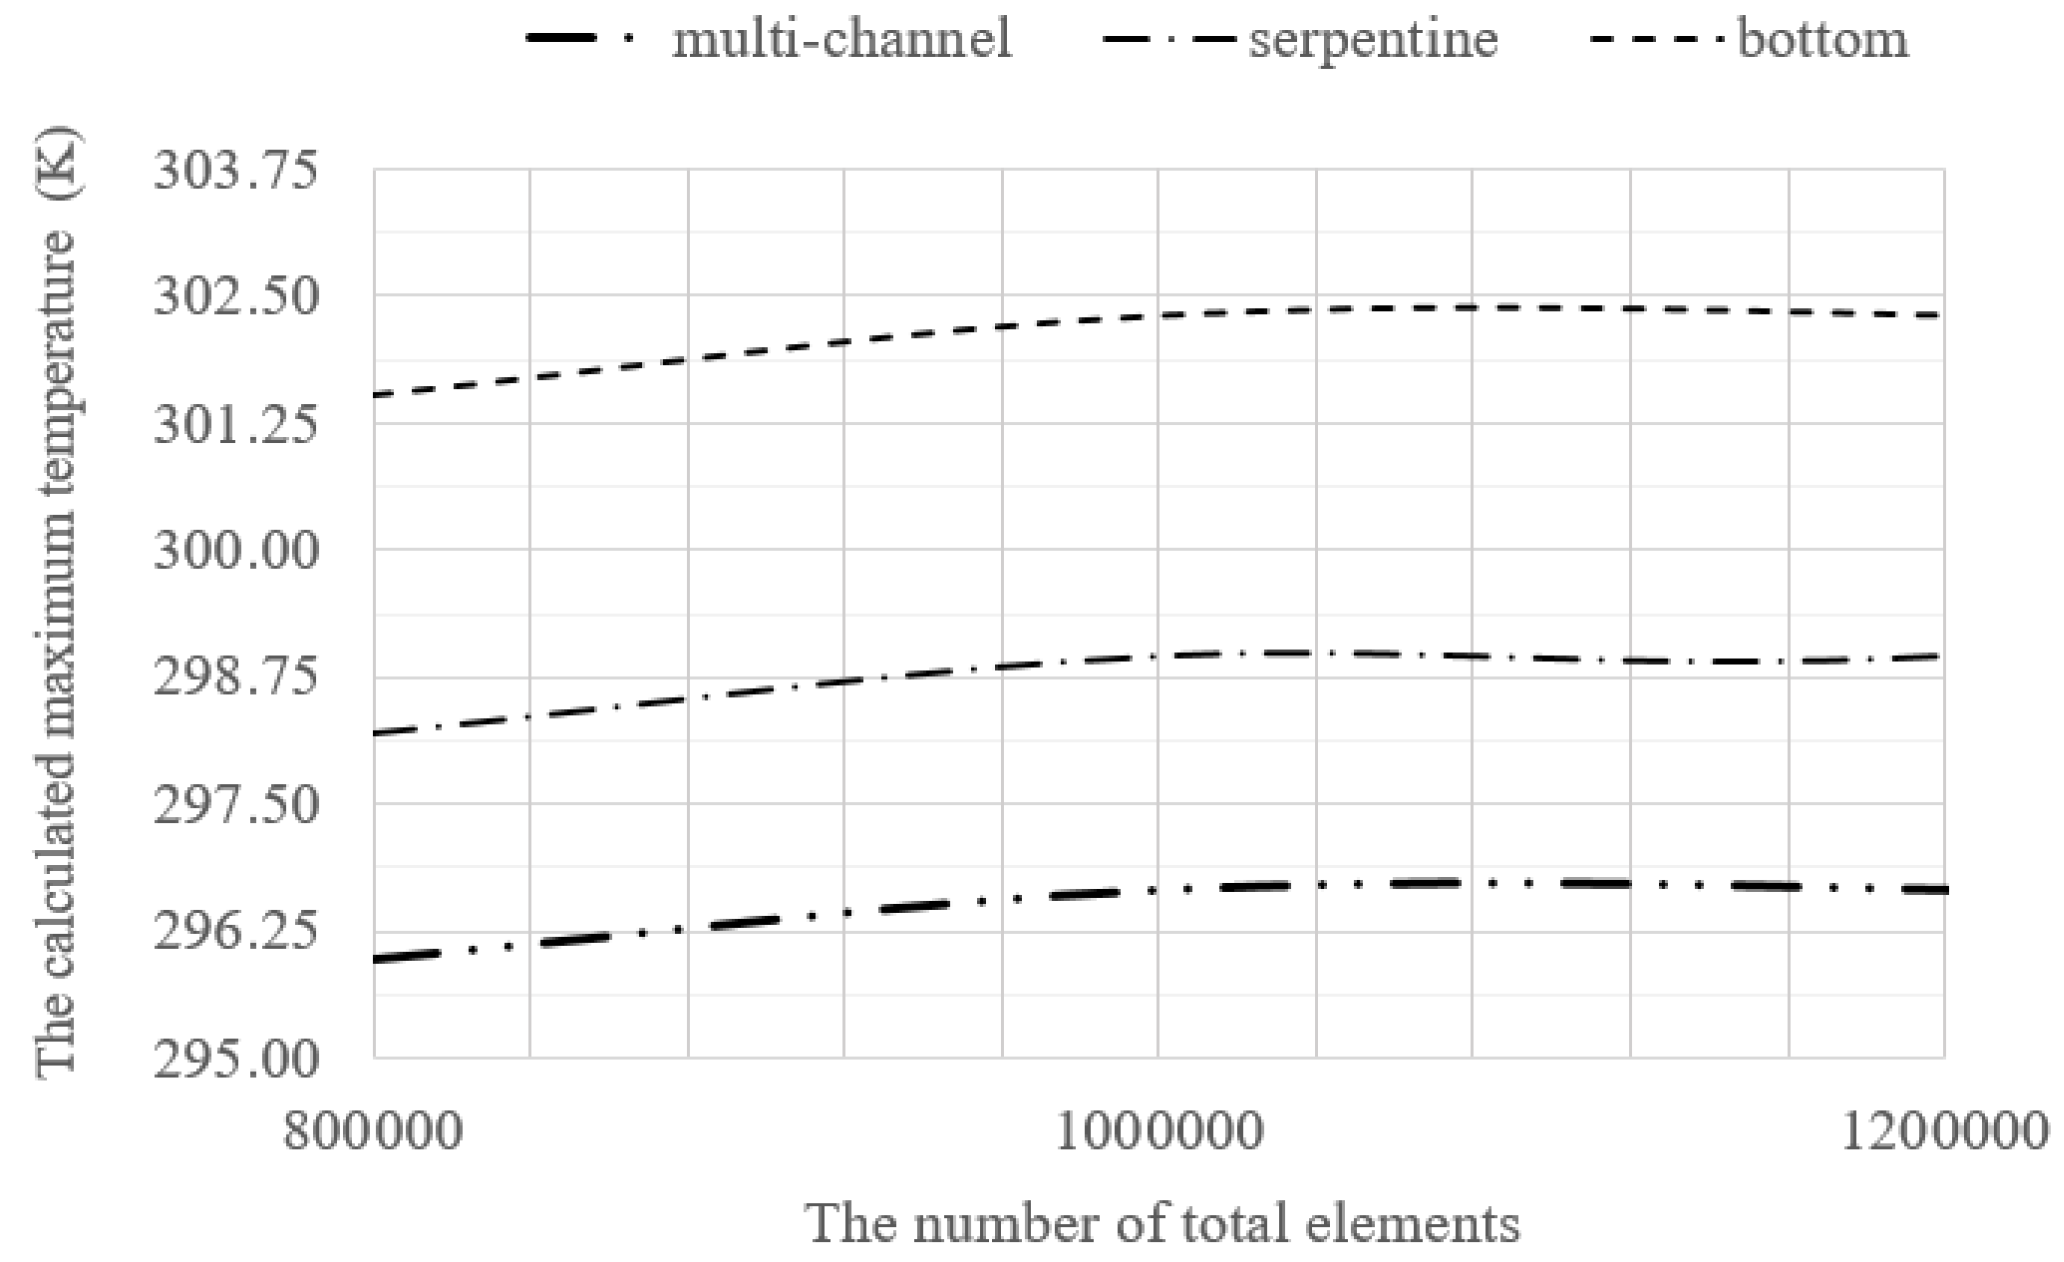
3.2. Mesh Independency Analysis
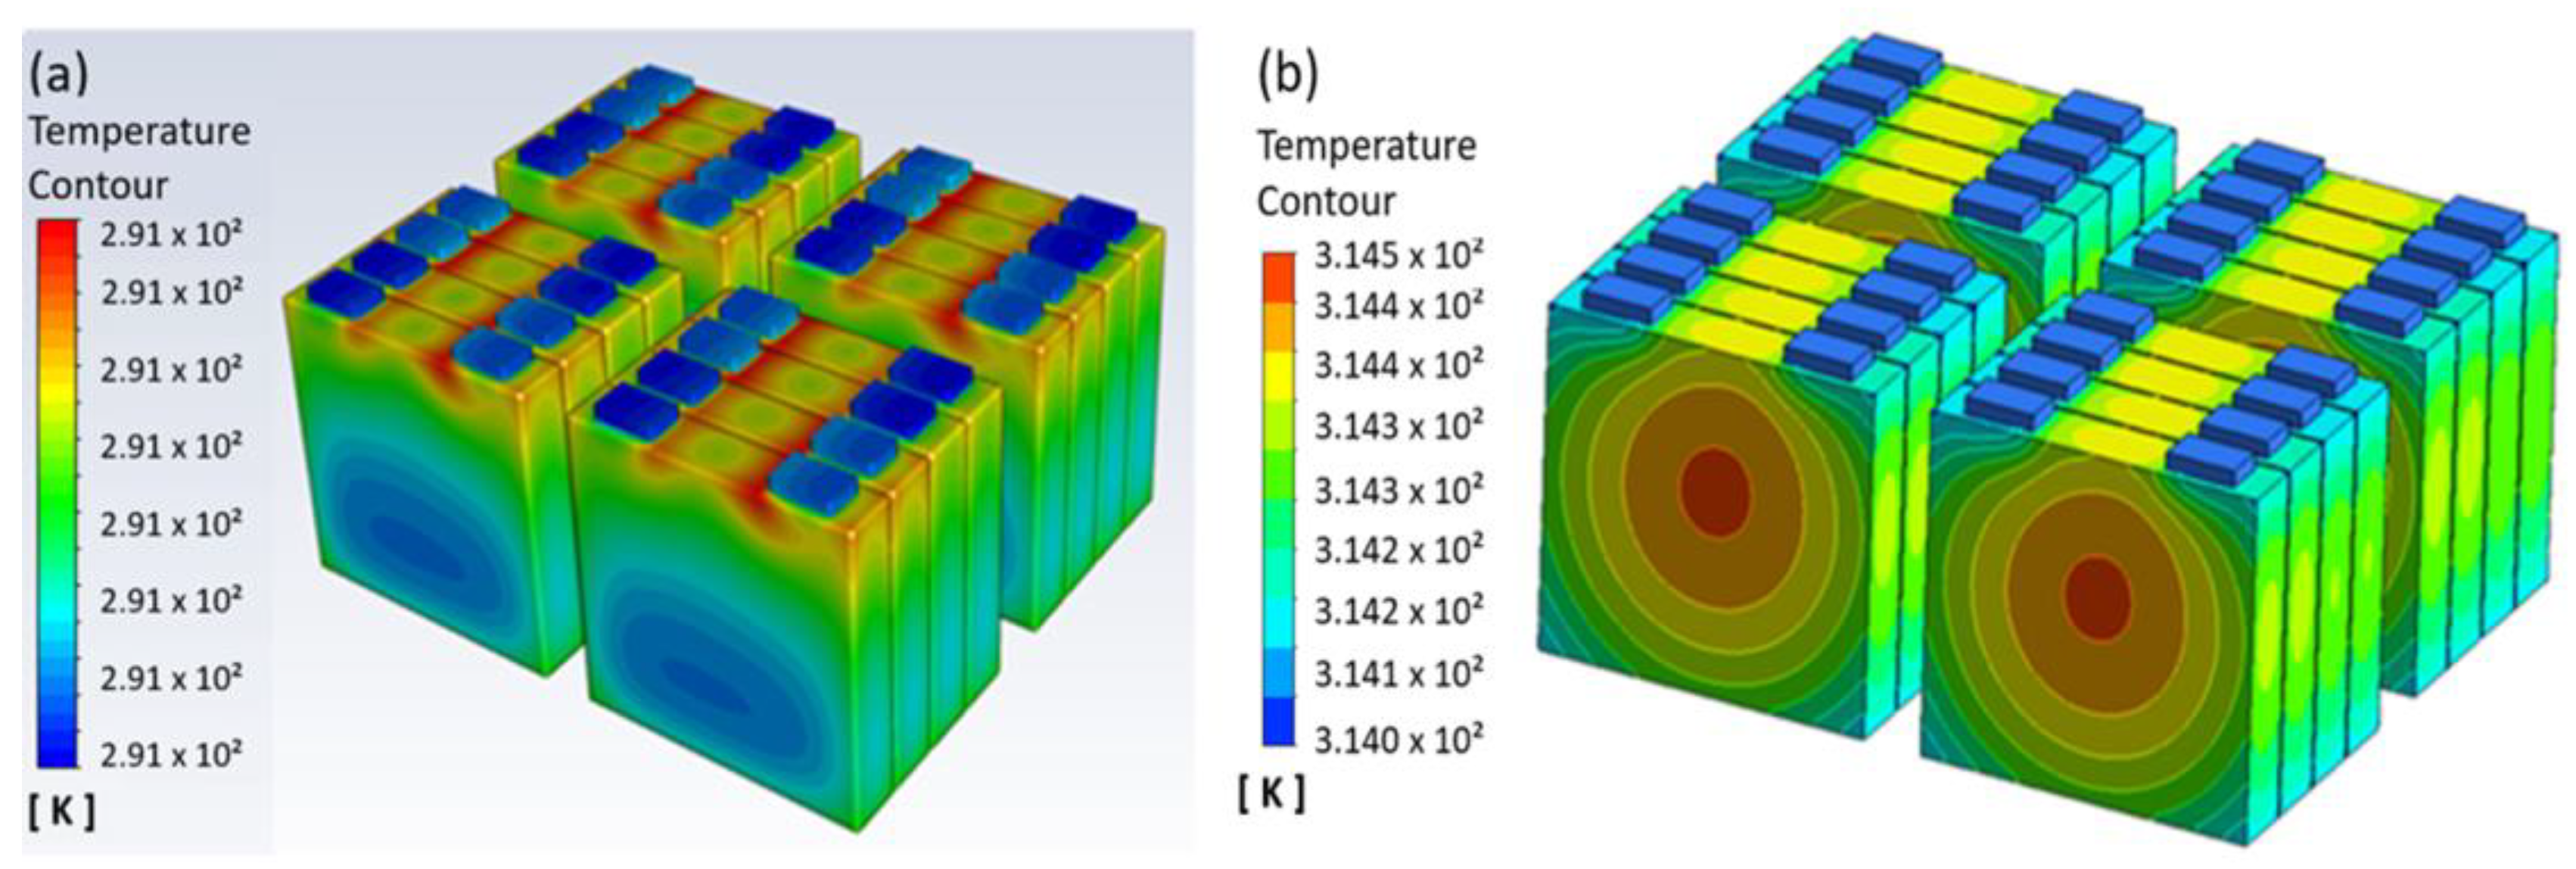
3.3. Numerical Analysis Results and Discussion
4. Conclusions
- A new higher-performance cold plate that has parallel water flow channels was designed for the thermal management of prismatic Li-ion battery cells in the present study.
- Using the multi-channel cold plate developed in this study, the temperature was reduced dramatically for higher discharging rates.
- A three-dimensional electro–thermal model that included flow and heat transfer analysis under transient conditions was developed for the evaluation of the thermal performance of three different liquid cold plates.
- The numerical simulation results were in good agreement with the experimental data so that for the battery module with the NTGK sub-model, flow and heat transfer analyses in transient numerical calculations were performed simultaneously for the cooling performance, apart from the heat generation models described in the literature.
- The results of this study contribute to the experimental setups considered in the laboratory environment, especially for prismatic cells such as LTO battery cells used in electric vehicles.
- Considering the cooling performance and temperature homogeneity, a new higher-performance cold plate was designed for the thermal management of prismatic Li-ion battery cells.
Author Contributions
Funding
Institutional Review Board Statement
Informed Consent Statement
Data Availability Statement
Acknowledgments
Conflicts of Interest
References
- Bach, W. Fossil Fuel Resources and Their Impacts on Environment and Climate. Int. J. Hydrogen Energy 1981, 6, 185–201. [Google Scholar] [CrossRef]
- Querini, F.; Dagostino, S.; Morel, S.; Rousseaux, P. Greenhouse Gas Emissions of Electric Vehicles Associated with Wind and Photovoltaic Electricity. Energy Procedia 2012, 20, 391–401. [Google Scholar] [CrossRef]
- Zhao, G.; Baker, J. Effects on Environmental Impacts of Introducing Electric Vehicle Batteries as Storage—A Case Study of the United Kingdom. Energy Strategy Rev. 2022, 40, 100819. [Google Scholar] [CrossRef]
- Miwa, T.; Sato, H.; Morikawa, T. Range and Battery Depletion Concerns with Electric Vehicles. J. Adv. Transp. 2017, 2017, 7491234. [Google Scholar] [CrossRef]
- Kostopoulos, E.D.; Spyropoulos, G.C.; Kaldellis, J.K. Real-World Study for the Optimal Charging of Electric Vehicles. Energy Rep. 2020, 6, 418–426. [Google Scholar] [CrossRef]
- Chakraborty, P.; Parker, R.; Hoque, T.; Du, L.; Wang, S.; Bhunia, S. Addressing the Range Anxiety of Battery Electric Vehicles with Charging En Route. Sci. Rep. 2022, 12, 5588. [Google Scholar] [CrossRef]
- Leng, F.; Tan, C.; Pecht, M. Effect of Temperature on the Aging Rate of Li Ion Battery Operating above Room Temperature. Sci. Rep. 2015, 5, 12967. [Google Scholar] [CrossRef]
- Lv, S.; Wang, X.; Lu, W.; Jiaqiao, Z.; Ni, H. The Influence of Temperature on the Capacity of Lithium Ion Batteries with Different Anodes. Energies 2021, 15, 60. [Google Scholar] [CrossRef]
- Ma, S.; Jiang, M.; Tao, P.; Song, C.; Wu, J.; Wang, J.; Deng, T.; Shang, W. Temperature Effect and Thermal Impact in Lithium-Ion Batteries: A Review. Prog. Nat. Sci. Mater. Int. 2018, 28, 653–666. [Google Scholar] [CrossRef]
- Ouyang, D.; He, Y.; Weng, J.; Liu, J.; Chen, M.; Wang, J. Influence of Low Temperature Conditions on Lithium-Ion Batteries and the Application of an Insulation Material. RSC Adv. 2019, 9, 9053–9066. [Google Scholar] [CrossRef]
- Wang, S.; Tang, Q.W.; Xie, H.; Li, C.; Zhang, J.; Jiang, L.; Wang, Q. Effects of Current and Ambient Temperature on Thermal Response of Lithium Ion Battery. Batteries 2022, 8, 203. [Google Scholar] [CrossRef]
- Previati, G.; Mastinu, G.; Gobbi, M. Thermal Management of Electrified Vehicles—A Review. Energies 2022, 15, 1326. [Google Scholar] [CrossRef]
- Sevilgen, G.; Kılıç, M.; Bayram, H.; Başak, E.; Dursun, H. The Investigation of the Multi-channel Hybrid Heat Pump System Designed and Prototyped for Heating Process of Electric Vehicles. AEJ Alex. Eng. J. 2023, 68, 417–435. [Google Scholar] [CrossRef]
- Kök, C.; Alkaya, A. Investigation of Thermal Behavior of Lithium-Ion Batteries under Different Loads. Eur. Mech. Sci. 2020, 4, 96–102. [Google Scholar] [CrossRef]
- Sevilgen, G.; Kiliç, M.; Aktaş, M. Dual-Separated Cooling Channel Performance Evaluation for High-Power Led Pcb in Automotive Headlight. Case Stud. Therm. Eng. 2021, 25, 100985. [Google Scholar] [CrossRef]
- Bulut, E.; Albak, E.İ.; Sevilgen, G.; Öztürk, F. Prediction and Optimization of the Design Decisions of Liquid Cooling Systems of Battery Modules Using Artificial Neural Networks. Int. J. Energy Res. 2022, 46, 7293–7308. [Google Scholar] [CrossRef]
- Bulut, E.; Albak, E.; Sevilgen, G.; Öztürk, F. A New Approach for Battery Thermal Management System Design Based on Grey Relational Analysis and Latin Hypercube Sampling. Case Stud. Therm. Eng. 2021, 28, 101452. [Google Scholar] [CrossRef]
- Tran, T.-H.; Harmand, S.; Desmet, B.; Filangi, S. Experimental Investigation on the Feasibility of Heat Pipe Cooling for HEV/EV Lithium-Ion Battery. Appl. Therm. Eng. 2014, 63, 551–558. [Google Scholar] [CrossRef]
- Ye, Y.; Saw, B.; Lip, H.; Yixiang, S.; Tay, A.A.O. Numerical Analyses on Optimizing a Heat Pipe Thermal Management System for Lithium-Ion Batteries during Fast Charging. Appl. Therm. Eng. 2015, 86, 281–291. [Google Scholar] [CrossRef]
- Galeotti, M.; Cinà, L.; Giammanco, C.; Cordiner, S.; Di Carlo, A. Performance Analysis and SOH (State of Health) Evaluation of Lithium Polymer Batteries through Electrochemical Impedance Spectroscopy. Energy 2015, 89, 678–686. [Google Scholar] [CrossRef]
- Chang, W.; Bommier, C.; Fair, T.; Yeung, J.; Patil, S.; Steingart, D. Understanding Adverse Effects of Temperature Shifts on Li-Ion Batteries: An Operando Acoustic Study. J. Electrochem. Soc. 2020, 167, 090503. [Google Scholar] [CrossRef]
- Sim, S.-B.; Lee, C.-H.; Si-kuk, K. Study on the Explosion and Fire Risks of Lithium Batteries Due to High Temperature and Short Circuit Current. Fire Sci. Eng. 2016, 30, 114–122. [Google Scholar] [CrossRef]
- Henriksen, M.; Vaagsaether, K.; Lundberg, J.; Forseth, S.; Bjerketvedt, D. Explosion Characteristics for Li-Ion Battery Electrolytes at Elevated Temperatures. J. Hazard. Mater. 2019, 371, 1–7. [Google Scholar] [CrossRef] [PubMed]
- Rao, Z.; Qian, Z.; Kuang, Y.; Li, Y. Thermal Performance of Liquid Cooling Based Thermal Management System for Cylindrical Lithium-Ion Battery Module with Variable Contact Surface. Appl. Therm. Eng. 2017, 123, 1514–1522. [Google Scholar] [CrossRef]
- Dan, D.; Zhao, Y.; Wei, M.; Wang, X. Review of Thermal Management Technology for Electric Vehicles. Energies 2023, 16, 4693. [Google Scholar] [CrossRef]
- Wang, T.; Tseng, K.J.; Zhao, J.; Wei, Z. Thermal investigation of lithium-ion battery module with different cell arrangement structures and forced air-cooling strategies. Appl. Energy 2014, 134, 229–238. [Google Scholar] [CrossRef]
- Chen, K.-H.; Han, T.; Khalighi, B.; Klaus, P. Air Cooling Concepts for Li-Ion Battery Pack in Cell Level. In Proceedings of the ASME 2017 Heat Transfer Summer Conference, Volume 1: Aerospace Heat Transfer; Computational Heat Transfer; Education; Environmental Heat Transfer; Fire and Combustion Systems; Gas Turbine Heat Transfer; Heat Transfer in Electronic Equipment; Heat Transfer in Energy Systems, Bellevue, DC, USA, 9–12 July 2017. [Google Scholar] [CrossRef]
- Gungor, S. Analytical and Numerical Investigations on Optimal Cell Spacing for Air-Cooled Energy Storage Systems. Int. J. Therm. Sci. 2023, 191, 108332. [Google Scholar] [CrossRef]
- Hasan, H.A.; Togun, H.; Abed, A.M.; Biswas, N.; Mohammed, H.I. Thermal Performance Assessment for an Array of Cylindrical Lithium-Ion Battery Cells Using an Air-Cooling System. Appl. Energy 2023, 346, 121354. [Google Scholar] [CrossRef]
- Saechan, P.; Dhuchakallaya, I. Numerical Study on the Air-Cooled Thermal Management of Lithium-Ion Battery Pack for Electrical Vehicles. Energy Rep. 2022, 8, 1264–1270. [Google Scholar] [CrossRef]
- Kummitha, O.R. Thermal Cooling of Li-Ion Cylindrical Cells Battery Module with Baffles Arrangement for Airflow Cooling Numerical Analysis. J. Energy Storage 2023, 59, 106474. [Google Scholar] [CrossRef]
- Mei, N.; Xu, X.; Li, R. Heat Dissipation Analysis on the Liquid Cooling System Coupled with a Flat Heat Pipe of a Lithium-Ion Battery. ACS Omega 2020, 5, 17431–17444. [Google Scholar] [CrossRef]
- Saw, L.H.; Tay, A.A.O.; Zhang, L.W. Thermal management of lithium-ion battery pack with liquid cooling. In Proceedings of the 2015 31st Thermal Measurement, Modeling & Management Symposium (SEMI-THERM), San Jose, CA, USA, 15–19 March 2015; pp. 298–302. [Google Scholar] [CrossRef]
- Peng, W.; Xu, H.; Xu, X.; Pan, C. Design and Simulation of Liquid Cooled System for Power Battery of PHEV. IOP Conf. Ser. Mater. Sci. Eng. 2017, 231, 012025. [Google Scholar] [CrossRef]
- Kılıç, M.; Gamsız, S.; Alınca, Z.N. Comparative Evaluation and Multi-Objective Optimization of Cold Plate Designed for the Lithium-Ion Battery Pack of an Electrical Pickup by Using Taguchi–Grey Relational Analysis. Sustainability 2023, 15, 12391. [Google Scholar] [CrossRef]
- Rao, Z.; Wang, S.; Zhang, G. Simulation and Experiment of Thermal Energy Management with Phase Change Material for Ageing LiFePO 4 Power Battery. Energy Convers. Manag. 2011, 52, 3408–3414. [Google Scholar] [CrossRef]
- Aslan, E.; Aydın, Y.; Ya¸sa, Y. Consideration of Graphene Material in PCM with Aluminum Fin Structure for Improving the Battery Cooling Performance. Int. J. Energy Res. 2022, 46, 10758–10769. [Google Scholar] [CrossRef]
- Joula, M.; Dilibal, S.; Mafratoglu, G.; Danquah, J.O.; Alipour, M. Hybrid Battery Thermal Management System with NiTi SMA and Phase Change Material (PCM) for Li-Ion Batteries. Energies 2022, 15, 4403. [Google Scholar] [CrossRef]
- Chen, J.; Kang, S.; Jiaqiang, E.; Huang, Z.; Wei, K.; Zhang, B.; Zhu, H.; Deng, Y.; Zhang, F.; Liao, G. Effects of Different Phase Change Material Thermal Management Strategies on the Cooling Performance of the Power Lithium Ion Batteries: A Review. J. Power Sources 2019, 442, 227228. [Google Scholar] [CrossRef]
- Mbulu, H.; Laoonual, Y.; Wongwises, S. Experimental Study on the Thermal Performance of a Battery Thermal Management System Using Heat Pipes. Case Stud. Therm. Eng. 2021, 26, 101029. [Google Scholar] [CrossRef]
- Lv, W.; Li, J.; Chen, M. Experimental Study on the Thermal Management Performance of a Power Battery Module with a Pulsating Heat Pipe under Different Thermal Management Strategies. Appl. Therm. Eng. 2023, 227, 120402. [Google Scholar] [CrossRef]
- Pakrouh, R.; Hosseini, M.J.; Ranjbar, A.A.; Rahimi, M. A Novel Liquid-Based Battery Thermal Management System Coupling with Phase Change Material and Thermoelectric Cooling. J. Energy Storage 2023, 64, 107098. [Google Scholar] [CrossRef]
- Chen, D.; Jiang, J.; Kim, G.-H.; Yang, C.; Pesaran, A. Comparison of Different Cooling Methods for Lithium Ion Battery Cells. Appl. Therm. Eng. 2015, 94, 846–854. [Google Scholar] [CrossRef]
- Deng, Y.; Feng, C.; Jiaqiang, E.; Zhu, H.; Chen, J.; Wen, M.; Yin, H. Effects of Different Coolants and Cooling Strategies on the Cooling Performance of the Power Lithium Ion Battery System: A Review. Appl. Therm. Eng. 2018, 142, 10–29. [Google Scholar] [CrossRef]
- Larrañaga, M.; Vertiz, G.; Fernandez Arroiabe, P.; Martinez Agirre, M.; Berasategi, J. A Novel Direct Liquid Cooling Strategy for Electric Vehicles Focused on Pouch Type Battery Cells. Appl. Therm. Eng. 2022, 216, 118869. [Google Scholar] [CrossRef]
- Dubey, P.; Pulugundla, G.; Srouji, A.K. Direct Comparison of Immersion and Cold-Plate based Cooling for Automotive Li-Ion Battery Modules. Energies 2021, 14, 1259. [Google Scholar] [CrossRef]
- Wang, C.; Zhang, G.; Meng, L.; Li, X.; Situ, W.; Lv, Y.; Rao, M. Liquid cooling based on thermal silica plate for battery thermal management system. Int. J. Energy Res. 2017, 41, 2468–2479. [Google Scholar] [CrossRef]
- Yeow, K.; Teng, H.; Thelliez, M.; Tan, E. Comparative Study on Thermal Behavior of Lithium-Ion Battery Systems with Indirect Air Cooling and Indirect Liquid Cooling. In Proceedings of the ASME/ISCIE 2012 International Symposium on Flexible Automation, St. Louis, MI, USA, 18–20 June 2012; ASME: New York, NY, USA, 2012; pp. 585–591. [Google Scholar] [CrossRef]
- Chen, M.; on-Mora, G. Accurate Electrical Battery Model Capable of Predicting Runtime and I–V Performance. IEEE Trans. Energy Convers. 2006, 21, 504–511. [Google Scholar] [CrossRef]
- Kim, U.; Shin, C.B.; Kim, C.-S. Modeling for the Scale-up of a Lithium-Ion Polymer Battery. J. Power Sources 2009, 189, 841–846. [Google Scholar] [CrossRef]
- Ho, T.; Chang, K.; Lee, S.; Kim, S. Transient Thermal Analysis of a Li-Ion Battery Module for Electric Cars Based on Various Cooling Fan Arrangements. Energies 2020, 13, 2387. [Google Scholar] [CrossRef]
- Shetty, D.D.; Sulthan, M.; Zuber, M.; Badruddin, I.A.; Kini, C.R. Computational Design and Analysis of a Novel Battery Thermal Management System of a Single 26650 Li-Ion Battery Cell for Electric Vehicle Application. J. Adv. Res. Fluid Mech. Therm. Sci. 2022, 93, 61–75. [Google Scholar] [CrossRef]
- Akbarzadeh, M.; Jaguemont, J.; Van Mierlo, J.; Berecibar, M. Experimental Analysis of a Liquid-Based Cooling System for Fast Charging of a High-Power Lithium Ion Cell. Energy Perspect. 2021, 2, 1–13. [Google Scholar]
- Avila, A.; Lucu, M.; Garcia-Bediaga, A.; Ibarguren, U.; Gandiaga, I.; Rujas, A. Hybrid Energy Storage System Based on Li-Ion and Li-S Battery Modules and GaN-Based DC-DC Converter. IEEE Access 2021, 9, 132342–132353. [Google Scholar] [CrossRef]
- Panchal, S.; Dincer, I.; Agelin-Chaab, M.; Fraser, R.; Fowler, M. Thermal Modeling and Validation of Temperature Distributions in a Prismatic Lithium-Ion Battery at Different Discharge Rates and Varying Boundary Conditions. Appl. Therm. Eng. 2016, 96, 190–199. [Google Scholar] [CrossRef]
- Behi, H.; Karimi, D.; Kalogiannis, T.; He, J.; Patil, M.S.; Muller, J.D.; Haider, A.; Mierlo, J.V.; Berecibar, M. Advanced hybrid thermal management system for LTO battery module under fast charging. Case Stud. Therm. Eng. 2022, 33, 101938. [Google Scholar] [CrossRef]
- Waag, W.; Sauer, D.U. Secondary Batteries–Lead–Acid Systems, State-of-Charge/Health. Encycl. Electrochem. Power Sources 2009, 793–804. [Google Scholar] [CrossRef]
- Zhang, F.; Xing, Z.; Wu, M. State of health estimation for Li-ion battery using characteristic voltage intervals and genetic algorithm optimized back propagation neural network. J. Energy Storage 2023, 57, 106277. [Google Scholar]
- Moffat, R.J. Describing the uncertainties in experimental results. Exp. Therm. Fluid Sci. 1988, 1, 3–17. [Google Scholar] [CrossRef]
- Hosen, M.S.; Pirooz, A.; Kalogiannis, T.; He, J.; Van Mierlo, J.; Berecibar, M. A Strategic Pathway from Cell to Pack-Level Battery Lifetime Model Development. Appl. Sci. 2022, 12, 4781. [Google Scholar] [CrossRef]
- Madani, S.S.; Swierczynski, M.; Kær, S. The discharge behavior of lithium-ion batteries using the Dual-Potential Multi-Scale Multi-Dimensional (MSMD) Battery Model. In Proceedings of the 2017 Twelfth International Conference on Ecological Vehicles and Renewable Energies (EVER), Monte Carlo, Monaco, 11–13 April 2017; pp. 1–14. [Google Scholar] [CrossRef]
- ANSYS Fluent Advanced Add-On Modules|PDF|Proton Exchange Membrane Fuel Cell|Anode. Scribd. Available online: https://www.scribd.com/document/344930548/ANSYS-Fluent-Advanced-Add-On-Modules (accessed on 15 August 2023).
- ANSYS Fluent Theory Guide|PDF|Fluid Dynamics|Fluid Mechanics. Scribd. Available online: https://www.scribd.com/document/230104948/ANSYS-Fluent-Theory-Guide (accessed on 15 August 2023).
- Kwon, K.; Shin, C.B.; Kang, T.; Kim, C.-S. A Two-Dimensional Modeling of a Lithium-Polymer Battery. J. Power Sources 2006, 163, 151–157. [Google Scholar] [CrossRef]
- Paccha-Herrera, E.; Calderón-Muñoz, W.; Orchard, M.; Jaramillo Montoya, F.; Medjaher, K. Correction: Paccha-Herrera et al. Thermal Modeling Approaches for a LiCoO2 Lithium-Ion Battery—A Comparative Study with Experimental Validation. Batteries 2020, 6, 40, Erratum in Batteries 2021, 7, 43. [Google Scholar] [CrossRef]
- Xia, B.; Ye, B.; Cao, J. Polarization Voltage Characterization of Lithium-Ion Batteries Based on a Lumped Diffusion Model and Joint Parameter Estimation Algorithm. Energies 2022, 15, 1150. [Google Scholar] [CrossRef]


| Properties | Li-Ion Cell |
|---|---|
| The number of cells | 16 |
| The total discharge current | 46 A, 161 A, 197 A |
| The nominal total voltage | 18.4 V |
| The nominal capacity | 3.63 kWh |
| The capacity ratio | 33% |
| The charging current and time | 5 A/10 h |
| Cool down duration | 2 h |
| Type of Device | Measuring Range | Accuracy |
|---|---|---|
| Internal temperature sensor | −50 °C/+400 °C | ±0.01 °C |
| Current sensor | 0–250 A | ±1.0% |
| Temperature sensors | −25 °C/+200 °C | ±0.1 °C |
| Surfaces or Domains | Boundary Conditions |
| Supply temperature of coolant | Constant temperature value of 290.5 K |
| Outlet surface of cooling block | Gauge pressure equals to 0 Pa |
| Mass flow rate of coolant at the main inlet section | 0.01 kg/s |
| Battery module with 16 cells | NTGK model |
| Outer surfaces of solid domains contact with air | Free convection boundary condition |
| Flow conditions | Laminar flow with unsteady conditions |
| Ambient temperature | 293 K |
| Material Type | Solid Domains |
| Multi-channel cold plate | Aluminum |
| Serpentine channel | Copper tube with aluminum cold plate |
| Bottom cold plate | Copper tube with aluminum cold plate |
| Outer surfaces of all cold plates | Convection boundary condition |
| Properties | Aluminum (Positive Tab) | Steel (Negative Tab) | Jelly Roll (Active Zone) |
|---|---|---|---|
| Density (kg/m3) | 2719 | 8030.0 | 2226 |
| Specific heat (J/kg-K) | 871 | 502.48 | 1197 |
| Thermal conductivity (W/mK) | 202.4 | 16.27 | 27 |
| Electrical conductivity (S/m) | 3.541 × | 8.33 × | 1.19 × 10⁶, 9.83 × 10⁵ |
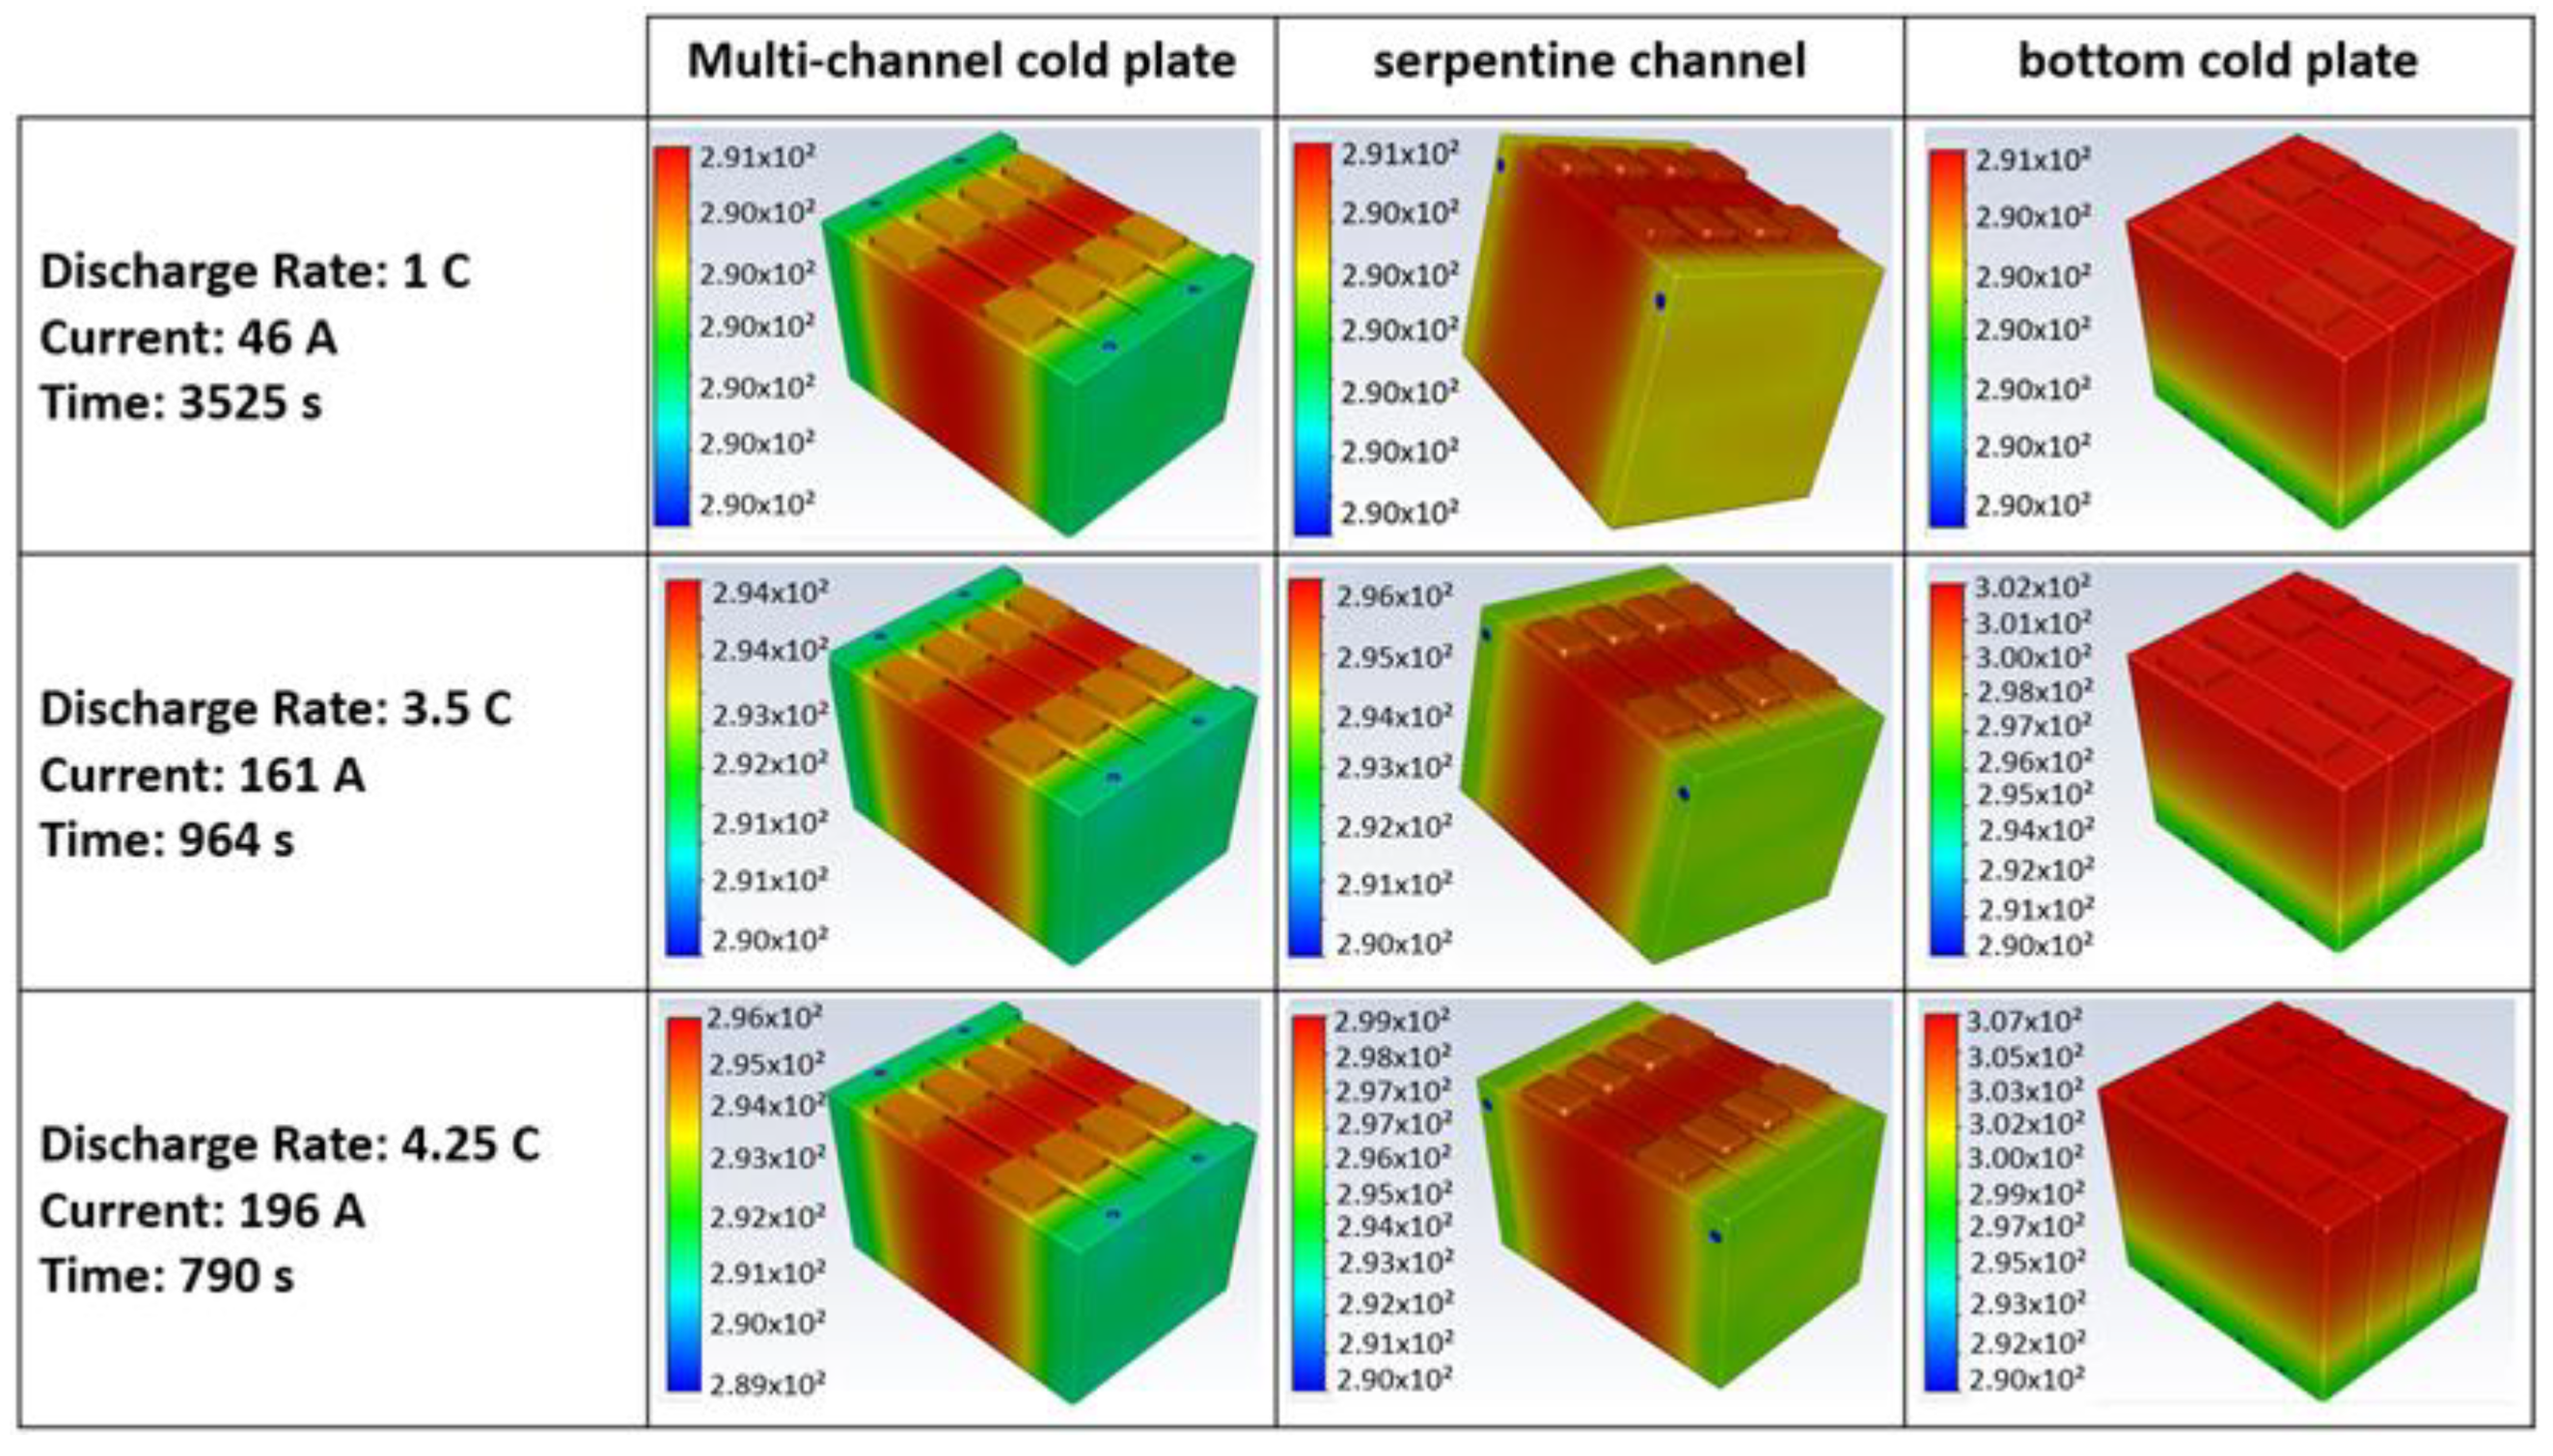
| Discharge Rate | Average Temperature (K) | Maximum Temperature (K) | Average Temperature Decrease (K) | |
|---|---|---|---|---|
| Without cooling | 1.00 C | 295.70 | 297.12 | - |
| 3.50 C | 309.89 | 313.23 | - | |
| 4.25 C | 314.57 | 321.53 | - | |
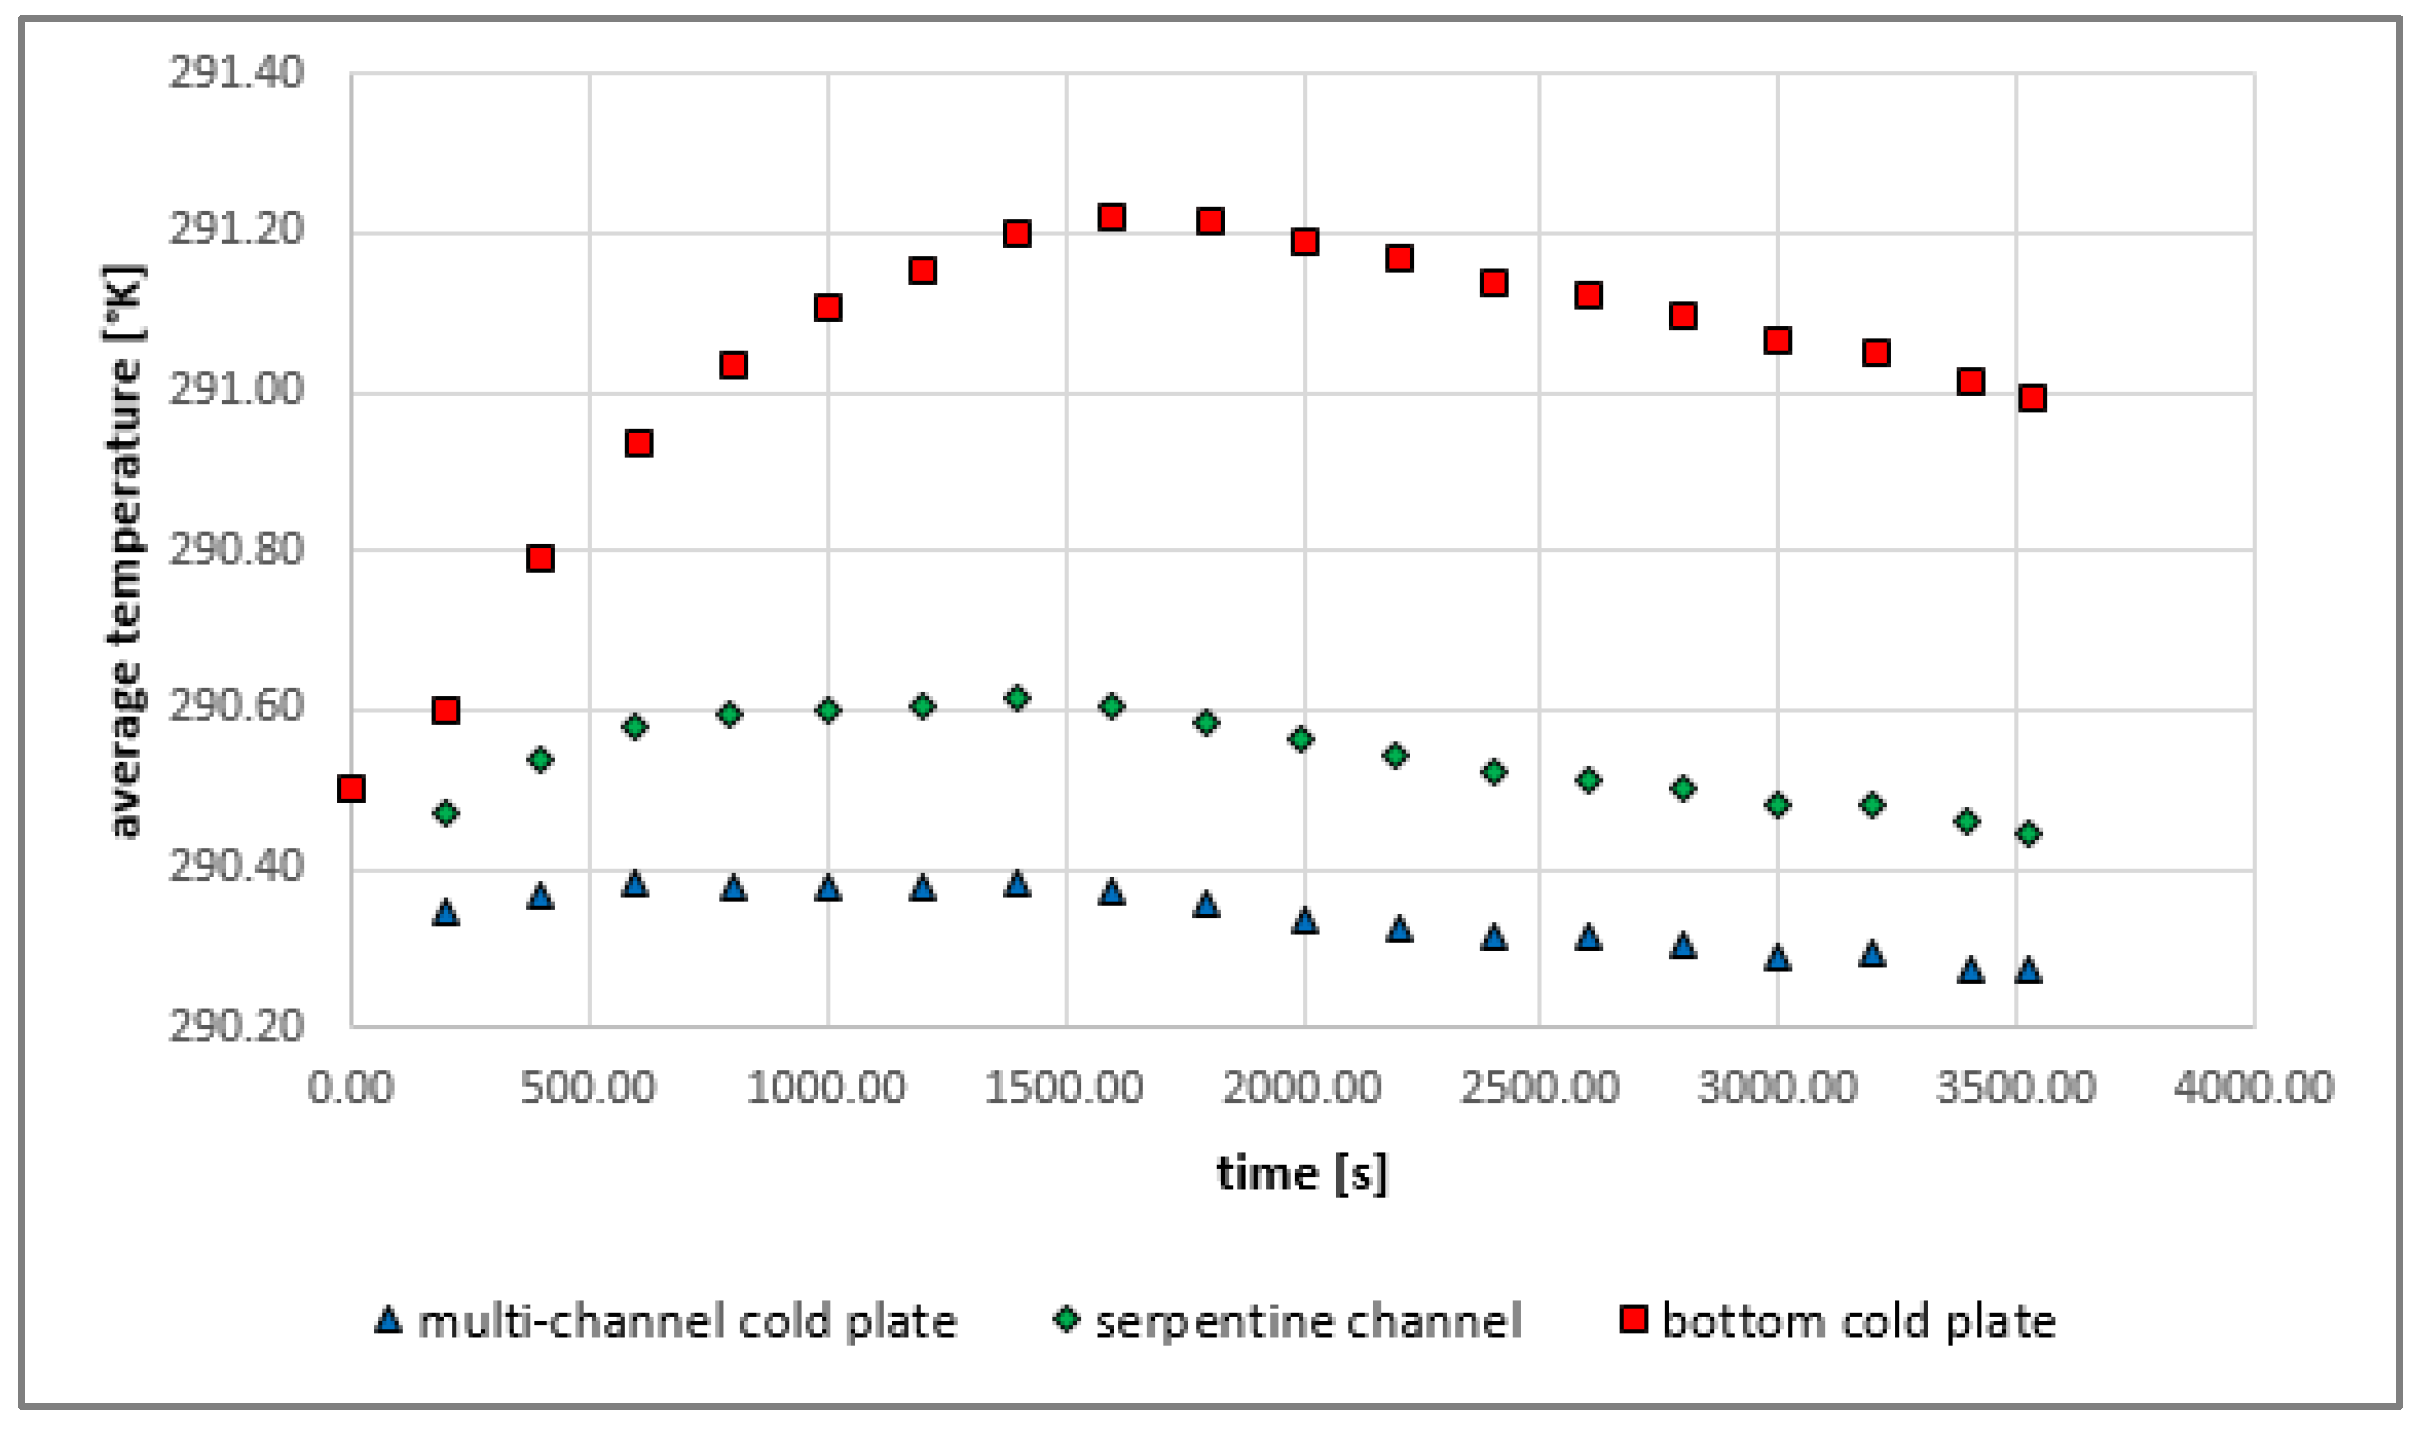
| Multi-channel cold plate | 1.00 C | 290.44 | 291.12 | 5.26 |
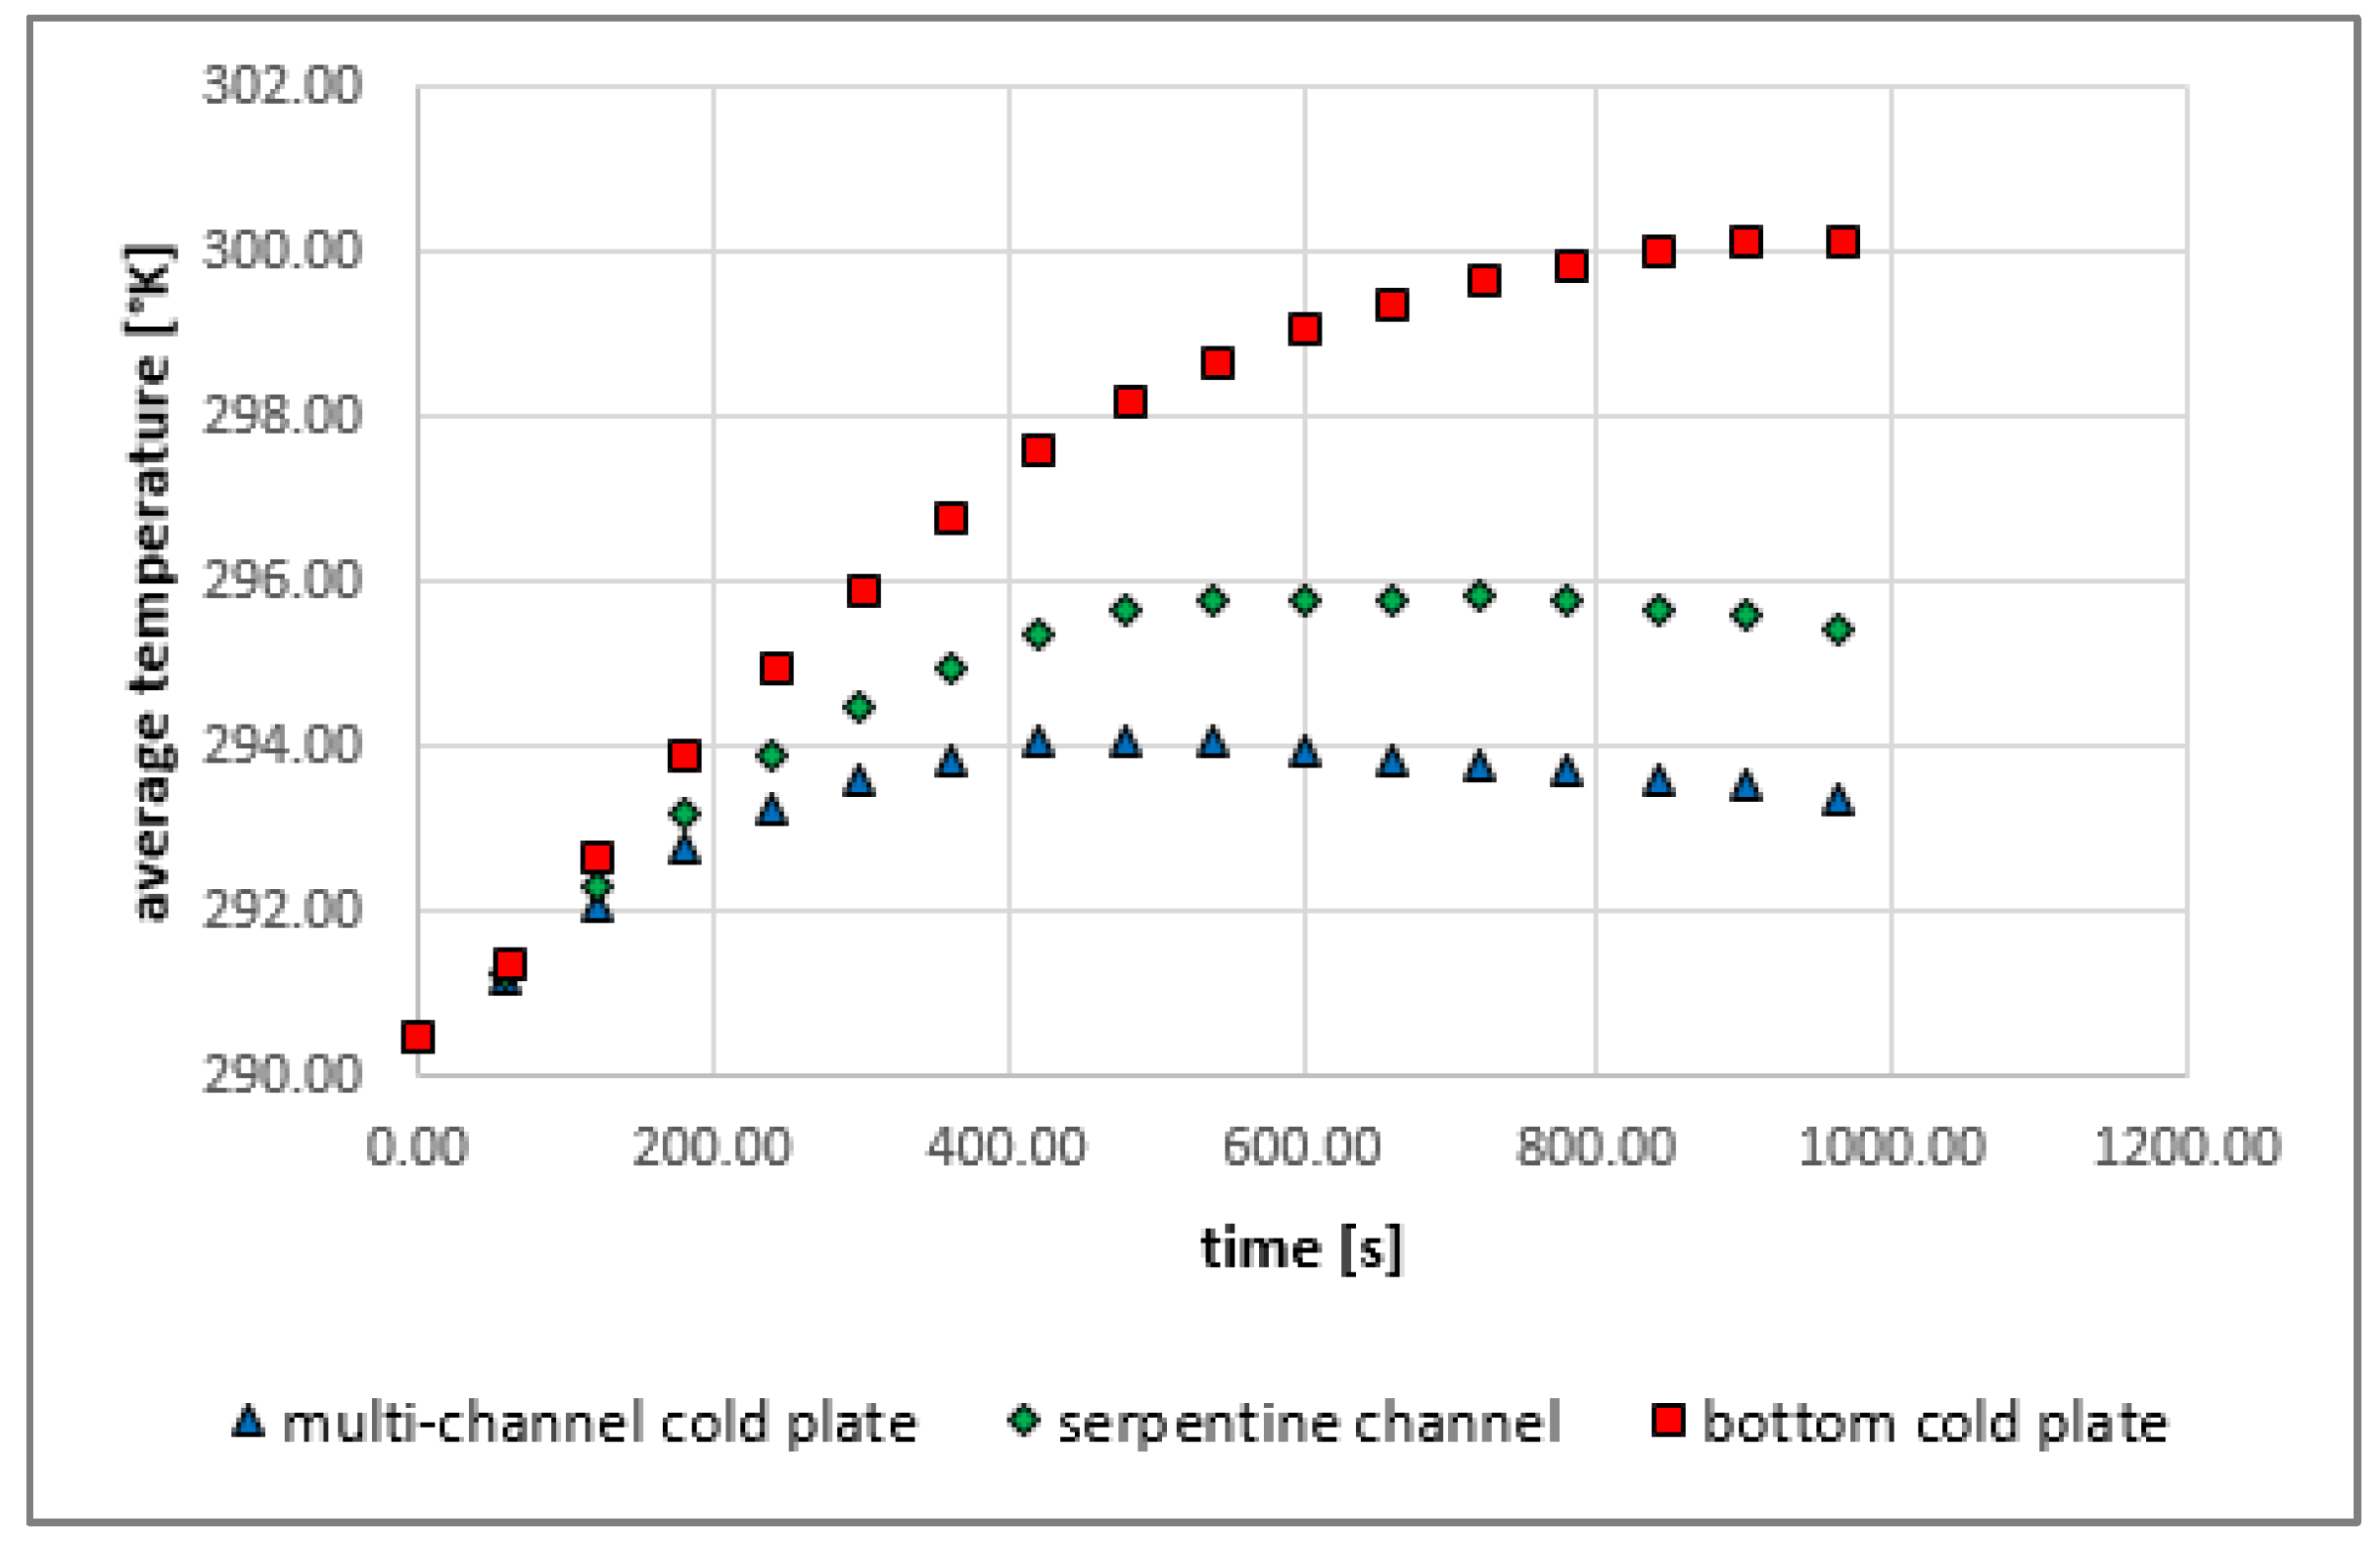
| 3.50 C | 293.60 | 294.81 | 16.29 | |
| 4.25 C | 295.27 | 296.23 | 19.30 | |
| Serpentine cold plate | 1.00 C | 290.60 | 291.34 | 5.10 |
| 3.50 C | 295.70 | 296.91 | 14.19 | |
| 4.25 C | 298.20 | 299.31 | 16.37 | |
| Bottom cold plate | 1.00 C | 291.19 | 291.87 | 4.51 |
| 3.50 C | 300.41 | 302.22 | 9.48 | |
| 4.25 C | 304.09 | 309.28 | 10.48 |
| Heat Transfer Characteristics | Multi-Channel Cold Plate | Serpentine | Bottom |
|---|---|---|---|
| Total convective heat transfer area (m2) | 0.0265 | 0.0108 | 0.00455 |
| Average heat transfer coefficient (W/m2K) | 517 | 1130 | 1358 |
| Convection heat transfer resistance (K/W) | 0.0730 | 0.0822 | 0.162 |
Disclaimer/Publisher’s Note: The statements, opinions and data contained in all publications are solely those of the individual author(s) and contributor(s) and not of MDPI and/or the editor(s). MDPI and/or the editor(s) disclaim responsibility for any injury to people or property resulting from any ideas, methods, instructions or products referred to in the content. |
© 2023 by the authors. Licensee MDPI, Basel, Switzerland. This article is an open access article distributed under the terms and conditions of the Creative Commons Attribution (CC BY) license (https://creativecommons.org/licenses/by/4.0/).
Share and Cite
Sevilgen, G.; Dursun, H.; Kılıç, M. Experimental and Numerical Investigations on the Thermal Performance of Three Different Cold Plates Designed for the Electrical Vehicle Battery Module. Sustainability 2023, 15, 14162. https://doi.org/10.3390/su151914162
Sevilgen G, Dursun H, Kılıç M. Experimental and Numerical Investigations on the Thermal Performance of Three Different Cold Plates Designed for the Electrical Vehicle Battery Module. Sustainability. 2023; 15(19):14162. https://doi.org/10.3390/su151914162
Chicago/Turabian StyleSevilgen, Gökhan, Harun Dursun, and Muhsin Kılıç. 2023. "Experimental and Numerical Investigations on the Thermal Performance of Three Different Cold Plates Designed for the Electrical Vehicle Battery Module" Sustainability 15, no. 19: 14162. https://doi.org/10.3390/su151914162
APA StyleSevilgen, G., Dursun, H., & Kılıç, M. (2023). Experimental and Numerical Investigations on the Thermal Performance of Three Different Cold Plates Designed for the Electrical Vehicle Battery Module. Sustainability, 15(19), 14162. https://doi.org/10.3390/su151914162