1. Introduction
The usage of renewable energies plays a key role in mitigating the effects of climate change. Renewable energy technologies have been growing faster compared to conventional energies over the last few decades. Solar energy is one of the most widely adopted renewable energy sources worldwide and is at the forefront of national strategies for reducing emissions [
1]. However, land-based solar energy systems and floating photovoltaic systems (FPVs) are also affected by extreme weather and climate change. Ironically, environmentally friendly energy production systems depend on the climate.
The frequency of extreme weather events has noticeably increased as a result of global climate change in recent years [
2,
3,
4,
5]. Thunderstorms and tornado events, attributed to the increasing sea surface temperatures (SST) on a global scale, have become more destructive in mid-latitudes [
6,
7]. The Mediterranean and its surrounding regions are witnessing an increase in the intensity and frequency of atmospheric phenomena, such as cyclones [
8,
9,
10,
11]. Being a Mediterranean country, Türkiye experiences an annual increase in the severity of extreme weather events [
12,
13,
14]. For example, the frequency of tornado events is increasing per decade in the country [
15]. It is evident that changes in sea-surface temperature anomalies have a significant potential to trigger mid-latitude cyclones over the Mediterranean, while it is possible to observe a recent intensification in reporting these extreme events [
16]. Another study also demonstrates an increase in both the severity and frequency of thunderstorm events in the region, which is attributed to climate change [
17]. Despite some studies indicating a decrease in the number of stormy days in the coastal regions of the country, the severity of these events is increasing [
14]. Furthermore, another high-resolution study indicates that future climate projections predict an increase in average temperature and heavy precipitation across the country [
13]. Many similar studies predict an increase in both the frequency and severity of extreme weather events, particularly in the eastern part of the Mediterranean [
10,
18,
19,
20,
21]. However, it may not be possible to reduce the number and severity of extreme weather events. The initial step in preventing the loss of life and property caused by weather-related disasters is to accurately forecast these events in terms of space and time [
22]. Accurate forecasting of the location and duration of heavy rainfall enables us to predict floods and plan water flow management [
23,
24]. Conducting risk and vulnerability analysis, classification, and mapping of areas susceptible to flash floods caused by heavy rains can offer valuable insights [
25]. Similarly, accurate short-term prediction of the occurrence locations can significantly reduce potential losses for severe weather events, such as hailstorms, as well [
26]. In addition, there are studies about artificial intelligence techniques to apply them to estimate maximum wind speeds. It is possible to identify optimal ANN architectures and downscaling levels through sensitivity analysis, reporting correlation values of around 0.80 for different wind farms in Türkiye, based on data from the NEWA Project. Therefore, the primary requirement for accurate forecasting in severe weather events is the use of appropriate modeling approaches [
27,
28].
Numerous studies suggest that enhancing the characterization of common physical schemes in numerical weather prediction (NWP) models is particularly valuable in preparing for future extreme weather conditions [
24,
26,
29,
30,
31]. The Weather Research and Forecasting (WRF) Model, developed by NCEP/NCAR, is one of the leading NWPs used by numerous operational meteorology institutions, research centers, and private companies worldwide. The WRF incorporates a wide range of physics schemes. However, these studies aim to tailor these schemes to regional and seasonal conditions.
Another important aspect to mention regarding NWPs is their ability to provide spatial data. In other words, they are highly valuable because, instead of generating temporal forecasts at a point scale, they produce weather forecast outputs spatiotemporally [
32]. Engineering project sites are usually located far from observation stations. Even if there are nearby meteorological stations, they may lack up-to-date and reliable datasets specifically ‘tailored’ for the projects. However, it is crucial to conduct in-depth meteorological analysis with expertise when utilizing these data.
Analysis of weather events at both the synoptic and mesoscale levels is essential to mitigate damage from natural disasters when selecting locations for planned facilities. If the selected site is susceptible to natural disasters, such as thunderstorms, it could lead to loss of life and substantial economic damage. Conducting detailed analyses of severe weather disasters is also crucial during the ‘energy facility site suitability study’ whether planning a wind/solar power plant or a nuclear power plant [
33,
34].
As an implementation of renewable energy, establishing of FPVs in water reservoirs becomes widespread, besides land-based solar energy systems [
35,
36]. One of the pioneer research studies found that FPVs produce more electricity compared to land-based, around 11% depending on wind, wind kinematics, and the amount of sunlight [
37]. The following studies also mentioned the environmental and financial sustainability of the FPV installation. For instance, it is emphasized that the reduction in greenhouse gases is possible with the contribution of an FPV system located in the hydroelectric power plants [
38]. Another example shows that establishing FPV systems is more advantageous than land-based PV systems in terms of dense population and land-usage purposes of the region [
39]. The cooling effect of the FPV for the surface temperature of both the water mass and air is experienced in the studies [
40,
41]. The facilities also cause the evaporation reduction depending on the FPV-covered surface [
42].
FPVs are also highly dependent on careful and well-planned engineering projects due to their exposure to strong winds and harsh waves, especially when installed in their natural environments over water reservoirs (
Figure 1), [
35,
36,
43,
44,
45,
46,
47].
However, a comprehensive review of the literature reveals a notable absence of in-depth research in this regard. While there have been studies related to present meteorological conditions and the development of corresponding designs for the installation of FPVs, they appear to be conducted solely for specific locations, with meteorological analyses often lacking the necessary level of detail [
45,
48,
49,
50]. For this reason, conducting a study that examines the extreme meteorological events that FPVs will encounter and reveals applicable analysis results will bring novelty to the literature.
The primary motivating idea behind this research is to analysis atmospheric extreme conditions for establishing FPV systems. Thus, significant costs, appropriate materials, and architectural designs would be selected by identifying many potential issues in advance that could be encountered in an FPV facility established at a highly dynamic surface like water, and the facility provides service for a longer period.
2. Materials and Methods
Meteorological analyses were carried out, ranging from general to a specific analysis, of the climatological, synoptic, and mesoscale aspects in this study. Moreover, spatiotemporal resolution of the data increases with each step of the analysis.
Synoptical analysis was performed especially for understanding of development and influence of a typical Mediterranean sourced mesocyclone over the area.
Some indicators are considered fundamental in mesoscale cyclone system analysis. The main characteristics of a mesoscale cyclone and priority conditions for tornadoes can be summarized as follows:
Moist convection
Instability
Lifting.
Different reputable resources can be used for the threshold values of the relevant indicators [
51,
52]. In addition, vertical thermodynamic conditions of the atmosphere are analyzed in some indicators, such as the convective available potential energy (CAPE), wind shear, lifting condensate level (LCL), and storm relative helicity (SRH) in the study.
As a third step, eight combinations of two PBL and four microphysics schemes of the WRF model are run to investigate the event in nested domains. Sensitivity analysis of the simulations was evaluated using the observations considering the wind speed. The main purpose of the mesoscale analysis was to accurately obtain the intensity and the location of the maximum wind speed over time.
Briefly, meteorological analysis of the thunderstorm event on Antalya in January 2019 was carried out under three main headings. These main headings and subheadings are shown in
Figure 2 as a flowchart.
It is possible to keep the scope wider in meteorological analysis. The event was searched in detail by Öztürk and Taştan [
53] as an analysis of the tornado and severe storm event on 26 January 2019. Analyses can also be performed for different meteorological variables, such as precipitation, temperature, relative humidity, pressure, etc. As mentioned before, it is deemed appropriate to analyze the maximum wind from meteorological variables. Since the general aim of the study is the FPVs planned to be installed in the reservoirs in the region. Then, it might be exposed to high spatiotemporal resolution.
2.1. Study Area and Case
The study area of this research is the administrative borders of Antalya province of Türkiye. The region’s appeal for installing FPVs is enhanced by its developed status in tourism, industry, and agriculture [
54], besides its significant solar energy potential.
Antalya is geographically located in the south of the Taurus Mountains and near the Mediterranean coast (
Figure 3), so it is frequently under the influence of mid-latitude cyclones, especially in the winter season [
20,
55]. Severe thunderstorm systems and tornado events were initially observed in the western part of Antalya upon examining the event’s occurrence, gradually progressing towards the center within a period of 2–3 days. Consequently, the study case is not only noteworthy for its tornado formation, but it also serves as a remarkable case to investigate the development of mid-latitude cyclones over the eastern Mediterranean. Tornado formation is significantly influenced by the strengthening and deepening of moist convective mesocyclones [
51].
In addition to this research, various studies conducted by different researchers have analyzed the tornado incident, particularly the one observed at Antalya International Airport on 26 January 2019 [
53,
56]. However, severe thunderstorm and tornado events are more common, especially in the districts to the west of Antalya. The chosen event in January 2019 caused the death of two people and injuries to seven others [
57] (
Figure 4a,b).
The outputs generated after the study, such as calculated wind speeds or wave characteristics, can be utilized for the planned FPV installations in dam reservoirs, while meteorological analysis can be conducted within the administrative boundaries of Antalya province. However, specific information regarding which dams and their sizes has not been finalized by the governmental agencies, for instance, the water reservoir of Manavgat Dam (
Figure 5), a hydroelectric power plant located to the east of Antalya, which would be a highly suitable site for this purpose. Similarly, there are numerous dams in Antalya. Therefore, with the obtained outputs and the method employed, calculations can easily be performed for any dam reservoir.
The extreme weather event characteristics mentioned earlier are utilized as a foundation for selecting suitable materials and designing concepts for the facilities for all FPV projects. Furthermore, the significant wave height is estimated by utilizing the extreme wind speed, enabling the calculation of all components required for anchoring the FPV systems.
2.2. Data Resources
This study has followed three essential steps: climatological, synoptic, and mesoscale analysis of the thunderstorm event that occurred in Antalya, Türkiye. Consequently, the analysis requires both long-term data and data with high temporal resolution. Required data were collected both online and by request from governmental institutions for the study.
The data used for climatological analysis include monthly total precipitation (mm/month) for several years, monthly values of the North Atlantic Oscillation Index (NAO) (ranging between −1 and +1), and the relationship between the number of tornadoes and vorticity corresponding to different months.
Climate Hazards group InfraRed Precipitation with Station (CHIRPS) data available on the Google Earth Engine Platform are utilized for obtaining monthly total precipitation data. CHIRPS generates spatial precipitation data with a horizontal resolution of 0.05° on a global scale, covering the period from 1981 to the present [
59].
Monthly index values of the North Atlantic Oscillation (NAO) are needed to correlate the total precipitation in the winter months from the monthly total precipitation data of more than 40 years between 1981 and 2021 for the study area, Antalya. These data are provided online by NOAA [
60].
Another important indicator for climatological analysis is the determination of the number of monthly occurrences of vorticity-induced storms seen in Europe. The online resources represented by the Copernicus Service are used [
61] for this requirement.
Spatial data, including Europe, the Mediterranean, and the eastern shores of the Atlantic Ocean, are needed for synoptic scale analysis of the atmosphere. The formation and movement trajectories of low-pressure systems and the specification of the front-trough lines are very important in synoptic analysis. Likewise, the thermal advection in the middle–upper atmosphere and the divergence and vorticity values in the upper atmosphere provide very valuable information for the development of thunderstorms at the synoptic scale.
The website wetter3.de/archive (accessed on 20 December 2022), where the weather charts for various atmospheric vertical levels produced by the German Weather Service (DWD in German abbreviation) are archived and presented freely online, is used for synoptic analysis. In addition, mean sea level atmospheric pressure and frontal charts produced by the MetOffice of the United Kingdom also take place in the same web site. These charts are applied for the frontal analysis of the storm.
In addition to all these, thermodynamic diagrams (skewT-logP) show the vertical situations of the atmosphere, and these diagrams are also very informative both in the synoptic scale and in regional short-term forecasts. As such, skewT-logP diagrams produced from ERA5 Reanalysis data presented by ECMWF are used in the study. These diagrams are produced by entering latitude–longitude and date–time information at Taszarek’s online web site “rawinsonde.com” (accessed on 21 December 2022) [
62].
Hourly wind speed data of five automatic weather observation stations belonging to Turkish State Meteorological Service (TSMS) were used to validate the accuracy of the model outputs in the mesoscale analysis part of the study (
Figure 6).
2.3. Description of Numerical Simulations
From the perspective of mesoscale analysis, the WRF state-of-the-art NWP model is used to simulate the thunderstorm events that occurred in January 2019. The WRF model comprises a range of physics schemes [
63]. Three nested domains with horizontal resolutions of 9 km, 3 km, and 1 km are arranged from the outermost to the innermost domain, respectively. The central point of the domain is located at 36.60° N and 31.05° E (
Figure 7). The innermost domain covers the province of Antalya and some neighboring areas. The simulations span eight days, starting from 00:00 UTC on 23 January 2019, with the first day considered as the “spin-up” period. Output data have temporal resolutions of 180, 180, and 15 min for the outer, middle, and innermost domains, respectively. Additionally, the ERA5 re-analysis dataset is used for initial and boundary conditions in the model simulation, with 3 h intervals.
In this study, four different microphysics schemes are tested: National Severe Storms Laboratory (NSSL2) [
64], Milbrandt 2-moment [
65,
66], Thompson [
67], and WRF-Single Moment 6 class (WSM6) [
68]. Additionally, two different planetary boundary layer schemes are tested: Mellor–Yamada–Janjic (MYJ) [
69] and Yonsei University (YSU) [
70]. The rapid radiative transfer model for GCMs (RRTMG) [
71] is used for shortwave and longwave radiation physics, and the Noah Land–Surface Model [
72] is used for the land-surface scheme. The Kain–Fritsch cumulus scheme [
73] is used only for the outermost domain, and it is switched off for inner domains (convection-permitting simulations). For more detailed information and abbreviation names of the simulations, refer to
Table 1 and
Table 2.
2.4. Wind-Driven Wave Characteristics
Fluid movements can be essentially divided into two categories in a facility built on water instead of a facility established on a terrestrial surface. The first of these is the force generated by the wind on its own, acting aerodynamically on a fixed mass. The second is the hydrodynamic force exerted by the water waves generated due to the wind. Therefore, the FPV platform standing on the water not only moves ‘horizontally from one place to another’, but also experiences turbulent vertical movements at its location due to the waves during extreme weather conditions, such as a storm. This can lead to stresses, deformations, and plastic breakages, both in the modular connection elements and the main platform within the FPV system.
Beyond the aerodynamic stresses caused by the wind, the potential damage generated by water waves especially often renders FPV facilities non-functional. Therefore, detailed hydrodynamic analyses are mandatory in areas where FPV installations are to be set up, taking into account the most extreme natural conditions. Unfortunately, it is impractical to establish technical measurement systems that would make this possible in water reservoirs worldwide. In other words, systems for measuring wave heights are not typically installed. Therefore, observation possibilities are often derived from wind. The wave height can be calculated through various approaches, either empirically or based on the fundamental equations of fluid dynamics using wind measurements as a basis.
In the context of this study, analysis was conducted to determine the characteristics of waves that will occur in water reservoirs using model outputs obtained after assessing the extreme meteorological conditions regionally, as if it were a ‘planned’ system instead of an ‘existing’ system. For this purpose, a modified version of the SPM Method adapted for small water reservoirs was employed as described in the technical notes of Özeren and Wren (2009) [
74].
The fetch distance is defined as the maximum distance where the wind can blow freely without any obstacles in its path [
50]. Accordingly, the greater the fetch distance, the higher the wave height generated by the wind [
51]. Wave height alone is actually a sufficient indicator in terms of demonstrating the hydrodynamic destructiveness of the water [
44,
52]. However, other hydrodynamic characteristics, such as shear stress, peak period, minimum exposure duration, and other factors, also contribute to the increase in destructiveness. In this study, a hydrodynamic analysis was performed to the extent relevant to the subject, and related interpretations were provided, rather than conducting a highly detailed technical analysis as in coastal hydraulics studies.
For this purpose, a program was written in
python, and the fundamental wave characteristics were calculated as described in the mentioned study [
74].
In (1),
U10: wind speed at 10 m (m/s),
z: elevation (m),
Uz: wind speed at ‘
z’ elevation (m/s).
In (2),
UA: Wind stress factor (m/s).
In (3),
g: gravity force (m/s
2),
tmin: minimum duration (s),
Ho: wind-driven water wave height (m),
F: fetch distance (m) (is taken as 500 m).
In (5), Tp: peak period (s).
The results about the wave characteristics are given in
Section 3.4 in graph and summary table formats.
3. Results
A comprehensive regional meteorological analysis has been conducted for FPV installations in this study. The obtained results, particularly in the context of severe winds and water waves, provide valuable information that can directly benefit practitioners in steps, such as material selection during the project-planning process, architectural design, and suitable site selection.
The emphasis has initially been placed on climatological and synoptic findings as meteorological analysis. The reason for this is that weather events generally follow “certain patterns” in the long term [
7,
75]. In other words, all meteorological events have specific characteristic features and similarities. Climatological and synoptic analysis have been conducted to be able to see this.
3.1. Climatological Analysis
The winter of 2019 especially in December 2018 stands out near the study area. Kömüşçü and Oğuz (2021) conducted an in-depth study of this subject, analyzing the winter conditions influenced by various global patterns, including arctic oscillation (AO), sudden stratospheric warming, and Ural blocking (UB) across Türkiye. The mentioned study found that the winter of 2018/2019 experienced northerly and north-westerly cold-air advection, resulting in record-low temperatures in Southeastern Europe and the Mediterranean regions [
76].
In addition, it is valuable to consider the impact of North Atlantic Oscillation (NAO), a global atmospheric circulation pattern, on the precipitation originating from the Mediterranean and occurring in the region in terms of synoptic climatology. Detailed research on this subject reveals that a positive NAO index leads to decreased winter precipitation, particularly on the western coasts of the Anatolian peninsula during winter months [
55]. Our analysis generally confirms the mentioned pattern. However, remarkably high precipitation amounts in January 2019 were observed [
60], despite being in the positive phase of the NAO index (
Figure 8). The main reason for this anomaly might be the heavy rainfall that occurred in the Western Mediterranean starting on 22 January and affecting the region until 27 January. As such, these rainfalls were highly influential in terms of the intensity of precipitation in January.
The total precipitation of winter months was considered a reference to normalize the monthly total precipitation. CHIRPS data provided monthly total precipitation for the years 1981 to 2021, and published NAO indices were also utilized. In another study, the positive phases of NAO were examined from a different perspective, highlighting the impact of the cold winter of 2018–2019 across the entire country [
76].
In fact, a cold anomaly characterized by northerly and north-westerly cold-air penetration was observed throughout December and until mid-January in the considered region. This anomaly was a result of the polar vortex splitting across the stratosphere and the movement of jet streams to mid-latitudes. Additionally, it is indicated in [
76] that during the second half of December 2018 and January 2019, the arctic oscillation and related cold-air penetration were more dominant than NAO.
The winter of 2019 stands out with the highest number of winter storms observed during the long-term observation period, averaging 111 windstorms per year considering the climatology of winter storms caused by vorticity [
61].
It is worth mentioning that there has been limited comprehensive research on the formation of
medicanes and their effects on Türkiye. One of the most comprehensive studies by Nastos et al. (2015) highlighted the intensification and impacts of medicanes, which they referred to as “Tropical-like cyclones (TLC)”, in the west and middle of the Mediterranean between 1947 and 2014 [
18]. However, there are clear differences and similarities between medicanes and mid-latitude cyclones in many aspects. One fundamental difference is the presence of an ‘
eye’ typically seen in tropical cyclones or hurricanes, which is also evident in medicane low-pressure systems. Climatologically, medicanes are mostly effective during the autumn months (September, October, and November). Cavicchia et al. (2014) established specific threshold values for meteorological conditions necessary for the formation of medicanes [
77]. Cyclones formed in the Aegean Sea stand out in winter, and some of them follow motion trajectories towards the Eastern Mediterranean [
78,
79]. Detailed studies on cyclogenesis observed over the Aegean Sea have been conducted by Flocas in 2000 [
80].
Considering all these factors, the event in question does not seem to be classified climatologically as a medicane. Instead, it can be considered as a typical cold-core mid-latitude Mediterranean cyclone. It would be beneficial to study the synoptic climatology of this region to assess the potential increase in the occurrence and impact area of ‘Medicane’ events in the coming years as a result of climate change.
3.2. Synoptic Analysis
A low-pressure system situated to the north of the Aegean Sea, cut off from the Genoa Gulf in the central Mediterranean, leads to the development of a trough over the Gulf of Antalya on the synoptic scale. This trough is supported by a pronounced zonal divergence line at higher atmospheric levels, which enhances the vertical growth of clouds through increased humidity and convergence. Moreover, a persistent warm advection from the southern region at middle atmospheric levels propels the system northward as it interacts with a cold-core occlusion front.
Consistent with findings from prior research [
10,
78,
81] using both climatological and synoptic approaches, the considered study area is susceptible to the influence of mid-latitude cyclones originating in the Western Mediterranean and progressing eastward. Additionally, cold-core cyclones can form over the Aegean Sea during the winter season.
However, this system lacks the distinctive warm core, yet it deepened following intense convective activity, unlike medicanes. A strong high-pressure system (mT-Azores subtropical) situated over the Atlantic Ocean exerted influence on Europe on 20 January. Consequently, a low-pressure system in the central Mediterranean appears to have strengthened. Notably, this system exhibited characteristics of an occlusion front from its inception with cold air present both ahead and behind it. The system’s movement at ground level was predominantly eastward along the zonal axis.
It Is well established that the presence of cyclonic vorticity within troughs of the upper atmosphere plays a crucial role in mid-latitude cyclogenesis. An important factor in this process is the occurrence of divergence in the upper atmosphere [
82]. Upper atmospheric divergence allows air masses at lower levels to converge, enhancing the strength of low-pressure systems at the surface (
Figure 9a). This convergence leads to an expansion of cloud formation, vertically (
Figure 9b).
This expansion allows moisture to be lifted as well, and the situation is clearly depicted in skewT-logP diagrams. These diagrams (
Figure 10) reveal a relatively uniform distribution of moisture between ground and the tropopause. The observed moisture distribution serves as an indicator that a potentially hazardous mesocyclone, characterized by significant moisture content at all vertical levels, could have a notable impact on the land.
Another crucial aspect when considering such extreme events is to examine the middle atmospheric geopotential height and the progression of advection. Notably, the presence of a low-pressure system at higher atmospheric levels (i.e., 500 hPa) holds significant importance in fortifying the overall system. The zonal flow associated with this system enhances the convergence of air masses near the surface, consequently leading to cloud formation and development (
Figure 11a,b).
Simultaneously, a warm advection originating from the southern region, specifically from the Mediterranean, was observed at the 850 hPa level as illustrated in
Figure 12a,b. This warm advection contributed to the complex dynamics of the system, further influencing its behavior and characteristics.
Analyzing the front chart for 24 January 2019, at 00 UTC and 06 UTC, reveals the emergence of
a trough line along the Western Mediterranean coasts of Türkiye. Prominently, Antalya is situated along this distinct trough line (
Figure 13a,b). The formation of this trough can be attributed to the presence of a low-pressure system over the Aegean Sea. This low-pressure center, which became detached from the middle Mediterranean cyclone originating in the Gulf of Genoa, extended eastward with zonal movement after 20 January. This low-pressure system was the primary driver behind the mesoscale thunderstorm system under consideration.
It is important to highlight that this system was accompanied by a trailing
cold-air mass. Consequently, the influential low-pressure system over the Gulf of Genoa exhibits characteristics more akin to a mid-latitude cyclone rather than those of a medicane. An evident deep trough was observed over the western coasts of Türkiye in the vicinity of the northern Aegean Sea, resulting from the system’s separation on 24 January. This trough carried warm air and moisture from the south where the Mediterranean is. The unique geographical characteristics of the area clearly played a pivotal role in triggering instability and intensifying convection precisely at this
juncture (
Figure 13).
A significant limitation of this study is the absence of radiosonde observations in proximity to the study area. While Isparta station (17240) serves as the nearest radiosonde station, its location north of the Taurus Mountains renders it inadequate for capturing mesocyclones originating from the Mediterranean. Consequently, the occurrence of such mesocyclones in the study area went unnoticed. As such, the thermodynamic diagrams produced using ERA5 Reanalysis data [
62] for the grids of the region where severe storm and tornadoes were seen was used instead of an observation station.
In
Figure 10a,b, thermodynamic diagrams with a time interval of 6 h illustrate a noticeable increase in wind shear intensity. The presence of wind shear is distinctly evident in both hodographs, exhibiting a circular pattern. Another significant observation drawn from the thermodynamic diagram is the prevalence of deep instability, extending from the surface to approximately the 300 hPa level.
Moreover, the lifting condensation level (LCL) indicates an unusually low cloud base level, which is conducive to the development of a wall cloud. The formation of a tornado becomes plausible under these conditions. Additionally, the relative humidity at the 850 hPa level is notably high. These combined factors create an environment for potential tornado formation.
Figure 10b vividly illustrates a remarkably consistent and uninterrupted smooth veering of winds both from the surface to 1 km and from the surface to 6 km. These wind shears were measured at 10 m/s and 25 m/s, respectively, at 06:00 UTC on 24 January 2019. While mid-latitude cyclones during the winter season typically exhibit insignificant convective available potential energy (CAPE) values, an intriguing exception emerges from this case study. Unclear CAPE values were observed prior to the tornado events (
Figure 10).
3.3. Mesoscale Analysis
The essential rationale for mesoscale meteorological analysis is to ‘take pictures’ of a meteorological event with high spatiotemporal resolution [
32]. Indeed, the comprehensive research conducted by Duzenli et al. (2021), which encompasses various aspects of the field, is quite noteworthy [
20]. Nevertheless, their study primarily focused on analyzing different model configurations of the WRF model during the summer and autumn seasons. Their examination centered around average temperature and cumulative precipitation, yet it falls short of providing a comprehensive understanding and interpretation of mid-latitude Mediterranean cyclone formation, which is the focus of our current study.
By prioritizing these factors, it is aimed to gain a more thorough insight into the intricacies of mid-latitude Mediterranean cyclone formation.
As previously mentioned in
Section 2.3, a total of eight different model configurations have been executed to represent the extreme thunderstorm events. The analysis results reveal that there is no statistically significant difference between simulations and observations across all stations (
Figure 14 and
Table 3) at about 10 m wind speed. However, MKT configuration (Mellor–Yamada–Janjic for PBL, Kain–Fritch for cumulus, and Thompson for microphysics) demonstrates slightly superior statistical performance in comparison to other configurations for many stations.
However, the most significant finding is the close alignment of hourly trends between observed and modeled wind speeds. In other words, a high correlation coefficient exists between the observed values and model predictions for all stations, except Alanya (Station Number 17310) (
Figure 14e). For instance, when evaluating wind speed values at Manavgat station (17954), a high Pearson correlation coefficient is observed. This high correlation signifies that the model performs adequately in this specific area (
Figure 14d).
The extensive size of the study area and its heterogeneous topography present challenges in accurately modeling wind speeds in 10 m. Successfully modeling a mesoscale storm system demands particularly sensitive studies, especially in regions characterized by high land–sea interactions. This region is the designated area for the planned FPV installation. It is crucial to ascertain how extreme thunderstorms occurring in the area could impact FPV facilities.
The results of the statistical analysis can be interpreted (
Table 3) considering the times when wind speed values are at their maximum.
Firstly, let us search into the model configurations for Antalya Airport station (17300):
- ○
Maximum wind speed has been measured as 15.40 m/s. The model configuration that predicted the wind speed closest to this value was YKT (Wmax = 13.31 m/s). This configuration, in fact, had the highest Pearson correlation coefficient. The NSE coefficient has also yielded a relatively high performance, being +0.009.
- ○
It is worth emphasizing regarding Antalya Airport as when the Yonsei University (YSU) planetary boundary layer (PBL) scheme is selected, the performance of all model configurations significantly improves according to the NSE efficiency coefficient. Therefore, YSU should be chosen as the PBL scheme instead of the Mellor–Yamada–Janjic (MYJ) scheme for modeling configuration. In conclusion, YKT configuration can be preferred for the events under consideration for extreme wind analysis in the center part of the study region.
If we examine the model configurations at the Manavgat station, which is from east side of the study area, the following can be determined:
- ○
According to observations in Manavgat, the maximum wind speed was recorded as 8.80 m/s on 26 January 2019. MKM configuration has exhibited the highest performance with a slightly higher Pearson correlation at the Manavgat meteorological station. However, the wind speed realized was 11.29 m/s in comparison. MKM configuration did not prove to be the best predictor for the maximum wind speed. Another configuration, the MKT configuration, has a relatively lower correlation, yet its prediction performance during the time when the maximum wind occurs is higher. In the case of the MKT configuration, the predicted wind speed at the time of the maximum wind on 26 January 2019 at 11:00 UTC is 10.76 m/s. The nearest prediction came from the YKW configuration, estimating it as 8.32 m/s.
- ○
Moreover, when examining time series in a trend of increasing or decreasing wind speeds, considering NSE coefficients as a statistical indicator, it is observed that MKT configuration provides the best result (even though it is not statistically very good) for this station with an NSE of −0.737. Similarly, YKW configuration also has a close value with an NSE of −0.862.
However, as a common observation across all configurations, it can be noted that the NSE coefficients do not demonstrate a ‘very high’ model performance. Nevertheless, they still offer an acceptable level of modeling performance. When designing a WRF model to determine the maximum wind speed for the Manavgat area, the MKT or YKW configurations could be preferred.
A prominent common aspect in all determined configurations is that the wind speeds predicted by the models tend to be slightly higher than the actual observations. This situation could be reevaluated with the consideration of several different events occurring at different times.
However, as an important finding, if the establishment of a facility is planned in these regions, it should be taken into account that the wind speed value during extreme conditions is around 15 m/s (approximately 30 knots).
While there may have been some issues with observations in measurements, such as those taken at Antalya Airport (Station Number 17300), this study suggests the feasibility of analyzing a regional mesoscale cyclone in the study area using the MKM model configuration of the WRF model.
According to the MKM configuration of the WRF model, it becomes evident that moisture and warm advection were transported from the sea, leading to increasingly unstable weather conditions during the morning hours of 24 and 26 January 2019 (
Figure 15). Subsequently, the most extreme conditions of mesoscale storm systems were observed around noon on these dates (
Figure 15).
3.4. Wind-Driven Wave Characteristics for FPV System Durability
The SPM Method is used to provide an appropriate analytical solution for determining the characteristics of water waves generated by wind in addition to determining the temporal variations of strong winds, as given
Section 2.4 in detail. The direct use of the SPM method is not appropriate for revealing the characteristics of water waves in water reservoirs, such as dams (in other words, continental inland waters), since it is primarily designed for ocean-deep water waves. For this purpose, a ‘modified’ SPM approach presented by Özeren and Wren provides a more realistic method for that. It is worth mentioning that there are no field measurements related to water waves. As such, it is not possible to validate the values obtained through calculations using the modified SPM approach. However, there is generally no objection to its use where necessary since the method includes coefficients obtained experimentally [
74].
If we briefly summarize the approach followed in this study, verified numerical weather prediction model results from meteorological stations located within the boundaries of Antalya province are used to calculate the wave characteristics for specific points, which are the station points where we assume the presence of a ‘pseudo’ water reservoir.
One might wonder: why is a spatial wave height layer not obtained when a spatial wind layer is obtained using NWP? The most reasonable answer to this question is that a temporal approach is preferred over a spatial one in order to observe the temporal variation of wave height during a thunderstorm event. Nevertheless, a spatial wave height layer can be obtained if desired for water reservoirs. However, there is a horizontal scale resolution problem here as well. This is because the horizontal resolution of the model outputs produced with NWP is 1 km × 1 km in the innermost domain, which unfortunately is not sufficient to spatially determine the wave characteristics in water reservoirs. In other words, calculating wave height for water reservoirs at this resolution may not be very applicable. Computational fluid dynamics (CFD) solutions can be used for this purpose. Thus, both wind and wind-driven wave height can be generated with high spatial resolution [
54]. As a result, a summary table of calculations made for each location near the station is provided in
Table 4. The values related to wave height are shown temporally in
Figure 16.
4. Discussion
This study actually represents ‘the first phase’ of an engineering planning and feasibility study for the establishment of FPVs. Because if the general scope of the mentioned engineering works is defined as determining the natural conditions that an FPV will be exposed to, one of the foremost tasks will be the identification and interpretation of meteorological extremes.
Meteorological extremes have been analyzed for FPVs planned in the southern part of Türkiye, within the boundaries of Antalya province, in this study. A severe thunderstorm event which occurred in the region recently, causing destructive effects, has been examined as a case. Tornado incidents have also been observed in various settlements, especially in the western and central parts of the region. Along with the unprecedented frequency in the past, the increase in such events has been attributed to parallel urbanization and economic development, resulting in a ‘multiplier effect’ for destructive impacts.
However, prior to this study, some preliminary works can also be conducted. For example, using long-term spatial datasets (ERA5), similar to those used in this study, the regional potential for floating solar energy can be calculated. Corresponding studies have been conducted in wind and terrestrial solar energy research [
83].
Although the analysis is focused solely on ‘FPVs and extreme weather events’ in this study, the impact of energy systems is also evaluated comprehensively, taking into account their effects on the national grids for electricity. Due to the inherent volatile nature of renewable resources, it is essential to assess their ability to withstand unexpected events in heavily loaded energy systems. There are comprehensive studies that propose a technical-reliability optimization framework to incorporate the impact of reliability constraints in the operation and planning phases of hybrid renewable energy systems for this challenge [
84,
85,
86]. As a result, optimal system designs for grid operations can also be developed with the increasing installation of FPVs in the future.
Spatial distributions of meteorological variables were obtained at various levels for a mid-latitude mesocyclone along the southwestern coast of Türkiye through detailed synoptic and mesoscale analyses. The initial development and stages of this event are meticulously examined and presented in this article.
5. Conclusions
This study makes a detailed analysis of a severe mid-latitude cyclone that occurred in the region around Antalya, a city located in the southwest of Türkiye, on the dates of 24–26 January 2019. The unique conditions of the region during winter months, including temperature and pressure differences between land and sea, as well as topographically influenced factors, have contributed to the formation of heavy rainfall, severe wind speed storms, and tornadoes associated with such a mid-latitude cyclone.
Furthermore, focusing particularly on strong winds, a mesoscale analysis of the event was conducted using the numerical weather prediction model, ‘the WRF’, with various configurations. Through sensitivity analysis of model parameters, appropriate parameterization of the model was determined.
Analysis of extreme events is important for design and applications in engineering projects; however, most of the time, it is not possible to fully represent the meteorological conditions of a large region with ‘point-based’ weather observation stations. In this comprehensive meteorological analysis, both synoptic and mesoscale aspects were addressed with different studies from various perspectives to support the understanding of these kinds of extreme atmospheric events with high-resolution point-based results.
The main objective of the study is to demonstrate the potential extreme wind conditions that the planned FPV systems in this region could be exposed to in the future. Based on these extreme wind speeds, another important design parameter, namely significant wave height, would be estimated easily, and therefore, it is essential to prioritize the assessment of natural constraints. Floating ‘energy facilities’ to be established and operated on the surface of a water reservoir require a significant initial investment cost and necessitate budget allocation for maintenance and repairs over time. In some cases, unforeseen natural constraints at the outset can actually jeopardize the efficiency and sustainability of the facility to be established. In this research, a step-by-step meteorological analysis, progressing from general to specific aspects, considered the necessary durability and safety conditions for the planned facilities, enabling the results to be utilized in structural analyses. Using this kind of meteorological analysis would be the first instance in the FPV-related literature.
Therefore, in future stages, one of the many factors that must be considered when conducting similar studies on FPVs in various geographical regions is the presence of extreme meteorological conditions.
In addition to these, there is a lot of work that needs to be carried out in the future. These could be listed briefly as follows:
- ○
To better understand the impact of climate change on FPVs, it would be beneficial to conduct studies on the effects of different climate scenarios, including both optimistic and pessimistic scenarios, produced by various global climate models belonging to different institutes. This would help to provide a comprehensive understanding of how the plants may be affected by different regional climate conditions.
- ○
The success of a facility depends on the ability of certain materials to withstand various natural or extreme conditions during its design and operational phases. The facilities can be designed and built to be more sustainable and resilient by selecting materials that are well suited to the regional climate conditions.
While the execution of the project-planning activities may not fall strictly within the scope of ‘preventive measures’, it will prove highly beneficial in mitigating ‘catastrophic damages’ encountered during various situations in the operational phase of the facilities. Thus, facilities will be able to operate in accordance with sustainability principles, resulting in fewer economic losses and extended operational lifespans.
Author Contributions
In this study, M.S.K. is responsible for the conceptualization of the study, data and literature investigation, mapping, modeling, and writing the original draft. A.D.Ş. is responsible for determining general project steps, conceptualizing, writing the original draft and the revision of literature research, correcting spelling–grammatical errors, and revision of the drafts. E.T. is responsible for numerical analysis, computing, modeling, and writing the original draft. All authors have read and agreed to the published version of the manuscript.
Funding
Computing resources used in this work were provided by the National Center for High Performance Computing of Türkiye (UHeM) [grant number 1007482020].
Institutional Review Board Statement
Not applicable.
Informed Consent Statement
Not applicable.
Data Availability Statement
In the study, there is an Excel file where the winter conditions of NAO are examined, and the calculations are also included in the file. There is also another Excel file obtained from the Copernicus data portal that graphs the numbers of winter storms in Europe due to the polar vortex. The time series of the observation stations used in the detailed statistical data analysis cannot be shared without the permission of TSMS. Finally, the outputs from different WRF simulations can be shared with the requesting researchers via e-mail.
Acknowledgments
All researchers who conducted this study declare that they have no conflicts of interest with any institution or person. We thank the Turkish State Meteorological Service (TSMS) for providing us the data of the stations, ECMWF for ERA5 reanalysis data, and National Oceanic and Atmospheric Administration (NOAA) for ETOPO1 terrain data.
Conflicts of Interest
The authors declare no conflict of interest.
References
- 2015–2019 Stratejik Plan; Republic of Türkiye Ministry of Energy and Natural Resources: Ankara, Turkiye, 2017. (In Turkish)
- Seneviratne, S.I.; Nicholls, N.; Easterling, D.; Goodess, C.M.; Kanae, S.; Kossin, J.; Luo, Y.; Marengo, J.; Mc Innes, K.; Rahimi, M.; et al. Changes in climate extremes and their impacts on the natural physical environment. In Managing the Risks of Extreme Events and Disasters to Advance Climate Change Adaptation; Field, C.B., Barros, V., Stocker, T.F., Qin, D., Dokken, D.J., Ebi, K.L., Mastrandrea, M.D., Mach, K.J., Plattner, G.-K., Allen, S.K., et al., Eds.; A Special Report of Working Groups I and II of the Intergovernmental Panel on Climate Change (IPCC); Cambridge University Press: Cambridge, UK; New York, NY, USA; pp. 109–230. [CrossRef]
- Archer, D. Global Warming: Understanding the Forecast; John Wiley & Sons: Hoboken, NJ, USA, 2012; ISBN 9780470943410. [Google Scholar]
- Brooks, H.E. Severe thunderstorms and climate change. Atmos. Res. 2013, 123, 129–138. [Google Scholar] [CrossRef]
- Adams, S.; Aich, V.; Albrecht, T.; Baarsch, F.; Boit, A.; Canales Trujillo, N.; Cartsburg, M.; Coumou, D.; Eden, A.; Fader, M. Turn Down the Heat: Confronting the New Climate Normal; The World Bank: Washington, DC, USA, 2014; ISBN 9781464804373. [Google Scholar]
- Fox-Kemper, B.; Hewitt, H.T.; Xiao, C.; Aðalgeirsdóttir, G.; Drijfhout, S.S.; Edwards, T.L.; Golledge, N.R.; Hemer, M.; Kopp, R.E.; Krinner, G.; et al. Ocean, Cryosphere and Sea Level Change. In Climate Change 2021: The Physical Science Basis. Contribution of Working Group I to the Sixth Assessment Report of the Intergovernmental Panel on Climate Change; Cambridge University Press: Cambridge, UK; New York, NY, USA, 2021; pp. 1211–1362. [Google Scholar] [CrossRef]
- Seneviratne, S.I.; Zhang, X.; Adnan, M.; Badi, W.; Dereczynski, C.; Di Luca, A.; Ghosh, S.; Iskandar, I.; Kossin, J.; Lewis, S.; et al. Weather and Climate Extreme Events in a Changing Climate. In Climate Change 2021: The Physical Science Basis. Contribution of Working Group I to the Sixth Assessment Report of the Intergovernmental Panel on Climate Change; Cambridge University Press: Cambridge, UK; New York, NY, USA, 2021; pp. 1513–1766. [Google Scholar] [CrossRef]
- Emanuel, K. Genesis and maintenance of “Mediterranean hurricanes”. Adv. Geosci. 2005, 2, 217–220. [Google Scholar] [CrossRef]
- Romero, R.; Emanuel, K. Climate Change and Hurricane-Like Extratropical Cyclones: Projections for North Atlantic Polar Lows and Medicanes Based on CMIP5 Models. J. Clim. 2017, 30, 279–299. [Google Scholar] [CrossRef]
- Galanaki, E.; Lagouvardos, K.; Kotroni, V.; Flaounas, E.; Argiriou, A. Thunderstorm climatology in the Mediterranean using cloud-to-ground lightning observations. Atmos. Res. 2018, 207, 136–144. [Google Scholar] [CrossRef]
- Taszarek, M.; Allen, J.T.; Groenemeijer, P.; Edwards, R.; Brooks, H.E.; Chmielewski, V.; Enno, S.E. Severe convective storms across Europe and the United States. Part I: Climatology of lightning, large hail, severe wind, and tornadoes. J. Clim. 2020, 33, 10239–10261. [Google Scholar] [CrossRef]
- Şen, Ö.L. A Holistic View of Climate Change and Its Impacts in Turkey. 2013. Available online: https://ipc.sabanciuniv.edu/Content/Images/CKeditorImages/20200327-01030010.pdf (accessed on 26 December 2022).
- Ozturk, T.; Ceber, Z.P.; Türkeş, M.; Kurnaz, M.L. Projections of climate change in the Mediterranean Basin by using downscaled global climate model outputs. Int. J. Climatol. 2015, 35, 4276–4292. [Google Scholar] [CrossRef]
- Kurtuluş, Y.F.; Acar, Z. Interannual Variability of Stormy Day Over Turkey. J. Geog. 2021, 42, 19–31. [Google Scholar] [CrossRef]
- Kahraman, A.; Markowski, P.M. Tornado climatology of Turkey. Mon. Weather Rev. 2014, 142, 2345–2352. [Google Scholar] [CrossRef]
- Nastos, P.T.; Karavana-Papadimou, K.; Matsangouras, I. Tropical-like cyclones in the Mediterranean: Impacts and composite daily means and anomalies of synoptic conditions. In Proceedings of the 14th International Conference on Environmental Science and Technology, Rhodes, Greece, 3–5 September 2015; pp. 3–5. [Google Scholar]
- Demircan, M.; Arabacı, H.; Soydam, M.; Eroğlu, H. Trends of Tornado Disasters in Turkey in Context of Climate Change. In Proceedings of the 9th International Symposium on Atmospheric Sciences (ATMOS 2019), Istanbul, Turkey, 23–26 October 2019; İstanbul Technical University: Istanbul, Turkey, 2019; pp. 350–355. [Google Scholar]
- Matsangouras, I.T.; Nastos, P.T.; Pytharoulis, I. Synoptic-mesoscale analysis and numerical modeling of a tornado event on 12 February 2010 in northern Greece. Adv. Sci. Res. 2011, 6, 187–194. [Google Scholar] [CrossRef][Green Version]
- Lelieveld, J.; Hadjinicolaou, P.; Kostopoulou, E.; Chenoweth, J.; El Maayar, M.; Giannakopoulos, C.; Hannides, C.; Lange, M.A.; Tanarhte, M.; Tyrlis, E.; et al. Climate change and impacts in the Eastern Mediterranean and the Middle East. Clim. Change 2012, 114, 667–687. [Google Scholar] [CrossRef]
- Duzenli, E.; Yucel, I.; Pilatin, H.; Yilmaz, M.T. Evaluating the performance of a WRF initial and physics ensemble over Eastern Black Sea and Mediterranean regions in Turkey. Atmos. Res. 2021, 248, 105184. [Google Scholar] [CrossRef]
- Aksu, H.; Cetin, M.; Aksoy, H.; Yaldiz, S.G.; Yildirim, I.; Keklik, G. Spatial and temporal characterization of standard duration-maximum precipitation over Black Sea Region in Turkey. Nat. Hazards 2022, 111, 2379–2405. [Google Scholar] [CrossRef]
- EPA (USA). Hazard Mitigation for Natural Disasters a Starter Guide for Water and Wastewater Utilities; Vol. EPA 810-B-16-002 June 2016. 2016. Available online: https://www.epa.gov/sites/default/files/2016-08/documents/160815-hazardmitigationfornaturaldisasters.pdf (accessed on 25 December 2022).
- Government India. Flood Early Warning System—A Warning Mechanism for MITIGATING Disaster during Flood; Government India: New Delhi, India, 2012. Available online: https://darpg.gov.in/sites/default/files/70.%20Flood%20Early%20Warning%20SystemFLEWS-Documentation-Final.pdf (accessed on 22 December 2022).
- Yucel, I.; Onen, A.; Yilmaz, K.K.; Gochis, D.J. Calibration and evaluation of a flood forecasting system: Utility of numerical weather prediction model, data assimilation and satellite-based rainfall. J. Hydrol. 2015, 523, 49–66. [Google Scholar] [CrossRef]
- Diakakis, M.; Deligiannakis, G.; Antoniadis, Z.; Melaki, M.; Katsetsiadou, N.K.; Andreadakis, E.; Spyrou, N.I.; Gogou, M. Proposal of a flash flood impact severity scale for the classification and mapping of flash flood impacts. J. Hydrol. 2020, 590, 125452. [Google Scholar] [CrossRef]
- Toker, E.; Ezber, Y.; Sen, O.L. Numerical simulation and sensitivity study of a severe hailstorm over Istanbul. Atmos. Res. 2021, 250, 105373. [Google Scholar] [CrossRef]
- Argüeso, D.; Hidalgo-Muñoz, J.M.; Gámiz-Fortis, S.R.; Esteban-Parra, M.J.; Dudhia, J.; Castro-Díez, Y. Evaluation of WRF parameterizations for climate studies over southern Spain using a multistep regionalization. J. Clim. 2011, 24, 5633–5651. [Google Scholar] [CrossRef]
- Zittis, G.; Hadjinicolaou, P.; Lelieveld, J. Comparison of WRF Model Physics Parameterizations over the MENA-CORDEX Domain. Am. J. Clim. Chang. 2014, 03, 490–511. [Google Scholar] [CrossRef]
- Fernández-González, S.; Martín, M.L.; García-Ortega, E.; Merino, A.; Lorenzana, J.; Sánchez, J.L.; Valero, F.; Rodrigo, J.S. Sensitivity analysis of the WRF model: Wind-resource assessment for complex terrain. J. Appl. Meteorol. Climatol. 2018, 57, 733–753. [Google Scholar] [CrossRef]
- Cunden, T.S.M.; Dhunny, A.Z.; Lollchund, M.R.; Rughooputh, S.D.D.V. Sensitivity analysis of WRF model for wind modelling over a complex topography under extreme weather conditions. In Proceedings of the 2018 5th International Symposium on Environment-Friendly Energies and Applications, EFEA 2018, Rome, Italy, 24–26 September 2018; Institute of Electrical and Electronics Engineers Inc.: Interlaken, Switzerland, 2019. [Google Scholar]
- Huang, H.; Lin, C.; Chen, Y. Sensitivity analysis of weather research and forecasting (WRF) model output variables to the thunderstorm lifecycle and its application. Nat. Hazards 2022, 114, 1967–1983. [Google Scholar] [CrossRef]
- Krishnamurti, T.N.; Bounoua, L. An Introduction to Numerical Weather Prediction Techniques, 1st ed.; CRC Press: Boca Raton, FL, USA, 1996. [Google Scholar]
- Rohatgi, J.; Araújo, A.; Primo, A. Extreme wind speeds and their prediction for wind turbines. Wind Eng. 2013, 37, 595–603. [Google Scholar] [CrossRef]
- Chen, X.; Xu, J.Z. Structural failure analysis of wind turbines impacted by super typhoon Usagi. Eng. Fail. Anal. 2016, 60, 391–404. [Google Scholar] [CrossRef]
- Trapani, K.; Redõn Santafé, M. A review of floating photovoltaic installations: 2007–2013. Prog. Photovoltaics Res. Appl. 2015, 23, 524–532. [Google Scholar] [CrossRef]
- World Bank Group; ESMAP; SERIS. Where Sun Meets Water: Floating Solar Market Report; World Bank Group: Washington, DC, USA, 2019; Available online: www.worldbank.org (accessed on 16 August 2020).
- Choi, Y.K. A study on power generation analysis of floating PV system considering environmental impact. Int. J. Softw. Eng. its Appl. 2014, 8, 75–84. [Google Scholar] [CrossRef]
- Durkovíc, V.; Durišíc, Ž. Analysis of the potential for use of floating PV power plant on the skadar lake for electricity supply of aluminium plant in montenegro. Energies 2017, 10, 1505. [Google Scholar] [CrossRef]
- Abid, M.; Abid, Z.; Sagin, J.; Murtaza, R.; Sarbassov, D.; Shabbir, M. Prospects of floating photovoltaic technology and its implementation in Central and South Asian Countries. Int. J. Environ. Sci. Technol. 2019, 16, 1755–1762. [Google Scholar] [CrossRef]
- Ueda, Y.; Kurokawa, K.; Konagai, M.; Takahashi, S.; Terazawa, A.; Ayaki, H. Five Years Demonstration Results of Floating Pv Systems with Water Spray Cooling. In Proceedings of the 27th European Photovoltaic Solar Energy Conference and Exhibition, Frankfurt, Germany, 24–28 September 2012. [Google Scholar]
- Tashtoush, B.; Al-Oqool, A. Factorial analysis and experimental study of water-based cooling system effect on the performance of photovoltaic module. Int. J. Environ. Sci. Technol. 2019, 16, 3645–3656. [Google Scholar] [CrossRef]
- Bontempo Scavo, F.; Tina, G.M.; Gagliano, A.; Nižetić, S. An assessment study of evaporation rate models on a water basin with floating photovoltaic plants. Int. J. Energy Res. 2021, 45, 167–188. [Google Scholar] [CrossRef]
- Sahu, A.; Yadav, N.; Sudhakar, K. Floating photovoltaic power plant: A review. Renew. Sustain. Energy Rev. 2016, 66, 815–824. [Google Scholar] [CrossRef]
- PV Magazine. Japan’s Largest Floating PV Plant Catches Fire after Typhoon Faxai Impact. 2019. Available online: https://www.pv-magazine.com/2019/09/09/japans-largest-floating-pv-plant-catches-fire-after-typhoon-faxai-impact/ (accessed on 14 October 2022).
- Kaymak, M.K.; Şahin, A.D. Problems encountered with floating photovoltaic systems under real conditions: A new FPV concept and novel solutions. Sustain. Energy Technol. Assess. 2021, 47, 101504. [Google Scholar] [CrossRef]
- Kaymak, M.K.; Şahin, A.D. The First Design and Application of Floating Photovoltaic (FPV) Energy Generation Systems in Turkey with Structural and Electrical Performance. Int. J. Precis. Eng. Manuf. Green Technol. 2021, 9, 827–839. [Google Scholar] [CrossRef]
- Kaymak, M.K.; Şahin, A.D. Floating and terrestrial photovoltaic systems comparison under extreme weather conditions. Int. J. Energy Res. 2022, 46, 20719–20727. [Google Scholar] [CrossRef]
- Prinsloo, F.C.; Schmitz, P.; Lombard, A. Sustainability assessment framework and methodology with trans-disciplinary numerical simulation model for analytical floatovoltaic energy system planning assessments. Sustain. Energy Technol. Assess. 2021, 47, 101515. [Google Scholar] [CrossRef]
- Rosa-Clot, P. FPV and Environmental Compatibility; Elsevier Inc.: Amsterdam, The Netherlands, 2020; ISBN 9780128170618. [Google Scholar]
- Reges, J.P.; Carvalho, P.C.M.; de Araújo, J.C.; Carneiro, T.C. Sizing Methodology of Floating Photovoltaic Plants in Dams of Semi-Arid Areas. J. Sol. Energy Eng. Trans. ASME 2022, 144, 041003. [Google Scholar] [CrossRef]
- Markowski, P.; Richardson, Y. Mesoscale Meteorology in Midlatitudes; John Wiley & Sons, Ltd.: Chichester, UK, 2010; 407p, ISBN 978-0-470-74213-6. [Google Scholar]
- National Weather Service (NWS). Severe Weather Forecasting Tip Sheet: WFO Louisville. Available online: https://www.weather.gov/media/lmk/soo/SvrWx_Fcstg_TipSheet.pdf (accessed on 22 December 2022).
- Öztürk, K.; Taştan, M.A. Investigating an extraordinary mesocyclonic tornado in the coastline of the Mediterranean, Turkey. In Proceedings of the 10th European Conference on Severe Storms, Krakow, Poland, 4–8 November 2019. [Google Scholar]
- Korkmaz, M.S.; Şahin, A.D. Developing a micrositing methodology for floating photovoltaic power plants. Int. J. Environ. Sci. Technol. 2023, 20, 7621–7644. [Google Scholar] [CrossRef]
- Türkeş, M.; Erlat, E. Climatological responses of winter precipitation in Turkey to variability of the North Atlantic Oscillation during the period 1930–2001. Theor. Appl. Climatol. 2005, 81, 45–69. [Google Scholar] [CrossRef]
- Korkmaz, K.A. Antalya Havalimanı’nda Gerçekleşen Hortum Olayının Ölçüm ve Asrükus veri Temeline Dayalı Incelenmesi; İstanbul Teknik Üniversitesi: İstanbul, Turkiye, 2020. [Google Scholar]
- Şafak, Y. Antalya’yı Hortum Vurdu: Ölü ve Yaralılar Var. 2019. Available online: https://www.sozcu.com.tr/2019/gundem/antalyada-hortum-can-aldi-1-olu-3254185/ (accessed on 20 October 2022).
- Şafak, Y. Photo (Damaged and Overturned Vehicles) from Kumluca. 2019. Available online: https://www.yenisafak.com/gundem/antalyayi-hortum-vurdu-olu-ve-yaralilar-var-3442923 (accessed on 20 October 2022).
- Funk, C.; Peterson, P.; Landsfeld, M.; Pedreros, D.; Verdin, J.; Shukla, S.; Husak, G.; Rowland, J.; Harrison, L.; Hoell, A.; et al. The climate hazards infrared precipitation with stations—A new environmental record for monitoring extremes. Sci. Data 2015, 2, 1–21. [Google Scholar] [CrossRef]
- NOAA-National Centers for Environmental Information North Atlantic Oscillation (NAO). Available online: https://www.ncei.noaa.gov/access/monitoring/nao/ (accessed on 20 October 2022).
- Copernicus Climate Change Service (C3S). Winter Windstorm Indicators for Europe from 1979 to 2021 Derived from Reanalysis. 2022. Available online: https://cds.climate.copernicus.eu/cdsapp#!/dataset/sis-european-wind-storm-indicators?tab=form (accessed on 8 September 2022).
- Taszarek, M.; Pilguj, N.; Allen, J.T.; Gensini, V.; Brooks, H.E.; Szuster, P. Comparison of Convective Parameters Derived from ERA5 and MERRA-2 with Rawinsonde Data over Europe and North America. J. Clim. 2021, 34, 3211–3237. [Google Scholar] [CrossRef]
- Skamarock, W.C.; Klemp, J.B.; Dudhia, J.; Gill, D.O.; Barker, D.M.; Duda, M.G.; Huang, X.-Y.; Wang, W.; Powers, J.G. A Description of the Advanced Research WRF Version 3. NCAR Tech. Note 2008, 475, 113. [Google Scholar]
- Mansell, E.R.; Ziegler, C.L.; Bruning, E.C. Simulated electrification of a small thunderstorm with two-moment bulk microphysics. J. Atmos. Sci. 2010, 67, 171–194. [Google Scholar] [CrossRef]
- Milbrandt, J.A.; Yau, M.K. A multimoment bulk microphysics parameterization. Part I: Analysis of the role of the spectral shape parameter. J. Atmos. Sci. 2005, 62, 3051–3064. [Google Scholar] [CrossRef]
- Milbrandt, J.A.; Yau, M.K. A multimoment bulk microphysics parameterization. Part II: A proposed three-moment closure and scheme description. J. Atmos. Sci. 2005, 62, 3065–3081. [Google Scholar] [CrossRef]
- Thompson, G.; Field, P.R.; Rasmussen, R.M.; Hall, W.D. Explicit forecasts of winter precipitation using an improved bulk microphysics scheme. Part II: Implementation of a new snow parameterization. Mon. Weather Rev. 2008, 136, 5095–5115. [Google Scholar] [CrossRef]
- Hong, S.-Y.; Lim, J.-O.J. The WRF Single-Moment 6-Class Microphysics Scheme (WSM6). J. Korean Meteorol. Soc. 2006, 42, 129–151. [Google Scholar]
- Janjic, Z.I. The step-mountain eta coordinate model: Further developments of the convection, viscous sublayer, and turbulence closure schemes. Mon. Weather Rev. 1994, 122, 927–945. [Google Scholar] [CrossRef]
- Hong, S.Y.; Noh, Y.; Dudhia, J. A new vertical diffusion package with an explicit treatment of entrainment processes. Mon. Weather Rev. 2006, 134, 2318–2341. [Google Scholar] [CrossRef]
- Iacono, M.J.; Delamere, J.S.; Mlawer, E.J.; Shephard, M.W.; Clough, S.A.; Collins, W.D. Radiative forcing by long-lived greenhouse gases: Calculations with the AER radiative transfer models. J. Geophys. Res. Atmos. 2008, 113, D13103. [Google Scholar] [CrossRef]
- Tewari, M.; Wang, W.; Dudhia, J.; LeMone, M.A.; Mitchell, K.; Ek, M.; Gayno, G.; Wegiel, J.; Cuenca, R. Implementation and verification of the united NOAH land surface model in the WRF model. In Proceedings of the 20th Conference on Weather Analysis and Forecasting/16th Conference on Numerical Weather Prediction, Madison, WI, USA, 14 January 2004; American Meteorological Society: Seattle, WA, US. [Google Scholar]
- Kain, J.S. The Kain–Fritsch Convective Parameterization: An Update. J. Appl. Meteorol. 2004, 43, 170–181. [Google Scholar] [CrossRef]
- Ozeren, Y.; Wren, D.G. Technical Note: Predicting Wind-Driven Waves in Small Reservoirs. Trans. ASABE 2009, 52, 1213–1221. [Google Scholar] [CrossRef]
- Ahrens, C.D.; Henson, R. Meteorology Today, 12th ed.; Cengage: Boston, MA, USA, 2019; ISBN 978-1-337-61666-9. [Google Scholar]
- Kömüşcü, A.Ü.; Oğuz, K. Analysis of cold anomalies observed over Turkey during the 2018/2019 winter in relation to polar vortex and other atmospheric patterns. Meteorol. Atmos. Phys. 2021, 133, 1327–1354. [Google Scholar] [CrossRef]
- Cavicchia, L.; von Storch, H.; Gualdi, S. A long-term climatology of medicanes. Clim. Dyn. 2014, 43, 1183–1195. [Google Scholar] [CrossRef]
- Campins, J.; Genovés, A.; Picornell, M.A.; Jansà, A. Climatology of Mediterranean cyclones using the ERA-40 dataset. Int. J. Climatol. 2011, 31, 1596–1614. [Google Scholar] [CrossRef]
- Groenemeijer, P.; Kühne, T. A Climatology of tornadoes in Europe: Results from the European severe weather database. Mon. Weather Rev. 2014, 142, 4775–4790. [Google Scholar] [CrossRef]
- Flocas, H.A. Diagnostics of cyclogenesis over the Aegean sea using potential vorticity inversion. Meteorol. Atmos. Phys. 2000, 73, 25–33. [Google Scholar] [CrossRef]
- Yavuz, V.; Deniz, A.; Özdemir, E.T.; Karan, H.; Temiz, C. Long-term thunderstorm analysis at airports in the Marmara Region: Types and favourable atmospheric conditions. Int. J. Glob. Warm. 2022, 28, 81. [Google Scholar] [CrossRef]
- Türkeş, M. Klimatoloji ve Meteoroloji, 2nd ed.; Kriter Yayıncılık: İstanbul, Türkiye, 2022; ISBN 978-605-5863-39-5. [Google Scholar]
- Soukissian, T.H.; Karathanasi, F.E.; Zaragkas, D.K. Exploiting offshore wind and solar resources in the Mediterranean using ERA5 reanalysis data. Energy Convers. Manag. 2021, 237, 114092. [Google Scholar] [CrossRef]
- Rasool, M.H.; Perwez, U.; Qadir, Z.; Ali, S.M.H. Scenario-based techno-reliability optimization of an off-grid hybrid renewable energy system: A multi-city study framework. Sustain. Energy Technol. Assessments 2022, 53, 102411. [Google Scholar] [CrossRef]
- Chen, X.; Xiao, J.; Yuan, J.; Xiao, Z.; Gang, W. Application and performance analysis of 100% renewable energy systems serving low-density communities. Renew. Energy 2021, 176, 433–446. [Google Scholar] [CrossRef]
- Türkay, B.E.; Telli, A.Y. Economic analysis of stand alone and grid connected hybrid energy systems. In Proceedings of the 2009 International Conference on Electrical and Electronics Engineering—ELECO 2009, Bursa, Türkiye, 5–8 November 2009; pp. 1931–1943. [Google Scholar]
Figure 1.
The FPV of Büyükçekmece Lake in İstanbul (a): calm and windless weather, (b): lightly windy and wavy.
Figure 1.
The FPV of Büyükçekmece Lake in İstanbul (a): calm and windless weather, (b): lightly windy and wavy.
Figure 2.
Meteorological analysis scheme of thunderstorm events in Antalya in January 2019.
Figure 2.
Meteorological analysis scheme of thunderstorm events in Antalya in January 2019.
Figure 3.
Location map of the study area.
Figure 3.
Location map of the study area.
Figure 4.
(
a) Damaged and overturned vehicles from Kumluca district [
58]. (
b) Damaged marketplace and road on Finike district [
57].
Figure 4.
(
a) Damaged and overturned vehicles from Kumluca district [
58]. (
b) Damaged marketplace and road on Finike district [
57].
Figure 5.
Manavgat dam reservoir area (from State Hydraulic Works (DSİ in Turkish abbreviation) 13th Regional Directorate).
Figure 5.
Manavgat dam reservoir area (from State Hydraulic Works (DSİ in Turkish abbreviation) 13th Regional Directorate).
Figure 6.
Automatic Weather Observation Stations (AWOSs) of the Study.
Figure 6.
Automatic Weather Observation Stations (AWOSs) of the Study.
Figure 7.
Nested domains for the WRF simulations.
Figure 7.
Nested domains for the WRF simulations.
Figure 8.
Long-term precipitation anomalies with NAO Index in Antalya.
Figure 8.
Long-term precipitation anomalies with NAO Index in Antalya.
Figure 9.
300 hPa jet streams (kn, shaded), geopotantial height (gpdam, black contours) and horizontal divergence (10−6/s, white contours) (a); relative vorticity (10−5/s, shaded) and wind (kn, wind bars) (b) over the Europe on 24 January 2019, 00:00 UTC (retrieved from wetter3.de (accessed on 20 December 2022)).
Figure 10.
SkewT-logP thermodynamic diagram of 24 January 2019, 00:00 UTC (
a) and 06:00 UTC (
b) near Antalya (retrieved from
www.rawinsonde.com (accessed on 20 December 2022)).
Figure 10.
SkewT-logP thermodynamic diagram of 24 January 2019, 00:00 UTC (
a) and 06:00 UTC (
b) near Antalya (retrieved from
www.rawinsonde.com (accessed on 20 December 2022)).
Figure 11.
500 mb geopotential height (gpdam, shaded), surface pressure (hPa, white contours) and geopotantial height thickness between 1000 hPa and 500 hPa (gpdam, black contours) over the Europe on 24 January 2019, 00:00 UTC (a) and 06:00 UTC (b) (retrieved from wetter3.de (accessed on 20 December 2022)). Thick and blue lines show main and secondary trough lines.
Figure 12.
850 hPa temperature (°C, shaded area and contours) over Europe on January 24, 2019, 00:00 UTC (a) at 06:00 UCT (b) (retrieved from wetter3.de (accessed on 20 December 2022)).
Figure 12.
850 hPa temperature (°C, shaded area and contours) over Europe on January 24, 2019, 00:00 UTC (a) at 06:00 UCT (b) (retrieved from wetter3.de (accessed on 20 December 2022)).
Figure 13.
Front charts of Europe on 24 January 2019, 00:00 UTC (a) and 06:00 UTC (b) (retrieved from UK-METOffice (accessed on 20 December 2022)).
Figure 13.
Front charts of Europe on 24 January 2019, 00:00 UTC (a) and 06:00 UTC (b) (retrieved from UK-METOffice (accessed on 20 December 2022)).
Figure 14.
Wind speed (m/s) observations (black contours) and configured model outputs (colored contours) for Kaş (a), Finike (b), Antalya Airport (c), Manavgat (d) and Alanya (e) stations between 24 and 26 January 2019.
Figure 14.
Wind speed (m/s) observations (black contours) and configured model outputs (colored contours) for Kaş (a), Finike (b), Antalya Airport (c), Manavgat (d) and Alanya (e) stations between 24 and 26 January 2019.
Figure 15.
MKM configuration results of surface pressure and wind speed at (a) 24 January 2019 06:00 UTC, (b) 24 January 2019 09:00 UTC, (c) 26 January 2019 06:00 UTC, and (d) 26 January 2019 09:00 UTC.
Figure 15.
MKM configuration results of surface pressure and wind speed at (a) 24 January 2019 06:00 UTC, (b) 24 January 2019 09:00 UTC, (c) 26 January 2019 06:00 UTC, and (d) 26 January 2019 09:00 UTC.
Figure 16.
Wave height calculations for pseudo reservoirs near observation stations in Antalya province: (a) Kaş, (b) Finike, (c) Antalya, (d) Manavgat, and (e) Alanya.
Figure 16.
Wave height calculations for pseudo reservoirs near observation stations in Antalya province: (a) Kaş, (b) Finike, (c) Antalya, (d) Manavgat, and (e) Alanya.
Table 1.
Description of model configuration.
Table 1.
Description of model configuration.
| Model | WRF 4.3.3 |
|---|
| Central point of domain | 36.60° N and 31.05° E |
| Number of nesting | 3 |
| Horizontal resolutions | 9, 3, and 1 km |
| Vertical levels | 41 |
| Temporal resolution | 180, 180, and 15 min |
| Temporal extent | 23.01.2010 00:00 UTC to 31.01.2019 00:00 UTC |
| Initial/boundary condition | ERA5 (interval seconds: 10,800) |
| Microphysics schemes | Milbrandt, NSSL2, WSM6 and Thompson |
| Cumulus schemes | Kain–Fritsch (used only for outmost domain) |
| PBL schemes | MYJ, YSU |
| Radiation scheme | RRTMG |
| Land-surface scheme | NOAH |
Table 2.
Various configurations for sensitivity analysis with physics schemes in the study.
Table 2.
Various configurations for sensitivity analysis with physics schemes in the study.
| Abbreviation in the Paper | PBL | Cumulus | Microphysics |
|---|
| MKM | MYJ | Kain–Fritsch | Milbrandt |
| MKN | MYJ | Kain–Fritsch | NSSL2 |
| MKT | MYJ | Kain–Fritsch | Thompson |
| MKW | MYJ | Kain–Fritsch | WSM6 |
| YKM | YSU | Kain–Fritsch | Milbrandt |
| YKN | YSU | Kain–Fritsch | NSSL2 |
| YKT | YSU | Kain–Fritsch | Thompson |
| YKW | YSU | Kain–Fritsch | WSM6 |
Table 3.
Error metrics of Wind Speed Modelling of different WRF Model configurations.
Table 3.
Error metrics of Wind Speed Modelling of different WRF Model configurations.
| | | | Configurations (Table 2 for Abbreviation) |
|---|
| Station Number | Station Name | Error Metric | MKM | MKN | MKT | MKW | YKM | YKN | YKT | YKW |
|---|
| 17380 | Kaş | Mean Biased | −1.663 | −1.314 | −1.286 | −1.524 | −1.738 | −1.417 | −1.271 | −1.363 |
| RMSE | 2.394 | 2.236 | 2.145 | 2.371 | 2.567 | 2.210 | 2.097 | 2.386 |
| Pearson correlation (r) | 0.548 | 0.603 | 0.624 | 0.511 | 0.522 | 0.651 | 0.616 | 0.532 |
| NSE | −1.482 | −1.165 | −0.993 | −1.435 | −1.853 | −1.116 | −0.905 | −1.466 |
| 17375 | Finike | Mean Biased | −1.575 | −1.837 | −1.473 | −1.793 | −1.643 | −1.654 | −1.340 | −1.748 |
| RMSE | 3.057 | 3.399 | 3.014 | 3.382 | 3.110 | 3.148 | 3.041 | 3.457 |
| Pearson correlation (r) | 0.713 | 0.715 | 0.723 | 0.711 | 0.672 | 0.680 | 0.687 | 0.637 |
| NSE | −2.229 | −2.991 | −2.140 | −2.952 | −2.342 | −2.424 | −2.195 | −3.130 |
| 17300 | Antalya Airport | Mean Biased | 0.873 | 0.702 | 1.034 | 0.826 | 0.367 | 0.339 | 0.707 | 0.898 |
| RMSE | 4.401 | 4.372 | 4.305 | 4.636 | 4.487 | 4.132 | 4.195 | 4.482 |
| Pearson correlation (r) | 0.543 | 0.547 | 0.552 | 0.535 | 0.692 | 0.659 | 0.699 | 0.715 |
| NSE | −0.091 | −0.077 | −0.044 | −0.211 | −0.134 | 0.038 | 0.009 | −0.132 |
| 17954 | Manavgat | Mean Biased | −2.507 | −2.679 | −2.347 | −2.555 | −3.014 | −3.042 | −2.674 | −2.482 |
| RMSE | 3.051 | 3.241 | 2.962 | 3.123 | 3.650 | 3.474 | 3.206 | 3.067 |
| Pearson correlation (r) | 0.819 | 0.791 | 0.769 | 0.769 | 0.762 | 0.783 | 0.759 | 0.750 |
| NSE | −0.843 | −1.079 | −0.737 | −0.930 | −1.638 | −1.389 | −1.034 | −0.862 |
| 17310 | Alanya | Mean Biased | −3.857 | −3.984 | −3.986 | −3.898 | −3.727 | −3.783 | −3.723 | −3.930 |
| RMSE | 4.364 | 4.372 | 4.444 | 4.410 | 4.178 | 4.192 | 4.204 | 4.338 |
| Pearson correlation (r) | 0.038 | 0.158 | 0.091 | 0.124 | 0.068 | 0.063 | 0.067 | 0.135 |
| NSE | −10.681 | −10.724 | −11.113 | −10.925 | −9.705 | −9.779 | −9.840 | −10.540 |
Table 4.
Calculated Average Water Waves Characteristics with Modified SPM Model (during the thunderstorm event in January 2019).
Table 4.
Calculated Average Water Waves Characteristics with Modified SPM Model (during the thunderstorm event in January 2019).
| Location | Uz (2 m Wind Speed)
(m/s) | U10 (10 m Wind Speed)
(m/s) | Ua (Wind Stress Factor)
(m/s) | tmin (Minimum Duration Time)
(Seconds) | Ho (Wave Height)
(m) | Tp (Peak
Period)
(Seconds) |
|---|
| Alanya | 4.69 | 5.91 | 6.41 | 263.79 | 0.09 | 1.01 |
| Antalya | 6.15 | 7.74 | 9.03 | 302.91 | 0.13 | 1.16 |
| Finike | 4.10 | 5.16 | 5.85 | 227.68 | 0.08 | 0.87 |
| Kaş | 4.64 | 5.84 | 6.39 | 259.37 | 0.09 | 0.99 |
| Manavgat | 6.01 | 7.57 | 8.82 | 297.99 | 0.13 | 1.14 |
| Disclaimer/Publisher’s Note: The statements, opinions and data contained in all publications are solely those of the individual author(s) and contributor(s) and not of MDPI and/or the editor(s). MDPI and/or the editor(s) disclaim responsibility for any injury to people or property resulting from any ideas, methods, instructions or products referred to in the content. |
© 2023 by the authors. Licensee MDPI, Basel, Switzerland. This article is an open access article distributed under the terms and conditions of the Creative Commons Attribution (CC BY) license (https://creativecommons.org/licenses/by/4.0/).


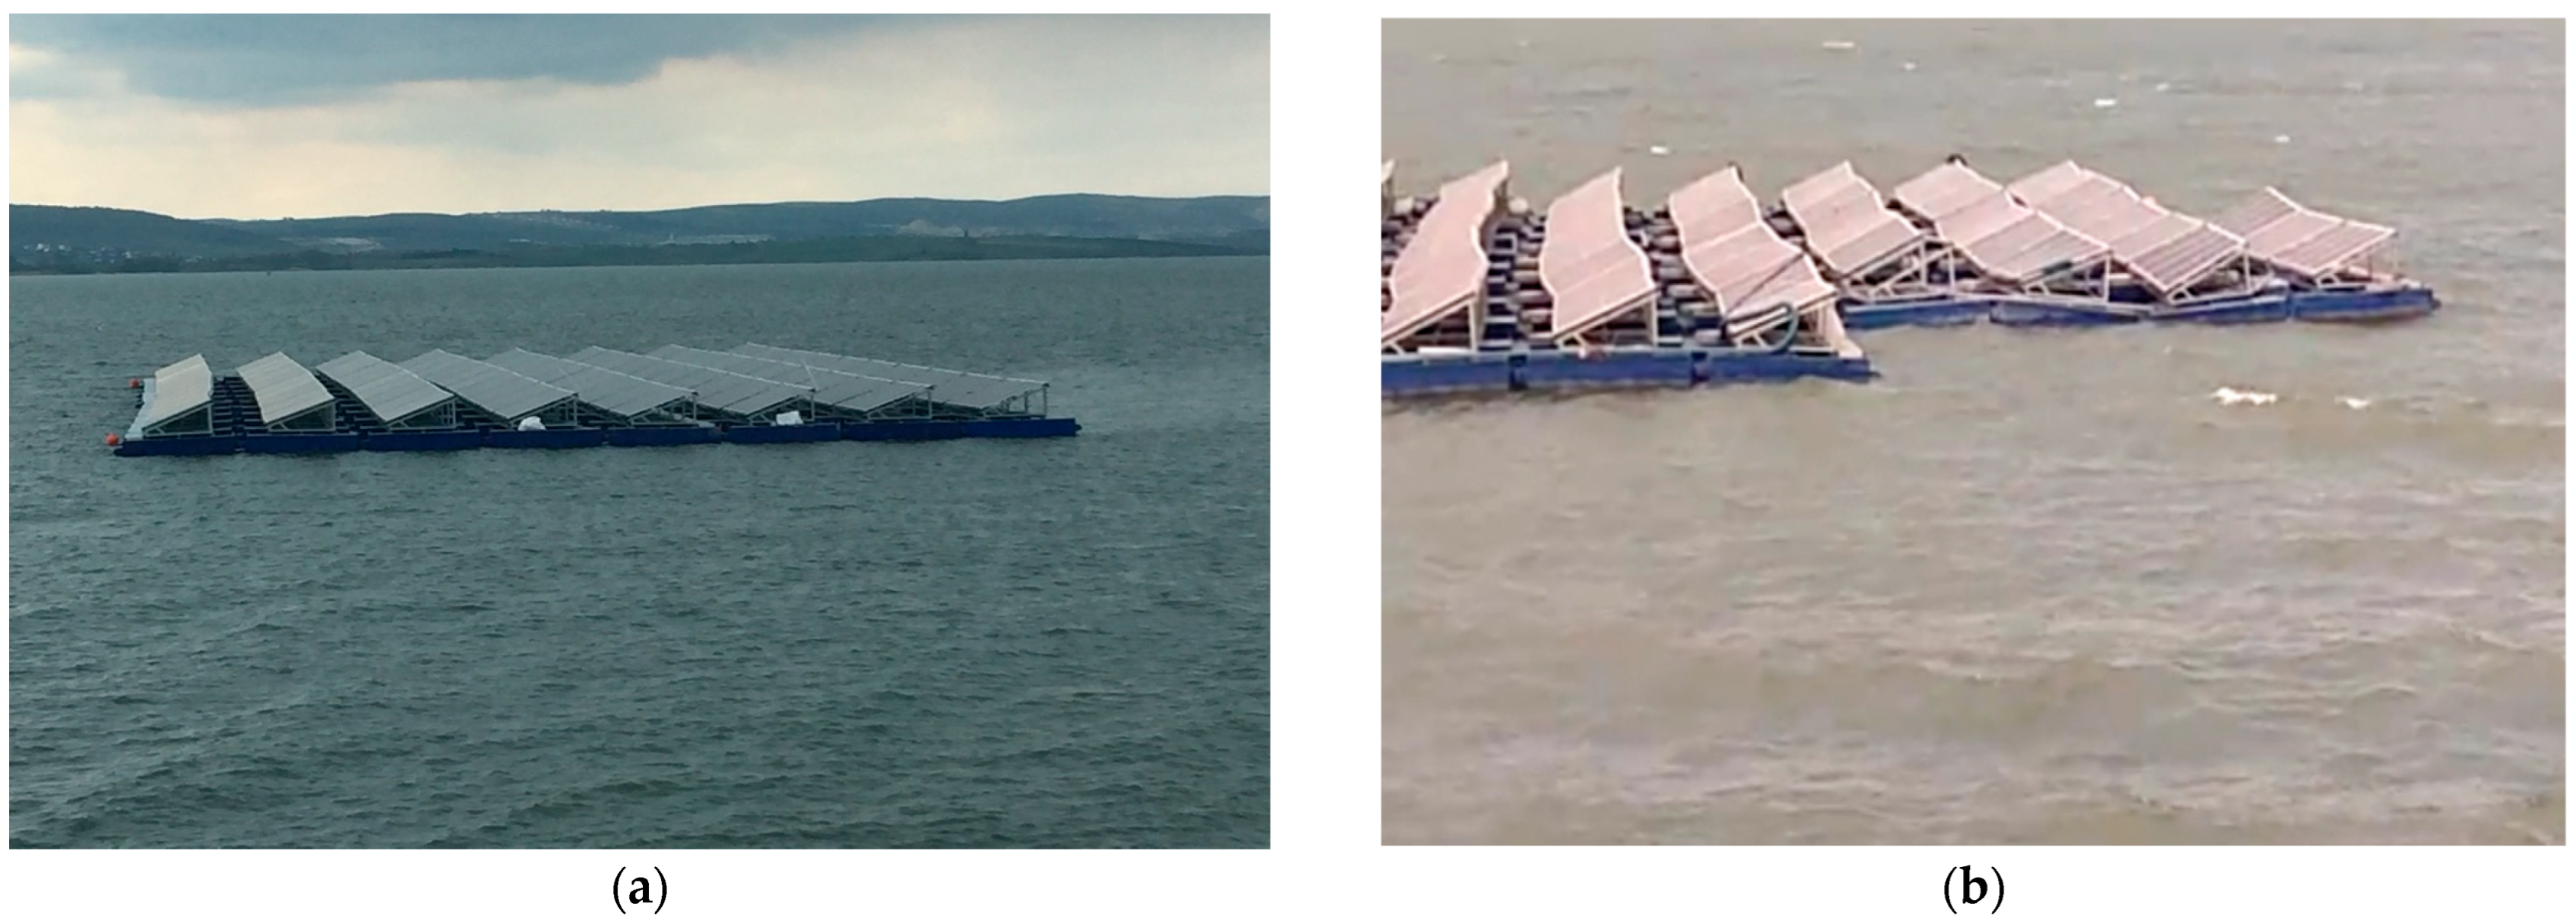
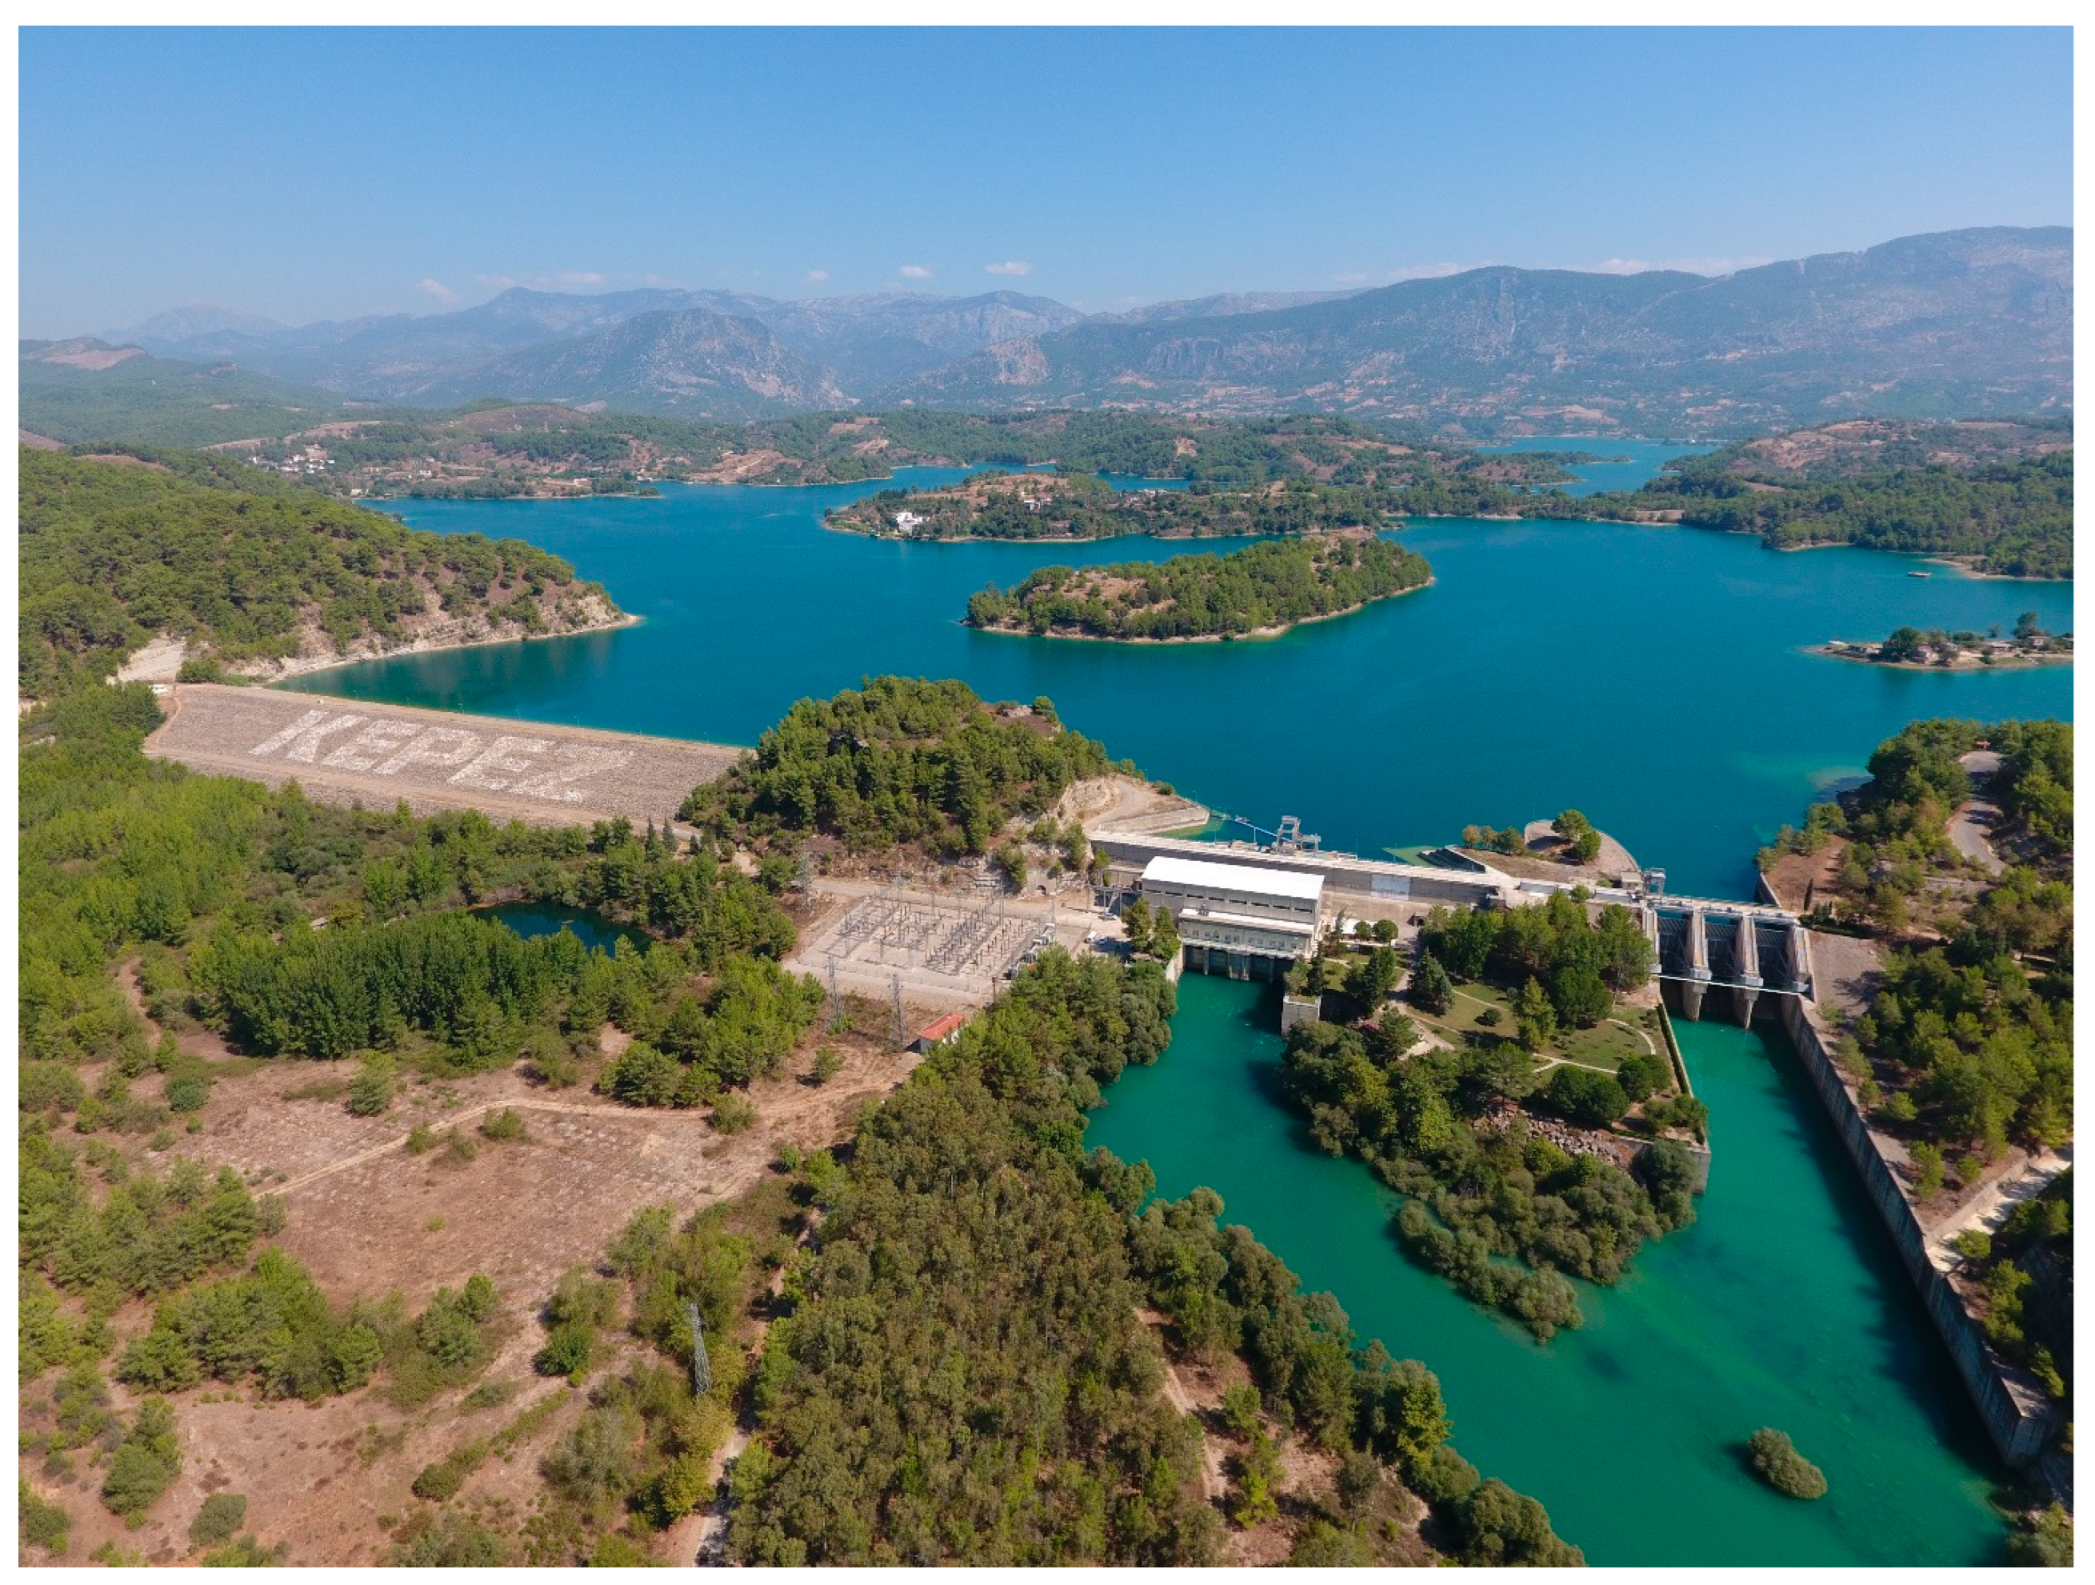
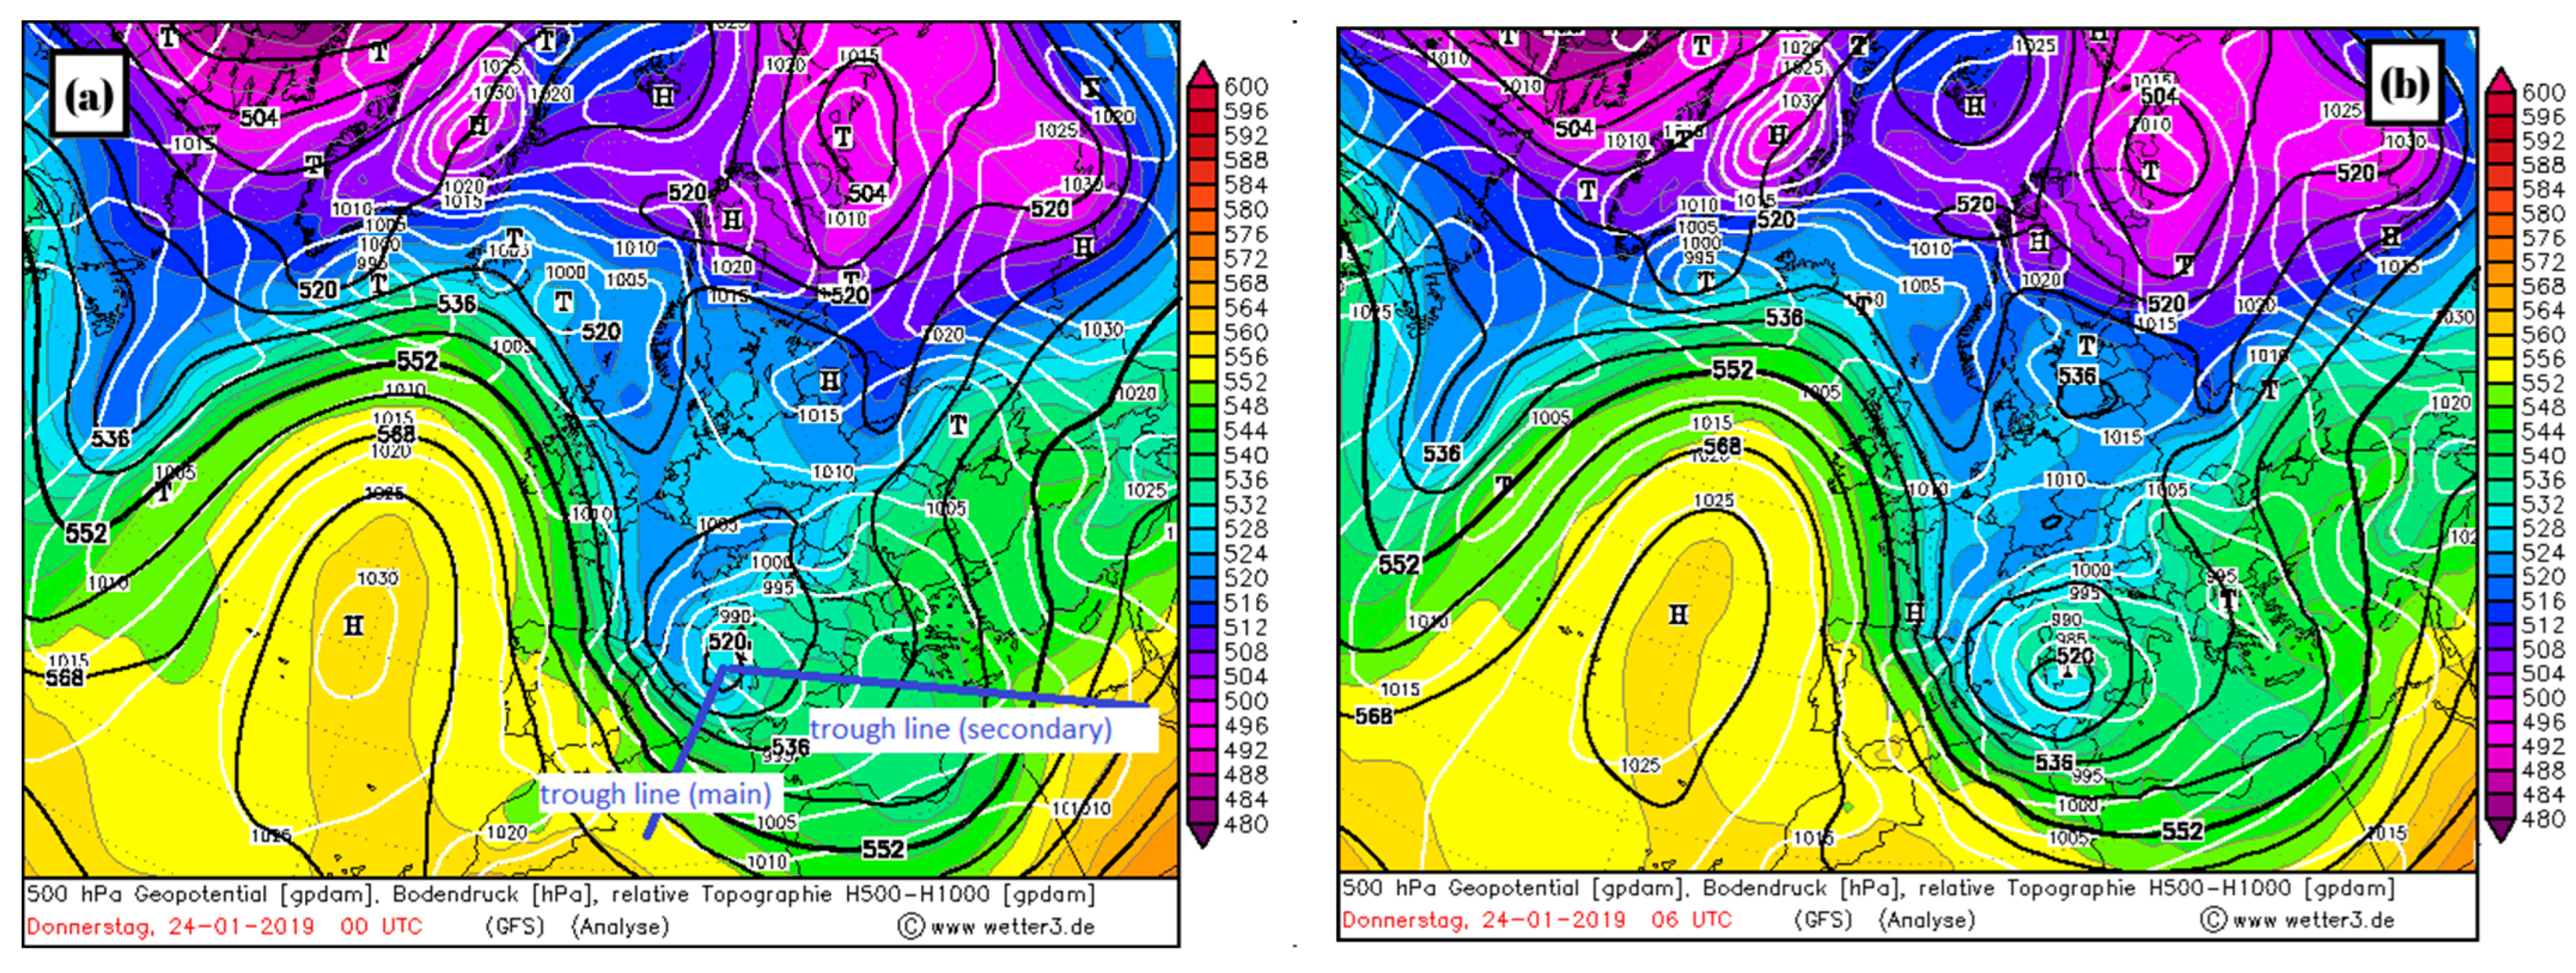
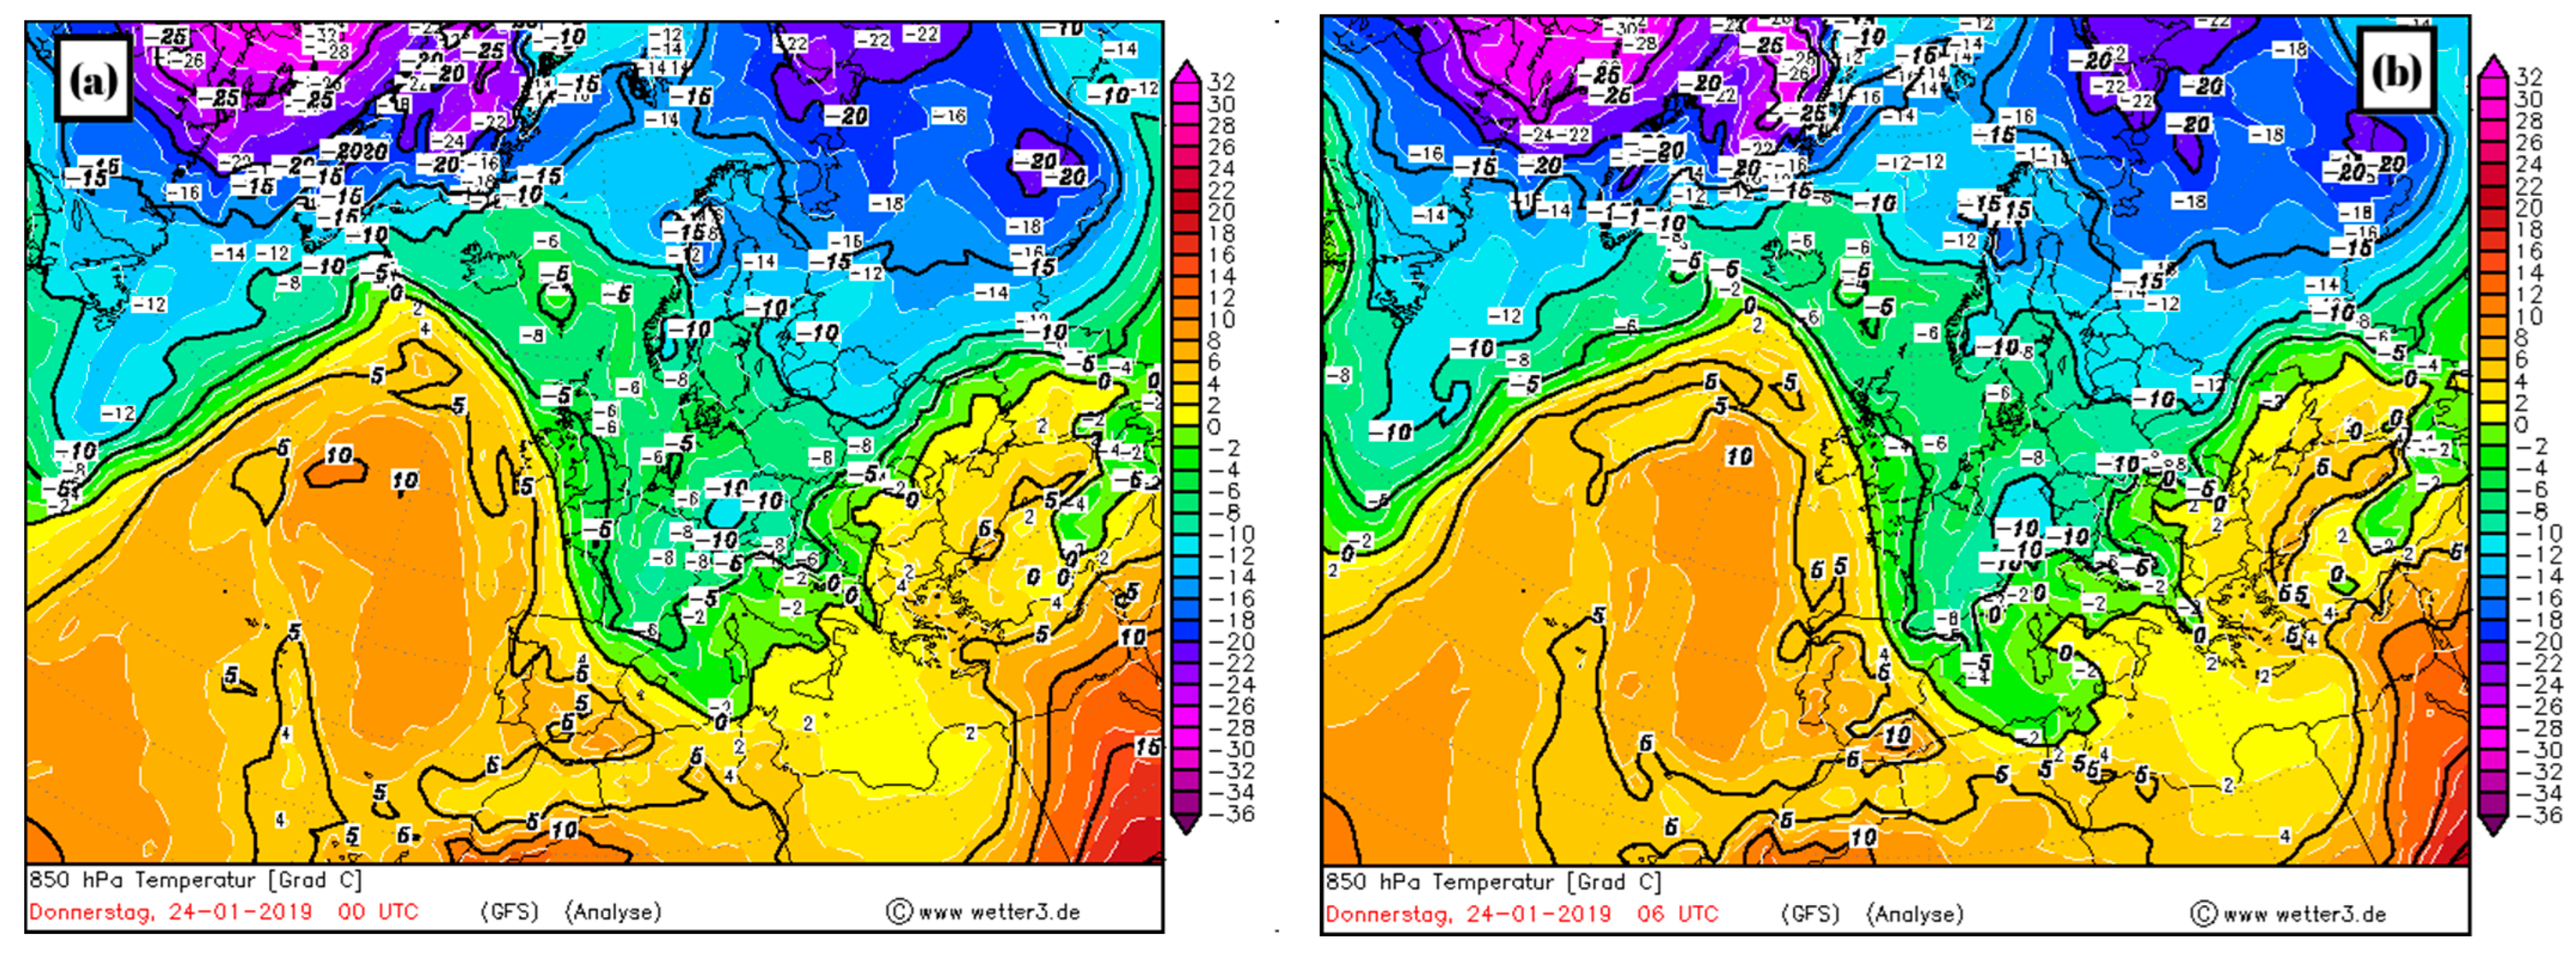