Article

Individual Pattern Response to CO2-Induced Acidification Stress in Haliotis rufescens Suggests Stage-Specific Acclimatization during Its Early Life History

by
Ricardo Gómez-Reyes
1,
Clara E. Galindo-Sánchez
2,
Fabiola Lafarga-De la Cruz
3,
José M. Hernández-Ayón
4,
Enrique Valenzuela-Wood
4 and
Laura López-Galindo
4,*
1
Facultad de Ciencias Marinas, Universidad Autónoma de Baja California, Ensenada 22860, Baja California, Mexico
2
Departamento de Biotecnología Marina, Centro de Investigación Científica y de Educación Superior de Ensenada, Baja California, Ensenada 22860, Baja California, Mexico
3
Departamento de Acuicultura, Centro de Investigación Científica y de Educación Superior de Ensenada, Baja California, Ensenada 22860, Baja California, Mexico
4
Instituto de Investigaciones Oceanológicas, Universidad Autónoma de Baja California, Ensenada 22860, Baja California, Mexico
*
Author to whom correspondence should be addressed.
Sustainability 2023, 15(18), 14010; https://doi.org/10.3390/su151814010
Submission received: 15 June 2023 / Revised: 31 August 2023 / Accepted: 5 September 2023 / Published: 21 September 2023

Abstract

:
The red abalone Haliotis rufescens is a pivotal marine resource in the context of worldwide abalone aquaculture. However, the species has been listed as critically endangered partly because of the life-history massive mortalities associated with habitat climate changes, including short- and long-term ocean acidification. Because abalone survival depends on its early life history success, figuring out its vulnerability to acidification is the first step to establishing culture management strategies. In the present study, red abalone embryos were reared under long-term CO2-induced acidification (pH 7.8 and 7.6) and evaluated. The impairment prevalence was assessed during their larval stages, considering the developmental success, growth and calcification. The result in the stage-specific disturbance suggests that the body abilities evaluated are at the expense of their development stages, of which the critical threshold is found under −0.4 pH units. Finally, the settlement was short-term stressed, displaying the opposite to that observed in the long-term acidification. Thus, the early life history interacts through multiple pathways that may also depend on the acidification challenge (i.e., short or long term). Understanding the tolerance limits and pathways of the stress response provides valuable insights for exploring the vulnerability of H. rufescens to ocean acidification.

Graphical Abstract

1. Introduction

Ocean acidification (OA) is a term that “commonly refers to the ongoing decrease in ocean pH owing to the ocean’s uptake of anthropogenic CO2” [1]. To date, the ocean has sunk 26% of the total CO2 emissions [2]. The Intergovernmental Panel on Climate Change (IPCC) suggests that the partial CO2 pressure may double by the year 2100 [3]. The thermodynamic reactions between CO2 and seawater modify the global carbon cycle in the ocean through the increase in the concentration of hydrogen ions ([H+]]) in seawater. This reaction represents a decrease not only in the pH, but also in the concentrations of carbonate ions ([ C O 3 2 ]) and, eventually, the saturation state of calcium carbonate ( C a C O 3 )—the mineral that is necessary to form the skeletons and shells of diverse marine organisms including mollusks [4].
The red abalone Haliotis rufescens Swainson, 1822, is a Pacific marine gastropod belonging to the Vetigastropoda distributed from Central Oregon, U.S.A. to Central Baja California, Mexico [5], which was estimated as the most relevant class of mollusk capture and culture [6]. The abalone life history includes an indirect biphasic larval life cycle with a short pelagic period, which moves from hours to several days, previous to its benthic lifestyle [7]. The larval life cycle comprises embryo fertilization and the initiation of metamorphosis, in which various maturation stages are found until recruitment, where planktonic larvae settle to give birth to the benthic lifestyle. Red abalone was recently listed as critically endangered because of overfishing and the massive mortality associated with climate changes during its early life stages [8]. Along the Pacific coast of North America, episodic water upwelling with a high CO2 content and low pH (i.e., corrosive acidified waters) was documented [9], and these acidification events were predicted to increase in the incoming years [10]. In multiple marine shelled mollusks, the most sensitive life history stage seems to be larvae, with a large majority of studies on this critical period of development revealing negative effects [11]. In other abalone species, impairment in their somatic performance was observed, where one or multiple planktonic stages were periodically exposed to corrosive waters, including survival, development, growth, morphology and the calcification rate [12,13,14,15,16,17,18,19]. Although the effect of the sudden acidification (henceforth “short-term”, involving the time span in hours) has been demonstrated on the abalone larval life, the literature does not reveal any clues regarding the effect on prolonged periods of acidification (henceforth “long-term”, involving the time span in several days) in planktonic larvae nor the prevalence of the deleterious effect throughout their pelagic period. Recently, contradictory results regarding larval performance against long-term acidification were shown [20,21,22], indicating that planktonic larvae may be resilient in some way to acidification. Nevertheless, this suggests that tolerance depends on different response pathways during its larval life cycle upon stress by the short- or long-term exposure to acidification. Finally, despite the weak population structure concerning red abalone due to its limited dispersal ability [23,24], genetic signatures of spatial adaptation were reported related to geographic variation along the Pacific coast [25]. Thus, local natural selection in the red abalone with different habitats include those under environmental stressors such as acidification. Due to its endangered status and projections for the natural H. rufescens habitat, determining the acidification sensitivity from a local population is an urgent task and may contribute to understanding how red abalone is facing climate change.
Because little attention has been paid to the prevalence of OA effects and which other compensatory abilities from the somatic growth remains at the expense of acidification stress during larval transitory stages, the major goal in the present research is to conduct an acidification experiment considering the assessment of long-term acidification stress during the critical early life history stages of H. rufescens. Moreover, the trochophore, early, middle and mature veliger ontogeny are included, contrasting stress response under two levels of CO2 acidification challenges and how the species modifies its morphology, developmental success, growth and calcification. Finally, the stress response under short- and long-term tolerance is evaluated during settlement.

2. Materials and Methods

2.1. Acclimation and Bioassay Overview

The bioassay consisted of evaluating the abalone’s early life history under present-day water conditions (control) compared to two possible climate change scenarios mimicking different pH, pCO2 and aragonite regimes [26]. A total of   1.7 × 10 6 fertilized eggs (97% fertilization rate) obtained from mass spawning (50 females and 20 males from an equal batch) were provided from the local farm facilities of Abulones Cultivados S. de R.L. de C.V. (Ensenada Baja California, Mexico at 31°17′23.9″ N, −116°24′35.9″ W). The fertilized eggs were transferred in sealed plastic Nalgene-like containers surrounded by ice packs in a cooler to the Applied Genomics and Marine Immunopathology Laboratory of the Oceanological Research Institute at UABC (IIO-Universidad Autónoma de Baja California) at Ensenada, B.C., Mexico in February 2022. Subsequently, they were maintained in FSW vessels (20 L) at room temperature for ~8 h. Afterward, the CO2-induced acidification challenge was conducted in plastic trays with seawater open-flow low current stream (n = 3, Figure S1) using 574,000 randomly selected embryos per treatment: control (8.0), moderate (7.8) and low (7.6) pH, respectively. The transitory stages of the early life history evaluated during the bioassay are summarized in Figure 1 and Table 1. Technical details supporting the CO2 injection system’s design and operation are described in the Supplementary Material.

2.2. Water Chemistry Analyses

Discrete water samples were taken from the experimental tanks (n = 6 per treatment) to evaluate water chemistry parameters during the bioassay. For the discrete samples in the laboratory, dissolved inorganic carbon (DIC) was quantified using the coulometric method described by Johnson et al. (1987) [27]. Total alkalinity (TA) was measured via open-cell titration following the standard operating procedure described by Dickson et al. (2007, SOP 3b) [28] and by using an automatic total alkalinity system (Model P-TA, PONTUS, Mexico; http://www.pontusbaja.com). Certified reference material (A. Dickson, Scripps, UCSD) was used for the DIC and TA measurements. The accuracy obtained for the reference material for DIC and TA was ± 3 μmol kg−1. Salinity was determined in the laboratory using a YSI3200 salinometer (±0.1; YSI, OH, USA). In situ pH (total proton scale, p H T ), carbonate concentrations [ C O 3 2 ], pCO2 and aragonite saturation (Ωara) values were derived from the DIC and TA values using CO2SYS software version 2.0 [29] with the dissociation constants of Mehrbach et al. (1973) [30], the sulfate constants of Dickson (1990) [31] and the borate constant of Uppström (1974) [32]. The pH was measured continuously during the bioassay using an in-house set of sensors immersed in the experimental tanks. Here, sensors were calibrated using the National Bureau of Standards (NBS). The pH slope of the NBS buffer solutions (pH 4 and 7) was calculated several times during the experiment to manage the sensor calibration (% offset: 98 ± 0.007, mean ± S.E.). Then, fluctuations in saturation levels concerning Ωara were predicted from measured p H N B S records and in situ p H T (R spearman = 0.57, p = 0.01, Figure S2).

2.3. Hatching Success

Trochophore larvae (24 HPF) were gently siphoned from the top of the open-flow trays, sieved through meshes of 200 and 100 μm using FSW and placed in separate vessels, ensuring that the FSW corresponded to the pH of each treatment. Hatching success was assessed in 1 mL aliquots (n = 6) from the open-flow trays (Figure S1), formalin fixed (1 drop/mL) and stored at room temperature. Then, hatched larvae were placed in the water reuse system tanks (n = 6) under the experimental conditions with a density of 12 hatched larvae m L 1 to continue the bioassay during subsequent larval development. Aliquots were counted under a microscope (4× magnification) using a counting slide to estimate the number of hatched larvae. The total volume of the individual containers ( V 1 ) was divided by the size of a sample volume ( V 2 ) and then multiplied by the resulting number of larvae counted in a dish (N), according to X = N ( V 1 / V 2 ) , where X is the total number of larvae in a large container; N is the number of larvae counted in a sample; V 1 is the total volume of the container and V 2 is the volume of the sample. The total number of larvae was divided by the 574,000 embryos used at the starting bioassay to calculate the hatching success. After hatching, trochophores and early veliger larvae were observed; an additional evaluation was made by scoring one of the possible morphological groups: normal shelled (success) and abnormal shelled or unshelled groups (failure), respectively (Figure S3) [17].

2.4. Veliger Maturation Success

A fraction of abalone larvae was gently siphoned after 30, 48, 60 and 108 HPF to evaluate the veliger maturation performance. Samples were formalin fixed (1 drop/mL) and stored at room temperature, followed by serial successive ethanol dehydration using rinses of the following concentrations: 50, 75 and finally, 90% ethanol. Veliger larvae suspended in 90% ethanol were stored for subsequent microscopic assessments, which included birefringence and morphometric analyses. According to Leighton (1972) [33], 500 to 1000 larvae per replicate (n = 6) were scored as successfully matured if they presented the general stage features at the time the samplings were carried out after 30, 48 and 60 HPF (Table 1). Competence success was estimated for 108 HPF as described in Section 2.7.

2.5. Morphometric Analyses

Larval growth was evaluated with a morphometric analysis of size comparisons using length and width parameters among specimens. The software Motic Image Plus v3.019 (Motic China Group) was set up according to the specifications for measuring images at 10× magnification. A set of 50 individuals per treatment was assessed to calculate the body length and width at 30, 48, 60 and 108 HPF. In larvae at 30 HPF, the measurement landmark was made horizontally along the main ciliary band (prototroch) and vertically from the anterior apical tuft towards the heads of the larvae (Figure S4A,B) [17]. On the other hand, the assessments performed at 48, 60 and 108 HPF considered the larval maximum body length and width (Figure S4C) [34]. Because of collinearity, morphometric parameters were combined as the square root of the length and width product and used to estimate an index for larval growth (Figure S5) [17]. Since abalone growth has often been reported to increase linearly as sigmoid function [35], length-at-stage analysis was assessed; the body morphometrics observed during the time of the veliger maturation were fitted to the Gompertz growth function: a e b e c x (Figure S6). Here, model coefficients were used to calculate the specific growth rate.

2.6. Birefringence

Larval calcification during veliger maturation was obtained using a polarizing filter mounted into a light microscope (Olympus BH-2, Hamburg, Germany). Larvae showing birefringence were interpreted to be covered by a mineralized shell [36]. This technique is useful to measure the calcification performance under acidification challenges during the early development of other planktonic mollusks [37]. Before the image acquisition, larvae were permanently mounted with glycerol (Appendix A). After that, a 64 px camera (Samsung Electronics, Gyeonggi, Republic of Korea) was used to acquire the birefringence images using a manual setup to achieve an equal light balance between images. Before pixel quantification, images were pre-processed by adding a binary mask; then, the birefringence area was traced using Fiji software v 2.3.0/1.53q [38]. A total of 20 to 50 individuals per treatment were observed at 48, 60 and 108 HPF. Samples from 30 HPF were excluded from the birefringence analysis due to insufficient crystallized CaCO3 [17].

2.7. Competence Success

Fully veliger maturation occurred at 108 HPF. The observed branching of the cephalic tentacles and the proportion of larvae that crawled in search of the substrate were the criteria to determine competent larvae to settle [39]. To estimate the competence success (%), 1 mL aliquots of larvae (n = 6) were taken and counted under a microscope (4× magnification) using a Sedgewick Rafter chamber. The total number of competent larvae at 108 HPF was divided by the 574,000 embryos used at the starting bioassay. The remaining pre-settled larvae were cultured under cumulative acidification until the end of the pelagic life history (occurring at 26 days post fertilization, DPF), and the settlement success and shell surface were evaluated.

2.8. Settlement: Short- and Long-Term Acidification

Regarding the question of the time of exposure to acidification challenges, a new batch of pre-settled larvae was reared at moderate (7.8) and low (7.6) pH to test any differences in the settlement due to short- and long-term acidification challenges (Figure 1). For lecithotrophic species, such as abalone, settlement is defined as contact with a substrate, leading to metamorphosis from the pelagic form to the benthic form [40]. Here, new water reuse system tanks (n = 3) were covered with the benthic diatom Navicula incerta as a food source and natural settlement inductive factor. Then, a density of 5210 competent larvae was equally distributed per tank. To estimate the settlement success (%), the absolute number of recruited larvae at 26 DPF was divided by the initial number of 5210 competent larvae. Ten formalin-fixed settled larvae were gently successively dehydrated with ethanol using rinses of 50, 75 and finally, 90% ethanol, and sputter coated with gold for dorsal-view shell surface examination using scanning electron microscopy (SEM, SU-3500 Hitachi High Tech Corporation, Tokyo, Japan).

2.9. Data Analysis

Data collection, transformation, organization, visualization and statistical analyses were performed using R version 4.0.3 [41]. First, Shapiro–Wilk and Levene tests were performed to test normality and homogeneity of variance, respectively [42]. To achieve hatching, competence and settlement success, a parametric one-way analysis of variance (ANOVA) and Welch ANOVA were used as initial tests, followed by T post hoc test using the Bonferroni adjustment for the p-values (p adj). Binomial tests were used for nominal data, and Kruskal and Wilcoxon tests were used as nonparametric tests. Candisc R package [43] was implemented for Canonical Correlation Analysis between treatments and individual morphometric variation during veliger maturation. The p adj cutoff points were <1 × 10⁻⁴ (****), <0.001 (***), <0.01 (**), <0.05 (*) and >0.05 (ns). According to Hedges et al. (1999) [44], a relative effect size (response ratio) was calculated using the formula L n R R = L n ( X T ) L n ( X C ) , where X T and X C are the natural log-transformed mean values between the biological assessments in the experimental treatment X T and its respective control X C [44]. Here, a response ratio of 0 indicates no effect, whereas 1 and −1 indicate a positive or negative effect, respectively. Except for water chemistry, quantitative data are summarized as mean and standard error (mean ± S.E.) in some results.

3. Results

3.1. pH Control and Water Chemistry

During the bioassay, the measured pHNBS (mean ± standard deviation [SD]) in the moderate and low treatments decreased by −0.2 and −0.4 units, respectively, in contrast to the control, which correlates with the decrement in the saturated state of aragonite (Ωara) in either of the acidification experimental conditions (Table 2). The seawater chemistry analysis resulted in the maintenance of different seawater regimes that mimic two ocean acidification scenarios (p adj < 0.0001). Here, the low pH challenge (pH = 7.6 ± 0.122, Ωara = 1.14 ± 0.489 and pCO2 = 987 ± 510 μatm) resembles the worst-case IPCC 2007 scenario [3]. In this situation, the seawater pH for the global ocean is projected to decrease by 0.4 pH units, which translates to a 100–150% increase in [H+] and a decrease in the carbonate ion concentration, making it more difficult for marine calcifying organisms to form biogenic calcium carbonate [45].

3.2. Larval Developmental Success

3.2.1. Hatching Success and Normal Shelled Larvae

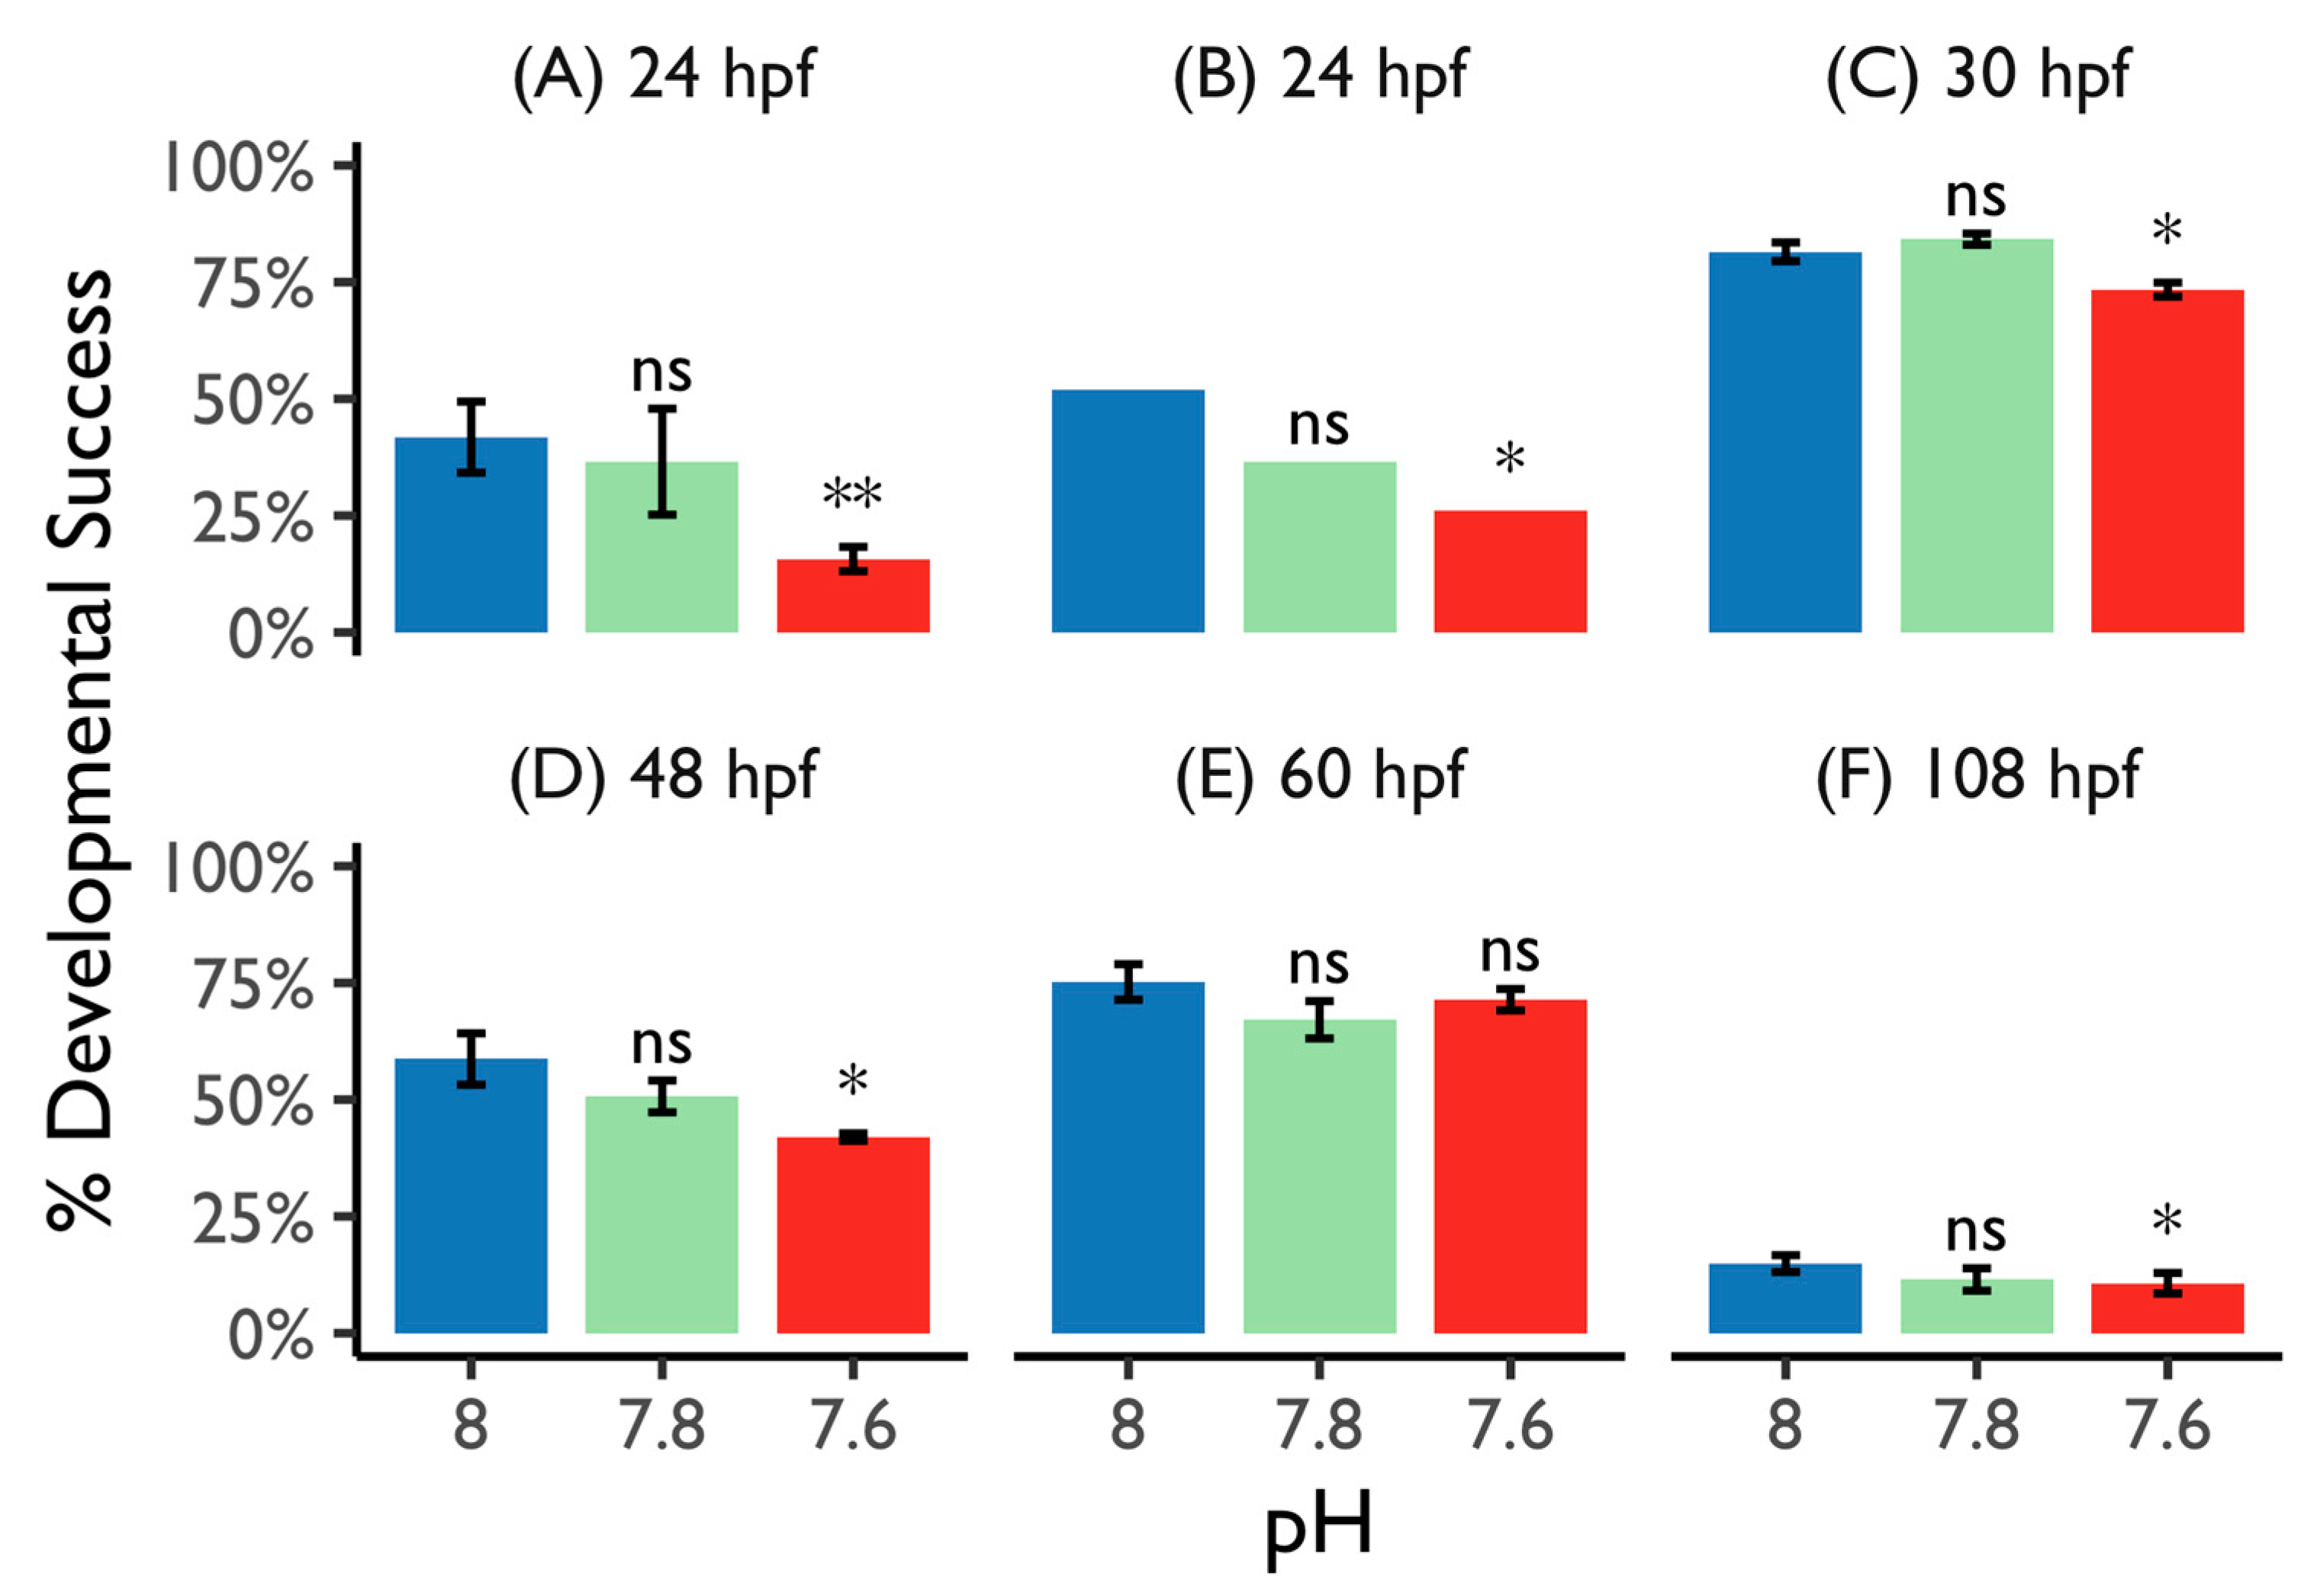
The hatching success in the control bioassay resulted in a mean ± S.E. of 42 ± 7.5%. In contrast, the success in the hatched larvae decreased as the acidification stress increased to 37 ± 11.3% at a moderate pH (7.8) and to 16 ± 2.6% at a low pH (7.6). Here, the highest negative acidification effect during the bioassay was found to result in LnRR ratios of −0.13 and −0.98, respectively (Table 3).
The prior statistical analysis showed differences in the hatching success among treatments (p < 0.05). However, the posteriori statistical pairwise comparison (Student’s t-test) resulted in a significant difference (p adj < 0.005) regarding the hatching success between the low pH challenge and the control (Figure 2A). Likewise, the proportions of normal shelled larvae and successfully matured larvae at 30 HPF resulted in a significant decrease (p < 0.01) only in the larvae that were raised in the low pH treatment (Figure 2B), which resulted in a negative LnRR of −0.69 (Table 3).

3.2.2. Veliger Maturation Impairment

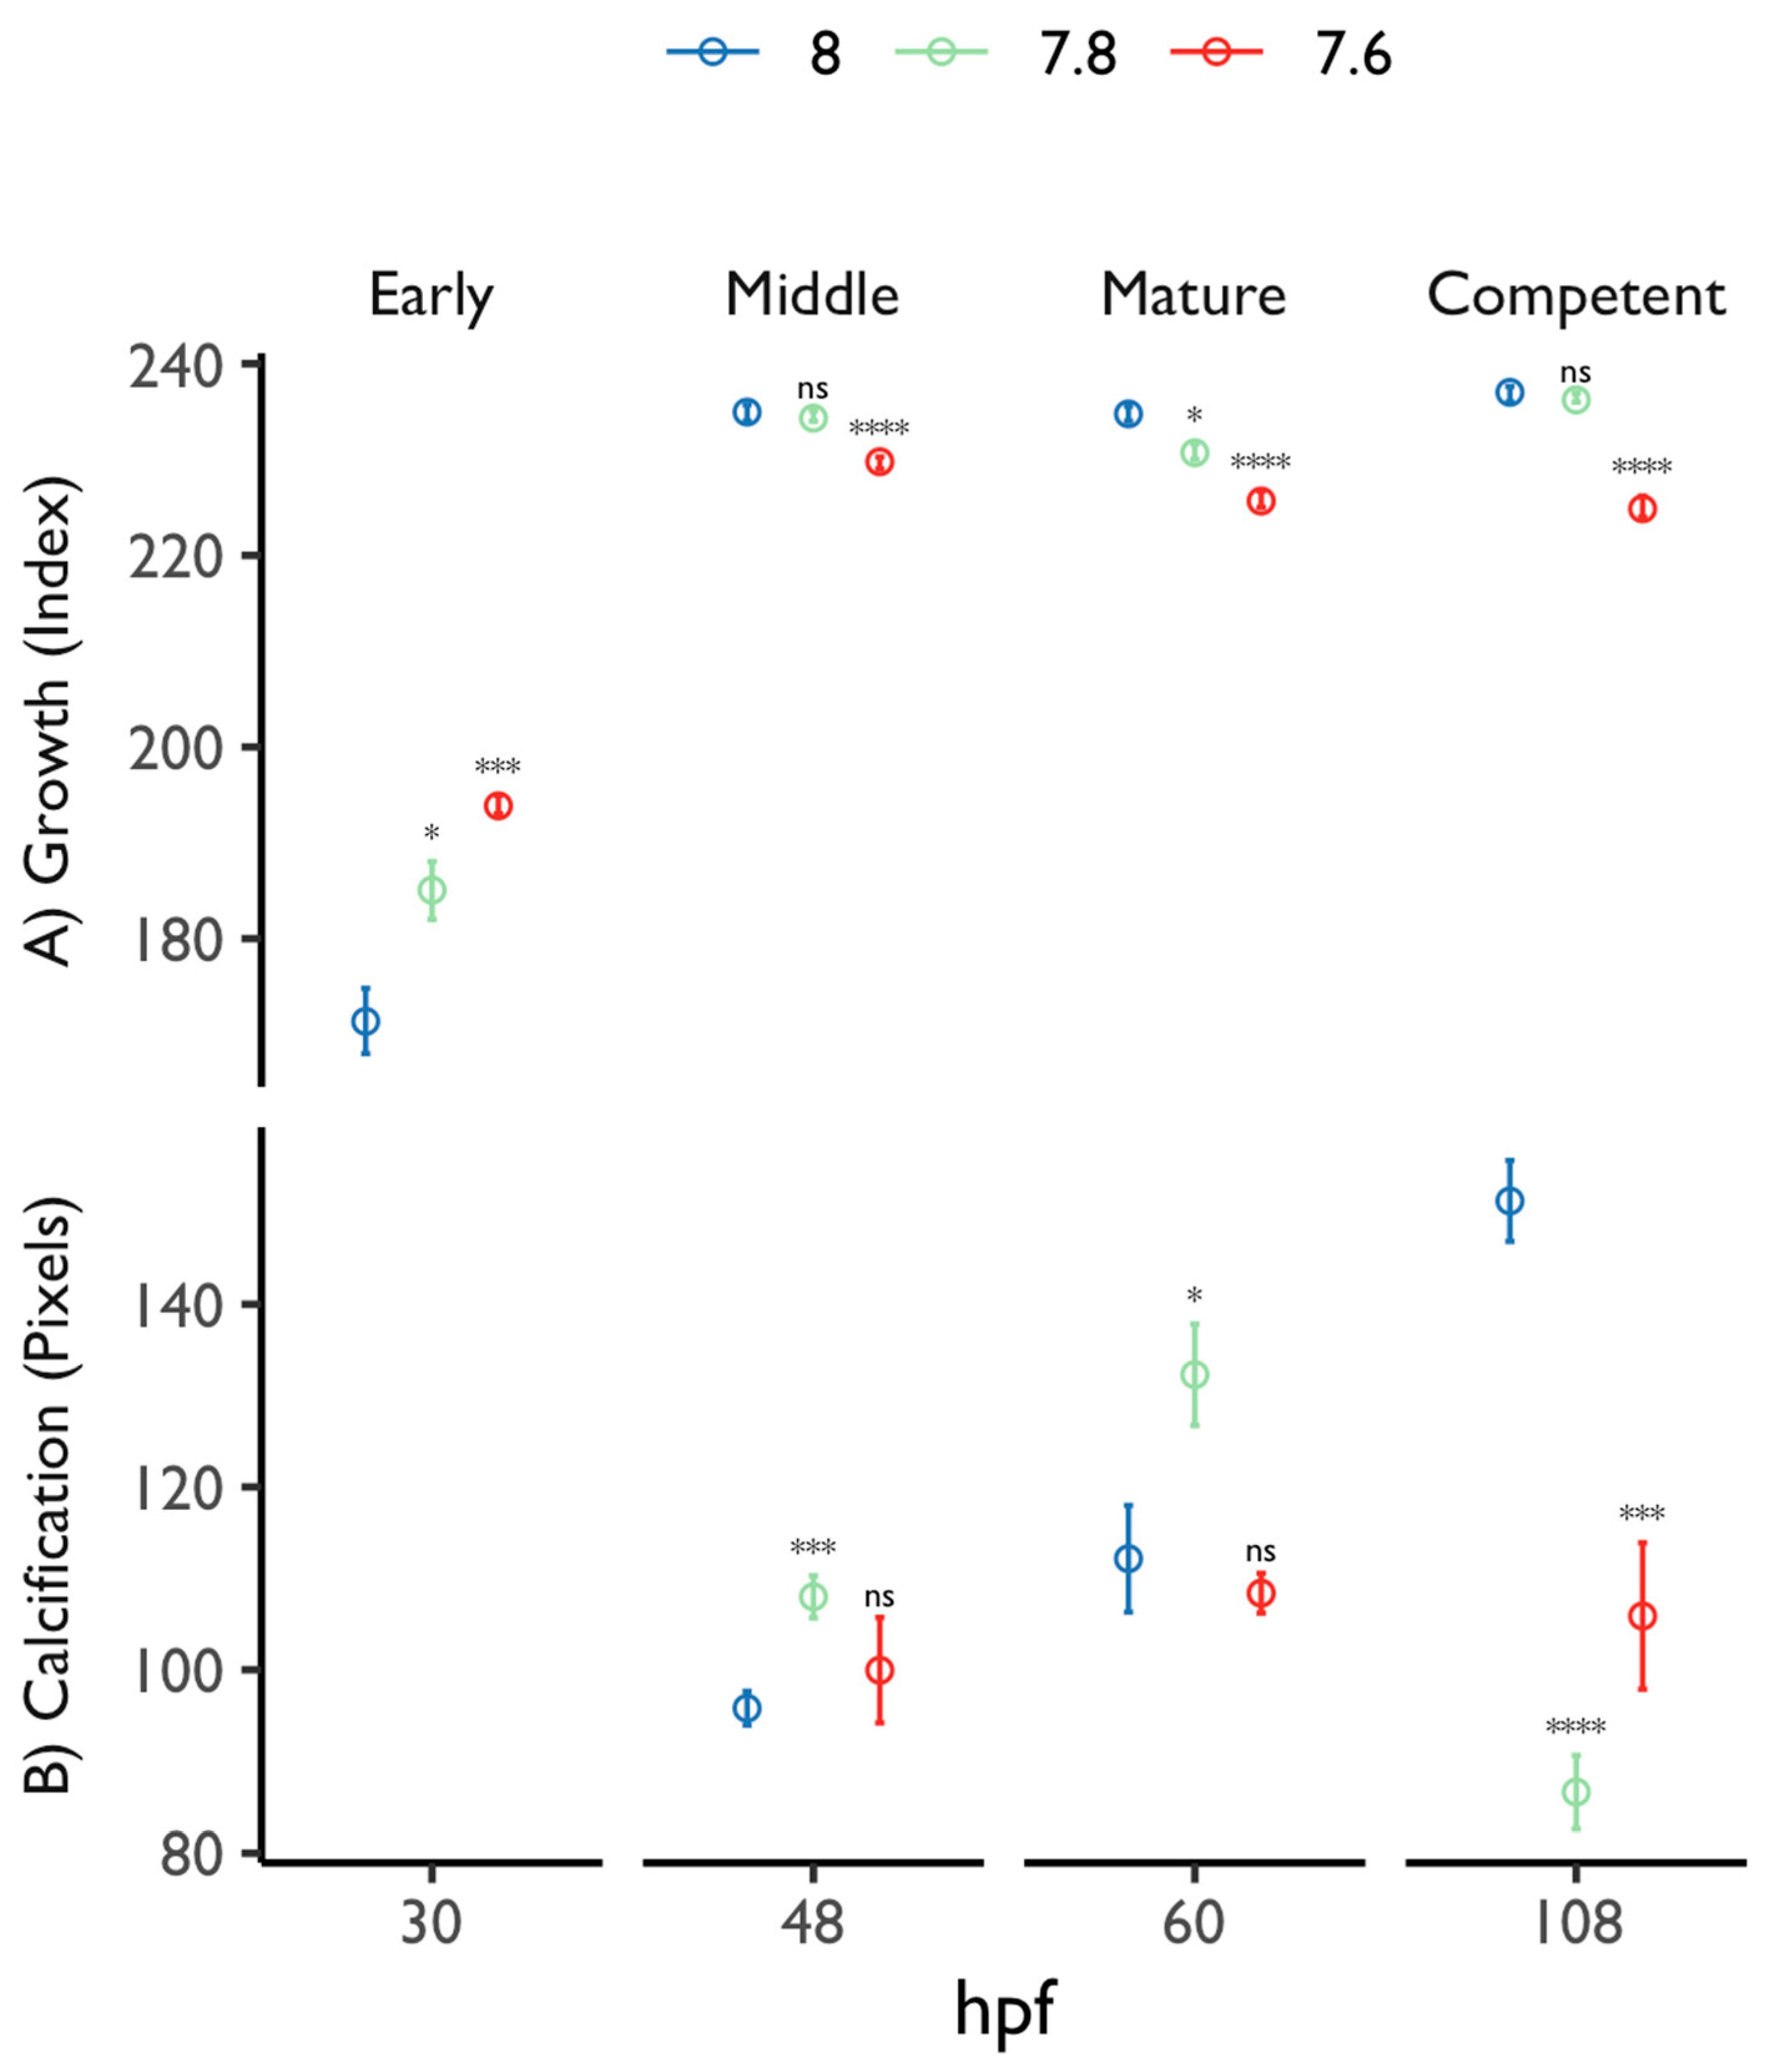
The proportion of larvae scored as successfully matured at 30, 48 and 60 HPF were reduced in either moderate or low pH treatments (Figure 2C–E), although significant differences were only found in the low pH treatment at 30 and 48 HPF that resulted in LnRR ratios of about −0.1 and −0.33, respectively (Table 3). Nevertheless, the length-at-stage analysis resulted in an impaired specific growth rate in the larvae reared to either a moderate or low pH (Table S1 and Figure S6). Here, the pooled growth data measured at 30, 48, 60 and 108 HPF fitted the Gompertz function ( R 2 : 0.975, p < 0), suggesting that the growth reduction during the veliger maturation reflects the developmental delay observed in the larvae reared at moderate and low pH levels. In fact, at 30 HPF, the average growth index values were significantly higher in the larvae reared to moderate and low pH levels than the control, which were 193.86 ± 1.1, 185.06 ± 3 and 171.36 ± 3.4, respectively. However, as the larvae matured to begin their settlement, the average growth slowed down due to pH stress (Figure 3A). On the other hand, the calcification data indicated another response pattern during veliger maturation. The average birefringence (pixels) was unusual from growth at the treatments at 48 and 60 HPF but significantly decreased as the growth index was compared to the control at 108 HPF (Figure 3B).
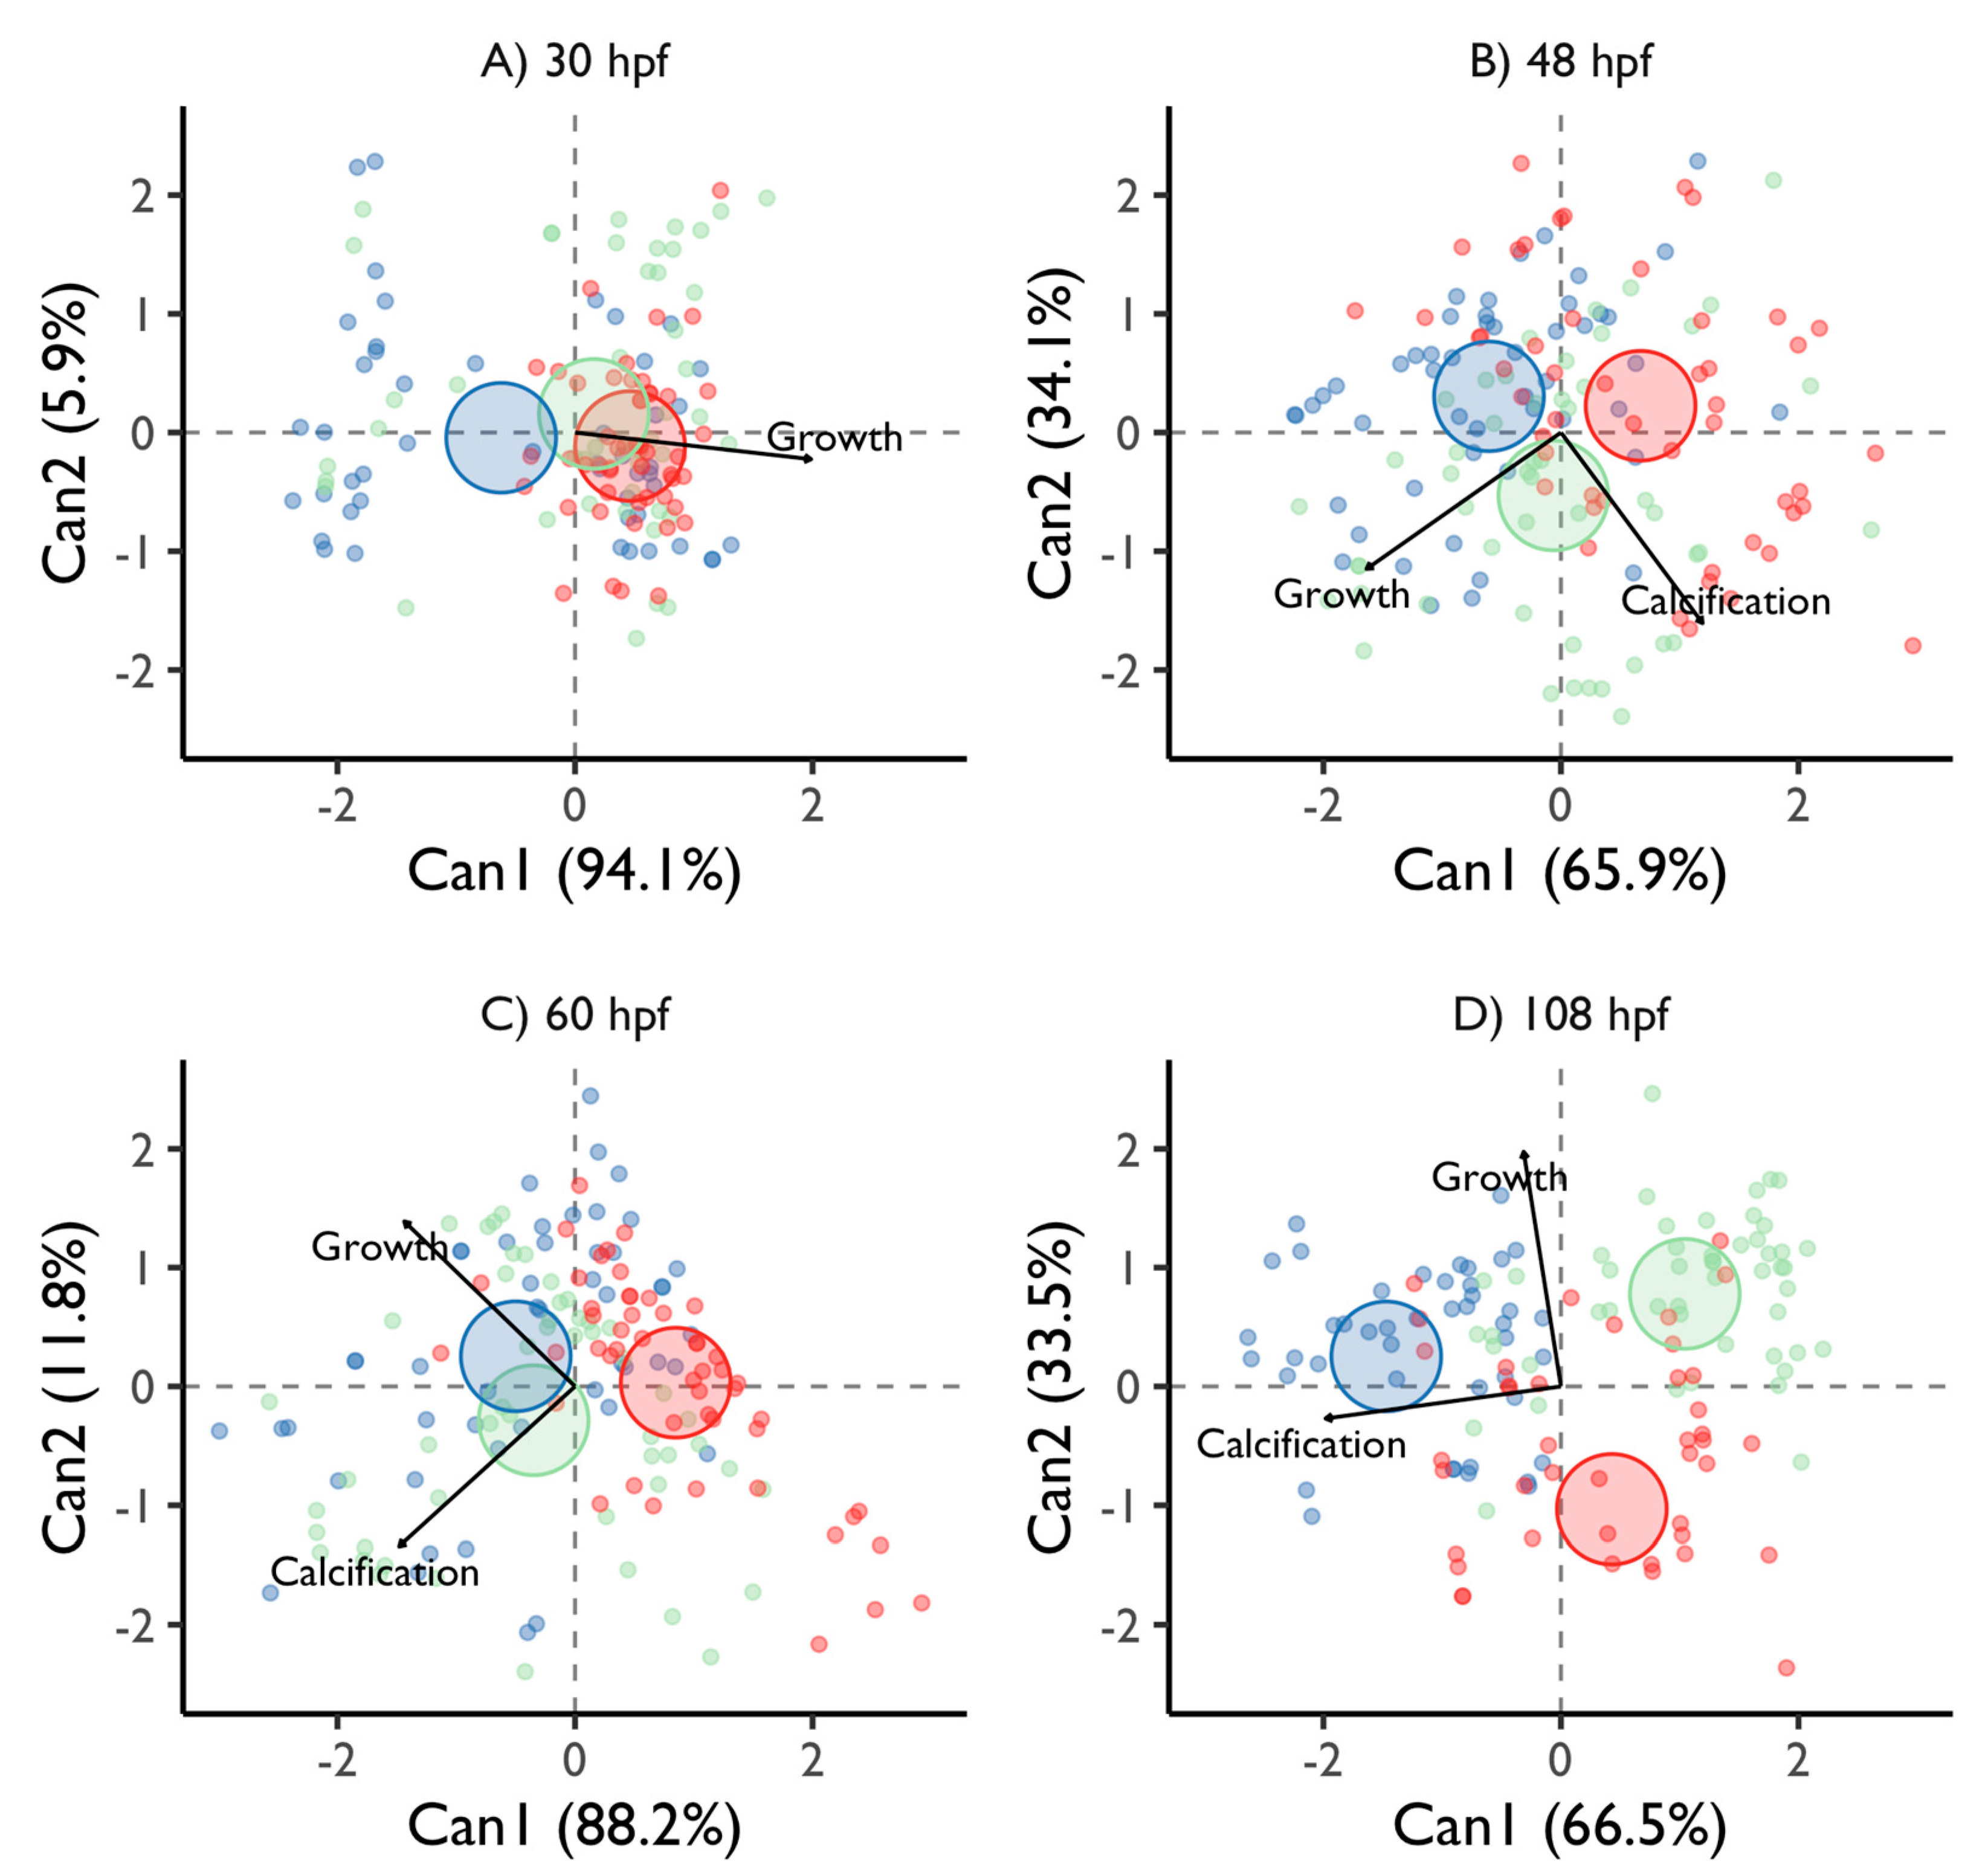
The canonical discriminatory analysis based on the assessments made during veliger maturation showed that at 30 HPF, the morphometrics from moderate to low pH levels clustered together, suggesting that they have similar growth patterns in response to pH conditions (Figure 4A). However, at 48 HPF, the larvae from a moderate pH clustered together to the control, indicating that they have similar growth, whereas the calcification remained related to a low pH (Figure 4B). Finally, at 60 and 108 HPF, the larvae morphometrics were spread from moderate to low pH levels and separated from the control group. These results suggest that the larvae had growth and calcification, which were not observed in those raised at the control pH (Figure 4C,D).

3.2.3. Competence Success

The competence success in the control bioassay resulted in a mean ± S.E. value of 15 ± 2%, whereas the success in competence was about 11 ± 2% in both the larvae raised to moderate cumulative acidification and low cumulative acidification scenarios, respectively. Here, the LnRR resulted in negative ratios of −0.26 and −033, respectively (Table 3). The posteriori statistical pairwise comparison (Student’s t-test) only resulted in a significant difference (p adj < 0.05) between the low pH when contrasting against its control (Figure 2F). During the veliger maturation, the in situ pHNBS (mean ± S.E.) ranged to 7.6 ± 0.007 and 7.4 ± 0.011 in the moderate and low pH challenges, respectively, which also represent a difference of 0.2 units in the pH (Table S2). Here, the predicted values concerning the ocean acidification covariables, showed a periodic Ωara below 1.0, which means the water was unsaturated to aragonite (Figure S2B), and the pCO2 (μatm) averages of 1004 ± 13 and 1229 ± 18 582 ± 1 exceed twice the normal pCO2 in the current ocean, respectively.

3.2.4. Settlement Success and Scanning Electron Microscopy

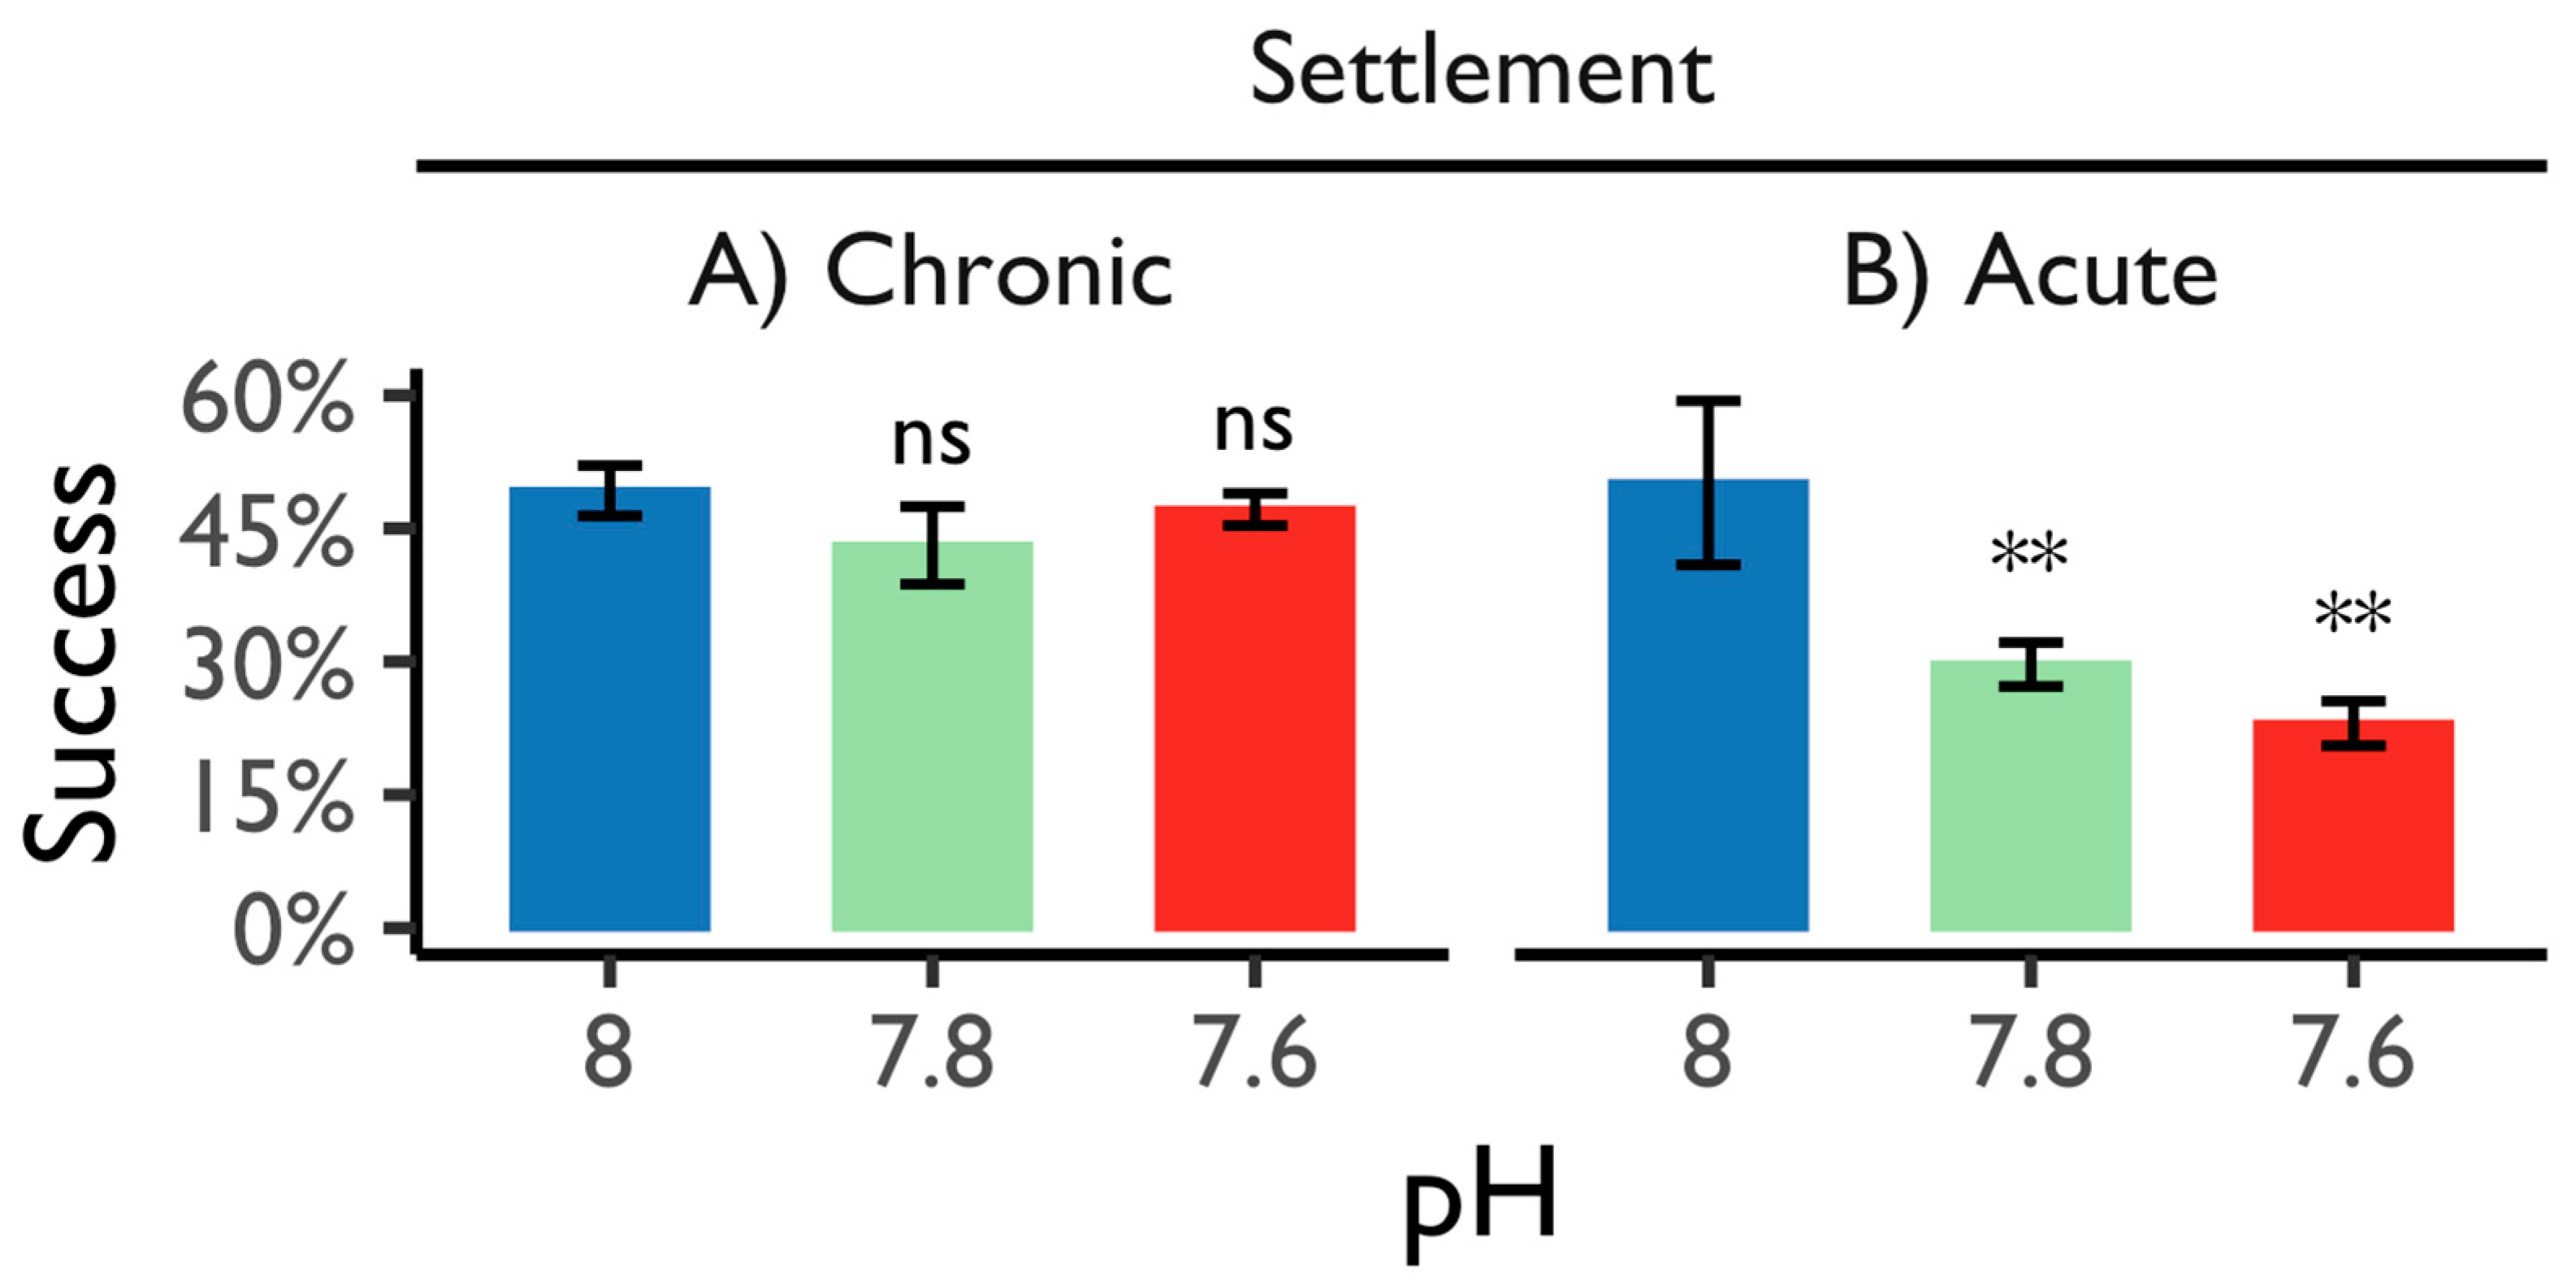
Regarding the effect on post-larvae to long-term acidification, the settled larvae at 26 DPF showed morphological responses in shell deterioration that did not affect their settlement success from chronic acidification stress (Figure 5A). Similar to larval competence success (Figure 2F), the decrease in the settlement was also quiet compared to the control average settlement in the long-term acidification challenge, resulting in mean ± S.E. values of 49 ± 2.8%, 43 ± 4.3% and 47 ± 1.8% for the control, moderate and low pH, respectively, and LnRR ratios of −0.13 and −0.04 for moderate and low pH (Table 3). Despite the negative acidification effect, no significant settlement effect was found among the treatments from the chronic acidification stress (Figure 5A).
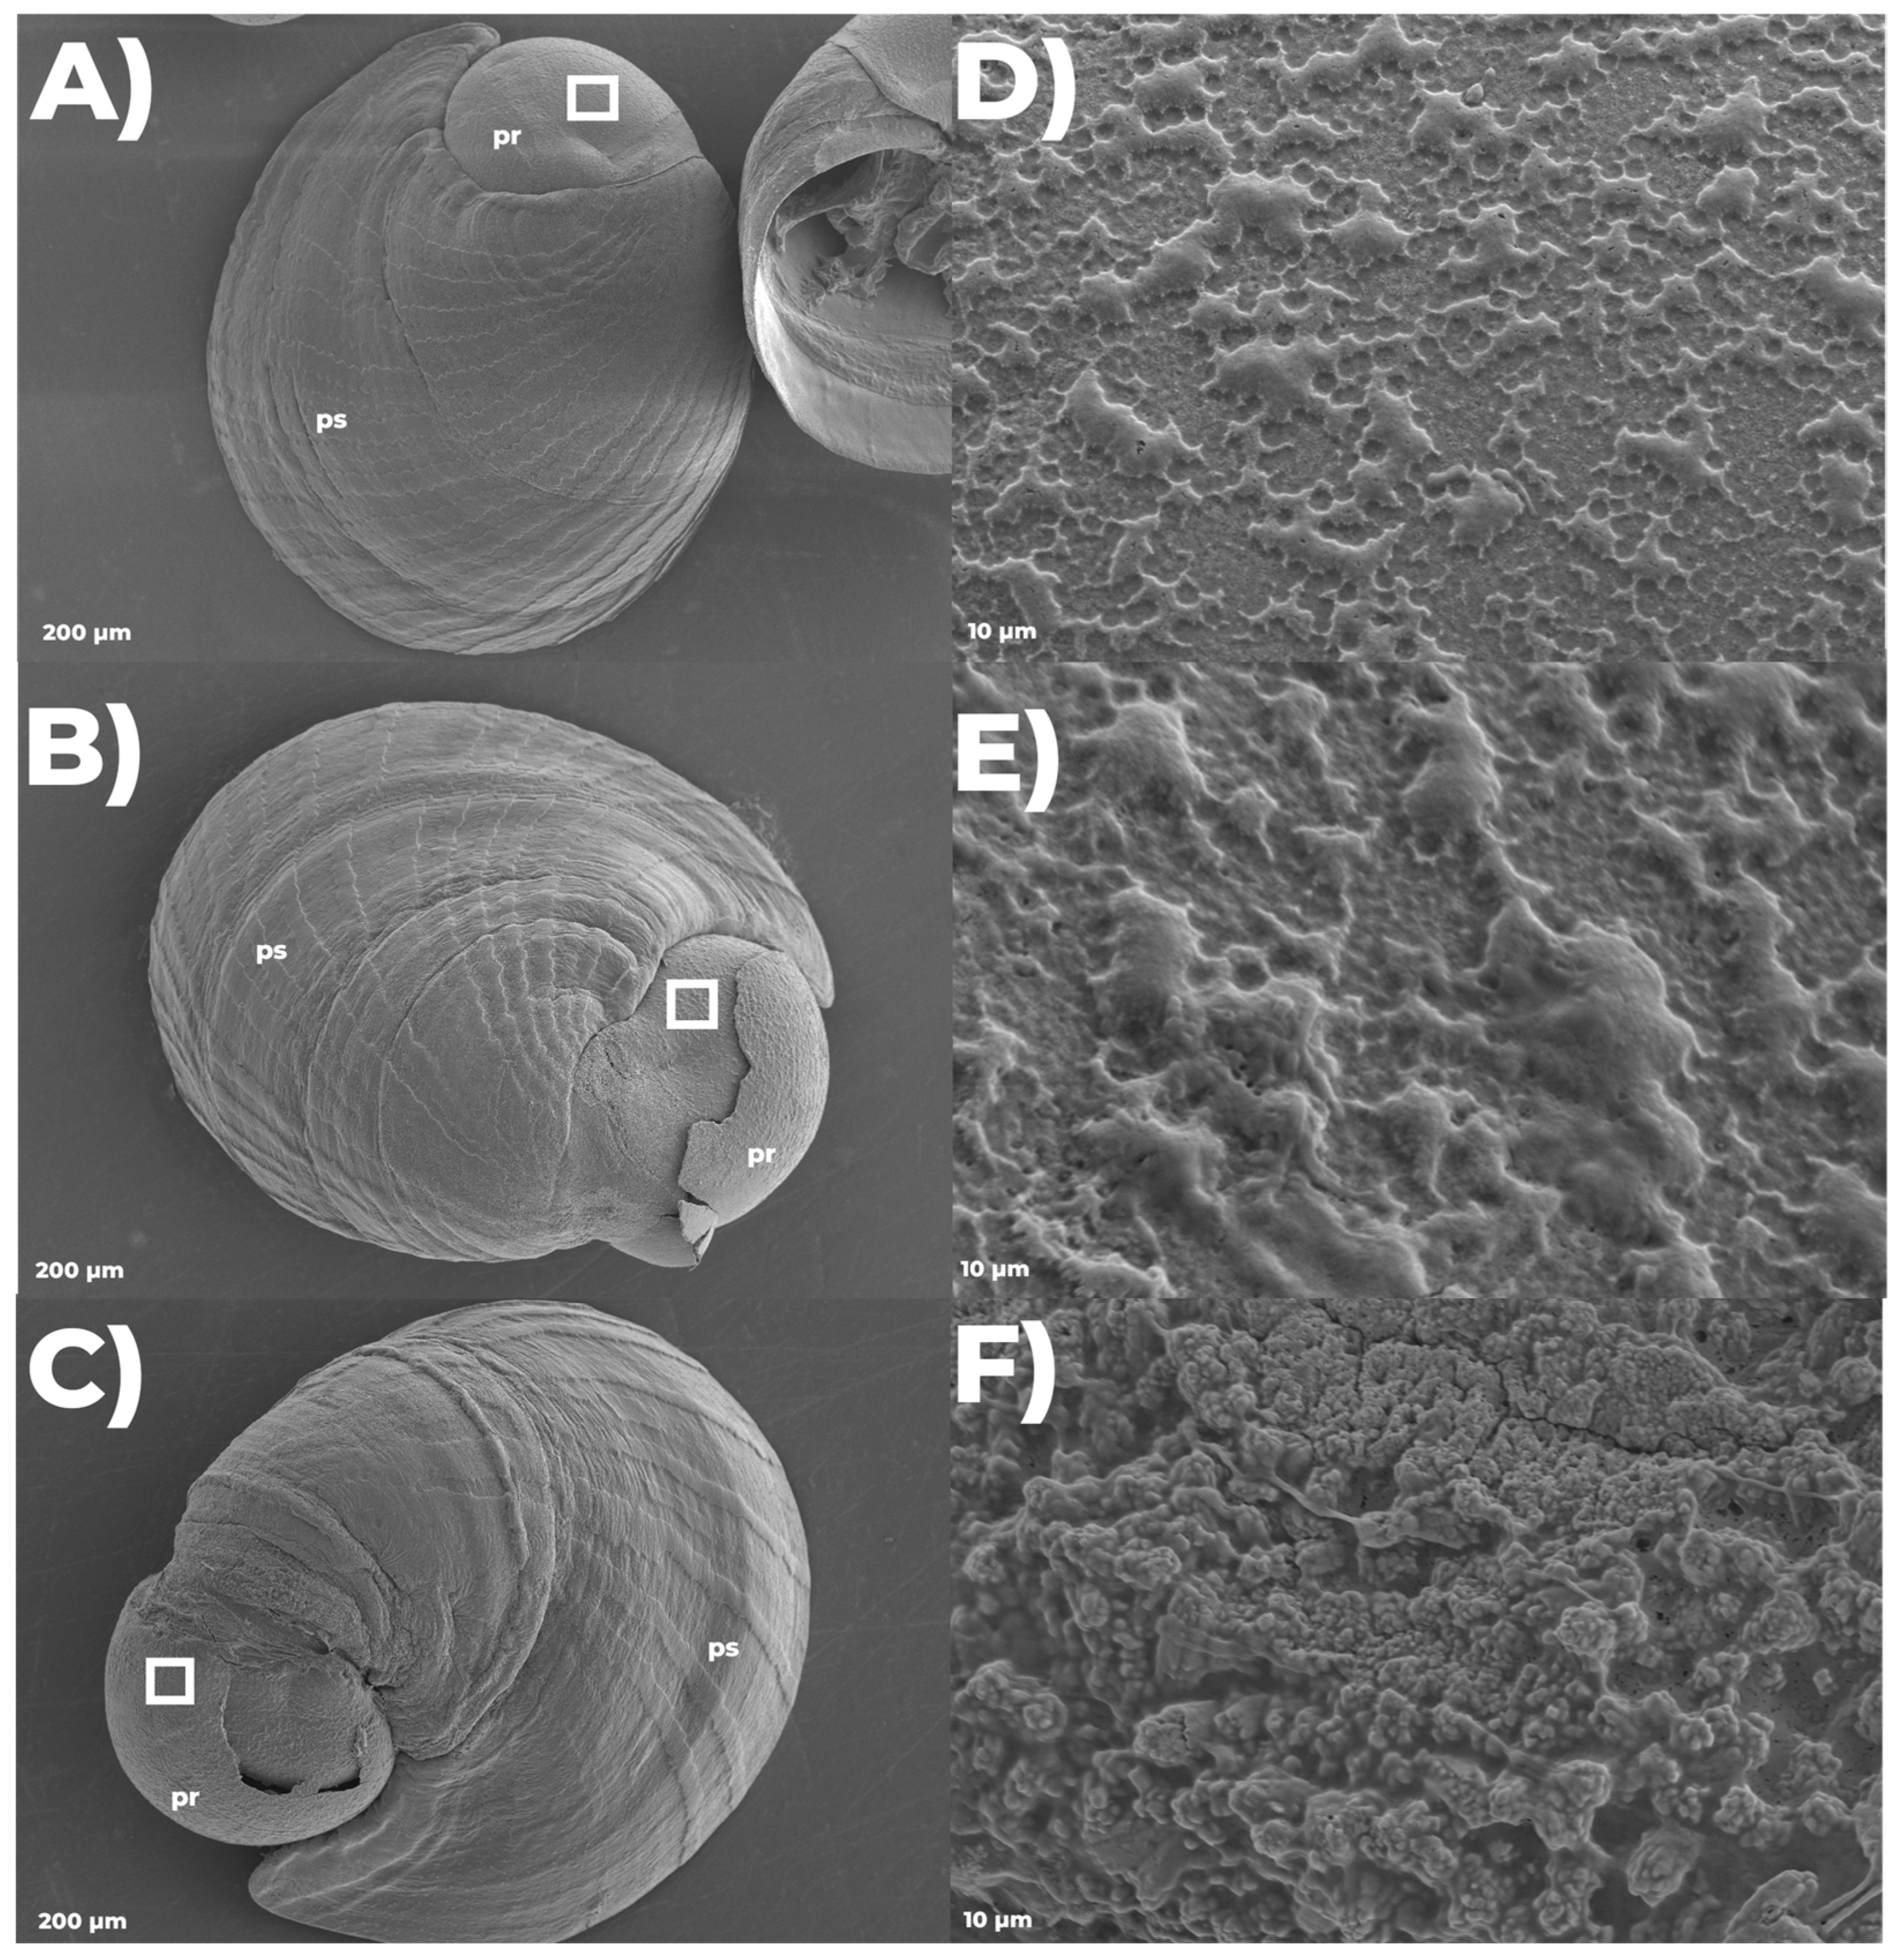
The settled larvae reared to pH 8.0 showed typical ear-shaped peristomal shells (Figure 6A). Additionally, the protoconch showed a smoothed granular texture surface and a normal alveolar pattern (Figure 6D). Nevertheless, the micrographs of the settled larvae reared under moderate and low pH levels showed irregularities and mineralization defects along the shell surface (Figure 6B,C), which may be evidence of shell corrosion. Here, the protoconch corrosion visibly increases as the pH decreases to 7.8 and 7.6, respectively (Figure 6E,F).
On the other hand, the larvae that were suddenly exposed to acidification during their settlement did not show shell deterioration, although the settlement success was severely affected. During the short-term acidification scenarios, the settlement success decreased significantly as a function of acidification challenges by 50 ± 9.2, 30 ± 2.4% and 23 ± 2.5% in the control, moderate and low pH, respectively (Figure 5B). These results represent a decrement by almost twice from the settlement success observed from the long-term acidification treatment. The initial statistical analysis showed differences among the settlement values in the acute stress treatments (p < 0.05), and the posterior statistical pairwise comparison (Student’s t-test) resulted in a significant difference (p adj < 0.005) between the settlement success in both the moderate and low pH scenarios when contrasting against the control. The LnRR ratios for the settlement under short-term acidification resulted in −0.52 and −0.78 in the moderate and low pH scenarios, respectively (Table 3). Despite the longest exposure time to acidification occurring during the settlement, the settled larvae suddenly raised to acidification did not show visible microfracture or erosion along the shell (Figure S7). Contrasting the short-term acidification challenges against the long-term acidification challenges during the settlement performance resulted in a significant differential response (F = 118.804, p < 0.05). The foregoing suggests that sensitivity to acidification may depend on the cumulative and acute levels of acidification that an abalone may experience during its pelagic life history.

4. Discussion

The present research shows results that are in concordance with those in the literature regarding the early life history of abalone, which includes reductions in the body growth, the decreased survival of larvae and developmental delay [15,46] as well as increased unshelled and abnormal larvae [12,47]. Several pelagic life history stages revealed a negative response in the calcification, growth and developmental rate during experiments that mimic two near-future acidification scenarios. Although the acidification impacts on some biological processes may be outweighed or diminished by the addition of other anthropogenic stressors (e.g., warming), they may fall into major climate change stressors because many seawater carbonate parameters are changing simultaneously (OA is also referred to “as a multiple driver”) [48], which may contribute to the performance impairment observed during the transitory stages of planktonic larvae. Although the response of the larvae to a moderate pH was similar to normal, the impairment in the low pH bioassay indicated that the biological process related to development, growth and calcification were compromised (but not lost) under this level of acidification. This result indicates a limitation in planktonic larvae acclimatization at a drop of −0.4 units in the pH. A comprehensive description of vulnerability requires an understanding of the critical threshold at which acidification impacts larval biology [49]. Therefore, the present research contributes to understanding the tolerance limits at which abalone larval life history performance impairment is found.
The proportion of larvae scored as successfully matured regarding the first morphological analysis correlates with the length-at-stage analysis, suggesting that it is a good proxy for assessing the developmental rate. Although development rate impairment is relative to the feeding rate in other planktonic species but not in lecithotrophic species [50], the specific growth rate from H. rufescens larvae was disturbed during its veliger maturation. The length-at-stage analysis showed that growth is impaired regarding stress to a low pH, indicating that the acidification covariates may affect growth and the developmental rate of the abalone during their pelagic life history. Abalone is expected to show reduced growth rates as more energy is invested in combating stress rather than growth [51]. In contrast to the reduced growth under acidification challenges, the calcification data indicate another response pattern during veliger maturation, suggesting that the body size is not an absolute estimator of calcification, but rather of somatic growth during the pelagic life history.
Calcification begins to be an active process during veliger maturation. Here, a calcification site provides key support for CaCO3 deposition [52,53], and the molecular mechanism associated with the initiation of aragonite crystallization is differentiated prior to veliger maturation in several mollusk larvae, including other abalone species [54,55]. In other aragonite calcifying larvae, the exposure to acidification exhibits drops in the pH and Ωara at the calcification site, which is correlated with decreased shell growth, and eventually, shell dissolution [56]. The observed calcification during the present research resulted in the highest negative acidification ratios by the moderate and low pH scenarios as the larvae matured and reached competence to settle at 108 HPF. This result suggests that acidification may be affecting the early red abalone life history performance by the unsaturation in aragonite. The related research concerning early red abalone did not find a disturbance in the expression of calcification regulation genes, suggesting that the acidification effect on calcification involves various gene regulatory networks in response to calcification and dissolution [57].
Although the energy needed to support metabolism during growth in lecithotrophic species, such as abalone, would appear to be met by the lipid reserves held within the yolk, the energetical reserves are not always enough to complete the planktonic lifestyle. Thus, abalone larvae may also capture dissolved nutrients from the environment using a mechanism known as hydrosol filtration [58] to supply the energy cost that is not supported by the yolk during its early development [59]. The foregoing is a basis to suggest a shift in the acid–base homeostasis, contributing to the observed larval growth and development impairment in a secondary fashion because of acidification. Changes in the cellular homeostasis have been suggested to reassign and decrease the energy yield for somatic growth and development in other marine invertebrates due to substantial energetic challenges of the internal homeostasis [60]. Therefore, this additional stress, coupled with calcification suppression, may be assumed to be due to acidification.
Regarding calcification and growth, the response pattern observed during veliger maturation suggests a larval-stage-specific acclimatization. Since metabolism reassignment is common in abalone larvae because its development involves complex body changes [61], substantial energetic yields due to stress are expected to be more challenging at some developmental stages, such as that observed during the present research. The holistic research regarding the pelagic life history in response to acidification should contribute to the understanding of which development stages are the most compromised by acidification in other calcifying species.
Shell corrosion in response to acidified waters was found in larvae from the European abalone H. tuberculata [19]. In many mollusks, the CaCO3 deposited during larval development is a combination between amorphous calcium carbonate and aragonite [36], including the European abalone [62]. In addition, abalone shells from post-larvae and juveniles are also essentially made of aragonite [55]. In the present research, the predicted Ωara values showed periodic under-saturation conditions during the larval and post-larvae development, which means the water was corrosive for aragonite, and dissolution and unprotected aragonite shells would begin to occur [9]. Thus, the corroded shell surface observed in the present research was in concordance with these episodic acidified waters.
Nevertheless, the recruitment to give birth towards a benthic lifestyle was not at the expense of the long-term acidification. The settled larvae from the long-term acidification challenge showed a morphological response in shell deterioration without affecting their settlement success. During the bioassay that resembles the worst-case IPCC 2007 scenario, the settlement did not show significant differences to the long-term stress, suggesting that H. rufescens possesses mechanisms that can be beneficial to the acidification during its early life history development. Despite the deleterious effect of the calcareous structure, the success reported during settlement suggests that the early life history of abalone may be resilient to different levels of chronic acidification. The acclimatization observed in this research was similar to previous reports during the settlement success of H. kamtschatkana [13] and H. tuberculata [19]. Although the settlement performance was not affected by the long-term acidification stress, the larvae exposed to short-term acidification showed a reduced settlement performance, indicating that settlement interacts with acidification through different stress response pathways. In natural habitats, increased levels of CO2 can profoundly affect the settlement of a wide range of benthic organisms [63]. Similar results regarding short-term acidification during settlement was found in previous research with Haliotis asinine [64]. Given that the interpretation of acidification tolerance limits extends from the highest level of response seen down to systemic, cellular and molecular hierarchies [65], discussions about the sensitivity to ocean acidification should consider, at least, the potential modes of systemic response to either short- or long-term acidification [51]. For example, while short-term acidification may involve a systemic response by a classical pathway to sudden or acute stress [66], long-term acidification acclimatization may involve different response pathways in response to cumulative or chronic stress such as stress priming [67] or carryover effects [68,69].
Settlement is a critical event in the life of many marine invertebrates that involves benthic-pelagic coupling, which requires the recognition of a suitable benthic environment (i.e., substrate) and the acceptance of that surface prior to the onset of metamorphosis [39]. Based on this fact, the vulnerability to acidification during settlement may depend on external factors that include substrate–larvae interactions, although these effects have not yet been tested for abalone. For example, suitable substrate recognition involves chemosensory signaling, which has been affecting marine fish by ocean acidification [70]. While suitable recognition may also be important for larval settlement in abalone [51], the substrate quality may play a pivotal role in larval coupling since it dramatically impacts the life history performance of planktonic larvae [71]. For example, acidification challenges cause deterioration in the nutritional quality of diatoms, resulting in the disturbance during the life history performance in other planktonic species [72]. Regarding abalone larval settlement, random responses to acidification were observed in other abalones, including indirect, positive [73] or neutral [69] effects using preconditioned (~4 to 6 months) crustose coralline algae. In contrast, Swezey et al. (2020) reported a depletion in settlement using diatoms (Navicula sp.), which were preconditioned only 24 h prior to the settlement [20]. Therefore, the nutritional quality of the preconditioned substrate could have significant implications for larval recruitment [74], but this was not evaluated in the present research.
With the improvement of next generation sequencing technologies (NGS), functional single-species genome-wide characterization has improved significantly. Although these technologies have been limited to a few mollusk species, they have revealed fascinating aspects of their resilience to environmental stressors [75,76,77,78]. The genetic signatures acting upon local environmental variability were recognized in the red abalone inhabiting along the California coastline [25]. Therefore, future efforts to understand the abalone resilience to ocean acidification should focus on describing additional regulation levels via understanding the gene interaction networks underlying the links between the external performance metrics and internal traits to predict the potential for species adaptation to ocean acidification.

5. Conclusions

The present research warns about the acidification sensitivity in the endangered species H. rufescens, placing it as a sentinel indicator for multiple marine mollusks with a biphasic larval life history facing ocean acidification. Sentinel species provide valuable insights for exploring the tolerance limits and pathways of stress response for worldwide aquaculture in the face of global climate change. Here, the early life history of the red abalone was negatively affected in experiments that mimicked two near-future acidification scenarios. As planktonic larvae mature to begin their benthic lifestyle, the differential long-term acidification levels significantly disturb the larval performance, suggesting that sensitivity depends on their developmental stages. A disturbance in the developmental success, growth and calcification via acidification resulted in a loss of species performance when the levels were found to be beyond their tolerance threshold. Here, red abalone larvae were challenged by −0.4 but not −0.2 pH units, whereas the evaluated larval stages (hatching, veliger maturation and settlement) showed different levels of resilience to long-term acidification. The settlement highlights remarkable response differences to short- and long-term acidification. Therefore, the discussion about the sensitivity to ocean acidification should consider the different modes of response to either short- or long-term acidification and the stage of its life history regarding its developmental biology. Because the natural ecosystem of red abalone will be heavily compromised by acidification in the future, the present research provides an understanding of the critical threshold at which acidification impairs its pelagic life history—native from a local region of the Pacific coast in North America. The loss of the red abalone early life stages experienced at present in the Pacific coast may take place under short-term acidification related to periodic episodic upwelling of waters, but not long-term acidification. Despite the negative effects on calcification, growth, development and mortalities observed during this research, they were not absolute. Thus, the pelagic–benthic transition was carried out successfully in the larvae reared under two long-term acidification levels.

Supplementary Materials

The following supporting information can be downloaded at: https://www.mdpi.com/article/10.3390/su151814010/s1. Reference [79] is cited in the supplementary materials.

Author Contributions

Conceptualization, R.G.-R., C.E.G.-S. and L.L.-G.; formal analysis, R.G.-R., J.M.H.-A. and L.L.-G.; funding acquisition, L.L.-G.; investigation, R.G.-R., C.E.G.-S., F.L.-D.l.C., J.M.H.-A., E.V.-W. and L.L.-G.; methodology, R.G.-R., F.L.-D.l.C., J.M.H.-A., E.V.-W. and L.L.-G.; supervision, C.E.G.-S. and L.L.-G.; visualization, R.G.-R., C.E.G.-S. and L.L.-G.; writing—original draft, R.G.-R.; writing—review and editing, C.E.G.-S. and L.L.-G. All authors have read and agreed to the published version of the manuscript.

Funding

This research was funded by Project UABC-PTC-832 and partially funded by Desarrollo De Un Sensor Submarinos De pH y Temperatura De Bajo Costo Con Aplicaciones A Estudios De La Acidificación En Zonas Acuícolas En B.C.

Institutional Review Board Statement

Not applicable.

Informed Consent Statement

Not applicable.

Data Availability Statement

Not applicable.

Acknowledgments

The authors thank CONACYT (Consejo Nacional de Ciencia y Tecnologia) for the doctoral scholarship (588201) awarded to Ricardo Gomez—Reyes as a part of his doctoral thesis at UABC (Universidad Autónoma de Baja California) and acknowledge all members of the Research and Training team of the Functional Genomics of Marine Organisms and Applied Genomics and Marine Immunopathology Laboratories of the Oceanological Research Institute at UABC (IIO-UABC) for their valuable technical advice. The authors also thank Juan Gabriel Correa Reyes for his technical support and his valuable suggestions. This research was partially supported by Desarrollo De Un Sensor Submarinos De pH y Temperatura De Bajo Costo Con Aplicaciones A Estudios De La Acidificacion En Zonas Acuicolas En B.C. The authors also thank Filiberto Núñez-Cebrero and Ernesto Larios-Soriano for their technical support and experiment management, Francesco Cicala for providing manuscript support, Diana Fischer for English editing support and LNMA-CICESE (Laboratorio Nacional de Microscopia Avanzada—Centro de Investigación Científica y de Educación Superior) for their scanning electron microscopy services.

Conflicts of Interest

The authors declare no conflict of interest.

Appendix A

Samples were formalin-fixed (1 drop/mL) and stored at room temperature, followed by serial successive ethanol dehydration using rinses of the following concentrations: 50%, 75% and finally, 90% ethanol. Veliger larvae suspended in 90% ethanol were stored for subsequent microscopic assessments, which included birefringence and morphometric analyses. According to Jardillier et al. (2008), a permanent mounting of the larvae with glycerol was made as follows: On a glass counting slide, a transparent varnish frame was painted around the slide of the respective size of the coverslip, which prevented the larvae from being crushed during mounting. It is important to consider drying the varnish before mounting. At room temperature, 50 to 100 sampled larvae were placed above the slide, allowing them to be evenly distributed on the slide. After the suspension volume (i.e, 90% alcohol) was evaporated, a drop (~500 uL) of glycerol was placed in the center of the coverslip and the mount was gently sealed, helping the glycerol to be embedded in all the larvae in the glass slide. Finally, the varnish was added between the mount to seal the slide permanently [62].

References

  1. Zeebe, R.E. History of seawater carbonate chemistry, atmospheric CO2, and ocean acidification. Annu. Rev. Earth Planet. Sci. 2012, 40, 141–165. [Google Scholar] [CrossRef]
  2. Friedlingstein, P.; Jones, M.W.; O’Sullivan, M.; Andrew, R.M.; Bakker, D.C.E.; Hauck, J.; Le Quéré, C.; Peters, G.P.; Peters, W.; Pongratz, J.; et al. Global carbon budget 2021. Earth Syst. Sci. Data 2022, 14, 1917–2005. [Google Scholar] [CrossRef]
  3. IPCC. Climate Change 2007: Synthesis Report. Contribution of Working Groups I, II and III to the Fourth Assessment Report of the Intergovernmental Panel on Climate Change; Core Writing Team, Pachauri, R.K., Reisinger, A., Eds.; IPCC: Geneva, Switzerland, 2007; p. 104. [Google Scholar]
  4. Millero, F.J. Impact of anthropogenic CO2 on the CaCO3 system in the oceans. Science 2004, 305, 362–366. [Google Scholar] [CrossRef]
  5. Geiger, D.L.; Owen, B. Abalone: World-Wide Haliotidae; ConchBooks: Hackenhein, Germany, 2012. [Google Scholar]
  6. FAO. The State of the World’s Aquatic Genetic Resources For food and Agriculture; FAO Commission on Genetic Resources for Food and Agriculture Assessments: Rome, Italy, 2019. [Google Scholar] [CrossRef]
  7. Nielsen, C. Origin and diversity of marine larvae. In Evolutionary Ecology of Marine Invertebrate Larvae; Carrier, T.J., Reitzel, A.M., Heyland, A., Eds.; Oxford University Press: Oxford, UK, 2018; pp. 3–15. [Google Scholar] [CrossRef]
  8. Peters, H.; Rogers-Bennett, L.; De Shields, R.M. Haliotis rufescens. IUCN Red List. Threat. Species 2021, 2021, e.T78771583A78772573. [Google Scholar] [CrossRef]
  9. Feely, R.A.; Sabine, C.L.; Hernandez-Ayon, J.M.; Ianson, D.; Hales, B. Evidence for upwelling of corrosive “acidified” water onto the Continental Shelf. Science 2008, 320, 1490–1492. [Google Scholar] [CrossRef]
  10. Siedlecki, S.A.; Pilcher, D.; Howard, E.M.; Deutsch, C.; MacCready, P.; Norton, E.L.; Frenzel, H.; Newton, J.; Feely, R.A.; Alin, S.R.; et al. Coastal processes modify projections of some climate-driven stressors in the California Current System. Biogeosciences 2021, 18, 2871–2890. [Google Scholar] [CrossRef]
  11. Gazeau, F.; Parker, L.M.; Comeau, S.; Gattuso, J.P.; O’Connor, W.A.; Martin, S.; Pörtner, H.O.; Ross, P.M. Impacts of ocean acidification on marine shelled molluscs. Mar. Biol. 2013, 160, 2207–2245. [Google Scholar] [CrossRef]
  12. Byrne, M.; Ho, M.; Wong, E.; Soars, N.A.; Selvakumaraswamy, P.; Shepard-Brennand, H.; Dworjanyn, S.A.; Davis, A.R. Unshelled abalone and corrupted urchins: Development of marine calcifiers in a changing ocean. Proc. R. Soc. B Biol. Sci. 2010, 278, 2376–2383. [Google Scholar] [CrossRef]
  13. Crim, R.N.; Sunday, J.M.; Harley, C.D.G. Elevated seawater CO2 concentrations impair larval development and reduce larval survival in endangered northern abalone (Haliotis kamtschatkana). J. Exp. Mar. Biol. Ecol. 2011, 400, 272–277. [Google Scholar] [CrossRef]
  14. Kimura, R.; Takami, H.; Ono, T.; Onitsuka, T.; Nojiri, Y. Effects of elevated pCO2 on the early development of the commercially important gastropod, Ezo abalone Haliotis discus hannai. Fish. Oceanogr. 2011, 20, 357–366. [Google Scholar] [CrossRef]
  15. Guo, X.; Huang, M.; Pu, F.; You, W.; Ke, C. Effects of ocean acidification caused by rising CO2 on the early development of three mollusks. Aquat. Biol. 2015, 23, 147–157. [Google Scholar] [CrossRef]
  16. Onitsuka, T.; Takami, H.; Muraoka, D.; Matsumoto, Y.; Nakatsubo, A.; Kimura, R.; Ono, T.; Nojiri, Y. Effects of ocean acidification with pCO2 diurnal fluctuations on survival and larval shell formation of Ezo abalone, Haliotis discus hannai. Mar. Environ. Res. 2018, 134, 28–36. [Google Scholar] [CrossRef] [PubMed]
  17. Wessel, N.; Martin, S.; Badou, A.; Dubois, P.; Huchette, S.; Julia, V.; Nunes, F.; Harney, E.; Paillard, C.; Auzoux-Bordenave, S. Effect of CO2–induced ocean acidification on the early development and shell mineralization of the European abalone (Haliotis tuberculata). J. Exp. Mar. Biol. Ecol. 2018, 508, 52–63. [Google Scholar] [CrossRef]
  18. Auzoux-Bordenave, S.; Wessel, N.; Badou, A.; Martin, S.; M’Zoudi, S.; Avignon, S.; Roussel, S.; Huchette, S.; Dubois, P. Ocean acidification impacts growth and shell mineralization in juvenile abalone (Haliotis tuberculata). Mar. Biol. 2020, 167, 11. [Google Scholar] [CrossRef]
  19. Kavousi, J.; Roussel, S.; Martin, S.; Gaillard, F.; Badou, A.; Di Poi, C.; Huchette, S.; Dubois, P.; Auzoux-Bordenave, S. Combined effects of ocean warming and acidification on the larval stages of the European abalone Haliotis tuberculata. Mar. Pollut. Bull. 2022, 175, 113131. [Google Scholar] [CrossRef]
  20. Swezey, D.S.; Boles, S.E.; Aquilino, K.M.; Stott, H.K.; Bush, D.; Whitehead, A.; Rogers-Bennett, L.; Hill, T.M.; Sanford, E. Evolved differences in energy metabolism and growth dictate the impacts of ocean acidification on abalone aquaculture. Proc. Natl. Acad. Sci. USA 2020, 117, 26513–26519. [Google Scholar] [CrossRef]
  21. Guo, X.; Huang, M.; Luo, X.; You, W.; Ke, C. Effects of one-year exposure to ocean acidification on two species of abalone. Sci. Total Environ. 2022, 852, 158144. [Google Scholar] [CrossRef]
  22. Auzoux-Bordenave, S.; Ledoux, A.; Martin, S.; Di Poi, C.; Suquet, M.; Badou, A.; Gaillard, F.; Servili, A.; Le Goïc, N.; Huchette, S.; et al. Responses of early life stages of European abalone (Haliotis tuberculata) to ocean acidification after parental conditioning: Insights from a transgenerational experiment. Mar. Environ. Res. 2022, 181, 105753. [Google Scholar] [CrossRef]
  23. Prince, J.D.; Sellers, T.L.; Ford, W.B.; Talbot, S.R. Experimental evidence for limited dispersal of haliotid larvae (genus Halio- tis; Mollusca: Gastropoda). J. Exp. Mar. Biol. Ecol. 1987, 106, 243–263. [Google Scholar] [CrossRef]
  24. Burton, R.S.; Tegner, M.J. Enhancement of red abalone Haliotis rufescens stocks at San Miguel Island: Reassessing a success story. Mar. Ecol. Prog. Ser. 2000, 202, 303–308. [Google Scholar] [CrossRef]
  25. De Wit, P.; Palumbi, S.R. Transcriptome-wide polymorphisms of red abalone (Haliotis rufescens) reveal patterns of gene flow and local adaptation. Mol. Ecol. 2013, 22, 2884–2897. [Google Scholar] [CrossRef] [PubMed]
  26. Riebesell, U.; Fabry, V.J.; Hansson, L.; Gattuso, J.P. Guide to Best Practices for Ocean Acidification Research and Data Reporting; reprinted edition including erratum; Publications Office of the European Union: Luxembourg, 2011; p. 258. [Google Scholar] [CrossRef]
  27. Johnson, K.M.; Sieburth, J.M.; Williams, P.J.L.; Brandstrom, L. Coulometric total carbon dioxide analysis for marine studies: Automation and calibration. Mar. Chem. 1987, 21, 117–133. [Google Scholar] [CrossRef]
  28. Dickson, A.G.; Sabine, C.L.; Christian, J.R. (Eds.) Guide to Best Practices for Ocean CO2 Measurement; North Pacific Marine Science Organization: Victoria, BC, Canada, 2007; p. 191. [Google Scholar]
  29. Lewis, E.R.; Wallace, D.W.R.; Allison, L.J. Program Developed for CO2 System Calculations; Environmental System Science Data Infrastructure for a Virtual Ecosystem (ESS-DIVE): Oak Ridge, TN, USA, 1998. [Google Scholar] [CrossRef]
  30. Mehrbach, C.; Culberson, C.H.; Hawley, J.E.; Pytkowicx, R.M. Measurement of the apparent dissociation constants of carbonic acid in seawater at atmospheric pressure. Limnol. Oceanogr. 1973, 18, 897–907. [Google Scholar] [CrossRef]
  31. Dickson, A.G. Standard potential of the reaction: AgCl(s) + 12H2(g) = Ag(s) + HCl(aq), and the standard acidity constant of the ion HSO-4 in synthetic sea water from 273.15 to 318.15 K. J. Chem. Thermodyn. 1990, 22, 113–127. [Google Scholar] [CrossRef]
  32. Uppström, L.R. Boron/chlorinity ratio of deep-sea water from the Pacific Ocean. Deep-Sea Res. 1974, 21, 161–162. [Google Scholar] [CrossRef]
  33. Leighton, D.L. The Influence of Temperature on Larval and Juvenile Growth in Three Species of Southern California Abalones. Fish. Bull. 1972, 72, 1137–1145. [Google Scholar]
  34. Noisette, F.; Comtet, T.; Legrand, E.; Bordeyne, F.; Davoult, D.; Martin, S. Does Encapsulation Protect Embryos from the Effects of Ocean Acidification? The Example of Crepidula fornicata. PLoS ONE 2014, 9, e93021. [Google Scholar] [CrossRef]
  35. Shepard, S.A.; Tegner, M.J.; Guzman del Proo, S.A. Abalone of the World: Biology, Fisheries and Culture, 1st ed.; Wiley-Blackwell: Cambridge, MA, USA, 1972. [Google Scholar]
  36. Weiss, I.M.; Tuross, N.; Addadi, L.; Weiner, S. Mollusc larval shell formation: Amorphous calcium carbonate is a precursor phase for aragonite. J. Exp. Zool. 2002, 293, 478–491. [Google Scholar] [CrossRef]
  37. Kurihara, H.; Kato, S.; Ishimatsu, A. Effects of increased seawater pCO2 on early development of the oyster Crassostrea gigas. Aquat. Biol. 2007, 1, 91–98. [Google Scholar] [CrossRef]
  38. Schindelin, J.; Arganda-Carreras, I.; Frise, E.; Kaynig, V.; Longair, M.; Pietzsch, T.; Cardona, A. Fiji: An open-source platform for biological-image analysis. Nat. Methods 2012, 9, 676–682. [Google Scholar] [CrossRef]
  39. Leighton, D.L. The Biology and Culture of the California abalones, 1st ed.; Dorrance Pub Co. Inc.: Pittsburg, PA, USA, 2000. [Google Scholar]
  40. Keough, M.J.; Downes, B.J. Recruitment of marine invertebrates: The role of active larval choices and early mortality. Oecologia 1982, 54, 348–352. [Google Scholar] [CrossRef] [PubMed]
  41. R Core Team. R: A Language and Environment for Statistical Computing; R Foundation for Statistical Computing: Vienna, Austria, 2020; Available online: https://www.r-project.org/ (accessed on 1 February 2023).
  42. Shapiro, S.S.; Wilk, M.B. An analysis of variance test for normality (complete samples). Biometrika 1965, 52, 591. [Google Scholar] [CrossRef]
  43. Friendly, M.; Fox, J. candisc: Visualizing Generalized Canonical Discriminant and Canonical Correlation Analysis. R Package Version 0.8-6. 2021. Available online: https://CRAN.R-project.org/package=candisc (accessed on 1 February 2023).
  44. Hedges, L.V.; Gurevitch, J.; Curtis, P.S. The meta-analysis of response ratios in experimental ecology. Ecology 1999, 80, 1150–1156. [Google Scholar] [CrossRef]
  45. Orr, J.C.; Fabry, V.J.; Aumont, O.; Bopp, L.; Doney, S.C.; Feely, R.A.; Gnanadesikan, A.; Gruber, N.; Ishida, A.; Joos, F.; et al. Anthropogenic ocean acidification over the twenty-first century and its impact on calcifying organisms. Nature 2005, 437, 681–686. [Google Scholar] [CrossRef]
  46. Li, J.; Jiang, Z.; Zhang, J.; Qiu, J.-W.; Du, M.; Bian, D.; Fang, J. Detrimental effects of reduced seawater pH on the early development of the Pacific abalone. Mar. Pollut. Bull. 2013, 74, 320–324. [Google Scholar] [CrossRef]
  47. Tahil, A.S.; Dy, D.T. Effects of reduced pH on the early larval development of hatchery-reared Donkey's ear abalone, Haliotis asinina (Linnaeus 1758). Aquaculture 2016, 459, 137–142. [Google Scholar] [CrossRef]
  48. Hurd, C.L.; Beardall, J.; Comeau, S.; Cornwall, C.E.; Havenhand, J.N.; Munday, P.L.; Parker, L.M.; Raven, J.A.; McGraw, C.M. Ocean acidification as a multiple driver: How interactions between changing seawater carbonate parameters affect marine life. Mar. Freshw. Res. 2020, 71, 263. [Google Scholar] [CrossRef]
  49. Bednaršek, N.; Calosi, P.; Feely, R.A.; Ambrose, R.; Byrne, M.; Chan, K.Y.K.; Weisberg, S.B. Synthesis of thresholds of ocean acidification impacts on echinoderms. Front. Mar. Sci. 2021, 8, 602601. [Google Scholar] [CrossRef]
  50. Dupont, S.; Thorndyke, M.C. Impact of CO2-Driven Ocean Acidification on Invertebrates Early Life-History—What We Know, What We Need to Know and What We Can Do. Biogeosciences Discuss. 2009, 6, 3109–3131. [Google Scholar] [CrossRef]
  51. Morash, A.J.; Alter, K. Effects of environmental and farm stress on abalone physiology: Perspectives for abalone aquaculture in the face of global climate change. Rev. Aquac. 2016, 8, 342–368. [Google Scholar] [CrossRef]
  52. Eyster, L.S.; Morse, M.P. Early shell formation during molluscan embryogenesis, with new studies on the surf clam, Spisula solidissima. Am. Zool. 1984, 24, 871–882. [Google Scholar] [CrossRef]
  53. Eyster, L.S. Shell inorganic composition and onset of shell mineralization during bivalve and gastropod embryogenesis. Biol. Bull. 1986, 170, 211–231. [Google Scholar] [CrossRef]
  54. Huang, Z.-X.; Chen, Z.-S.; Ke, C.-H.; Zhao, J.; You, W.-W.; Zhang, J.; Dong, W.-T.; Chen, J. Pyrosequencing of Haliotis diversicolor Transcriptomes: Insights into Early Developmental Molluscan Gene Expression. PLoS ONE 2012, 7, e51279. [Google Scholar] [CrossRef]
  55. Auzoux-Bordenave, S.; Badou, A.; Gaume, B.; Berland, S.; Helléouet, M.N.; Milet, C.; Huchette, S. Ultrastructure, chemistry and mineralogy of the growing shell of the European abalone Haliotis tuberculata. J. Struct. Biol. 2010, 171, 277–290. [Google Scholar] [CrossRef] [PubMed]
  56. Ramesh, K.; Hu, M.Y.; Thomsen, J.; Bleich, M.; Melzner, F. Mussel larvae modify calcifying fluid carbonate chemistry to promote calcification. Nat. Commun. 2017, 8, 1709. [Google Scholar] [CrossRef] [PubMed]
  57. Zippay, M.L.; Hofmann, G.E. Effect of pH on gene expression and thermal tolerance of early life history stages of red abalone (Haliotis rufescens). J. Shellfish Res. 2010, 29, 429–439. [Google Scholar] [CrossRef]
  58. Pernet, B. Larval Feeding: Mechanisms, Rates, and Performance in Nature; Oxford University Press: Oxford, UK, 2018; pp. 87–102. [Google Scholar] [CrossRef]
  59. Jaeckle, W.B.; Manahan, D.T. Feeding by a “nonfeeding” larva: Uptake of dissolved amino acids from seawater by lecithotrophic larvae of the gastropod Haliotis rufescens. Mar. Biol. 1989, 103, 87–94. [Google Scholar] [CrossRef]
  60. Stumpp, M.; Hu, M.; Casties, I.; Saborowski, R.; Bleich, M.; Melzner, F.; Dupont, S. Digestion in sea urchin larvae impaired under ocean acidification. Nat. Clim. Chang. 2013, 3, 1044–1049. [Google Scholar] [CrossRef]
  61. Jaeckle, W.B.; Manahan, D.T. Growth and energy imbalance during the development of a lecithotrophic molluscan larva (Haliotis rufescens). Biol. Bull. 1989, 177, 237–246. [Google Scholar] [CrossRef]
  62. Jardillier, E.; Rousseau, M.; Gendron-Badou, A.; Fröhlich, F.; Smith, D.C.; Martin, M.; Helléouet, M.-N.; Huchette, S.; Doumenc, D.; Auzoux-Bordenave, S. A morphological and structural study of the larval shell from the abalone Haliotis tuberculata. Mar. Biol. 2008, 154, 735–744. [Google Scholar] [CrossRef]
  63. Cigliano, M.; Gambi, M.C.; Rodolfo-Metalpa, R.; Patti, F.P.; Hall-Spencer, J.M. Effects of ocean acidification on invertebrate settlement at volcanic CO2 vents. Mar. Biol. 2010, 157, 2489–2502. [Google Scholar] [CrossRef]
  64. Tahil, A.S.; Dy, D.T. Effects of Reduced pH on Larval Settlement and Survival of the Donkey’s Ear Abalone, Haliotis asinina (Linnaeus 1758). Philipp. J. Sci. 2015, 144, 21–29. [Google Scholar]
  65. Pörtner, H. Ecosystem effects of ocean acidification in times of ocean warming: A physiologist’s view. Mar. Ecol. Prog. Ser. 2008, 373, 203–217. [Google Scholar] [CrossRef]
  66. Cannon, W.B. Bodily Changes in Pain, Hunger, Fear, and Rage; Appleton-Century-Crofts: New York, NY, USA, 1915. [Google Scholar]
  67. Costantini, D. Does hormesis foster organism resistance to extreme events? Front. Ecol. Environ. 2014, 12, 209–210. [Google Scholar] [CrossRef]
  68. Parker, L.M.; Ross, P.M.; O’Connor, W.A.; Borysko, L.; Raftos, D.A.; Pörtner, H.O. Adult exposure influences offspring response to ocean acidification in oysters. Glob. Chang. Biol. 2012, 18, 82–92. [Google Scholar] [CrossRef]
  69. Espinel-Velasco, N.; Lamare, M.; Kluibenschedl, A.; Moss, G.; Cummings, V. Ocean acidification induces carry-over effects on the larval settlement of the New Zealand abalone, Haliotis iris. ICES J. Mar. Sci. 2020, 78, 340–348. [Google Scholar] [CrossRef]
  70. Munday, P.L.; Dixson, D.L.; Donelson, J.M.; Jones, G.P.; Pratchett, M.S.; Devitsina, G.V.; Døving, K.B. Ocean acidification impairs olfactory discrimination and homing ability of a marine fish. Proc. Natl. Acad. Sci. USA 2009, 106, 1848–1852. [Google Scholar] [CrossRef]
  71. Phillips, N.E.; Gaines, S.D. Spatial and temporal variability in size at settlement of intertidal mytilid mussels from around Pt. Conception, California. Invertebr. Reprod. Dev. 2002, 41, 171–177. [Google Scholar] [CrossRef]
  72. Rossoll, D.; Bermúdez, R.; Hauss, H.; Schulz, K.G.; Riebesell, U.; Sommer, U.; Winder, M. Ocean acidification-induced food quality deterioration constrains trophic transfer. PLoS ONE 2012, 7, e34737. [Google Scholar] [CrossRef]
  73. O’Leary, J.K.; Barry, J.P.; Gabrielson, P.W.; Rogers-Bennett, L.; Potts, D.C.; Palumbi, S.R.; Micheli, F. Calcifying algae maintain settlement cues to larval abalone following algal exposure to extreme ocean acidification. Sci. Rep. 2017, 7, 5774. [Google Scholar] [CrossRef]
  74. Vargas, C.A.; de la Hoz, M.; Aguilera, V.; Martín, V.S.; Manríquez, P.H.; Navarro, J.M.; Torres, R.; Lardies, M.A.; Lagos, N.A. CO2-driven ocean acidification reduces larval feeding efficiency and changes food selectivity in the mollusk Concholepas concholepas. J. Plankton Res. 2013, 35, 1059–1068. [Google Scholar] [CrossRef]
  75. Strader, M.E.; Wong, J.M.; Hofmann, G.E. Ocean acidification promotes broad transcriptomic responses in marine metazoans: A literature survey. Front. Zool. 2020, 17, 7. [Google Scholar] [CrossRef] [PubMed]
  76. López-Landavery, E.A.; Carpizo-Ituarte, E.J.; Pérez-Carrasco, L.; Díaz, F.; la Cruz, F.L.-D.; García-Esquivel, Z.; Hernández-Ayón, J.M.; Galindo-Sánchez, C.E. Acidification stress effect on umbonate veliger larval development in Panopea globosa. Mar. Pollut. Bull. 2021, 163, 111945. [Google Scholar] [CrossRef] [PubMed]
  77. Kapsenberg, L.; Bitter, M.C.; Miglioli, A.; Aparicio-Estalella, C.; Pelejero, C.; Gattuso, J.-P.; Dumollard, R. Molecular basis of ocean acidification sensitivity and adaptation in Mytilus galloprovincialis. IScience 2022, 25, 104677. [Google Scholar] [CrossRef]
  78. Gurr, S.J.; Trigg, S.A.; Vadopalas, B.; Roberts, S.B.; Putnam, H.M. Acclimatory gene expression of primed clams enhances robustness to elevated p CO2. Mol. Ecol. 2022, 31, 5005–5023. [Google Scholar] [CrossRef]
  79. Lüdecke, D.; Ben-Shachar, M.; Patil, I.; Waggoner, P.; Makowski, D. performance: An R Package for Assessment, Comparison and Testing of Statistical Models. J. Open Source Softw. 2021, 6, 3139. [Google Scholar] [CrossRef]
Figure 1. Experimental design. In the control treatment (blue line), seawater pH was used in natural conditions (pH 8.0), whereas moderate (red line) and low pH (red line) acidification water were CO2 acidified. Long-term acidification stress under two pH levels were evaluated 24, 30, 48, 60 and 108 h post fertilization (HPF) starting from fertilized eggs (solid green and red line). After 108 HPF, new cultured larvae under natural pH were reared to moderate and low pH to evaluate settlement differences by short- and long-term acidification stress until 26 days post fertilization (DPF, dashed green and red lines).
Sustainability 15 14010 g001
Figure 2. Successfully matured larvae during planktonic life history. Developmental success mean ± S.E. (y axis) of Haliotis rufescens larvae cultured under different pH conditions (x axis, control (pH 8.0, blue bar), moderate (pH 7.8, green bar) and low (pH 7.6, red bar)) after 24, 30, 48, 60 and 108 h post fertilization (HPF). The hatching success and normal shelled larvae were evaluated at 24 HPF (A,B). Proportion of successfully matured veliger were scored at 30, 48 and 60 HPF (CE), and full veliger maturation was scored at 108 HPF via the competence success (F). Multiple contrast comparison was performed to evaluate treatment differences using the control as reference group. The p adjustable cutoff points are shown: <0.01 (**), <0.05 (*) and >0.05 (ns).
Sustainability 15 14010 g002
Figure 3. Veliger maturation impairment. Mean ± S.E. (y axis) from body growth index (A) and calcification (B) of Haliotis rufescens larvae cultured under different cumulative pH conditions, control (pH 8.0, blue dots), moderate (pH 7.8, green dots) and low (pH 7.6, red dots), during its development at 30, 48, 60 and 108 HPF (post fertilization x axis). Top annotation indicates the transitory stages from veliger maturation according to Table 1. Multiple contrast comparison was performed to evaluate treatment differences using the control as reference group. The p adjustable cutoff points are shown: <1 × 10⁻⁴ (****), <0.001 (***), <0.05 (*) and >0.05 (ns).
Sustainability 15 14010 g003
Figure 4. Stage-specific growth and calcification response. Canonical discriminatory analysis based on the veliger maturation assessments made for Haliotis rufescens larvae cultured under different cumulative pH conditions: control (pH 8.0, blue dots and ellipses), moderate (pH 7.8, green dots and ellipses) and low (pH 7.6, red dots and ellipses). The first (Can1) and second (Can2) explanatory dimensions are in parentheses. Arrows indicate the relationship of the metrics measured to the canonical dimensions, and ellipses show the group means on the canonical dimensions. The relative size of ellipses indicates heterogeneity of variance.
Sustainability 15 14010 g004
Figure 5. Settlement performance depends on short- and long-term acidification stress. Settlement average success (%) and standard error of Haliotis rufescens larvae cultured under (A) long-term (Chronic) and (B) short-term (acute) pH: control (pH 8.0, blue bar), moderate (pH 7.8, green bar) and low (pH 7.6, red bar). Multiple contrast comparison was performed to evaluate treatment differences. The p adjustable cutoff points are shown: <0.01 (**) and >0.05 (ns).
Sustainability 15 14010 g005
Figure 6. Scanning electron micrographs of Haliotis rufescens post-larvae reared under long-term acidification. Dorsal view (200–400 µm) of Haliotis rufescens 26-day-old post-fertilized larvae showing typical ear-shaped peristomal shell (ps) with growth rings and protoconch (pr). The control, moderate and low pH are shown, respectively (AC). Settled larvae reared under long-term acidification (moderate and low pH) exposed microfractures (B,C) not observed in larvae reared in control (A). The laminar section (10 µm) from the protoconch (pr, white boxes, (AC)) is observed in the left panel (DF). Normal shell with granular texture and alveolar pattern is observed in the control treatment (D). In contrast, abnormal granular texture along the protoconch is observed in the larvae reared under cumulative moderate and low pH, respectively (E,F).
Sustainability 15 14010 g006
Table 1. Stages evaluated during the red abalone early life history. Features distinctive to each stage and the assessed parameters are described.
Time 1Stage 2FeatureAssessment
10 HPFEmbryonic TrochophoreLarvae show ciliated prototrochal girdle Starting bioassay
24 HPFHatched TrochophoreLarvae swim upward, congregating at the water surfaceDevelopmental success and normal shelled larvae
30 HPFEarly VeligerThe larval velum appears twisted, and the shell is imbalancedDevelopmental success and growth
48 HPFMiddle VeligerVisceral mass torsion occursDevelopmental success, growth and calcification
60 HPFMature VeligerLarval shell is fully formed; retractor muscle is attached to the shell posterior and operculum distinctDevelopmental success, growth and calcification
108 HPFCompetent VeligerCilia are retained from hours to days, and swimming may occur intermittently; larvae start to crawl to the vessel bottomDevelopmental success, growth and calcification
26 DPFSettle LarvaeLarvae are settled at the vessel bottom; advanced post-larvae are formed days afterDevelopmental success and SEM 3
1 Hours post fertilization (HPF) or days post fertilization (DPF). 2 Morphological traits used to assess developmental success. 3 Scanning electron micrographs (SEM).
Table 2. Water chemistry analysis. Average and standard deviation (mean ± SD) from measured values, including pH, dissolved inorganic carbon (DIC, μmol/kg) and total alkalinity (TA, μmol/kg), and calculated values, including carbonate concentration (CO3, μmol/kg), aragonite saturation (Ωara) and partial pressure of CO2 (pCO2, μatm), obtained in the experimental systems during this study (n = 6).
MeasuredCalculated (CO2Sys)
AssaypH ± SdDIC ± SdTA ± SdCO3 ± SdΩara ± SdpCO2 ± Sd
Control8.07 ± 0.0292043 ± 332187 ± 60111 ± 24.81.69 ± 0.376591 ± 131
Moderate7.74 ± 0.0042057 ± 982175 ± 66101 ± 651.3 ± 1897 ± 563
Low7.62 ± 0.1221972 ± 2022051 ± 15875.2 ± 32.21.14 ± 0.489987 ± 510
Table 3. Relative effect size (response ratio) calculated for Haliotis rufescens early life history cultured under different pH conditions. A response ratio of 0 indicates no effect, whereas 1 and −1 response ratios indicate a positive or negative effect, respectively. If the assessment of multiple contrast comparison is significant, the p adjustable cutoff points are shown in parentheses: <1 × 10⁻⁴ (****), <0.001 (***), <0.01 (**) and <0.05 (*).
Time 1AssessmentModerateLow
24 HPFHatching success−0.13−0.98 (**)
Normal shelled larvae−0.35−0.69 (*)
30 HPFGrowth index0.07 (*)0.12 (***)
Veliger maturation0.03−0.1 (*)
48 HPFGrowth index0−0.02 (***)
Birefringence0.12 (***)0.04
Veliger maturation−0.15−0.33 (*)
60 HPFGrowth index−0.02 (*)−0.04 (****)
Birefringence0.16 (*)−0.03
Veliger maturation−0.11−0.05
108 HPFGrowth index0−0.05 (****)
Birefringence−0.56 (****)−0.36 (***)
Competence success−0.26−0.33 (*)
26 DPFSettlement (short term)−0.52 (**)−0.78 (**)
Settlement (long term)−0.13−0.04
1 Hours post fertilization (HPF) or days post fertilization (DPF).
Disclaimer/Publisher’s Note: The statements, opinions and data contained in all publications are solely those of the individual author(s) and contributor(s) and not of MDPI and/or the editor(s). MDPI and/or the editor(s) disclaim responsibility for any injury to people or property resulting from any ideas, methods, instructions or products referred to in the content.